Embed Size (px)
Citation preview
40 DIE ERDE · Vol. 147 · 1/2016
ZusammenfassungDie steigende Nachfrage nach Palmöl und Bioenergie fördert die Ausweitung von mit Ölpalmen (Elaeis guineensis) bestandenen tropischen Nutzflächen und intensiviert zugleich Nutzungskonflikte mit der Nahrungsmittelproduk-tion sowie Umweltdegradation. Des Weiteren erhöht die Abholzung von Regenwald zur Errichtung von Ölpalmen-plantagen in der Regel den Ausstoß von Treibhausgasen. Umfassende Wirkungsanalysen zur Ausbreitung von Ölpal-menplantagen benötigen Zeitreihen von Landnutzungskarten. Der Runde Tisch für nachhaltiges Palmöl (RSPO) hat bisher keine Leitlinien für die Evaluierung von Landnutzungsänderungen erstellt. Obwohl Fernerkundungsmetho-den für die Beobachtung und Modellierung von Landnutzungsänderungen allgemein gut geeignet sind, wird die Nut-zung von Landsat- Aufnahmen aus tropischen Regionen durch Bewölkung beeinträchtigt. Diese Studie präsentiert einen neuen Ansatz, welcher die Google Earth Engine (GEE) und das „System for Automated Geoscientific Analysis“ (SAGA) GIS nutzt. Zeitlich und räumlich aufgelöste Landnutzungs- und Landbedeckungsänderungen durch den An-bau von Ölpalmen werden mit einem „median pixel composite mosaic“ von Landsat-5-, 7- und 8-Szenen für die Zeit-räume 1999-2005 und 2009-2015 erfasst. Für die erste Periode erreicht das Verfahren eine Gesamtgenauigkeit von 70,33 % und einen Kappa-Koeffizienten von 0,62. In der zweiten Periode steigen diese Werte auf 84,5 % und 0,80.
A novel approach in monitoring land-cover change in the tropics: oil palm cultivation in the Niger Delta, Nigeria
Stanley U. Okoro1, Udo Schickhoff1, Jürgen Böhner1, Uwe A. Schneider2
1 CEN Center for Earth System Research and Sustainability, Institute of Geography, University of Hamburg, Bundesstr. 55, 20146 Hamburg, Germany, [email protected], [email protected], [email protected]
2 CEN Center for Earth System Research and Sustainability, Research Unit Sustainability and Global Change, University of Hamburg, Grindelberg 5, 20144 Hamburg, [email protected]
Manuscript submitted: 19 August 2015 / Accepted for publication: 17 November 2015 / Published online: 22 March 2016
AbstractThe increasing demand for palm oil and bioenergy has promoted the expansion of tropical farmland covered with oil palms (Elaeis guineensis), resulting in increased competition with food production as well as environmental degradation. Moreover, oil palm cultivation may have increased greenhouse gas (GHG) emissions through defor-estation. The overall impact estimation of oil palm related land-use change requires spatiotemporal land-use maps. So far, the Roundtable on Sustainable Palm Oil (RSPO) has not established guidelines on how to measure and evaluate oil palm related land-cover change. While remote sensing methods are suitable in general, the use of Landsat images in the tropics for the monitoring and modeling of land-cover changes has been restricted due to the influence of cloud cover. This study presents a novel approach for mapping tropical land-cover change using the Google Earth Engine (GEE) cloud-based platform and the System for Automated Geoscientific Analysis (SAGA) GIS. Spatiotemporal land-use and land-cover changes in relation to oil palm cultivation are assessed using a median pixel composite mosaic of Landsat 5, 7 and 8 image scenes for the time periods 1999-2005 and 2009-2015. The proposed approach yields an overall accuracy and kappa coefficient of 70.33 % and 0.62 for the first image composite period, and 84.5 % and 0.80 for the second image composite period respectively.
Okoro, Stanley U., Udo Schickhoff, Jürgen Böhner and Uwe A. Schneider 2016: A novel approach in monitoring land-cover change in the tropics: oil palm cultivation in the Niger Delta, Nigeria . – DIE ERDE 147 (1): 40-52
DOI: 10.12854/erde-147-3
Vol. 147, No. 1 · Research article
D I E E R D EJournal of the
Geographical Society of Berlin
41DIE ERDE · Vol. 147 · 1/2016
1. Introduction
Traditionally, oil palm production has been a part of mixed farming activities in West Africa. However, in the current practice, most production has expanded as an industrial-scale mono-crop (Corley and Tinker 2016). This imposes greater environmental risk on lo-cal societies, particularly on those with limited eco-nomic capacities (Colchester 2011). Currently, oil palm cultivation is characterized by large monocultures of uniform age structure, low canopy, sparse under-growth, a low stability microclimate and intensive use of fertilizers and pesticides. Land-cover patterns reflect the underlying natural and social processes which, thus, helps to provide essential information for modeling and understanding many phenomena on Earth ( Liang 2008). Furthermore, understanding the complex interaction between human activities and global change requires the analysis of land cover data (Gong et al. 2013). The conversion of natural forest to agricultural uses such as oil palm etc., has been re-flected in regional land-use maps in most of the tropical regions. This conversion can result in a series of nega-tive impacts (Carlson et al. 2012), e.g., forest estate loss, social cost (private cost plus externalities as a result of forest to oil palm estate conversion), loss of biodiversi-ty and ecosystem services, alternative revenue loss and greenhouse gas emissions etc. (Sayer et al. 2012; Sheil et al. 2009). To date, comprehensive regional land-use maps of the Nigerian Niger Delta which incorporate oil palm cultivation have not been produced. The lack of detailed land-use maps may be due to the limited availability of cloud-free satellite images and the unat-tractiveness of such studies for most private actors and non-governmental sectors. Consequently, scientists have not been able to carry out such research, possibly a result of the cost of acquiring high-resolution satellite images like IKONOS etc. in the region.
Satellite remote sensing technology provides promis-ing approaches for monitoring land-cover change. In many studies in southeastern Asia, continuous obser-vations of the land surface have been used to map oil palm cultivation (Kamaruzaman and Setiawan 2003; Santoso et al. 2011; Tan et al. 2012). The classifications of satellite imagery for land-cover mapping, however, often require extensive skills of an experienced envi-ronmental analyst (Aitkenhead and Aalders 2011). If
such skills have not been available, land cover classi-fication maps have been developed from ground sur-veys and base maps such as digital topographic maps. In addition, land-use maps and soil suitability agricul-tural maps (although not available for public use in the study area) have increased the accuracy of land-cover classification maps (Razali et al. 2014; Reichenbach and Geng 2003). Replacing or updating these maps with a large amount of remotely sensed data remains a very challenging task in land-use and land-cover mapping (Franklin and Wulder 2002). Different methods have been implemented; these can be divided into two cate-gories: phenology and image-based approaches. The latter make use of spectral signatures to delineate different types of land cover, e.g. oil palm trees (e.g. Shafri et al. 2011; Thenkabail et al. 2004). The former relies on the temporal signal of optical sensors to iden-tify various land covers using coarse resolution data from the Moderate-resolution Imaging Spectroradio-meter (MODIS), e.g. Gutierrez-Velez et al. 2011. This is not ideal for monitoring oil palm distribution because the saturation of optimal images due to canopy closure causes a reduction in the possibility of detecting struc-tural features (Shafri et al. 2011). Cloud cover issues are most common in tropical regions and have been a great challenge in land-cover monitoring. Due to the reduced monitoring options of cloudy images, Synthet-ic Aperture Radar (SAR) data were frequently used as a major alternative in tropical studies (Koo et al. 2012; Li et al. 2015, Morel et al. 2011). The reason for this has been attributed to SAR’s all-weather and all-time capa-bility. On the other hand, due to their coarse resolution of 50 m, SAR data are difficult to be used in a detailed monitoring of tropical land cover.
The GEE, which is an online environmental geoprocess-ing platform that incorporates data from the National Aeronautics and Space Administration (NASA) and the Landsat Program, has created an avenue which allows users to assess records of Landsat imagery and process them over its online platform. This process reduces us-ers’ computational processing times when analysing Landsat imagery, making global- and regional-scale Landsat projects achievable (e.g., Hansen et al. 2013).
The objective of this study is to provide a novel ap-proach in monitoring and analyzing oil palm re-lated land-cover issues in the tropics using Landsat
Monitoring land-cover change in the tropics: oil palm cultivation in the Niger Delta, Nigeria
Keywords Oil palm mapping, Google Earth Engine, SAGA GIS, Landsat image, land use/land cover
42 DIE ERDE · Vol. 147 · 1/2016
Monitoring land-cover change in the tropics: oil palm cultivation in the Niger Delta, Nigeria
data with a resolution of 30 m via GEE and SAGA GIS (Conrad et al. 2015). We implement the Voting Sup-port Vector Machine (SVM) classifier in GEE to map oil palm plantation in the Nigerian Niger Delta. To investigate the biases of our classifier, the analysis of its error matrix which includes overall accuracy, user accuracy and producer accuracy and the com-putation of its kappa coefficient were performed.
2. Study area
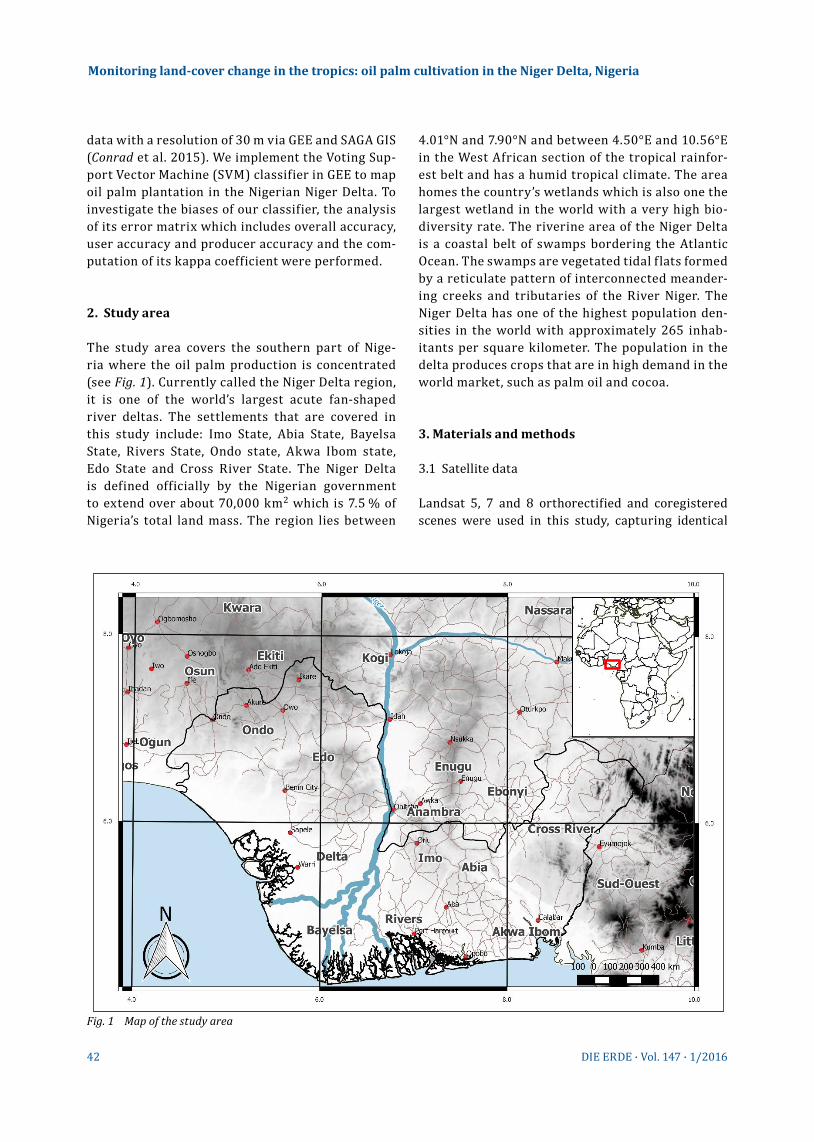
The study area covers the southern part of Nige-ria where the oil palm production is concentrated (see Fig. 1). Currently called the Niger Delta region, it is one of the world’s largest acute fan-shaped river deltas. The settlements that are covered in this study include: Imo State, Abia State, Bayelsa State, Rivers State, Ondo state, Akwa Ibom state, Edo State and Cross River State. The Niger Delta is defined officially by the Nigerian government to extend over about 70,000 km2 which is 7.5 % of Nigeria’s total land mass. The region lies between
4.01°N and 7.90°N and between 4.50°E and 10.56°E in the West African section of the tropical rainfor-est belt and has a humid tropical climate. The area homes the country’s wetlands which is also one the largest wetland in the world with a very high bio-diversity rate. The riverine area of the Niger Delta is a coastal belt of swamps bordering the Atlantic Ocean. The swamps are vegetated tidal f lats formed by a reticulate pattern of interconnected meander-ing creeks and tributaries of the River Niger. The Niger Delta has one of the highest population den-sities in the world with approximately 265 inhab-itants per square kilometer. The population in the delta produces crops that are in high demand in the world market, such as palm oil and cocoa.
3. Materials and methods
3.1 Satellite data
Landsat 5, 7 and 8 orthorectified and coregistered scenes were used in this study, capturing identical
Fig. 1 Map of the study area
43DIE ERDE · Vol. 147 · 1/2016
Monitoring land-cover change in the tropics: oil palm cultivation in the Niger Delta, Nigeria
periods of calendar days (270-365) for 1999 through 2005 and 2009 through 2015. We did not consider using surface reflectance data following Song et al. (2001), who stated that an atmospheric correction was unnecessary for a change detection based on a classification of multitemporal composites in which multiple dates of remotely sensed images are recti-fied and placed in single dataset as long as the train-ing dataset is derived from the image being classified.
We decided to work with the images of calendar days 270-365 in each year in order to avoid season-ality issues of oil palm reflectance values that may arise from seasonal variation of chlorophyll con-centration, foliar pigments and other reflectance properties. We consider the image collection com-posite range used in this study as ideal for oil palm mapping studies. We worked with Landsat mosaic images only because they are consistent with a resolution of 30 m and the combination of different Landsat sensors has only minor effects on the out-put of the images. Landsat has a high degree of simi-larities among its different sensors (Li et al. 2014), a notable advantage compared to working with the fusion of Landsat and MODIS images with a coarser resolution of 50 m as in Bisquert et al. (2015).
3.2 Data pre-processing
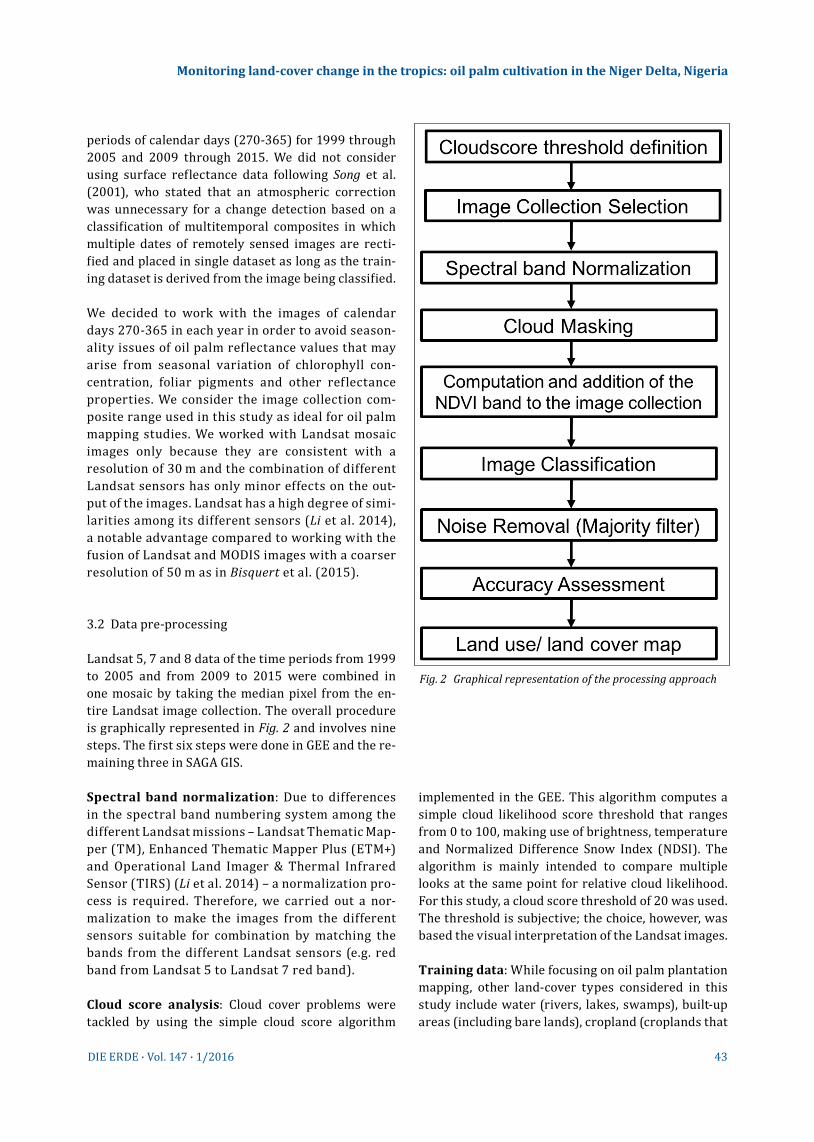
Landsat 5, 7 and 8 data of the time periods from 1999 to 2005 and from 2009 to 2015 were combined in one mosaic by taking the median pixel from the en-tire Landsat image collection. The overall procedure is graphically represented in Fig. 2 and involves nine steps. The first six steps were done in GEE and the re-maining three in SAGA GIS.
Spectral band normalization: Due to differences in the spectral band numbering system among the different Landsat missions – Landsat Thematic Map-per (TM), Enhanced Thematic Mapper Plus (ETM+) and Operational Land Imager & Thermal Infrared Sensor (TIRS) (Li et al. 2014) – a normalization pro-cess is required. Therefore, we carried out a nor-malization to make the images from the different sensors suitable for combination by matching the bands from the different Landsat sensors (e.g. red band from Landsat 5 to Landsat 7 red band).
Cloud score analysis: Cloud cover problems were tackled by using the simple cloud score algorithm
implemented in the GEE. This algorithm computes a simple cloud likelihood score threshold that ranges from 0 to 100, making use of brightness, temperature and Normalized Difference Snow Index (NDSI). The algorithm is mainly intended to compare multiple looks at the same point for relative cloud likelihood. For this study, a cloud score threshold of 20 was used. The threshold is subjective; the choice, however, was based the visual interpretation of the Landsat images.
Training data: While focusing on oil palm plantation mapping, other land-cover types considered in this study include water (rivers, lakes, swamps), built-up areas (including bare lands), cropland (croplands that
Fig. 2 Graphical representation of the processing approach
44 DIE ERDE · Vol. 147 · 1/2016
Monitoring land-cover change in the tropics: oil palm cultivation in the Niger Delta, Nigeria
are not covered by oil palm trees) and forest. We in-corporated the ground truth data, Google Earth data and Landsat image data in our training sample. The ground truth data were collected during a field work between November and December 2014.
Reference data: Due to the costs of acquiring refer-ence data for using our sampling approach at a region-al scale, we collected our reference data by combining Landsat image and Google Earth imagery. In a similar case, Pulighe et al. (2015) assess the horizontal accu-racy of Google Earth images and conclude that they have an overall positional accuracy close to 1 m. This suggests that this is sufficient for deriving a reference data set for land-cover mapping. The sampling method used is the stratified random sampling method (Husch et al. 2003). The points were stratified according to the distribution of land-use/cover classes, in order to lessen the possibility of biases from misclassification. The choice of this sampling method was based on the recommendations of Olofsson et al. (2014) regarding good practices for estimating area and assessing ac-curacy of land cover and land use maps.
Signature analyses of reflectance values of land cover types: To determine and understand the spec-
tral separability of the Landsat reflectance bands of the various land-cover types, to enable the choice and order of spectral bands to be used, the Landsat image reflectance at known land-cover types against the bands were plotted. Furthermore, the reflectance val-ues against the different wavelengths at various land-cover types were also plotted.
Image classification: The approach is based on the supervised classification of multispectral, multisensor data, using the Landsat image collection of Landsat 5, 7 and 8 combined in one mosaic. Supervised classifica-tion is a method often used for the quantitative analy-sis of remote sensing images. It aims at grouping the spectral domain into regions that can be associated with ground cover classes of interest for a particular application (Richards 2013). The Landsat image bands were chosen and their arrangements were Near Infra-red (NIR), Shortwave Infrared 1 (SWIR1), Red, Green and the computed Normalized Difference Vegetation Index (NDVI) band. The NDVI is an index of plant green-ness, which is also an indicator of density of plants. It is calculated using the formula in Equation 1.
(Eq. 1)
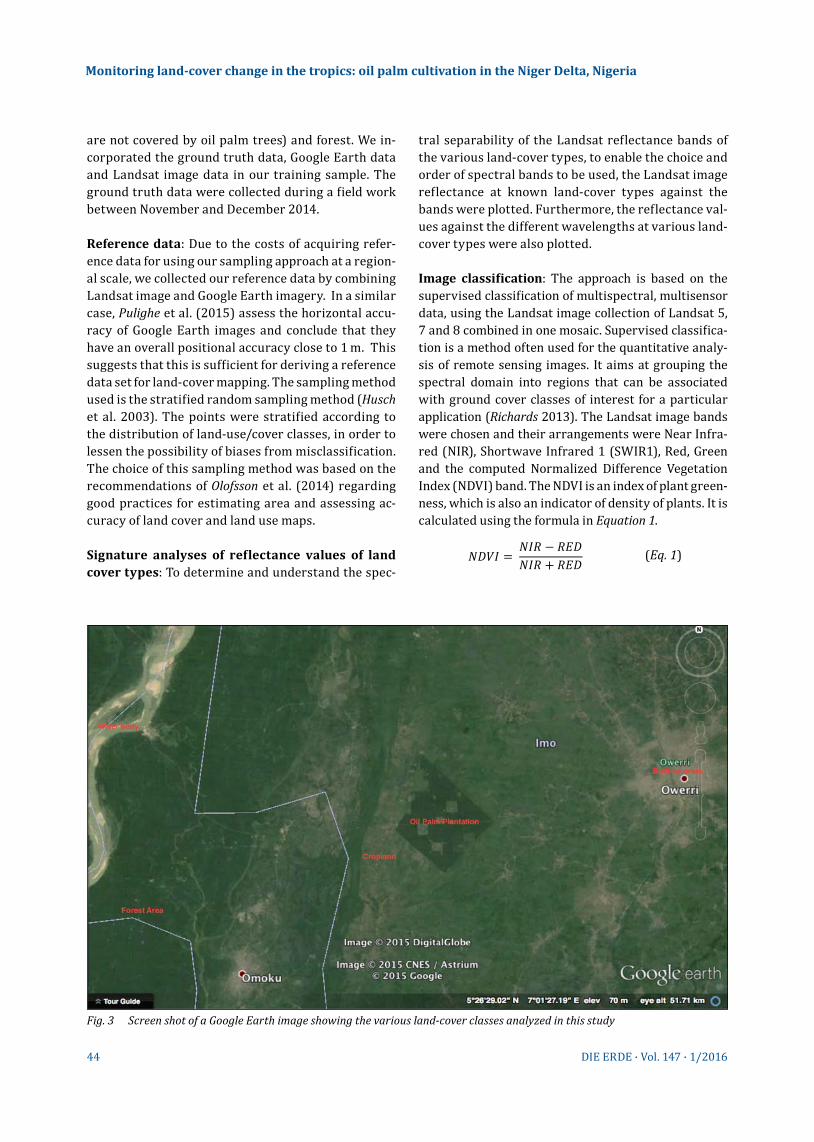
Fig. 3 Screen shot of a Google Earth image showing the various land-cover classes analyzed in this study
45DIE ERDE · Vol. 147 · 1/2016
The classification scheme employed to create a land-cover/land-use map was a modification of Omodanisi (2013) to incorporate oil palm and crop-land and to combine high forest and light forest in a single land-cover type (Fig. 3), thus differentiating between i) water bodies, ii) a built-up areas class which also includes bare ground, roads and build-ing facilities, iii) cropland which includes all agri-cultural land that does not have oil palms planted as mixed crop, iv) forests, including primary and secondary forests, v) oil palms.
Classifiers voting support vector machine (SVM): The concept of SVM is based on decision plains that de-fine decision boundaries. The classifier takes inputs from training data and makes predictions based on given inputs. The classes input is formed by relating the training data set to each pixel in an image (Kav-zoglu and Colkesen 2009). The algorithm was first in-troduced as a machine learning method by Cortes and Vapnik (1995) based on a non-probability binary func-tion because it predicts for each of a series of given inputs the possible input that the input belongs to. Originally, the approach was designed to solve binary problems. In remote sensing applications, however, the problem often involves multiclass/non-binary problems. Various approaches have been proposed to address multiclass problems (m-class), e.g. Schölkopf and Smola (2002), where the problem is usually split into a set of binary classifiers before combining them. The one-against-all classification strategy splits the problem into multiple binary sub-problems. The one-versus-one classification strategy creates Equation 2 binary sub-problems and later combines the follow-ing adopting a majority voting scheme. The approach has shown to be more suitable for large problems like ours (cf. Hsu and Lin 2002). Its operation is carried out in feature space, where classes are separated by a boundary that is as wide as possible. Our choice of choosing this algorithm as classifier algorithm was based on the finding that it performs well in mapping oil palm plantation (Li et al. 2015; Nooni et al. 2014).
(Eq. 2)
3.3 Post-processing
Noise filtering (majority filter): In order to reduce noise in the classification result, we applied a major-ity filter algorithm as implemented in SAGA GIS in the post-processing, which removes isolated cells. The
majority filter considered a search radius of 3 x 3 cells to improve the homogeneity of the classified raster.
Accuracy assessment: Many factors affect the ac-curacy of an image classification, this includes pre-processing of remote sensing data, precision and resolution of remote sensing data and training sample selection. Accuracy assessment allows the analyst to compare certain pixel values in a raster layer to the reference pixels for which the class is known (Mani Murali et al. 2006), in order to establish the error margin of the classified image. This requires a sim-ple cross-tabulation of the class labels allocated by a classification of the remotely sensed data against the reference data. The error matrix aids in quantifying image classification accuracy and its area estimation.
The accuracy assessment computation we carried out includes:
– Confusion matrix: The confusion matrix is cal-culated by comparing the location and class of each reference pixel with the corresponding location and class in the classification image.
– Producer accuracy: This is the measure that in-dicates the probability that the classifier has labeled an image pixel into class A given that the reference class is A.
– User accuracy: This measures the probability that a pixel is class A given that the classifier has labeled the pixel into class A.
– Overall accuracy: This is calculated by summing the number of pixels classified correctly, divided by the total number of pixels in that land-cover class.
– Kappa coefficient: The kappa coefficient (k) meas-ures the agreement between the classification result with that of the reference pixels. Perfectly agreed means that the kappa coefficient tends to 1 or is very close to 1. It is calculated using the formula
k (Eq. 3)
where i is the class number, N is the total number of classified pixels that are compared to reference data, mi,i is the number of pixels belonging to the reference class i, which have been classified with a class i, Ci is the total number of classified pixels belonging to class i, Gi is the number of reference pixels belonging to class i.
Monitoring land-cover change in the tropics: oil palm cultivation in the Niger Delta, Nigeria
46 DIE ERDE · Vol. 147 · 1/2016
Change detection: Change detection is a process of identifying differences in the state of an object or pheno-menon by observing it at different times ( Jensen 1996). Change detection analyses can be deducted in many ways. In land-use/land-cover change analyses, three categories are mostly used: i) algebra-based approach image differencing, image regression, image rationing, vegetation index differencing and change vector analy-sis (Singh 1989); ii) transformation principal component analysis, tassled cap, Gramm-Schmidt and Chi.square test (Nielsen and Canty 2008); iii) classification-based spectral-temporal combined analysis, post-classifica-tion comparison, unsupervised change detection, hy-brid change detection, artificial neutral networks and
electromagnetic transformation (İlsever and Ünsalan 2012). We decided to work with post-classification comparison because this technique makes use of the-matic maps (classified images) as input and does image differencing on a pixel-wise basis. The main advantage of post-classification comparison is that it avoids prob-lems encountered at the image original pixel level, for example shadows and reflections ( Jensen 1996).
4. Results and discussion
A total of five land-cover types were identified and classified in this study. These were water, built-up
Monitoring land-cover change in the tropics: oil palm cultivation in the Niger Delta, Nigeria
Band
Refl
ecta
nce
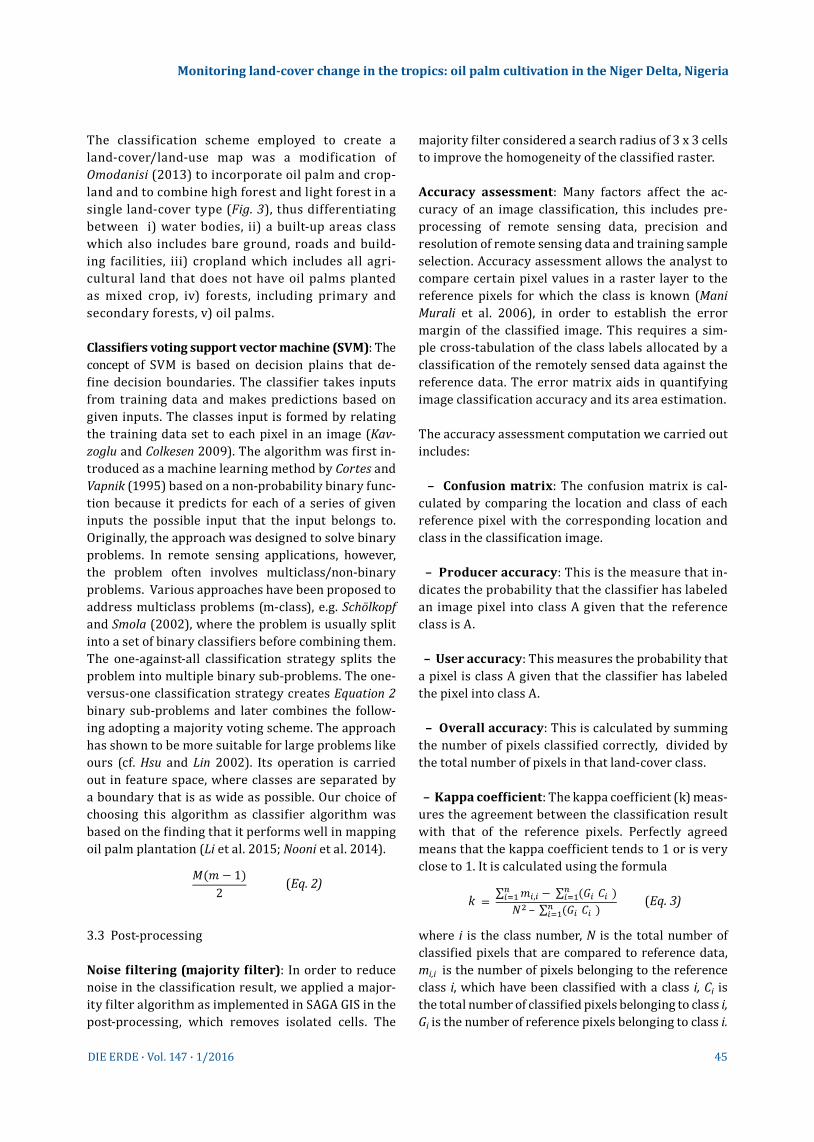
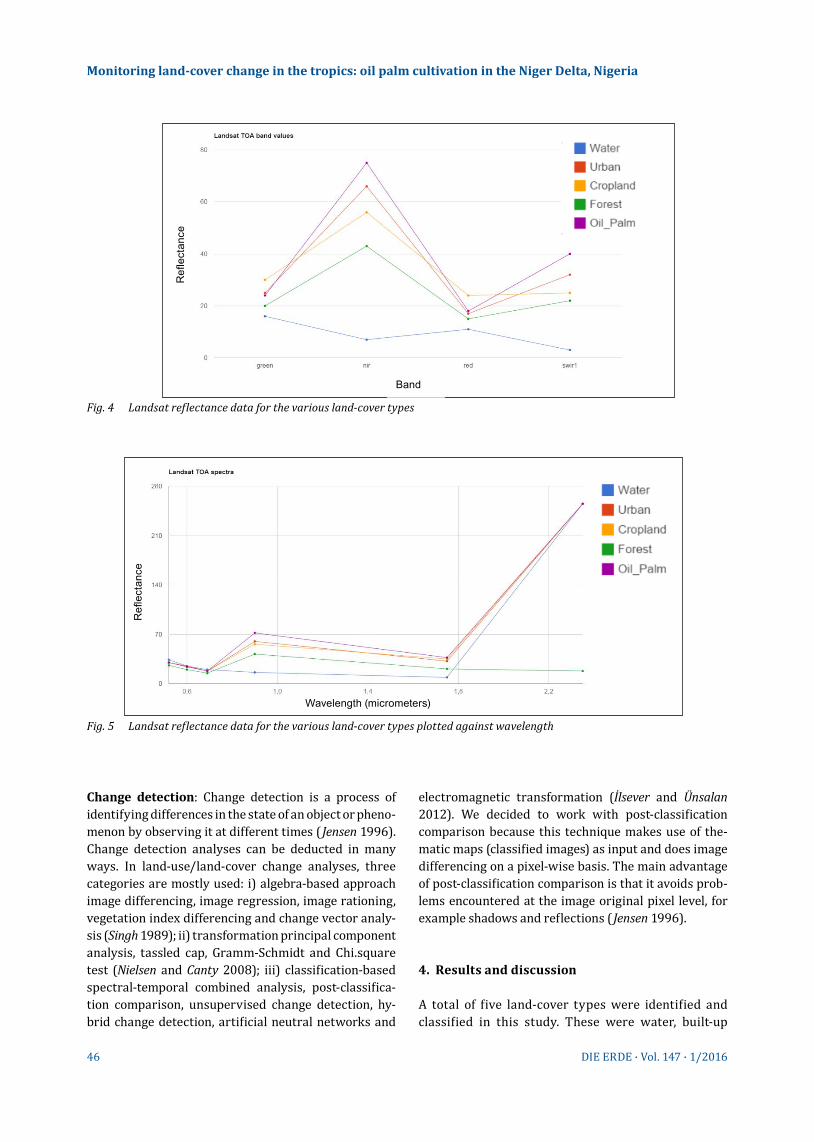
Fig. 4 Landsat reflectance data for the various land-cover types
Refl
ecta
nce
Wavelength (micrometers)
Fig. 5 Landsat reflectance data for the various land-cover types plotted against wavelength
47DIE ERDE · Vol. 147 · 1/2016
Monitoring land-cover change in the tropics: oil palm cultivation in the Niger Delta, Nigeria
areas, cropland, forest and oil palm as shown in Figure 4. Following our approach, we were able to get little or no cloud cover in our image composite.
The plot of the reflectance values against the chosen Landsat image bands and reflectance values against wavelengths of the land-cover types at known points in our study area (Figs. 4 and 5) show a very clear spectral separability of the land-cover types within
our chosen image bands. The near-infrared band has the highest spectral separability to distinguish among the different land-cover types. Thus, the band arrangement of the classification follows the order of its separability among the land-cover types.
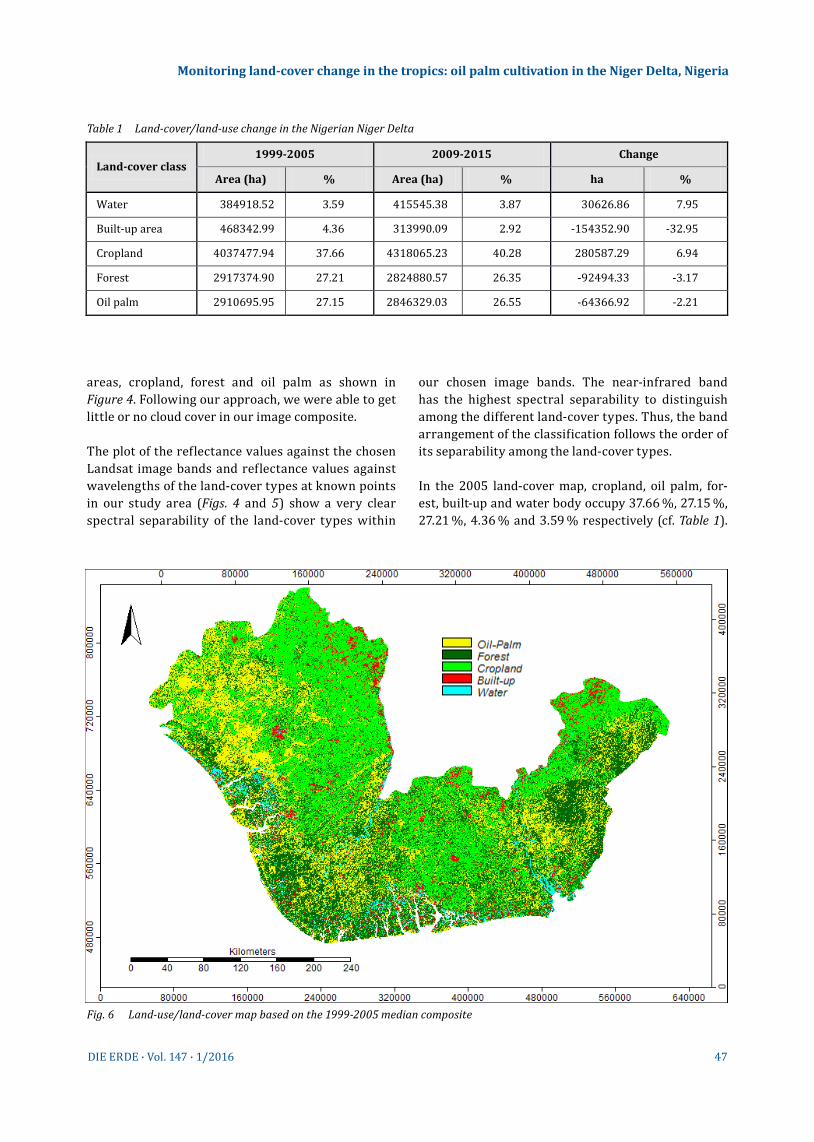
In the 2005 land-cover map, cropland, oil palm, for-est, built-up and water body occupy 37.66 %, 27.15 %, 27.21 %, 4.36 % and 3.59 % respectively (cf. Table 1).
Land-cover class 1999-2005 2009-2015 Change
Area (ha) % Area (ha) % ha %
Water 384918.52 3.59 415545.38 3.87 30626.86 7.95
Built-up area 468342.99 4.36 313990.09 2.92 -154352.90 -32.95
Cropland 4037477.94 37.66 4318065.23 40.28 280587.29 6.94
Forest 2917374.90 27.21 2824880.57 26.35 -92494.33 -3.17
Oil palm 2910695.95 27.15 2846329.03 26.55 -64366.92 -2.21
Table 1 Land-cover/land-use change in the Nigerian Niger Delta
Fig. 6 Land-use/land-cover map based on the 1999-2005 median composite
48 DIE ERDE · Vol. 147 · 1/2016
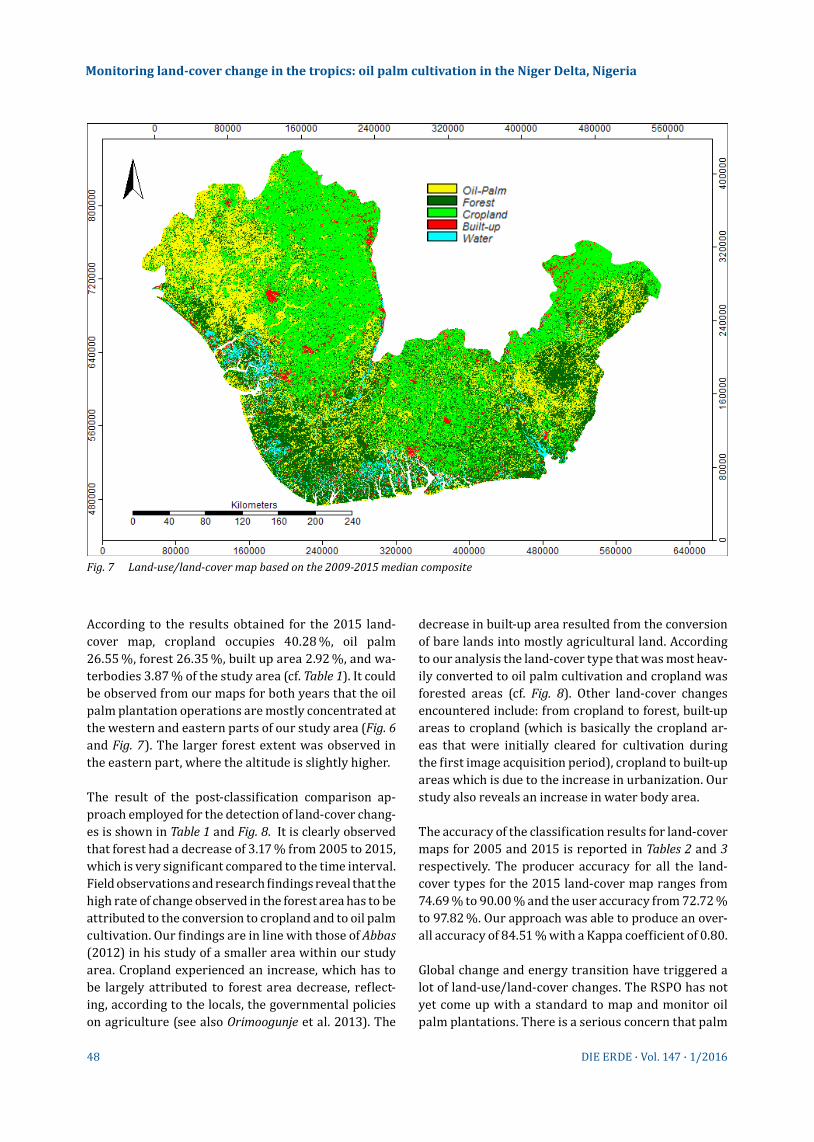
According to the results obtained for the 2015 land-cover map, cropland occupies 40.28 %, oil palm 26.55 %, forest 26.35 %, built up area 2.92 %, and wa-terbodies 3.87 % of the study area (cf. Table 1). It could be observed from our maps for both years that the oil palm plantation operations are mostly concentrated at the western and eastern parts of our study area (Fig. 6 and Fig. 7). The larger forest extent was observed in the eastern part, where the altitude is slightly higher.
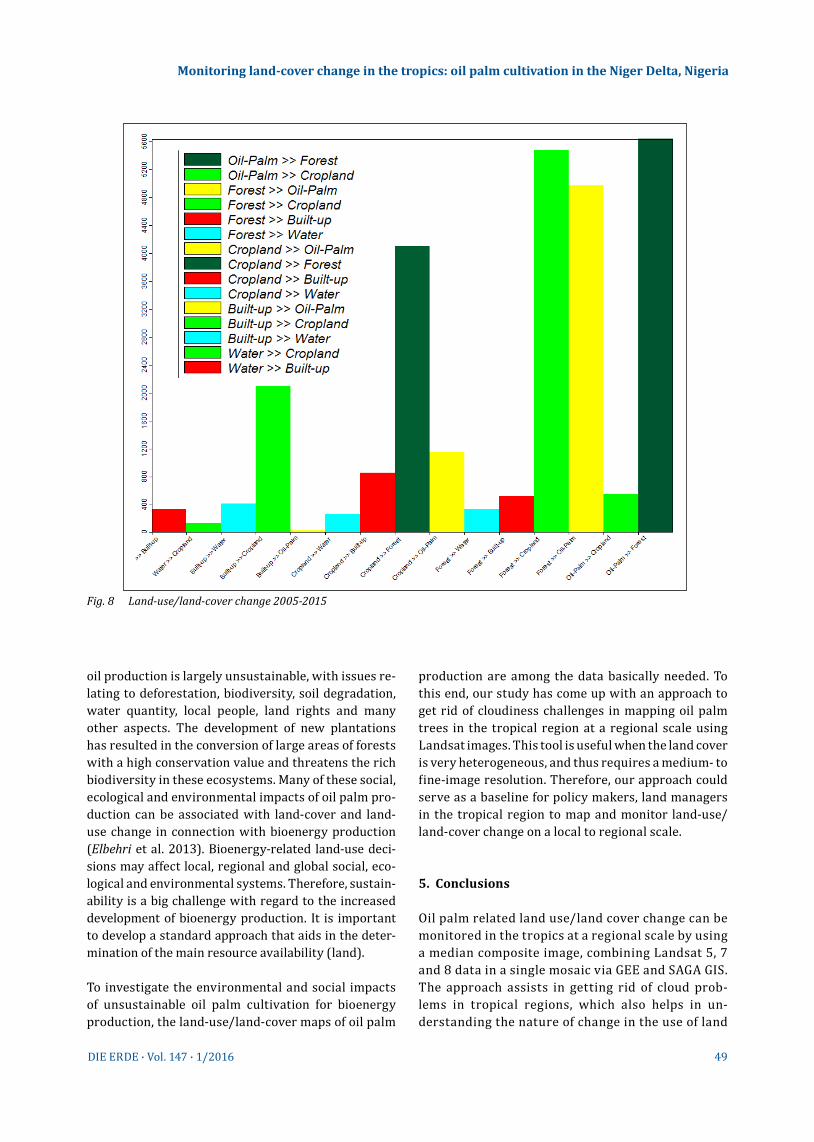
The result of the post-classification comparison ap-proach employed for the detection of land-cover chang-es is shown in Table 1 and Fig. 8. It is clearly observed that forest had a decrease of 3.17 % from 2005 to 2015, which is very significant compared to the time interval. Field observations and research findings reveal that the high rate of change observed in the forest area has to be attributed to the conversion to cropland and to oil palm cultivation. Our findings are in line with those of Abbas (2012) in his study of a smaller area within our study area. Cropland experienced an increase, which has to be largely attributed to forest area decrease, reflect-ing, according to the locals, the governmental policies on agriculture (see also Orimoogunje et al. 2013). The
decrease in built-up area resulted from the conversion of bare lands into mostly agricultural land. According to our analysis the land-cover type that was most heav-ily converted to oil palm cultivation and cropland was forested areas (cf. Fig. 8). Other land-cover changes encountered include: from cropland to forest, built-up areas to cropland (which is basically the cropland ar-eas that were initially cleared for cultivation during the first image acquisition period), cropland to built-up areas which is due to the increase in urbanization. Our study also reveals an increase in water body area.
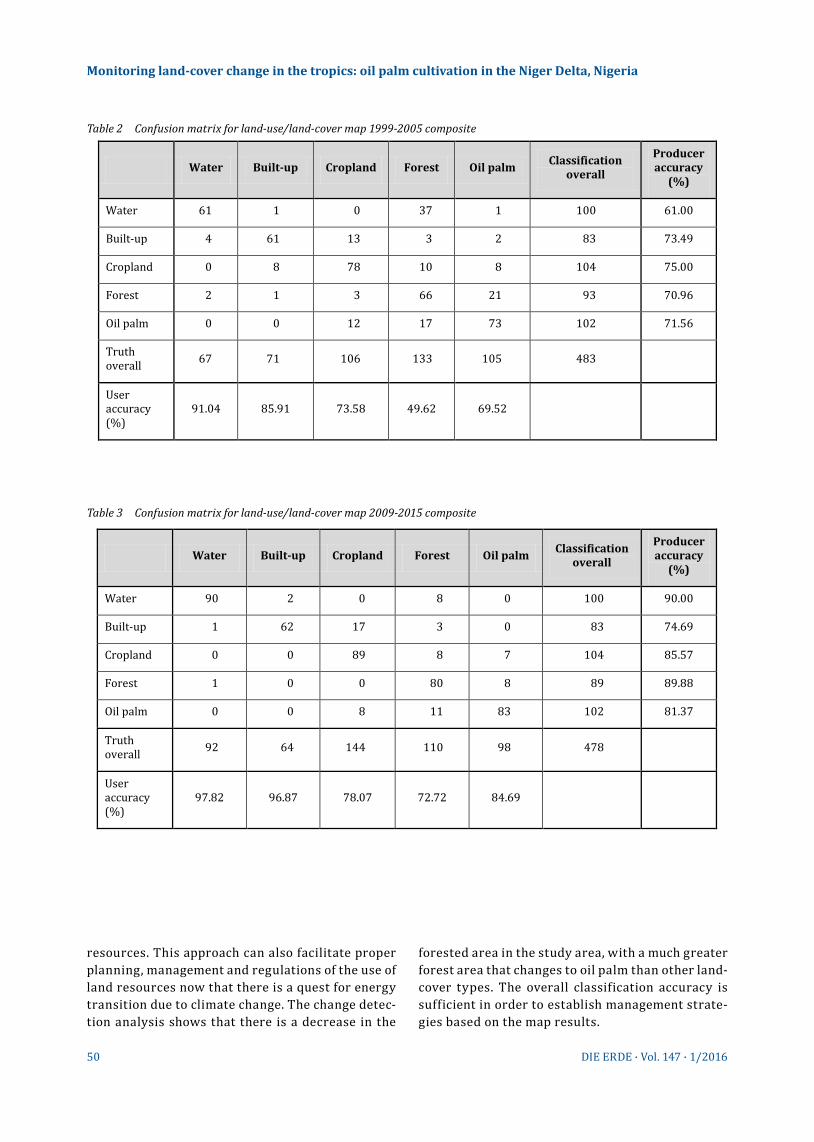
The accuracy of the classification results for land-cover maps for 2005 and 2015 is reported in Tables 2 and 3 respectively. The producer accuracy for all the land-cover types for the 2015 land-cover map ranges from 74.69 % to 90.00 % and the user accuracy from 72.72 % to 97.82 %. Our approach was able to produce an over-all accuracy of 84.51 % with a Kappa coefficient of 0.80.
Global change and energy transition have triggered a lot of land-use/land-cover changes. The RSPO has not yet come up with a standard to map and monitor oil palm plantations. There is a serious concern that palm
Monitoring land-cover change in the tropics: oil palm cultivation in the Niger Delta, Nigeria
Fig. 7 Land-use/land-cover map based on the 2009-2015 median composite
49DIE ERDE · Vol. 147 · 1/2016
oil production is largely unsustainable, with issues re-lating to deforestation, biodiversity, soil degradation, water quantity, local people, land rights and many other aspects. The development of new plantations has resulted in the conversion of large areas of forests with a high conservation value and threatens the rich biodiversity in these ecosystems. Many of these social, ecological and environmental impacts of oil palm pro-duction can be associated with land-cover and land-use change in connection with bioenergy production (Elbehri et al. 2013). Bioenergy-related land-use deci-sions may affect local, regional and global social, eco-logical and environmental systems. Therefore, sustain-ability is a big challenge with regard to the increased development of bioenergy production. It is important to develop a standard approach that aids in the deter-mination of the main resource availability (land).
To investigate the environmental and social impacts of unsustainable oil palm cultivation for bioenergy production, the land-use/land-cover maps of oil palm
production are among the data basically needed. To this end, our study has come up with an approach to get rid of cloudiness challenges in mapping oil palm trees in the tropical region at a regional scale using Landsat images. This tool is useful when the land cover is very heterogeneous, and thus requires a medium- to fine-image resolution. Therefore, our approach could serve as a baseline for policy makers, land managers in the tropical region to map and monitor land-use/land-cover change on a local to regional scale.
5. Conclusions
Oil palm related land use/land cover change can be monitored in the tropics at a regional scale by using a median composite image, combining Landsat 5, 7 and 8 data in a single mosaic via GEE and SAGA GIS. The approach assists in getting rid of cloud prob-lems in tropical regions, which also helps in un-derstanding the nature of change in the use of land
Monitoring land-cover change in the tropics: oil palm cultivation in the Niger Delta, Nigeria
Fig. 8 Land-use/land-cover change 2005-2015
50 DIE ERDE · Vol. 147 · 1/2016
resources. This approach can also facilitate proper planning, management and regulations of the use of land resources now that there is a quest for energy transition due to climate change. The change detec-tion analysis shows that there is a decrease in the
forested area in the study area, with a much greater forest area that changes to oil palm than other land-cover types. The overall classification accuracy is sufficient in order to establish management strate-gies based on the map results.
Monitoring land-cover change in the tropics: oil palm cultivation in the Niger Delta, Nigeria
Water Built-up Cropland Forest Oil palm Classification overall
Producer accuracy
(%)
Water 61 1 0 37 1 100 61.00
Built-up 4 61 13 3 2 83 73.49
Cropland 0 8 78 10 8 104 75.00
Forest 2 1 3 66 21 93 70.96
Oil palm 0 0 12 17 73 102 71.56
Truth overall 67 71 106 133 105 483
User accuracy (%)
91.04 85.91 73.58 49.62 69.52
Table 2 Confusion matrix for land-use/land-cover map 1999-2005 composite
Water Built-up Cropland Forest Oil palm Classification overall
Producer accuracy
(%)
Water 90 2 0 8 0 100 90.00
Built-up 1 62 17 3 0 83 74.69
Cropland 0 0 89 8 7 104 85.57
Forest 1 0 0 80 8 89 89.88
Oil palm 0 0 8 11 83 102 81.37
Truth overall 92 64 144 110 98 478
User accuracy (%)
97.82 96.87 78.07 72.72 84.69
Table 3 Confusion matrix for land-use/land-cover map 2009-2015 composite
51DIE ERDE · Vol. 147 · 1/2016
Acknowledgements
The authors are grateful to the GEE Developers group for their kind support in providing the Landsat image archive and the geoprocessing platform that enabled this study as well as their comments in the course of writing the script for the analysis. We also would like to thank the anonymous reviewers for their helpful comments on the manuscript. Stanley Okoro was supported by the University of Hamburg Graduate Students Merit Fellowship.
References
Abbas, I.I. 2012: An assessment of land use/land cover changes in a section of Niger Delta, Nigeria. – Frontiers in Science 2 (6): 137-143
Aitkenhead, M.J. and I.H. Aalders 2011: Automating land cover mapping of Scotland using expert system and knowledge integration methods. – Remote Sensing of Environment 115 (5): 1285-1295
Bisquert, M., G. Bordogna, A. Bégué, G. Candiani, M. Teisseire and P. Poncelet 2015: A simple fusion method for image time series based on the estimation of image temporal validity. – Remote Sensing 7 (1): 704-724
Carlson, K.M., L.M. Curran, D. Ratnasari, A.M. Pittman, B.S. Soares-Filho, G.P. Asner, S.N. Trigg, D.A. Gaveau, D. Law-rence and H.O. Rodrigues 2012: Committed carbon emis-sions, deforestation, and community land conversion from oil palm plantation expansion in West Kalimantan, Indonesia. – PNAS, Proceedings of the National Academy of Sciences of the United States of America 109 (19): 7559-7564
Colchester, M. 2011: Palm oil and indigenous peoples in South East Asia. – Forest Peoples Programme and Inter-national Land Coalition. – Rome
Conrad, O., B. Bechtel, M. Bock, H. Dietrich, E. Fischer, L. Ger-litz, J. Wehberg, V. Wichmann and J. Böhner 2015: System for automated geoscientific analyses (SAGA), v. 2.1.4. – Geoscientific Model Development 8 (2): 2271-2312
Corley, RH.V. and P.B. Tinker (2016): The oil palm. – 5th edi-tion. – Chichester
Cortes, C. and V. Vapnik 1995: Support-vector networks. – Machine Learning 20 (3): 273-297
Elbehri, A., A. Segerstedt and P. Liu 2013: Biofuels and the sustainability challenge: A global assessment of sus-tainability issues, trends and policies for biofuels and related feedstocks. – FAO. – Rome. – Online accessed at: http://www.fao.org/docrep/017/i3126e/i3126e.pdf, 25/06/2015
Franklin, S.E. and M.A. Wulder 2002: Remote sensing methods in medium spatial resolution satellite data land
cover classification of larger areas. – Progress in Physi-cal Geography 26 (2): 173-205
Gong, P., J. Wang, L. Yu, Y.C. Zhao, Y.Y. Zhao, L. Liang, Z.G. Niu, X.M. Huang, H.H. Fu, S. Liu, C.C. Li, X.Y. Li, W. Fu, C.X. Liu, Y. Xu, X.Y. Wang, Q. Cheng, L.Y. Hu, W.B. Yao, H. Zhang, P. Zhu, Z.Y. Zhao, H.Y. Zhang, Y.M. Zheng, L.Y. Ji, Y.W. Zhang, H. Chen, A. Yan, J.H. Guo, L. Yu, L. Wang, X.J. Liu, T.T. Shi, M.H. Zhu, Y.L. Chen, G.W. Yang, P. Tang, B. Xu, C. Giri, N. Clinton, Z.L. Zhu, J. Chen and J. Chen 2013: Finer resolution obser-vation and monitoring of global land cover: first mapping results with Landsat TM and ETM+ data. – International Journal of Remote Sensing 34 (7): 2607-2654
Gutiérrez-Vélez, V.H., R. DeFries, M. Pinedo-Vásquez, M. Uri-arte, C. Padoch, W. Baethgen, K. Fernandes and Y. Lim 2011: High-yield oil palm expansion spares land at the ex-pense of forests in the Peruvian Amazon. – Environmen-tal Research Letters 6 (4): 044029. – Accessed online: http://iopscience.iop.org/article/10.1088/1748-9326/ 6/4/044029/pdf, 04/01/2016
Hansen, M.C., P.V. Potapov, R. Moore, M. Hancher, S.A. Turu-banova, A. Tyukavina, D. Thau, S.V. Stehman, S.J. Goetz, T.R. Loveland, A. Kommareddy, A. Egorov, L. Chini, C.O. Jus-tice and J.R.G. Townshend 2013: High-resolution global maps of 21st-century forest cover change. – Science 342 (6160): 850-853
Hsu, C.W. and C.J. Lin 2002: A comparison of methods for multiclass support vector machines. – IEEE Transactions on Neural Networks 13 (2): 415-425
Husch, B., T.W. Beers and J.A. Kershaw 2003: Forest mensura-tion. – 4th edition. – New York et al.
İlsever, M. and C. Ünsalan 2012: Two-dimensional change detection methods. – SpringerBriefs in Computer Science. – London
Jensen, J.R. 1996: Introductory digital image processing: a remote sensing perspective. – 2nd edition. – Prentice Hall
Kamaruzaman, J. and I. Setiawan 2003: Quantifying deforesta-tion in a permanent forest reserve using vectorised Land-sat TM. – Journal of Tropical Forest Science 15 (4): 570-582
Kavzoglu, T. and I. Colkesen 2009: A kernel functions analysis for support vector machines for land cover classification. – International Journal of Applied Earth Observation and Geoinformation 11 (5): 352-359
Koo, V.C., Y.K. Chan, V. Gobi, M.Y. Chua, C.H. Lim, C.S. Lim, C.C. Thum, T.S. Lim, Z. Ahmad, K.A. Mahmood, M.H. Shahid, C.Y. Ang, W.Q. Tan, P.N. Tan, K.S. Yee, W.G. Cheaw, H.S. Boey, A.L. Choo and B.C. Sew 2012: A new unmanned aerial vehicle synthetic aperture radar for environmental monitoring. – Progress in Electromagnetics Research 122: 245-268
Li, P., L. Jiang and Z. Feng 2014: Cross-comparison of vegeta-tion indices derived from Landsat-7 Enhanced Thematic Mapper Plus (ETM+) and Landsat-8 Operational Land Imager (OLI) sensors. – Remote Sensing 6 (1): 310-329
Monitoring land-cover change in the tropics: oil palm cultivation in the Niger Delta, Nigeria
52 DIE ERDE · Vol. 147 · 1/2016
Li, L., J. Dong, S. Njeudeng Tenku and X. Xiao 2015: Mapping oil palm plantations in Cameroon using PALSAR 50-m ortho-rectified mosaic images. – Remote Sensing 7 (2): 1206-1224
Liang, S. 2008: Advances in land remote sensing. System, modeling, inversion and application. – Dordrecht
Mani Murali, R., P. Vethamony, A.K. Saran and S. Jayakumar 2006: Change detection studies in coastal zone features of Goa, India by remote sensing. – Current Science 91 (6): 816-820. – Accessed online: http://www.iisc.ernet.in/~currsci/sep252006/816.pdf, 04/01/2016
Morel, A.C., S.S. Saatchi, Y. Malhi, N.J. Berry, L. Banin, D. Burs-lem, R. Nilus and R.C. Ong 2011: Estimating aboveground biomass in forest and oil palm plantation in Sabah, Malaysian Borneo using ALOS PALSAR data. – Forest Ecology and Management 262 (9): 1786-1798
Nielsen, A.A. and M.J. Canty 2008: Kernel principal compo-nent analysis for change detection. – In: Bruzzone, L., C. Notarnicola and F. Posa (eds.): Image and signal process-ing for remote sensing XIV. – Proceedings of SPIE Confer-ence, 15-18 September 2008, Cardiff. – SPIE 7109. – Bell-ingham, Washington: 7109OT01-10. – Accessed online: http://www2.imm.dtu.dk/pubdb/views/edoc_down-load.php/5667/pdf/imm5667.pdf, 04/01/2016
Nooni, I.K., A.A. Duker, I. Van Duren, L. Addae-Wireko and E.M. Osei Jnr. 2014: Support vector machine to map oil palm in a heterogeneous environment. – International Journal of Remote Sensing 35 (13): 4778-4794
Olofsson, P., G.M. Foody, M. Herold, S.V. Stehman, C.E. Wood-cock and M.A. Wulder 2014: Good practices for estimating area and assessing accurancy of land change. – Remote Sensing of Environment 148: 42-57
Omodanisi, E.O. 2013: Resultant land use and land cover change from oil spillage using remote sensing and GIS. – Research Journal of Applied Sciences, Engineering and Technology 6 (11): 2032-2040
Orimoogunje, O.O.I., O.E. Ndidi and O. Ekanade 2013: The dynamics of agricultural land use using multi-spectral imageries in Southern part of Nigeria. – Geoinformatics & Geostatistics: An Overview S1: 007
Pulighe, G., V. Baiocchi and F. Lupia 2015: Horizontal accu-racy assessment of very high-resolution Google Earth images in the city of Rome, Italy. – International Journal of Digital Earth, online first
Razali, S.M., A. Marin, A.A. Nuruddin, H.Z. Shafri and H.A. Hamid 2014: Capability of Integrated MODIS imagery
and ALOS for oil palm, rubber and forest areas mapping in tropical forest regions. – Sensors 14 (5): 8256-8282
Reichenbach, S.E. and F. Geng 2003: Two-dimensional cubic convolution. – IEEE Transactions on Image Processing 12 (8): 857-865
Richards, J.A. 2013: Remote sensing digital image analysis: an introduction. – 5th edition. – Berlin et al.
Santoso, H., T. Gunawan, R.H. Jatmiko, W. Darmosarkoro and B. Minasny 2011: Mapping and identifying basal stem rot disease in oil palms in North Sumatra with QuickBird imagery. – Precision Agriculture 12 (2): 233-248
Sayer, J., J. Ghazoul, P. Nelson and A.K. Boedhihartono 2012: Oil palm expansion transforms tropical landscapes and livelihoods. – Global Food Security 1 (2): 114-119
Schölkopf, B. and A.J. Smola 2002: Learning with kernels. Support vector machines, regularization, optimization, and beyond. – Cambridge, Mass.
Shafri, H.Z.M., N. Hamdan and M.I. Saripan 2011: Semi- automatic detection and counting of oil palm trees from high spatial resolution airborne imagery. – International Journal of Remote Sensing 32 (8): 2095-2115
Sheil, D., A. Casson, E. Meijaard, M. van Nordwijk, J. Gaskell, J. Sunderland-Groves, K. Wertz and M. Kanninen 2009: The impacts and opportunities of oil palm in Southeast Asia: What do we know and what do we need to know? – Center for International Forestry Research (CIFOR) Occasional Papers 51. – Bogor, Indonesia. – Accessed online: http://www.cifor.org/publications/pdf_files/OccPapers/OP-51.pdf, 04/01/2016
Singh, A. 1989: Digital change detection techniques using remotely-sensed data. – International Journal of Remote Sensing 10 (6): 989-1003
Song, C., C.E. Woodcock, K.C. Seto, M.P. Lenney and S.A. Ma-comber 2001: Classification and change detection using Landsat TM data: When and how to correct atmospheric effects? – Remote Sensing of Environment 75 (2): 230-244
Tan, K.P., K.D. Kanniah and A.P. Cracknell 2012: A review of remote sensing based productivity models and their suit-ability for studying oil palm productivity in tropical re-gions. – Progress in Physical Geography 36 (5): 655-679
Thenkabail, P.S., N. Stucky, B.W. Griscom, M.S. Ashton, J. Diels, B. van der Meer and E. Enclona 2004: Biomass estimations and carbon stock calculations in the oil palm plantations of African derived savannas using IKONOS data. – Inter-national Journal of Remote Sensing 25 (23): 5447-5472
Monitoring land-cover change in the tropics: oil palm cultivation in the Niger Delta, Nigeria
![maks@lix.polytechnique.fr arXiv:2003.14286v1 [stat.ML] 31 ... · LIX, Ecole Polytechnique´ maks@lix.polytechnique.fr Abstract We present a novel learning-based approach for comput-ing](https://img.pdfslide.tips/doc/110x75/5f478f5b763a916b9b67658a/makslix-arxiv200314286v1-statml-31-lix-ecole-polytechnique-makslix.jpg)