Embed Size (px)
Citation preview
A QUANTITATIVE ASSESSMENT OF THE NET EFFECTS ON FETAL
NEURODEVELOPMENT FROM EATING COMMERCIAL FISH
(As Measured by IQ and also by Early Age Verbal Development in Children)
May 2014

2
TABLE OF CONTENTS
Preface…………………………………………………………………… 6 Executive Summary…………………………………………………….. 9 “Road Map” to this Assessment……………………………………….. 14 SECTION I: Purpose, Steps, Scope, Limitations, And Relationship to Risk Management……………………………......
17
(a) Adverse and Beneficial Health Effects in Fish………………. …………….... 17 (b) The “Net Effects” Approach to Estimating Health Effects….………………... 19 (c) The Steps in This Assessment of Net effects…….………………………….... 19 (d) The Scope of the Assessment…………………..……………………………... 20 (e) Assessment Limitations…….…………………………………………………. 22 (f) The Assessment’s Relationship to Risk Management…………………........... 24
SECTION II: Commercial Fish and Exposure to Methylmercury in the United States……………………………...........
25
(a) Different Forms of Mercury………………………………………................... 25 (b) Fish Consumption is the Primary Route of Exposure
To Methylmercury.............................................................................................. 26
(c) Methylmercury Concentrations in Fish Sold Commercially………………….. 27 (d) Whether Methylmercury Is Increasing in Commercial Fish…………………. 30
SECTION III: Identification of Health Effects………………………. 32
(a) Prenatal Exposure: Research on Associations Between Fish Consumption and/or Exposure to Methylmercury and Neurodevelopmental Effects in the Fetus…………………………………......
33
(a)(1) Clinical Effects: Japan and Iraq…………………………………… 34 (a)(2) Subclinical Effects: New Zealand, Faroe Islands, Seychelles Islands…………………………………………………..
34
(a)(3) Subclinical Effects: Poland, United Kingdom, United States, Denmark……………………………………………..
37
(b) Children’s Postnatal Exposure. ……………………………………………… 55 (b)(1) Research on Associations Between Children’s Fish
Consumption and/or Exposure to Methylmercury and Neurodevelopmental Effects………………………………………...
55
(b)(2) Maternal Fish Consumption During Lactation ……………………. 56
SECTION IV: Overview of the Exposure Modeling and the Modeling for IQ …………………..……………………………………
57
(a) Conceptual Framework……………………………………………………...... 57

3
(a)(1) Primary Questions of Fact that the Assessment Was Designed to Address……………………………………………
57
(a)(2) Secondary Questions of Fact that the Assessment Was Designed to Address……………………………………………
58
(b) Conceptual Model…………………………………………………………...... 59 (b)(1) Conceptual Model: Exposure………………………………………. 59 (b)(2) Conceptual Model: Dose-Response……………………………..…. 60
(c) Exposure Modeling Overview……………………………………...…..…….. 61 (c)(1) Estimating Species and Amounts That People Eat…………….… 61 (c)(2) Estimating Variations in the Species that People Eat………...…….. 62 (c)(3) Estimating Levels of Methylmercury In Commercial Fish………… 63 (c)(4) Estimating Methylmercury Intake from Eating Commercial Fish…………………………………………….
64
(c)(5) Converting Dietary Methylmercury Intake to Hair Levels of Methylmercury……………………………………...
64
(c)(6) Differentiating Between Mercury and Methylmercury For Purposes of Exposure Assessment……………………………...
64
(c)(7) Exposure Modeling Flow Diagram And Associated Table……………………………………………….
65
(d) Dose-Response Modeling Overview………………………………………….. 70 (d)(1) Preferences for Selecting Research Results for Input into the Dose-Response Modeling…………………………...
70
(d)(2) IQ: Selection of Research Results for Inclusion in the Adverse Methylmercury Dose-Response Function………………….
72
(d)(3) IQ: Selection of Research Results for Inclusion in the Beneficial Fish Nutrients Dose-Response Function…………………
75
(d)(4) Dose-Response Modeling Flow Diagram And Associated Table………………………………………………
77
SECTION V: Modeling Results for Exposure and for IQ ………………………….………………………...
89
(a) Exposure Results….…………………………………………………………… 89 (a)(1) Amounts of Fish Consumed………………………………………... 89 (a)(2) Dietary Intake of Methylmercury…………………………………... 90
(b) Population-Level Results for IQ…………….…………………………………. 92 (b)(1) Population Results for Methylmercury’s Contribution
To the Net Effects on IQ………………………………………….. 93
(b)(2) Population Results for Beneficial Fish Nutrients’ Contribution to the Net Effects on IQ……………………………..
95
(b)(3) Population Results for the Net Effects on IQ……………………… 96 (c) Species-by-Species Results Involving Individual Consumption……………… 99
(d) Sensitivity Analyses ………………………………………………………….. (d)(1) Population Results for the Net Effects on IQ
When Omega-3 Fatty Acids are the Sole Source Of the Beneficial Effect……………………………………………
(d)(2) Species-by-Species Results with 20 Percent
108 108

4
Increase in Methylmercury in Each Fish………………………….. 109 (e) Hypothetical Consumption Scenario Results…………………………………. 114
APPENDIX A: Dose-Response Modeling and Assessment Results for Early Age Verbal Development (at about 18 months of age) and Later Age Verbal Development (at six through nine years of age)………………………………………
120
(a) Selection of Research Results for Inclusion in the Modeling For Early Age Verbal Development………………………………………......
120
(a)(1) Selection of Research Results for Inclusion in the Adverse Methylmercury Dose-Response Function………………………………….
120
(a)(2) Selection of Research Results for Inclusion in the Beneficial Fish Nutrients Dose-Response Function …………………………………..
123
(b) The Modeling Results for Early Age Verbal Development………………………….. 125 (b)(1) How the Modeling Results are Expressed…………………………. 125 (b)(2) Population Results for Methylmercury’s Contribution
To the Net Effects on Early Age Verbal Development…………… 126
(b)(3) Population Results for Beneficial Fish Nutrients’ Contributions to the Net Effects on Early Age Verbal Development………………………………………………
128
(b)(4) Population Results for the Net Effects on Early Age Verbal Development………………………………………………
129
(b)(5) Species-by-Species Results for Early Age Verbal Development Involving Individual Consumption................
130
(b)(6) Results for Hypothetical Consumption Scenarios For Early Age Verbal Development……………………………….
135
(c) Selection of Research Results for Inclusion in the Modeling For Later Age Verbal Development………………………………………….
137
(c)(1) Selection of Research Results for Inclusion in the Adverse Methylmercury Dose-Response Function……………….
137
(c)(2) Selection of Research Results for Inclusion in the Beneficial Fish Nutrients’ Dose-Response Function……………...
139
(d) The Modeling Results for Later Age Verbal Development…………….......... 141 (d)(1) Population Results for Methylmercury’s Contribution
To the Net Effects on Later Age Verbal Development…………….. 141
(d)(2) Population Results for Beneficial Fish Nutrients’ Contributions to the Net Effects on Later Age Verbal Development………………………………………………
142
(d)(3) Population Results for the Net Effects on Later Age Verbal Development………………………………………………
143
(d)(4) Species-by-Species Results for Later Age Verbal Development Involving Individual Consumption….......................
144
APPENDIX B: Summary of Research and Modeling Results……… 149
(a) Summary and Interpretation of Research Results…………………………... 149

5
(a)(1) Research Results Relating to Prenatal Exposure……………………. 149 (a)(2) Research Results Relating to Postnatal Exposure………………….. 150
(b) Summary and Interpretation of Modeling Results…………………………. 150 (b)(1) Species-by-Species Results Involving Individual
Consumption………………………………………………………... 151
(b)(2) Population-level Results …………………………………………… 155
APPENDIX C: Technical Description of the Assessment Methodology……………………………………………….
158
(a) Methylmercury and Fish Exposure Assessment………………………………. 158 (a)(1) Fish Consumption………………………………………………………….. 158 (a)(2) Methylmercury Levels in Fish……………………………………………... 163 (a)(3) Biomarker Calculations: Mercury in Blood and Hair……………………... 168 (a)(4) Omega-3 Intake…………………………………………………………….. 174
(b) Dose-Response Functions………………………………………………........... 175 (b)(1) Methylmercury and Neurodevelopmental Endpoints……………………… 175 (b)(2) Neurodevelopmental Benefits from Nutrients in Fish……………………... 187
(c) Simulation Models…………………………………………………………….. 197 (c)(1) Exposure Simulations………………………………………………………. 197 (c)(2) Dose-Response Simulations………………………………………………... 198
APPENDIX D: Modeling Results…………………………………....... 200 (a) Baseline Estimates…………………………………………………………….. 200
(a)(1) Fish Consumption………………………………………………………….. 200 (a)(2) Blood and Hair Mercury Levels……………………………………………. 201 (a)(3) Neurodevelopmental Effects Attributable to Methylmercury Exposure…………………………………………………..
203
(a)(4) Neurodevelopmental Effects Attributable to Beneficial Nutrients in Fish………………………………………………...
204
(a)(5) Net Effects Attributable to Fish Consumption……………………………... 205 (b) Intervention Scenarios………………………………………………………… 206
(b)(1) Consumption Limit Scenarios……………………………………………… 206 (b)(2) Fixed Consumption Amount Scenarios …………………………………… 207 (b)(3) Scenarios that Limit Species Consumed…………………………………… 210
(c) An Analysis of the Net Effects from Individual Species……………………… 211 APPENDIX E: Methodology and Results from Carrington and Bolger (2000)…………………………………………..
231
APPENDIX F: Glossary………………………………………………. 241 APPENDIX G: Research Needs Relating to Neurologic Endpoints………………………………………………………………..
247
REFERENCES………………………………………………………...... 250

6
PREFACE
This quantitative assessment of the net effects on fetal neurodevelopment of eating commercial fish during pregnancy was first issued by the U.S. Food and Drug Administration (FDA) as a draft for public comment in 20091 under the title “Report of Quantitative Risk and Benefit Assessment of Consumption of Commercial Fish, Focusing on Fetal Neurodevelopmental Effects (Measured by Verbal Development in Children) and on Coronary Heart Disease and Stroke in the General Population.” The current version modifies and expands on that portion of the assessment that addressed fetal neurodevelopment. The portions of the assessment that address fatal coronary heart disease and stroke remain in draft and are not included in this document. After issuance in draft in 2009, the assessment underwent a second round of scientific peer review by non-government experts (the first round occurred prior to issuance), a public comment period that generated over 460 public comments, and, more recently, review by government scientists both within and outside of FDA. As a consequence of this process the 2009 draft was revised in a number of respects. Key revisions are as follows:
• Much of the text, including the name of the assessment, has been rewritten, either for clarity or to accommodate evolving concepts and new modeling. For example, the review of research studies that provide the scientific and contextual basis for the assessment has been rewritten to focus on how each study contributes to a weight of evidence about whether: (a) eating fish during pregnancy affects fetal neurodevelopment; and if so, (b) whether that effect is a net effect that contains both an adverse effect from methylmercury and a beneficial effect from one or more nutrients in fish.
• The primary modeling in the assessment now estimates the net effects of eating
commercial fish during pregnancy on IQ measured through nine years of age as indicative of how eating fish can affect neurodevelopment generally. The estimates of the net effects of eating commercial fish on early age verbal development have been retained from the 2009 draft as a secondary modeling and for purposes of comparison.
• The assessment also now estimates the net effects of maternal fish consumption
on later age verbal development (through nine years of age). There is evidence that the neurodevelopmental test results for this endpoint are sensitive to both methylmercury (e.g., the Boston Naming Test as administered in the Faroe Islands study) and beneficial nutrients in fish (verbal IQ as administered in the Avon Longitudinal Study of Parents and Children in the United Kingdom). This aspect of the assessment estimates the effects of fish consumption on a relatively
1 http://www.fda.gov/Food/FoodborneIllnessContaminants/metals/ucm088758.htm
7
sensitive endpoint for purposes of comparison with endpoints that may be more representative of the effects of fish consumption on fetal neurodevelopment.
• The assessment now includes species-by-species modeling for 47 selected species and market types of commercial fish. For each species or market type the assessment estimates how much would have to be eaten per week during pregnancy for a child to obtain the maximum neurodevelopmental improvement, if any, that could be obtained from that species or market type. It also estimates the size of that maximum improvement measured in IQ points. The assessment then estimates how much of that species or market type would have to be eaten per week in order for the net effect on a child to be adverse rather than beneficial.
• The species-by-species modeling performs these estimates twice based on two
alternate assumptions: (1) the beneficial effect from nutrients in fish is the same for all commercial species and market types; and (2) the beneficial effect varies from species to species depending on how much omega-3 fatty acids are in the fish. Under the latter assumption, omega-3 fatty acids are the sole source of the beneficial effect. This alternative assumption is new to the assessment based on reviewer comments, but it does not represent a position by FDA on whether or how much omega-3 fatty acids actually contribute to the beneficial effect. The main focus of this modeling continues to be on fish, not omega-3 fatty acids from fish. Therefore, the assessment does not take into account studies designed to assess the effect of omega-3 fatty acid supplements on the health outcomes of interest.
• The dose-response relationships for the beneficial effects of fish nutrients on fetal neurodevelopment have been recalculated to include a “plateau,” i.e., a level of fish consumption beyond which those beneficial effects remain the same and no longer increase.
• The criteria for selecting research results to incorporate into the dose-response
modeling were reconsidered. The new criteria allow for the utilization of data summaries when individual subject data are not available. The use of data summaries enabled the incorporation of results from the Faroe Islands and New Zealand studies as well as additional results from the Seychelles Islands study and the Avon Longitudinal Study of Parents and Children in the United Kingdom.
• The assessment of exposures in the United States was partially revised. As a
consequence, our estimates for amounts of mercury in maternal hair – a key measure of exposure – are now closer to estimates from the National Health and Nutrition Evaluation Survey operated by the Centers for Disease Control and Prevention.
8
• The revision to the exposure assessment notwithstanding, we also conducted a sensitivity analysis in which the concentrations of methylmercury in each fish in the species-by-species analysis were increased by 20 percent to determine how the modeling results would be affected if actual exposures were significantly higher than estimated by FDA’s exposure assessment.
We thank the peer reviewers, interagency reviewers, and the public for comments that served as catalysts for these and other revisions. Also, special thanks to “the doctor,” who cured seemingly intractable formatting problems in the manuscript for this assessment more times than we can remember.
9
EXECUTIVE SUMMARY Purpose The purpose of this assessment is to estimate effects on the developing nervous system of the fetus from the consumption of commercial fish during pregnancy. An assessment of this type can be a resource for public health officials in the development of risk management strategies, such as fish consumption advice directed to pregnant and lactating women. It can also point scientists to areas where additional research would be useful, since quantitative assessments must always rely on assumptions to some extent to fill gaps in existing data. It can also serve as a basis for future assessments as new data and methodologies become available. No assessment is ever final in that sense. The assessment also reviews the evidence on the effects of fish consumption by young children on their own neurodevelopment. That review can inform the development of advice directed to parents of young children, as well as indicate where additional research may be necessary. Background Understanding the actual health consequences of methylmercury in fish has been a goal of researchers and public health agencies for decades. Methylmercury is in most if not all fish, at least in trace amounts. It is a neurotoxin that can harm the nervous system when exposure to it is high enough. The developing nervous system of the fetus can be especially sensitive to it. This sensitivity was demonstrated in industrial poisoning events in Japan and Iraq in the last century that caused exposures to methylmercury hundreds of times higher than they are from typical fish consumption. The results included overt neurological harm to many children born to mothers who had ingested very high amounts of methylmercury. That harm was often severe. Fortunately, effects of that magnitude from prenatal exposure to methylmercury have never been reported again. The principal question for researchers and public health agencies has been whether subtle, subclinical effects are occurring in the fetus from maternal consumption of fish under more normal circumstances. To complicate that question, substantial evidence has emerged within the past decade that fish consumption during pregnancy can benefit the developing nervous system even though fish contain methylmercury. Whether this benefit is due solely to omega-3 fatty acids in fish or to some combination of nutrients that could include omega-3 fatty acids is not yet well understood. Nonetheless, evidence for beneficial effects on neurodevelopment in addition to adverse effects on the same endpoint raises important public health questions. Under what circumstances is eating fish during pregnancy likely to be harmful or beneficial to the developing fetus? How harmful or beneficial are these effects likely to be? Which of these effects, or both, are actually occurring in the United States and under what circumstances? What would be the consequences for fetal neurodevelopment if fish consumption were different?
10
This assessment was designed to address these questions. It does so by estimating the “net effects” on fetal neurodevelopment from eating commercial fish during pregnancy. The effects are “net” because they include adverse effects from methylmercury and beneficial effects from fish, presumably from one or more nutrients in the fish. Because methylmercury is the principal form of mercury in fish, it is the only form of mercury relevant to this assessment. To estimate net effects, this assessment follows well-established quantitative risk assessment steps, but with the added dimension of calculating dose-response relationships for both adverse methylmercury effects and beneficial fish, i.e., nutrient(s) effects, then combining the two by adding them together. The assessment assumes that the beneficial and adverse effects act independently of one another and occur at the same time. The U.S. Food and Drug Administration (FDA) first utilized this approach in a draft of this assessment published for public comment in 2009. Since then, the “net effects” concept has been used in an assessment of risks and benefits of fish consumption by the Food and Agriculture Organization of the United Nations and the World Health Organization (FAO/WHO 2011), with results consistent with those contained in this assessment. FDA derived the dose-response relationships for the adverse and beneficial effects from studies reported in the scientific literature that have looked for associations between results on tests of neurodevelopment at various ages and either fish consumption or exposure to methylmercury, or both, during pregnancy. Whether net effects were beneficial or adverse in these studies appear to have depended on the amounts and types of fish consumed during pregnancy. In studies published since 2004, beneficial net effects on neurodevelopment appear to have been the most likely consequence of fish consumption in the populations studied, including populations in the United States. Beneficial net effects were consistently associated with consumption during pregnancy that exceeded to some extent 12 ounces or two servings of fish per week, the ceiling recommended in 2004 for pregnant women by FDA and the Environmental Protection Agency (EPA) and the high end of the 8-12 ounces of fish per week now recommended for pregnant women by the Dietary Guidelines for Americans (DGA 2010). On the other hand, in several studies methylmercury appeared to contribute to the net effects by reducing the size of beneficial net effects and possibly causing the net effects to become adverse under some circumstances. It is well established that when exposures to methylmercury are high enough, net effects can become adverse. The poisoning events in Japan involving contaminated fish demonstrate that at some point, methylmercury can overwhelm any beneficial effects from fish.
11
Section IV of this assessment summarizes a number of key studies that provide evidence relating to net effects. The Assessment This modeling in this assessment provides estimates for the net effects of eating commercial fish during pregnancy on three neurodevelopmental endpoints: (1) IQ at nine years of age – the primary modeling in this assessment; (2) early age verbal development through about 18 months of age – the secondary modeling in this assessment, included in part for purposes of comparison; and (3) later age verbal development through nine years of age, included principally for purposes of comparison. We presume that the net effects of fish consumption on IQ and on early age verbal development are representative of the net effects of fish consumption on neurodevelopment generally. IQ is a relatively broad indicator of neurodevelopment that incorporates a range of sub-tests in several “domains” of neurodevelopment. IQ’s predictive value for achievement throughout life has been studied extensively. Early age verbal development (through about 18 months of age) is much narrower in scope than full IQ and is measured at a much younger age, but the estimated net effects for this endpoint generally track the estimates for IQ. Our modeling for later age verbal development (through nine years of age) include results from the Boston Naming Test in the Faroe Islands and verbal IQ (a subset of full IQ) in the United Kingdom, both of which appear to be sensitive to methylmercury and to beneficial nutrients in fish, respectively. We modeled this endpoint in order to compare net effects on a sensitive endpoint against net effects on more representative endpoints. The assessment includes both population-level modeling, in which we estimate percentiles of the population that are experiencing various net effects, and individual-level modeling in which we estimate the likely effects if a pregnant woman were to eat certain amounts of specific species of fish. This modeling included 47 commercial species and market types. The assessment estimates that for each of the endpoints modeled, consumption of commercial fish during pregnancy is net beneficial for most children in the United States. On a population basis, average neurodevelopment in this country is estimated to benefit by nearly 0.7 of an IQ point (95% C.I. of 0.39 – 1.37 IQ points) from maternal consumption of commercial fish. For comparison purposes, the average population-level benefit for early age verbal development is equivalent in size to 1.02 of an IQ point (95% C.I. of 0.44 – 2.01 IQ size equivalence). For a sensitive endpoint as estimated by tests of later age verbal development, the average population-level benefit from fish consumption is estimated to be 1.41 verbal IQ points (0.91, 2.00). The assessment also estimates that a mean maximum improvement of about three IQ points is possible from fish consumption, depending on the types and amounts of fish consumed. Fish lower in methylmercury generally produce larger benefits than fish higher in methylmercury and the likelihood of an adverse net effect is lower. Amounts needed to obtain the largest benefits, e.g., the most IQ points, can vary depending on fish
12
species, but in the hypothetical scenarios modeled in this assessment, the largest benefits on a population-wide basis occurred when all pregnant women ate 12 ounces of a variety of fish per week. By contrast, an FDA survey of young women indicates that pregnant women eat slightly less than two ounces of fish per week. For IQ, the population-level modeling estimates that between one and five percent of children are likely to be experiencing net adverse effects (central estimates). The expected cause for net adverse effects would be substantial maternal consumption of fish high in methylmercury. Another possible cause could be very low maternal fish consumption. This possibility derives from a study of IQ results in the United Kingdom in which slightly adverse effects were seen when consumption was very low (as shown in Figure C-17 in Appendix C). These results suggest that beneficial effects might not begin until consumption is beyond some minimal level, e.g., three ounces per week. If that is so, the only influence on net effects below that level would be methylmercury. We incorporated these low-dose adverse effects into the modeling. In addition to the central estimates of one and five percent of children, less likely possible outcomes includes adverse net effects through as much as 50 percent of children as reflected in the confidence intervals. Due to limited market share for the species highest in methylmercury (see Table II-1 in Section II), a combination of very low fish consumption by many women and substantial consumption of high methylmercury fish by some women would appear to be the most plausible explanation for adverse net effects much beyond one percent of children – and even possibly for adverse net effects through one percent. The size of the adverse net effects are estimated to range from -0.01 of an IQ point (95% C.I. of -0.13 – 0.00) to -0.05 of an IQ point (-0.56, 0.00). These effects are relatively small because they are reduced from what they otherwise would be by the beneficial contributions to the net effects. Methylmercury effects independent of any beneficial contribution from fish nutrients would be larger. The net effects modeling for both early and later age verbal development do not estimate that adverse net effects are likely for those endpoints. However the confidence intervals do estimate small possibilities of faint adverse net effects through at least 10 percent of children for early age verbal development and 25 percent of children for later age verbal development. These results are at least suggestive of adverse effects when fish consumption is not enough to generate a beneficial effect. Due to limitations in the data beyond the 99.9th percentiles of fish consumption and exposure to methylmercury, the population-level modeling does not estimate net effects for any endpoint above 99.9 percent of the population. Consequently, it omits the most extreme one-tenth of one percent of consumers, both in terms of amounts of fish consumed and exposures to methylmercury. It is reasonable to assume that net adverse effects on IQ are occurring within that population. Such adverse effects would be in addition to those estimated through the 99.9th percentile, as described above.
13
In addition to population-level modeling, the assessment modeled 47 individual commercial fish species and market types for their effects on fetal neurodevelopment. The results are consistent with the population-level results. Almost all species and market types are estimated to become net beneficial at relatively low levels of consumption, although the size of any net benefit is somewhat smaller than it otherwise would be due to methylmercury. This beneficial net effect increases along with consumption until a maximum possible benefit is reached. This benefit is estimated to be around three IQ points when IQ is the endpoint and equivalent in size to two IQ points when early age verbal development is the endpoint. Consumption beyond an amount necessary to obtain the maximum possible benefit causes the net benefit to become smaller because exposure to methylmercury continues to increase. If consumption becomes great enough, the net benefit can disappear and be replaced by net adverse effects. This phenomenon, in which fish convey a net benefit that increases with consumption until a beneficial plateau is reached, followed by a decrease in net benefit that can be replaced by a net adverse effect if consumption becomes high enough, is estimated to occur for most species of commercial fish. For species that are lower in methylmercury, the size of the maximum possible net benefit is estimated to be higher than it is for species that are higher in methylmercury and the amounts per week that must be consumed to become net adverse is greater. For species that are very low in methylmercury, the amount needed to become net adverse can be high to the point of being essentially unreachable. But for the minority of species that are relatively high in methylmercury, that amount is reachable by high-end consumers of those species. Moreover, some fish highest in methylmercury could possibly become net adverse almost immediately.

14
“ROAD MAP” TO THIS ASSESSMENT This assessment is divided between main text and seven appendices, as follows: Section I: This section describes the core problem that this assessment was designed to address: how to estimate the effects of eating fish on fetal neurodevelopment when there appear to be both adverse and beneficial contributions to those effects. Section I briefly describes the quantitative “net effects” approach that was utilized in this assessment and how it is similar to, and differs from, quantitative risk assessment methodology. This section also includes various introductory matters, such as the distinction between risk assessment (in this case, assessment of “net effects”) and risk management and a review of this assessment’s limitations. Section II: This section provides an introduction to the subject of methylmercury in fish. Methylmercury is a neurotoxin that can adversely affect fetal neurodevelopment. It can contribute adversely to the net effects from eating fish during pregnancy. The section distinguishes methylmercury from other forms of mercury and describes why methylmercury is the only form of mercury that is relevant to the assessment. It provides an overview of how much methylmercury there is in different species of commercial fish and, briefly, what is known and not known about whether methylmercury concentrations in these fish are increasing. Section III: This section reviews the state of the science relevant to the net effects of eating fish during pregnancy on fetal neurodevelopment and the net effects on neurodevelopment in children as a result of their consumption of fish. This knowledge derives primarily from observational research in humans on the effects of methylmercury and/or fish consumption on neurodevelopment. Results from studies on prenatal exposure to mercury and on fish consumption during pregnancy have been incorporated into the dose-response modeling in this assessment. The research review in this section focuses on what each study contributes to a general understanding of the net effects from fish consumption, including both adverse and beneficial contributions to those net effects. Section IV: This section addresses the modeling used in the assessment to estimate both: (a) the exposures to methylmercury that are occurring and to amounts and types of commercial fish that are being consumed in the United States; and (b) dose-responses for the adverse effects from methylmercury, the beneficial effects from fish nutrients, and the net effects on IQ from the combination of the two. The beginning of the section lists questions of fact that the modeling was designed to answer. This section also contains a discussion of how and why the results from some research studies were selected for inclusion into the modeling. It describes our selection preferences and how the results we included in the modeling met those preferences. The section also includes flow diagrams and associated tables that describe both the exposure and dose-response modeling. The associated tables address various scientific questions that had to be addressed at each step in the modeling, including assumptions that were employed.

15
Section V: This section provides the quantitative results from the exposure analysis and from the modeling results for IQ. They include population-level results that estimate the percentages of the population that are being benefited and the percentages being adversely affected under current levels of consumption as well as the magnitude of those effects. Hypothetical modeling shows how those effects could change if pregnant women were to eat only certain amounts and types of fish. Section V also includes species-by-species results involving individual consumption of 47 species and market types. These results assume that a pregnant woman eats only one of these species and no other. For each species and market type, the model estimates how much she would have to eat per week in order to obtain the most benefit, if any, that the fish or market type could provide to her offspring; the size of that benefit at its peak; and the amount of that fish or market type that would have to be eaten per week in order for the net effect on her offspring to be adverse. Finally, the section contains the results from two sensitivity analyses. In the first one, we repeated the species-by-species modeling, but with the assumption that only omega-3 fatty acids provide the beneficial effects. (The primary modeling treats fish as “packages” of nutrients since the exact source of the beneficial effects is not well understood.) In the second sensitivity analysis, we raised the amounts of methylmercury in each species and market type by 20 percent in order to examine how the IQ results would change if methylmercury amounts were higher than those recorded in the FDA database. Appendix A: This appendix describes the dose-response modeling for early and later age verbal development and provides the quantitative results from those modelings. Appendix B: This appendix provides an interpretive summary of both the research results that are germane to the assessment and all the modeling results produced by the assessment. Appendix C: This appendix addresses exposure and dose-response modeling in greater technical detail. It addresses matters such as adjustment for water loss during food preparation; calculation of fish portion sizes; how distributions of methylmercury levels were constructed for each of 51 fish groups; and how the relationships between mercury in the diet and mercury in blood and hair were calculated. It lists omega-3 fatty acid concentrations in commercial species and addresses how they were calculated. On dose-response modeling, this appendix addresses regression analyses; comparison of similarities and differences in dose-response relationships from individual locations; how the data on fish benefits fit different non-linear dose-response models; and details of Monte Carlo modeling for multiple simulations of the entire population. Appendix D: Provides the modeling results in more technical detail than in Section V or in Appendices A and B. Appendix E: This excerpt from a journal article by Carrington and Bolger (2000) describes methodology used to model developmental milestone data from Iraq and the Seychelles Islands. It provides details that are referenced in Appendix C but not specifically included.

16
Appendix F: Glossary of both terms and acronyms used in this assessment. Appendix G: An inventory of research needs addressing outstanding matters germane to this assessment.
17
SECTION I: PURPOSE, STEPS, SCOPE, LIMITATIONS, AND RELATIONSHIP TO RISK MANAGEMENT
This assessment represents an effort by the U.S. Food and Drug Administration to improve its understanding of health effects on U.S. consumers from eating commercial fish. It was first issued in draft in January 2009. That draft estimated effects for three health endpoints for which methylmercury in commercial fish is a potential risk factor: (1) fetal neurodevelopment, (2) fatal coronary heart disease (CHD), and (3) fatal stroke. This assessment contains revised estimates for fetal neurodevelopment. The estimates for fatal coronary heart disease and fatal stroke remain in draft as issued in 2009. “Commercial fish” are fish that are bought and sold in interstate commerce. FDA has regulatory responsibility for the safety of fish in interstate commerce under the Federal Food, Drug, and Cosmetic Act (the Act) (21 U.S.C. 301 et seq.). For purposes of this assessment, the term “fish” includes fresh and saltwater finfish, crustaceans, and molluscan shellfish (e.g., clams and oysters) intended for human consumption, either wild-caught or aquacultured. (a) Adverse and Beneficial Health Effects in Fish Methylmercury is in most, if not all fish, at least in trace amounts. It is the principal form of mercury in fish and thus is the form relevant to this assessment. Methylmercury is a neurotoxin that can affect the developing nervous system of the fetus as a consequence of a pregnant woman’s consumption of fish. The fetus is generally more susceptible to toxic effects from methylmercury than is an adult. As an additional matter, the past decade has witnessed the accumulation of substantial evidence that fish consumption can benefit fetal neurodevelopment even though fish contain methylmercury. This effect is due presumably to one or more nutrients in the fish. While the role of each nutrient is not fully understood, fish provide a source of easily digestible protein, high levels of the amino acids taurine, arginine and glutamine, micronutrients including vitamins A and D, and minerals such as iodine and selenium (EFSA 2005; He & Daviglus 2005). Many fish also provide a uniquely rich source of omega-3 fatty acids, most notably docosahexaenoic acid (DHA) and eicosapentaenoic acid (EPA). DHA has been shown to be essential for development of the central nervous system (EFSA 2005, page 30). Also, a number of research studies have reported associations between omega-3 fatty acids and reduced risk of cardiovascular events such as heart attack and stroke (Kris-Etherton et al., 2002). Traditional approaches to assessing potential health risks from eating fish have not been designed to account for adverse and beneficial effects on the same health endpoint. The National Academy of Science’s Institute of Medicine (IOM) considered the importance of taking both adverse and beneficial effects into account generally in its 2006 review of the risks and benefits of consuming commercially available fish. Its report, entitled “Seafood Choices: Balancing Benefits and Risks” (IOM 2006), observed that “Part of the
18
challenge in characterizing the health risks associated with increased methylmercury exposure in seafood is related to the fact that this source also provides nutrients that might have health effects which mitigate those of methylmercury” (IOM 2006, p. 130). The report concluded that:
“New tools apart from traditional safety assessments should be developed, such as consumer-based benefit-risk analyses. A better way is needed to characterize the risks combined with the benefits analysis.” “Consolidated advice is needed that brings together different benefit and risk considerations, and is tailored to individual circumstances, to better inform consumer choices. Effort should be made to improve coordination of federal guidance with that provided through partnerships at the state and local level.”
Other organizations have reached similar conclusions. In 2006, the Codex Alimentarius Commission2 requested that the Food and Agriculture Organization (FAO) of the United Nations and the World Health Organization (WHO) convene experts from around the world to, among other things:
“Consider and review the evidence on the beneficial nutritional factors of eating fish (e.g., as a source of protein and essential nutrients such as vitamin D, iodine, and omega-3 fatty acids).” “Develop a methodology and identify the data necessary for carrying out quantitative risk assessments of risks and benefits related to fish and other seafood consumption.” and “Compare nutritional benefits against the possibility of adverse effects, including the uncertainties, taking into consideration all groups in the population, and, if possible, allowing quantitative comparisons of human health risks and benefits of fish and other seafood consumption” (Codex 2006).
In response, the FAO and WHO convened a “Joint FAO/WHO Consultation on the Risks and Benefits of Fish Consumption” in 2010 to compare “the health risks and health benefits of fish consumption in a systematic way, if possible by using quantitative risk/benefit assessment models” (FAO/WHO 2009). The Joint FAO/WHO Consultation produced an assessment of risks and benefits of fish consumption that replicated in many respects the net effects approach FDA first published in draft in 2009 (FAO/WHO 2011). Moreover, the FAO/WHO assessment contains results that are consistent with the results in this assessment. 2 The Codex Alimentarius Commission was created by the the Food and Agriculture Organization (FAO) of the United Nations and the World Health Organization to develop food standards and guidelines to protect the health of consumers and ensure fair trade practices (Codex 2009). The United States is a member nation of Codex Alimentarius.
19
In the European Union, the Scientific Committee of the European Food Safety Authority (EFSA) has issued guidance “for performing risk-benefit assessments of food related to human health risks and human health benefits,” (EFSA 2010) with “fish consumption and exposure to methylmercury” being a specific example of a risk-benefit assessment. The guidance points out that one outcome of such an assessment could be a “net health impact value” (EFSA 2010, page 2).
(b) The “Net Effects” Approach to Estimating Health Effects The FDA assessment is consistent with the IOM recommendations as well as both the FAO/WHO and EFSA approaches in that it contains quantitative estimates of the net effects from eating commercial fish on fetal neurodevelopment. A “net effect” is the effect that eating fish has on a particular health endpoint for an individual.3 It is “net” because it can include an adverse contribution from methylmercury and a beneficial contribution from fish, presumably from one or more nutrients in the fish, at the same time. A net effect on an individual can be adverse, beneficial, or neutral, depending on the relative strengths of those contributions. This assessment estimates the adverse and beneficial contributions separately and then adds them together to estimate the net effects from maternal consumption of commercial fish. The approach used in this assessment can provide a holistic view of the consequences of any risk management strategy involving fish consumption, thereby enabling risk managers and consumers to maximize health benefits consistent with the minimization of risk. (c) The Steps in This Assessment of Net Effects This assessment follows processes typically used in quantitative risk assessment (CFSAN 2002), but with some variation to accommodate both adverse and beneficial effects. Quantitative risk assessment is designed to provide numerical estimates of the likelihood and magnitude of adverse effects from a specific hazard through a range of exposures to that hazard that occur within a given population.4 This assessment estimates the direction of effects – adverse or beneficial – in addition to their likelihood and magnitude, through the range of exposures to methylmercury and the amounts of commercial fish that are being consumed in the United States.
3 The “net effects” approach, as used here, does not involve comparing or combining unrelated health effects, such as the risk of adverse effects on fetal neurodevelopment vs. the benefits of reducing risk of coronary heart disease. 4 Quantitative risk assessment is distinguished from “safety assessment,” which has provided the traditional basis for risk management for methylmercury. A safety assessment calculates a single low level of exposure to a potential food safety hazard, e.g., methylmercury, that is deemed to be without appreciable risk (although not necessarily free of all risk) over a long period of time, e.g., a lifetime of exposure. A safety assessment does not quantify that risk, or estimate the magnitude of an adverse effect, or estimate the consequences of exposures above the safety assessment level. It is not designed to take beneficial effects into account.

20
This assessment of net effects contains the following steps:
• The identification of certain health effects that can occur from eating fish.5 This step consists of a review of research that has looked for associations between fish consumption and/or methylmercury and various health effects. Our review focuses on evidence for, and details about, net effects on neurodevelopment from eating fish during pregnancy that include adverse and beneficial effects from methylmercury and fish nutrients respectively.
• An assessment of exposures in the United States to commercial fish and to
methylmercury from commercial fish.
• Estimates of dose-response relationships for:
o Adverse effects on fetal neurodevelopment from methylmercury alone, absent any beneficial effects from fish (presumably from one or more nutrients in the fish);
o Beneficial effects on fetal neurodevelopment from fish (presumably from one
or more nutrients in the fish) absent any adverse effect from methylmercury; and
o Net effects that reflect the relative strengths of the adverse and beneficial
effects at various doses.6
• Integration of the assessment of exposure and the dose-response relationship for net effects into estimates of the net effects on fetal neurodevelopment that are likely to be occurring in the U.S. population.7 These estimates include attendant uncertainties.
(d) The Scope of the Assessment The primary estimates in this assessment are for the net effects from the consumption of commercial fish by pregnant women on IQ through nine years of age. IQ encompasses language skills, motor skills, visual perception, memory as well as social judgment and reasoning. The assessment also estimates the net effects on later age verbal development (through nine years of age). This estimate involves results on neurodevelopmental tests that appear to have been particularly sensitive to both methylmercury (the Boston Naming Test administered in the Faroe Islands) and benefits from fish, presumably one or more nutrients in the fish (verbal IQ, a subset of full IQ, administered in the United Kingdom). The modeling results for later age verbal development enable a comparison between an apparently sensitive endpoint and endpoints that appear to be more 5 In a quantitative risk assessment for food, this step is typically characterized as “hazard identification” because that type of assessment only addresses adverse effects from the presence of a food safety hazard. 6 In quantitative risk assessment for food, this step is typically characterized as “hazard characterization.” 7 In quantitative risk assessment, this step is typically characterized as “risk characterization.”
21
representative of the effects of fish consumption on neurodevelopment. Finally, the assessment estimates the net effects on early age verbal development (through about 18 months in age). These estimates enable a comparison between IQ and a narrower, non-IQ endpoint measured at a much earlier age. It is not possible, at least at this time, to assess the effects of maternal fish consumption on all aspects of neurodevelopment. As a practical matter, this assessment was limited to the effects of fish consumption on selected aspects of neurodevelopment and presume them be reasonably representative of the effects on neurodevelopment as a whole. The assessment includes estimates of both population-level effects and individual effects, as follows.
Population-Level Effects
1. “Baseline:” The assessment estimates effects from current commercial fish
consumption in the United States. It takes into account the wide range of consumption patterns that occur in this country. These estimates include directions of effect (adverse, neutral, and beneficial) and sizes of the net effects that are occurring in 99.9 percent of U.S. children. Food consumption survey data are not sufficient to characterize exposures beyond the 99.9th percentile.
2. Hypothetical scenarios: The assessment estimates how net effects would shift toward either the adverse or the beneficial for the U.S. population as a whole if pregnant women were to eat more or less fish and if the fish contained specified amounts of methylmercury.
Individual Effects on a Species-by-Species Basis The assessment includes estimates of the net effect on an individual child’s neurodevelopment if an expectant mother were to eat only one species or market type of commercial fish during pregnancy. These estimates include 47 commercial species/market types. For each species/market type, there are two series of estimates. The first series treats fish as identical “packages” of nutrients that differ only in the amounts of methylmercury they contain. This approach is used because the relative contributions to the beneficial effect from each nutrient in the fish is not fully understood. The second series treats omega-3 fatty acids as if they were the sole source of the beneficial effect. Among other things, these estimates predict how many ounces per week of each species a pregnant woman would have to eat to cause her child to experience an adverse net effect. In so doing, they provide information about the consequences of consuming fish and being exposed to methylmercury beyond the 99.9th percentiles, i.e., the highest one-tenth of one percent of U.S. consumption and exposure, that is not addressed in the population-level modeling.
22
(e) Assessment Limitations
1. Although IQ and verbal development encompass many aspects of
neurodevelopment, they do not encompass all aspects or include all neurodevelopmental tests. It is not practical to do so, at least for the foreseeable future. We selected two endpoints that we presume to be reasonably representative of neurodevelopment as a whole plus an additional endpoint that appears to be particularly sensitive to both methylmercury and beneficial nutrients.
2. The assessment’s population-level estimates apply to 99.9 percent of the U.S.
population (i.e., they apply through the 99.9th percentile of U.S. exposure to methylmercury) but do not reach the last one-tenth of one percent. Data on exposures to methylmercury as well as to amounts of fish consumed beyond the 99.9th percentile are not robust. Extreme exposures beyond the 99.9th percentile would appear to require separate assessments based on data from those population segments. For now, as stated previously, our species-by-species modeling provides some insight into the health consequences of very high consumption and very high exposure to methylmercury beyond the 99.9th percentile.
3. The assessment addresses long-term fish consumption and exposure to
methylmercury but does not address the health consequences, if any, of eating a single fish meal or a relatively small number of meals during a short period of time. Virtually all the research studies – and thus all the available data – involve relatively long term exposures. The consequences of exposure from a single meal or from a small number of meals involve matters such as kinetics of absorption from the gastrointestinal tract, dilution in four to five liters of maternal blood, attachment to red blood cells, distribution and elimination from the body.
4. The assessment is limited to methylmercury as the adverse contributor to the net
effects and does not include other chemical contaminants such as dioxins and polychlorinated biphenyls (PCBs). The science relating to these other chemicals is not sufficiently developed to enable the calculation of dose-response relationships in humans for fetal neurodevelopment. Also, exposure data are not yet sufficient for non-dioxin-like compound polychlorinated biphenyls. Unlike methylmercury, which is predominantly from fish consumption, PCB exposure can occur from other dietary and non-dietary sources. Moreover, while methylmercury levels are broadly characteristic for a given species, PCB (and related compounds) concentrations tend to be dependent on local contaminant levels and thus tend to be an issue for recreational and subsistence fish more than for commercial fish.
5. It is not known whether methylmercury has a threshold of effect, i.e., whether
methylmercury does not produce an adverse effect below some level of exposure. Consequently, one of the models employed in this assessment includes

23
simulations of various possible thresholds while another assumes with no threshold. The combined results from these two modelings are in the direction of no threshold, in that they estimate that effects from methylmercury occur at small doses.
6. It is not known whether adverse methylmercury effects and beneficial effects
from nutrients counteract each other in some way. If they do not counteract, and are thus independent of one another, then adding them together so that the net effects reflect the larger of the two under any given set of circumstances, as we have done here, is a reasonable modeling choice.
7. The assessment does not model the effects of postnatal fish consumption or
exposure to methylmercury (e.g., effects from a person’s own consumption of fish) on neurological function. While it is known that the nervous system continues to develop postnatally, the current state of data does not support a determination of whether children are as sensitive to methylmercury or to the beneficial effects of fish nutrients as the developing fetus. This assessment reviews research that has examined postnatal exposure and fish consumption but does not model effects from postnatal consumption or exposure by young children or by adults. Adults are generally less sensitive to methymercury than the fetus but they can be adversely affected when exposures are high enough. Postnatal exposure is an area still in need of data development and assessment.
8. Because the beneficial contribution from each nutrient in fish is not well understood, the population-based portion of the assessment treats commercial fish as identical “packages” of nutrients without distinguishing one nutrient from another or one fish species from another in terms of beneficial effect. However, for purposes of comparison the species-by-species modeling estimates what the net effects would be if omega-3 fatty acids were the sole source of the beneficial nutrient effects.
9. The modeling does not take into account the health consequences of eating or not eating foods other than commercial fish. For purposes of this assessment we assume that the net effects from eating fish derive solely from what is in fish and not from substituting fish for other foods or from nutrients in foods eaten in addition to fish. Although the health consequences of eating other foods in addition to fish or in place of fish are important matters, they are not easily addressed and are beyond the scope of this assessment. Similarly, the hypothetical scenarios involving increases or decreases in fish consumption do not take into account health consequences from corresponding increases or decreases in foods other than fish.
Finally, we note that the assessment is not an evaluation of the scientific evidence for, or an authoritative statement about, the relationship of a nutrient and a disease or health-related condition under section 403(r) of the Act (21 U.S.C. 343(r)).

24
(f) The Assessment’s Relationship to Risk Management This assessment is intended to serve as a resource for those engaged in the management of risk, along with all other sources of relevant information and analysis. It does not modify any existing risk management policy. Risk management is a distinct process that involves weighing policy alternatives and then selecting and implementing appropriate control options in light of all appropriate data and scientific assessments such as this one (CFSAN 2002). Advice to consumers about fish consumption is a form of risk management. Although the hypothetical scenarios in this assessment can provide some insight into the consequences of various risk management alternatives, the scenarios are not intended to be exhaustive of all possibilities. As a related matter, this assessment does not “balance” risks against benefits by addressing whether a potential benefit might be sufficient to justify some level of risk. That type of balancing, if it were to be done at all, would involve the making of value judgments as part of risk management decision making. Similarly, judgments about the clinical significance of the estimates produced by this assessment would also involve risk management and are outside the scope of this assessment.

25
SECTION II: COMMERCIAL FISH AND EXPOSURE TO METHYLMERCURY IN THE UNITED STATES
This section addresses the relationship between eating commercial fish and exposure to methylmercury in the United States. That relationship provides a basis for the exposure analysis that was performed as part of the assessment of net effects. Methylmercury, an organic form of mercury, is present in at least trace amounts in the vast majority of fish. Because it occurs naturally in the environment as a result of geologic and biological processes, it is part of the food chain and humans have been ingesting it since fish became part of the human diet. In recent times it is being added to the environment as a result of human activity. There is evidence that the net effects on fetal neurodevelopment include an adverse contribution from methylmercury at levels of exposure that occur in the United States (see Section III of this assessment). Consequently, our assessment incorporates the possibility, if not the likelihood, that methylmercury is neurotoxic through the range of U.S. exposures to it, including exposures that are relatively low. (a) Different Forms of Mercury Methylmercury is an organic form of the metallic element, mercury. Mercury occurs in three basic forms: metallic, or elemental mercury, inorganic mercury, and organic mercury. Each form can be toxic to humans when exposure is high enough, although they behave differently in terms of absorption into the body and the degree to which they are distributed to body organs. It has been postulated that these different forms may interact with each other at a cellular level to create a combined effect, but the available evidence (e.g., toxicokinetic differences and dissimilar clinical presentation) does not indicate that an interaction takes place at the relevant target organs (e.g., central nervous system). No two forms of mercury appear to affect the same aspects of the central nervous system. Inorganic mercury occurs naturally, mostly in the form of ores. It enters the environment as a result of volcanic activity and erosion from wind and water. Inorganic mercury is also emitted into the environment through human activity, mostly from the burning of fossil fuels, mining, smelting, and solid waste incineration. Metallic, or elemental mercury, is also the form that was used in mercury thermometers and dental amalgams. Inorganic mercury compounds are used in small amounts in some antibacterial products. Methylmercury is the most common organic form of mercury. It is converted in the environment from inorganic mercury through natural, biological processes, e.g., the activity of bacteria, phytoplankton and fungi. Methylmercury can enter the food chain by accumulating in the muscle tissue of fish and marine mammals. Longer-lived predator fish tend to have more methylmercury in them than other fish because they spend their lives eating fish that also contain methylmercury.
26
Because this assessment estimates the impact of the consuming commercial fish on fetal neurodevelopment, its focus is limited to the form of mercury, i.e., methylmercury, found in fish. Methylmercury is neurotoxic. It is easily absorbed from the gastrointestinal tract and readily enters the brain, including the brain of the developing fetus. It is excreted from the human body with an average half life that has been measured at about 50 days, with a range of 42-70 days (Sherlock et al., 1984).
Another organic form of mercury is ethylmercury. Humans have been exposed to small amounts of ethylmercury from the thimerosal preservative in some multi-use influenza vaccines, ophthalmic and otic drug products. Thimerosal has been removed from or reduced to trace amounts in all vaccines routinely recommended for children six years of age and under and adult exposures are not frequent. Exposures are also relatively short in duration since ethylmercury leaves the body more quickly than methylmercury (Magos & Clarkson, 2006). Ethylmercury has been reported to be less neurotoxic than methylmercury but can exert renal toxicity (Magos & Clarkson, 2006). (b) Fish Consumption Is the Primary Route of Exposure to Methylmercury The National Health and Nutrition Examination Study (NHANES), conducted by the Centers for Disease Control and Prevention, is a survey of the health and nutritional status of the U.S. population that collects data from individual participants through interviews and physical examinations. In 1999 NHANES began measuring exposure to mercury in U.S. women of childbearing age and children aged one through five8 by taking samples of scalp hair and blood.9 These measurements were coupled with 30-day fish and shellfish consumption frequency questionnaires. Mercury levels in both blood and hair increased along with fish consumption, indicating that the mercury levels largely reflected exposure to mercury from fish (Mahaffey et al., 2004; McDowell et al., 2004).10 11 It has been estimated that methylmercury constitutes about 95 percent of the total mercury in finfish and about 45 percent of total mercury in molluscan bivalve shellfish 8 In 2003, mercury measurements were expanded to include males age 16 and above and older women (CDC 2005). 9 Variations in concentration along a hair strand can reveal differences in the person’s exposure over weeks and possibly months, depending on the length of the hair. Hair cannot provide information, however, about exposure at the moment the hair sample was taken because of the time it takes for methylmercury to concentrate in hair. Conversely, concentrations in blood cannot reveal variations over time, but can provide information about recent exposure (McDowell, et al., 2004). Both blood and hair levels were measured during the first two years of mercury testing under NHANES; only blood levels have been measured thereafter. 10 It is possible that people can take in small but measurable amounts of methylmercury from other sources. For example, a study in Sweden among people who reported no fish consumption showed small concentrations of methylmercury in their blood that the authors attributed to eating chickens and pigs etc. that had been fed fish meal (Lindberg et al., 2004). The levels from sources other than fish in Sweden were too low to provide a meaningful contribution to overall exposure. 11 Correlations between mercury hair and blood levels and fish consumption in the United States have also been reported by Hightower & Moore (2003) and Oken et al. (2005 & 2008).
27
(e.g., clams, oysters mussels) (Hight & Cheng 2006). Because the mercury concentrations in molluscan bivalve shellfish are extremely low, the differences between total mercury and methylmercury in these species are small. (c) Methylmercury Concentrations in Fish Sold Commercially FDA and others have been analyzing commercial fish species in the United States for years for concentrations of total mercury12 in their muscle tissues. The results can be found on the FDA web site at http://www.fda.gov/Food/FoodborneIllnessContaminants/Metals/ucm115644.htm. They are generally consistent with databases maintained in other countries for the same species (CodexCFAC 2006; Health Canada 2007; Montwill 2007). Because the total mercury in fish is mostly methylmercury, we use that term here to describe the concentrations that have been found in commercial fish. For each listed species and product type (e.g., canned light tuna), the database includes the average methylmercury concentration in the samples taken for that species or product type, the median concentration, the minimum and maximum concentrations that have been found in individual samples, and the number of samples upon which the above values are based. The database can be used to estimate body burdens of methylmercury based on how much fish of various species are eaten. This assessment used the database to help estimate exposures to methylmercury as well as how those exposures would change if more or less fish were eaten or if the types of fish changed. Previously, the database was used to estimate what exposures to methylmercury would be if the FDA/EPA consumption advisory for methylmercury were followed (Carrington et al., 2004). Highlights from the Database:
• The range of mean methylmercury concentrations in all commercial species spans about two orders of magnitude: For the fish for which methylmercury has been at a detectable level (most of them), the lowest mean concentrations are between 0.01 and 0.02 parts per million (ppm) while the highest mean concentrations are around 1.0 ppm. The highest mean concentration is 1.45 ppm for tilefish from the Gulf of Mexico.
• Most commercial fish have concentrations that are toward the low end of this range: As a consequence, the mean methylmercury concentration for commercial fish in the U.S. marketplace, weighted for consumption, is 0.072 ppm.13 “Weighted for consumption” means that the more popular a species is, the more
12 Laboratory analyses for total mercury are easier and less costly to perform than analyses for methylmercury. 13 The mean methylmercury concentration weighted for consumption for commercial species has been declining slightly due largely to an increase in the market share of aquacultured fish. In 2009 FDA estimated a mean weighted for consumption of 0.086 ppm.
28
“weight” it is given when calculating the mean concentration for all commercial fish.
• The “top 20” fish: The mean concentrations in the top 20 most consumed commercial species in the United States range from 0.01 ppm nondetectable to 0.13 ppm, with the exceptions of albacore canned tuna, which averages 0.35 ppm, and fresh tuna, which averages 0.39 ppm. The top 20 species comprise approximately 84 percent of commercial fish consumed in the United States (Montwill 2008).
• Higher-end species: With the exception of tuna products, all commercial species
with mean concentrations of 0.3 ppm or higher are outside the top 20 in terms of consumption. These include long-lived predatory fish that tend to accumulate the most methylmercury. The four highest commercial species that FDA and EPA recommend be avoided by pregnant women and young children -- shark (0.98 ppm), swordfish (1.0 ppm), king mackerel (0.73 ppm) and tilefish from the Gulf of Mexico (1.45 ppm)14 -- collectively account for one half of one percent of U.S. consumption (Montwill 2008).
• Variability of concentrations within species and product types: As a result of normal variation there is considerable overlap in mercury concentrations among species and product types. For example, canned light tuna has an average concentration (0.13 ppm) that is one-third the average concentration for canned albacore tuna, but the low-to-high range in the FDA database for canned light tuna is nearly identical to that for canned albacore tuna (nondetectable to 0.852 ppm for light; nondetectable to 0.853 ppm for albacore). Consequently, some cans of albacore contain less mercury than some cans of light and some cans of light contain more mercury than some cans of albacore.
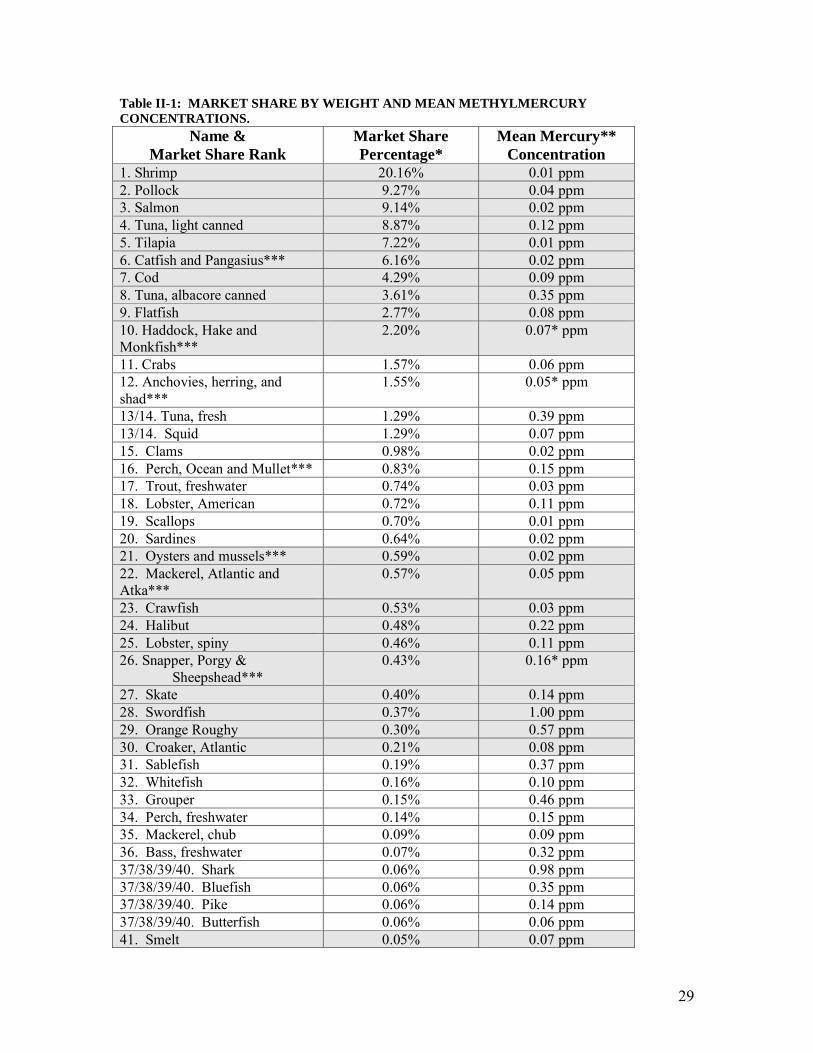
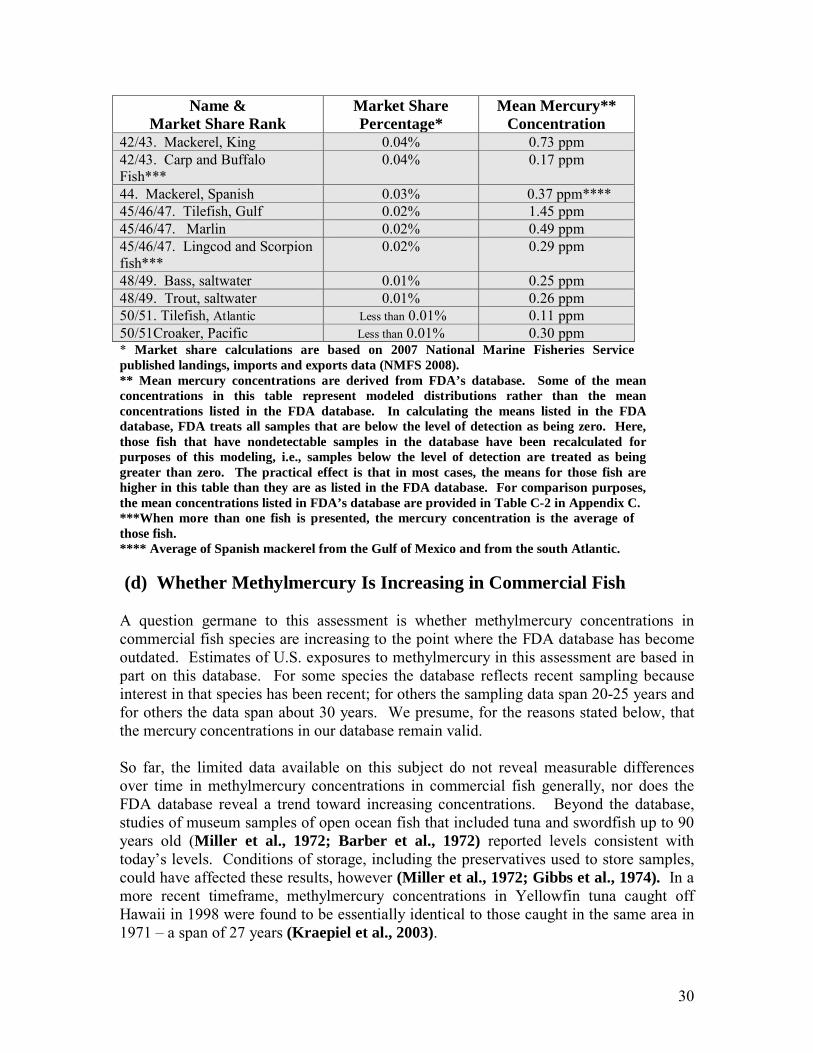
Table II-1 provides mean methylmercury concentrations for commercial species and market types listed by market share. The methylmercury concentrations are from the FDA database.
14 Tilefish samples from the Atlantic in our database average 0.14 ppm.
29
Table II-1: MARKET SHARE BY WEIGHT AND MEAN METHYLMERCURY CONCENTRATIONS.
Name & Market Share Rank
Market Share Percentage*
Mean Mercury** Concentration
1. Shrimp 20.16% 0.01 ppm 2. Pollock 9.27% 0.04 ppm 3. Salmon 9.14% 0.02 ppm 4. Tuna, light canned 8.87% 0.12 ppm 5. Tilapia 7.22% 0.01 ppm 6. Catfish and Pangasius*** 6.16% 0.02 ppm 7. Cod 4.29% 0.09 ppm 8. Tuna, albacore canned 3.61% 0.35 ppm 9. Flatfish 2.77% 0.08 ppm 10. Haddock, Hake and Monkfish***
2.20% 0.07* ppm
11. Crabs 1.57% 0.06 ppm 12. Anchovies, herring, and shad***
1.55% 0.05* ppm
13/14. Tuna, fresh 1.29% 0.39 ppm 13/14. Squid 1.29% 0.07 ppm 15. Clams 0.98% 0.02 ppm 16. Perch, Ocean and Mullet*** 0.83% 0.15 ppm 17. Trout, freshwater 0.74% 0.03 ppm 18. Lobster, American 0.72% 0.11 ppm 19. Scallops 0.70% 0.01 ppm 20. Sardines 0.64% 0.02 ppm 21. Oysters and mussels*** 0.59% 0.02 ppm 22. Mackerel, Atlantic and Atka***
0.57% 0.05 ppm
23. Crawfish 0.53% 0.03 ppm 24. Halibut 0.48% 0.22 ppm 25. Lobster, spiny 0.46% 0.11 ppm 26. Snapper, Porgy &
Sheepshead*** 0.43% 0.16* ppm
27. Skate 0.40% 0.14 ppm 28. Swordfish 0.37% 1.00 ppm 29. Orange Roughy 0.30% 0.57 ppm 30. Croaker, Atlantic 0.21% 0.08 ppm 31. Sablefish 0.19% 0.37 ppm 32. Whitefish 0.16% 0.10 ppm 33. Grouper 0.15% 0.46 ppm 34. Perch, freshwater 0.14% 0.15 ppm 35. Mackerel, chub 0.09% 0.09 ppm 36. Bass, freshwater 0.07% 0.32 ppm 37/38/39/40. Shark 0.06% 0.98 ppm 37/38/39/40. Bluefish 0.06% 0.35 ppm 37/38/39/40. Pike 0.06% 0.14 ppm 37/38/39/40. Butterfish 0.06% 0.06 ppm 41. Smelt 0.05% 0.07 ppm
30
Name & Market Share Rank
Market Share Percentage*
Mean Mercury** Concentration
42/43. Mackerel, King 0.04% 0.73 ppm 42/43. Carp and Buffalo Fish***
0.04% 0.17 ppm
44. Mackerel, Spanish 0.03% 0.37 ppm**** 45/46/47. Tilefish, Gulf 0.02% 1.45 ppm 45/46/47. Marlin 0.02% 0.49 ppm 45/46/47. Lingcod and Scorpion fish***
0.02% 0.29 ppm
48/49. Bass, saltwater 0.01% 0.25 ppm 48/49. Trout, saltwater 0.01% 0.26 ppm 50/51. Tilefish, Atlantic Less than 0.01% 0.11 ppm 50/51Croaker, Pacific Less than 0.01% 0.30 ppm * Market share calculations are based on 2007 National Marine Fisheries Service published landings, imports and exports data (NMFS 2008). ** Mean mercury concentrations are derived from FDA’s database. Some of the mean concentrations in this table represent modeled distributions rather than the mean concentrations listed in the FDA database. In calculating the means listed in the FDA database, FDA treats all samples that are below the level of detection as being zero. Here, those fish that have nondetectable samples in the database have been recalculated for purposes of this modeling, i.e., samples below the level of detection are treated as being greater than zero. The practical effect is that in most cases, the means for those fish are higher in this table than they are as listed in the FDA database. For comparison purposes, the mean concentrations listed in FDA’s database are provided in Table C-2 in Appendix C. ***When more than one fish is presented, the mercury concentration is the average of those fish. **** Average of Spanish mackerel from the Gulf of Mexico and from the south Atlantic. (d) Whether Methylmercury Is Increasing in Commercial Fish A question germane to this assessment is whether methylmercury concentrations in commercial fish species are increasing to the point where the FDA database has become outdated. Estimates of U.S. exposures to methylmercury in this assessment are based in part on this database. For some species the database reflects recent sampling because interest in that species has been recent; for others the sampling data span 20-25 years and for others the data span about 30 years. We presume, for the reasons stated below, that the mercury concentrations in our database remain valid. So far, the limited data available on this subject do not reveal measurable differences over time in methylmercury concentrations in commercial fish generally, nor does the FDA database reveal a trend toward increasing concentrations. Beyond the database, studies of museum samples of open ocean fish that included tuna and swordfish up to 90 years old (Miller et al., 1972; Barber et al., 1972) reported levels consistent with today’s levels. Conditions of storage, including the preservatives used to store samples, could have affected these results, however (Miller et al., 1972; Gibbs et al., 1974). In a more recent timeframe, methylmercury concentrations in Yellowfin tuna caught off Hawaii in 1998 were found to be essentially identical to those caught in the same area in 1971 – a span of 27 years (Kraepiel et al., 2003).
31
We are unaware of increases in commercial freshwater species. Methylmercury concentrations in freshwater commercial species are low. In our database the average methylmercury concentration for commercial freshwater species is 0.08 ppm and the highest average for any species is 0.14 ppm (FDA 2010). It is also worth noting the potential significance of the trend toward more aquacultured fish in the U.S. marketplace. Aquacultured fish tend to be raised and harvested quickly without much opportunity to accumulate methylmercury. Moreover, aquacultured fish are not usually the large predatory types of fish that accumulate methylmercury over time by eating other fish containing methylmercury. On the other side of the coin, there is evidence of significant increases in average total mercury levels in at least some ocean waters during this century (Sunderland et al., 2009). As mercury emissions from human activity convert to methylmercury in the world’s water bodies, methylmercury concentrations in fish could be affected at some point. This is a matter that warrants continued monitoring.
32
SECTION III: IDENTIFICATION OF HEALTH EFFECTS This section reviews evidence that fish consumption can affect:
• Fetal neurodevelopment from prenatal exposure -- from the mother’s consumption of fish, primarily during pregnancy.
• Neurodevelopment in children from postnatal exposure -- from their own
consumption of fish or mother’s milk after the mother has consumed fish. The central nervous system continues to develop after birth so whether young children are especially vulnerable to harm from methylmercury and/or receptive to nutrients in fish that can benefit neurodevelopment are important questions. (Because this assessment is limited to the developing nervous system, this review does not include research on neurological effects in adults from their own consumption of fish.)
The evidence on this subject consists primarily of results from research studies with humans that have been published in peer reviewed, scientific journals. FDA does not conduct primary research in humans on the toxicity of methylmercury or on health effects from nutrients contained in fish. This review focuses on whether there is a consistency of outcome across studies that could reasonably support two hypotheses:
(1) first, that fish consumption directly affects the above health endpoints; and
(2) second, that the overall effects, i.e., the net effects, on these endpoints are determined by the relative strengths of adverse and beneficial effects from methylmercury and nutrients in the fish.
For the most part, the studies examined in this assessment are those that provide evidence relating to the validity (or lack thereof) of both hypotheses. The studies we examined have all been “observational” in that each of them has essentially recorded what was occurring in a given population without removing potentially confounding factors in advance of the study. Observational studies attempt to screen out these factors through statistical techniques. Because they cannot exercise the kind of control over the study environment that is found in a controlled trial, they are considered to be less capable of demonstrating cause-and-effect relationships than controlled trials (FDA 2009). However, they do reveal associational relationships or their absence, which can contribute to a weight of evidence on whether a cause and effect relationship exists. Investigators typically have divided their study populations into subgroups based on extent of exposure, e.g., greater or lesser prenatal exposure to methylmercury, or greater or lesser fish consumption, over a particular time period. They have then examined whether higher or lower exposures within these study populations were associated with differences in health outcomes, e.g., whether more highly exposed individuals tended to have higher or lower scores on tests of neurodevelopment than those with lesser exposures.
33
Early studies looked for associations between methylmercury and adverse health effects without considering overall health effects from eating the fish that contained the methylmercury. Nonetheless, they provide evidence about methylmercury’s contribution to the overall health effects from fish. Many of the more recent studies have looked for associations between fish consumption during pregnancy and neurodevelopment. There is growing recognition that adverse and beneficial effects must be accounted for in order to fully understand the consequences of fish consumption on neurodevelopment. An observation in 2007 by members of the Faroe Islands research team “that the opposite effects of beneficial nutrients and toxic contaminants should not be ignored by epidemiological studies in this field” (Budtz-Jørgensen et al., 2007) has become the norm. Most of the studies that have examined the effect of methylmercury in fish have reported their findings in terms of total mercury, which includes molecular forms of that element that do not appear in fish in significant amounts, i.e., inorganic forms. As mentioned earlier, laboratory analysis for total mercury in hair and blood is easier and less costly to perform than analysis for methylmercury. Nonetheless, this assessment uses the term “methylmercury” as often as possible for the sake of consistency. For most studies it can be assumed that the total mercury found in hair has been mostly methylmercury and that almost all of that methylmercury has been from fish. Given the focus of our review, we do not address many of the technical details and uncertainties associated with each study. This review is not intended to serve as a substitute for reading the reports that have been published by the researchers or analyses of the studies that have been published by others. Regarding the uncertainties that accompany all observational studies, the authors of the published results tend to be forthright in acknowledging them. Also, this review of the studies mostly addresses whether reported effects have been adverse, neutral, or beneficial but does not typically address the reported sizes of those effects. Outside of the extreme poisoning events in Japan and Iraq, reported effects have been subclinical and have required sophisticated tests to detect. Size of effect is addressed in Sections IV and V and in Appendices A through D. (a) Prenatal Exposure: Research on Associations between Fish Consumption and/or Exposure to Methylmercury and Neurodevelopmental Effects in the Fetus As stated previously, early research addressed the effects of methylmercury exposure on fetal neurodevelopment rather than the overall effects of fish consumption. The impetus for doing so was extreme poisoning from methylmercury that occurred in Japan and Iraq. (a)(1) Clinical Effects: Japan and Iraq
34
Extreme poisoning events in Japan in the previous century confirmed that methylmercury in fish can be neurotoxic to humans.15 Methylmercury released into Minamata Bay, Japan from industrial discharge caused accumulations in fish to range from over 5 ppm to nearly 40 ppm (Harada et al., 1995). Given the importance of fish in the Japanese diet, these concentrations led to methylmercury exposures that were often hundreds of times higher than common U.S. exposures. The consequence was an epidemic of neurological effects (Marsh et al., 1987; Harada et al., 1995). In the general population these effects ranged from mild to severe, including numbness in the extremities (paresthesia), inability to coordinate voluntary muscular movements (ataxia), visual effects such as blurred vision and restriction of the visual field, speech and hearing difficulties, and in extreme cases, death from failure of the central nervous system (Bakir et al, 1973; Harada et al., 1995). The event provided strong evidence that at extreme levels, adverse effects from methylmercury can overwhelm any beneficial effects that might otherwise accrue from fish consumption. Another severe poisoning event occurred in Iraq from grain that had been contaminated with methylmercury (Bakir et al, 1973; Marsh et al, 1987). Both the Japanese and Iraqi events indicate that adverse effects do not “plateau” at some level of exposure but continue to increase as exposure increases. Also, children who had been exposed before birth experienced effects that were often more severe than those experienced by their mothers. These effects included congenital cerebral palsy, mental retardation, primitive reflex, deformities of the limbs, and disturbances in physical development and nutrition (Harada et al., 1995). Symptoms of this nature have not been reported outside of these events. Nonetheless, they constitute the primary evidence that the developing fetus can be more sensitive to methylmercury than the adult (Harada et al, 1995; Marsh et al, 1987). (a)(2) Subclinical Effects: New Zealand, Faroe Islands, Seychelles Islands In the wake of the Japan and Iraq events, scientific investigation focused on finding the lowest exposures to methylmercury that could adversely affect the developing nervous system of the fetus. In order to have the best chance of detecting subtle effects, researchers looked for populations with exposures to methylmercury that are relatively high. The researchers anticipated that effects would reveal themselves as differences in scores on neurodevelopmental tests between children who had been prenatally exposed to higher versus lower amounts of methylmercury within a study population (Marsh et al., 1995a; Myers et al., 2007). An early study in New Zealand was designed “to ascertain whether the exposure to high-mercury fish in New Zealand would cause intrauterine methylmercury poisoning”
15 This conclusion is supported by studies with animals. A review of the animal data on methylmercury can be found in the Toxicological Profile on Mercury performed by the Agency for Toxic Substances and Disease Registry (ATSDR). This document contains the conclusion that “animal studies…provide irrefutable evidence that the central and peripheral nervous systems are target organs for organic mercury-induced toxicity” (ATSDR 1999, page 137).
35
(Kjellström et al., 1988). That study found associations between maternal hair levels above 6 ppm (above the 99.9th percentile in the United States) and deficits on tests at ages four and six years (Kjellström et al., 1986 & 1988). The high-mercury fish tended to be shark from “fish and chips“ that were popular within that study population. A subsequent study in the Faroe Islands, located between Iceland and Norway in the north Atlantic, also found adverse associations between methylmercury exposure and results on a number of neurodevelopmental tests (Grandjean et al., 1995 & 1998). The combination of pilot whale and fish that were eaten in the Faroe Islands appears to have been the functional equivalent of eating fish with high concentrations of methylmercury relative to nutrients, as apparently was the case in New Zealand. Although the cod consumed in the Faroe Islands was low in methylmercury, with a reported average concentration of 0.07 ppm (Weihe et al., 1996, page 142), most methylmercury in the diet came from pilot whale (Grandjean et al., 1999). Faroese pilot whales can be high in methylmercury, with a reported average of about 1.6 ppm (Grandjean et al., 1992). A study conducted in the Seychelles Islands located in the Indian Ocean also looked for associations between prenatal exposure to methylmercury and children’s’ test scores in a population with exposures similar to those in New Zealand and the Faroe Islands. The average maternal hair level in the Seychelles Islands was 6.8 ppm (Davidson et al., 1998), which exceeds the 99.9th percentile of U.S. exposure. Fish consumption during pregnancy was about 12 meals per week (Shamlaye et al., 1995). This study has not found consistent associations between methylmercury and test outcomes at various ages through 19 years (Myers et al., 1995, 1997 & 2003; Davidson et al., 1995, 1998 & 2011; van Wijngaarden et al., 2013). The fish eaten in the Seychelles Islands were marine species that were mostly low in methylmercury (Davidson et al., 1998). Neither marine mammals such as the pilot whale eaten in the Faroe Islands, nor shark eaten in New Zealand, were consumed. Nonetheless, research from the Seychelles Islands published in 2008 provides some evidence that methylmercury may be contributing to net effects there. Indication of an adverse methylmercury effect that was hidden within the net effect resulted from an analysis of one test result that took into account both methylmercury and nutrients (Davidson et al., 2008). A beneficial association between omega-3 fatty acids and one test score became stronger when an adjustment was made for mercury (Strain et al., 2008). That latter finding suggests that methylmercury reduced the apparent size of the beneficial effect. In another analysis from the Seychelles Islands, beneficial associations between two test results and the omega-3 fatty acid DHA steadily diminished as methylmercury exposure increased, to the point where the beneficial associations vanished when maternal mercury hair levels reached nine and 11 ppm respectively. (NHANES data show maternal mercury hair levels at the 95th percentile of exposure in the United States at 1.73 ppm; our exposure estimate for the 99.9th percentile of exposure in the United States is around 5.6 ppm.) For two other test results, beneficial associations with DHA increased, then
36
diminished as methylmercury exposures increased, but then stopped diminishing when mercury hair levels reached eight ppm (Lynch et al., 2011).
The Strain et al. and Lynch et al. results suggest that omega-3 fatty acids in fish contribute to the beneficial component of the net effects. The Strain et al. results also provide evidence that beyond some level of consumption, benefits from fish nutrients do not continue to increase. Those results included a beneficial outcome on one test result but not on 15 others even though fish consumption averaged over 18 ounces per week. In other words, one test result improved along with increased fish consumption but all other test results showed no improvement as fish consumption increased. These results suggest that most beneficial effects occur below 18 ounces per week. The nutrients studied were limited but they included omega-3 fatty acids. None of the studies in these three locations (Faroe Islands, New Zealand, Seychelles Islands) attempted to measure the net effects of consuming fish during pregnancy on fetal neurodevelopment. To do that, a study would have to compare neurodevelopmental test results of those whose mothers ate fish during pregnancy against results from those whose mothers ate no fish. Nonetheless, the studies provide important evidence germane to net effects as follows:
• The New Zealand and Faroe Islands studies – and more recently the Seychelles study to a limited extent -- provide evidence that methylmercury can adversely affect fetal neurodevelopment at levels of exposure considerably below those in the Japan and Iraq poisoning events. Exposures in these studies overlap high-end exposures in the United States.
• Two of the studies provide some evidence that fish can contribute beneficially to
fetal neurodevelopment.
• A statistical analysis of Faroe Islands results suggests that net effects from fish include a beneficial component (Budtz-Jørgensen et al., 2007). That analysis found beneficial associations, two of which were statistically significant, between the fish eaten by the mothers and test results in their children.
• In the Seychelles Islands, beneficial associations have been reported between omega-3 fatty acids from eating fish and some test results.
• On the other hand, no associations were found between fish nutrients and many
other test results in the Seychelles Islands. Results from that study have been mostly “flat,” suggesting that beneficial effects had already reached a plateau for most or nearly all participants in that study. (The primary evidence for beneficial effects have come from studies involving lower levels of fish consumption, including before a plateau is reached, in the United Kingdom, the United States, and Denmark, as described below.)

37
(a)(3) Subclinical Effects: Poland, United Kingdom, United States, Denmark, Japan Of the eleven remaining studies reviewed here, only two focused solely on methylmercury. These were studies in Poland that looked for an association between prenatal exposure and results on the Bayley Scales of Infant Development at one year of age (the first study) and then at two and three years of age (the second study) (Jedrychowski et al., 2006 & 2007). Methylmercury exposures appear to have been similar to U.S. exposures, although possibly slightly lower. An adverse association between prenatal exposure and test scores was found in the first study at age one, providing evidence that methylmercury can contribute to net effects at relatively low exposures. An adverse association could not be found, however, at ages two and three years with the same children plus additional children who had been added to the study population (the second study). The absence of an association at the later ages could be interpreted as evidence that an adverse effect can dissipate over time. Disappearance of an adverse association at later ages does not occur in any other published study, however. It could simply be an erroneous finding. The authors could only speculate as to why it occurred. The remaining studies examined the effects from maternal fish consumption or the effects from both maternal fish consumption and prenatal exposure to methylmercury. These studies involved populations in the United States, the United Kingdom, Denmark, and Japan. Methylmercury exposures in the United Kingdom and Denmark substantially overlap those in the United States. The three studies in the United Kingdom all involved participants in the Avon Longitudinal Study of Parents and Children. These studies provide evidence about the direction and size of net effects from fish consumption under certain circumstances. In Williams et al. (2001), oily fish consumption during pregnancy was associated with a greater likelihood that the children would fully develop stereoscopic vision at 3.5 years of age when compared against children whose mothers ate no fish during pregnancy. In Daniels et al. (2004), fish consumption during pregnancy was associated with better scores on the Macarthur Communicative Development Inventory at 15 months of age and the Denver Developmental Screening Test at 18 months of age than were obtained by those whose mothers ate no fish. In Hibbeln et al. (2007), fish consumption during pregnancy was associated with improvements on a battery of tests administered at ages six months through eight years, including IQ, over eating no fish during pregnancy. In the Daniels et al. (2004) study, fish consumption through four servings per week was more beneficial than no fish consumption, although the greatest increases in benefit were between eating no fish and eating 1-3 meals per week. These findings suggest that most of the beneficial effects occur at relatively low levels of fish consumption. Benefits tended to peak within 1-3 meals per week and in some cases appeared to diminish slightly above three meals, although the net effects were still beneficial. These findings suggest that beneficial effects can reach a plateau within this range of
38
consumption. They also suggest that when consumption exceeds an amount needed to produce a peak benefit, the size of the net beneficial effect can diminish, possibly due to increased intake of methylmercury. The Daniels et al. (2004) study also looked for, but did not find, an association between methylmercury exposures and test scores within a subset of 1,054 children in its study population. Moreover, adjusting for mercury did not cause beneficial effects to increase, i.e., the beneficial net effects did not seem to have been measurably reduced by methylmercury. These findings can be interpreted as evidence that methylmercury is not neurotoxic at levels of exposure seen in the United Kingdom, i.e., that there is a threshold of effect above the exposures experienced by this study population. Such an interpretation would not be consistent, however, with the finding in that study – albeit slight -- of a decrease in the beneficial net effect above three servings per week. Consequently, an alternative interpretation is that to methylmercury’s contribution to net effects is not always detected in an observational study when exposures to it are relatively low. Hibbeln et al. (2007) was the first of four studies published so far that was designed to examine the consequences of following or exceeding the FDA/EPA consumption advice relating to methylmercury issued in 2004. That advice recommends that women who might become pregnant, women who are pregnant, and nursing mothers eat up to 12 ounces per week of fish, defined as two average servings (FDA/EPA 2004), i.e., that they not exceed 12 ounces per week. In Hibbeln et al. (2007), eating no fish during pregnancy was associated with the greatest risk that children would score in the bottom quartile, i.e., the lowest 25 percent, of that study population, on tests of verbal IQ. Fish consumption up to 12 ounces per week was associated with less risk of scoring in the bottom quartile while consumption of more than 12 ounces per week was associated with the least risk. The beneficial effect above 12 ounces per week reported in Hibbeln et al. (2007) suggests that the peak beneficial effect seen in Daniels et al. (2004) within a range of 1-3 servings per week was likely to have been closer to three servings than to one. Data on verbal IQ that were obtained by FDA on the same study population reveal a tapering in the rate of improvement as fish consumption increased. This finding suggests that a plateau would be reached at some point, possibly just beyond the highest levels for which data were generated. Additional data obtained by FDA on full IQ from the same study population also indicate the existence of a plateau toward the high end of fish consumption (see Section IV and Appendices A and D for details). The Hibbeln et al. (2007) study only looked at fish consumption and did not measure methylmercury exposure. The researchers estimated exposures after the fact and concluded that methylmercury had increased the risk of low performance on verbal IQ in the group that ate up to 12 ounces of fish per week (Hibbeln et al., 2007; Hibbeln 2007). These estimates were based on an assumption that methylmercury contributes adversely to net effects at relatively low levels of exposure.
39
In the Hibbeln et al. (2007) study, beneficial effects were associated with increases in intake of omega-3 fatty acids during pregnancy, suggesting that omega-3 fatty acids significantly contribute to the benefits or are the sole source of them. On the other hand, the beneficial effects in Daniels et al. (2004) were associated equally with “white” fish and “oily” fish, suggesting that nutrients other than omega-3 fatty acids contribute to benefits. “Oily” fish tend to be those that are rich in omega-3 fatty acids as compared to “white” fish. In the United States, four studies found both adverse effects from methylmercury and beneficial effects from fish nutrients. The earliest of these, Oken et al. (2005), looked for associations between both fish consumption and methylmercury exposure and results on a test of visual recognition memory16 at ages 5.5 – 8.4 months. Each additional weekly serving of fish was associated with a four point gain on that test. Conversely, each 1.0 ppm of mercury in maternal hair was associated with a loss on the test of 7.5 points. The gain from “fish” was adjusted for mercury while the loss from mercury was adjusted for fish consumption, meaning that the gains and losses represented contributions to the net effects but not the net effects themselves. The results suggest that methylmercury contributes adversely and fish nutrients contribute beneficially at U.S. levels of exposure. It is possible to compare the size of the gain in test points from fish consumption against the size of the loss in test points from methylmercury by converting loss-per-each-1.0 ppm of hair mercury to loss-per-each-additional weekly fish serving. Each additional weekly fish serving was associated with a loss of 1.28 points from methylmercury and an increase of four points from fish,17 for a net gain of 2.72 points per additional serving on average. While the net effect on any given individual could be worse than the average, this result indicates that the beneficial contribution to the net effect can exceed the adverse contribution at relatively low levels of fish consumption. The Oken et al. (2005) study examined the consequences of exceeding or following the joint FDA/EPA consumption advice relating to methylmercury by considering the effect of eating more or less than two servings per week. Eating more than two servings was associated with higher scores on average than eating two servings or less. The best results were associated with eating more than two servings when methylmercury exposures were below the 90-95th percentiles. These findings indicate that a net effect
16A “visual recognition memory” test measures the total time that an infant spends looking at a picture of a new face rather than a picture of a familiar face. It involves an infant’s ability to remember and recognize a familiar stimulus, then to look away towards a new stimulus. The authors pointed out that the results correlate with later IQ, although the correlation is stronger when mental development is impaired than it is when cognition is within normal range (Oken et al., 2005, page 1,379). 17 Average loss per fish serving can be determined by first calculating how many weekly fish servings had to be consumed in order to achieve an increase of 1.0 ppm in maternal hair mercury in this study population. According to the authors, each weekly fish serving resulted in an increase of 0.17 ppm in maternal hair mercury. Dividing 0.17 ppm into 1.0 ppm reveals that 5.88 weekly fish meals were needed to achieve an increase of 1.0 ppm. Dividing 5.88 weekly fish meals into 7.5 VRM points lost (per each 1.0 ppm) results in 1.28 VRM points lost per weekly fish meal due to methylmercury.
40
from eating more than two servings per week can be more beneficial than eating less than two, especially when methylmercury in the fish is low. The study also suggests that if there is a maximum beneficial effect from eating fish, it may require more than two servings per week to obtain it, depending upon the circumstances. The second study in the United States, Oken et al. (2008), looked for associations between results on the Peabody Picture Vocabulary Test (PPVT) and the Wide Range Assessment of Visual Motor Abilities (WRAVMA), at three years of age and the following: (a) fish consumption during pregnancy; (b) the omega-3 fatty acids DHA and EPA from those fish; and (c) prenatal exposure to methylmercury from those fish. Generally speaking, maternal fish consumption was associated with improvements on the tests while methylmercury was associated with reductions, providing further evidence of both adverse and beneficial contributions to net effects at U.S. levels of consumption and exposure. Oken et al. (2008) compared eating relatively large and small amounts of fish, coupled with relatively large and small exposures to methylmercury during pregnancy, against eating no fish. The study also measured differences between eating more and less than two servings per week in order to examine the consequences of following or exceeding the joint FDA/EPA fish consumption advice. Eating more than two servings was associated with higher scores on the WRAVMA than eating two or less servings, including eating no fish at all. Methylmercury appeared to affect these outcomes, however. In the group that ate more than two servings per week, those with lower exposures (i.e., exposures below the highest 10 percent of U.S. exposures) did better than those with higher exposures (i.e., exposures in the highest U.S. 10 percent), even though both subgroups experienced net benefits. These results indicate that net effects can be beneficial when maternal consumption exceeds two servings per week, although the size of the beneficial effect can be reduced by the methylmercury in the fish. The magnitude of that reduction would be determined by the amount of methylmercury. Methylmercury also appeared to affect outcomes in the group that ate two or less servings per week. In this group, children with lower exposures (i.e., exposures that were below the highest 10 percent of U.S. exposures) had somewhat better scores than those whose mothers ate no fish during pregnancy, although the difference was not statistically significant. Conversely, 25 children in that group who had higher exposures (i.e., exposures in the top U.S. 10 percent) had scores that were generally lower than those whose mothers ate no fish during pregnancy. This latter result suggests that net effects can be adverse in the United States when methylmercury is high relative to fish nutrients. Although the amounts of fish eaten during pregnancy had been relatively low, i.e., two or less servings per week, they had resulted in exposures that were in the highest 10 percent of U.S. exposures. The number of children associated with that outcome was small (25 out of 341) but the result is at least consistent with two general propositions: (1) that methylmercury is capable of contributing to net effects at U.S. levels of exposure; and (2) that high methylmercury relative to fish nutrients can produce adverse net effects.
41
This study also found an association between each 100 mg. of maternal daily DHA and EPA from fish and increases on both the PPVT and the WRAVMA, suggesting that omega-3 fatty acids contribute to the beneficial effect. Finally, it is worth noting that the two Oken et al. studies suggest that any plateau that exists in the beneficial effect is likely to be above two servings per week. The third study in the United States, Lederman et al. (2008), looked for associations between both prenatal exposure to mercury and fish consumption during pregnancy and results on the Bayley Scales of Infant Development II at 12, 24, and 36 months of age and on the Wechsler Preschool and Primary Scale of Intelligence at 48 months of age. The original purpose of this study was to examine whether proximity to the collapse of the World Trade Center towers in 2001 would be associated with in elevated total mercury levels in blood and whether these blood levels would be associated with adverse neurodevelopmental effects in children born shortly after September 11. These associations were not found; the authors concluded that it was likely that blood mercury in the individuals studied came from other sources, which may have been in the form of inorganic mercury. Blood mercury was associated with lower scores while fish consumption during pregnancy, i.e., eating fish as compared to not eating fish, was associated with higher scores. These results provide additional evidence that both methylmercury and nutrients in fish contribute to net effects at U.S. levels of consumption and exposure. As with the other studies in the United States, the most recent study, Sagiv et al. (2012), found both adverse associations with mercury and beneficial associations with fish consumption consistent with net effects that include both of them. Adverse associations were found between prenatal exposure to mercury and attention-deficit/hyperactivity disorder (ADHD)–related behaviors at eight years of age, although primarily when exposures to mercury were 1 ppm or higher in maternal hair during pregnancy. This level corresponds to just above the 90th percentile of exposure among women of childbearing age per FDA’s exposure modeling (see Table V-3). The study also found associations between eating more than two fish meals per week and protection against some ADHD–related behaviors. In this study population, 607 children took neurodevelopmental tests of ADHD-related behaviors, while 421 children had measures of maternal hair mercury and 515 had fish consumption data. The next study in this review, which involved a relatively large population in Denmark, looked for associations between fish consumption during pregnancy and a variety of developmental milestones, such as sitting unsupported at six months of age and climbing stairs and drinking from a cup at 18 months of age (Oken et al., 2008a). Methylmercury exposures were not measured, but the authors reported that the most commonly consumed fish had median mercury levels between 0.034 and 0.049 ppm. These values are well below the U.S. average for commercial fish weighted for consumption of 0.072 ppm. Amounts of fish consumed were similar to amounts consumed in the United States, e.g., most women in the Danish study population ate between 1-2 servings per week.
42
The Denmark study found that milestone results were better for those whose mothers ate the most fish in the study than they were for those whose mothers ate the least fish, including no fish. The study also examined the consequences of following or exceeding the FDA/EPA consumption advice by comparing results from children whose mothers ate more than 12 ounces per week against those whose mothers ate 12 or fewer ounces per week. Fish consumption above 12 ounces per week was associated with the best milestone attainments. This result indicates that eating more than 12 ounces per week can produce a beneficial net effect, especially when methylmercury is low relative to beneficial nutrients. It also suggests that a plateau on benefits can be above 12 ounces per week. The last study in this review examined results on a Neonatal Assessment Scale at three days of age in a study population of 498 mother-infant pairs in Japan (Suzuki et al., 2010). The study found adverse associations between methylmercury exposure and results on the “motor cluster” portion of the test and beneficial associations between fish consumption and the “motor cluster” results. These associations provide evidence of a methylmercury contribution and a beneficial fish contribution to the net effects. Average fish consumption in this study population was 12.6 ounces per week, so it is reasonable to assume that some women ate enough to exceed a benefits plateau while others did not. For those who did not, benefits could still be increasing along with consumption. For those who exceeded the plateau, the only effect that would reveal itself would be from methylmercury. It is possible, therefore, that the associations found with both methylmercury and fish benefits reflect different levels of fish consumption in that population. In any event, the published results involve the earliest ages in a long-term study of these children, so results on subsequent tests may help clarify these findings. To facilitate comparison of methylmercury exposures in the various study populations to U.S. exposures, Table V-3 in Section V provides estimates of methylmercury levels in hair and blood in U.S. women of childbearing age. The estimates come from FDA exposure modeling. FDA’s estimated average fish intake for U.S. women of childbearing age is 3.6 ounces per week (Table V-1 in Section V). Table III-1 summarizes the above-mentioned studies and the evidence they provide.
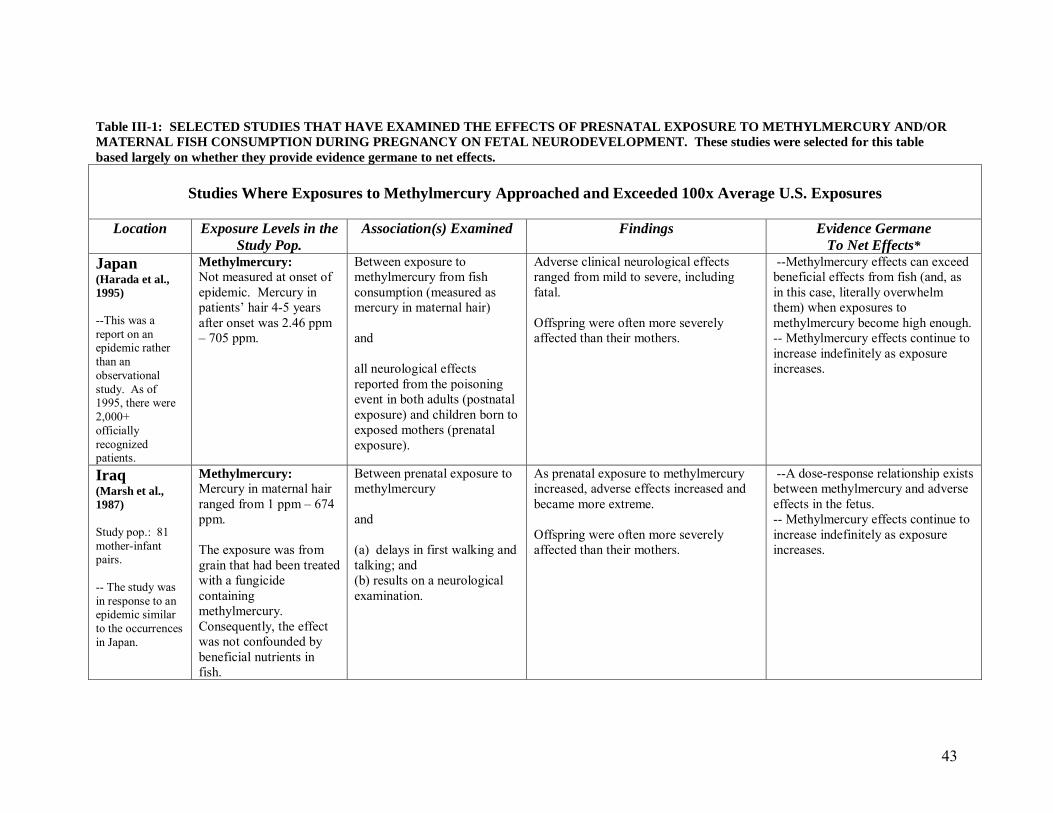
43
Table III-1: SELECTED STUDIES THAT HAVE EXAMINED THE EFFECTS OF PRESNATAL EXPOSURE TO METHYLMERCURY AND/OR MATERNAL FISH CONSUMPTION DURING PREGNANCY ON FETAL NEURODEVELOPMENT. These studies were selected for this table based largely on whether they provide evidence germane to net effects.
Studies Where Exposures to Methylmercury Approached and Exceeded 100x Average U.S. Exposures
Location Exposure Levels in the
Study Pop. Association(s) Examined Findings Evidence Germane
To Net Effects* Japan (Harada et al., 1995) --This was a report on an epidemic rather than an observational study. As of 1995, there were 2,000+ officially recognized patients.
Methylmercury: Not measured at onset of epidemic. Mercury in patients’ hair 4-5 years after onset was 2.46 ppm – 705 ppm.
Between exposure to methylmercury from fish consumption (measured as mercury in maternal hair) and all neurological effects reported from the poisoning event in both adults (postnatal exposure) and children born to exposed mothers (prenatal exposure).
Adverse clinical neurological effects ranged from mild to severe, including fatal. Offspring were often more severely affected than their mothers.
--Methylmercury effects can exceed beneficial effects from fish (and, as in this case, literally overwhelm them) when exposures to methylmercury become high enough. -- Methylmercury effects continue to increase indefinitely as exposure increases.
Iraq (Marsh et al., 1987) Study pop.: 81 mother-infant pairs. -- The study was in response to an epidemic similar to the occurrences in Japan.
Methylmercury: Mercury in maternal hair ranged from 1 ppm – 674 ppm. The exposure was from grain that had been treated with a fungicide containing methylmercury. Consequently, the effect was not confounded by beneficial nutrients in fish.
Between prenatal exposure to methylmercury and (a) delays in first walking and talking; and (b) results on a neurological examination.
As prenatal exposure to methylmercury increased, adverse effects increased and became more extreme. Offspring were often more severely affected than their mothers.
--A dose-response relationship exists between methylmercury and adverse effects in the fetus. -- Methylmercury effects continue to increase indefinitely as exposure increases.
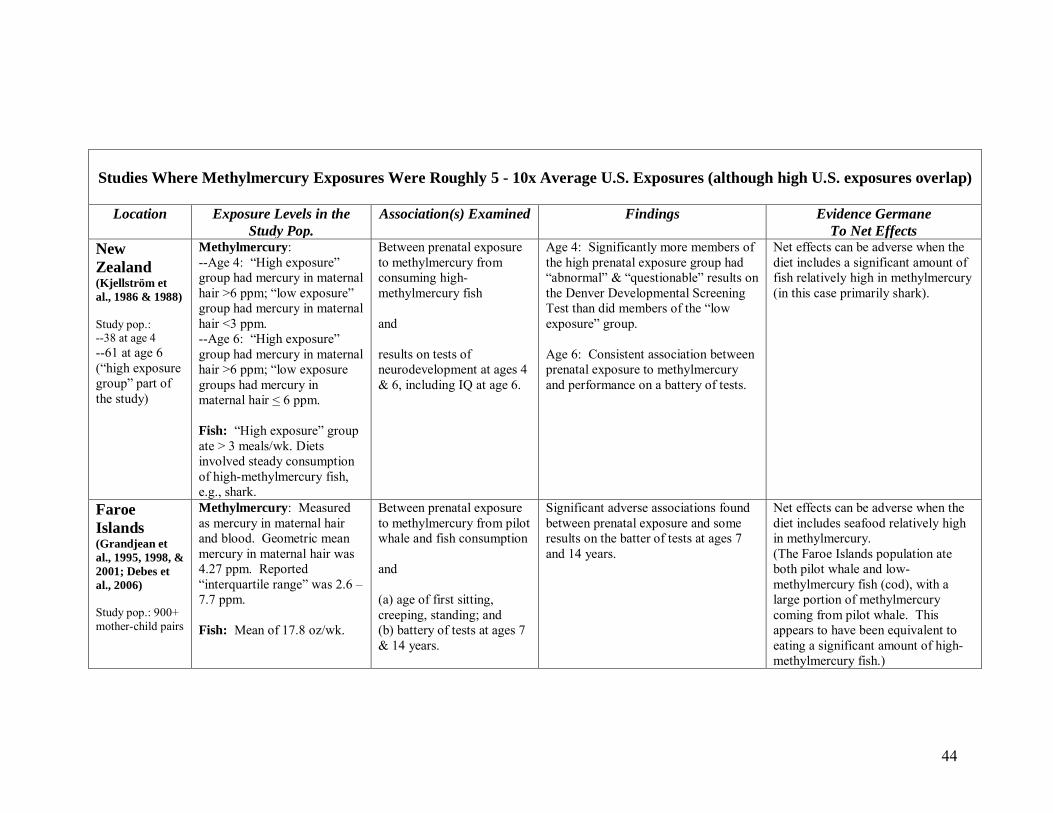
44
Studies Where Methylmercury Exposures Were Roughly 5 - 10x Average U.S. Exposures (although high U.S. exposures overlap)
Location Exposure Levels in the Study Pop.
Association(s) Examined Findings Evidence Germane To Net Effects
New Zealand (Kjellström et al., 1986 & 1988) Study pop.: --38 at age 4 --61 at age 6 (“high exposure group” part of the study)
Methylmercury: --Age 4: “High exposure” group had mercury in maternal hair >6 ppm; “low exposure” group had mercury in maternal hair <3 ppm. --Age 6: “High exposure” group had mercury in maternal hair >6 ppm; “low exposure groups had mercury in maternal hair < 6 ppm. Fish: “High exposure” group ate > 3 meals/wk. Diets involved steady consumption of high-methylmercury fish, e.g., shark.
Between prenatal exposure to methylmercury from consuming high-methylmercury fish and results on tests of neurodevelopment at ages 4 & 6, including IQ at age 6.
Age 4: Significantly more members of the high prenatal exposure group had “abnormal” & “questionable” results on the Denver Developmental Screening Test than did members of the “low exposure” group. Age 6: Consistent association between prenatal exposure to methylmercury and performance on a battery of tests.
Net effects can be adverse when the diet includes a significant amount of fish relatively high in methylmercury (in this case primarily shark).
Faroe Islands (Grandjean et al., 1995, 1998, & 2001; Debes et al., 2006) Study pop.: 900+ mother-child pairs
Methylmercury: Measured as mercury in maternal hair and blood. Geometric mean mercury in maternal hair was 4.27 ppm. Reported “interquartile range” was 2.6 – 7.7 ppm. Fish: Mean of 17.8 oz/wk.
Between prenatal exposure to methylmercury from pilot whale and fish consumption and (a) age of first sitting, creeping, standing; and (b) battery of tests at ages 7 & 14 years.
Significant adverse associations found between prenatal exposure and some results on the batter of tests at ages 7 and 14 years.
Net effects can be adverse when the diet includes seafood relatively high in methylmercury. (The Faroe Islands population ate both pilot whale and low-methylmercury fish (cod), with a large portion of methylmercury coming from pilot whale. This appears to have been equivalent to eating a significant amount of high-methylmercury fish.)
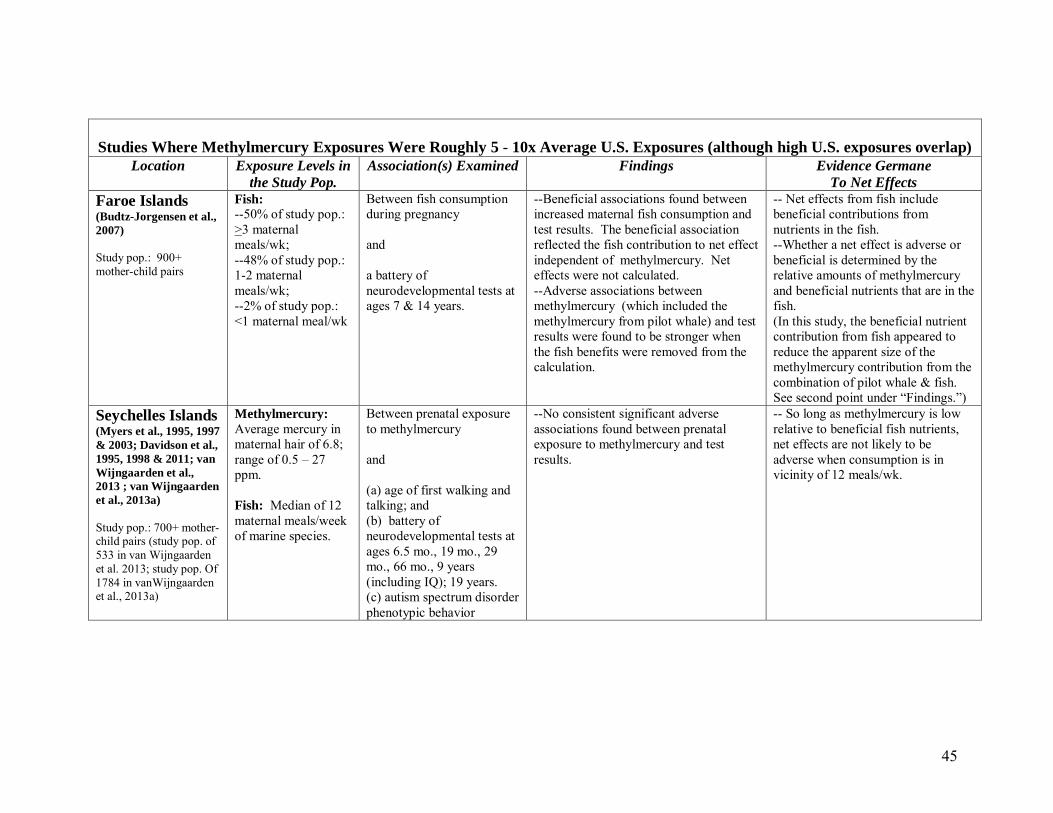
45
Studies Where Methylmercury Exposures Were Roughly 5 - 10x Average U.S. Exposures (although high U.S. exposures overlap)
Location Exposure Levels in the Study Pop.
Association(s) Examined Findings Evidence Germane To Net Effects
Faroe Islands (Budtz-Jorgensen et al., 2007) Study pop.: 900+ mother-child pairs
Fish: --50% of study pop.: >3 maternal meals/wk; --48% of study pop.: 1-2 maternal meals/wk; --2% of study pop.: <1 maternal meal/wk
Between fish consumption during pregnancy and a battery of neurodevelopmental tests at ages 7 & 14 years.
--Beneficial associations found between increased maternal fish consumption and test results. The beneficial association reflected the fish contribution to net effect independent of methylmercury. Net effects were not calculated. --Adverse associations between methylmercury (which included the methylmercury from pilot whale) and test results were found to be stronger when the fish benefits were removed from the calculation.
-- Net effects from fish include beneficial contributions from nutrients in the fish. --Whether a net effect is adverse or beneficial is determined by the relative amounts of methylmercury and beneficial nutrients that are in the fish. (In this study, the beneficial nutrient contribution from fish appeared to reduce the apparent size of the methylmercury contribution from the combination of pilot whale & fish. See second point under “Findings.”)
Seychelles Islands (Myers et al., 1995, 1997 & 2003; Davidson et al., 1995, 1998 & 2011; van Wijngaarden et al., 2013 ; van Wijngaarden et al., 2013a) Study pop.: 700+ mother-child pairs (study pop. of 533 in van Wijngaarden et al. 2013; study pop. Of 1784 in vanWijngaarden et al., 2013a)
Methylmercury: Average mercury in maternal hair of 6.8; range of 0.5 – 27 ppm. Fish: Median of 12 maternal meals/week of marine species.
Between prenatal exposure to methylmercury and (a) age of first walking and talking; and (b) battery of neurodevelopmental tests at ages 6.5 mo., 19 mo., 29 mo., 66 mo., 9 years (including IQ); 19 years. (c) autism spectrum disorder phenotypic behavior
--No consistent significant adverse associations found between prenatal exposure to methylmercury and test results.
-- So long as methylmercury is low relative to beneficial fish nutrients, net effects are not likely to be adverse when consumption is in vicinity of 12 meals/wk.

46
Studies Where Methylmercury Exposures Were Roughly 5 - 10x Average U.S. Exposures (although high U.S. exposures overlap) Location Exposure Levels in the
Study Pop. Association(s) Examined Findings Evidence Germane
To Net Effects Seychelles Islands (Davidson et al., 2008) Study pop: 229 mother-child pairs
Methylmercury: Average Hg in maternal hair was 5.9 ppm Fish: Maternal consumption averaged about 19 oz/wk.
Between prenatal exposure to: (a) methylmercury; (b) the omega-3 fatty acid DHA; (c) the omega-6 fatty acid AA; (d) iodine; and (e) iron (measured in maternal blood) and measures of infant cognition & memory at 5, 9, 25, and 30 months of age.
An adverse association between methylmercury and one of 16 developmental endpoints (psychomotor component of BSID-II) at 30 months when analysis took into account both methylmercury and nutrients. The adverse association was otherwise hidden within the overall net effects. No other adverse or beneficial association found with remaining test scores.
-- Net effects from a diet of marine species can contain an adverse methylmercury component. -- The beneficial effect has a plateau that is below 18 oz/wk. (Because beneficial effects did not appear to increase as fish consumption increased.)
Seychelles Islands (Strain et al., 2008) Study pop : 229 mother-child pairs
Methylmercury: Average Hg in maternal hair was 5.9 ppm Fish: Maternal consumption averaged about 19 oz /wk
Between prenatal exposure to: (a) methylmercury; (b) the omega-3 fatty acids DHA, EPA, & ALA; (c) the omega-6 fatty acids AA & LA and results on Bayley Scales of Infant Development II test at ages 9 and 30 months.
A beneficial association between omega-3 fatty acids and one of 16 developmental endpoints (psychomotor component of BSID-II at age 9 months). The association became stronger when adjustment was made for methylmercury, i.e., methylmercury appeared to reduce the size of the beneficial effect.
--Beneficial net effects can be reduced to some degree by methylmercury. --Most but not necessarily all beneficial effects have stopped increasing when fish consumption is in the vicinity of 18 oz/wk. --Omega-3 fatty acids may contribute to the beneficial effect.
Seychelles Islands (Lynch et al., 2011) Study pop : 229 mother-child pairs
Methylmercury: Average Hg in maternal hair was 5.9 ppm Fish: Maternal consumption averaged about 19 oz /wk
Between prenatal exposure to: (a) A combination of methylmercury and the omega-3 fatty acid DHA; (b) A combination of methylmercury and the omega-6 fatty acid AA; (c) A combination of methylmercury and maternal iodine;
--The beneficial association between the omega-3 fatty acid DHA and results on 2 Bayley subtests (MDI at 9 months and PDI at 30 months) steadily decreased as methylmercury exposure increased and disappeared at 9 & 11 ppm hair mercury respectively. --The beneficial association between DHA and results on 2 other Bayley
--Beneficial net effects can be reduced by increasing exposure to methylmercury. --When methylmercury exposure becomes high enough, a beneficial net effect can disappear and be replaced by an adverse net effect. --Omega-3 fatty acids may

47
Studies Where Methylmercury Exposures Were Roughly 5 - 10x Average U.S. Exposures (although high U.S. exposures overlap)
Location Exposure Levels in the Study Pop.
Association(s) Examined Findings Evidence Germane To Net Effects
(d) A combination of methylmercury and maternal iron; (e) A combination of methylmercury and maternal choline; And Results on the Bayley Scales of Infant Development II test at ages 9 and 30 months.
subtests (MDI at 30 months and PDI at 9 months) increased then decreased as methylmercury exposure increased up to 8 ppm maternal hair, but did not decrease thereafter. --The other nutrients were essentially unaffected by increasing methylmercury exposure.
contribute to the beneficial effect. -- Iron, iodine, the omega-6 fatty acid AA, and choline might not contribute to the beneficial effect.
Japan (Suzuki et al., 2010) Study pop : 498 mother-infant pairs
Methylmercury: Median Hg in maternal hair was 1.96 ppm. Fish: Maternal fish consumption averaged 12.6 oz/wk.
Between: (a)Prenatal exposure to methylmercury; and (b)Fish consumption during pregnancy And Results on Neonatal Behavioral Assessment Scale (NBAS) at 3 days of age
-- An adverse association between methylmercury and results on “motor cluster” of the NBAS. -- A positive association between fish consumption and results on the “motor cluster” of the NBAS.
Net effects from fish can include adverse contributions from methylmercury and beneficial contributions from nutrients in fish.

48
Studies in the United States or Countries with Exposures to Methylmercury Largely Within the Range of U.S. Exposures
Location Exposure Levels in the Study Pop.
Association(s) Examined Findings Evidence Germane To Net Effects
U.K. (Williams et al., 2001) Study pop.: 435 mother-child pairs
Fish: divided “oily” fish and into 3 frequency categories: --Never during pregnancy; --Once every 2 wks during pregnancy; --More than once every 2 wks during pregnancy. Methylmercury: not measured in either fish or population biomarkers.
Between consumption of oily fish during pregnancy and stereoscopic vision at 3.5 years.
A beneficial association between maternal consumption of oily fish and achievement of full (adult level) stereoscopic vision in offspring.
-- Fish consumption during pregnancy can be net beneficial for a child’s visual development. -- The beneficial effect occurs with oily fish or the omega-3 fatty acid DHA in oily fish.
U.K. (Daniels et al., 2004) Study pop.: 7,421 mother-infant pairs --subset of 1,054 mother-infant pairs measured for Hg
Fish: Divided into 4 amount categories: -- 0; -- 1 serving/2 wks; -- 1-3 servings/wk; -- >4 servings/wk. Methylmercury: measured as mercury in umbilical cord tissue; median of 0.01 µg/g wet weight.
--Between fish consumption during pregnancy and prenatal exposure to methylmercury and results on MacArthur Communicative Development Inventory at 15 months of age and Denver Developmental Screening Test at 18 months of age.
Fish: --Fish consumption during pregnancy through 4+ servings per week was associated with “subtle but consistent” increases in test scores. Fish intake was also “subtly” associated with the highest scores. -- The largest increases tended to be associated with eating relatively low amounts of fish, e.g., 1-3 servings/wk., over eating no fish. Benefits tended to peak in the 1-3 servings/wk range. -- At >4 servings/wk, some benefits were slightly smaller than they had been at 1-3 servings/wk. -- “Oily” fish and “white” fish were
-- Net effects from fish consumption are likely to be beneficial through 4 servings/wk. when methylmercury intake is low relative to beneficial nutrients. --Greatest increases in benefits occur with relatively low fish consumption. Beyond that, increases can occur but not as strongly, until benefits stop increasing. -- The peak beneficial effect is in the range of 1-3 fish servings/wk. --When consumption exceeds that needed to achieve the peak for benefits, the beneficial net effect becomes smaller, possibly because

49
Studies in the United States or Countries with Exposures to Methylmercury Largely Within the Range of U.S. Exposures
Location Exposure Levels in the
Study Pop. Association(s) Examined Findings Evidence Germane
To Net Effects
associated with similar beneficial net effects. Methylmercury: No significant adverse association found.
the adverse contribution from methylmercury continues to increase. --Beneficial effects are not limited to omega-3 fatty acids.
U.S. (Oken et al., 2005) Study pop.: 135
Fish: Maternal consumption averaged 1.2 servings/wk. (range of 0-5.5 servings/wk) Methylmercury: Average mercury in maternal hair was 0.55 ppm, with range of 0.02 ppm – 2.38 ppm.
Between fish consumption during pregnancy and prenatal exposure to methylmercury and test of visual recognition memory at ages 5.5 – 8.4 months.
Maternal fish consumption independent of methylmercury (i.e., the beneficial nutrient contribution to the net effects) was associated with improvements on the test while methylmercury independent of fish (i.e., the adverse methylmercury contribution to the net effects) was associated with reductions as follows: --Each additional weekly fish serving was associated with a 4 point gain while each 1.0 ppm of mercury was associated with a 7.5 point loss. [NOTE: When converted to common metric of “per additional weekly fish serving,” average gain was 4 points and an average loss was 1.28 points, for an average net gain per serving of 2.7 points.] -- Eating > 2 servings per week was associated with higher scores on average than < 2 servings/wk. -- > 2 servings per week & lower methylmercury appeared to be
At fish consumption levels and methylmercury exposures in this U.S. study: -- Net effects from fish include both benefits from nutrients and deficits from methylmercury: -- The beneficial contribution to the net effects can be larger than the adverse methylmercury contribution. -- Low methylmercury exposure can facilitate the most beneficial net effect. -- Assuming the beneficial effect has a plateau per the evidence from Seychelles Island and the U.K, it is above 2 servings/wk.

50
Studies in the United States or Countries with Exposures to Methylmercury Largely Within the Range of U.S. Exposures
Location Exposure Levels in the
Study Pop. Association(s) Examined Findings Evidence Germane
To Net Effects
associated with best results.
Poland (Jedrychowski et al., 2006) Study pop.: 233
Methylmercury: Measured as mercury in cord & maternal blood. Geometric mean in maternal blood was 0.55 µg/L with range of 0.10 – 3.40 µg/L.
Prenatal exposure to methylmercury and results on the Bayley Scales of Infant Development II at 1 year of age.
Significant adverse associations found between prenatal exposure and test results.
Methylmercury can contribute to net effects at relatively low levels of prenatal exposure.
Poland (Jedrychowski et al., 2007) Study pop.: 374 (including the original study population of 233)
Methylmercury: Measured as mercury in cord blood.
Prenatal exposure to methylmercury and results on the Bayley Scales of Infant Development II at 2 & 3 years of age.
No significant adverse association found between prenatal exposure and test results. The significant adverse association seen at age 1 (previous study) was no longer found.
Methylmercury does not contribute to net effects at low exposure (or, if it does contribute, it is so small that it is difficult to detect). Or An adverse methylmercury effect is not necessarily permanent, at least when prenatal exposure is low. Or Meaning is just unclear. Reinforces why a single observational study does not prove cause-&-effect or absence thereof, especially when effects are small.

51
Studies in the United States or Countries with Exposures to Methylmercury Largely Within the Range of U.S. Exposures
Location
Exposure Levels in the Study Pop
Association(s) Examined
Findings
Evidence Germane
To Net Effects U.K. (Hibbeln et al., 2007 ; Hibbeln 2007) Study pop.: 9,000 mother-child pairs
Fish: Maternal consumption averaged 8.3 oz/wk, with a range of 0 – 115.4 oz/wk. Omega-3 fatty acids: Study pop. averaged 1.6 g/wk, with a range of 0 – 15.6 g/wk. Methylmercury: not measured.
Between fish consumption during pregnancy and battery of neurodevelopmental tests ages 6 months through 8 years, including IQ at age 8.
On tests of verbal IQ: -- Zero fish consumption during pregnancy was associated with greatest risk of scoring in the bottom 25% within the study pop. -- Fish consumption < 12 oz/wk was associated with less risk of scoring in the bottom 25%. -- Fish consumption >12 oz/wk was associated with the least risk. -- Greater maternal consumption of omega-3 fatty acids was associated with reduced risk of scoring in lowest 25%. Follow-up estimate: Methylmercury assumed to have reduced the size of the beneficial effect (Hibbeln 2007).
-- So long as methylmercury is low relative to beneficial fish nutrients, net effects from >12 oz. of fish/wk are likely to be beneficial. -- A plateau in beneficial effects can be above 12 ounces/wk. --Omega-3 fatty acids may contribute to the beneficial effects. -- Beneficial net effects can still contain methylmercury contributions that reduce the size of the net benefits.
U.S. (Oken et al., 2008) Study pop.: 341
Fish: Maternal consumption averaged 1.5 servings/wk. (range of 0 – 7.5 servings/wk). Methylmercury: measured as mercury in maternal blood and hair. Average mercury-hair was .053 ppm, with a range of 0 ppm – 2.4 ppm The omega-3 fatty acids
Between: (a) fish consumption during pregnancy; (b) maternal omega-3 fatty acids DHA & EPA from fish; (c) prenatal exposure to methylmercury (measured as Hg-hair) and results on Peabody Picture Vocabulary Test (PPVT) and Wide Range Assessment of
Maternal fish consumption was associated with improvements on WRAVMA test while methylmercury was associated with reductions as follows: -->2 servings/wk was associated with higher scores than with both : (a) <2 servings/wk.; and (b) eating no fish during pregnancy. -- >2 servings/wk resulting in exposures to methylmercury below the 90th percentile was associated with the highest scores.
At U.S. fish consumption levels and methylmercury exposures in this study: -- Net effects from fish include both benefits from nutrients and deficits from methylmercury. -- Net effects are mostly beneficial because methylmercury is low relative to beneficial nutrients in most U.S. commercial fish, although methylmercury in the fish reduces the net benefit to some extent. -- However, net effects can be

52
Studies in the United States or Countries with Exposures to Methylmercury Largely Within the Range of U.S. Exposures
Location
Exposure Levels in the
Study Pop
Association(s) Examined
Findings
Evidence Germane
To Net Effects DHA and EPA from
fish: Maternal consumption averaged 128 mg/day.
Visual Motor Abilities (WRAVMA) at 3 years of age.
-- >2 servings/wk resulting in exposures to methylmercury above the 90th percentile was associated with lower scores, but still higher than (a) <2 servings/wk; and (b) eating no fish during pregnancy. – <2 servings/wk resulting in exposures to methylmercury below 90th percentile was weakly associated with improvement over eating no fish (but the improvement was not as large as the difference between >2 servings/wk and eating no fish). -- <2 servings/wk resulting in exposures to methylmercury above 90th percentile) was associated with a decline below eating no fish. -- Each 100 mg of maternal daily DHA & EPA from fish was associated with increases on both the PPVT & the WRAVMA.
adverse when methylmercury is high relative to beneficial fish nutrients. -- > 2 servings/wk can be beneficial. -- >2 servings per week resulting in low methylmercury exposure can be the most beneficial. -- Omega-3 fatty acids contribute to the beneficial effect. -- Assuming the beneficial effect has a plateau per the evidence from Seychelles Islands and the U.K., that plateau is above 2 servings/wk.

53
Studies in the United States or Countries with Exposures to Methylmercury Largely Within the Range of U.S. Exposures
Location
Exposure Levels in the Study Pop
Association(s) Examined
Findings
Provides at Least Some
Evidence That: (germane to net effects)
U.S. (Lederman et al., 2008) Study pop.: 329
Methylmercury: Maternal and cord blood total mercury. Average cord mercury was 7.82 µg/L; average maternal mercury was 2.32 µg/L. Fish: Amounts were not measured. For purposes of this study, mothers either ate fish during pregnancy or they did not.
Between (a) mercury; and (b) fish consumption, i.e., either eating fish or not eating fish, during pregnancy and Results on Bayley Scales of Infant Development II at 12, 24, and 36 months of age and the Wechsler Preschool and Primary Scale of Intelligence at 48 months of age.
Methylmercury was associated with lower scores but eating fish during pregnancy was associated with higher scores than eating no fish.
At U.S. levels of fish consumption and methylmercury exposures in this study, net effects from fish include both benefits from nutrients and deficits from methylmercury.
Denmark (Oken et al., 2008a) Study pop.: 25,446 mother-infant pairs.
Fish: Maternal consumption averaged 0.94 oz/wk, with a range of 0 – 17.5 oz/wk. Most commonly consumed species had median Hg that ranged from 0.034 to 0.049 ppm.
Between fish consumption during pregnancy and various developmental milestones at 6 & 18 months of age.
Each additional serving of fish per week during pregnancy was associated with improved attainment of developmental milestones in offspring. -- Fish consumption >12 oz/wk was associated with best milestone attainment.
-- So long as methylmercury is low relative to beneficial nutrients, net effects from fish consumption > 12 oz/wk are likely to be beneficial. -- A plateau in beneficial effects can be above 12 ounces/wk.

54
Studies in the United States or Countries with Exposures to Methylmercury Largely Within the Range of U.S. Exposures
Location
Exposure Levels in the Study Pop
Association(s) Examined
Findings
Provides at Least Some
Evidence That: (germane to net effects)
U.S. (Sagiv et al., 2012) Study pop.: 607 mother-child pairs
Methylmercury: Average mercury in maternal hair of 0.62 ppm. Fish: Median of 2.3 servings per week during pregnancy.
Between (a) mercury; and (b) fish consumption during pregnancy and Tests of attention-deficit hyperactivity disorder (ADHD)-related behavior at 8 years of age. Tests: Connors Rating Scale-Teachers; Neurobehavioral Evaluation System 2 Continuous Performance Test; Wechsler Intelligence Scale for Children III.
--Mercury was associated with inattention and impulsivity/hyperactivity. --Evidence of a mercury threshold of effect below 1 ppm maternal hair mercury. --Fish consumption >2 servings/week was associated with protection against some ADHD-related behaviors.
At U.S. levels of fish consumption and methylmercury exposures in this study, net effects from fish include both benefits from nutrients and deficits from methylmercury.
*Evidence from a single observational study does not generally constitute proof. Moreover, evidence varies in quality from one study to another. Consequently, the evidence should be considered from a cumulative perspective.

55
(b) Children’s Postnatal Exposure (b)(1) Research on Associations between Children’s Fish Consumption and/or Exposure to Methylmercury and Neurodevelopmental Effects Whether children experience neurodevelopmental effects due to their own consumption of fish is an important question because their nervous systems are still developing. They might be especially sensitive to methylmercury or to beneficial nutrients in fish, or to both. So far, the majority of studies that have examined this question have focused on whether the children in those studies have been adversely affected by methylmercury. Four studies have looked for associations between children’s postnatal exposure to methylmercury and their results on tests of neurodevelopment. One study has looked for an association between children’s fish consumption and test scores. The four methylmercury studies were in the Faroe and Seychelles Islands, Spain, and the United States. The study that focused on fish consumption was in the United Kingdom. The study in Spain found an adverse association between children’s exposure to methylmercury and test scores but the other three did not. That study involved 72 children at age four (Freire et al., 2010). Mean exposure was 1.81 ppm of mercury in hair, which is about three times higher than hair levels of U.S. children 1-5 years of age at the 95th percentile of exposure in the NHANES study (McDowell et al., 2004). Exposure to methylmercury was associated with decrements in general cognitive, memory, and verbal test scores. The decrements were found after adjustment for fish consumption, which could be interpreted to mean that they represented effects from the methylmercury in the fish eaten by the children independent of any benefits from the nutrients in the fish. The other three studies found that scores improved somewhat as exposure to methylmercury increased. These improvements may have been due to increased fish consumption that was the source of the increased methylmercury exposure. In an early phase of their study, the Faroe Islands researchers looked for an association between postnatal mercury exposure and delays in the developmental milestones of first sitting, creeping and standing (Grandjean et al., 1995). Infants who achieved these milestones the earliest had the highest hair mercury levels at 12 months age of all those in the study population. The researchers noted that these children had also experienced the longest breastfeeding and they hypothesized that the contents of mother’s milk, including n-3 long-chain fatty acids, might have been responsible for their early development. The Faroe Islands study also addressed postnatal exposure at 14 years of age and reported that “Postnatal methylmercury exposure had no discernible effect” and that this outcome, among others, was similar to those obtained when the children were seven years old. They also indicated that they saw improvements, i.e., “many coefficients suggesting effects in the direction opposite to expectation” (Debes et al., 2006).
56
The Seychelles Islands study produced similar results at 66 months of age. Children with the highest mean mercury hair level, 14.9 ppm, scored slightly better on four of six neurological development scores than the group with the lowest mean of 2.2 ppm (Davidson et al., 1998). The study in the United States examined 780 children at ages two, five, and seven with exposures to methylmercury characterized by the authors as “low but typical” for the United States (Cao et al., 2010). As exposure to methylmercury increased, IQ tended to increase and behavioral problems tended to decrease. These results obviously were not caused by methylmercury but could have represented net effects from fish. The United Kingdom study that focused on fish (Daniels et al., 2004) found an association between increases in children’s fish consumption at 15 and 18 months of age and small but statistically significant improvements in scores on neurodevelopmental tests within a study population of slightly over 7,400. (b)(2) Maternal Fish Consumption during Lactation A related question about postnatal exposure is whether neurodevelopment can be affected by the contents of mother’s milk as a result of maternal consumption of fish.18 If so, then under what circumstances would an effect be adverse or beneficial and what would be the magnitude of such an effect? We are not aware of research that has attempted to address these questions directly. Indirectly, breastfeeding in the Faroe Island study was associated with early attainment of developmental milestones, i.e., sitting, creeping, and standing, even though those who reached these milestones early had higher hair-mercury levels than those who did not. This result suggested “that, if methylmercury exposure from human milk had any adverse effect on milestone development in these infants, the effect was compensated for or overruled by advantages associated with nursing” (Grandjean et al., (1995). Similarly, duration of breastfeeding was associated with better attainment of developmental milestones in a study in Denmark (Oken et al., 2008a). One way of considering whether methylmercury in mother’s milk could affect neurodevelopment is to examine whether an infant’s postnatal exposure through lactation is of a similar magnitude as that which occurs prenatally. The transport of methylmercury from maternal blood into human milk is less efficient than the transport across the blood–brain and blood–placenta barriers and results in low concentrations in maternal milk. Consequently, if a mother continues to eat the same types and amounts of fish during lactation as she did while pregnant, the infant’s exposure to methylmercury can be expected to be less than what occurs in utero (Björnberg et al., 2005; Dorea 2004; FAO/WHO JECFA, 2007).
18 The 2004 FDA/EPA consumption advice relating to methylmercury recommends that nursing mothers eat up to 12 ounces per week of fish, defined as two average servings (FDA/EPA 2004), that they not exceed 12 ounces per week, in order to limit their children’s exposure to methylmercury from mother’s milk.

57
SECTION IV:OVERVIEW OF THE EXPOSURE MODELING AND THE MODELING FOR IQ
This section provides an overview of the logic and design of the quantitative assessment of net effects. (a) Conceptual Framework As described in Section III, a substantial body of research has examined the effects of both fish consumption and methylmercury exposure on fetal neurodevelopment during pregnancy. That research provides the scientific underpinning for this assessment, including the basis for the factual questions the assessment was designed to address. We divide these questions into primary and secondary questions of fact, as follows. (a)(1) Primary Questions of Fact that the Assessment Was Designed to Address
(1) Is eating commercial fish during pregnancy affecting fetal neurodevelopment (as represented by selected indicators of it) in the United States? If so, to what extent is fetal neurodevelopment being affected adversely and/or beneficially?
(2) How big are the effects? How big are: (a) methylmercury’s adverse effects; (b) fish nutrients’ beneficial effects; and (c) the net effects that a combination of (a) and (b)?
(3) What amounts and types of commercial fish are likely to cause net effects that are adverse? What amounts and types of commercial fish are likely to cause net effects that are beneficial? As a practical matter, a net adverse effect is a score or result on a test of neurodevelopment that is lower than it would have been if the mother had eaten no fish during pregnancy. A net beneficial effect is a score or result on a test of neurodevelopment that is higher than it would have been if the mother had eaten no fish during pregnancy.
(4) What are the uncertainties associated with these estimates, i.e., what is the range of reasonably possible effects in addition to the most likely effects estimated by the assessment? (These ranges are presented as confidence intervals surrounding the central estimates.)
For the first and third questions, the model estimates the percentages of U.S. children who experience adverse and beneficial net effects from their mothers’ consumption of commercial fish during pregnancy, as well as the sizes of those effects. The estimates range from effects being experienced by one-tenth of one percent of all children through effects being experienced by 99.9 percent of all children. In this population-level modeling, the estimate for each percentile of children is presented as the largest possible
58
effect that could occur through that percentile. As a consequence, the largest estimated effects occur at the 99.9th population percentile because 99.9 percent of the population is experiencing effects up to and including the largest effects.
The results start at one-tenth of one percent of the population in order to pick up small percentages that might be experiencing net adverse effects. The results stop at the 99.9th percentile because little is known beyond that percentile about amounts and types of fish consumed or to exposures to methylmercury. It is possible to fill this small but potentially important gap in the assessment to an extent with results from the species-by-species modeling. That modeling estimates how much of each commercial species must be consumed each week in order to achieve certain outcomes, both beneficial and adverse. The highest amounts of fish consumed in these estimates often exceed those associated with the 99.9th percentile. Consequently, it is possible to draw reasonable inferences about effects for those who are in the highest one-tenth of one percent of exposures.
The species-by-species modeling also addresses the third question about amounts and types of commercial fish that are likely to produce adverse or beneficial net effects. Although this modeling does not address how mixes of fish can produce particular effects, it can be assumed that an effect from the fish with the highest average methylmercury concentration in a particular mix of fish represents the worst case possibility from eating the entire mix.
(a)(2) Secondary Questions of Fact that the Assessment Was Designed to Address
In order to address the primary questions, the assessment addressed the following secondary questions:
1. Do the beneficial contributions to the net effects from nutrients in the fish reach a plateau at some amount of fish consumption, and if so, at what level? As described in Section III, research studies provide evidence of a plateau.
2. To what extent are net beneficial effects less beneficial than they otherwise would be as a consequence of adverse contributions from methylmercury? Conversely, to what extent are net adverse effects less adverse than they otherwise would be as a consequence of beneficial contributions from one or more nutrients in the fish?
3. What are the net effects above and below 12 ounces of fish per week? (Recall that 12 ounces of fish is the recommended weekly maximum in 2004 FDA/EPA consumption advice for pregnant women and it is the high end of the range of 8-12 ounces per week recommended for pregnant women by the Dietary Guidelines for Americans 2010 (DGA 2010).) Are there circumstances in which eating more than 12 ounces per week during pregnancy is likely to be more beneficial than eating less than 12 ounces per week? Are there circumstances in which eating more than 12 ounces per week during pregnancy is likely to be adverse relative to eating no fish, while eating less than 12 ounces per week of the same fish would not be adverse?
59
(b) Conceptual Model (b)(1) Conceptual Model: Exposure In order to estimate neurodevelopmental effects in the United States from eating commercial fish during pregnancy, it was first necessary to estimate exposure, i.e., how much of each commercial species people are eating and how much methylmercury is in them. Because the exact combination of nutrients in fish responsible for beneficial effects is not fully understood, in much of our modeling we treated all commercial fish as being alike in terms of benefits conferred. An exception to this approach was in species-by-species modeling that estimates what the net effects would be if omega-3 fatty acids were the sole source of the beneficial effect. For that modeling, the various amounts of omega-3 fatty acids in fish were significant factors. The major steps in the exposure modeling were:
• Estimating the amounts of fish that people eat: Amounts of fish eaten over time
depend on the frequencies with which people eat fish and the serving sizes, i.e., the amounts that people eat per meal (measured in terms of cooked fish).
• Estimating the species of fish that people eat: Different species of fish contain
different average concentrations of methylmercury and omega-3 fatty acids.
• Estimating how much methylmercury and omega-3 fatty acids would likely be in each of these fish: In addition to differences among species, fish of the same species can differ in their methylmercury concentrations. The exposure modeling takes both intra and interspecies differences in methylmercury concentrations into account. For omega-3 fatty acids, the modeling only takes interspecies differences into account since the data available to us did not include intraspecies differences.
• Estimating dietary intake of methylmercury: This calculation is based on the
previous three estimates.
• Estimating body burdens of methylmercury: Over time, levels of methylmercury in the body are largely a result of dietary intake minus excretion. As stated previously, the average half life in the human body has been measured at about 50 days with a range of 42-70 days (Sherlock et al., 1984). We estimate body burdens in terms of parts per million of mercury in hair. Many studies looking for associations between body burdens of methylmercury and adverse effects have measured hair levels as the biomarker for body burden, although blood levels and other biomarkers have also been used. Hair is regarded as being a more reliable indicator of long term exposure than is blood. Blood is regarded as a good
60
measure of current short-term exposure, although it can also represent long-term exposure when that exposure is steady. (See Appendix C for technical details and references.)
(b)(2) Conceptual Model: Dose-Response To assess net effects on fetal neurodevelopment from eating commercial fish, we first developed dose-response relationships for:
• Adverse effects from methylmercury independent of beneficial effects from nutrients in fish; and
• Beneficial effects from fish, presumably from one or more nutrients in the fish,
independent of adverse effects from methylmercury. We then combined these two dose-response relationships by adding them together in order to estimate dose-response relationships for the net effects. When added together, a net effect will be adverse or beneficial depending on whether the methylmercury effect or the beneficial nutrient effect is stronger in a given situation. This approach is based on an assumption that the adverse and beneficial effects are independent of one another and do not interact. We are not aware of data in humans that support interactive effects or the need for a more complex model, although the possibility has been raised with regard to selenium (Ralston & Raymond, 2010). Because the two effects are added together in our model, the assessment estimates that methylmercury reduces the size of any net beneficial effect and that beneficial nutrients reduce the size of any net adverse effect. We developed adverse and beneficial dose-response relationships for IQ through nine years of age. The adverse and beneficial dose-response relationships that were developed for the 2009 draft of this assessment for early age verbal development have been retained for purposes of comparison (see Appendix A). Together, they produce a range into which net effects appear to fall. We were not necessarily looking for worst case or best case effects to model because such effects tend to be outliers supported by limited data. The dose-response functions for the net effects were combined with results from the U.S. exposure assessment to estimate the net effects that are likely occurring in the United States on a population basis, i.e., that are likely occurring through various percentages of the population. We also used the dose-response functions to estimate the net effects on a single individual depending on how much of particular types of fish the individual’s mother ate during pregnancy. This species-by-species modeling did not require combining the dose-response function with results from the exposure assessment, however. Figure IV-1 provides a simple overall description of the conceptual model. The remainder of this section provides an overview of the modeling approach, beginning with exposure. Appendix C contains additional details.
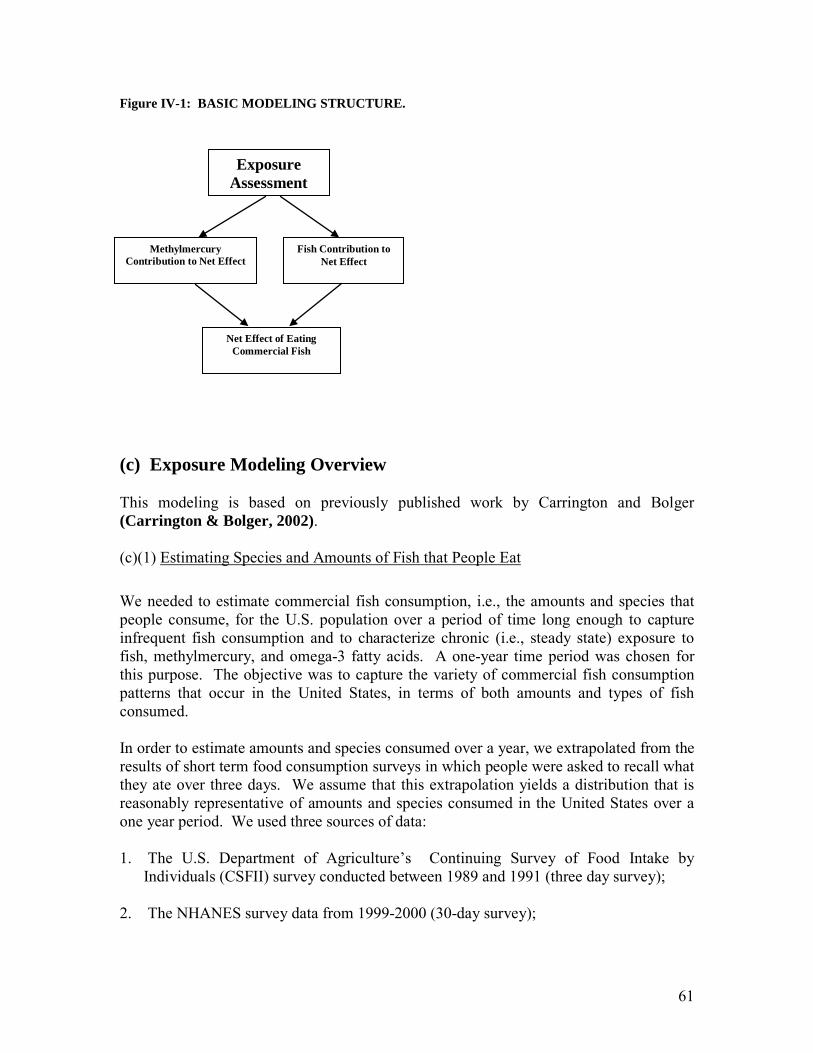
61
Figure IV-1: BASIC MODELING STRUCTURE. (c) Exposure Modeling Overview This modeling is based on previously published work by Carrington and Bolger (Carrington & Bolger, 2002). (c)(1) Estimating Species and Amounts of Fish that People Eat We needed to estimate commercial fish consumption, i.e., the amounts and species that people consume, for the U.S. population over a period of time long enough to capture infrequent fish consumption and to characterize chronic (i.e., steady state) exposure to fish, methylmercury, and omega-3 fatty acids. A one-year time period was chosen for this purpose. The objective was to capture the variety of commercial fish consumption patterns that occur in the United States, in terms of both amounts and types of fish consumed. In order to estimate amounts and species consumed over a year, we extrapolated from the results of short term food consumption surveys in which people were asked to recall what they ate over three days. We assume that this extrapolation yields a distribution that is reasonably representative of amounts and species consumed in the United States over a one year period. We used three sources of data: 1. The U.S. Department of Agriculture’s Continuing Survey of Food Intake by
Individuals (CSFII) survey conducted between 1989 and 1991 (three day survey);
2. The NHANES survey data from 1999-2000 (30-day survey);
Exposure Assessment
Methylmercury Contribution to Net Effect
Fish Contribution to Net Effect
Net Effect of Eating Commercial Fish

62
3. National Marine Fisheries Service market share data on consumable commercial fish (2007).
The three-day survey was the U. S. Department of Agriculture Continuing Survey of Food Intake by Individuals (CSFII) (USDA 1993). It surveyed both men and women and obtained information about portion sizes that they ate. We assume that the portion sizes represent cooked fish. (Accounting for water loss during cooking is described in section Appendix C, section (a)(1)). These data were statistically representative of the U.S. population. The 30-day survey was a fish and shellfish consumption frequency questionnaire that had been administered as part of the NHANES survey during 1999-2000. It captured information about frequency and various types of fish, e.g., clams, tuna, swordfish, and salmon. However, this survey only involved women of childbearing age and children up to 11 years of age and did not obtain information about serving size. These omissions made it impossible for us to rely solely on the 30-day survey for our exposure assessment. Since the three-day survey provided information lacking in the 30-day survey, and vice versa, we used the two surveys together. We used data from the National Marine Fisheries Service of the U.S. Department of Commerce (NMFS 2008) on “edible (for human use) meat weight” for individual commercial fish species that are imported into, or landed in, the United States to develop a rank order of popularity for commercial fish. We used these data to help estimate the types of fish consumed over a year. These data were used to supplement the short term survey data for characterization of long-term variation in species consumed over an entire year. NMFS market share data were also used to adjust portion sizes to reflect current levels of consumption. Since the NMFS data are more recent than the survey data, they more accurately reflect current national patterns of fish consumption. (c)(2) Estimating Variations in the Species that People Eat In order to estimate the species of fish that people eat, we developed and implemented the following process: • Using the 30-day survey: For each individual in the survey who ate at least four fish
meals during the survey period, we developed a “repetition ratio” to reflect the extent to which the individual ate the same fish or ate a variety of fish. The mathematics of the “repetition ratio” are provided in Appendix C.
• Using the three-day survey and the NMFS market share data: The individuals in the
three-day survey reported eating fish from zero to four times during the survey period. For each of the 3,525 individuals in the survey who ate at least one fish meal during the survey period, we randomly selected one of the “repetition ratios” developed from the 30-day survey. The repetition ratio was used to determine the extent to which the types of fish reported for that person in the three-day survey were considered to be representative of the only types of fish eaten by that person over a
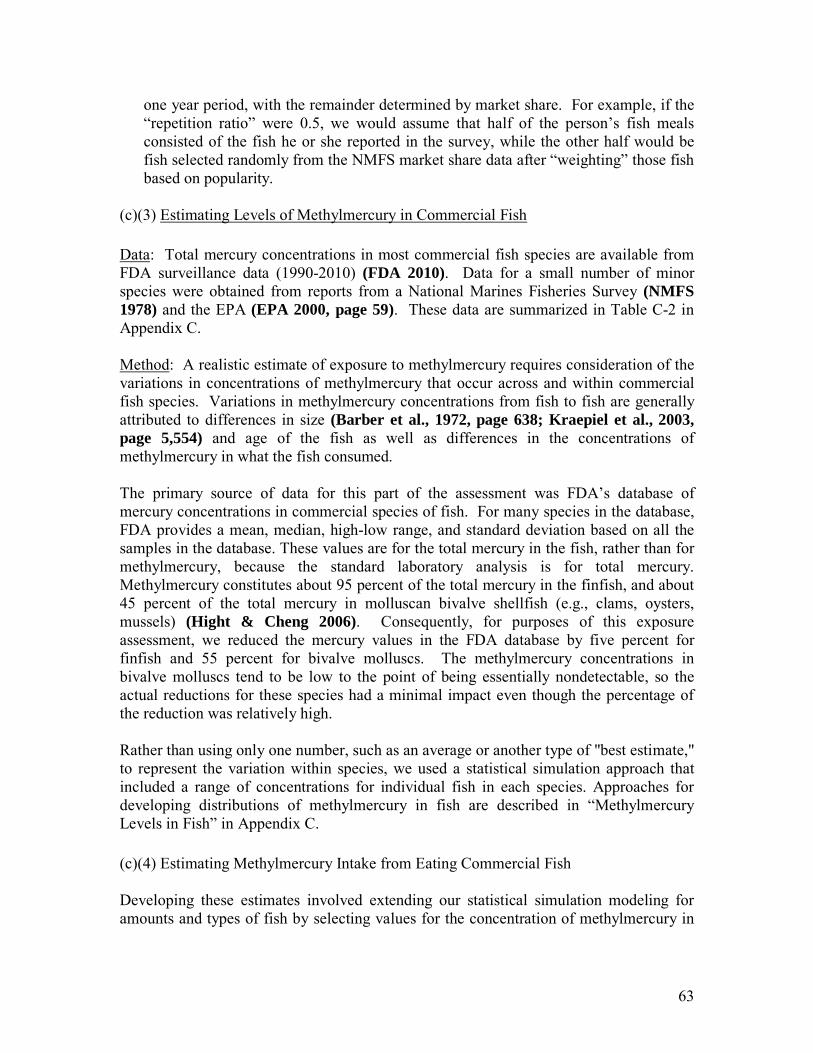
63
one year period, with the remainder determined by market share. For example, if the “repetition ratio” were 0.5, we would assume that half of the person’s fish meals consisted of the fish he or she reported in the survey, while the other half would be fish selected randomly from the NMFS market share data after “weighting” those fish based on popularity.
(c)(3) Estimating Levels of Methylmercury in Commercial Fish Data: Total mercury concentrations in most commercial fish species are available from FDA surveillance data (1990-2010) (FDA 2010). Data for a small number of minor species were obtained from reports from a National Marines Fisheries Survey (NMFS 1978) and the EPA (EPA 2000, page 59). These data are summarized in Table C-2 in Appendix C. Method: A realistic estimate of exposure to methylmercury requires consideration of the variations in concentrations of methylmercury that occur across and within commercial fish species. Variations in methylmercury concentrations from fish to fish are generally attributed to differences in size (Barber et al., 1972, page 638; Kraepiel et al., 2003, page 5,554) and age of the fish as well as differences in the concentrations of methylmercury in what the fish consumed. The primary source of data for this part of the assessment was FDA’s database of mercury concentrations in commercial species of fish. For many species in the database, FDA provides a mean, median, high-low range, and standard deviation based on all the samples in the database. These values are for the total mercury in the fish, rather than for methylmercury, because the standard laboratory analysis is for total mercury. Methylmercury constitutes about 95 percent of the total mercury in the finfish, and about 45 percent of the total mercury in molluscan bivalve shellfish (e.g., clams, oysters, mussels) (Hight & Cheng 2006). Consequently, for purposes of this exposure assessment, we reduced the mercury values in the FDA database by five percent for finfish and 55 percent for bivalve molluscs. The methylmercury concentrations in bivalve molluscs tend to be low to the point of being essentially nondetectable, so the actual reductions for these species had a minimal impact even though the percentage of the reduction was relatively high. Rather than using only one number, such as an average or another type of "best estimate," to represent the variation within species, we used a statistical simulation approach that included a range of concentrations for individual fish in each species. Approaches for developing distributions of methylmercury in fish are described in “Methylmercury Levels in Fish” in Appendix C. (c)(4) Estimating Methylmercury Intake from Eating Commercial Fish Developing these estimates involved extending our statistical simulation modeling for amounts and types of fish by selecting values for the concentration of methylmercury in
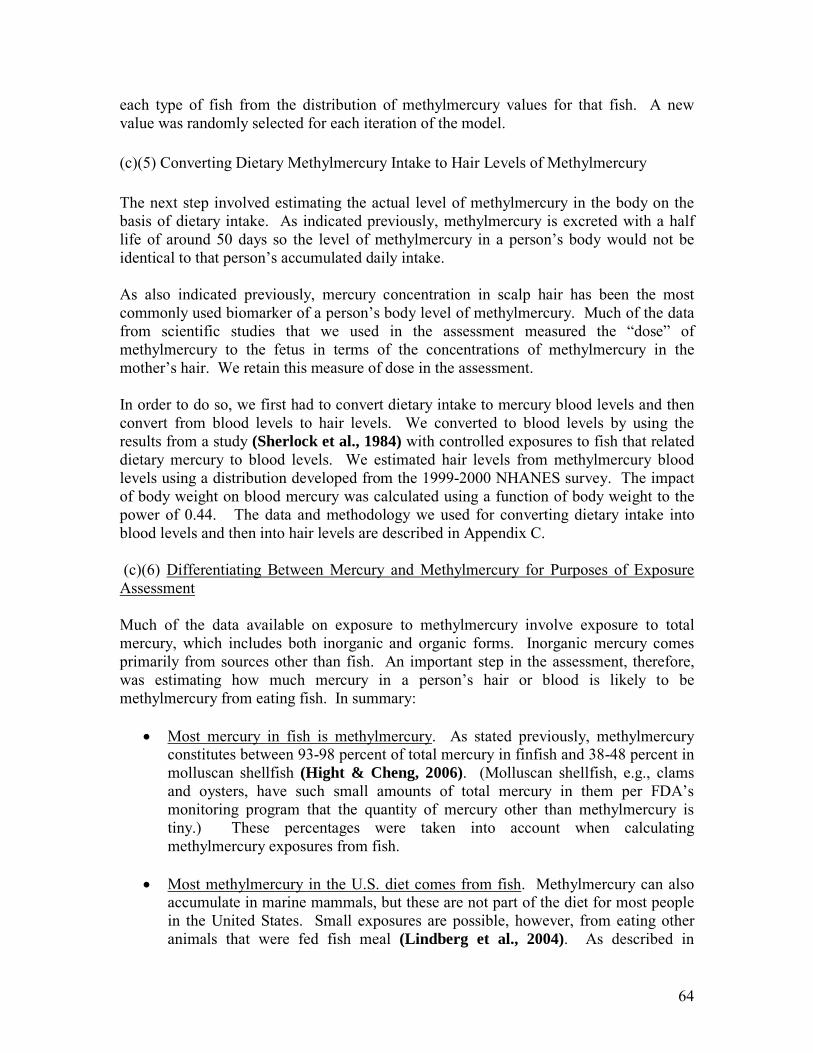
64
each type of fish from the distribution of methylmercury values for that fish. A new value was randomly selected for each iteration of the model. (c)(5) Converting Dietary Methylmercury Intake to Hair Levels of Methylmercury The next step involved estimating the actual level of methylmercury in the body on the basis of dietary intake. As indicated previously, methylmercury is excreted with a half life of around 50 days so the level of methylmercury in a person’s body would not be identical to that person’s accumulated daily intake. As also indicated previously, mercury concentration in scalp hair has been the most commonly used biomarker of a person’s body level of methylmercury. Much of the data from scientific studies that we used in the assessment measured the “dose” of methylmercury to the fetus in terms of the concentrations of methylmercury in the mother’s hair. We retain this measure of dose in the assessment. In order to do so, we first had to convert dietary intake to mercury blood levels and then convert from blood levels to hair levels. We converted to blood levels by using the results from a study (Sherlock et al., 1984) with controlled exposures to fish that related dietary mercury to blood levels. We estimated hair levels from methylmercury blood levels using a distribution developed from the 1999-2000 NHANES survey. The impact of body weight on blood mercury was calculated using a function of body weight to the power of 0.44. The data and methodology we used for converting dietary intake into blood levels and then into hair levels are described in Appendix C. (c)(6) Differentiating Between Mercury and Methylmercury for Purposes of Exposure Assessment Much of the data available on exposure to methylmercury involve exposure to total mercury, which includes both inorganic and organic forms. Inorganic mercury comes primarily from sources other than fish. An important step in the assessment, therefore, was estimating how much mercury in a person’s hair or blood is likely to be methylmercury from eating fish. In summary:
• Most mercury in fish is methylmercury. As stated previously, methylmercury constitutes between 93-98 percent of total mercury in finfish and 38-48 percent in molluscan shellfish (Hight & Cheng, 2006). (Molluscan shellfish, e.g., clams and oysters, have such small amounts of total mercury in them per FDA’s monitoring program that the quantity of mercury other than methylmercury is tiny.) These percentages were taken into account when calculating methylmercury exposures from fish.
• Most methylmercury in the U.S. diet comes from fish. Methylmercury can also
accumulate in marine mammals, but these are not part of the diet for most people in the United States. Small exposures are possible, however, from eating other animals that were fed fish meal (Lindberg et al., 2004). As described in

65
Appendix C, we estimate that about 0.1 ppb of methylmercury in the blood is from sources other than fish. This amount was taken into account in the exposure assessment.
• People have mercury in their bodies other than methylmercury. Other forms of
mercury were not included in the exposure assessment because our focus was on methylmercury in fish. To exclude inorganic mercury, we used data from the CDC NHANES survey that showed both the total mercury and the inorganic mercury in each person surveyed. The amount of methylmercury (i.e., organic mercury) in an individual can be calculated by subtracting the inorganic mercury from the total mercury. This calculation also describes a ratio between total mercury and methylmercury.
• People have mercury in their bodies even though they eat no fish. In NHANES
there are respondents who reported eating no fish but whose hair or blood showed the presence of mercury. We assumed that phenomenon results from other exposures and we accounted for it by including a statistical distribution for other contributions in blood levels.
(c)(7) Exposure Modeling Flow Diagram and Associated Table The flow diagram in Figure IV-2 and the accompanying Table IV-1 provide an overview of the exposure modeling and the key input parameters. Table IV-1 presents a summary of scientific questions, data and related assumptions associated with the scientific questions, and implications for the modeling results caused by the uncertainties in the data and assumptions. The assumptions primarily address how the available data were used and adjusted to provide a national picture of exposure for both commercial fish consumption and methylmercury.

66
Figure IV-2: FLOW DIAGRAM FOR THE EXPOSURE MODELING. The numbers at various steps in flow correspond to numbers in Table IV-1, located immediately behind this flow diagram.
Annual Intake Simulation
3-Day Frequency (CSFII)
3-Day % Eaters (CSFII) Annual
Frequency
Annual % Eaters
Survey Species (CSFII)
Market Share Species (NMFS)
Species Repetition (30 Day NHANES)
Species Consumed
Serving Size (CSFII)
Corrected Serving Size
Portion Size Adjustment (NMFS 2008)
Species Hg (FDA, NMFS)
Species MeHg
Speciation Factor
MeHg Intake
Fish Intake
Daily MeHg Intake Over One Year
Daily Fish Intake Over One Year
1
Long Term Correction (30 Day NHANES)
2 3
4
5
6
7
1
1
1
PUFA Intake
Species PUFA (USDA)
Daily PUFA Intake Over One Year
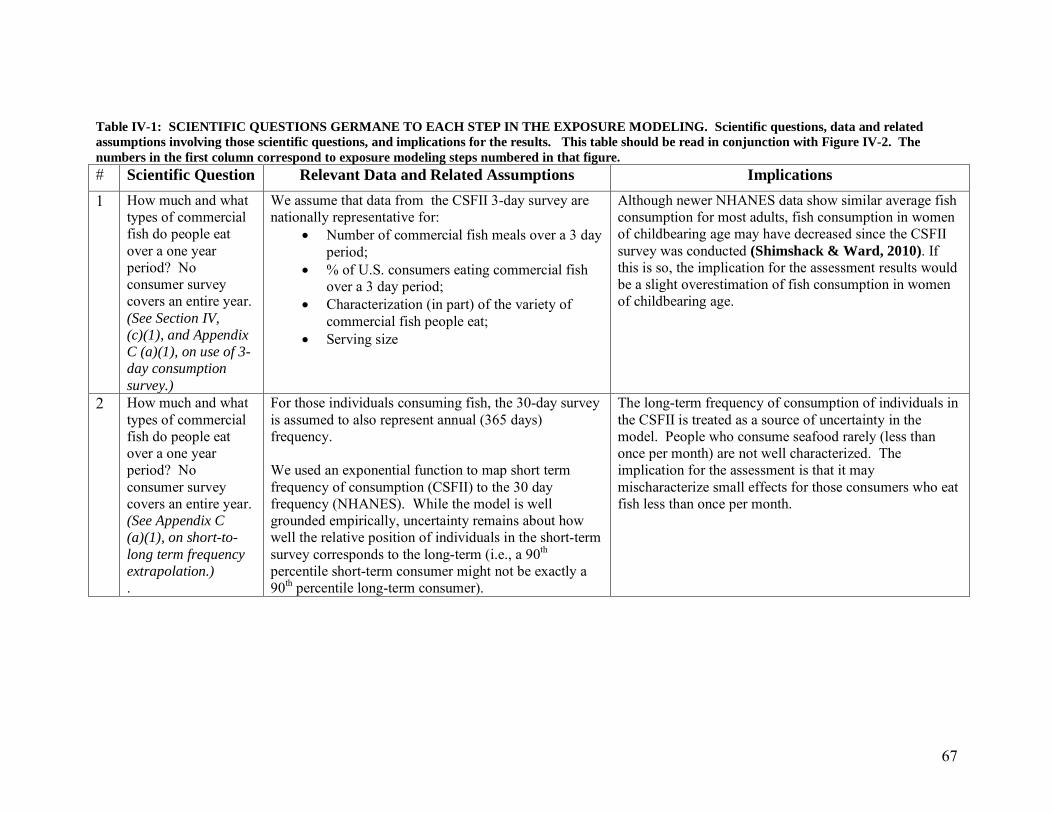
67
Table IV-1: SCIENTIFIC QUESTIONS GERMANE TO EACH STEP IN THE EXPOSURE MODELING. Scientific questions, data and related assumptions involving those scientific questions, and implications for the results. This table should be read in conjunction with Figure IV-2. The numbers in the first column correspond to exposure modeling steps numbered in that figure. # Scientific Question Relevant Data and Related Assumptions Implications 1 How much and what
types of commercial fish do people eat over a one year period? No consumer survey covers an entire year. (See Section IV, (c)(1), and Appendix C (a)(1), on use of 3-day consumption survey.)
We assume that data from the CSFII 3-day survey are nationally representative for:
• Number of commercial fish meals over a 3 day period;
• % of U.S. consumers eating commercial fish over a 3 day period;
• Characterization (in part) of the variety of commercial fish people eat;
• Serving size
Although newer NHANES data show similar average fish consumption for most adults, fish consumption in women of childbearing age may have decreased since the CSFII survey was conducted (Shimshack & Ward, 2010). If this is so, the implication for the assessment results would be a slight overestimation of fish consumption in women of childbearing age.
2 How much and what types of commercial fish do people eat over a one year period? No consumer survey covers an entire year. (See Appendix C (a)(1), on short-to-long term frequency extrapolation.) .
For those individuals consuming fish, the 30-day survey is assumed to also represent annual (365 days) frequency.
We used an exponential function to map short term frequency of consumption (CSFII) to the 30 day frequency (NHANES). While the model is well grounded empirically, uncertainty remains about how well the relative position of individuals in the short-term survey corresponds to the long-term (i.e., a 90th percentile short-term consumer might not be exactly a 90th percentile long-term consumer).
The long-term frequency of consumption of individuals in the CSFII is treated as a source of uncertainty in the model. People who consume seafood rarely (less than once per month) are not well characterized. The implication for the assessment is that it may mischaracterize small effects for those consumers who eat fish less than once per month.
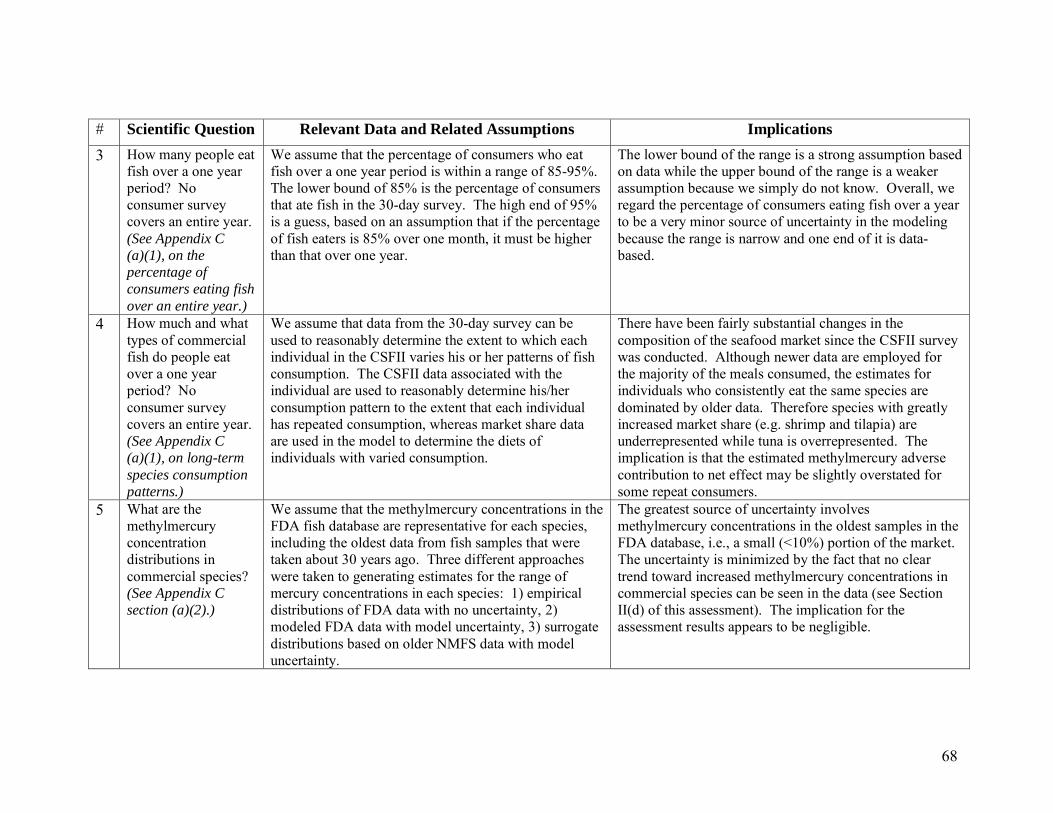
68
# Scientific Question Relevant Data and Related Assumptions Implications 3 How many people eat
fish over a one year period? No consumer survey covers an entire year. (See Appendix C (a)(1), on the percentage of consumers eating fish over an entire year.)
We assume that the percentage of consumers who eat fish over a one year period is within a range of 85-95%. The lower bound of 85% is the percentage of consumers that ate fish in the 30-day survey. The high end of 95% is a guess, based on an assumption that if the percentage of fish eaters is 85% over one month, it must be higher than that over one year.
The lower bound of the range is a strong assumption based on data while the upper bound of the range is a weaker assumption because we simply do not know. Overall, we regard the percentage of consumers eating fish over a year to be a very minor source of uncertainty in the modeling because the range is narrow and one end of it is data-based.
4 How much and what types of commercial fish do people eat over a one year period? No consumer survey covers an entire year. (See Appendix C (a)(1), on long-term species consumption patterns.)
We assume that data from the 30-day survey can be used to reasonably determine the extent to which each individual in the CSFII varies his or her patterns of fish consumption. The CSFII data associated with the individual are used to reasonably determine his/her consumption pattern to the extent that each individual has repeated consumption, whereas market share data are used in the model to determine the diets of individuals with varied consumption.
There have been fairly substantial changes in the composition of the seafood market since the CSFII survey was conducted. Although newer data are employed for the majority of the meals consumed, the estimates for individuals who consistently eat the same species are dominated by older data. Therefore species with greatly increased market share (e.g. shrimp and tilapia) are underrepresented while tuna is overrepresented. The implication is that the estimated methylmercury adverse contribution to net effect may be slightly overstated for some repeat consumers.
5 What are the methylmercury concentration distributions in commercial species? (See Appendix C section (a)(2).)
We assume that the methylmercury concentrations in the FDA fish database are representative for each species, including the oldest data from fish samples that were taken about 30 years ago. Three different approaches were taken to generating estimates for the range of mercury concentrations in each species: 1) empirical distributions of FDA data with no uncertainty, 2) modeled FDA data with model uncertainty, 3) surrogate distributions based on older NMFS data with model uncertainty.
The greatest source of uncertainty involves methylmercury concentrations in the oldest samples in the FDA database, i.e., a small (<10%) portion of the market. The uncertainty is minimized by the fact that no clear trend toward increased methylmercury concentrations in commercial species can be seen in the data (see Section II(d) of this assessment). The implication for the assessment results appears to be negligible.
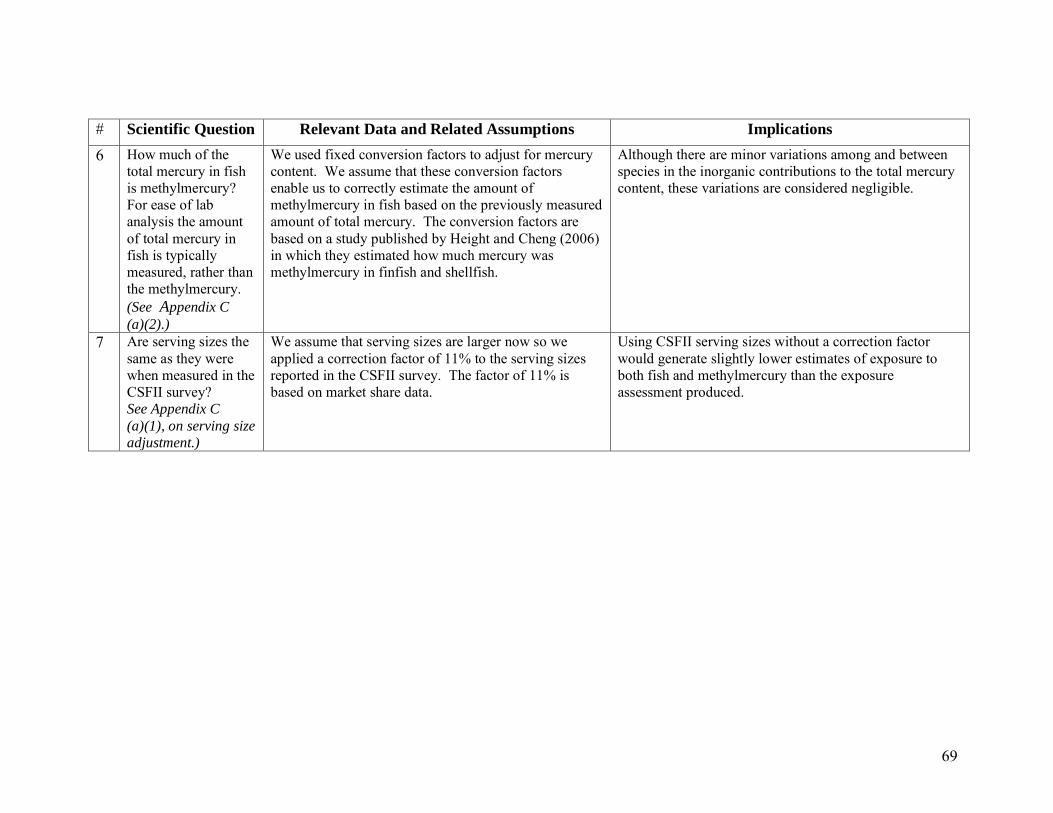
69
# Scientific Question Relevant Data and Related Assumptions Implications 6 How much of the
total mercury in fish is methylmercury? For ease of lab analysis the amount of total mercury in fish is typically measured, rather than the methylmercury. (See Appendix C (a)(2).)
We used fixed conversion factors to adjust for mercury content. We assume that these conversion factors enable us to correctly estimate the amount of methylmercury in fish based on the previously measured amount of total mercury. The conversion factors are based on a study published by Height and Cheng (2006) in which they estimated how much mercury was methylmercury in finfish and shellfish.
Although there are minor variations among and between species in the inorganic contributions to the total mercury content, these variations are considered negligible.
7 Are serving sizes the same as they were when measured in the CSFII survey? See Appendix C (a)(1), on serving size adjustment.)
We assume that serving sizes are larger now so we applied a correction factor of 11% to the serving sizes reported in the CSFII survey. The factor of 11% is based on market share data.
Using CSFII serving sizes without a correction factor would generate slightly lower estimates of exposure to both fish and methylmercury than the exposure assessment produced.
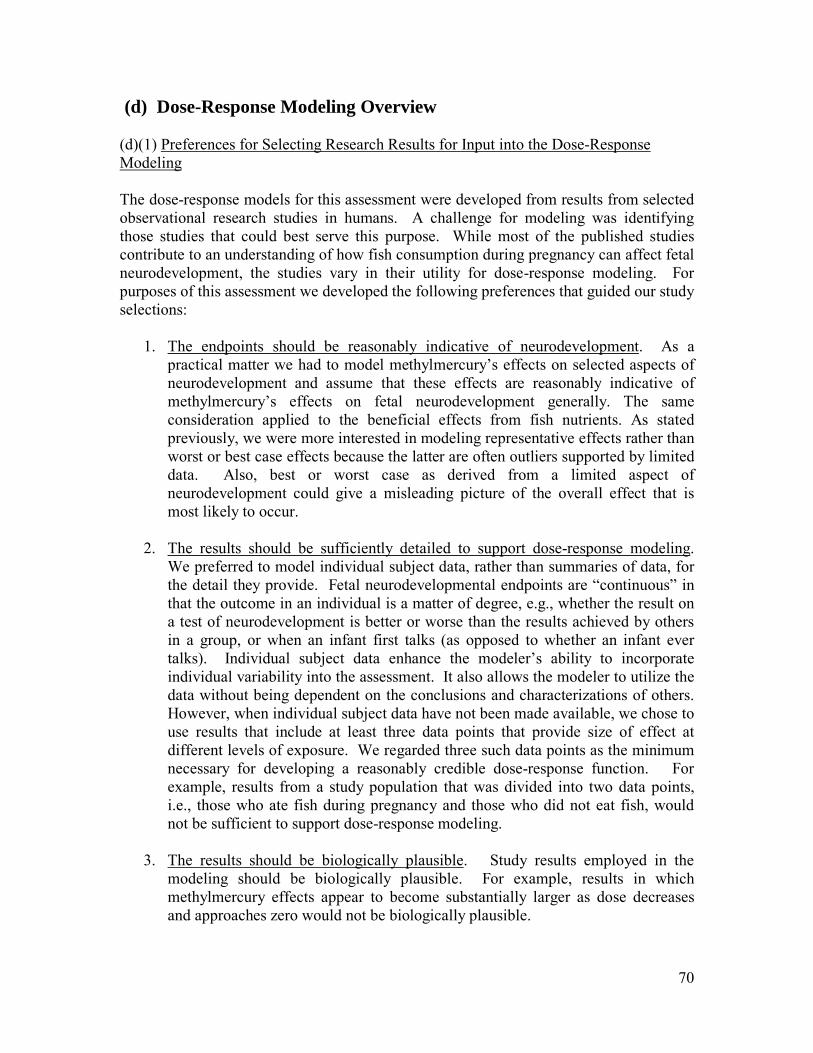
70
(d) Dose-Response Modeling Overview (d)(1) Preferences for Selecting Research Results for Input into the Dose-Response Modeling The dose-response models for this assessment were developed from results from selected observational research studies in humans. A challenge for modeling was identifying those studies that could best serve this purpose. While most of the published studies contribute to an understanding of how fish consumption during pregnancy can affect fetal neurodevelopment, the studies vary in their utility for dose-response modeling. For purposes of this assessment we developed the following preferences that guided our study selections:
1. The endpoints should be reasonably indicative of neurodevelopment. As a practical matter we had to model methylmercury’s effects on selected aspects of neurodevelopment and assume that these effects are reasonably indicative of methylmercury’s effects on fetal neurodevelopment generally. The same consideration applied to the beneficial effects from fish nutrients. As stated previously, we were more interested in modeling representative effects rather than worst or best case effects because the latter are often outliers supported by limited data. Also, best or worst case as derived from a limited aspect of neurodevelopment could give a misleading picture of the overall effect that is most likely to occur.
2. The results should be sufficiently detailed to support dose-response modeling. We preferred to model individual subject data, rather than summaries of data, for the detail they provide. Fetal neurodevelopmental endpoints are “continuous” in that the outcome in an individual is a matter of degree, e.g., whether the result on a test of neurodevelopment is better or worse than the results achieved by others in a group, or when an infant first talks (as opposed to whether an infant ever talks). Individual subject data enhance the modeler’s ability to incorporate individual variability into the assessment. It also allows the modeler to utilize the data without being dependent on the conclusions and characterizations of others. However, when individual subject data have not been made available, we chose to use results that include at least three data points that provide size of effect at different levels of exposure. We regarded three such data points as the minimum necessary for developing a reasonably credible dose-response function. For example, results from a study population that was divided into two data points, i.e., those who ate fish during pregnancy and those who did not eat fish, would not be sufficient to support dose-response modeling.
3. The results should be biologically plausible. Study results employed in the modeling should be biologically plausible. For example, results in which methylmercury effects appear to become substantially larger as dose decreases and approaches zero would not be biologically plausible.

71
4. The results should be reasonably consistent with effects seen in other studies. We preferred to incorporate results from studies in which methylmercury or beneficial nutrient effects were not unusually large or small relative to effects seen in other studies. An example of an unusually large effect would be an apparent methylmercury effect at low dose that is significantly greater than a methylmercury effect that has been reported at much higher doses.
5. The results should not have been substantially confounded. To calculate separate dose-response relationships for methylmercury and beneficial fish nutrients, it was important to incorporate data from studies where each effect could be estimated without having been substantially confounded, offset, or mitigated by the other. Some studies have used statistical techniques to separate a methylmercury effect from a beneficial effect and other potential confounders. The accuracy of the results will always a source of some uncertainty because the methylmercury effect tends to be small and the two variables (adverse effect from methylmercury and beneficial effect from nutrients) tend to be highly correlated. For purposes of this assessment, the best that could be done was to minimize the likelihood of substantial confounding though careful selection of the data. (See Preference 6, below.)
6. The results for methylmercury should reflect relatively high exposures. Methylmercury effects that have been reported at exposures below those in the extreme poisoning events in Japan and Iraq have tended to be subtle. Effects become smaller as dose decreases. At low-dose U.S. exposures the small size of the effects can challenge the ability of an observational study to measure them with accuracy or with sufficient certainty that they actually are methylmercury effects, as opposed to correlations with other effects. A very large study involving thousands of participants could have the power to minimize these uncertainties, however. As an additional matter, at relatively high exposures reflective of high fish consumption, confounding by beneficial nutrients can become less likely because benefits have already reached a plateau (see Preference 7, below). When most fish consumption in a study population is greater than that needed to reach a benefits plateau, variations in neurodevelopmental test results could be due to greater or lesser exposures to methylmercury but not due to greater or lesser exposures to beneficial nutrients in fish.
7. For the beneficial nutrient effects, the results should reflect relatively low exposures. Research results indicate that beneficial nutrient effects are relatively low dose effects that reach plateaus at some amount of fish consumption. Above that amount, beneficial effects no longer increase as fish consumption increases. Consequently, a study involving a population that essentially consumes above this plateau will not necessarily reveal a dose-response relationship for the beneficial nutrient effect because benefits will not increase or decrease as consumption increases or decreases within that study population.

72
8. For the beneficial nutrient effects, the results should come from the consumption
of fish. As mentioned previously, fish presents a “package” that includes lean protein, omegta-3 fatty acids, selenium, and other minerals and nutrients. In order to capture this “package,” we modeled results from studies involving fish consumption and did not include results from studies that only measured the contribution from an individual nutrient. This modeling produced dose-response functions for fish generally, without distinguishing among species. Such modeling is adequate for population-level estimates where the population as a whole eats a variety of fish, but it is problematic when attempting to differentiate among specific fish. For that reason, the species-by-species modeling in this assessment also considers what the net effects would be for individual fish if omega-3 fatty acids were the sole source of the beneficial effect.
9. Studies with more participants are better than studies with fewer participants. As mentioned above, large studies have more power to accurately detect small effects than do small studies, all other things being equal. This can be especially true when the study is attempting to distinguish between closely correlated variables. Our preference was to use data from relatively large study populations. An exception we made to that preference was our use of data from a study conducted in Iraq with only 81 mother-enfant pairs. The effects seen in that study were large-to-extreme and were not confounded by fish nutrients. They were not likely to represent anything other than methylmercury effects. We include results of modeling effects observed in the Iraqi study in Appendix A.
10. Both the beneficial nutrient effect and the methylmercury effect should involve comparable aspects of neurodevelopment. Although Z-Scores may be used to compare virtually any neurobehavioral effect (see the discussion of Z-Scores in Appendix A), we preferred that the beneficial nutrient effect be within the same general domain or aspect of neurodevelopment as the methylmercury effect. The dose-response relationship for each of them could then be combined into a single dose-response relationship for the net effect from fish on a specific domain or aspect of neurodevelopment, e.g., IQ.
(d)(2) IQ: Selection of Research Results for Inclusion in the Adverse Methylmercury Dose-Response Function Studies in New Zealand and the Seychelles Islands looked for associations between exposure to methylmercury and results on a full battery of IQ tests. The tests were administered at six years of age in New Zealand and at nine years of age in the Seychelles Islands. In the Faroe Islands study, full IQ tests were not administered but tests chosen to assess specific functional domains were administered at seven years of age. Two analyses conducted outside FDA developed adverse dose-response relationships for methylmercury’s effect on IQ from these studies. One analysis was originally developed
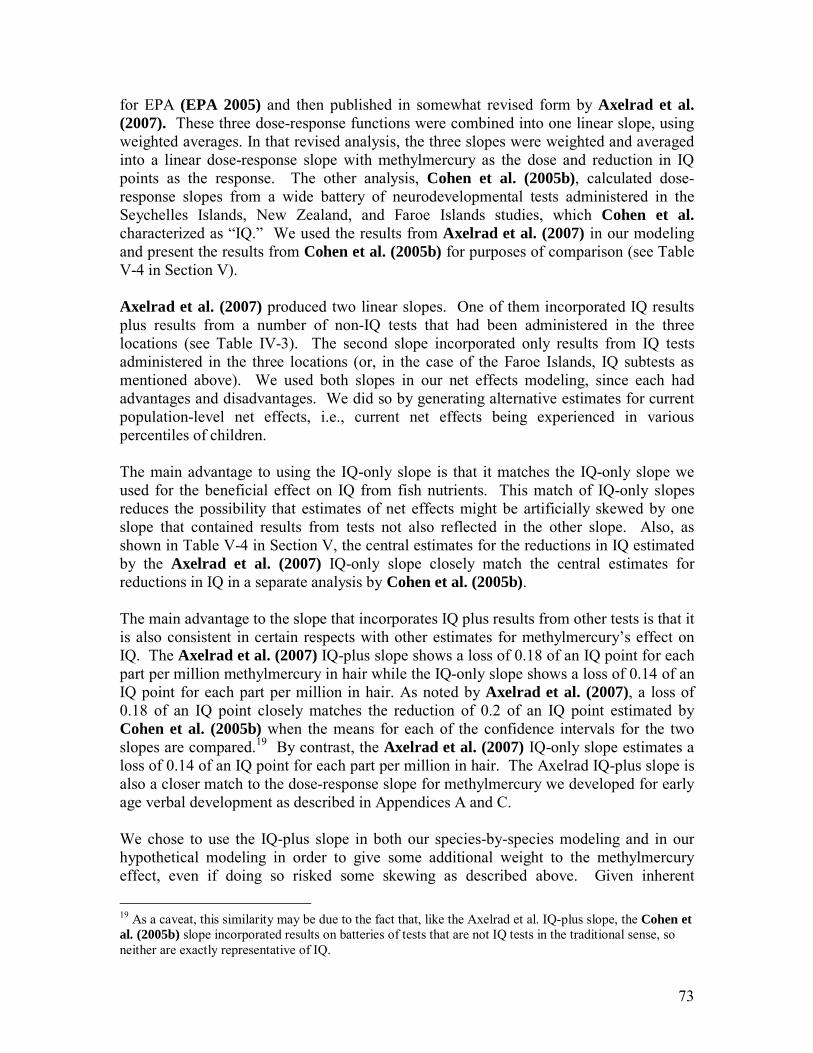
73
for EPA (EPA 2005) and then published in somewhat revised form by Axelrad et al. (2007). These three dose-response functions were combined into one linear slope, using weighted averages. In that revised analysis, the three slopes were weighted and averaged into a linear dose-response slope with methylmercury as the dose and reduction in IQ points as the response. The other analysis, Cohen et al. (2005b), calculated dose-response slopes from a wide battery of neurodevelopmental tests administered in the Seychelles Islands, New Zealand, and Faroe Islands studies, which Cohen et al. characterized as “IQ.” We used the results from Axelrad et al. (2007) in our modeling and present the results from Cohen et al. (2005b) for purposes of comparison (see Table V-4 in Section V). Axelrad et al. (2007) produced two linear slopes. One of them incorporated IQ results plus results from a number of non-IQ tests that had been administered in the three locations (see Table IV-3). The second slope incorporated only results from IQ tests administered in the three locations (or, in the case of the Faroe Islands, IQ subtests as mentioned above). We used both slopes in our net effects modeling, since each had advantages and disadvantages. We did so by generating alternative estimates for current population-level net effects, i.e., current net effects being experienced in various percentiles of children. The main advantage to using the IQ-only slope is that it matches the IQ-only slope we used for the beneficial effect on IQ from fish nutrients. This match of IQ-only slopes reduces the possibility that estimates of net effects might be artificially skewed by one slope that contained results from tests not also reflected in the other slope. Also, as shown in Table V-4 in Section V, the central estimates for the reductions in IQ estimated by the Axelrad et al. (2007) IQ-only slope closely match the central estimates for reductions in IQ in a separate analysis by Cohen et al. (2005b). The main advantage to the slope that incorporates IQ plus results from other tests is that it is also consistent in certain respects with other estimates for methylmercury’s effect on IQ. The Axelrad et al. (2007) IQ-plus slope shows a loss of 0.18 of an IQ point for each part per million methylmercury in hair while the IQ-only slope shows a loss of 0.14 of an IQ point for each part per million in hair. As noted by Axelrad et al. (2007), a loss of 0.18 of an IQ point closely matches the reduction of 0.2 of an IQ point estimated by Cohen et al. (2005b) when the means for each of the confidence intervals for the two slopes are compared.19 By contrast, the Axelrad et al. (2007) IQ-only slope estimates a loss of 0.14 of an IQ point for each part per million in hair. The Axelrad IQ-plus slope is also a closer match to the dose-response slope for methylmercury we developed for early age verbal development as described in Appendices A and C. We chose to use the IQ-plus slope in both our species-by-species modeling and in our hypothetical modeling in order to give some additional weight to the methylmercury effect, even if doing so risked some skewing as described above. Given inherent
19 As a caveat, this similarity may be due to the fact that, like the Axelrad et al. IQ-plus slope, the Cohen et al. (2005b) slope incorporated results on batteries of tests that are not IQ tests in the traditional sense, so neither are exactly representative of IQ.
74
uncertainties in the modeling, we may err toward overestimating the methylmercury effect in modeling that was most likely to influence risk management decisions, e.g., when calculating, for example, how much fish a pregnant women could eat per week before the net effect for offspring is likely to become adverse. (In a sensitivity analysis described in Section V, we also raised the amount of methylmercury in each fish by 20 percent to determine how higher methylmercury levels than have been captured in the FDA database might affect outcomes.) The data and results from which the methylmercury dose-response relationship with IQ was derived met our preferences for dose-response modeling as follows:
• IQ is a representative indicator of effect. IQ incorporates a range of sub-tests in
several “domains” of neurodevelopment, each of which increases the likelihood that it includes tests that could be affected by methylmercury at low doses. IQ modeling can address neurodevelopmental effects at later ages than could early age results such as ages of first talking and walking. It has been hypothesized that effects from prenatal exposure to methylmercury are difficult to detect until a child becomes older (Myers et al., 1995). Moreover, IQ’s predictive value for achievement throughout life has been studied extensively.
• Sufficient detail was available for dose-response modeling. Individual subject data
from the Faroe Islands, Seychelles Islands, and New Zealand studies were not made available but the number of data points in the summaries was adequate for dose-response modeling by Axelrad et al. (2007).
• The results were biologically plausible. The results were biologically plausible in
that methylmercury effects increased as exposures increased and vice versa. • The results were reasonably consistent with effects seen in other studies. Combined
results for IQ from the three locations (Faroe Islands, Seychelles Islands, and New Zealand) as analyzed by Axelrad et al. (2007) are consistent with results from a battery of tests from the same locations and characterized as IQ by Cohen et al. (2005b). The results were also consistent with the effect of methylmercury on the onset of talking as described in Appendix A.
• The methylmercury effect is not likely to have been substantially confounded. The
potential confounder of greatest concern is the beneficial effect from fish nutrients that could cause the methylmercury effect to appear smaller than it actually is or to hide it altogether. In the Faroe Islands, Seychelles Islands, and New Zealand studies, we assume that confounding by fish nutrients did not substantially alter the results. As explained previously, the basis for this assumption is the likelihood that most fish consumption in these study populations exceeded amounts needed to reach a plateau in the beneficial effects provided by the fish. Where the effects being studied are primarily differences in test scores among those whose benefits have already been maximized, the differences could only be due to the various exposures to methylmercury in that study population, unconfounded by benefits.
75
• The exposures were relatively high. The Seychelles Islands, Faroe Islands, and New Zealand studies involved exposures as high as has been reported outside of the extreme poisoning events in Japan and Iraq, which is why these populations were chosen for study. While there is some overlap between high-end U.S. exposures and those seen in the three studies, most exposures in those locations were many times higher than most U.S. exposures.
By contrast, low-dose studies solely within the range of U.S. exposures appear to have produced inconsistent results. The methylmercury effect reported in a small U.S. study, Oken et al. (2005), appears to be unusually large, to the point where it seems to be greater than methylmercury effects reported in the Faroe Islands or New Zealand studies. Most of the exposures in the latter studies were about 10 times greater than most of U.S. exposures. Consequently, the Oken et al. (2005) result is the opposite of what we would expect. The methylmercury effect reported in a follow-up study in the United States, Oken et al. (2008), appears to be smaller than the effect reported in Oken et al. (2005), while a study in England, Daniels et al. (2004), found no methylmercury effect at all.
• The combined study population was relatively large. Collectively, the three studies
(the Seychelles Islands, the Faroe Islands, and New Zealand studies) had over 1,600 study participants.
(d)(3) IQ: Selection of Research Results for Inclusion in the Beneficial Fish Nutrients Dose-Response Function The Avon Longitudinal Study of Parents and Children (ALSPAC), operated by the University of Bristol in England, obtained data on maternal fish consumption during pregnancy and on both full and verbal IQ, a subset of full IQ, of offspring at eight years of age from over 5,000 mother-child pairs. ALSPAC is tracking nearly 14,000 children from birth in 1991-1992 through adulthood to obtain information on mental and physical health, educational achievement, and general well being (ALSPAC 2010). We obtained ALSPAC summary data from 5,407 mother-child pairs that included maternal fish consumption and both full and verbal IQ results in their children. These data show the children’s mean IQ scores along with the standard error of the mean at six levels of maternal fish consumption. As discussed in Section III, an analysis of prenatal exposures to methylmercury and test scores in 1,054 of the children in the ALSPAC study found no association between estimated methylmercury and scores (Daniels et al., 2004). Our conclusion from the Daniels et al. (2004) results was that confounding by methylmercury was not estimable in the IQ group. For purposes of our modeling, however, we assume that some degree of confounding did occur and that as a consequence, the methylmercury in the fish eaten by the mothers in the IQ group reduced the size of the beneficial effect. We adjusted for that influence in our modeling20 in order to estimate the size of the beneficial effect 20 We did not similarly adjust for benefits in our modeling of methylmercury’s adverse effects. For that modeling we only used results from relatively high exposure studies. We assume that in those locations
76
independent of methylmercury. The size of the methylmercury adjustment was derived from the size of the IQ deficit from methylmercury estimated by Axelrad et al. (2007) as described previously. As shown in Figure C-17 in Appendix C, IQ improved sharply as maternal fish consumption increased from about three ounces per week to slightly over eight ounces per week. The IQ results we have for consumption beyond eight ounces per week (at about 12.8 and 17.8 ounces per week) do not show any additional increase, indicative of a plateau in the beneficial effect. Also, the IQ results we have for the lowest levels of fish consumption do not show a beneficial effect below three ounces of fish per week. We examined four shapes for beneficial dose-response relationships to determine which of them might best fit the six data points that we have. We eliminated a linear shape in which IQ would continue to increase indefinitely in proportion to increased fish consumption. Such a shape would not fit the plateau that appears to exist at higher levels of consumption. We also eliminated an exponential shape in which IQ increases sharply at extremely small amounts of fish consumption since the data did not show such an increase. We concluded that “hill” and “hockey stick” shapes, as pictured in Figure C-17 in Appendix C, provide the best fit. They both indicate a plateau beyond roughly 10 ounces of fish per week. We incorporated both functions in our modeling, giving equal weight to each. The data from which we calculated the beneficial dose-response relationships for IQ met our preferences for dose-response modeling as follows:
• IQ is a representative indicator of effect. See the reasons provided previously.21
• The endpoint for the beneficial effect was the same as the endpoint for the methylmercury effect. Both endpoints involved IQ.
• Sufficient detail was available for dose-response modeling. We had six data points for IQ. We regard three data points as the minimum necessary for modeling purposes
• The results were biologically plausible. A strong gain in benefits followed by lesser gains and then a plateau is biologically plausible and fits the evidence from observational studies. Otherwise, extremely high fish consumption could produce nearly unlimited gains in intelligence, at least so long as the fish were low in methylmercury.
benefits would have already reached a plateau or the rate of increase in benefits would have at least tapered off substantially. Under those circumstances an adjustment would not be needed for purposes of developing a dose-response function. 21 Also, as stated previously, we modeled verbal IQ for comparative reasons because it appeared to be particularly responsive to beneficial effects from fish nutrients in the ALSPAC study population in addition to appearing to be highly sensitive to methylmercury in the Faroe Islands study.
77
• The results were consistent with beneficial effects seen in other studies. The
beneficial nutrient contributions to the net effects on IQ are roughly within an IQ point (up to 1.2 IQ points) of the beneficial nutrient contributions estimated by this assessment for early age verbal development. As a caveat, however, the both results came from the same location.
• Exposures to beneficial fish nutrients were relatively low. Exposures were low
enough to reveal a sharp increase in the beneficial effect followed by a tapering to a plateau. Where exposures are mostly above these levels, there appears to be little or no additional benefit, i.e., the dose-response function is essentially “flat.”
• The study population was relatively large. Over 5,000 children is a relatively
large study size. (d)(4) Dose-Response Modeling Flow Diagram and Associated Tables The flow diagram in Figure IV-3 and the accompanying Table IV-2 provide an overview of the dose-response modeling. Table IV-2 addresses key scientific questions, data and assumptions associated with the questions, and the implications for the modeling as a consequence of uncertainties in the data and the assumptions. The assumptions primarily address how the available data are used and adjusted to provide a national picture of net effects on fetal neurodevelopment from commercial fish consumption, including the contributions to those net effects from methylmercury and fish nutrients. Table IV-3 lists the neurodevelopmental tests that produced the results incorporated into the dose-response modeling for each endpoint, i.e., for IQ, early age verbal development, and later age verbal development (the latter two are addressed in Appendix A).
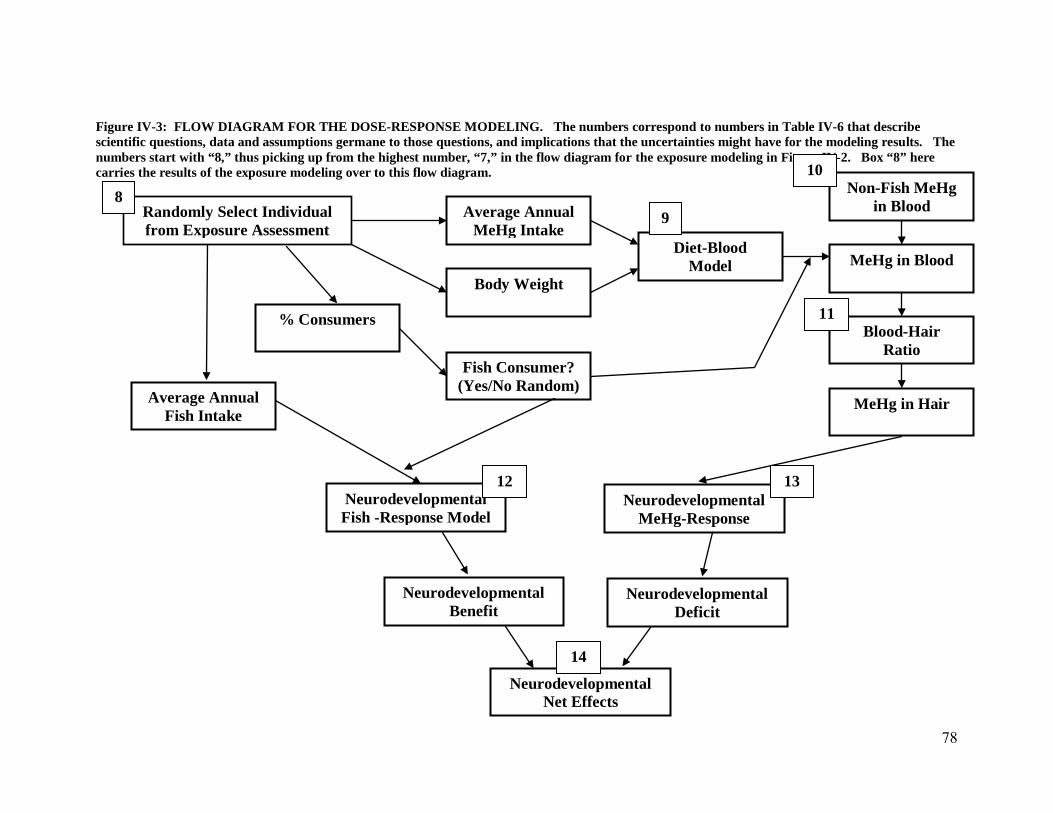
78
Figure IV-3: FLOW DIAGRAM FOR THE DOSE-RESPONSE MODELING. The numbers correspond to numbers in Table IV-6 that describe scientific questions, data and assumptions germane to those questions, and implications that the uncertainties might have for the modeling results. The numbers start with “8,” thus picking up from the highest number, “7,” in the flow diagram for the exposure modeling in Figure IV-2. Box “8” here carries the results of the exposure modeling over to this flow diagram.
Randomly Select Individual from Exposure Assessment
Average Annual MeHg Intake
Average Annual Fish Intake
Body Weight
% Consumers
Non-Fish MeHg in Blood
Diet-Blood Model
Blood-Hair Ratio
MeHg in Blood
Fish Consumer? (Yes/No Random)
MeHg in Hair
Neurodevelopmental MeHg-Response
Neurodevelopmental Deficit
Neurodevelopmental Fish -Response Model
Neurodevelopmental Benefit
Neurodevelopmental Net Effects
8 9
10
11
12 13
14
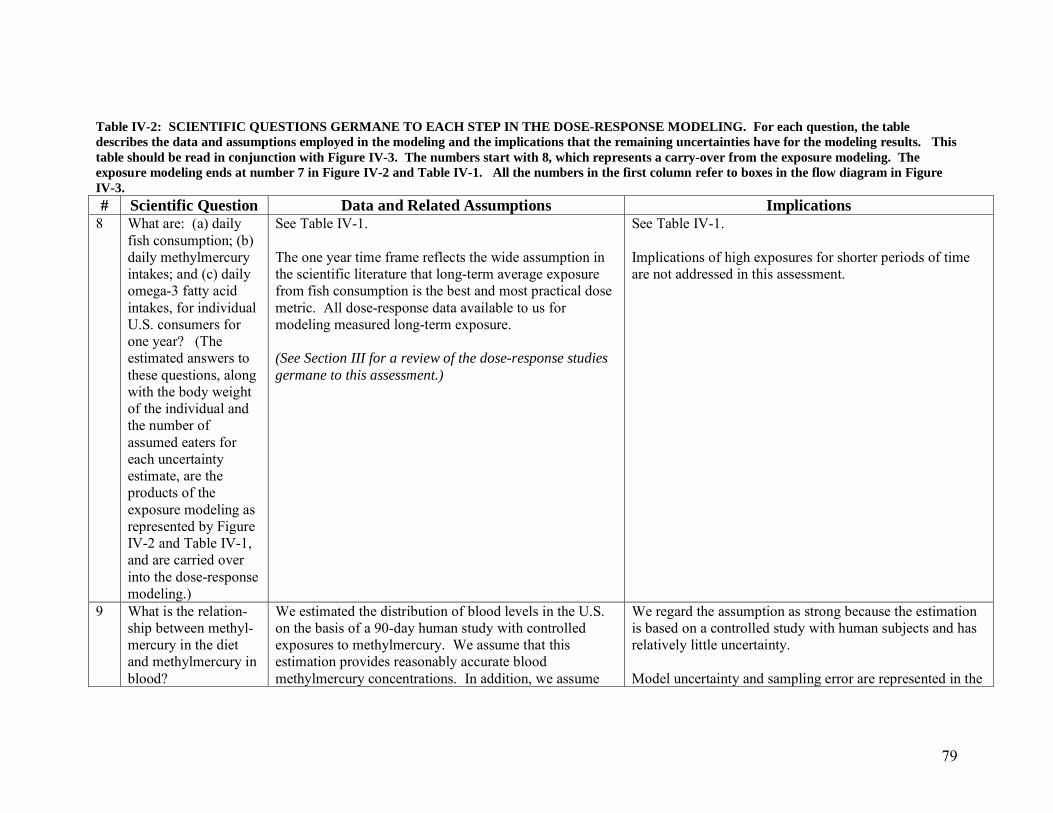
79
Table IV-2: SCIENTIFIC QUESTIONS GERMANE TO EACH STEP IN THE DOSE-RESPONSE MODELING. For each question, the table describes the data and assumptions employed in the modeling and the implications that the remaining uncertainties have for the modeling results. This table should be read in conjunction with Figure IV-3. The numbers start with 8, which represents a carry-over from the exposure modeling. The exposure modeling ends at number 7 in Figure IV-2 and Table IV-1. All the numbers in the first column refer to boxes in the flow diagram in Figure IV-3. # Scientific Question Data and Related Assumptions Implications
8 What are: (a) daily fish consumption; (b) daily methylmercury intakes; and (c) daily omega-3 fatty acid intakes, for individual U.S. consumers for one year? (The estimated answers to these questions, along with the body weight of the individual and the number of assumed eaters for each uncertainty estimate, are the products of the exposure modeling as represented by Figure IV-2 and Table IV-1, and are carried over into the dose-response modeling.)
See Table IV-1. The one year time frame reflects the wide assumption in the scientific literature that long-term average exposure from fish consumption is the best and most practical dose metric. All dose-response data available to us for modeling measured long-term exposure. (See Section III for a review of the dose-response studies germane to this assessment.)
See Table IV-1. Implications of high exposures for shorter periods of time are not addressed in this assessment.
9 What is the relation- ship between methyl- mercury in the diet and methylmercury in blood?
We estimated the distribution of blood levels in the U.S. on the basis of a 90-day human study with controlled exposures to methylmercury. We assume that this estimation provides reasonably accurate blood methylmercury concentrations. In addition, we assume
We regard the assumption as strong because the estimation is based on a controlled study with human subjects and has relatively little uncertainty. Model uncertainty and sampling error are represented in the
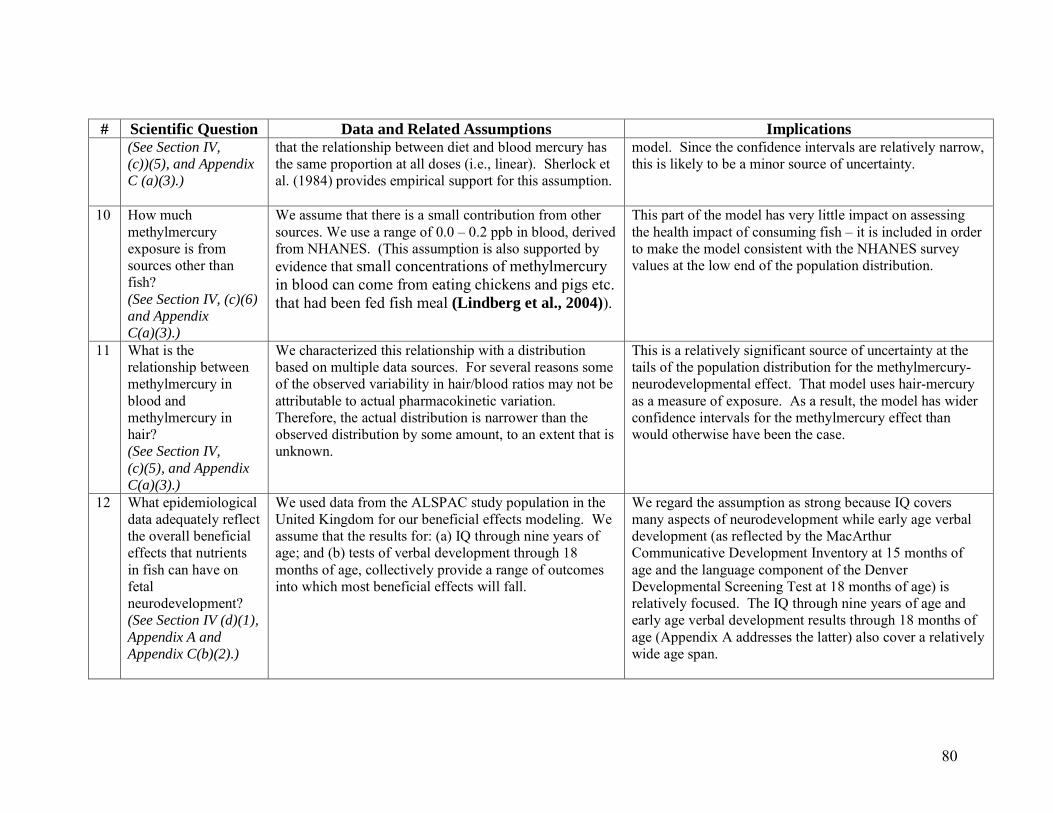
80
# Scientific Question Data and Related Assumptions Implications (See Section IV, (c))(5), and Appendix C (a)(3).)
that the relationship between diet and blood mercury has the same proportion at all doses (i.e., linear). Sherlock et al. (1984) provides empirical support for this assumption.
model. Since the confidence intervals are relatively narrow, this is likely to be a minor source of uncertainty.
10 How much methylmercury exposure is from sources other than fish? (See Section IV, (c)(6) and Appendix C(a)(3).)
We assume that there is a small contribution from other sources. We use a range of 0.0 – 0.2 ppb in blood, derived from NHANES. (This assumption is also supported by evidence that small concentrations of methylmercury in blood can come from eating chickens and pigs etc. that had been fed fish meal (Lindberg et al., 2004)).
This part of the model has very little impact on assessing the health impact of consuming fish – it is included in order to make the model consistent with the NHANES survey values at the low end of the population distribution.
11 What is the relationship between methylmercury in blood and methylmercury in hair? (See Section IV, (c)(5), and Appendix C(a)(3).)
We characterized this relationship with a distribution based on multiple data sources. For several reasons some of the observed variability in hair/blood ratios may not be attributable to actual pharmacokinetic variation. Therefore, the actual distribution is narrower than the observed distribution by some amount, to an extent that is unknown.
This is a relatively significant source of uncertainty at the tails of the population distribution for the methylmercury-neurodevelopmental effect. That model uses hair-mercury as a measure of exposure. As a result, the model has wider confidence intervals for the methylmercury effect than would otherwise have been the case.
12 What epidemiological data adequately reflect the overall beneficial effects that nutrients in fish can have on fetal neurodevelopment? (See Section IV (d)(1), Appendix A and Appendix C(b)(2).)
We used data from the ALSPAC study population in the United Kingdom for our beneficial effects modeling. We assume that the results for: (a) IQ through nine years of age; and (b) tests of verbal development through 18 months of age, collectively provide a range of outcomes into which most beneficial effects will fall.
We regard the assumption as strong because IQ covers many aspects of neurodevelopment while early age verbal development (as reflected by the MacArthur Communicative Development Inventory at 15 months of age and the language component of the Denver Developmental Screening Test at 18 months of age) is relatively focused. The IQ through nine years of age and early age verbal development results through 18 months of age (Appendix A addresses the latter) also cover a relatively wide age span.

81
# Scientific Question Data and Related Assumptions Implications The use of data from a single study population (the ALSPAC population in the U.K.) is a source of uncertainty in the model, however. One aspect of this uncertainty is that the data come from fish in the U.K. marketplace and do not necessarily fully represent fish in the U.S. marketplace. However, the uncertainty is mitigated by the fact that the data come from a large number of subjects, which made it possible to detect benefits that are relatively small compared to other influences. Moreover, for early age verbal development, no offsetting methylmercury effect was detected, indicating that the results were not substantially reduced by offsetting adverse effects, although we assume that they were reduced to some extent. Finally, the sizes of the beneficial effects are generally consistent with those that have been obtained in smaller U.S. studies and a very large study in Denmark.
12 What is the dose-response relationship (e.g., linear or non-linear) between fish consumption and neurodevelopmental benefits? (See Section IV, (d)(2) & (d)(3),Appendix A, and Appendix C(b)(2).)
We developed separate dose-response models for the beneficial effects of fish nutrients on IQ and early age verbal development (See Appendix A for the latter) from data we obtained from the ALSPAC study population in the U.K. For each of these endpoints, we relied on two similar dose-response “shapes” that both appear to fit the data. The first was a linear shape with a maximum effect beyond which no additional beneficial effect accrued, i.e., a “hockey stick” shape. The second was a sigmoidal shape where the majority of the increase occurs over a narrow range of nutrient intakes, primarily at the low end of fish consumption. Effects were corrected for other variables, including methylmercury. We assume that the combination of these two “shapes” into the beneficial effects model provides a reasonably accurate picture of the response relationship between fish consumption and
The data we obtained on the ALSPAC cohort had been divided into fish consumption categories. We conducted a regression analysis across all the categories, so the consequences of misclassification would be small. An error in recall by a woman in the study about how much fish she ate during pregnancy might mean that she was placed in an incorrect consumption category, but the most likely consequence would be that the error would only span one of the categories rather than span multiple categories. For that reason, we believe that errors in recall would not have significantly affected the regression analysis.
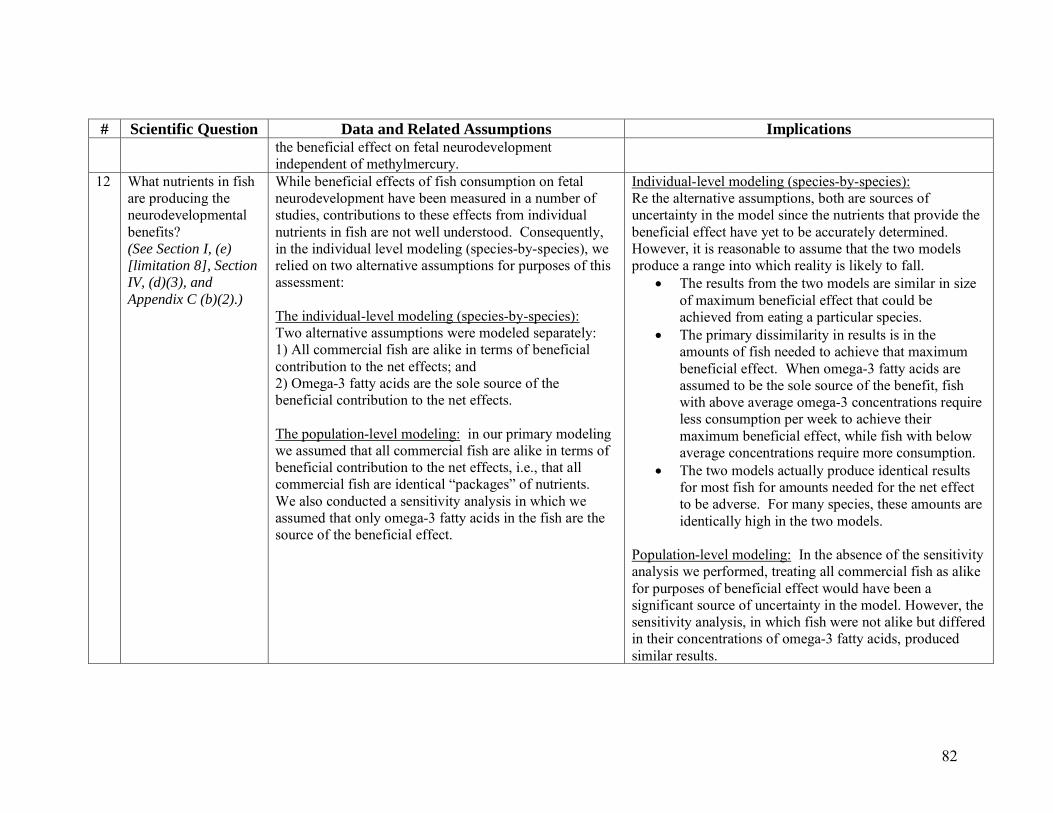
82
# Scientific Question Data and Related Assumptions Implications the beneficial effect on fetal neurodevelopment independent of methylmercury.
12 What nutrients in fish are producing the neurodevelopmental benefits? (See Section I, (e) [limitation 8], Section IV, (d)(3), and Appendix C (b)(2).)
While beneficial effects of fish consumption on fetal neurodevelopment have been measured in a number of studies, contributions to these effects from individual nutrients in fish are not well understood. Consequently, in the individual level modeling (species-by-species), we relied on two alternative assumptions for purposes of this assessment: The individual-level modeling (species-by-species): Two alternative assumptions were modeled separately: 1) All commercial fish are alike in terms of beneficial contribution to the net effects; and 2) Omega-3 fatty acids are the sole source of the beneficial contribution to the net effects. The population-level modeling: in our primary modeling we assumed that all commercial fish are alike in terms of beneficial contribution to the net effects, i.e., that all commercial fish are identical “packages” of nutrients. We also conducted a sensitivity analysis in which we assumed that only omega-3 fatty acids in the fish are the source of the beneficial effect.
Individual-level modeling (species-by-species): Re the alternative assumptions, both are sources of uncertainty in the model since the nutrients that provide the beneficial effect have yet to be accurately determined. However, it is reasonable to assume that the two models produce a range into which reality is likely to fall.
• The results from the two models are similar in size of maximum beneficial effect that could be achieved from eating a particular species.
• The primary dissimilarity in results is in the amounts of fish needed to achieve that maximum beneficial effect. When omega-3 fatty acids are assumed to be the sole source of the benefit, fish with above average omega-3 concentrations require less consumption per week to achieve their maximum beneficial effect, while fish with below average concentrations require more consumption.
• The two models actually produce identical results for most fish for amounts needed for the net effect to be adverse. For many species, these amounts are identically high in the two models.
Population-level modeling: In the absence of the sensitivity analysis we performed, treating all commercial fish as alike for purposes of beneficial effect would have been a significant source of uncertainty in the model. However, the sensitivity analysis, in which fish were not alike but differed in their concentrations of omega-3 fatty acids, produced similar results.
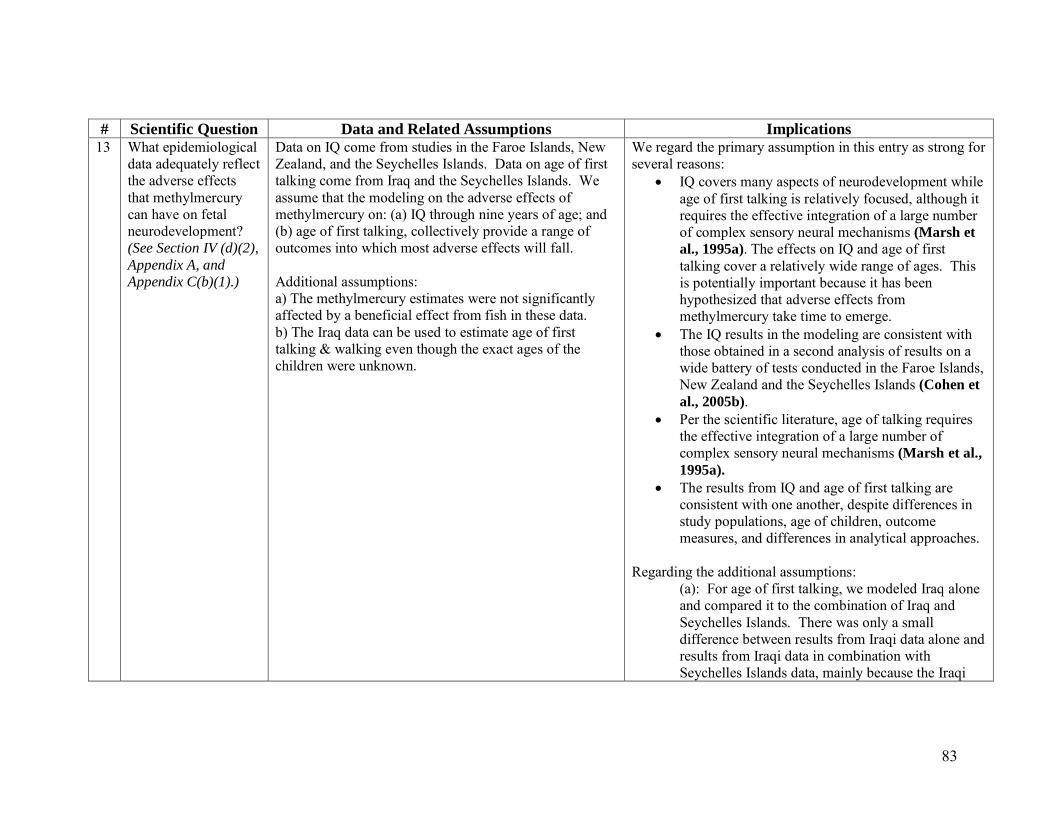
83
# Scientific Question Data and Related Assumptions Implications 13 What epidemiological
data adequately reflect the adverse effects that methylmercury can have on fetal neurodevelopment? (See Section IV (d)(2), Appendix A, and Appendix C(b)(1).)
Data on IQ come from studies in the Faroe Islands, New Zealand, and the Seychelles Islands. Data on age of first talking come from Iraq and the Seychelles Islands. We assume that the modeling on the adverse effects of methylmercury on: (a) IQ through nine years of age; and (b) age of first talking, collectively provide a range of outcomes into which most adverse effects will fall. Additional assumptions: a) The methylmercury estimates were not significantly affected by a beneficial effect from fish in these data. b) The Iraq data can be used to estimate age of first talking & walking even though the exact ages of the children were unknown.
We regard the primary assumption in this entry as strong for several reasons:
• IQ covers many aspects of neurodevelopment while age of first talking is relatively focused, although it requires the effective integration of a large number of complex sensory neural mechanisms (Marsh et al., 1995a). The effects on IQ and age of first talking cover a relatively wide range of ages. This is potentially important because it has been hypothesized that adverse effects from methylmercury take time to emerge.
• The IQ results in the modeling are consistent with those obtained in a second analysis of results on a wide battery of tests conducted in the Faroe Islands, New Zealand and the Seychelles Islands (Cohen et al., 2005b).
• Per the scientific literature, age of talking requires the effective integration of a large number of complex sensory neural mechanisms (Marsh et al., 1995a).
• The results from IQ and age of first talking are consistent with one another, despite differences in study populations, age of children, outcome measures, and differences in analytical approaches.
Regarding the additional assumptions:
(a): For age of first talking, we modeled Iraq alone and compared it to the combination of Iraq and Seychelles Islands. There was only a small difference between results from Iraqi data alone and results from Iraqi data in combination with Seychelles Islands data, mainly because the Iraqi

84
# Scientific Question Data and Related Assumptions Implications data dominate the dose-response function. Also, the Seychelles Islands data involved levels of fish consumption that were likely to be above a plateau in benefits; thus the beneficial effect was essentially “flat” and thus would not have confounded the methylmercury results. The same holds true for IQ. Most fish consumption in the three studies used to estimate the effect of methylmercury on IQ -- Faroe Islands, Seychelles Islands, and New Zealand, was likely to have been beyond an amount at which benefits reach a plateau. When benefits are flat, the differences among study participants could only be due to differences in methylmercury exposure unaffected by benefits. (b): The Iraqi mothers were able to place the ages of their children within six month blocks of their actual birth dates. Since the mothers knew the times of year (e.g., season) that their children were born, errors were likely to be no more than three months on either side of the actual birth date. The size of such errors would be small relative to the size of the effects seen in Iraq, where delays of over a year, including delays of several years, were reported.
13 What is the dose-response relationship (e.g., linear or non-linear) between methylmercury exposure and neurodevelopmental deficits?
The shapes of the dose-response functions for methylmercury are based on data from the studies described in the previous entry. The shapes are essentially linear, in that adverse effects increase in proportion to exposure, with no plateau. The shape of the function for age of first talking becomes somewhat steeper at the high end but includes some possibility of a threshold of effect at low doses. A threshold of effect is
The uncertainty represented in the model is the primary source of uncertainty in the simulation model estimates. The analyses together essentially cover the landscape of possible sources of uncertainty.
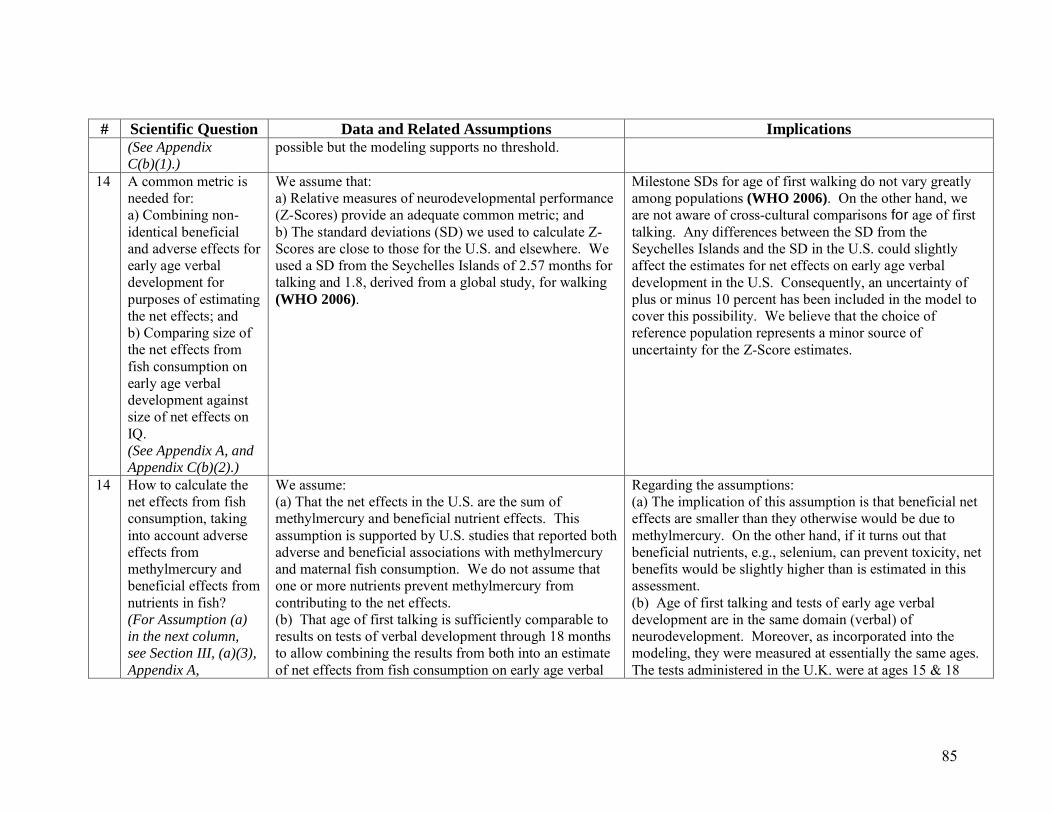
85
# Scientific Question Data and Related Assumptions Implications (See Appendix C(b)(1).)
possible but the modeling supports no threshold.
14 A common metric is needed for: a) Combining non-identical beneficial and adverse effects for early age verbal development for purposes of estimating the net effects; and b) Comparing size of the net effects from fish consumption on early age verbal development against size of net effects on IQ. (See Appendix A, and Appendix C(b)(2).)
We assume that: a) Relative measures of neurodevelopmental performance (Z-Scores) provide an adequate common metric; and b) The standard deviations (SD) we used to calculate Z-Scores are close to those for the U.S. and elsewhere. We used a SD from the Seychelles Islands of 2.57 months for talking and 1.8, derived from a global study, for walking (WHO 2006).
Milestone SDs for age of first walking do not vary greatly among populations (WHO 2006). On the other hand, we are not aware of cross-cultural comparisons for age of first talking. Any differences between the SD from the Seychelles Islands and the SD in the U.S. could slightly affect the estimates for net effects on early age verbal development in the U.S. Consequently, an uncertainty of plus or minus 10 percent has been included in the model to cover this possibility. We believe that the choice of reference population represents a minor source of uncertainty for the Z-Score estimates.
14 How to calculate the net effects from fish consumption, taking into account adverse effects from methylmercury and beneficial effects from nutrients in fish? (For Assumption (a) in the next column, see Section III, (a)(3), Appendix A,
We assume: (a) That the net effects in the U.S. are the sum of methylmercury and beneficial nutrient effects. This assumption is supported by U.S. studies that reported both adverse and beneficial associations with methylmercury and maternal fish consumption. We do not assume that one or more nutrients prevent methylmercury from contributing to the net effects. (b) That age of first talking is sufficiently comparable to results on tests of verbal development through 18 months to allow combining the results from both into an estimate of net effects from fish consumption on early age verbal
Regarding the assumptions: (a) The implication of this assumption is that beneficial net effects are smaller than they otherwise would be due to methylmercury. On the other hand, if it turns out that beneficial nutrients, e.g., selenium, can prevent toxicity, net benefits would be slightly higher than is estimated in this assessment. (b) Age of first talking and tests of early age verbal development are in the same domain (verbal) of neurodevelopment. Moreover, as incorporated into the modeling, they were measured at essentially the same ages. The tests administered in the U.K. were at ages 15 & 18
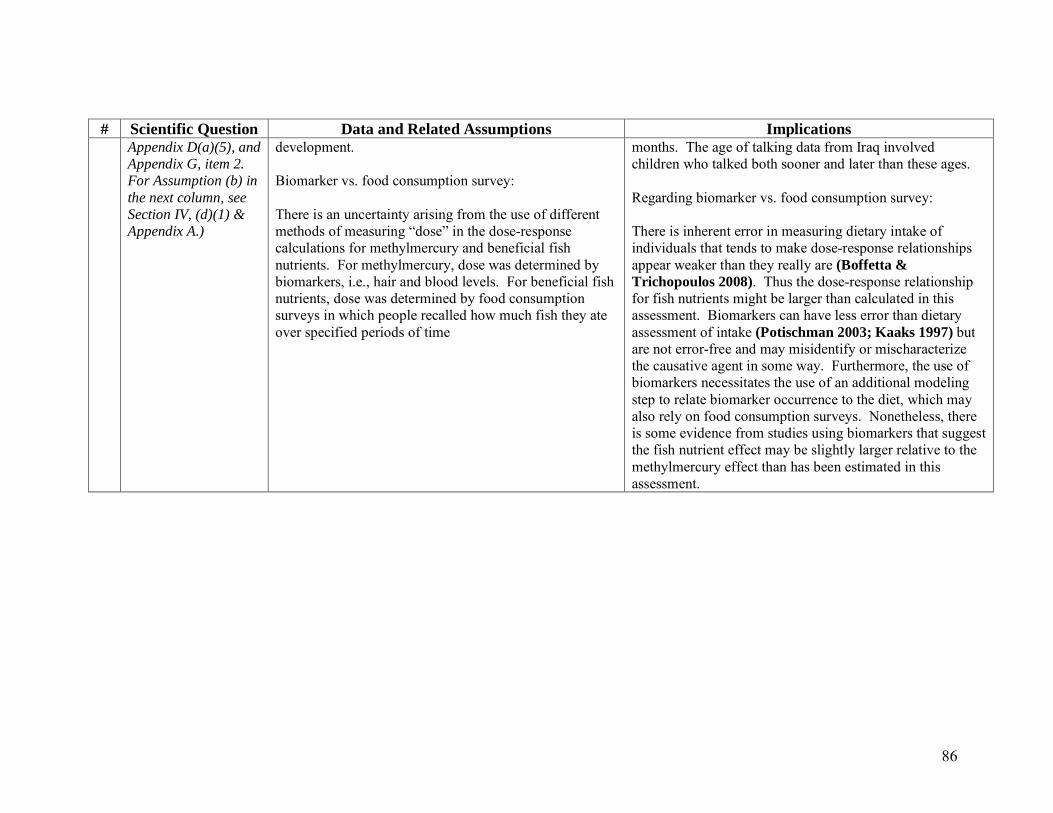
86
# Scientific Question Data and Related Assumptions Implications Appendix D(a)(5), and Appendix G, item 2. For Assumption (b) in the next column, see Section IV, (d)(1) & Appendix A.)
development. Biomarker vs. food consumption survey: There is an uncertainty arising from the use of different methods of measuring “dose” in the dose-response calculations for methylmercury and beneficial fish nutrients. For methylmercury, dose was determined by biomarkers, i.e., hair and blood levels. For beneficial fish nutrients, dose was determined by food consumption surveys in which people recalled how much fish they ate over specified periods of time
months. The age of talking data from Iraq involved children who talked both sooner and later than these ages. Regarding biomarker vs. food consumption survey: There is inherent error in measuring dietary intake of individuals that tends to make dose-response relationships appear weaker than they really are (Boffetta & Trichopoulos 2008). Thus the dose-response relationship for fish nutrients might be larger than calculated in this assessment. Biomarkers can have less error than dietary assessment of intake (Potischman 2003; Kaaks 1997) but are not error-free and may misidentify or mischaracterize the causative agent in some way. Furthermore, the use of biomarkers necessitates the use of an additional modeling step to relate biomarker occurrence to the diet, which may also rely on food consumption surveys. Nonetheless, there is some evidence from studies using biomarkers that suggest the fish nutrient effect may be slightly larger relative to the methylmercury effect than has been estimated in this assessment.

87
Table IV-3: NEURODEVELOPMENTAL TESTS THAT CONTRIBUTED TO DOSE-RESPONSE FUNCTIONS USED IN THIS ASSESSMENT. The neurodevelopmental tests that generated the data used to develop dose-response functions for IQ and for early and later age verbal development.
IQ: Adverse Methylmercury Contribution Test Age Location
Wechsler Intelligence Scale for Children – Revised: Digital Span subtest
7 years Faroe Islands
Wechsler Intelligence Scale for Children – Revised: Similarities subtest
7 years Faroe Islands
Wechsler Intelligence Scale for Children – Revised: Block Design subtest
7 years Faroe Islands
Bender-Gestalt Test 7 years Faroe Islands California Verbal Learning Test – Children 7 years Faroe Islands Boston Naming Test 7 years Faroe Islands Wechsler Intelligence Scale for Children – Revised 6 years New Zealand McCarthy Scales of Children’s Abilities 6 years New Zealand Test of Language Development 6 years New Zealand Wechsler Intelligence Scale for Children – 3rd Edition 9 years Seychelles Islands California Verbal Learning Test – Children 9 years Seychelles Islands Boston Naming Test 9 years Seychelles Islands Developmental Test of Visual-Motor Integration 9 years Seychelles Islands Wide Range Assessment of Memory & Learning: Design Memory subtest
9 years Seychelles Islands
IQ: Beneficial Fish Nutrient(s) Contribution Test Age Location
Wechsler Intelligence Scale for Children – 3rd Edition 8 years United Kingdom Early Age Verbal Development: Adverse Methylmercury Contribution
Test Age Location Delays in first talking 10-72 months Iraq Delays in first talking Seychelles Islands
Early Age Verbal Development: Beneficial Fish Nutrient(s) Contribution Test Age Location
Denver Developmental Screening Test: Language 18 months United Kingdom
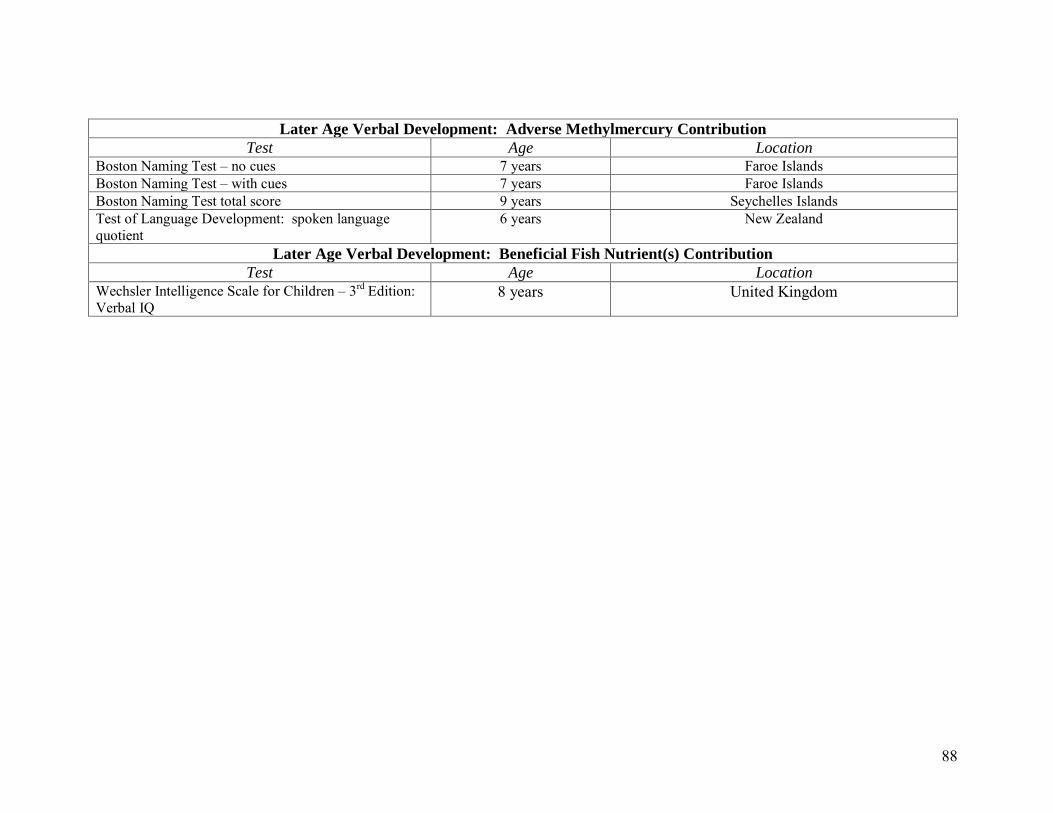
88
Later Age Verbal Development: Adverse Methylmercury Contribution Test Age Location
Boston Naming Test – no cues 7 years Faroe Islands Boston Naming Test – with cues 7 years Faroe Islands Boston Naming Test total score 9 years Seychelles Islands Test of Language Development: spoken language quotient
6 years New Zealand
Later Age Verbal Development: Beneficial Fish Nutrient(s) Contribution Test Age Location
Wechsler Intelligence Scale for Children – 3rd Edition: Verbal IQ
8 years United Kingdom
89
SECTION V: MODELING RESULTS FOR EXPOSURE AND FOR IQ
(a) Exposure Results (a)(1) Amounts of Fish Consumed
Table V-1 shows fish consumption for women 16-45 years of age, expressed in terms of ounces per week. For purposes of comparison, the table includes men in the same age range. The table indicates that 12 ounces of fish per week, which is at the upper end of the consumption range recommended for pregnant women by the Dietary Guidelines for Americans 2010 (DGA 2010), represents consumption in the vicinity of the 95th percentile for women of childbearing age (i.e., approximately five percent of women of childbearing age eat more than 12 ounces per week). FDA’s exposure modeling for women of childbearing age estimates that average fish consumption for this age group is 3.7 ounces per week. The FDA exposure modeling does not estimate consumption for the subset of women in this age range who are pregnant, however. The modeling assumes that average consumption for pregnant women is the same as it is for women 16-45 years of age. However, a survey conducted by FDA indicates that pregnant women eat less fish than non-pregnant women of the same age (Lando et al., 2012). Also, median fish consumption among the women in that survey was less than two ounces per week, suggesting that the average may be skewed by outliers who eat atypically high amounts of fish. Average weekly consumption taken from the 2003-2004 NHANES survey (provided in Table V-1 for purposes of comparison) was also below three ounces. The latter two results, i.e., pregnant women eat less than non-pregnant women in the FDA survey, and an average of less than three ounces from NHANES, suggest at least a possibility that our modeling is overestimating consumption by pregnant women. If that is so, then would likely be overestimating exposure to both methylmercury and to beneficial nutrients. An overestimation of this nature could cause the model to estimate slightly greater net beneficial effects at lower levels of consumption and slightly more adverse net effects at the highest levels of fish consumption than actually occur.22
22 These possibilities are based on modeling results, presented in this section, indicating that beneficial effects on neurodevelopment tend to dominate the net effects at lower levels of fish consumption while adverse methylmercury effects become stronger at higher levels of consumption.
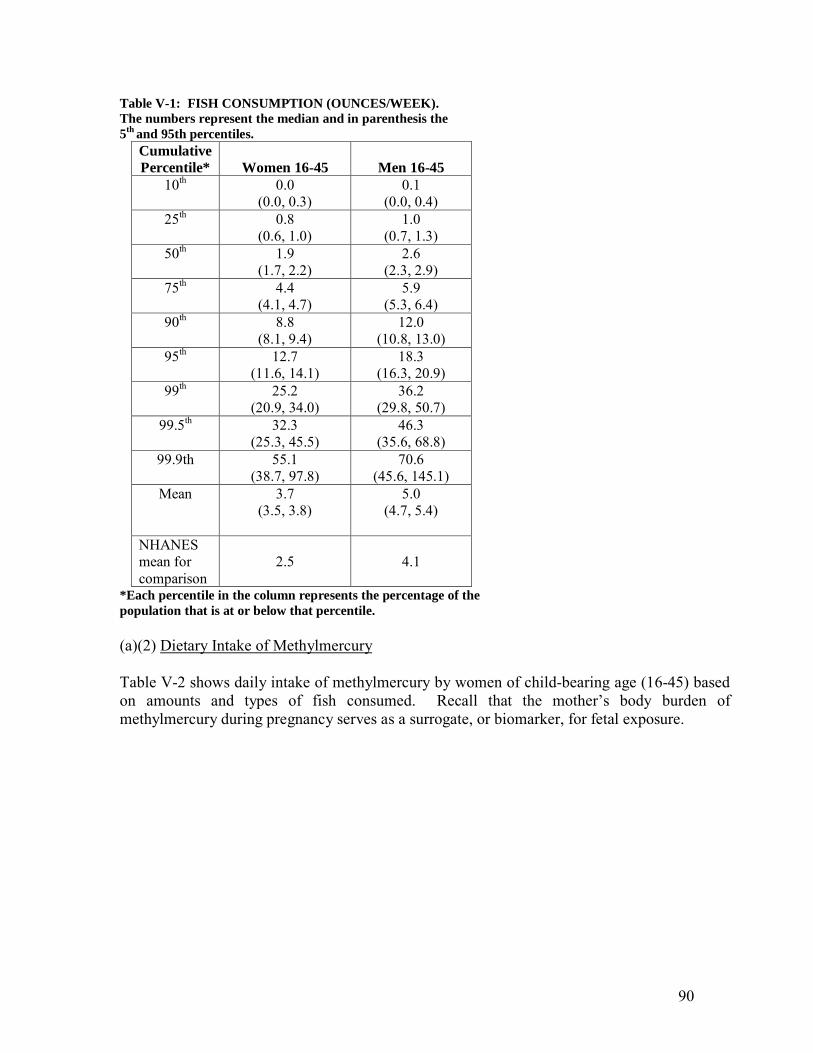
90
Table V-1: FISH CONSUMPTION (OUNCES/WEEK). The numbers represent the median and in parenthesis the 5th and 95th percentiles.
Cumulative Percentile*
Women 16-45
Men 16-45
10th 0.0 (0.0, 0.3)
0.1 (0.0, 0.4)
25th 0.8 (0.6, 1.0)
1.0 (0.7, 1.3)
50th 1.9 (1.7, 2.2)
2.6 (2.3, 2.9)
75th 4.4 (4.1, 4.7)
5.9 (5.3, 6.4)
90th 8.8 (8.1, 9.4)
12.0 (10.8, 13.0)
95th 12.7 (11.6, 14.1)
18.3 (16.3, 20.9)
99th 25.2 (20.9, 34.0)
36.2 (29.8, 50.7)
99.5th 32.3 (25.3, 45.5)
46.3 (35.6, 68.8)
99.9th 55.1 (38.7, 97.8)
70.6 (45.6, 145.1)
Mean 3.7 (3.5, 3.8)
5.0 (4.7, 5.4)
NHANES mean for comparison
2.5
4.1
*Each percentile in the column represents the percentage of the population that is at or below that percentile. (a)(2) Dietary Intake of Methylmercury Table V-2 shows daily intake of methylmercury by women of child-bearing age (16-45) based on amounts and types of fish consumed. Recall that the mother’s body burden of methylmercury during pregnancy serves as a surrogate, or biomarker, for fetal exposure.

91
Table V-2: DIETARY METHYLMERCURY23 FROM FISH CONSUMPTION (MICROGRAMS PER DAY) Cumulative Percentile of Women Ages 16-45*
Median (5th, 95th)
10th 0.0 (0.0, 0.1)
25th 0.2 (0.1, 0.3)
50th 0.7 (0.6, 0.8)
75th 1.7 1.5, 1.8)
90th 3.5 (3.2, 3.8)
95th 5.3 (4.5, 5.9)
99th 10.7 (8.8, 13.8)
99.5th 13.8 (10.9, 17.6)
99.9th 22.3 (15.6, 44.0)
Mean 1.4 (1.3, 1.5)
*Each percentile in the column represents the percentage of the population that is at or below that percentile. Table V-3 shows the results from Table V-2 along with our conversions from dietary methylmercury to blood and hair concentrations. These concentrations were used in the “dose” estimates in the dose-response modeling. Note that estimated exposure to methylmercury essentially doubles between the 99th and 99.9th percentiles.
23 These are mercury levels in the mothers, not in the children. The dose-response data that are available on effects on the fetus are in terms of mothers’ levels of mercury, not infants’ levels. Therefore the conversion from what’s in the mother to what’s in the infant is part of the dose-response function and does not have to be estimated.
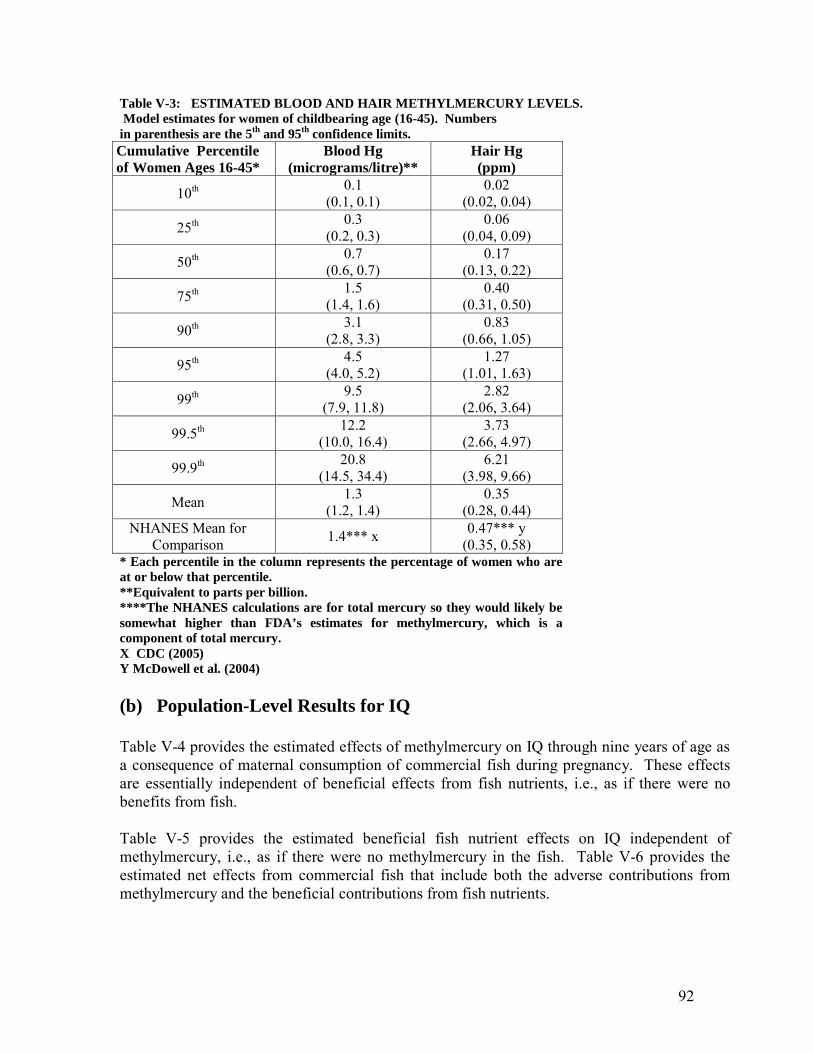
92
Table V-3: ESTIMATED BLOOD AND HAIR METHYLMERCURY LEVELS. Model estimates for women of childbearing age (16-45). Numbers in parenthesis are the 5th and 95th confidence limits. Cumulative Percentile of Women Ages 16-45*
Blood Hg (micrograms/litre)**
Hair Hg (ppm)
10th 0.1 (0.1, 0.1)
0.02 (0.02, 0.04)
25th 0.3 (0.2, 0.3)
0.06 (0.04, 0.09)
50th 0.7 (0.6, 0.7)
0.17 (0.13, 0.22)
75th 1.5 (1.4, 1.6)
0.40 (0.31, 0.50)
90th 3.1 (2.8, 3.3)
0.83 (0.66, 1.05)
95th 4.5 (4.0, 5.2)
1.27 (1.01, 1.63)
99th 9.5 (7.9, 11.8)
2.82 (2.06, 3.64)
99.5th 12.2 (10.0, 16.4)
3.73 (2.66, 4.97)
99.9th 20.8 (14.5, 34.4)
6.21 (3.98, 9.66)
Mean 1.3 (1.2, 1.4)
0.35 (0.28, 0.44)
NHANES Mean for Comparison 1.4*** x 0.47*** y
(0.35, 0.58) * Each percentile in the column represents the percentage of women who are at or below that percentile. **Equivalent to parts per billion. ****The NHANES calculations are for total mercury so they would likely be somewhat higher than FDA’s estimates for methylmercury, which is a component of total mercury. X CDC (2005) Y McDowell et al. (2004) (b) Population-Level Results for IQ Table V-4 provides the estimated effects of methylmercury on IQ through nine years of age as a consequence of maternal consumption of commercial fish during pregnancy. These effects are essentially independent of beneficial effects from fish nutrients, i.e., as if there were no benefits from fish. Table V-5 provides the estimated beneficial fish nutrient effects on IQ independent of methylmercury, i.e., as if there were no methylmercury in the fish. Table V-6 provides the estimated net effects from commercial fish that include both the adverse contributions from methylmercury and the beneficial contributions from fish nutrients.
93
Each of these tables presents estimated effects for various percentages of U.S. children through 99.9 percent of all children. The effects presented at the 99.9 percent level are the largest likely effects that could occur through 99.9 percent of children but they also include all the lesser effects presented in the table. (b)(1) Population Results for Methylmercury’s Contribution to the Net Effects on IQ Table V-4 presents three estimates for methylmercury’s adverse effects on IQ independent of any beneficial effects from nutrients in fish. These estimates were described in section IV and are summarized briefly here:
1. Estimates derived from an analysis by Axelrad et al. (2007) that took into account IQ scores in the Seychelles Islands and New Zealand, scores on subsets of IQ from the Faroe Islands, and scores on some non-IQ tests from these locations. We used these estimates in our modeling of net effects on IQ.
2. Estimates derived from a second analysis by Axelrad et al. (2007) that only took into account IQ scores in the Seychelles Islands and New Zealand, and scores on subsets of IQ from the Faroe Islands. We also used these estimates in our modeling of net effects on IQ.
3. Estimates derived from an analysis by Cohen et al. (2005b) that took into account batteries of tests administered in the Seychelles Islands, Faroe Islands and New Zealand that, collectively, were characterized by the authors as representing IQ. We did not use these estimates in our modeling of IQ but include them here for purposes of comparison. (We used a subset of these estimates, however, in our modeling for later age verbal development, as described in Appendix A.)
It is worth pointing out that these estimates are derived from a Cohen et al. (2005b) secondary analysis and not from their primary modeling. Cohen et al. conducted this secondary analysis in response to concerns about biological plausibility in their primary modeling. Unlike Axelrad et al. (2007), Cohen et al. utilized results from the Faroe Islands study that had been subject to log linear dose-response modeling by the Faroe Islands researchers. In that type of modeling, the logs of the doses are substituted for the sizes of the actual doses. Log transformation has its purposes, and its application to the exposures that occurred in the Faroe Islands may have been entirely appropriate. However, when extrapolated down through the range of U.S. exposures, the log linear modeling estimated that the sizes of the methylmercury effects increase exponentially -- involving multiple IQ points -- as exposures approach zero. Such results are not biologically plausible. Cohen et al. (2005b) attempted to solve this problem in their primary analysis by averaging the methylmercury-IQ effects that the log-linear modeling had estimated for the lowest 25 percent of exposures. Doing so prevented their dose-response function from predicting extreme increases in effects as doses approach zero. A significant problem remained, however, in that these averaged effects still exceeded the sizes of
94
the actual effects that had been observed at higher exposures in the Faroe Islands study -- the very study from which the averaging had been initially derived.
Cohen et al. (2005b) performed the secondary analysis in response to this problem. The secondary analysis also involved averaging, but this time the averaged results were from the central part of the range of Faroe Islands exposures, rather than from the lowest part of the range. These results had also been subject to log linear modeling but they did not involve extrapolation down through the range of lower exposures observed in a few of the Faroese and in the United States. Consequently, they did not suffer from the biological implausibility that had occurred when the log linear extrapolated results were used, i.e., extreme increases in effects as doses approached zero.
Additional discussion of the Cohen et al. (2005b) analysis of the Faroe Islands results, with a figure representing the log-linear modeling results and the averaging, is contained in Appendix C.
In Table V-4 each reduction in IQ from methylmercury reflects the maximum reduction that is likely to occur within that percentage of the population absent any benefits from fish. It includes all possible lesser reductions. The zeros for the central estimates through the 10th percentile represent children whose mothers ate no fish during pregnancy. The zeros in 95 percent confidence intervals for at least 25 percent of U.S. children (in the Axelrad et al. (2007) analysis) suggest a small possibility of no adverse contribution from methylmercury. Our assessment was weighted largely (but not entirely) against such a possibility, i.e., against the existence of a threshold of effect for methylmercury, so a threshold would only appear as a small possibility in the confidence intervals. The confidence intervals derived from the Cohen et al., 2005b analysis include some negative numbers through the 50th percentile, indicative of a very small possibility of a beneficial effect from methylmercury. (In this table positive numbers reflect adverse effects while negative numbers reflect beneficial effects.) This is an anomaly in the modeling and may be due to a correlation with beneficial fish consumption.
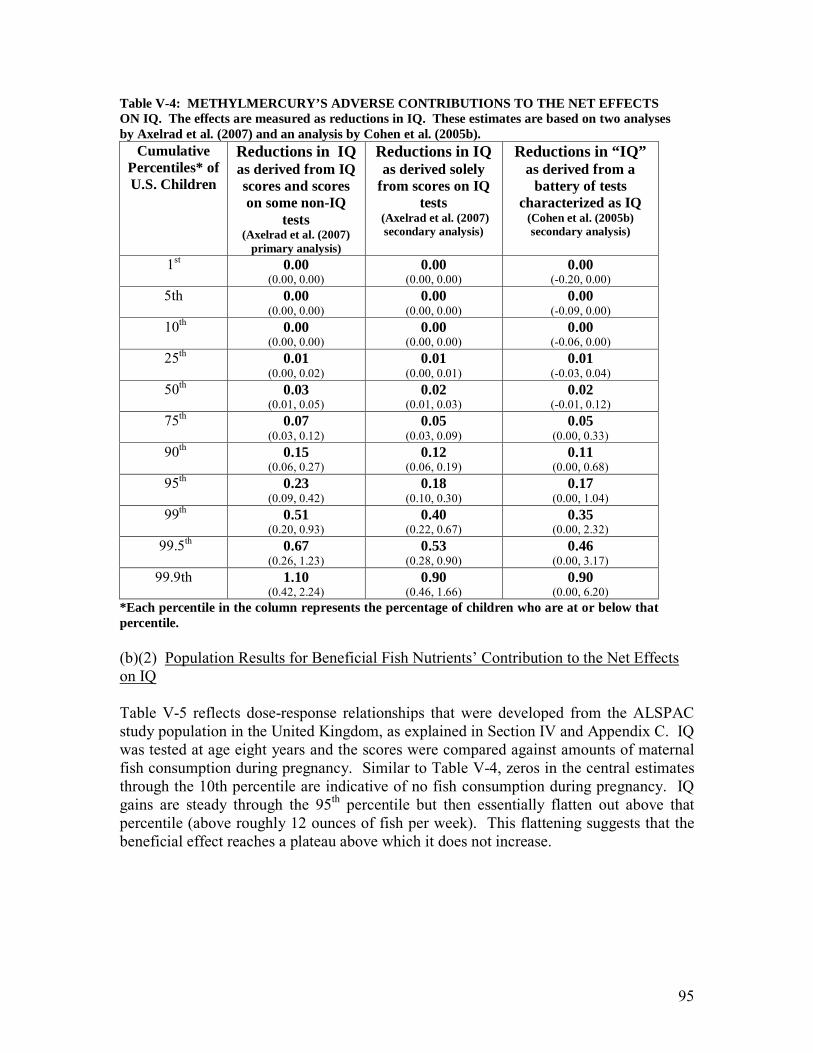
95
Table V-4: METHYLMERCURY’S ADVERSE CONTRIBUTIONS TO THE NET EFFECTS ON IQ. The effects are measured as reductions in IQ. These estimates are based on two analyses by Axelrad et al. (2007) and an analysis by Cohen et al. (2005b).
Cumulative Percentiles* of U.S. Children
Reductions in IQ as derived from IQ scores and scores on some non-IQ
tests (Axelrad et al. (2007)
primary analysis)
Reductions in IQ as derived solely
from scores on IQ tests
(Axelrad et al. (2007) secondary analysis)
Reductions in “IQ” as derived from a
battery of tests characterized as IQ
(Cohen et al. (2005b) secondary analysis)
1st 0.00 (0.00, 0.00)
0.00 (0.00, 0.00)
0.00 (-0.20, 0.00)
5th 0.00 (0.00, 0.00)
0.00 (0.00, 0.00)
0.00 (-0.09, 0.00)
10th 0.00 (0.00, 0.00)
0.00 (0.00, 0.00)
0.00 (-0.06, 0.00)
25th 0.01 (0.00, 0.02)
0.01 (0.00, 0.01)
0.01 (-0.03, 0.04)
50th 0.03 (0.01, 0.05)
0.02 (0.01, 0.03)
0.02 (-0.01, 0.12)
75th 0.07 (0.03, 0.12)
0.05 (0.03, 0.09)
0.05 (0.00, 0.33)
90th 0.15 (0.06, 0.27)
0.12 (0.06, 0.19)
0.11 (0.00, 0.68)
95th 0.23 (0.09, 0.42)
0.18 (0.10, 0.30)
0.17 (0.00, 1.04)
99th 0.51 (0.20, 0.93)
0.40 (0.22, 0.67)
0.35 (0.00, 2.32)
99.5th 0.67 (0.26, 1.23)
0.53 (0.28, 0.90)
0.46 (0.00, 3.17)
99.9th 1.10 (0.42, 2.24)
0.90 (0.46, 1.66)
0.90 (0.00, 6.20)
*Each percentile in the column represents the percentage of children who are at or below that percentile. (b)(2) Population Results for Beneficial Fish Nutrients’ Contribution to the Net Effects on IQ Table V-5 reflects dose-response relationships that were developed from the ALSPAC study population in the United Kingdom, as explained in Section IV and Appendix C. IQ was tested at age eight years and the scores were compared against amounts of maternal fish consumption during pregnancy. Similar to Table V-4, zeros in the central estimates through the 10th percentile are indicative of no fish consumption during pregnancy. IQ gains are steady through the 95th percentile but then essentially flatten out above that percentile (above roughly 12 ounces of fish per week). This flattening suggests that the beneficial effect reaches a plateau above which it does not increase.
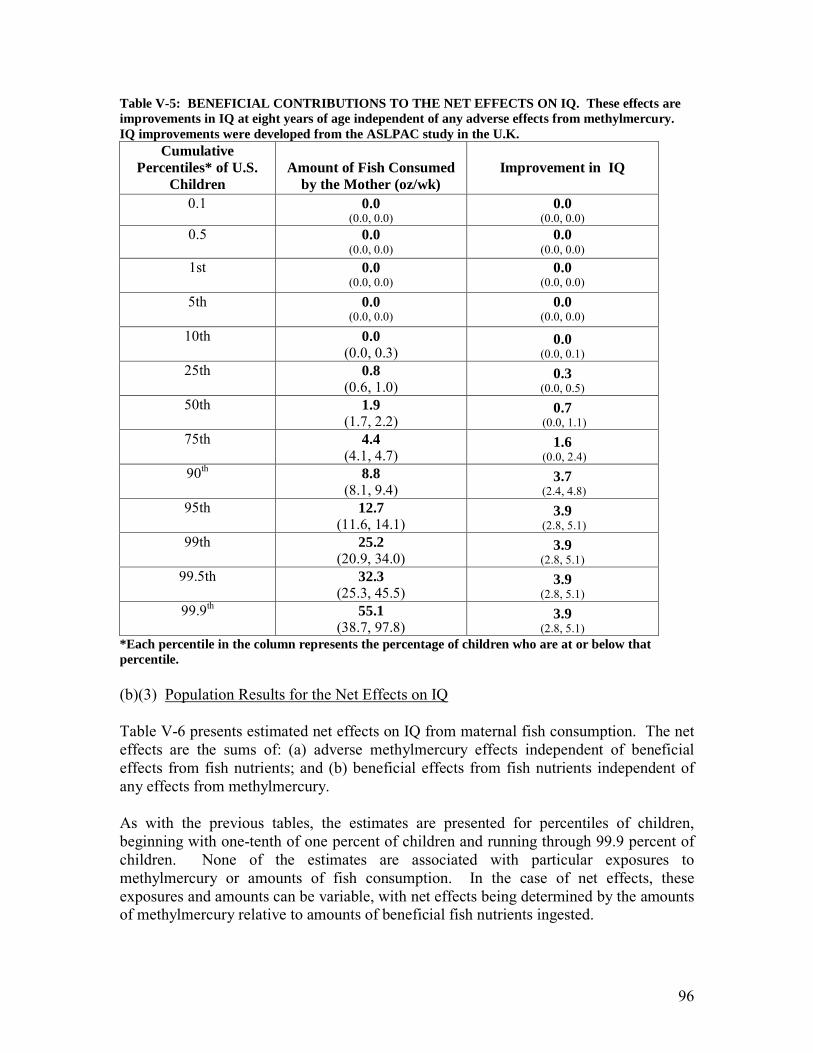
96
Table V-5: BENEFICIAL CONTRIBUTIONS TO THE NET EFFECTS ON IQ. These effects are improvements in IQ at eight years of age independent of any adverse effects from methylmercury. IQ improvements were developed from the ASLPAC study in the U.K.
Cumulative Percentiles* of U.S.
Children
Amount of Fish Consumed
by the Mother (oz/wk)
Improvement in IQ
0.1 0.0
(0.0, 0.0) 0.0
(0.0, 0.0) 0.5
0.0
(0.0, 0.0) 0.0
(0.0, 0.0) 1st
0.0
(0.0, 0.0) 0.0
(0.0, 0.0)
5th
0.0 (0.0, 0.0)
0.0 (0.0, 0.0)
10th
0.0 (0.0, 0.3)
0.0 (0.0, 0.1)
25th
0.8 (0.6, 1.0)
0.3 (0.0, 0.5)
50th
1.9 (1.7, 2.2)
0.7 (0.0, 1.1)
75th
4.4 (4.1, 4.7)
1.6 (0.0, 2.4)
90th 8.8 (8.1, 9.4)
3.7 (2.4, 4.8)
95th
12.7 (11.6, 14.1)
3.9 (2.8, 5.1)
99th
25.2 (20.9, 34.0)
3.9 (2.8, 5.1)
99.5th
32.3 (25.3, 45.5)
3.9 (2.8, 5.1)
99.9th
55.1 (38.7, 97.8)
3.9 (2.8, 5.1)
*Each percentile in the column represents the percentage of children who are at or below that percentile. (b)(3) Population Results for the Net Effects on IQ Table V-6 presents estimated net effects on IQ from maternal fish consumption. The net effects are the sums of: (a) adverse methylmercury effects independent of beneficial effects from fish nutrients; and (b) beneficial effects from fish nutrients independent of any effects from methylmercury. As with the previous tables, the estimates are presented for percentiles of children, beginning with one-tenth of one percent of children and running through 99.9 percent of children. None of the estimates are associated with particular exposures to methylmercury or amounts of fish consumption. In the case of net effects, these exposures and amounts can be variable, with net effects being determined by the amounts of methylmercury relative to amounts of beneficial fish nutrients ingested.
97
The table contains two sets of estimates for the net effects. In one of these, the methylmercury effects are derived from results on tests that constitute IQ as administered in the Seychelles Islands, the Faroe Islands, and New Zealand (Axelrad et al., 2007 secondary analysis). In the other estimate, the methylmercury effects are derived from results on tests that constitute IQ plus some non-IQ tests from these locations (Axelrad et al., 2007 primary analysis). The latter produced estimates that are somewhat more adverse than those based solely on IQ results. The estimates for the adverse methylmercury effects derived solely from IQ results provide a match with the estimates we used for the beneficial fish nutrients effects that are also derived solely from IQ results. Because they both represent IQ and nothing more, the resulting dose-response function for net effects is not likely to be skewed by one function that contains test results not found in the other function. On the other hand, the estimates for the adverse methylmercury effects derived from both IQ and non-IQ results appear to be somewhat more consistent with the size of methylmercury effects measured in other analyses.24
Regardless of which dose-response function is used, Table V-6 shows that most children whose mothers eat fish during pregnancy experience net benefits. As expected, these net benefits are not as large as nutrient benefits independent of methylmercury, as shown in the previous table. The differences reflect adverse contributions from methylmercury. The average net effect across the population is nearly identical for the two estimates, i.e., a gain of 0.67 of an IQ point (0.38, 1.34) when the more adverse methylmercury dose-response function is incorporated into the net effects and a gain of 0.69 of an IQ point (0.39, 1.37) when the less adverse function is incorporated. The greatest gains are also nearly the same, i.e., 3.46 IQ points (2.60, 4.62) when the more adverse function is incorporated and 3.49 IQ points (2.68, 4.63) when the less adverse function is incorporated. The remaining net benefits are similarly close. The highest three population percentiles show slight increases in net beneficial effects even though in the previous table the beneficial effects independent of methylmercury did not increase for all practical purposes at those percentiles. These increases can be explained by variations in methylmercury exposures within those population percentiles. Less methylmercury exposure would cause net beneficial effects to increase even if the beneficial contribution to the net effect remained constant. The most notable difference between the two sets of estimates is in the percentages of children likely to be experiencing net adverse effects. When the less adverse methylmercury function is used, central estimates of adverse net effects occur through one percent of children. When the more adverse methylmercury function is used, the central estimates for adverse net effects extend though five percent of children. For both sets of estimates the net adverse effects are similar in size, ranging from -0.01 of an IQ point (-0.16, 0.00) to -0.05 of an IQ point (-0.56, 0.00). 24 See Section IV for a discussion on this point. As a caveat, this consistency depends on how the measurement is made.

98
The most obvious cause for net adverse effects would be substantial consumption of high methylmercury fish by some women. A less obvious cause could also be very low maternal fish consumption. The evidence for this possibility comes from slightly adverse results at very low consumption in data from the ALSPAC study in the United Kingdom (as shown in Figure C-17 in Appendix C) that were incorporated into the modeling. That data suggest that beneficial effects might not begin until consumption is beyond some minimal level, e.g., three ounces per week. If that is so, the only influence on net effects below that level would be methylmercury (assuming that methylmercury has no threshold of effect). Figures D-3 through D-6 in Appendix D show net effect dose-response functions for a number of fish that are slightly adverse before becoming beneficial. Adverse net effects though five percent of children become more plausible under a combination of very low fish consumption by many women and plus substantial consumption of high methylmercury fish by some women. It is worth noting that under both estimates there is a small possibility of adverse net effects through as much as 50 percent of children, as indicated by the negative numbers in the confidence intervals. Given the relatively low market shares for the species highest in methylmercury (see Table II-1 in Section II), very low fish consumption by many women would seem the most likely explanation for any adverse net effects that might be occurring through 50 percent of the population. Conversely, the confidence intervals include zero through 75 percent of children, indicating a small possibility of no adverse net effects at all, for any reason, within the population. No adverse effects would most likely be due to a threshold of effect for methylmercury, below which it is not toxic. For that to be true, the slightly adverse effects seen at very low consumption in the ALSPAC data would have to be due to some other cause. Our assessment includes a small possibility of a threshold of effect, but for the most part, it “leans” toward the absence of any threshold. Adverse effects from methylmercury at U.S. levels of exposure are more likely than not in our assessment. It is also worth noting that because the model covers 99.9 percent of U.S. children, it does not capture adverse net effects that may be occurring at the most extreme exposures to methylmercury or the most extreme levels of fish consumption (the highest one-tenth of one percent of the population). We assume that adverse net effects are also occurring in this subpopulation.
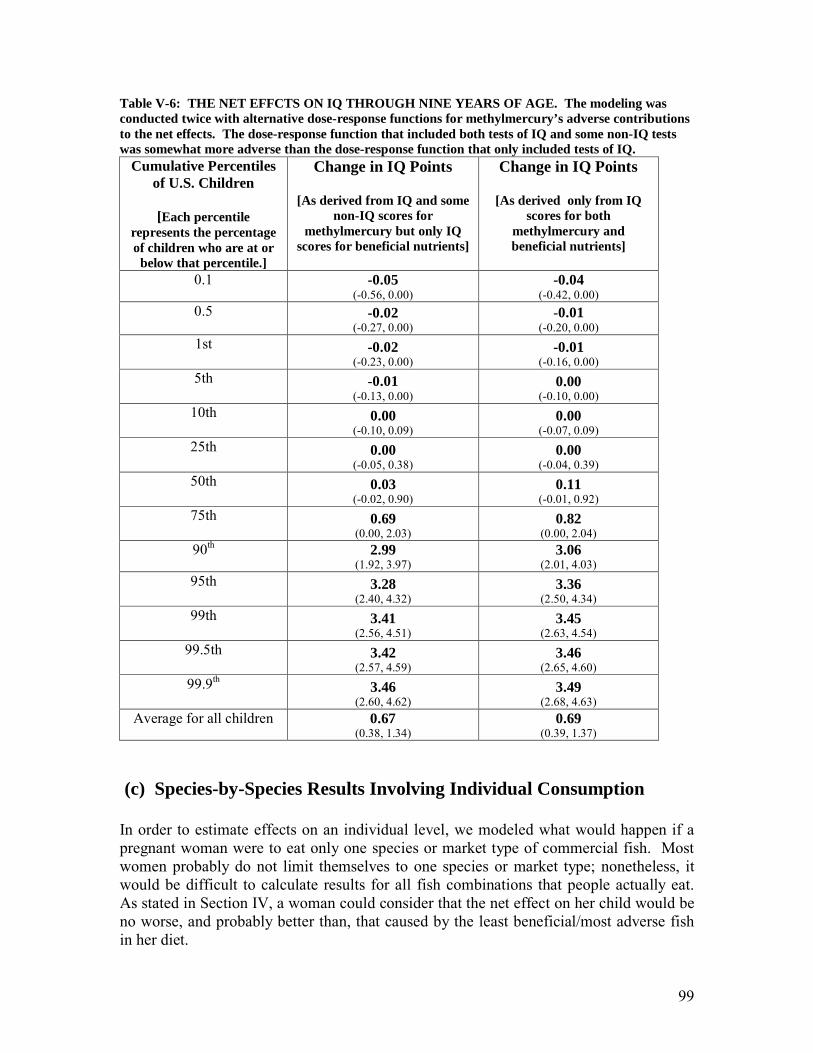
99
Table V-6: THE NET EFFCTS ON IQ THROUGH NINE YEARS OF AGE. The modeling was conducted twice with alternative dose-response functions for methylmercury’s adverse contributions to the net effects. The dose-response function that included both tests of IQ and some non-IQ tests was somewhat more adverse than the dose-response function that only included tests of IQ.
Cumulative Percentiles of U.S. Children
[Each percentile
represents the percentage of children who are at or
below that percentile.]
Change in IQ Points
[As derived from IQ and some non-IQ scores for
methylmercury but only IQ scores for beneficial nutrients]
Change in IQ Points
[As derived only from IQ scores for both
methylmercury and beneficial nutrients]
0.1 -0.05 (-0.56, 0.00)
-0.04 (-0.42, 0.00)
0.5
-0.02 (-0.27, 0.00)
-0.01 (-0.20, 0.00)
1st
-0.02 (-0.23, 0.00)
-0.01 (-0.16, 0.00)
5th
-0.01 (-0.13, 0.00)
0.00 (-0.10, 0.00)
10th
0.00 (-0.10, 0.09)
0.00 (-0.07, 0.09)
25th
0.00 (-0.05, 0.38)
0.00 (-0.04, 0.39)
50th
0.03 (-0.02, 0.90)
0.11 (-0.01, 0.92)
75th
0.69 (0.00, 2.03)
0.82 (0.00, 2.04)
90th 2.99 (1.92, 3.97)
3.06 (2.01, 4.03)
95th
3.28 (2.40, 4.32)
3.36 (2.50, 4.34)
99th
3.41 (2.56, 4.51)
3.45 (2.63, 4.54)
99.5th
3.42 (2.57, 4.59)
3.46 (2.65, 4.60)
99.9th
3.46 (2.60, 4.62)
3.49 (2.68, 4.63)
Average for all children 0.67 (0.38, 1.34)
0.69 (0.39, 1.37)
(c) Species-by-Species Results Involving Individual Consumption In order to estimate effects on an individual level, we modeled what would happen if a pregnant woman were to eat only one species or market type of commercial fish. Most women probably do not limit themselves to one species or market type; nonetheless, it would be difficult to calculate results for all fish combinations that people actually eat. As stated in Section IV, a woman could consider that the net effect on her child would be no worse, and probably better than, that caused by the least beneficial/most adverse fish in her diet.
100
For each commercial fish species and market type that we modeled, we calculated three data points: 1. The amount that a pregnant woman would have to eat per week in order to provide
to her child the neurodevelopmental benefit obtainable from that species or market type. The assessment estimates that the beneficial effect is larger than the adverse methylmercury effect at relatively low levels of fish consumption and exposures to methylmercury. Consequently, for most species, a relatively low amount per week is likely to be net beneficial.
2. The size of the maximum beneficial effect obtainable from each species and market
type, expressed as a gain in some number of IQ points. 3. The amount that a pregnant woman would have to eat per week for the net effect on
her child to be adverse. When consumption exceeds the amount per week needed to achieve a maximum beneficial effect, the net benefit declines until it is eventually replaced by a net adverse effect. This decline occurs because the adverse methylmercury effect continues to increase while the beneficial effect no longer increases once it reaches a plateau.
Figures D-3 through D-9 in Appendix D provide a visualization of these effects (i.e., they provide the dose-response functions for the net effects) for selected species of fish. The species-by-species modeling assumes that the mother is average in terms of biological variability.25 It also assumes that, over time, the methylmercury in the species being consumed by an individual will achieve the mean concentration for that species. It also incorporates the more adverse of the two dose-response functions for methylmercury that was developed by Axelrad et al. (2007). (See the primary analysis in Table V-4.) Tables V-7 and V-8 present the results for IQ. Results for early and later age verbal development are presented for comparison purposes in Appendix A. Each table contains entries for 47 selected26 commercial fish species and market types, listed in descending order of mean methylmercury concentration. Table V-7 assumes all fish are “packages” of nutrients that are alike in terms of benefits conveyed. Table V-8 assumes the omega-3 fatty acids eicosapentaenoic acid (EPA) and docosahexanoic acid (DHA) convey the beneficial effect. In the latter modeling, all fish are not alike in terms of benefits because they vary in their omega-3 content.
25 The population-level estimates provided previously differ in that respect in that they include variations in sensitivity to methylmercury. For that reason there is a slight difference in the greatest possible beneficial net effects occurring within the population and the greatest possible beneficial net effects in these species-by-species tables. 26 Certain fish that are primarily recreationally caught were not included in these tables although they may be occasionally sold in commerce, i.e., freshwater perch, freshwater bass, pike, and marlin.
101
The mean methylmercury concentrations shown in Tables V-7 and V-8 are uncooked values derived from the FDA database. However, both the methylmercury and omega-3 concentrations used in this assessment reflect concentrations after cooking. (The omega-3 values in Table V-8 are cooked values from the U.S. Department of Agriculture database.) To calculate methylmercury concentrations for cooked fish, we applied correction factors to the uncooked methylmercury concentrations to account for water loss during cooking. The application of correction factors is described in Appendix C, subsection (a)(1); the correction factors themselves are presented in Table C-3, and the methylmercury concentrations after application of these correction factors, i.e., after cooking, are also presented in Table C-3. In Table V-7, all 47 fish and market types are estimated to be net beneficial when consumed in amounts per week that are not unusually high (central estimates). The amounts per week that provide the most benefit for each species fall within a range of eight to 10 ounces per week (central estimates). The confidence intervals for these estimates also fall within a narrow range of seven to 14 ounces per week, with the exception of tilefish from the Gulf of Mexico. For this fish the confidence interval contains a small possibility that it might not be beneficial at any amount. The mean amount per week that provides the most benefit for all species is 9.1 ounces per week. The size of the largest benefit that can be provided by an individual species ranges from a low of 1.4 IQ points for tilefish from the Gulf of Mexico (95% C.I. of 0.0 – 2.7 IQ points) to a high of 3.3 IQ points for five species. The mean largest benefit for all species together is 3 IQ points. For the top 10 species by market share (see Table II-1 in Section II), the mean is 3.2 IQ points. As stated previously, when consumption exceeds an amount needed to obtain the maximum possible benefit, the size of the net benefit starts to decline due to increasing exposure to methylmercury. If enough fish are consumed, the beneficial net effect can be replaced by an adverse net effect. When fish are assumed to be identical “packages” of nutrients in Table V-7, the fish currently recommended for avoidance (shark, swordfish, king mackerel, and tilefish from the Gulf of Mexico) require the least amount of consumption to reach a net adverse effect, from 16 ounces per week ((95% C.I. of 0 – 30 oz/wk) to 32 ounces per week (95% C.I. of 16 – 59 oz/wk).27 These amounts are between the 95th and 99.5th percentiles for fish consumption generally. There is a small 27 In the New Zealand research study, in which the population ate a considerable amount of shark, evidence for adverse effects was reported in a “high exposure” group that ate more than three fish meals per week. More than three fish meals could have been as low as 16 ounces per week for some people (four servings times a minimum of four ounces per serving). By contrast, in our species-by-species modeling for shark, the central estimate for the number of ounces per week needed for the net effect to become adverse is 25 (although the confidence intervals include the lesser possibilities that it could be as low as 13 and as high as 47 ounces per week). The apparent discrepancy between our central estimate of 25 ounces per week and adverse effects that could have been as low as 16 ounces per week as reported from the New Zealand study can be explained in one of two ways. First, our lower confidence limit of 13 ounces per week extends through the lowest possible consumption of 16 ounces per week in New Zealand. Second, the adverse effects seen in New Zealand may have actually been declines in the size of net beneficial effects due to consumption in excess of optimum amounts. These declines would have been due to increasing exposures to methylmercury without any further increases in benefits.

102
possibility, as indicated by the confidence limits, that Gulf tilefish convey no benefit are immediately adverse. All other species and market types are estimated to require higher amounts before they become net adverse. In Table V-8, when omega-3 fatty acids are assumed to be solely responsible for the beneficial effect, all fish are estimated to convey a beneficial net effect at relatively low levels of fish consumption with the exception of orange roughy. This fish is estimated to provide little or no beneficial effect and is immediately adverse for all practical purposes. Orange roughy has the fifth highest mean concentration of methylmercury of all commercial species but almost no omega-3 fatty acids. With orange roughy excluded, the mean amount needed to achieve a maximum benefit is 12.5 ounces per week while the size of that maximum benefit ranges from 2.1 IQ points (95th C.I. of 0.8 – 3.0 ounces/week) to 3.3 IQ points for five fish. The mean maximum benefit with orange roughy excluded is 3 IQ points. The differences between the results in Tables V-7 and V-8 for any given fish depend on whether the fish is above or below average in its omega-3 fatty acid content. A fish that is above average will reach its maximum net benefit with less weekly consumption than if it were a “package” of nutrients identical to all other fish in that regard. It will also have a larger maximum net benefit. The amount needed to become net adverse will not be different, however, when omega-3 fatty acids are the sole source of the beneficial effect and when the fish is a “package” of nutrients. These differences, and the lack of difference for becoming net adverse, are explained as follows:
• The size of the beneficial contribution to the net effect is the same regardless of cause: In this modeling, the beneficial contribution to the net effect (as distinguished from a beneficial net effect, which is a sum of beneficial and adverse contributions) is assumed to reach the same maximum size for each fish regardless whether omega-3 fatty acids are the sole source of the beneficial contribution or whether fish are identical “packages” of nutrients. This assumption is attributable to the fact that the same data were used to model the beneficial contribution from omega-3 fatty acids and from fish as identical “packages” of nutrients. Those data came from studies in which developmental test scores were compared against amounts of fish consumed during pregnancy. We assume that the results of these studies provide a reasonably accurate dose-response function for the beneficial contribution to the net effect regardless of its underlying cause, whether omega-3 fatty acids alone or a “package” of nutrients. As described below, this assumption is germane to the differences between ounces per week to reach maximum benefit and size of maximum benefit as well as to the lack of difference between ounces per week to become net adverse.
• Differences between ounces per week to reach maximum benefit: Even though the size of the maximum beneficial contribution to the net effect is assumed to be the same for all fish, those fish that are relatively high in omega-3 fatty acids will

103
require less consumption per week to reach it than fish that are relatively low in omega-3 fatty acids. This is because the response (i.e., the beneficial contribution to the net effect) is dependent on dose (i.e., the amount of omega-3 fatty acids). The greater the dose, i.e., the concentration of omega-3 fatty acids, the less fish are needed to obtain the same beneficial response. Consequently, those fish will require less consumption per week to reach the maximum benefit than fish than when the same fish are deemed to be “packages” of nutrients that are identical to all other fish. Conversely, fish that are relatively low in omega-3 fatty acids will require more consumption per week to reach their maximum beneficial contribution to the net effect than those same fish when they are deemed to be “packages” of nutrients. These differences are reflected in the third column in Table V-7 as compared to the fourth column in Table V-8.
• Differences between size of the maximum benefit: When a maximum beneficial
contribution to the net effect is reached sooner due to relatively high omega-3 fatty acid content, the methylmercury effect is less than it would have been if more fish had been needed to reach that maximum effect. Less consumption means less methylmercury in this circumstance. As a consequence, the size of the beneficial net effect is larger than it would be if more fish had been needed. Thus, in Table V-8, a fish that is relatively high in omega-3 fatty acids will have a larger maximum net benefit than the same fish when a “package” of nutrients is deemed to be the cause of the benefit in Table V-7. Conversely, a fish that is relatively low in omega-3 fatty acids will have a smaller maximum net beneficial effect than the same fish when a “package” of nutrients is deemed to be the cause. More fish will have been needed to achieve it, thus increasing the exposure to methylmercury from that fish.
• Same amounts needed to become net adverse: In most cases, the amount of fish per week needed to become net adverse is dependent on: (a) the size of the beneficial contribution to the net effect; and (b) the amount of methylmercury in the fish. In any given fish these are the same when omega-3 fatty acids are deemed to be the sole source of the beneficial effect and when the fish is deemed to be a “package” of nutrients identical to all other fish (see the first bullet above). An exception would be a fish like orange roughy when omega-3 fatty acids are the sole source of the beneficial effect. For orange roughy, a net adverse effect is estimated to occur before the maximum benefit is achieved. Consequently, when omega-3 fatty acids are the sole source of the benefit, the ounces per week to become adverse is zero, as compared to 41 (21, 76) ounces per week when fish are identical “packages” of nutrients.
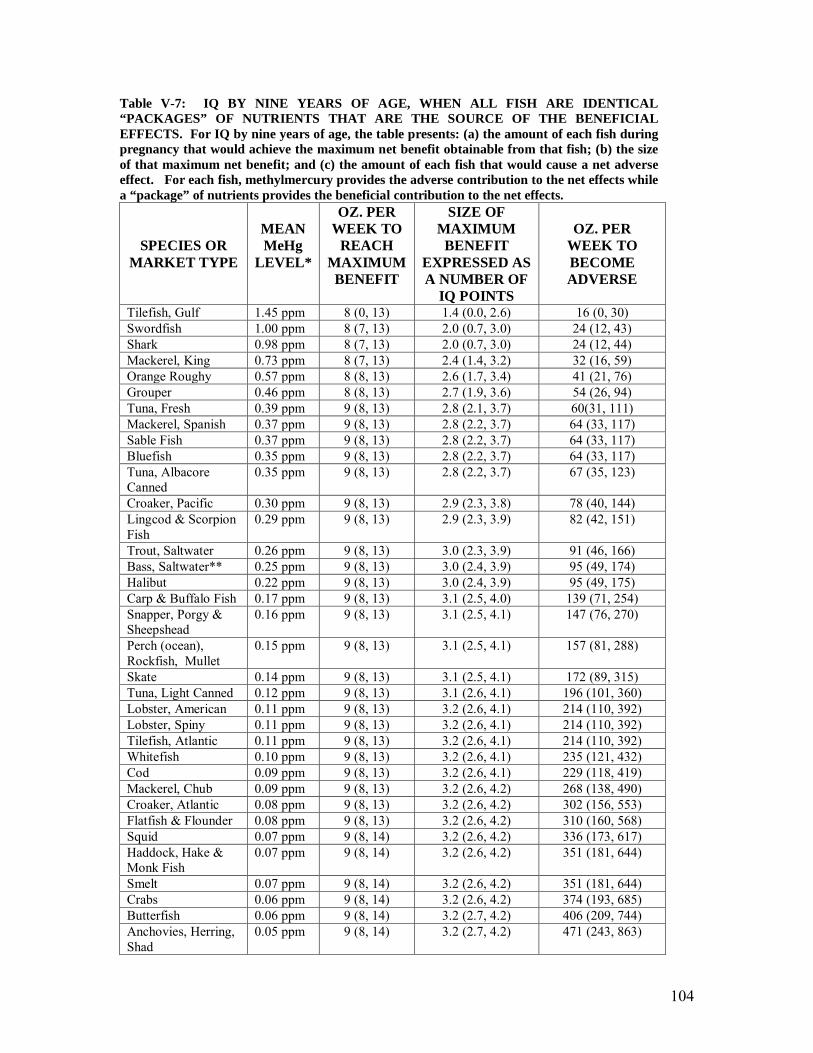
104
Table V-7: IQ BY NINE YEARS OF AGE, WHEN ALL FISH ARE IDENTICAL “PACKAGES” OF NUTRIENTS THAT ARE THE SOURCE OF THE BENEFICIAL EFFECTS. For IQ by nine years of age, the table presents: (a) the amount of each fish during pregnancy that would achieve the maximum net benefit obtainable from that fish; (b) the size of that maximum net benefit; and (c) the amount of each fish that would cause a net adverse effect. For each fish, methylmercury provides the adverse contribution to the net effects while a “package” of nutrients provides the beneficial contribution to the net effects.
SPECIES OR MARKET TYPE
MEAN MeHg
LEVEL*
OZ. PER WEEK TO
REACH MAXIMUM BENEFIT
SIZE OF MAXIMUM
BENEFIT EXPRESSED AS A NUMBER OF
IQ POINTS
OZ. PER
WEEK TO BECOME ADVERSE
Tilefish, Gulf 1.45 ppm 8 (0, 13) 1.4 (0.0, 2.6) 16 (0, 30) Swordfish 1.00 ppm 8 (7, 13) 2.0 (0.7, 3.0) 24 (12, 43) Shark 0.98 ppm 8 (7, 13) 2.0 (0.7, 3.0) 24 (12, 44) Mackerel, King 0.73 ppm 8 (7, 13) 2.4 (1.4, 3.2) 32 (16, 59) Orange Roughy 0.57 ppm 8 (8, 13) 2.6 (1.7, 3.4) 41 (21, 76) Grouper 0.46 ppm 8 (8, 13) 2.7 (1.9, 3.6) 54 (26, 94) Tuna, Fresh 0.39 ppm 9 (8, 13) 2.8 (2.1, 3.7) 60(31, 111) Mackerel, Spanish 0.37 ppm 9 (8, 13) 2.8 (2.2, 3.7) 64 (33, 117) Sable Fish 0.37 ppm 9 (8, 13) 2.8 (2.2, 3.7) 64 (33, 117) Bluefish 0.35 ppm 9 (8, 13) 2.8 (2.2, 3.7) 64 (33, 117) Tuna, Albacore Canned
0.35 ppm 9 (8, 13) 2.8 (2.2, 3.7) 67 (35, 123)
Croaker, Pacific 0.30 ppm 9 (8, 13) 2.9 (2.3, 3.8) 78 (40, 144) Lingcod & Scorpion Fish
0.29 ppm 9 (8, 13) 2.9 (2.3, 3.9) 82 (42, 151)
Trout, Saltwater 0.26 ppm 9 (8, 13) 3.0 (2.3, 3.9) 91 (46, 166) Bass, Saltwater** 0.25 ppm 9 (8, 13) 3.0 (2.4, 3.9) 95 (49, 174) Halibut 0.22 ppm 9 (8, 13) 3.0 (2.4, 3.9) 95 (49, 175) Carp & Buffalo Fish 0.17 ppm 9 (8, 13) 3.1 (2.5, 4.0) 139 (71, 254) Snapper, Porgy & Sheepshead
0.16 ppm 9 (8, 13) 3.1 (2.5, 4.1) 147 (76, 270)
Perch (ocean), Rockfish, Mullet
0.15 ppm 9 (8, 13) 3.1 (2.5, 4.1) 157 (81, 288)
Skate 0.14 ppm 9 (8, 13) 3.1 (2.5, 4.1) 172 (89, 315) Tuna, Light Canned 0.12 ppm 9 (8, 13) 3.1 (2.6, 4.1) 196 (101, 360) Lobster, American 0.11 ppm 9 (8, 13) 3.2 (2.6, 4.1) 214 (110, 392) Lobster, Spiny 0.11 ppm 9 (8, 13) 3.2 (2.6, 4.1) 214 (110, 392) Tilefish, Atlantic 0.11 ppm 9 (8, 13) 3.2 (2.6, 4.1) 214 (110, 392) Whitefish 0.10 ppm 9 (8, 13) 3.2 (2.6, 4.1) 235 (121, 432) Cod 0.09 ppm 9 (8, 13) 3.2 (2.6, 4.1) 229 (118, 419) Mackerel, Chub 0.09 ppm 9 (8, 13) 3.2 (2.6, 4.2) 268 (138, 490) Croaker, Atlantic 0.08 ppm 9 (8, 13) 3.2 (2.6, 4.2) 302 (156, 553) Flatfish & Flounder 0.08 ppm 9 (8, 13) 3.2 (2.6, 4.2) 310 (160, 568) Squid 0.07 ppm 9 (8, 14) 3.2 (2.6, 4.2) 336 (173, 617) Haddock, Hake & Monk Fish
0.07 ppm 9 (8, 14) 3.2 (2.6, 4.2) 351 (181, 644)
Smelt 0.07 ppm 9 (8, 14) 3.2 (2.6, 4.2) 351 (181, 644) Crabs 0.06 ppm 9 (8, 14) 3.2 (2.6, 4.2) 374 (193, 685) Butterfish 0.06 ppm 9 (8, 14) 3.2 (2.7, 4.2) 406 (209, 744) Anchovies, Herring, Shad
0.05 ppm 9 (8, 14) 3.2 (2.7, 4.2) 471 (243, 863)
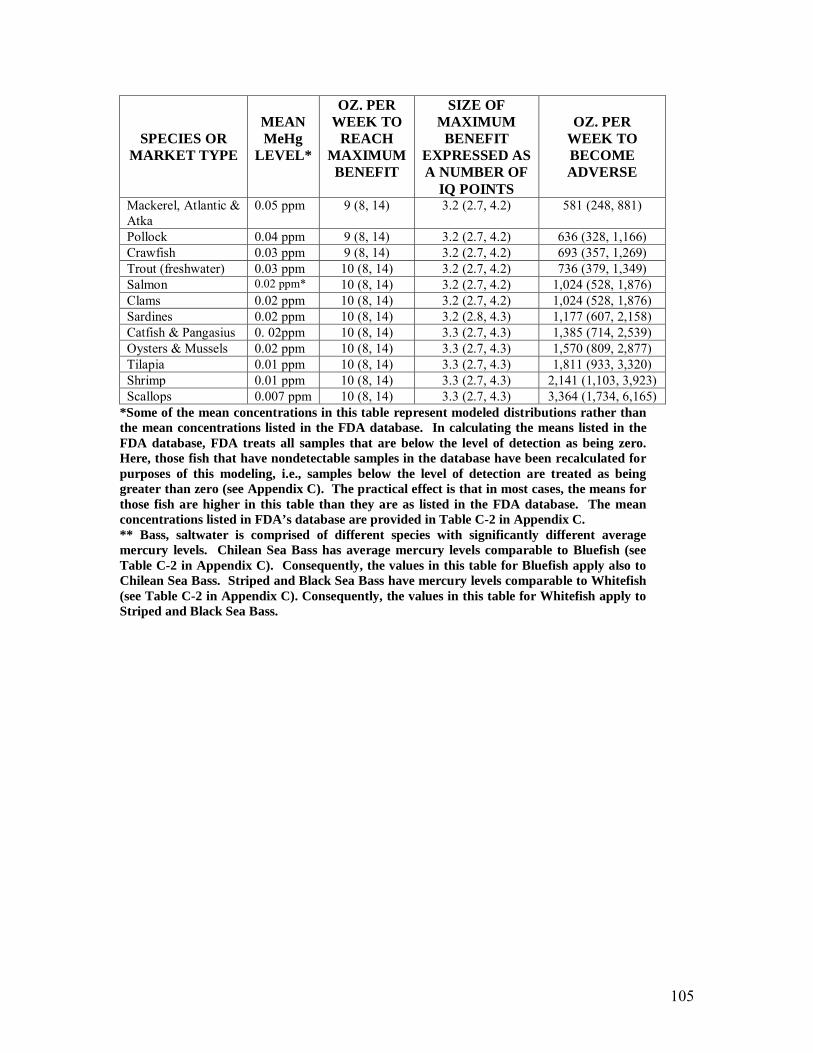
105
SPECIES OR MARKET TYPE
MEAN MeHg
LEVEL*
OZ. PER WEEK TO
REACH MAXIMUM BENEFIT
SIZE OF MAXIMUM
BENEFIT EXPRESSED AS A NUMBER OF
IQ POINTS
OZ. PER
WEEK TO BECOME ADVERSE
Mackerel, Atlantic & Atka
0.05 ppm 9 (8, 14) 3.2 (2.7, 4.2) 581 (248, 881)
Pollock 0.04 ppm 9 (8, 14) 3.2 (2.7, 4.2) 636 (328, 1,166) Crawfish 0.03 ppm 9 (8, 14) 3.2 (2.7, 4.2) 693 (357, 1,269) Trout (freshwater) 0.03 ppm 10 (8, 14) 3.2 (2.7, 4.2) 736 (379, 1,349) Salmon 0.02 ppm* 10 (8, 14) 3.2 (2.7, 4.2) 1,024 (528, 1,876) Clams 0.02 ppm 10 (8, 14) 3.2 (2.7, 4.2) 1,024 (528, 1,876) Sardines 0.02 ppm 10 (8, 14) 3.2 (2.8, 4.3) 1,177 (607, 2,158) Catfish & Pangasius 0. 02ppm 10 (8, 14) 3.3 (2.7, 4.3) 1,385 (714, 2,539) Oysters & Mussels 0.02 ppm 10 (8, 14) 3.3 (2.7, 4.3) 1,570 (809, 2,877) Tilapia 0.01 ppm 10 (8, 14) 3.3 (2.7, 4.3) 1,811 (933, 3,320) Shrimp 0.01 ppm 10 (8, 14) 3.3 (2.7, 4.3) 2,141 (1,103, 3,923) Scallops 0.007 ppm 10 (8, 14) 3.3 (2.7, 4.3) 3,364 (1,734, 6,165)
*Some of the mean concentrations in this table represent modeled distributions rather than the mean concentrations listed in the FDA database. In calculating the means listed in the FDA database, FDA treats all samples that are below the level of detection as being zero. Here, those fish that have nondetectable samples in the database have been recalculated for purposes of this modeling, i.e., samples below the level of detection are treated as being greater than zero (see Appendix C). The practical effect is that in most cases, the means for those fish are higher in this table than they are as listed in the FDA database. The mean concentrations listed in FDA’s database are provided in Table C-2 in Appendix C. ** Bass, saltwater is comprised of different species with significantly different average mercury levels. Chilean Sea Bass has average mercury levels comparable to Bluefish (see Table C-2 in Appendix C). Consequently, the values in this table for Bluefish apply also to Chilean Sea Bass. Striped and Black Sea Bass have mercury levels comparable to Whitefish (see Table C-2 in Appendix C). Consequently, the values in this table for Whitefish apply to Striped and Black Sea Bass.
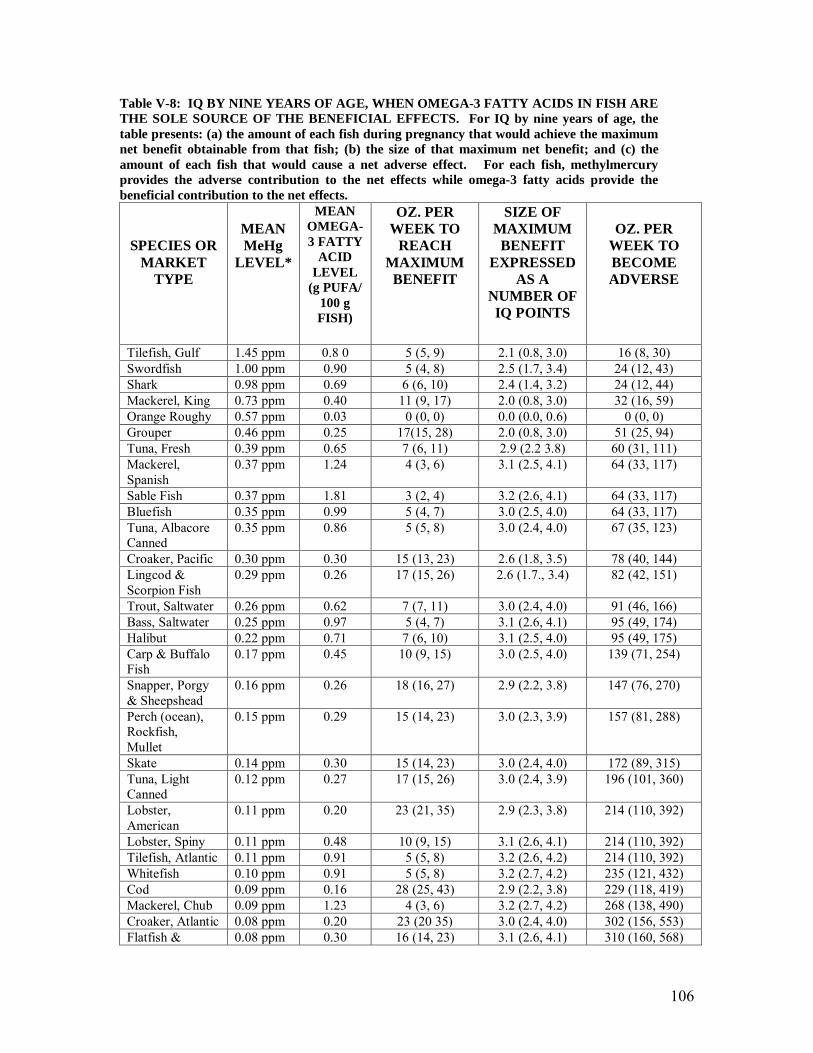
106
Table V-8: IQ BY NINE YEARS OF AGE, WHEN OMEGA-3 FATTY ACIDS IN FISH ARE THE SOLE SOURCE OF THE BENEFICIAL EFFECTS. For IQ by nine years of age, the table presents: (a) the amount of each fish during pregnancy that would achieve the maximum net benefit obtainable from that fish; (b) the size of that maximum net benefit; and (c) the amount of each fish that would cause a net adverse effect. For each fish, methylmercury provides the adverse contribution to the net effects while omega-3 fatty acids provide the beneficial contribution to the net effects.
SPECIES OR MARKET
TYPE
MEAN MeHg
LEVEL*
MEAN OMEGA-3 FATTY
ACID LEVEL
(g PUFA/ 100 g FISH)
OZ. PER WEEK TO
REACH MAXIMUM
BENEFIT
SIZE OF MAXIMUM
BENEFIT EXPRESSED
AS A NUMBER OF IQ POINTS
OZ. PER
WEEK TO BECOME ADVERSE
Tilefish, Gulf 1.45 ppm 0.8 0 5 (5, 9) 2.1 (0.8, 3.0) 16 (8, 30) Swordfish 1.00 ppm 0.90 5 (4, 8) 2.5 (1.7, 3.4) 24 (12, 43) Shark 0.98 ppm 0.69 6 (6, 10) 2.4 (1.4, 3.2) 24 (12, 44) Mackerel, King 0.73 ppm 0.40 11 (9, 17) 2.0 (0.8, 3.0) 32 (16, 59) Orange Roughy 0.57 ppm 0.03 0 (0, 0) 0.0 (0.0, 0.6) 0 (0, 0) Grouper 0.46 ppm 0.25 17(15, 28) 2.0 (0.8, 3.0) 51 (25, 94) Tuna, Fresh 0.39 ppm 0.65 7 (6, 11) 2.9 (2.2 3.8) 60 (31, 111) Mackerel, Spanish
0.37 ppm 1.24 4 (3, 6) 3.1 (2.5, 4.1) 64 (33, 117)
Sable Fish 0.37 ppm 1.81 3 (2, 4) 3.2 (2.6, 4.1) 64 (33, 117) Bluefish 0.35 ppm 0.99 5 (4, 7) 3.0 (2.5, 4.0) 64 (33, 117) Tuna, Albacore Canned
0.35 ppm 0.86 5 (5, 8) 3.0 (2.4, 4.0) 67 (35, 123)
Croaker, Pacific 0.30 ppm 0.30 15 (13, 23) 2.6 (1.8, 3.5) 78 (40, 144) Lingcod & Scorpion Fish
0.29 ppm 0.26 17 (15, 26) 2.6 (1.7., 3.4) 82 (42, 151)
Trout, Saltwater 0.26 ppm 0.62 7 (7, 11) 3.0 (2.4, 4.0) 91 (46, 166) Bass, Saltwater 0.25 ppm 0.97 5 (4, 7) 3.1 (2.6, 4.1) 95 (49, 174) Halibut 0.22 ppm 0.71 7 (6, 10) 3.1 (2.5, 4.0) 95 (49, 175) Carp & Buffalo Fish
0.17 ppm 0.45 10 (9, 15) 3.0 (2.5, 4.0) 139 (71, 254)
Snapper, Porgy & Sheepshead
0.16 ppm 0.26 18 (16, 27) 2.9 (2.2, 3.8) 147 (76, 270)
Perch (ocean), Rockfish, Mullet
0.15 ppm 0.29 15 (14, 23) 3.0 (2.3, 3.9) 157 (81, 288)
Skate 0.14 ppm 0.30 15 (14, 23) 3.0 (2.4, 4.0) 172 (89, 315) Tuna, Light Canned
0.12 ppm 0.27 17 (15, 26) 3.0 (2.4, 3.9) 196 (101, 360)
Lobster, American
0.11 ppm 0.20 23 (21, 35) 2.9 (2.3, 3.8) 214 (110, 392)
Lobster, Spiny 0.11 ppm 0.48 10 (9, 15) 3.1 (2.6, 4.1) 214 (110, 392) Tilefish, Atlantic 0.11 ppm 0.91 5 (5, 8) 3.2 (2.6, 4.2) 214 (110, 392) Whitefish 0.10 ppm 0.91 5 (5, 8) 3.2 (2.7, 4.2) 235 (121, 432) Cod 0.09 ppm 0.16 28 (25, 43) 2.9 (2.2, 3.8) 229 (118, 419) Mackerel, Chub 0.09 ppm 1.23 4 (3, 6) 3.2 (2.7, 4.2) 268 (138, 490) Croaker, Atlantic 0.08 ppm 0.20 23 (20 35) 3.0 (2.4, 4.0) 302 (156, 553) Flatfish & 0.08 ppm 0.30 16 (14, 23) 3.1 (2.6, 4.1) 310 (160, 568)
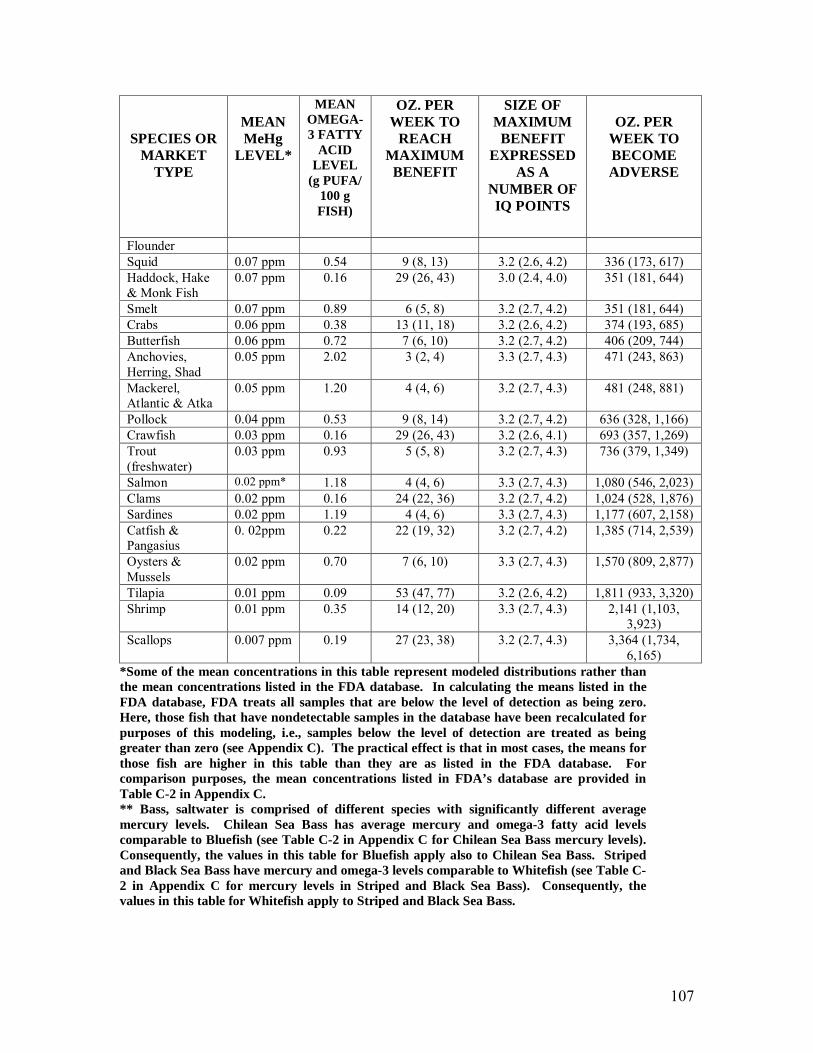
107
SPECIES OR MARKET
TYPE
MEAN MeHg
LEVEL*
MEAN OMEGA-3 FATTY
ACID LEVEL
(g PUFA/ 100 g FISH)
OZ. PER WEEK TO
REACH MAXIMUM
BENEFIT
SIZE OF MAXIMUM
BENEFIT EXPRESSED
AS A NUMBER OF IQ POINTS
OZ. PER
WEEK TO BECOME ADVERSE
Flounder Squid 0.07 ppm 0.54 9 (8, 13) 3.2 (2.6, 4.2) 336 (173, 617) Haddock, Hake & Monk Fish
0.07 ppm 0.16 29 (26, 43) 3.0 (2.4, 4.0) 351 (181, 644)
Smelt 0.07 ppm 0.89 6 (5, 8) 3.2 (2.7, 4.2) 351 (181, 644) Crabs 0.06 ppm 0.38 13 (11, 18) 3.2 (2.6, 4.2) 374 (193, 685) Butterfish 0.06 ppm 0.72 7 (6, 10) 3.2 (2.7, 4.2) 406 (209, 744) Anchovies, Herring, Shad
0.05 ppm 2.02 3 (2, 4) 3.3 (2.7, 4.3) 471 (243, 863)
Mackerel, Atlantic & Atka
0.05 ppm 1.20 4 (4, 6) 3.2 (2.7, 4.3) 481 (248, 881)
Pollock 0.04 ppm 0.53 9 (8, 14) 3.2 (2.7, 4.2) 636 (328, 1,166) Crawfish 0.03 ppm 0.16 29 (26, 43) 3.2 (2.6, 4.1) 693 (357, 1,269) Trout (freshwater)
0.03 ppm 0.93 5 (5, 8) 3.2 (2.7, 4.3) 736 (379, 1,349)
Salmon 0.02 ppm* 1.18 4 (4, 6) 3.3 (2.7, 4.3) 1,080 (546, 2,023) Clams 0.02 ppm 0.16 24 (22, 36) 3.2 (2.7, 4.2) 1,024 (528, 1,876) Sardines 0.02 ppm 1.19 4 (4, 6) 3.3 (2.7, 4.3) 1,177 (607, 2,158) Catfish & Pangasius
0. 02ppm 0.22 22 (19, 32) 3.2 (2.7, 4.2) 1,385 (714, 2,539)
Oysters & Mussels
0.02 ppm 0.70 7 (6, 10) 3.3 (2.7, 4.3) 1,570 (809, 2,877)
Tilapia 0.01 ppm 0.09 53 (47, 77) 3.2 (2.6, 4.2) 1,811 (933, 3,320) Shrimp 0.01 ppm 0.35 14 (12, 20) 3.3 (2.7, 4.3) 2,141 (1,103,
3,923) Scallops 0.007 ppm 0.19 27 (23, 38) 3.2 (2.7, 4.3) 3,364 (1,734,
6,165) *Some of the mean concentrations in this table represent modeled distributions rather than the mean concentrations listed in the FDA database. In calculating the means listed in the FDA database, FDA treats all samples that are below the level of detection as being zero. Here, those fish that have nondetectable samples in the database have been recalculated for purposes of this modeling, i.e., samples below the level of detection are treated as being greater than zero (see Appendix C). The practical effect is that in most cases, the means for those fish are higher in this table than they are as listed in the FDA database. For comparison purposes, the mean concentrations listed in FDA’s database are provided in Table C-2 in Appendix C. ** Bass, saltwater is comprised of different species with significantly different average mercury levels. Chilean Sea Bass has average mercury and omega-3 fatty acid levels comparable to Bluefish (see Table C-2 in Appendix C for Chilean Sea Bass mercury levels). Consequently, the values in this table for Bluefish apply also to Chilean Sea Bass. Striped and Black Sea Bass have mercury and omega-3 levels comparable to Whitefish (see Table C-2 in Appendix C for mercury levels in Striped and Black Sea Bass). Consequently, the values in this table for Whitefish apply to Striped and Black Sea Bass.
108
(d) Sensitivity Analyses (d)(1) Population Results for the Net Effects on IQ When Omega-3 Fatty Acids are the Sole Source of the Beneficial Effect Fish presents a “package” that includes lean protein, omegta-3 fatty acids, selenium, and other minerals and nutrients. In order to capture this “package,” we modeled beneficial contributions to the net effects from studies involving fish consumption rather than studies involving any individual nutrient. These studies primarily compared quantity of fish consumed during pregnancy to children’s neurodevelopmental test scores. As a consequence, our modeling produced dose-response functions for the beneficial contributions to the net effects from fish generally, without distinguishing among species. Thus, our primary population-level modeling in Section V(b) treats all fish the same in terms of their beneficial contributions to the net effects on fetal neurodevelopment, i.e., they each convey identical beneficial effects from identical “packages” of nutrients. We acknowledge the uncertainty in an assumption that all commercial fish are alike in this respect. To examine the significance of this uncertainty for our modeling results, we performed a sensitivity analysis in which we assumed that the omega-3 fatty acids eicosapentaenoic acid (EPA) and docosahexanoic acid (DHA) in fish provide the beneficial effect. As can be seen in Table V-9, below, the differences in the population-level results when fish are assumed to be identical “packages” of nutrients and when omega-3 fatty acids are assumed to be the sole source of the beneficial effect from fish are not substantial, although the omega-3 results are slightly more adverse and less beneficial. This difference probably results from the popularity of some fish, such as shrimp, that are relatively low in omega-3 fatty acids and thus require considerable consumption to obtain as much omega-3 fatty acids as can be obtained from less consumption of other fish. In any case, since either assumption produces similar results, we would not regard either assumption as a major source of modeling uncertainty for population-level results.
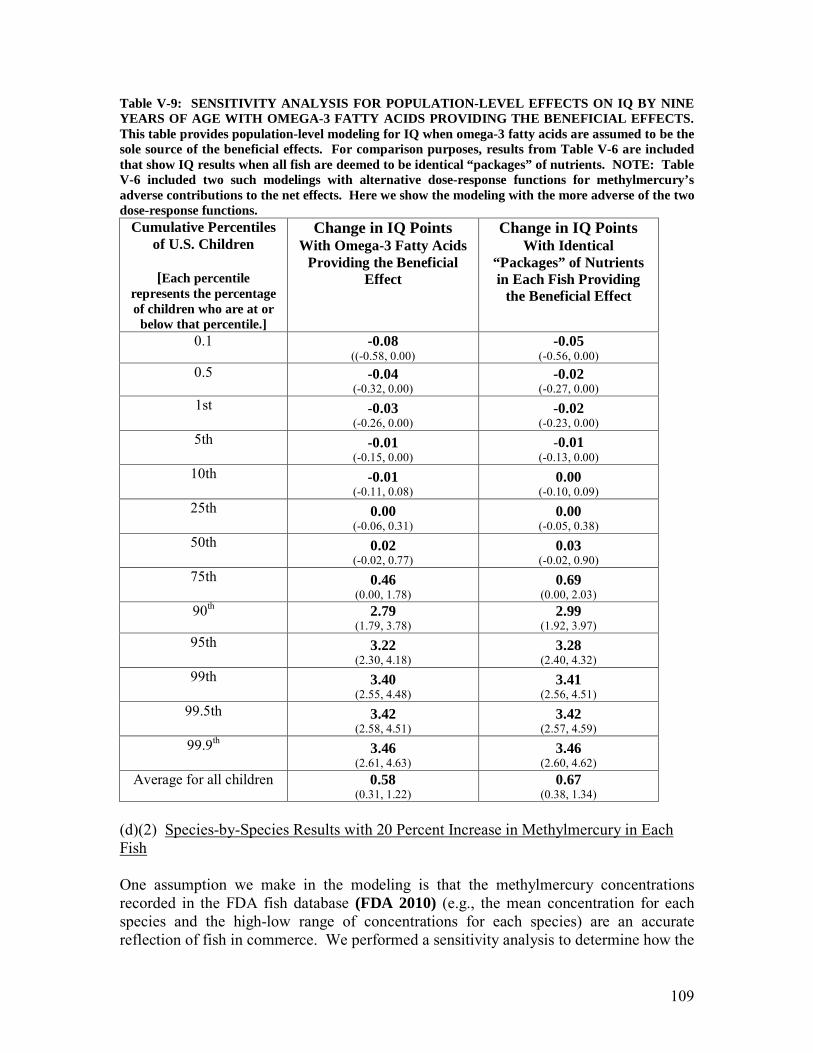
109
Table V-9: SENSITIVITY ANALYSIS FOR POPULATION-LEVEL EFFECTS ON IQ BY NINE YEARS OF AGE WITH OMEGA-3 FATTY ACIDS PROVIDING THE BENEFICIAL EFFECTS. This table provides population-level modeling for IQ when omega-3 fatty acids are assumed to be the sole source of the beneficial effects. For comparison purposes, results from Table V-6 are included that show IQ results when all fish are deemed to be identical “packages” of nutrients. NOTE: Table V-6 included two such modelings with alternative dose-response functions for methylmercury’s adverse contributions to the net effects. Here we show the modeling with the more adverse of the two dose-response functions.
Cumulative Percentiles of U.S. Children
[Each percentile
represents the percentage of children who are at or
below that percentile.]
Change in IQ Points With Omega-3 Fatty Acids
Providing the Beneficial Effect
Change in IQ Points With Identical
“Packages” of Nutrients in Each Fish Providing
the Beneficial Effect
0.1 -0.08 ((-0.58, 0.00)
-0.05 (-0.56, 0.00)
0.5
-0.04 (-0.32, 0.00)
-0.02 (-0.27, 0.00)
1st
-0.03 (-0.26, 0.00)
-0.02 (-0.23, 0.00)
5th
-0.01 (-0.15, 0.00)
-0.01 (-0.13, 0.00)
10th
-0.01 (-0.11, 0.08)
0.00 (-0.10, 0.09)
25th
0.00 (-0.06, 0.31)
0.00 (-0.05, 0.38)
50th
0.02 (-0.02, 0.77)
0.03 (-0.02, 0.90)
75th
0.46 (0.00, 1.78)
0.69 (0.00, 2.03)
90th 2.79 (1.79, 3.78)
2.99 (1.92, 3.97)
95th
3.22 (2.30, 4.18)
3.28 (2.40, 4.32)
99th
3.40 (2.55, 4.48)
3.41 (2.56, 4.51)
99.5th
3.42 (2.58, 4.51)
3.42 (2.57, 4.59)
99.9th
3.46 (2.61, 4.63)
3.46 (2.60, 4.62)
Average for all children 0.58 (0.31, 1.22)
0.67 (0.38, 1.34)
(d)(2) Species-by-Species Results with 20 Percent Increase in Methylmercury in Each Fish One assumption we make in the modeling is that the methylmercury concentrations recorded in the FDA fish database (FDA 2010) (e.g., the mean concentration for each species and the high-low range of concentrations for each species) are an accurate reflection of fish in commerce. We performed a sensitivity analysis to determine how the
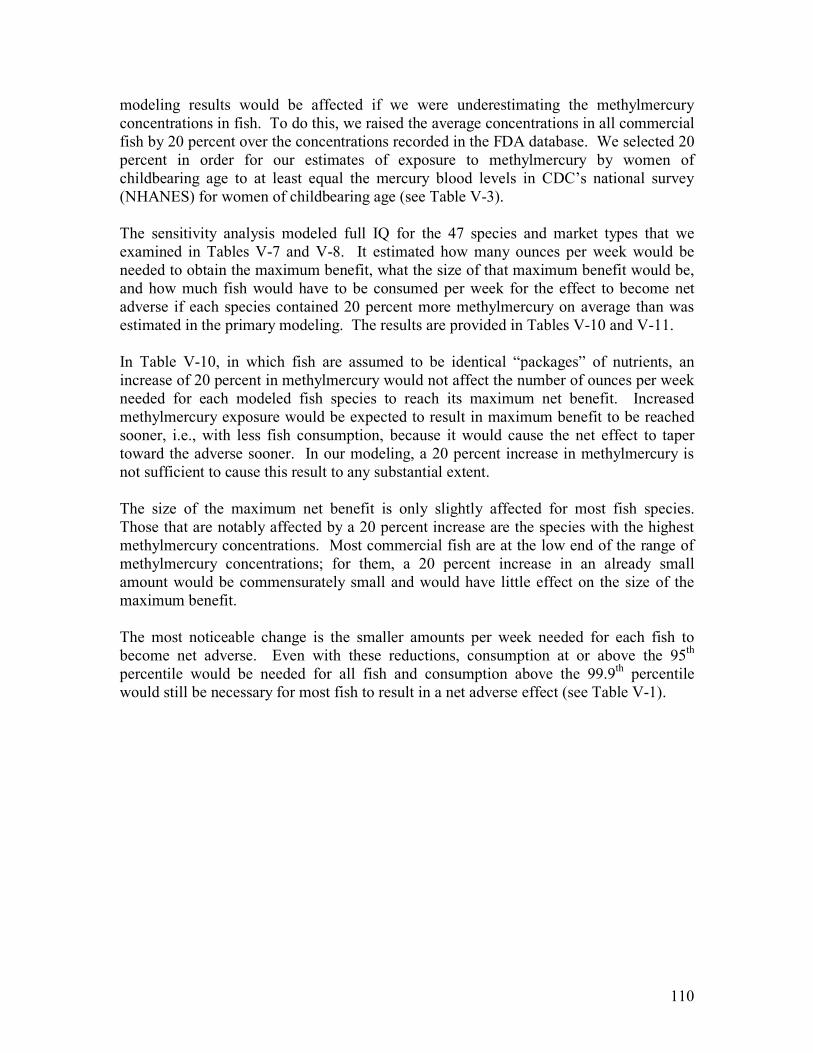
110
modeling results would be affected if we were underestimating the methylmercury concentrations in fish. To do this, we raised the average concentrations in all commercial fish by 20 percent over the concentrations recorded in the FDA database. We selected 20 percent in order for our estimates of exposure to methylmercury by women of childbearing age to at least equal the mercury blood levels in CDC’s national survey (NHANES) for women of childbearing age (see Table V-3). The sensitivity analysis modeled full IQ for the 47 species and market types that we examined in Tables V-7 and V-8. It estimated how many ounces per week would be needed to obtain the maximum benefit, what the size of that maximum benefit would be, and how much fish would have to be consumed per week for the effect to become net adverse if each species contained 20 percent more methylmercury on average than was estimated in the primary modeling. The results are provided in Tables V-10 and V-11. In Table V-10, in which fish are assumed to be identical “packages” of nutrients, an increase of 20 percent in methylmercury would not affect the number of ounces per week needed for each modeled fish species to reach its maximum net benefit. Increased methylmercury exposure would be expected to result in maximum benefit to be reached sooner, i.e., with less fish consumption, because it would cause the net effect to taper toward the adverse sooner. In our modeling, a 20 percent increase in methylmercury is not sufficient to cause this result to any substantial extent. The size of the maximum net benefit is only slightly affected for most fish species. Those that are notably affected by a 20 percent increase are the species with the highest methylmercury concentrations. Most commercial fish are at the low end of the range of methylmercury concentrations; for them, a 20 percent increase in an already small amount would be commensurately small and would have little effect on the size of the maximum benefit. The most noticeable change is the smaller amounts per week needed for each fish to become net adverse. Even with these reductions, consumption at or above the 95th
percentile would be needed for all fish and consumption above the 99.9th percentile would still be necessary for most fish to result in a net adverse effect (see Table V-1).
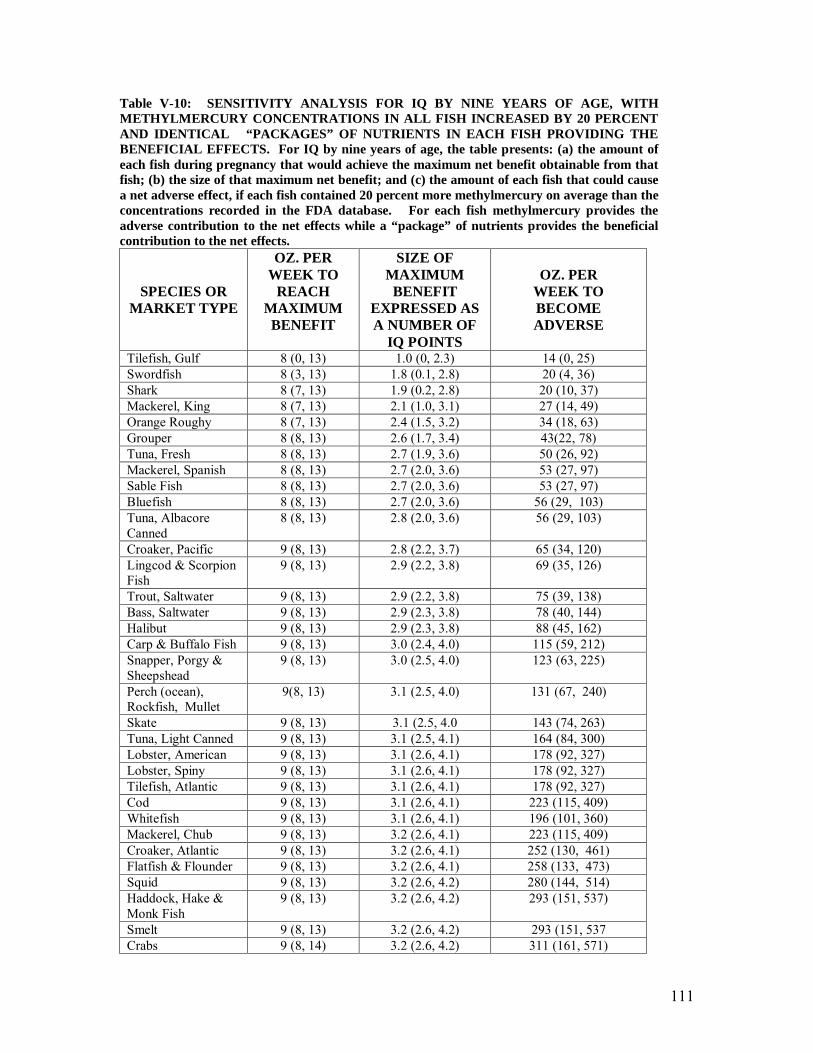
111
Table V-10: SENSITIVITY ANALYSIS FOR IQ BY NINE YEARS OF AGE, WITH METHYLMERCURY CONCENTRATIONS IN ALL FISH INCREASED BY 20 PERCENT AND IDENTICAL “PACKAGES” OF NUTRIENTS IN EACH FISH PROVIDING THE BENEFICIAL EFFECTS. For IQ by nine years of age, the table presents: (a) the amount of each fish during pregnancy that would achieve the maximum net benefit obtainable from that fish; (b) the size of that maximum net benefit; and (c) the amount of each fish that could cause a net adverse effect, if each fish contained 20 percent more methylmercury on average than the concentrations recorded in the FDA database. For each fish methylmercury provides the adverse contribution to the net effects while a “package” of nutrients provides the beneficial contribution to the net effects.
SPECIES OR MARKET TYPE
OZ. PER WEEK TO
REACH MAXIMUM BENEFIT
SIZE OF MAXIMUM
BENEFIT EXPRESSED AS A NUMBER OF
IQ POINTS
OZ. PER
WEEK TO BECOME ADVERSE
Tilefish, Gulf 8 (0, 13) 1.0 (0, 2.3) 14 (0, 25) Swordfish 8 (3, 13) 1.8 (0.1, 2.8) 20 (4, 36) Shark 8 (7, 13) 1.9 (0.2, 2.8) 20 (10, 37) Mackerel, King 8 (7, 13) 2.1 (1.0, 3.1) 27 (14, 49) Orange Roughy 8 (7, 13) 2.4 (1.5, 3.2) 34 (18, 63) Grouper 8 (8, 13) 2.6 (1.7, 3.4) 43(22, 78) Tuna, Fresh 8 (8, 13) 2.7 (1.9, 3.6) 50 (26, 92) Mackerel, Spanish 8 (8, 13) 2.7 (2.0, 3.6) 53 (27, 97) Sable Fish 8 (8, 13) 2.7 (2.0, 3.6) 53 (27, 97) Bluefish 8 (8, 13) 2.7 (2.0, 3.6) 56 (29, 103) Tuna, Albacore Canned
8 (8, 13) 2.8 (2.0, 3.6) 56 (29, 103)
Croaker, Pacific 9 (8, 13) 2.8 (2.2, 3.7) 65 (34, 120) Lingcod & Scorpion Fish
9 (8, 13) 2.9 (2.2, 3.8) 69 (35, 126)
Trout, Saltwater 9 (8, 13) 2.9 (2.2, 3.8) 75 (39, 138) Bass, Saltwater 9 (8, 13) 2.9 (2.3, 3.8) 78 (40, 144) Halibut 9 (8, 13) 2.9 (2.3, 3.8) 88 (45, 162) Carp & Buffalo Fish 9 (8, 13) 3.0 (2.4, 4.0) 115 (59, 212) Snapper, Porgy & Sheepshead
9 (8, 13) 3.0 (2.5, 4.0) 123 (63, 225)
Perch (ocean), Rockfish, Mullet
9(8, 13) 3.1 (2.5, 4.0) 131 (67, 240)
Skate 9 (8, 13) 3.1 (2.5, 4.0 143 (74, 263) Tuna, Light Canned 9 (8, 13) 3.1 (2.5, 4.1) 164 (84, 300) Lobster, American 9 (8, 13) 3.1 (2.6, 4.1) 178 (92, 327) Lobster, Spiny 9 (8, 13) 3.1 (2.6, 4.1) 178 (92, 327) Tilefish, Atlantic 9 (8, 13) 3.1 (2.6, 4.1) 178 (92, 327) Cod 9 (8, 13) 3.1 (2.6, 4.1) 223 (115, 409) Whitefish 9 (8, 13) 3.1 (2.6, 4.1) 196 (101, 360) Mackerel, Chub 9 (8, 13) 3.2 (2.6, 4.1) 223 (115, 409) Croaker, Atlantic 9 (8, 13) 3.2 (2.6, 4.1) 252 (130, 461) Flatfish & Flounder 9 (8, 13) 3.2 (2.6, 4.1) 258 (133, 473) Squid 9 (8, 13) 3.2 (2.6, 4.2) 280 (144, 514) Haddock, Hake & Monk Fish
9 (8, 13) 3.2 (2.6, 4.2) 293 (151, 537)
Smelt 9 (8, 13) 3.2 (2.6, 4.2) 293 (151, 537 Crabs 9 (8, 14) 3.2 (2.6, 4.2) 311 (161, 571)
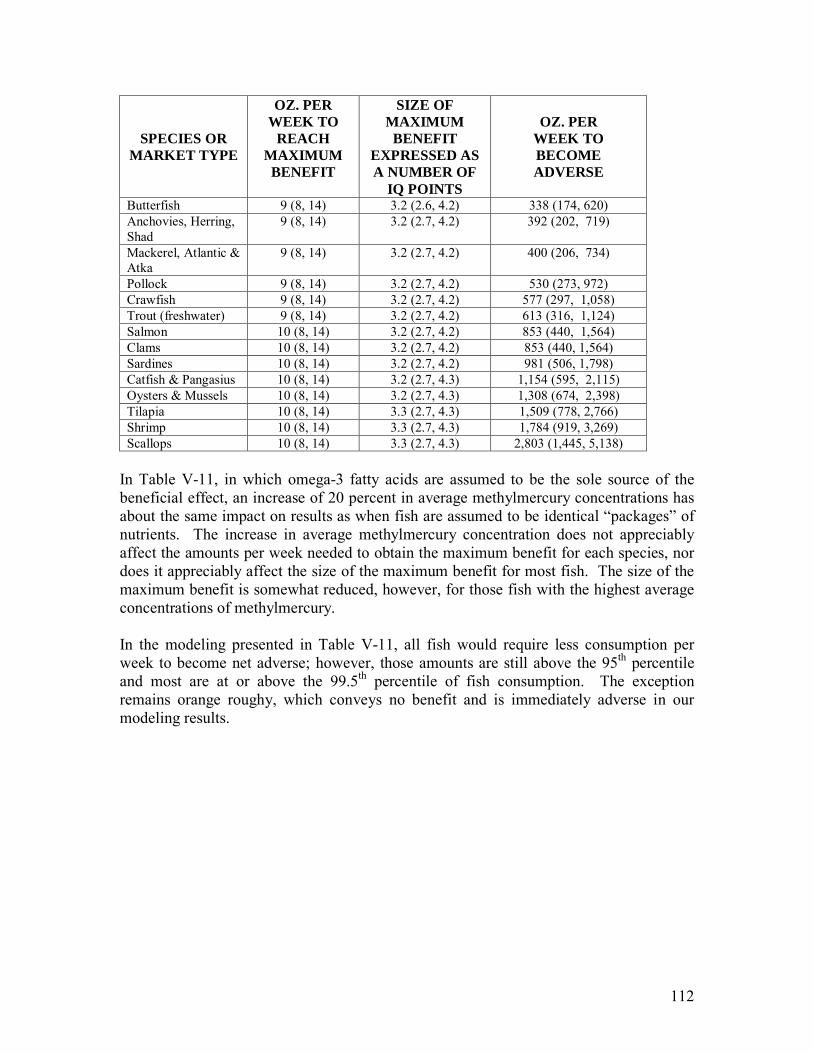
112
SPECIES OR MARKET TYPE
OZ. PER WEEK TO
REACH MAXIMUM BENEFIT
SIZE OF MAXIMUM
BENEFIT EXPRESSED AS A NUMBER OF
IQ POINTS
OZ. PER
WEEK TO BECOME ADVERSE
Butterfish 9 (8, 14) 3.2 (2.6, 4.2) 338 (174, 620) Anchovies, Herring, Shad
9 (8, 14) 3.2 (2.7, 4.2) 392 (202, 719)
Mackerel, Atlantic & Atka
9 (8, 14) 3.2 (2.7, 4.2) 400 (206, 734)
Pollock 9 (8, 14) 3.2 (2.7, 4.2) 530 (273, 972) Crawfish 9 (8, 14) 3.2 (2.7, 4.2) 577 (297, 1,058) Trout (freshwater) 9 (8, 14) 3.2 (2.7, 4.2) 613 (316, 1,124) Salmon 10 (8, 14) 3.2 (2.7, 4.2) 853 (440, 1,564) Clams 10 (8, 14) 3.2 (2.7, 4.2) 853 (440, 1,564) Sardines 10 (8, 14) 3.2 (2.7, 4.2) 981 (506, 1,798) Catfish & Pangasius 10 (8, 14) 3.2 (2.7, 4.3) 1,154 (595, 2,115) Oysters & Mussels 10 (8, 14) 3.2 (2.7, 4.3) 1,308 (674, 2,398) Tilapia 10 (8, 14) 3.3 (2.7, 4.3) 1,509 (778, 2,766) Shrimp 10 (8, 14) 3.3 (2.7, 4.3) 1,784 (919, 3,269) Scallops 10 (8, 14) 3.3 (2.7, 4.3) 2,803 (1,445, 5,138)
In Table V-11, in which omega-3 fatty acids are assumed to be the sole source of the beneficial effect, an increase of 20 percent in average methylmercury concentrations has about the same impact on results as when fish are assumed to be identical “packages” of nutrients. The increase in average methylmercury concentration does not appreciably affect the amounts per week needed to obtain the maximum benefit for each species, nor does it appreciably affect the size of the maximum benefit for most fish. The size of the maximum benefit is somewhat reduced, however, for those fish with the highest average concentrations of methylmercury. In the modeling presented in Table V-11, all fish would require less consumption per week to become net adverse; however, those amounts are still above the 95th percentile and most are at or above the 99.5th percentile of fish consumption. The exception remains orange roughy, which conveys no benefit and is immediately adverse in our modeling results.
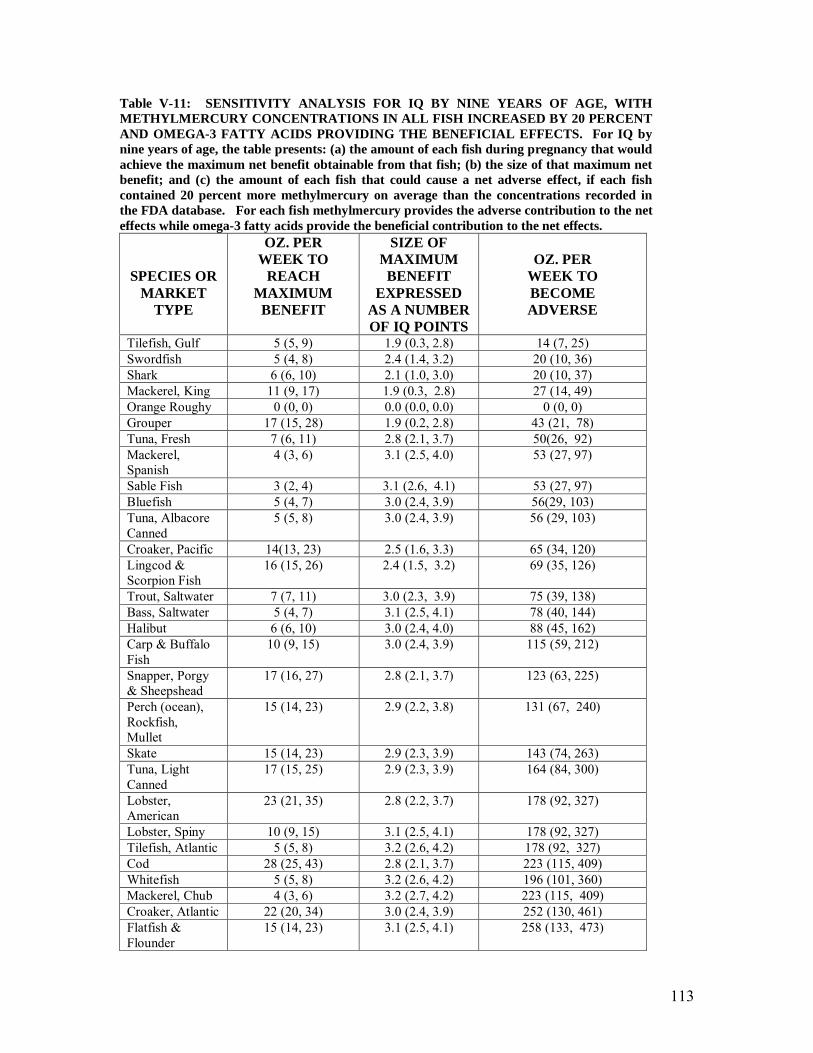
113
Table V-11: SENSITIVITY ANALYSIS FOR IQ BY NINE YEARS OF AGE, WITH METHYLMERCURY CONCENTRATIONS IN ALL FISH INCREASED BY 20 PERCENT AND OMEGA-3 FATTY ACIDS PROVIDING THE BENEFICIAL EFFECTS. For IQ by nine years of age, the table presents: (a) the amount of each fish during pregnancy that would achieve the maximum net benefit obtainable from that fish; (b) the size of that maximum net benefit; and (c) the amount of each fish that could cause a net adverse effect, if each fish contained 20 percent more methylmercury on average than the concentrations recorded in the FDA database. For each fish methylmercury provides the adverse contribution to the net effects while omega-3 fatty acids provide the beneficial contribution to the net effects.
SPECIES OR MARKET
TYPE
OZ. PER WEEK TO
REACH MAXIMUM
BENEFIT
SIZE OF MAXIMUM BENEFIT
EXPRESSED AS A NUMBER OF IQ POINTS
OZ. PER
WEEK TO BECOME ADVERSE
Tilefish, Gulf 5 (5, 9) 1.9 (0.3, 2.8) 14 (7, 25) Swordfish 5 (4, 8) 2.4 (1.4, 3.2) 20 (10, 36) Shark 6 (6, 10) 2.1 (1.0, 3.0) 20 (10, 37) Mackerel, King 11 (9, 17) 1.9 (0.3, 2.8) 27 (14, 49) Orange Roughy 0 (0, 0) 0.0 (0.0, 0.0) 0 (0, 0) Grouper 17 (15, 28) 1.9 (0.2, 2.8) 43 (21, 78) Tuna, Fresh 7 (6, 11) 2.8 (2.1, 3.7) 50(26, 92) Mackerel, Spanish
4 (3, 6) 3.1 (2.5, 4.0) 53 (27, 97)
Sable Fish 3 (2, 4) 3.1 (2.6, 4.1) 53 (27, 97) Bluefish 5 (4, 7) 3.0 (2.4, 3.9) 56(29, 103) Tuna, Albacore Canned
5 (5, 8) 3.0 (2.4, 3.9) 56 (29, 103)
Croaker, Pacific 14(13, 23) 2.5 (1.6, 3.3) 65 (34, 120) Lingcod & Scorpion Fish
16 (15, 26) 2.4 (1.5, 3.2) 69 (35, 126)
Trout, Saltwater 7 (7, 11) 3.0 (2.3, 3.9) 75 (39, 138) Bass, Saltwater 5 (4, 7) 3.1 (2.5, 4.1) 78 (40, 144) Halibut 6 (6, 10) 3.0 (2.4, 4.0) 88 (45, 162) Carp & Buffalo Fish
10 (9, 15) 3.0 (2.4, 3.9) 115 (59, 212)
Snapper, Porgy & Sheepshead
17 (16, 27) 2.8 (2.1, 3.7) 123 (63, 225)
Perch (ocean), Rockfish, Mullet
15 (14, 23) 2.9 (2.2, 3.8) 131 (67, 240)
Skate 15 (14, 23) 2.9 (2.3, 3.9) 143 (74, 263) Tuna, Light Canned
17 (15, 25) 2.9 (2.3, 3.9) 164 (84, 300)
Lobster, American
23 (21, 35) 2.8 (2.2, 3.7) 178 (92, 327)
Lobster, Spiny 10 (9, 15) 3.1 (2.5, 4.1) 178 (92, 327) Tilefish, Atlantic 5 (5, 8) 3.2 (2.6, 4.2) 178 (92, 327) Cod 28 (25, 43) 2.8 (2.1, 3.7) 223 (115, 409) Whitefish 5 (5, 8) 3.2 (2.6, 4.2) 196 (101, 360) Mackerel, Chub 4 (3, 6) 3.2 (2.7, 4.2) 223 (115, 409) Croaker, Atlantic 22 (20, 34) 3.0 (2.4, 3.9) 252 (130, 461) Flatfish & Flounder
15 (14, 23) 3.1 (2.5, 4.1) 258 (133, 473)
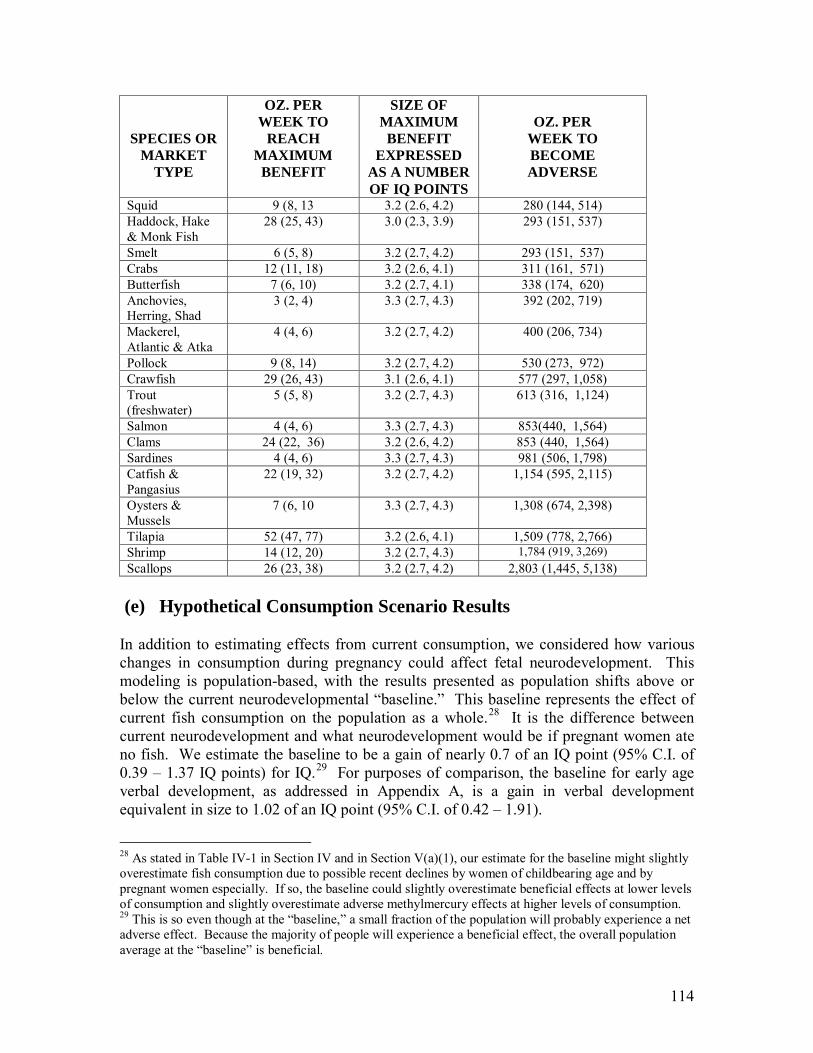
114
SPECIES OR MARKET
TYPE
OZ. PER WEEK TO
REACH MAXIMUM
BENEFIT
SIZE OF MAXIMUM BENEFIT
EXPRESSED AS A NUMBER OF IQ POINTS
OZ. PER
WEEK TO BECOME ADVERSE
Squid 9 (8, 13 3.2 (2.6, 4.2) 280 (144, 514) Haddock, Hake & Monk Fish
28 (25, 43) 3.0 (2.3, 3.9) 293 (151, 537)
Smelt 6 (5, 8) 3.2 (2.7, 4.2) 293 (151, 537) Crabs 12 (11, 18) 3.2 (2.6, 4.1) 311 (161, 571) Butterfish 7 (6, 10) 3.2 (2.7, 4.1) 338 (174, 620) Anchovies, Herring, Shad
3 (2, 4) 3.3 (2.7, 4.3) 392 (202, 719)
Mackerel, Atlantic & Atka
4 (4, 6) 3.2 (2.7, 4.2) 400 (206, 734)
Pollock 9 (8, 14) 3.2 (2.7, 4.2) 530 (273, 972) Crawfish 29 (26, 43) 3.1 (2.6, 4.1) 577 (297, 1,058) Trout (freshwater)
5 (5, 8) 3.2 (2.7, 4.3) 613 (316, 1,124)
Salmon 4 (4, 6) 3.3 (2.7, 4.3) 853(440, 1,564) Clams 24 (22, 36) 3.2 (2.6, 4.2) 853 (440, 1,564) Sardines 4 (4, 6) 3.3 (2.7, 4.3) 981 (506, 1,798) Catfish & Pangasius
22 (19, 32) 3.2 (2.7, 4.2) 1,154 (595, 2,115)
Oysters & Mussels
7 (6, 10 3.3 (2.7, 4.3) 1,308 (674, 2,398)
Tilapia 52 (47, 77) 3.2 (2.6, 4.1) 1,509 (778, 2,766) Shrimp 14 (12, 20) 3.2 (2.7, 4.3) 1,784 (919, 3,269) Scallops 26 (23, 38) 3.2 (2.7, 4.2) 2,803 (1,445, 5,138)
(e) Hypothetical Consumption Scenario Results In addition to estimating effects from current consumption, we considered how various changes in consumption during pregnancy could affect fetal neurodevelopment. This modeling is population-based, with the results presented as population shifts above or below the current neurodevelopmental “baseline.” This baseline represents the effect of current fish consumption on the population as a whole.28 It is the difference between current neurodevelopment and what neurodevelopment would be if pregnant women ate no fish. We estimate the baseline to be a gain of nearly 0.7 of an IQ point (95% C.I. of 0.39 – 1.37 IQ points) for IQ.29 For purposes of comparison, the baseline for early age verbal development, as addressed in Appendix A, is a gain in verbal development equivalent in size to 1.02 of an IQ point (95% C.I. of 0.42 – 1.91).
28 As stated in Table IV-1 in Section IV and in Section V(a)(1), our estimate for the baseline might slightly overestimate fish consumption due to possible recent declines by women of childbearing age and by pregnant women especially. If so, the baseline could slightly overestimate beneficial effects at lower levels of consumption and slightly overestimate adverse methylmercury effects at higher levels of consumption. 29 This is so even though at the “baseline,” a small fraction of the population will probably experience a net adverse effect. Because the majority of people will experience a beneficial effect, the overall population average at the “baseline” is beneficial.
115
We modeled eight scenarios in which pregnant women eat various amounts of fish and/or fish containing certain amounts of methylmercury. For each scenario the result is presented here as a single population shift above or below the baseline. In Appendix D the results for each scenario are broken down into shifts above or below the baseline for various percentages of U.S. children. These percentages start with one-tenth of one percent of children and run through 99.9 percent of children. In each scenario there are individuals who fare better and worse than others. That percentage breakdown helps reveal those differences. In three scenarios, pregnant women eat any amount, including no fish at all, up to a certain maximum amount of fish per week. These maximum amounts are four ounces per week (one scenario) and 12 ounces per week (two scenarios, one of which imposes a restriction on the amount of methylmercury in the fish being consumed). Those who were eating more than these amounts reduce down to them, while everyone else continues to eat the same amounts they were eating before. Because the mean consumption for women of childbearing age is estimated to be 3.7 ounces per week – with evidence that pregnant women eat closer to two ounces per week30 -- a majority of women in each scenario do not have to reduce the amounts they eat. These scenarios essentially examine the population-wide consequences of reducing high-end consumption by a minority of women. In four other scenarios, all pregnant women, including those who otherwise would eat no fish, eat exactly the same amounts of fish during pregnancy. These amounts are four, eight, 12, and 18 ounces per week. To eat exactly these amounts, most women would have to increase their fish consumption while a minority would have to reduce it. The amounts per week are below, close to, and above the optimum consumption levels estimated for most species in the species-by-species modeling presented previously. In an eighth scenario, pregnant women may eat as much or little fish as they want but the mean concentrations in the fish are restricted toward the low end for commercial fish. The results are presented here as effects on full IQ. Results are not provided here for verbal IQ since they are not deemed to be representative of the effect of fish consumption on neurodevelopment generally, but they were calculated and are included in Appendix D. The results for the comparative modeling for early age verbal development are in Appendix A. First Scenario: Pregnant Women Eat No More Than Four Ounces of Fish Per Week. In this scenario, women who consume four ounces or less per week of commercial fish do not alter the amounts or types of fish they eat. Those eating more than four ounces per week reduce their consumption to exactly four ounces, but do not change the types of fish they eat. This scenario causes in a population-wide decline of 0.41 of an IQ point (95% C.I. of 0.22 – 0.63). This decline may be attributed to reductions in fish consumption by those 30 Infant Feeding Practices Study II, 2005-6 (FDA/CDC), involving approximately 1,500 women.
116
who were eating above four ounces per week. For most of these people, this reduction drops them further away from an optimum weekly amount than they were previously consuming. In the species-by-species modeling, the mean optimum amount is around nine ounces per week when all fish are assumed to contain equal “packages” of nutrients that impart identical benefits and somewhat higher when omega-3 fatty acids are assumed to be the sole source of the beneficial effect. For a minority who eat high amounts of high-methylmercury fish, the reduction down to four ounces per week could be beneficial. On a population-wide basis, however, decreases would exceed gains. Second Scenario: Pregnant Women Eat No More Than 12 Ounces of Fish Per Week. In this scenario, women who consume 12 ounces per week or less of commercial fish do not alter the amounts or types of fish they eat; however, those eating more than 12 ounces per week reduce their consumption to exactly 12 ounces, but do not change the types of fish they eat. This scenario results in almost no change in the baseline (there is an extremely slight improvement), primarily because most children are not affected one way or another. Only five percent of pregnant women would have to reduce consumption down to 12 ounces per week. Within this five percent, many children would experience small improvements as a consequence of their mothers’ reduction down toward a more optimum consumption level. Also, children in this group whose mothers reduce their consumption of high-methylmercury fish would also be likely to experience improvements. Third Scenario: Pregnant Women Eat No More Than 12 Ounces of Fish Per Week of Species with Mean Methylmercury Concentrations of 0.23 ppm or Less: This scenario retains the 12 ounce-per-week maximum from the previous scenario but the fish are limited to species and market types with mean concentrations of 0.23 ppm or less. This mean concentration is higher than the average for all commercial fish weighted for consumption (0.072 ppm). A mean concentration of 0.23 ppm includes canned light tuna, which averages 0.12 ppm, as well as cod, both of which are highly popular, but excludes over 20 commercial species, including canned albacore tuna and fresh tuna. This scenario results in a population-wide increase above the baseline of 0.03 of an IQ point (95% C.I. of 0.01 – 0.05 of an IQ point). The small improvement between this scenario and the previous one is due to the switch to lower methylmercury fish by some people. On an individual basis, a mean concentration of 0.23 ppm could produce gains for some children that are larger than the population-wide gain if their mothers otherwise would have eaten substantial amounts of high-methylmercury fish. Fourth Scenario: Pregnant Women Eat Only Fish Species with Mean Methylmercury Concentrations of 0.23 ppm or less, but with No Limit on Consumption: This scenario enables a comparison of the 12 ounce per week limitation on fish consumption in the previous scenario against no limitation on consumption. In

117
both scenarios, women of childbearing age are limited to fish species and market types with mean methylmercury concentrations of 0.23 ppm or less. This scenario results in a population-wide increase above the baseline of 0.02 of an IQ point (95% C.I. of 0.00 – 0.04 of an IQ point). This gain is slightly less than in the previous scenario because some consumers continue to eat fish above the amounts necessary to achieve maximum beneficial effects. Above those optimum amounts, net benefits gradually taper off. Fifth Scenario: Pregnant Women All Eat Exactly Four Ounces of Fish Per Week. This scenario results in a population-wide decline below the baseline of 0.14 of an IQ point (95% C.I. of -0.66 – 0.41 of an IQ point). The estimated gains caused by a modest increase in fish consumption would not be substantial on a population-wide basis. The gains would be more than offset by declines by women who were previously eating more than four ounces per week. On an individual basis, gains would derive from reductions in consumption of high-methylmercury fish by some women while losses would be experienced by those who reduce consumption of relatively low-methylmercury fish down to four ounces per week. As a technical matter, in a scenario in which some people eat much more fish than they usually do (including people who normally eat no fish), we had to decide for them what kinds of additional fish they were eating. The most practical plausible approach was to have the fish achieve the commercial weighted average of 0.072 ppm of methylmercury. We applied this approach to Scenarios Five through Eight. Sixth Scenario: Pregnant Women All Eat Exactly Eight Ounces of Fish Per Week: This scenario involves significantly greater increases in consumption by many women than occurred in the previous scenario. Consequently, the scenario results in a population-wide increase above the baseline of 2.29 IQ points (95% C.I. of 1.19 – 3.29 IQ points). This gain reflects both the significant increases in consumption and a ceiling on consumption that is near the optimum amount for many individual species. Seventh Scenario: Pregnant Women All Eat Exactly 12 Ounces of Fish Per Week. This scenario involves very substantial increases in consumption by most women. Twelve ounces of fish per week is about 40 pounds per year while per capita fish consumption is around 16 pounds per year. The scenario results in a population-wide increase above the baseline of 2.63 IQ points (95% C.I. of 1.76 – 3.39 IQ points). This is the greatest gain of all the scenarios due to the substantial increases in consumption and to the proximity of 12 ounces per week to the optimum beneficial amount for most species. Most children in this scenario would experience increased benefits due to increased fish consumption by their mothers. For the minority of children whose mothers reduce consumption down to 12 ounces per week, many would still experience slight gains as they recoup the decline in benefits that can occur beyond 12 ounces per week for many
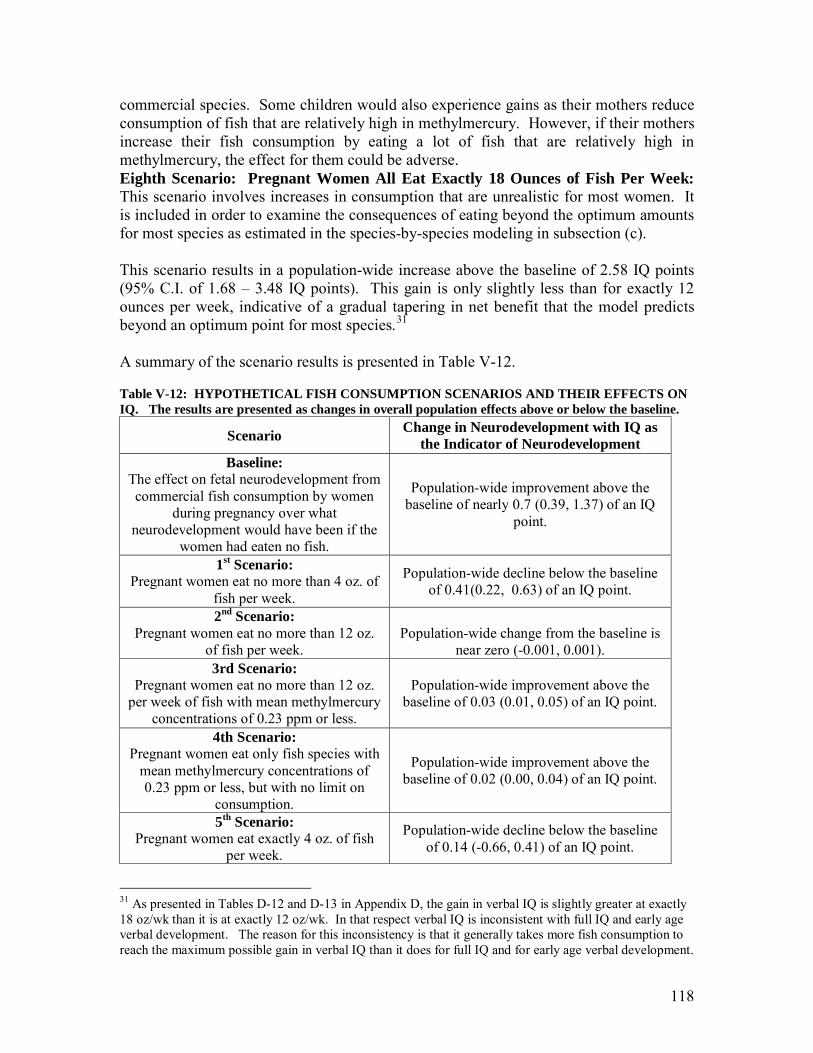
118
commercial species. Some children would also experience gains as their mothers reduce consumption of fish that are relatively high in methylmercury. However, if their mothers increase their fish consumption by eating a lot of fish that are relatively high in methylmercury, the effect for them could be adverse. Eighth Scenario: Pregnant Women All Eat Exactly 18 Ounces of Fish Per Week: This scenario involves increases in consumption that are unrealistic for most women. It is included in order to examine the consequences of eating beyond the optimum amounts for most species as estimated in the species-by-species modeling in subsection (c). This scenario results in a population-wide increase above the baseline of 2.58 IQ points (95% C.I. of 1.68 – 3.48 IQ points). This gain is only slightly less than for exactly 12 ounces per week, indicative of a gradual tapering in net benefit that the model predicts beyond an optimum point for most species.31 A summary of the scenario results is presented in Table V-12. Table V-12: HYPOTHETICAL FISH CONSUMPTION SCENARIOS AND THEIR EFFECTS ON IQ. The results are presented as changes in overall population effects above or below the baseline.
Scenario Change in Neurodevelopment with IQ as the Indicator of Neurodevelopment
Baseline: The effect on fetal neurodevelopment from commercial fish consumption by women
during pregnancy over what neurodevelopment would have been if the
women had eaten no fish.
Population-wide improvement above the baseline of nearly 0.7 (0.39, 1.37) of an IQ
point.
1st Scenario: Pregnant women eat no more than 4 oz. of
fish per week.
Population-wide decline below the baseline of 0.41(0.22, 0.63) of an IQ point.
2nd Scenario: Pregnant women eat no more than 12 oz.
of fish per week.
Population-wide change from the baseline is
near zero (-0.001, 0.001). 3rd Scenario:
Pregnant women eat no more than 12 oz. per week of fish with mean methylmercury
concentrations of 0.23 ppm or less.
Population-wide improvement above the baseline of 0.03 (0.01, 0.05) of an IQ point.
4th Scenario: Pregnant women eat only fish species with
mean methylmercury concentrations of 0.23 ppm or less, but with no limit on
consumption.
Population-wide improvement above the baseline of 0.02 (0.00, 0.04) of an IQ point.
5th Scenario: Pregnant women eat exactly 4 oz. of fish
per week.
Population-wide decline below the baseline of 0.14 (-0.66, 0.41) of an IQ point.
31 As presented in Tables D-12 and D-13 in Appendix D, the gain in verbal IQ is slightly greater at exactly 18 oz/wk than it is at exactly 12 oz/wk. In that respect verbal IQ is inconsistent with full IQ and early age verbal development. The reason for this inconsistency is that it generally takes more fish consumption to reach the maximum possible gain in verbal IQ than it does for full IQ and for early age verbal development.

119
Scenario Change in Neurodevelopment with IQ as the Indicator of Neurodevelopment
6th Scenario: Pregnant women eat exactly 8 oz. of fish
per week.
Population-wide improvement above the
baseline of 2.29 (1.19, 3.29) of an IQ point. 7th Scenario:
Pregnant women eat exactly 12 oz. of fish per week.
Population-wide improvement above the
baseline of 2.63 (1.76, 3.39) of an IQ point. 8th Scenario:
Pregnant women eat exactly 18 oz. of fish per week.
Population-wide improvement above the
baseline of 2.58 (1.68, 3.45) of an IQ point.

120
APPENDIX A: Dose-Response Modeling and Assessment Results for Early Age Verbal Development (at about 18
months of age) And Later Age Verbal Development (At six through nine years of age)
The draft of this assessment modeled the net effects of maternal fish consumption on early age verbal development as a representative indicator of the net effects from fish consumption on neurodevelopment generally. This updated assessment focuses on IQ but retains the modeling for early age verbal development for purposes of comparison. The estimated effects on both endpoints, as presented in Section V and this appendix, are not identical but they are consistent and appear to provide a plausibly narrow range in which net effects are likely to fall. The assessment now also includes modeling based on scores on later age verbal development because these scores appear to reflect a particular sensitivity to the effects of both methylmercury and beneficial fish nutrients. The results allow for a comparison between a particularly sensitive endpoint and more representative endpoints. (a) Selection of Research Results for Inclusion in the Modeling for Early Age Verbal Development (a)(1) Selection of Research Results for Inclusion in the Adverse Methylmercury Dose-Response Function A study of the poisoning event in Iraq involving contaminated bread provided data on an association between prenatal exposure to methylmercury and neurodevelopment independent of fish. In certain respects, these data are probably the least ambiguous data on methylmercury toxicity in humans currently available because the effects were unusually large and were clearly attributable to methylmercury. Moreover, they were not likely to have been confounded or otherwise seemingly reduced by any offsetting beneficial effects from nutrients in fish. The researchers in Iraq collected data on ages of first walking and talking that revealed dose-response relationships between delays in these milestones and prenatal exposures to methylmercury (Marsh et al., 1987). We utilized these data to model dose-response relationships for methylmercury on both age of first talking and age of first walking. As explained below, we only used age of first talking to represent methylmercury in our assessment of net effects. Nonetheless, the results for age of first walking are provided separately in this appendix for purposes of comparison. One source of uncertainty in this modeling is the exact age of the children when they first walked and talked, since birthdays were not recorded in Iraq. The mothers provided the ages of their children within six month time frames. We believe these estimates are sufficiently accurate for our purposes. Likely errors were no larger than a few months
121
either way, which would be within a range of normal variation for these milestones. Moreover, we would not expect errors in recollection to be biased toward the children actually being either older or younger than estimated. Finally, at high doses, the delays were larger than the six month time frames and could span years. In addition to the Iraq data, we incorporated data on age of first talking from the Seychelles Islands study in order to include normal background variation in the modeling. Individual subject data from the Seychelles Islands enabled us to see the variation on an individual-by-individual basis. By contrast, the study population in Iraq was not big enough to allow us to estimate normal variation independent of methylmercury effects. Even with the addition of Seychelles Islands data, the dose-response relationship between methylmercury and age of first talking is driven primarily by the Iraq data because the effects there were large. As a consequence, the dose-response relationship from the Iraq-Seychelles Islands data is not substantially different from a dose-response relationship calculated from the Iraq data alone. If we were to model solely from the Iraq data, the median estimate would be a delay of 0.048 months for each additional part per million of mercury in maternal hair as compared to a delay of 0.045 months for each additional part per million of mercury in maternal hair from the combination of Iraq-Seychelles. (See Figure C-6 in Appendix C. See also a general description of an “Iraq only” analysis in Carrington et al., 1997.) The data and results from which the dose-response relationship was derived met our preferences for dose-response modeling as follows:
• Age of first talking is a representative indicator of effect. Although not covering the various aspects of neurodevelopment measured by IQ, early age developmental milestones can be useful measures of neurological health. As stated by Marsh et al. (1995a):
“Age at which an infant talks, stands alone and walks without assistance may appear to be crude indices of development. However, they all require the effective integration of a large number of complex motor and sensory neural mechanisms, and when supported by neurological observations of behavior, vocalization, understanding, motor and sensory functions, they provide very good standards for comparisons on an individual infant or group basis.”
Both early speech and motor development have been associated with greater IQ at eight years of age; early speech development has been associated with reading comprehension at 26 years of age (Murray et al., 2007). There is another perspective on these endpoints, however, as expressed by Crump et al. (1998): “The measures of effect in the Iraqi study (late walking,

122
late talking, and neurological score) are relatively crude measures of neurological deficit and may not be as sensitive to methylmercury as more subtle but equally important effects that could be occurring, such as effects upon IQ.” We included IQ in this assessment, as described previously.
• Sufficient detail was available for dose-response modeling. Individual subject data from these studies were available to us. Such data from Iraq were published in Marsh et al., (1987). Individual subject data on age of first talking in the Seychelles Islands were obtained from the Seychelles Islands research team.
• The results were biologically plausible. The results from the Iraq study, which
essentially dominate the dose-response function, showed no upper limit on effects. As exposures increased, the number of children who were affected increased, and the effects became more extreme. The Seychelles Islands data showed effects at lower exposures that were not statistically significant but they did show background variability, i.e., variations in individuals within a population, that are consistently seen in regression analyses of methylmercury effects (see Figures C-6 and C-7 in Appendix C). (See also the discussion on the subject of confounding, below.)
• The results were consistent with effects seen in other studies. The Iraq results
were consistent with analyses of the effects seen in the Japan poisoning events at equivalent levels of exposure.
• The methylmercury effect does not appear to have been substantially confounded
by fish nutrients. The Iraq results were not confounded by beneficial effects from fish consumption because they occurred as a result of eating bread made from contaminated grain. The Seychelles Islands results were derived from eating fish, but in amounts that appear to have been mostly above a plateau in the beneficial effects. Consequently, Seychelles Islands results would be expected to show only changes in dose-response to methylmercury, such as they were, but not to fish nutrients, in that study population.
• The exposures were high. The exposures in Iraq were high enough to result in
clinically observable effects that were clearly from methylmercury.
• The primary study population was small in this case. Although our preference was to use results from relatively large studies, the small study in Iraq had only 81 mother-infant pairs. Small size was not a major drawback, however, because the methylmercury effect was large and thus very clear. It was not necessary to have a large study population in order to discern a small methylmercury effect from normal background variation. On the other hand, the Seychelles Islands study that we used to estimate normal background variation was relatively large, with over 700 mother-child pairs.

123
(a)(2) Selection of Research Results for Inclusion in the Beneficial Fish Nutrient Dose-Response Function In order to develop a dose-response function for the beneficial effects of fish nutrients on early age verbal development, we used data from 7,421 mother-child pairs in the previously described ALSPAC study in the United Kingdom. These data include amounts of fish consumed by expectant mothers and subsequent test scores by their children on vocabulary comprehension in the MacArthur Communicative Development Inventory (MCDI) at 15 months of age and the language component of the Denver Developmental Screening Test (DDST) at 18 months of age. Although these tests did not include age of first talking, they did involve verbal comprehension at roughly the same ages as children who first talk. We assume that these results are sufficiently comparable – even though not identical – to the milestone results on age of first talking from Iraq and the Seychelles Islands in order to combine them for purposes of estimating net effects of fish consumption on early age verbal development. The DDST total scores also included a motor component, but it could not be separated from total score. Consequently, we lacked discrete subject data on the beneficial effects of fish consumption on early age motor skills that could be matched against methylmercury’s effect on the age of first walking from Iraq and the Seychelles Islands. For this reason our modeling of net effects on early age neurodevelopment was limited to verbal development. We modeled data from the same study population that was analyzed by Daniels et al., (2004). We obtained individual subject data from the ALSPAC without any of the adjustments that were made in the Daniels et al., (2004) analysis. We adjusted for age and child’s postnatal consumption of fish using multivariate regression (see Appendix C). The data also included amounts of fish consumed by the children at six and 15 months. As an additional matter, the data included prenatal methylmercury exposure levels for a subset of 1,225 children in this study population. We discovered that methylmercury had a positive relationship to test scores, a phenomenon attributable to its correlation with fish consumption. Nonetheless, we assume that methylmercury reduced the size of the beneficial effect to some degree so we made a correction based on the size of the methylmercury effect as estimated by our dose-response function for age of first talking. This adjustment is explained in Appendix C. In the draft of this assessment we chose a linear dose-response relationship for the beneficial nutrient(s) effect because we had not yet discerned a non-linear shape for it. A linear function does not include a “plateau” at which the effect remains the same as fish consumption increases. We have replaced the linear function with a non-linear one that appears to more accurately reflect the realities for the beneficial nutrient(s) effect. In the data we received from the ALSPAC, the test scores were associated with four levels of maternal fish consumption:

124
(1) Rarely or never ate fish during pregnancy; (2) Ate fish once per two weeks during pregnancy; (3) Ate fish one to three times per week during pregnancy; and (4) Ate fish four or more times per week during pregnancy.
We calculated an average test score for each of these consumption levels as shown in Figures C-14 through 16 in Appendix C. In their analysis of the same data, Daniels et al. (2004) converted the four consumption levels into amounts of fish per day by assuming that each serving averaged 4.5 ounces.32 We accepted that assumption. We examined four different shapes for the dose-response relationship to determine which of them might best fit the scores at the four consumption levels. As with IQ, we found that “hill” and “hockey stick” shapes fit the data points well. We used both of these shapes in our modeling, giving equal weight to each. These shapes show a strong increase in beneficial effect at lower levels of consumption followed by a reduced rate of increase at higher levels of consumption. The data we have do not include consumption that is high enough to cause the shapes to become completely flat but they strongly suggest that a plateau would be reached without much additional fish consumption. The data from which the dose-response relationships were derived met our preferences for modeling as listed in subsection (c) of this section. The reasons are as follows:
• Early age verbal development is a representative indicator of effect. We assume that the reasons that apply to age of first talking, as discussed previously, also apply to the test administered here on early age verbal development.
• The endpoint for the beneficial effect was comparable to that for the
methylmercury effect. Both the beneficial and adverse contributions to the net effect from eating fish involved aspects of early age verbal development measured at overlapping ages.
• Sufficient detail was available for dose-response modeling. We had individual
subject test scores for 7,421 children. These were divided into four categories based on how much fish their mothers’ ate during pregnancy. We regarded these data as sufficient for modeling purposes.
• The results were biologically plausible. A strong gain in benefits at relatively low
levels of consumption followed by lesser gains and then a plateau is biologically plausible.
32 This was the assumption made by Daniels et al. (2004) in their analysis of the same cohort.

125
• The results were consistent with beneficial effects seen in other studies. The beneficial nutrient contributions to the net effects on early age verbal development are similar to the beneficial nutrient contributions to the net effects on IQ, both in size and shape of slope. They both start out strong and then taper to plateaus. As a caveat, however, the results both come from the same location.
• The beneficial nutrient effect was not substantially confounded by
methylmercury. As described previously, no association was found between prenatal mercury exposures and test scores in a subset of 1,054 of the children in this study population (Daniels et al., 2004). Moreover, when mercury was adjusted for in the analysis by Daniels et al. (2004), the beneficial effects did not increase. This finding suggests that the beneficial net effects were not significantly reduced by methylmercury, although we assume that there probably was some reduction.
• Exposures to beneficial fish nutrients were relatively low. Exposures were low
enough to reveal an early significant increase in the beneficial effect followed by a tapering towards a plateau. Were exposures mostly above these levels, the beneficial effect would have appeared to be essentially “flat.”
• The study population was relatively large. Over 7,000 children is a relatively
large study size. (b) The Modeling Results for Early Age Verbal Development (b)(1) How the Modeling Results are Expressed For early age verbal development, methylmercury’s contributions to the net effects are expressed in terms of delays in first talking. The delays are measured in days. They are also expressed as Z-Scores, which are statistical tools that essentially measure the size of an effect. Z-Scores facilitate the comparison of results from one model to another. They also facilitate combining results from different models into a single model. We converted delays in age of first talking into Z-Scores in order to combine them with improvements on tests of early age verbal development for purposes of estimating net effects. We converted the improvements into Z-Scores for the same reason. We then converted the Z-Scores into units of measurement that are the same size as an IQ point. We refer to them as “IQ Size Equivalents (IQse),” since they are not really IQ points. Conversion to IQse allows us to compare the size of the estimated effects on early age verbal development against the size of the estimated effects on IQ. A Brief Explanation of Z-Scores: A Z-Score describes where a particular measurement or result (e.g., a child’s weight) stands relative to other measurements or results within a group (e.g., the weights of other children in the group). A Z-Score describes how far a particular result is above or below the average of all the results in the group. When a Z-
126
Score is positive, the result exceeds the average, e.g., a child is heavier than the average weight in the group. When a Z-Score is negative, the result is below the average, e.g., a child that is lighter than the average. Assuming that the data follow a normal distribution, a positive Z-Score of exactly 1.0 means that the result exceeds the average by one standard deviation. In a normal distribution, 68 percent of all the results within a group will fall within one standard deviation of the average. A fraction of a Z-Score means that the result is above or below the average by that fraction of a standard deviation. Z-Scores are used to indicate the relative size of a change in a result in a population. For example, if, as result of maternal consumption of fish during pregnancy, a child talks later or sooner than otherwise would have been the case, the size of the change can be expressed as the difference between what the Z-Score would have been without any maternal fish consumption versus with that consumption. In this respect we are providing “net Z-Scores,” i.e., the difference between one Z-Score and another. Another feature of Z-Scores is that they can be used to compare results from different groups. A simple example involves two identical exam scores (e.g., two scores of 75) obtained in two different college classes. Converting each exam score to a Z-Score (which compares that exam score to the other exam scores in the class) reveals whether they are likely to produce the same or different grades when graded on a curve. If one score produces a positive Z-Score, it means that the exam result was above the average for that class. If the other exam score produces a negative Z-Score, it means that the score was below average. In that situation, the Z-Scores reveal that the grades will be different. If the two exam scores each produce positive Z-Scores, but one is larger than the other, the one with the larger Z-Score may result a higher grade even though both are above average. Because Z-Score and IQ scores are linked to standard deviation, a Z-Score can be converted to IQ (or at least to the size equivalent of IQ) and vice versa. The standard deviation for IQ scores in the population is 15 IQ points. Consequently, Z-Scores can be converted into IQ points by multiplying them by 15 (Cohen et al., 2005c). (b)(2) Population Results for Methylmercury’s Contributions to the Net Effects on Early Age Verbal Development Table A-1 contains estimates for delays in first talking from methylmercury independent of beneficial nutrients. The results are presented in terms of delays in days, as well as in changes in Z-Scores and IQse. For purposes of comparison, Table A-2 contains estimates for delays in first talking from methylmercury independent of beneficial nutrients. We modeled first walking in addition to first talking simply because we had the data from the Iraq study to do so. In Table A-1 the central estimate for each percentile beyond the 10th is a delay, although the confidence intervals reflect a small possibility of no delay up to the 90th percentile. These confidence intervals suggest a small possibility that that below some level of
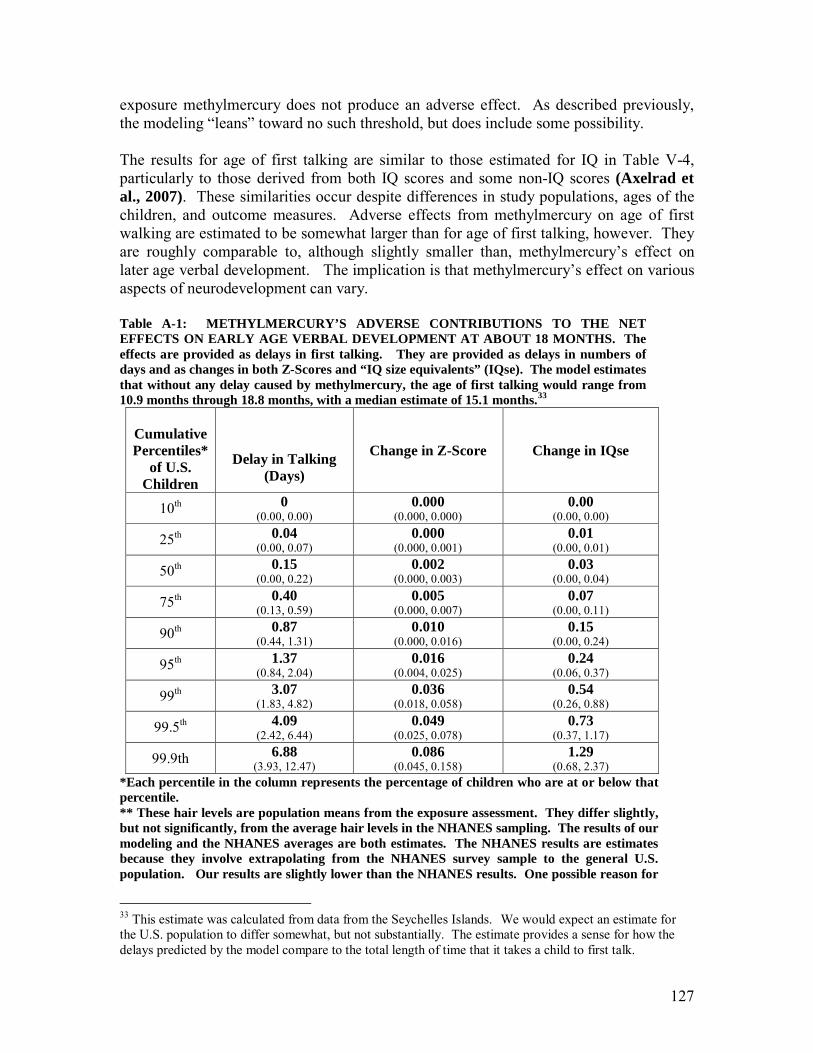
127
exposure methylmercury does not produce an adverse effect. As described previously, the modeling “leans” toward no such threshold, but does include some possibility. The results for age of first talking are similar to those estimated for IQ in Table V-4, particularly to those derived from both IQ scores and some non-IQ scores (Axelrad et al., 2007). These similarities occur despite differences in study populations, ages of the children, and outcome measures. Adverse effects from methylmercury on age of first walking are estimated to be somewhat larger than for age of first talking, however. They are roughly comparable to, although slightly smaller than, methylmercury’s effect on later age verbal development. The implication is that methylmercury’s effect on various aspects of neurodevelopment can vary. Table A-1: METHYLMERCURY’S ADVERSE CONTRIBUTIONS TO THE NET EFFECTS ON EARLY AGE VERBAL DEVELOPMENT AT ABOUT 18 MONTHS. The effects are provided as delays in first talking. They are provided as delays in numbers of days and as changes in both Z-Scores and “IQ size equivalents” (IQse). The model estimates that without any delay caused by methylmercury, the age of first talking would range from 10.9 months through 18.8 months, with a median estimate of 15.1 months.33
Cumulative Percentiles*
of U.S. Children
Delay in Talking (Days)
Change in Z-Score Change in IQse
10th 0 (0.00, 0.00)
0.000 (0.000, 0.000)
0.00 (0.00, 0.00)
25th 0.04 (0.00, 0.07)
0.000 (0.000, 0.001)
0.01 (0.00, 0.01)
50th 0.15 (0.00, 0.22)
0.002 (0.000, 0.003)
0.03 (0.00, 0.04)
75th 0.40 (0.13, 0.59)
0.005 (0.000, 0.007)
0.07 (0.00, 0.11)
90th 0.87 (0.44, 1.31)
0.010 (0.000, 0.016)
0.15 (0.00, 0.24)
95th 1.37 (0.84, 2.04)
0.016 (0.004, 0.025)
0.24 (0.06, 0.37)
99th 3.07 (1.83, 4.82)
0.036 (0.018, 0.058)
0.54 (0.26, 0.88)
99.5th 4.09 (2.42, 6.44)
0.049 (0.025, 0.078)
0.73 (0.37, 1.17)
99.9th 6.88 (3.93, 12.47)
0.086 (0.045, 0.158)
1.29 (0.68, 2.37)
*Each percentile in the column represents the percentage of children who are at or below that percentile. ** These hair levels are population means from the exposure assessment. They differ slightly, but not significantly, from the average hair levels in the NHANES sampling. The results of our modeling and the NHANES averages are both estimates. The NHANES results are estimates because they involve extrapolating from the NHANES survey sample to the general U.S. population. Our results are slightly lower than the NHANES results. One possible reason for
33 This estimate was calculated from data from the Seychelles Islands. We would expect an estimate for the U.S. population to differ somewhat, but not substantially. The estimate provides a sense for how the delays predicted by the model compare to the total length of time that it takes a child to first talk.
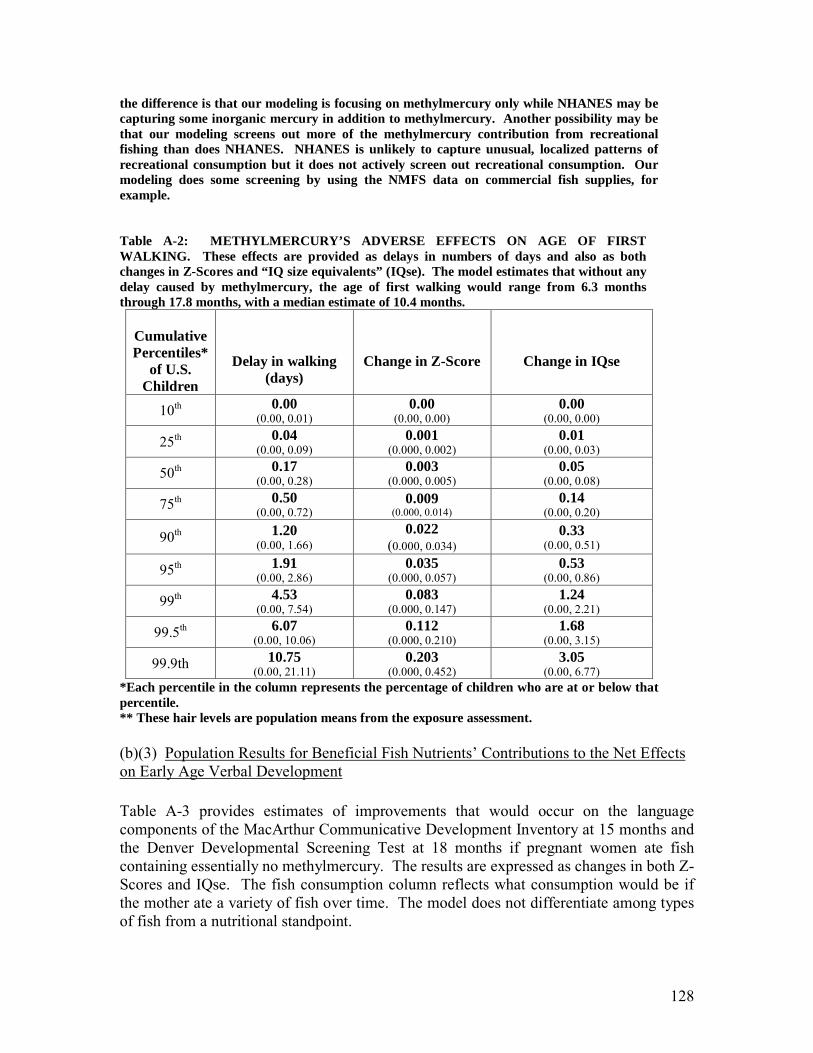
128
the difference is that our modeling is focusing on methylmercury only while NHANES may be capturing some inorganic mercury in addition to methylmercury. Another possibility may be that our modeling screens out more of the methylmercury contribution from recreational fishing than does NHANES. NHANES is unlikely to capture unusual, localized patterns of recreational consumption but it does not actively screen out recreational consumption. Our modeling does some screening by using the NMFS data on commercial fish supplies, for example. Table A-2: METHYLMERCURY’S ADVERSE EFFECTS ON AGE OF FIRST WALKING. These effects are provided as delays in numbers of days and also as both changes in Z-Scores and “IQ size equivalents” (IQse). The model estimates that without any delay caused by methylmercury, the age of first walking would range from 6.3 months through 17.8 months, with a median estimate of 10.4 months.
Cumulative Percentiles*
of U.S. Children
Delay in walking (days)
Change in Z-Score
Change in IQse
10th 0.00 (0.00, 0.01)
0.00 (0.00, 0.00)
0.00 (0.00, 0.00)
25th 0.04 (0.00, 0.09)
0.001 (0.000, 0.002)
0.01 (0.00, 0.03)
50th 0.17 (0.00, 0.28)
0.003 (0.000, 0.005)
0.05 (0.00, 0.08)
75th 0.50 (0.00, 0.72)
0.009 (0.000, 0.014)
0.14 (0.00, 0.20)
90th 1.20 (0.00, 1.66)
0.022 (0.000, 0.034)
0.33 (0.00, 0.51)
95th 1.91 (0.00, 2.86)
0.035 (0.000, 0.057)
0.53 (0.00, 0.86)
99th 4.53 (0.00, 7.54)
0.083 (0.000, 0.147)
1.24 (0.00, 2.21)
99.5th 6.07 (0.00, 10.06)
0.112 (0.000, 0.210)
1.68 (0.00, 3.15)
99.9th 10.75 (0.00, 21.11)
0.203 (0.000, 0.452)
3.05 (0.00, 6.77)
*Each percentile in the column represents the percentage of children who are at or below that percentile. ** These hair levels are population means from the exposure assessment. (b)(3) Population Results for Beneficial Fish Nutrients’ Contributions to the Net Effects on Early Age Verbal Development Table A-3 provides estimates of improvements that would occur on the language components of the MacArthur Communicative Development Inventory at 15 months and the Denver Developmental Screening Test at 18 months if pregnant women ate fish containing essentially no methylmercury. The results are expressed as changes in both Z-Scores and IQse. The fish consumption column reflects what consumption would be if the mother ate a variety of fish over time. The model does not differentiate among types of fish from a nutritional standpoint.
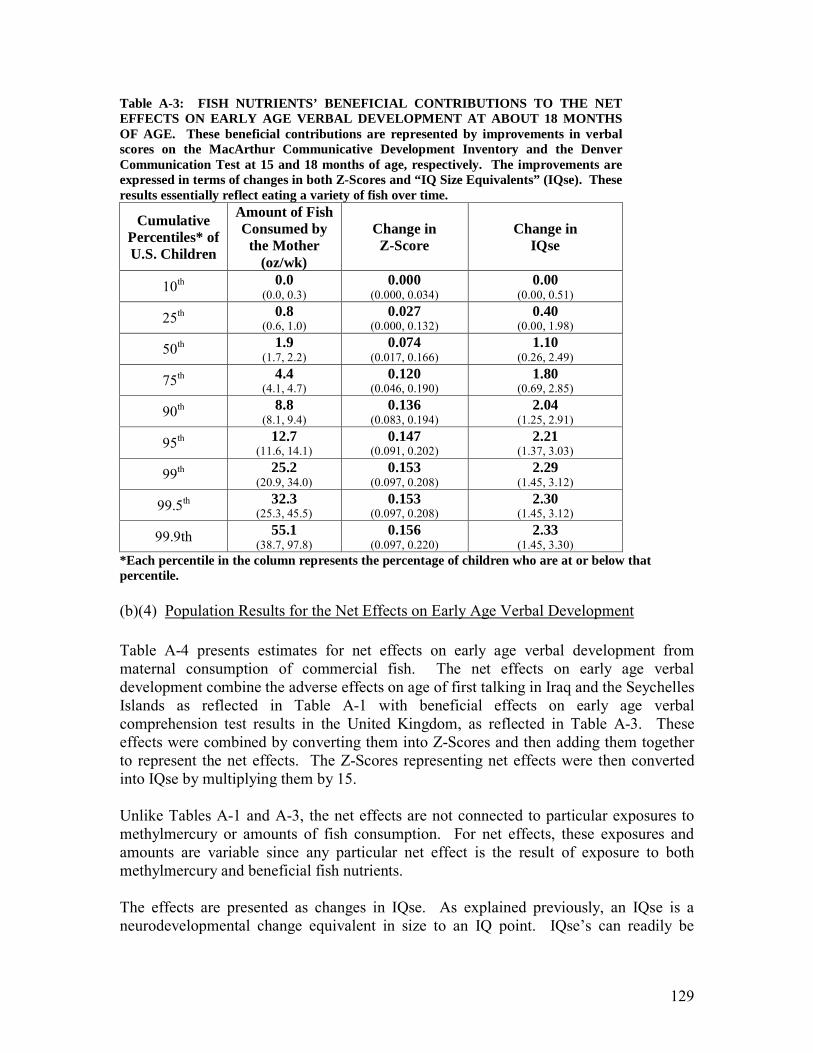
129
Table A-3: FISH NUTRIENTS’ BENEFICIAL CONTRIBUTIONS TO THE NET EFFECTS ON EARLY AGE VERBAL DEVELOPMENT AT ABOUT 18 MONTHS OF AGE. These beneficial contributions are represented by improvements in verbal scores on the MacArthur Communicative Development Inventory and the Denver Communication Test at 15 and 18 months of age, respectively. The improvements are expressed in terms of changes in both Z-Scores and “IQ Size Equivalents” (IQse). These results essentially reflect eating a variety of fish over time.
Cumulative Percentiles* of U.S. Children
Amount of Fish Consumed by
the Mother (oz/wk)
Change in Z-Score
Change in IQse
10th 0.0 (0.0, 0.3)
0.000 (0.000, 0.034)
0.00 (0.00, 0.51)
25th 0.8 (0.6, 1.0)
0.027 (0.000, 0.132)
0.40 (0.00, 1.98)
50th 1.9 (1.7, 2.2)
0.074 (0.017, 0.166)
1.10 (0.26, 2.49)
75th 4.4 (4.1, 4.7)
0.120 (0.046, 0.190)
1.80 (0.69, 2.85)
90th 8.8 (8.1, 9.4)
0.136 (0.083, 0.194)
2.04 (1.25, 2.91)
95th 12.7 (11.6, 14.1)
0.147 (0.091, 0.202)
2.21 (1.37, 3.03)
99th 25.2 (20.9, 34.0)
0.153 (0.097, 0.208)
2.29 (1.45, 3.12)
99.5th 32.3 (25.3, 45.5)
0.153 (0.097, 0.208)
2.30 (1.45, 3.12)
99.9th 55.1 (38.7, 97.8)
0.156 (0.097, 0.220)
2.33 (1.45, 3.30)
*Each percentile in the column represents the percentage of children who are at or below that percentile. (b)(4) Population Results for the Net Effects on Early Age Verbal Development Table A-4 presents estimates for net effects on early age verbal development from maternal consumption of commercial fish. The net effects on early age verbal development combine the adverse effects on age of first talking in Iraq and the Seychelles Islands as reflected in Table A-1 with beneficial effects on early age verbal comprehension test results in the United Kingdom, as reflected in Table A-3. These effects were combined by converting them into Z-Scores and then adding them together to represent the net effects. The Z-Scores representing net effects were then converted into IQse by multiplying them by 15. Unlike Tables A-1 and A-3, the net effects are not connected to particular exposures to methylmercury or amounts of fish consumption. For net effects, these exposures and amounts are variable since any particular net effect is the result of exposure to both methylmercury and beneficial fish nutrients. The effects are presented as changes in IQse. As explained previously, an IQse is a neurodevelopmental change equivalent in size to an IQ point. IQse’s can readily be
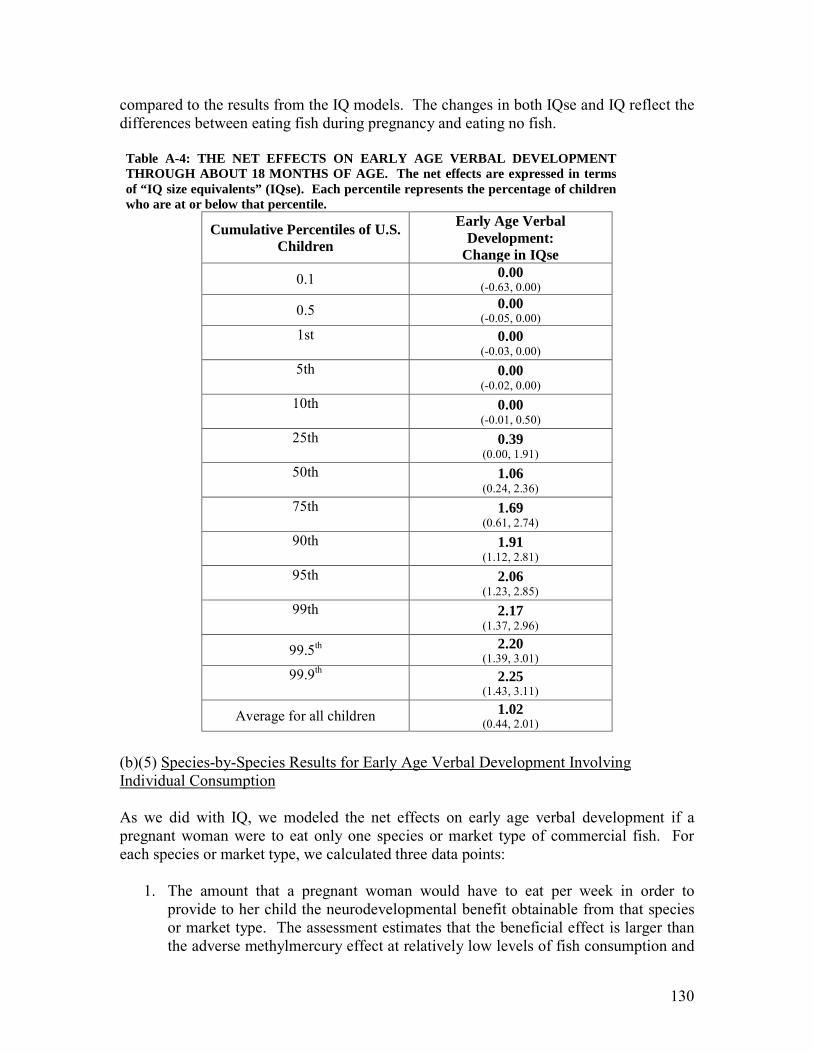
130
compared to the results from the IQ models. The changes in both IQse and IQ reflect the differences between eating fish during pregnancy and eating no fish. Table A-4: THE NET EFFECTS ON EARLY AGE VERBAL DEVELOPMENT THROUGH ABOUT 18 MONTHS OF AGE. The net effects are expressed in terms of “IQ size equivalents” (IQse). Each percentile represents the percentage of children who are at or below that percentile.
Cumulative Percentiles of U.S. Children
Early Age Verbal Development:
Change in IQse 0.1 0.00
(-0.63, 0.00)
0.5 0.00 (-0.05, 0.00)
1st
0.00 (-0.03, 0.00)
5th
0.00 (-0.02, 0.00)
10th
0.00 (-0.01, 0.50)
25th
0.39 (0.00, 1.91)
50th
1.06 (0.24, 2.36)
75th
1.69 (0.61, 2.74)
90th
1.91 (1.12, 2.81)
95th
2.06 (1.23, 2.85)
99th
2.17 (1.37, 2.96)
99.5th 2.20 (1.39, 3.01)
99.9th
2.25 (1.43, 3.11)
Average for all children 1.02 (0.44, 2.01)
(b)(5) Species-by-Species Results for Early Age Verbal Development Involving Individual Consumption As we did with IQ, we modeled the net effects on early age verbal development if a pregnant woman were to eat only one species or market type of commercial fish. For each species or market type, we calculated three data points:
1. The amount that a pregnant woman would have to eat per week in order to provide to her child the neurodevelopmental benefit obtainable from that species or market type. The assessment estimates that the beneficial effect is larger than the adverse methylmercury effect at relatively low levels of fish consumption and
131
exposures to methylmercury. Consequently, for most species, a relatively low amount per week is likely to be net beneficial.
2. The size of the maximum beneficial effect obtainable from each species and
market type, expressed as a gain in some number of IQse points.
3. The amount that a pregnant woman would have to eat per week for the net effect on her child to be adverse. When consumption exceeds the amount per week needed to achieve a maximum beneficial effect, the net benefit declines until it is eventually replaced by a net adverse effect. This decline occurs because the adverse methylmercury effect continues to increase while the beneficial effect no longer increases once it reaches a plateau.
The model assumes that the mother is average in terms of biological variability. It also assumes that over time, the methylmercury in the species being consumed will achieve the mean concentration for that species. Tables A-5 and A-6 present the results. In Table A-5, all fish are assumed to be alike in terms of beneficial effect while in Table A-6 omega-3 fatty acids are assumed to be the sole source of the beneficial effect.
In Table A-5, all 47 species and market types are likely to be net beneficial for early age verbal development at relatively low amounts of weekly consumption (central estimates). However, there is a small possibility that tilefish from the Gulf of Mexico, swordfish, and shark are not net beneficial at any amount, as indicated by the lower confidence limit of zero, and that king mackerel is only slightly beneficial as indicated by the lower confidence limit of 0.3 of an IQse point.
Four commercial species recommended for avoidance during pregnancy in the 2004 FDA/EPA consumption advice -- shark, swordfish, king mackerel, and tilefish from the Gulf of Mexico -- require the lowest amounts per week in order to become net adverse – between 9 and 20 ounces per week (central estimates). This range is between the 90th – 99th percentiles of fish consumption (see Table V-1). For Gulf tilefish, swordfish, and shark, there is a small possibility that they are never beneficial and immediately net adverse as indicated by lower bound confidence limits of zero.
For the remaining species and market types, the number of ounces per week required for the effect to be net adverse begins at 26 ounces per week (95% C.I. of 15 – 62 oz/wk) and increases substantially thereafter. The majority of fish require consumption at or beyond the 99.9th percentile of fish consumption.
The amounts needed to obtain the maximum beneficial effect from each species and market type range from two ounces per week (95% C.I. of 0 – 9 oz/wk) to 16 ounces per week (95% C.I. of 2 – 232 oz/wk), with a mean of 8.1 ounces per week for all species and market types. The size of the maximum beneficial effect ranges from 1.1 IQse ((95% C.I. of 0.0 – 2.3 IQse) to 2.2 IQse (95% C.I. of 1.4 – 3.0 IQse) for all species and market
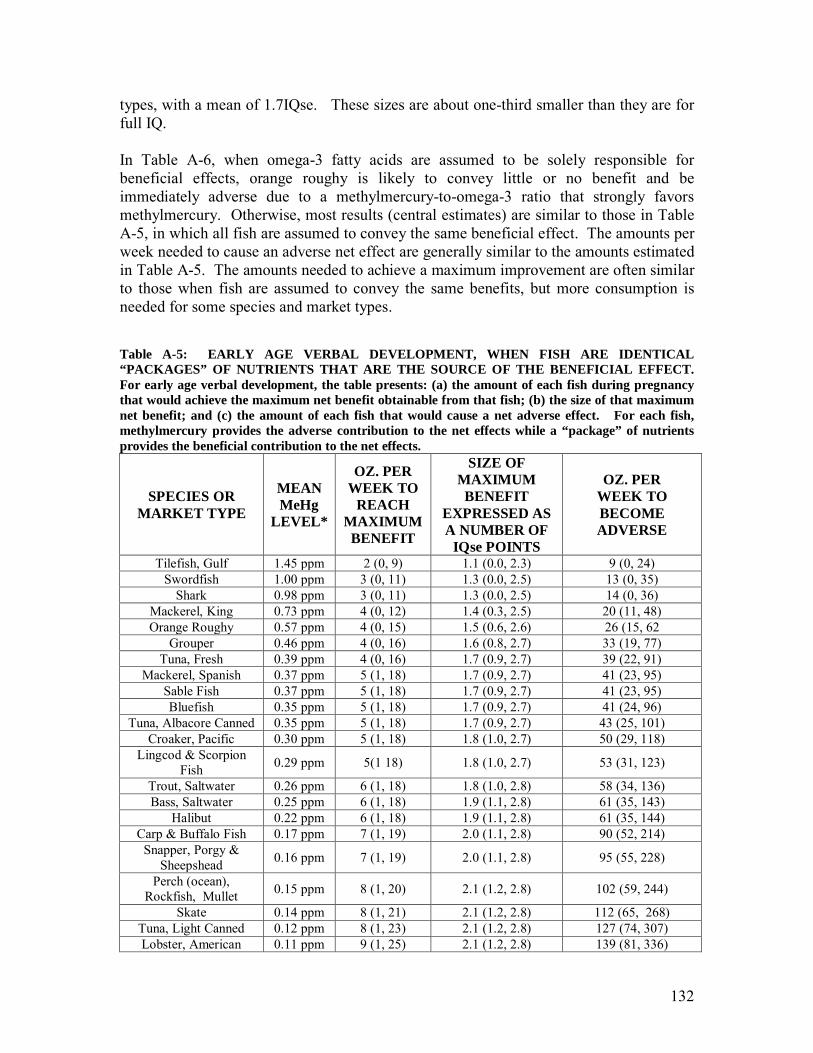
132
types, with a mean of 1.7IQse. These sizes are about one-third smaller than they are for full IQ. In Table A-6, when omega-3 fatty acids are assumed to be solely responsible for beneficial effects, orange roughy is likely to convey little or no benefit and be immediately adverse due to a methylmercury-to-omega-3 ratio that strongly favors methylmercury. Otherwise, most results (central estimates) are similar to those in Table A-5, in which all fish are assumed to convey the same beneficial effect. The amounts per week needed to cause an adverse net effect are generally similar to the amounts estimated in Table A-5. The amounts needed to achieve a maximum improvement are often similar to those when fish are assumed to convey the same benefits, but more consumption is needed for some species and market types. Table A-5: EARLY AGE VERBAL DEVELOPMENT, WHEN FISH ARE IDENTICAL “PACKAGES” OF NUTRIENTS THAT ARE THE SOURCE OF THE BENEFICIAL EFFECT. For early age verbal development, the table presents: (a) the amount of each fish during pregnancy that would achieve the maximum net benefit obtainable from that fish; (b) the size of that maximum net benefit; and (c) the amount of each fish that would cause a net adverse effect. For each fish, methylmercury provides the adverse contribution to the net effects while a “package” of nutrients provides the beneficial contribution to the net effects.
SPECIES OR MARKET TYPE
MEAN MeHg
LEVEL*
OZ. PER WEEK TO
REACH MAXIMUM BENEFIT
SIZE OF MAXIMUM BENEFIT
EXPRESSED AS A NUMBER OF
IQse POINTS
OZ. PER WEEK TO BECOME ADVERSE
Tilefish, Gulf 1.45 ppm 2 (0, 9) 1.1 (0.0, 2.3) 9 (0, 24) Swordfish 1.00 ppm 3 (0, 11) 1.3 (0.0, 2.5) 13 (0, 35)
Shark 0.98 ppm 3 (0, 11) 1.3 (0.0, 2.5) 14 (0, 36) Mackerel, King 0.73 ppm 4 (0, 12) 1.4 (0.3, 2.5) 20 (11, 48) Orange Roughy 0.57 ppm 4 (0, 15) 1.5 (0.6, 2.6) 26 (15, 62
Grouper 0.46 ppm 4 (0, 16) 1.6 (0.8, 2.7) 33 (19, 77) Tuna, Fresh 0.39 ppm 4 (0, 16) 1.7 (0.9, 2.7) 39 (22, 91)
Mackerel, Spanish 0.37 ppm 5 (1, 18) 1.7 (0.9, 2.7) 41 (23, 95) Sable Fish 0.37 ppm 5 (1, 18) 1.7 (0.9, 2.7) 41 (23, 95) Bluefish 0.35 ppm 5 (1, 18) 1.7 (0.9, 2.7) 41 (24, 96)
Tuna, Albacore Canned 0.35 ppm 5 (1, 18) 1.7 (0.9, 2.7) 43 (25, 101) Croaker, Pacific 0.30 ppm 5 (1, 18) 1.8 (1.0, 2.7) 50 (29, 118)
Lingcod & Scorpion Fish 0.29 ppm 5(1 18) 1.8 (1.0, 2.7) 53 (31, 123)
Trout, Saltwater 0.26 ppm 6 (1, 18) 1.8 (1.0, 2.8) 58 (34, 136) Bass, Saltwater 0.25 ppm 6 (1, 18) 1.9 (1.1, 2.8) 61 (35, 143)
Halibut 0.22 ppm 6 (1, 18) 1.9 (1.1, 2.8) 61 (35, 144) Carp & Buffalo Fish 0.17 ppm 7 (1, 19) 2.0 (1.1, 2.8) 90 (52, 214)
Snapper, Porgy & Sheepshead 0.16 ppm 7 (1, 19) 2.0 (1.1, 2.8) 95 (55, 228)
Perch (ocean), Rockfish, Mullet 0.15 ppm 8 (1, 20) 2.1 (1.2, 2.8) 102 (59, 244)
Skate 0.14 ppm 8 (1, 21) 2.1 (1.2, 2.8) 112 (65, 268) Tuna, Light Canned 0.12 ppm 8 (1, 23) 2.1 (1.2, 2.8) 127 (74, 307) Lobster, American 0.11 ppm 9 (1, 25) 2.1 (1.2, 2.8) 139 (81, 336)
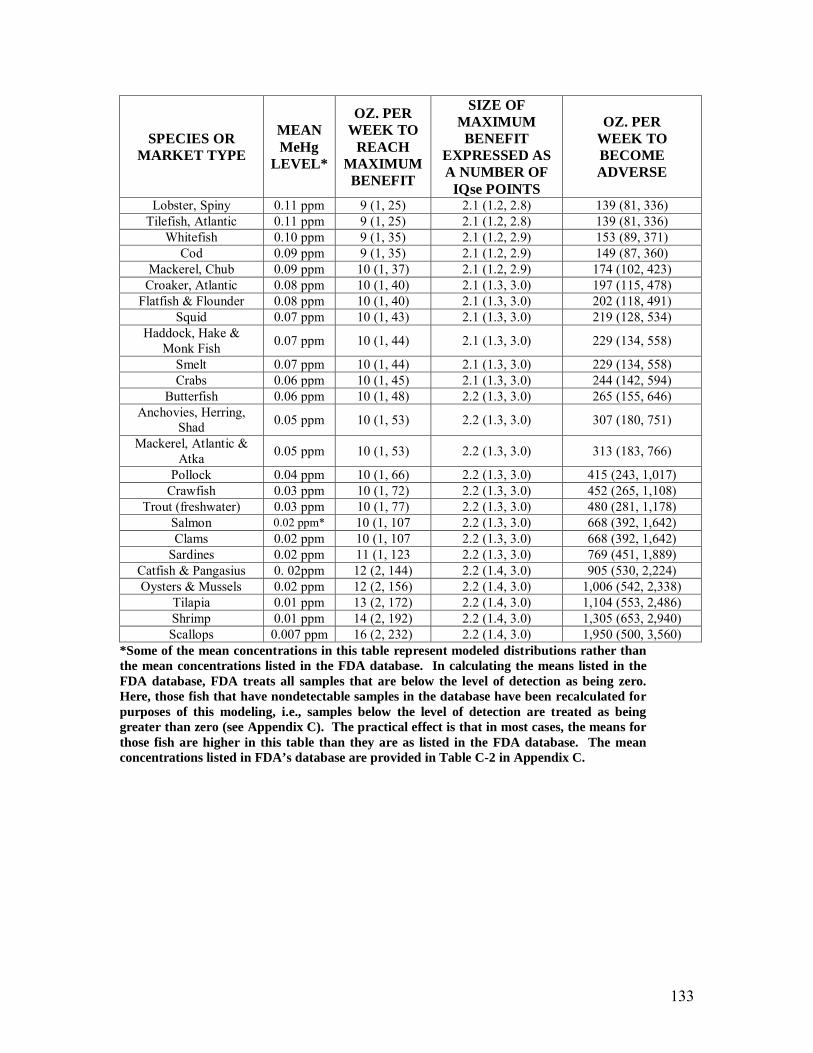
133
SPECIES OR MARKET TYPE
MEAN MeHg
LEVEL*
OZ. PER WEEK TO
REACH MAXIMUM BENEFIT
SIZE OF MAXIMUM BENEFIT
EXPRESSED AS A NUMBER OF
IQse POINTS
OZ. PER WEEK TO BECOME ADVERSE
Lobster, Spiny 0.11 ppm 9 (1, 25) 2.1 (1.2, 2.8) 139 (81, 336) Tilefish, Atlantic 0.11 ppm 9 (1, 25) 2.1 (1.2, 2.8) 139 (81, 336)
Whitefish 0.10 ppm 9 (1, 35) 2.1 (1.2, 2.9) 153 (89, 371) Cod 0.09 ppm 9 (1, 35) 2.1 (1.2, 2.9) 149 (87, 360)
Mackerel, Chub 0.09 ppm 10 (1, 37) 2.1 (1.2, 2.9) 174 (102, 423) Croaker, Atlantic 0.08 ppm 10 (1, 40) 2.1 (1.3, 3.0) 197 (115, 478)
Flatfish & Flounder 0.08 ppm 10 (1, 40) 2.1 (1.3, 3.0) 202 (118, 491) Squid 0.07 ppm 10 (1, 43) 2.1 (1.3, 3.0) 219 (128, 534)
Haddock, Hake & Monk Fish 0.07 ppm 10 (1, 44) 2.1 (1.3, 3.0) 229 (134, 558)
Smelt 0.07 ppm 10 (1, 44) 2.1 (1.3, 3.0) 229 (134, 558) Crabs 0.06 ppm 10 (1, 45) 2.1 (1.3, 3.0) 244 (142, 594)
Butterfish 0.06 ppm 10 (1, 48) 2.2 (1.3, 3.0) 265 (155, 646) Anchovies, Herring,
Shad 0.05 ppm 10 (1, 53) 2.2 (1.3, 3.0) 307 (180, 751)
Mackerel, Atlantic & Atka 0.05 ppm 10 (1, 53) 2.2 (1.3, 3.0) 313 (183, 766)
Pollock 0.04 ppm 10 (1, 66) 2.2 (1.3, 3.0) 415 (243, 1,017) Crawfish 0.03 ppm 10 (1, 72) 2.2 (1.3, 3.0) 452 (265, 1,108)
Trout (freshwater) 0.03 ppm 10 (1, 77) 2.2 (1.3, 3.0) 480 (281, 1,178) Salmon 0.02 ppm* 10 (1, 107 2.2 (1.3, 3.0) 668 (392, 1,642) Clams 0.02 ppm 10 (1, 107 2.2 (1.3, 3.0) 668 (392, 1,642)
Sardines 0.02 ppm 11 (1, 123 2.2 (1.3, 3.0) 769 (451, 1,889) Catfish & Pangasius 0. 02ppm 12 (2, 144) 2.2 (1.4, 3.0) 905 (530, 2,224) Oysters & Mussels 0.02 ppm 12 (2, 156) 2.2 (1.4, 3.0) 1,006 (542, 2,338)
Tilapia 0.01 ppm 13 (2, 172) 2.2 (1.4, 3.0) 1,104 (553, 2,486) Shrimp 0.01 ppm 14 (2, 192) 2.2 (1.4, 3.0) 1,305 (653, 2,940) Scallops 0.007 ppm 16 (2, 232) 2.2 (1.4, 3.0) 1,950 (500, 3,560)
*Some of the mean concentrations in this table represent modeled distributions rather than the mean concentrations listed in the FDA database. In calculating the means listed in the FDA database, FDA treats all samples that are below the level of detection as being zero. Here, those fish that have nondetectable samples in the database have been recalculated for purposes of this modeling, i.e., samples below the level of detection are treated as being greater than zero (see Appendix C). The practical effect is that in most cases, the means for those fish are higher in this table than they are as listed in the FDA database. The mean concentrations listed in FDA’s database are provided in Table C-2 in Appendix C.

134
Table A-6: EARLY AGE VERBAL DEVELOPMENT, WHEN OMEGA-3 FATTY ACIDS IN FISH ARE THE SOLE SOURCE OF THE BENEFICIAL EFFECT. For early age verbal development, the table presents: (a) the amount of each fish during pregnancy that would achieve the maximum net benefit obtainable from that fish; (b) the size of that maximum net benefit; and (c) the amount of each fish that would cause a net adverse effect. For each fish, methylmercury provides the adverse contribution to the net effects while omega-3 fatty acids provide the beneficial contribution to the net effects.
SPECIES OR MARKET
TYPE
MEAN MeHg
LEVEL*
MEAN OMEGA-3 FATTY
ACID LEVEL
(g PUFA/ 100 g FISH)
OZ. PER WEEK TO
REACH MAXIMUM
BENEFIT
SIZE OF MAXIMUM
BENEFIT EXPRESSED
AS A NUMBER OF IQse POINTS
OZ. PER WEEK TO BECOME ADVERSE
Tilefish, Gulf 1.45 ppm 0.8 0 2 (0, 7) 1.3 (0.0, 2.5) 9 (2, 24) Swordfish 1.00 ppm 0.69 2 (0, 8) 1.5 (0.6, 2.6) 15 (80, 35)
Shark 0.98 ppm 0.90 3 (0, 9) 1.4 (0.3, 2.5) 15 (8, 36) Mackerel, King 0.73 ppm 0.40 4 (0, 15) 1.3 (0.0, 2.5) 19 (5, 48) Orange Roughy 0.57 ppm 0.03 0 (0, 41) 0.0 (0, 1.4) 0 (0, 51)
Grouper 0.46 ppm 0.25 7 (0, 22) 1.3 (0.0, 2.5) 29 (0, 77) Tuna, Fresh 0.39 ppm 0.65 4 (1, 14) 1.7 (1.0, 2.7) 39 (22, 91)
Mackerel, Spanish 0.37 ppm 1.24 3 (1, 8) 2.0 (1.2, 2.8) 41 (24, 99) Sable Fish 0.37 ppm 1.81 3 (0, 8) 2.1 (1.2, 2.8) 41 (24, 100) Bluefish 0.35 ppm 0.86 4 (1, 10) 2.0 (1.1, 2.8) 41 (24, 98)
Tuna, Albacore Canned 0.35 ppm 0.99 4 (1, 11) 1.9 (1.1, 2.8) 43 (25, 103)
Croaker, Pacific 0.30 ppm 0.30 7 (1, 28) 1.5 (0.7, 2.6) 50 (28, 118) Lingcod &
Scorpion Fish 0.29 ppm 0.26 8 (1, 30) 1.5 (0.6., 2.6) 52 (30, 123)
Trout, Saltwater 0.26 ppm 0.62 6 (1, 73) 1.9 (1.1, 2.8) 58 (34, 138) Bass, Saltwater 0.25 ppm 0.97 4 (1, 14) 2.1 (1.2, 2.8) 62 (36, 148)
Halibut 0.22 ppm 0.71 5 (1, 14) 2.0 (1.1, 2.8) 62 (36, 147) Carp & Buffalo
Fish 0.17 ppm 0.45 8 (2, 21) 2.0 (1.1, 2.8) 90 (52, 212)
Snapper, Porgy & Sheepshead 0.16 ppm 0.26 10 (3, 36) 1.7 (0.9, 2.7) 94 (54, 221)
Perch (ocean), Rockfish, Mullet 0.15 ppm 0.29 10 (2, 32) 1.8 (1.0, 2.8) 101 (58, 236)
Skate 0.14 ppm 0.30 10 (2, 31) 1.9 (1.1, 2.8) 111 (64, 260) Tuna, Light
Canned 0.12 ppm 0.27 12 (3, 34) 1.9 (1.1, 2.8) 127 (73, 298)
Lobster, American 0.11 ppm 0.20 14 (4, 48) 1.8 (1.0, 2.7) 138 (79, 321) Lobster, Spiny 0.11 ppm 0.91 9 (2, 25) 2.1 (1.2, 2.8) 139 (81, 335)
Tilefish, Atlantic 0.11 ppm 0.48 6 (1, 23) 2.1 (1.3, 3.0) 139 (82, 340) Whitefish 0.10 ppm 0.16 6 (1, 35) 2.2 (1.3, 3.0) 153 (90, 375)
Cod 0.09 ppm 0.91 16 (4, 59) 1.7 (0.9, 2.7) 146 (84, 343) Mackerel, Chub 0.09 ppm 1.23 4 (1, 37) 2.2 (1.3, 3.0) 175 (102, 428)
Croaker, Atlantic 0.08 ppm 0.30 18 (4, 47) 2.0 (1.1, 2.8) 195 (113, 462) Flatfish & Flounder 0.08 ppm 0.20 14 (2, 40) 2.1 (1.2, 2.8) 201 (117, 484)
Squid 0.07 ppm 0.16 9 (1, 43) 2.1 (1.3, 3.0) 219 (128, 534) Haddock, Hake & 0.07 ppm 0.89 21 (4, 58) 1.9 (1.1, 2.8) 227 (132, 535)
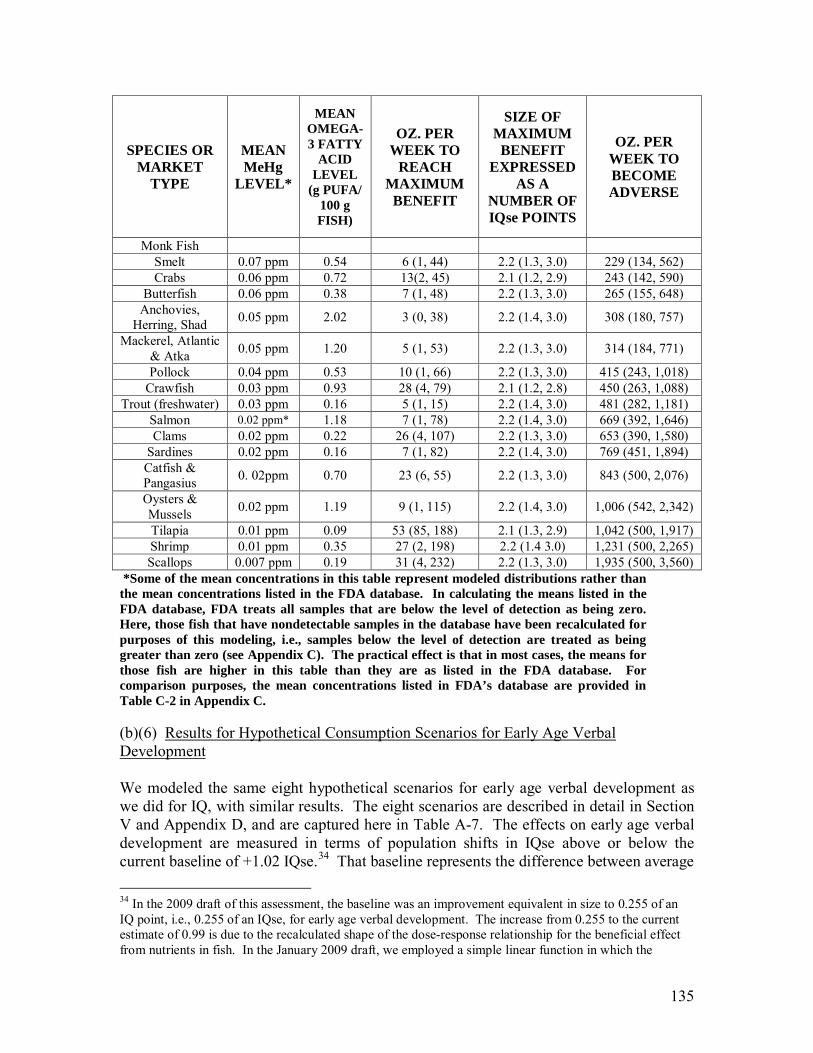
135
SPECIES OR MARKET
TYPE
MEAN MeHg
LEVEL*
MEAN OMEGA-3 FATTY
ACID LEVEL
(g PUFA/ 100 g FISH)
OZ. PER WEEK TO
REACH MAXIMUM
BENEFIT
SIZE OF MAXIMUM
BENEFIT EXPRESSED
AS A NUMBER OF IQse POINTS
OZ. PER WEEK TO BECOME ADVERSE
Monk Fish Smelt 0.07 ppm 0.54 6 (1, 44) 2.2 (1.3, 3.0) 229 (134, 562) Crabs 0.06 ppm 0.72 13(2, 45) 2.1 (1.2, 2.9) 243 (142, 590)
Butterfish 0.06 ppm 0.38 7 (1, 48) 2.2 (1.3, 3.0) 265 (155, 648) Anchovies,
Herring, Shad 0.05 ppm 2.02 3 (0, 38) 2.2 (1.4, 3.0) 308 (180, 757)
Mackerel, Atlantic & Atka 0.05 ppm 1.20 5 (1, 53) 2.2 (1.3, 3.0) 314 (184, 771)
Pollock 0.04 ppm 0.53 10 (1, 66) 2.2 (1.3, 3.0) 415 (243, 1,018) Crawfish 0.03 ppm 0.93 28 (4, 79) 2.1 (1.2, 2.8) 450 (263, 1,088)
Trout (freshwater) 0.03 ppm 0.16 5 (1, 15) 2.2 (1.4, 3.0) 481 (282, 1,181) Salmon 0.02 ppm* 1.18 7 (1, 78) 2.2 (1.4, 3.0) 669 (392, 1,646) Clams 0.02 ppm 0.22 26 (4, 107) 2.2 (1.3, 3.0) 653 (390, 1,580)
Sardines 0.02 ppm 0.16 7 (1, 82) 2.2 (1.4, 3.0) 769 (451, 1,894) Catfish & Pangasius 0. 02ppm 0.70 23 (6, 55) 2.2 (1.3, 3.0) 843 (500, 2,076)
Oysters & Mussels 0.02 ppm 1.19 9 (1, 115) 2.2 (1.4, 3.0) 1,006 (542, 2,342)
Tilapia 0.01 ppm 0.09 53 (85, 188) 2.1 (1.3, 2.9) 1,042 (500, 1,917) Shrimp 0.01 ppm 0.35 27 (2, 198) 2.2 (1.4 3.0) 1,231 (500, 2,265) Scallops 0.007 ppm 0.19 31 (4, 232) 2.2 (1.3, 3.0) 1,935 (500, 3,560)
*Some of the mean concentrations in this table represent modeled distributions rather than the mean concentrations listed in the FDA database. In calculating the means listed in the FDA database, FDA treats all samples that are below the level of detection as being zero. Here, those fish that have nondetectable samples in the database have been recalculated for purposes of this modeling, i.e., samples below the level of detection are treated as being greater than zero (see Appendix C). The practical effect is that in most cases, the means for those fish are higher in this table than they are as listed in the FDA database. For comparison purposes, the mean concentrations listed in FDA’s database are provided in Table C-2 in Appendix C. (b)(6) Results for Hypothetical Consumption Scenarios for Early Age Verbal Development We modeled the same eight hypothetical scenarios for early age verbal development as we did for IQ, with similar results. The eight scenarios are described in detail in Section V and Appendix D, and are captured here in Table A-7. The effects on early age verbal development are measured in terms of population shifts in IQse above or below the current baseline of +1.02 IQse.34 That baseline represents the difference between average 34 In the 2009 draft of this assessment, the baseline was an improvement equivalent in size to 0.255 of an IQ point, i.e., 0.255 of an IQse, for early age verbal development. The increase from 0.255 to the current estimate of 0.99 is due to the recalculated shape of the dose-response relationship for the beneficial effect from nutrients in fish. In the January 2009 draft, we employed a simple linear function in which the

136
IQse for the population as a result of current fish consumption during pregnancy and what average IQse for the population would be if women ate no fish during pregnancy. Table A-7: HYPOTHETICAL FISH CONSUMPTION SCENARIOS’ EFFECTS ON EARLY AGE VERBAL DEVELOPMENT WITH IQ INCLUDED FOR COMPARISON. The results are presented as changes in overall population effects above or below the baseline.
Scenario
Change in Early Age Verbal Development as
the Indicator of Neurodevelopment,
Expressed in Number of IQse Points
For Comparison: Change in IQ as the
Indicator of Neurodevelopment,
Expressed in Number of IQ Points
Baseline: The effect on fetal
neurodevelopment from commercial fish
consumption by women during pregnancy over what
neurodevelopment would have been if the women had
eaten no fish.
Population-wide improvement above the
baseline of 1.02 (0.44, 2.01) of an IQse.
Population-wide improvement above the
baseline of nearly 0.7 (0.39, 1.37) of an IQ point.
1st Scenario: Pregnant women eat no
more than 4 oz. of fish per week.
Population-wide decrease below the baseline of 0.02
(-0.04, 0.23) of an IQse.
Population-wide decrease below the baseline of 0.41 (0.22, 0.63) of an IQ point.
2nd Scenario: Pregnant women eat no
more than 12 oz. of fish per week.
Population-wide change from the baseline is near
zero (-0.02, 0.01).
Population-wide change from the baseline is near
zero (-0.001, 0.001). 3rd Scenario:
Pregnant women eat no more than 12 oz. a week of
fish species with mean methylmercury
concentrations of 0.12 ppm or less.
Population-wide improvement above the
baseline of 0.03 (0.00, 0.04) of an IQse.
Population-wide improvement above the
baseline of 0.03 (0.01, 0.05) of an IQ point.
4th Scenario: Pregnant women eat only
fish species with mean methylmercury
concentrations of 0.12 ppm or less, but with no limit on
consumption.
Population-wide improvement above the
baseline of 0.02 (0.01, 0.04) of an IQse.
Population-wide improvement above the
baseline of 0.02 (0.00, 0.04) of an IQ point.
beneficial response increased indefinitely in proportion to the amount of fish consumed. A reanalysis of the data, plus the acquisition of new data, shows a dose-response relationship that increases sharply at relatively low amounts of fish consumption and then tapers to a plateau. It is that sharp early increase that accounts for the new “baseline” calculation.

137
Scenario
Change in Early Age Verbal Development as
the Indicator of Neurodevelopment,
Expressed in Number of IQse Points
For Comparison: Change in IQ as the
Indicator of Neurodevelopment,
Expressed in Number of IQ Points
5th Scenario: Pregnant women eat
exactly 4 oz. of fish per week.
Population-wide
improvement above the baseline of 0.55 (0.14, 1.23)
of an IQse.
Population-wide decrease below the baseline of 0.14 (-0.66, 0.41) of an IQ point.
6th Scenario: Pregnant women eat
exactly 8 oz. of fish per week.
Population-wide
improvement above the baseline of 0.84 (0.30, 1.32)
of an IQse.
Population-wide
improvement above the baseline of 2.29 (1.19, 3.29)
of an IQ point.
7th Scenario: Pregnant women eat
exactly 12 oz. of fish per week.
Population-wide
improvement above the baseline of 0.91 (0.25, 1.82)
of an IQse.
Population-wide
improvement above the baseline of 2.63 (1.76, 3.39)
of an IQ point.
8th Scenario: Pregnant women eat
exactly 18 oz. of fish per week.
Population-wide
improvement above the baseline of 0.91 (0.20, 1.82)
of an IQse.
Population-wide
improvement above the baseline of 2.58 (1.68, 3.45)
of an IQ point.
(c) Selection of Research Results for Inclusion in the Modeling for Later Age Verbal Development (c)(1) Selection of Research Results for Inclusion in the Adverse Methylmercury Dose-Response Function As described in Section IV, Cohen et al. (2005b), calculated dose-response slopes for methylmercury’s effect on a wide battery of neurodevelopmental tests administered in the Seychelles Islands, New Zealand, and Faroe Islands studies, which the authors characterized as IQ. These three slopes were combined into one linear slope, using weighted averages. Cohen et al. (2005b) subdivided their results into components of IQ, including verbal IQ. We incorporated this slope into our assessment of the net effects of fish consumption on later age verbal development. In doing so, we used the results from a secondary analysis by Cohen et al. (2005b) rather than the results from their primary analysis, as explained in Section IV. Ninety-two percent of this slope is based on results from the Boston Naming Test (Cohen et al., 2005b, Technical Appendix, page 353.319)35, which appeared to be particularly 35 In the “Summary” on page 353.e19, Cohen et al. provided the weights they assigned to the results from each of these studies. The study weights were 1.0 (Faroe Islands), 0.88 (Seychelles Islands) , and 0.16
138
sensitive to methylmercury in the Faroe Islands study (NRC, 2000, see pp. 286-7). This apparent sensitivity made it attractive to us as a way of measuring net effects of fish consumption on a sensitive endpoint. In developing a dose-response function for methylmercury, Cohen et al. used results from this test in both the Faroe Islands and the Seychelles Islands but assigned more weight to the Faroe Islands results. Cohen et al. (2005b) also integrated other tests results from New Zealand into the dose-response slope but assigned the least weight to them. Table IV-3 lists the tests that were characterized as representing verbal IQ by Cohen et al. (2005b). The data and results from which the methylmercury dose-response relationship with the Boston Naming Test (plus spoken language quotient test as administered in New Zealand) was derived met our preferences for dose-response modeling as follows:
• Boston Naming as a representative indicator of effect: As reported in the Faroe
Islands, the Boston Naming Test appeared to be more sensitive to the adverse effects of methylmercury than other tests of neurodevelopment. We modeled it for that reason, i.e., so we could compare effects from a sensitive endpoint against effects from more representative endpoints. Because we do not consider results on the Boston Naming Test to be representative, we performed this analysis for comparison purposes only.
• Sufficient detail was available for dose-response modeling. Individual subject data
from the Faroe Islands, Seychelles Islands, and New Zealand studies have not been made available but the number of data points in the summaries was adequate for dose-response modeling by Cohen et al. (2005b).
• The results were biologically plausible. The results were biologically plausible in
that methylmercury effects increased as exposures increased and vice versa. • The results were reasonably consistent with effects seen in other studies. Results
mostly from the Boston Naming test were higher than the other dose-response functions calculated for methylmercury, but they were modeled for that very reason. Even so, they are not so much higher that they lack reasonable consistency.
• The methylmercury effect is not likely to have been substantially confounded. As
described in Section IV, the potential confounder of greatest concern is the beneficial effect from fish nutrients that could cause the methylmercury effect to appear smaller than it actually is or to hide it altogether. In the Faroe Islands, Seychelles Islands, and New Zealand studies, we assume that confounding by fish nutrients did not substantially alter the results. As explained previously, the basis for this assumption is the likelihood that most fish consumption in these study populations exceeded amounts needed to reach a plateau in the beneficial effects provided by the fish. Where the effects being studied are primarily differences in test scores among those
(New Zealand), for a total weight of 2.04. The combined weights of the Faroe Islands and Seychelles Islands results constitute 92 percent of that total.
139
whose benefits have already been maximized, the differences could only be due to the various exposures to methylmercury in that study population, unconfounded by benefits.
• The exposures were relatively high. The Seychelles Islands, Faroe Islands, and New
Zealand studies involved exposures as high as has ever been reported outside of the extreme poisoning events in Japan and Iraq, which is why these populations were chosen for study. While there is some overlap between high-end U.S. exposures and those seen in the three studies, most exposures in those locations were many times higher than most U.S. exposures.
By contrast, low-dose studies solely within the range of U.S. exposures appear to have produced inconsistent results. See Section IV for a discussion on this point.
• The combined study population was relatively large. Collectively, the three studies
(the Seychelles Islands, the Faroe Islands, and New Zealand studies) had over 1,600 study participants.
(c)(2) Selection of Research Results for Inclusion in the Beneficial Fish Nutrients Dose-Response Function The Avon Longitudinal Study of Parents and Children (ALSPAC), operated by the University of Bristol in the United Kingdom, obtained data on maternal fish consumption during pregnancy and on both full and verbal IQ, a subset of full IQ, of offspring at eight years of age from over 5,000 mother-child pairs. ALSPAC is tracking nearly 14,000 children from birth in 1991-1992 through adulthood to obtain information on mental and physical health, educational achievement, and general well being (ALSPAC 2010). We obtained ALSPAC summary data from 5,407 mother-child pairs that included maternal fish consumption and both full and verbal IQ results in their children. These data show the children’s mean IQ scores along with the standard error of the mean at six levels of maternal fish consumption. As discussed in Section III, an analysis of prenatal exposures to methylmercury and test scores in 1,054 children in the ALSPAC study found no association between methylmercury and scores (Daniels et al., 2004). Our conclusion from the Daniels et al. (2004) results was that confounding by methylmercury was not estimable in this population. For purposes of our modeling, however, we assume that some degree of confounding did occur and that as a consequence, the methylmercury in the fish eaten by the mothers reduced the size of the beneficial effect. We adjusted for that influence in our modeling.36 The size of the methylmercury adjustment was derived from the size of
36 We did not similarly adjust for benefits in our modeling of methylmercury’s adverse effects. For that modeling we only used results from relatively high exposure studies. We assume that in those locations benefits would have already reached a plateau or the rate of increase in benefits would have at least tapered off substantially. Under those circumstances an adjustment would not be needed for purposes of developing a dose-response function.
140
the IQ deficit from methylmercury estimated by Cohen et al. (2005b) as described previously.
Figure C-20 in Appendix C shows the six dose-response data points we have for verbal IQ. The beneficial effect shows no increase by the first data point of about 2.5 ounces of fish per week, then increases sharply to about 5.7 ounces per week, then continues to increase more gradually thereafter as consumption increases, suggestive of a plateau at some point. We examined four shapes for beneficial dose-response relationships to determine which of them might best fit the six data points that we have. We eliminated a linear shape in which IQ would continue to increase indefinitely in proportion to increased fish consumption. Such a shape would not fit the plateau that appears to exist at higher levels of consumption. We also eliminated an exponential shape in which IQ increases sharply at extremely small amounts of fish consumption since the data did not show such an increase. We concluded that “hill” and “hockey stick” shapes, as pictured in Figures C-21 and C-22 in Appendix C, provide the best fit. We incorporated both functions in our modeling, giving equal weight to each. The “hill” shape appears to be approaching a plateau at about 15 ounces per week while the “hockey stick” shape appears to reach a plateau at about 12 ounces per week. The extent to which data from which we calculated the beneficial dose-response relationships for verbal IQ met our preferences for dose-response modeling is as follows:
• Verbal IQ as a representative indicator of effect: We modeled verbal IQ for comparative reasons because it appeared to be particularly responsive to beneficial effects from fish nutrients in the ALSPAC study population. We do not regard it to be representative of beneficial effects from fish nutrients generally.
• Whether the endpoint for the beneficial effect is the same as the endpoint for the
methylmercury effect: The results used to measure the beneficial fish nutrient effects on later age verbal development was the verbal component of the Wechsler Intelligence Scale for Children. The results used to measure the adverse methylmercury effects were primarily from the Boston Naming Test, although characterized by Cohen et al. (2005b) as verbal IQ. They are not identical; however, both are in the domain of verbal development at about the same age.
• Sufficient detail was available for dose-response modeling: We had six data points for verbal IQ. We regard three data points as the minimum necessary for modeling purposes
• The results were biologically plausible. A strong gain in benefits followed by lesser gains and then by a plateau is biologically plausible and fits the evidence from observational studies. Otherwise, extremely high fish consumption could produce nearly unlimited gains in intelligence, at least so long as the fish were low in methylmercury.
141
• The results were consistent with other beneficial effects. The beneficial nutrient
contributions to the net effects on verbal IQ are greater than they are in other dose-response functions that we have calculated for the beneficial effect, but were modeled for that reason. Even so, they are not so much higher that they lack reasonable consistency.
• Exposures to beneficial fish nutrients were relatively low: Exposures were low enough to reveal a sharp increase in the beneficial effect followed by a tapering to a plateau. Where exposures are mostly above these levels, there appears to be little or no additional benefit, i.e., the dose-response function is essentially “flat.”
• The study population was relatively large: A study population with more than
5,000 children is relatively large. (d) The Modeling Results for Later Age Verbal Development
(d)(1) Population Results for Methylmercury’s Contribution to the Net Effects on Later Age Verbal Development As explained previously, this modeling was based on the work by Cohen et al., who subdivided the results they characterized as IQ into components of IQ, including verbal. In Table A-8 these verbal results are expressed in terms of changes in verbal IQ points. As expected, these results are more adverse than for full IQ or for age of first talking because they are dominated by results on the Boston Naming Test in the Faroe Islands study. Those results appeared to be particularly sensitive to methylmercury.

142
Table A-8: METHYLMERCURY’S ADVERSE CONTRIBUTIONS TO THE NET EFFECTS ON LATER AGE VERBAL DEVELOPMENT INDEPENDENT OF ANY BENEFITS FROM NUTRIENTS IN FISH. The adverse contributions are measured as reductions in verbal IQ points. Each percentile represents the percentage of children who are at or below that percentile.
Cumulative Percentiles of U.S. Children
Methyl-mercury’s Contribution to Net Effects on Later Age
Verbal Development as Measured by Reductions in Verbal IQ Points
(Cohen et al. 2005b Secondary Analysis)
k1st 0.00 (0.00, 0.00)
5th 0.00 (0.00, 0.00)
10th 0.00 (0.00, 0.01)
25th 0.02 (0.01, 0.04)
50th 0.07 (0.03, 0.12)
75th 0.18 (0.07, 0.29)
90th 0.38 (0.15, 0.64)
95th 0.58 (0.24, 0.99)
99th 1.29 (0.54, 2.22)
99.5th 1.68 (0.70, 2.95)
99.9th 2.78 (1.12, 5.38)
(d)(2) Population Results for the Beneficial Fish Nutrients’ Contributions to the Net Effects on Later Age Verbal Development The beneficial contributions to the net effects on later age verbal development, as represented by results on the verbal component of the Wechsler IQ test, are greater than they are for the other estimates of beneficial contributions in this assessment. Table A-9 presents the results in terms of changes in verbal IQ points.
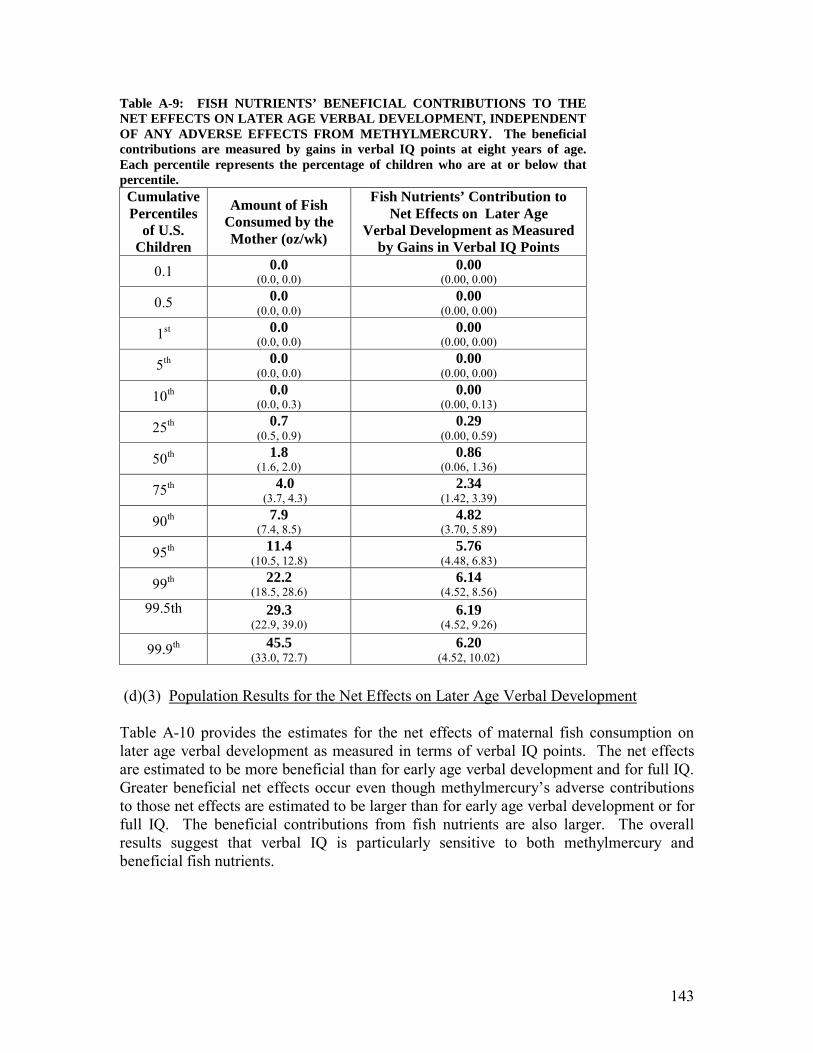
143
Table A-9: FISH NUTRIENTS’ BENEFICIAL CONTRIBUTIONS TO THE NET EFFECTS ON LATER AGE VERBAL DEVELOPMENT, INDEPENDENT OF ANY ADVERSE EFFECTS FROM METHYLMERCURY. The beneficial contributions are measured by gains in verbal IQ points at eight years of age. Each percentile represents the percentage of children who are at or below that percentile. Cumulative Percentiles
of U.S. Children
Amount of Fish Consumed by the Mother (oz/wk)
Fish Nutrients’ Contribution to Net Effects on Later Age
Verbal Development as Measured by Gains in Verbal IQ Points
0.1 0.0 (0.0, 0.0)
0.00 (0.00, 0.00)
0.5 0.0 (0.0, 0.0)
0.00 (0.00, 0.00)
1st 0.0 (0.0, 0.0)
0.00 (0.00, 0.00)
5th 0.0 (0.0, 0.0)
0.00 (0.00, 0.00)
10th 0.0 (0.0, 0.3)
0.00 (0.00, 0.13)
25th 0.7 (0.5, 0.9)
0.29 (0.00, 0.59)
50th 1.8 (1.6, 2.0)
0.86 (0.06, 1.36)
75th 4.0 (3.7, 4.3)
2.34 (1.42, 3.39)
90th 7.9 (7.4, 8.5)
4.82 (3.70, 5.89)
95th 11.4 (10.5, 12.8)
5.76 (4.48, 6.83)
99th 22.2 (18.5, 28.6)
6.14 (4.52, 8.56)
99.5th
29.3 (22.9, 39.0)
6.19 (4.52, 9.26)
99.9th 45.5 (33.0, 72.7)
6.20 (4.52, 10.02)
(d)(3) Population Results for the Net Effects on Later Age Verbal Development Table A-10 provides the estimates for the net effects of maternal fish consumption on later age verbal development as measured in terms of verbal IQ points. The net effects are estimated to be more beneficial than for early age verbal development and for full IQ. Greater beneficial net effects occur even though methylmercury’s adverse contributions to those net effects are estimated to be larger than for early age verbal development or for full IQ. The beneficial contributions from fish nutrients are also larger. The overall results suggest that verbal IQ is particularly sensitive to both methylmercury and beneficial fish nutrients.
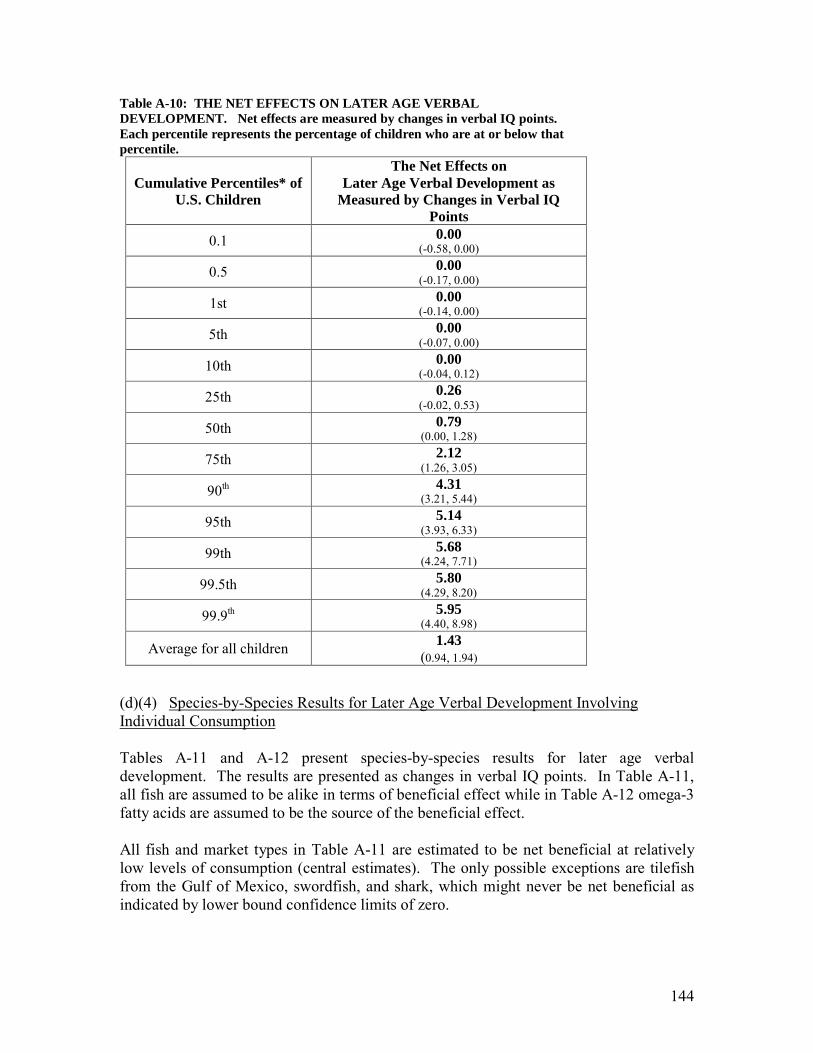
144
Table A-10: THE NET EFFECTS ON LATER AGE VERBAL DEVELOPMENT. Net effects are measured by changes in verbal IQ points. Each percentile represents the percentage of children who are at or below that percentile.
Cumulative Percentiles* of U.S. Children
The Net Effects on Later Age Verbal Development as
Measured by Changes in Verbal IQ Points
0.1 0.00 (-0.58, 0.00)
0.5 0.00 (-0.17, 0.00)
1st 0.00 (-0.14, 0.00)
5th 0.00 (-0.07, 0.00)
10th 0.00 (-0.04, 0.12)
25th 0.26 (-0.02, 0.53)
50th 0.79 (0.00, 1.28)
75th 2.12 (1.26, 3.05)
90th 4.31 (3.21, 5.44)
95th 5.14 (3.93, 6.33)
99th 5.68 (4.24, 7.71)
99.5th 5.80 (4.29, 8.20)
99.9th 5.95 (4.40, 8.98)
Average for all children 1.43 (0.94, 1.94)
(d)(4) Species-by-Species Results for Later Age Verbal Development Involving Individual Consumption Tables A-11 and A-12 present species-by-species results for later age verbal development. The results are presented as changes in verbal IQ points. In Table A-11, all fish are assumed to be alike in terms of beneficial effect while in Table A-12 omega-3 fatty acids are assumed to be the source of the beneficial effect. All fish and market types in Table A-11 are estimated to be net beneficial at relatively low levels of consumption (central estimates). The only possible exceptions are tilefish from the Gulf of Mexico, swordfish, and shark, which might never be net beneficial as indicated by lower bound confidence limits of zero.
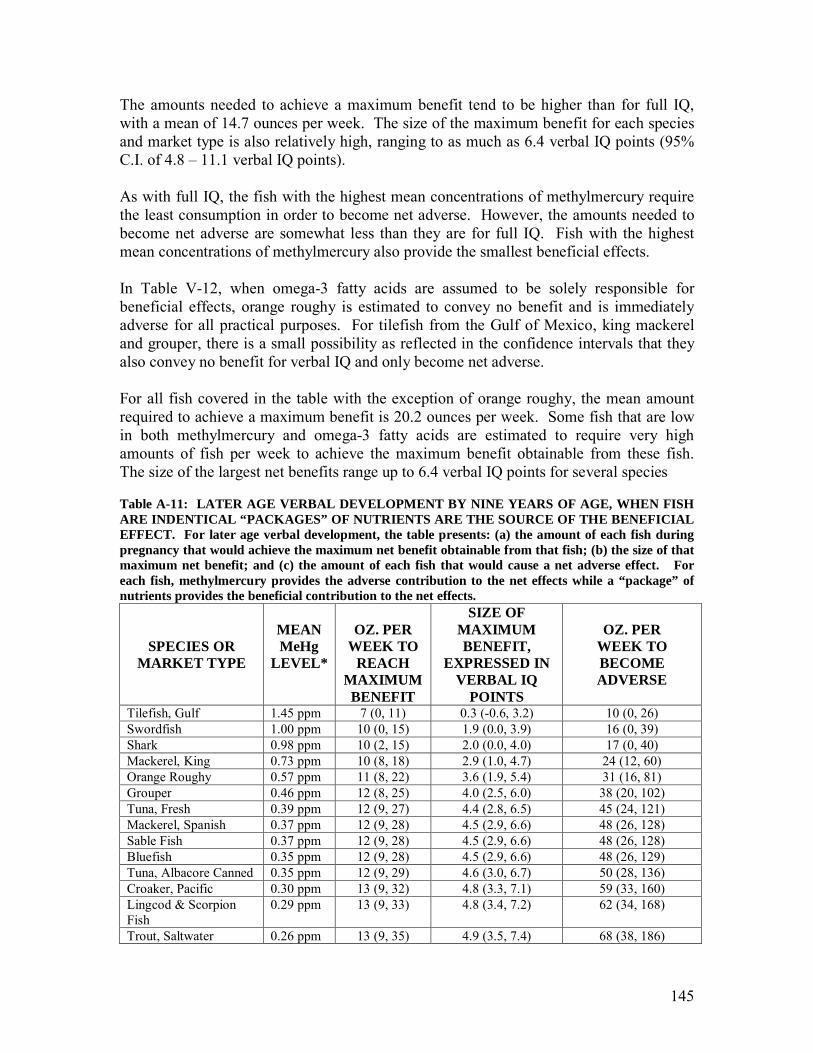
145
The amounts needed to achieve a maximum benefit tend to be higher than for full IQ, with a mean of 14.7 ounces per week. The size of the maximum benefit for each species and market type is also relatively high, ranging to as much as 6.4 verbal IQ points (95% C.I. of 4.8 – 11.1 verbal IQ points). As with full IQ, the fish with the highest mean concentrations of methylmercury require the least consumption in order to become net adverse. However, the amounts needed to become net adverse are somewhat less than they are for full IQ. Fish with the highest mean concentrations of methylmercury also provide the smallest beneficial effects. In Table V-12, when omega-3 fatty acids are assumed to be solely responsible for beneficial effects, orange roughy is estimated to convey no benefit and is immediately adverse for all practical purposes. For tilefish from the Gulf of Mexico, king mackerel and grouper, there is a small possibility as reflected in the confidence intervals that they also convey no benefit for verbal IQ and only become net adverse. For all fish covered in the table with the exception of orange roughy, the mean amount required to achieve a maximum benefit is 20.2 ounces per week. Some fish that are low in both methylmercury and omega-3 fatty acids are estimated to require very high amounts of fish per week to achieve the maximum benefit obtainable from these fish. The size of the largest net benefits range up to 6.4 verbal IQ points for several species Table A-11: LATER AGE VERBAL DEVELOPMENT BY NINE YEARS OF AGE, WHEN FISH ARE INDENTICAL “PACKAGES” OF NUTRIENTS ARE THE SOURCE OF THE BENEFICIAL EFFECT. For later age verbal development, the table presents: (a) the amount of each fish during pregnancy that would achieve the maximum net benefit obtainable from that fish; (b) the size of that maximum net benefit; and (c) the amount of each fish that would cause a net adverse effect. For each fish, methylmercury provides the adverse contribution to the net effects while a “package” of nutrients provides the beneficial contribution to the net effects.
SPECIES OR MARKET TYPE
MEAN MeHg
LEVEL*
OZ. PER
WEEK TO REACH
MAXIMUM BENEFIT
SIZE OF MAXIMUM BENEFIT,
EXPRESSED IN VERBAL IQ
POINTS
OZ. PER
WEEK TO BECOME ADVERSE
Tilefish, Gulf 1.45 ppm 7 (0, 11) 0.3 (-0.6, 3.2) 10 (0, 26) Swordfish 1.00 ppm 10 (0, 15) 1.9 (0.0, 3.9) 16 (0, 39) Shark 0.98 ppm 10 (2, 15) 2.0 (0.0, 4.0) 17 (0, 40) Mackerel, King 0.73 ppm 10 (8, 18) 2.9 (1.0, 4.7) 24 (12, 60) Orange Roughy 0.57 ppm 11 (8, 22) 3.6 (1.9, 5.4) 31 (16, 81) Grouper 0.46 ppm 12 (8, 25) 4.0 (2.5, 6.0) 38 (20, 102) Tuna, Fresh 0.39 ppm 12 (9, 27) 4.4 (2.8, 6.5) 45 (24, 121) Mackerel, Spanish 0.37 ppm 12 (9, 28) 4.5 (2.9, 6.6) 48 (26, 128) Sable Fish 0.37 ppm 12 (9, 28) 4.5 (2.9, 6.6) 48 (26, 128) Bluefish 0.35 ppm 12 (9, 28) 4.5 (2.9, 6.6) 48 (26, 129) Tuna, Albacore Canned 0.35 ppm 12 (9, 29) 4.6 (3.0, 6.7) 50 (28, 136) Croaker, Pacific 0.30 ppm 13 (9, 32) 4.8 (3.3, 7.1) 59 (33, 160) Lingcod & Scorpion Fish
0.29 ppm 13 (9, 33) 4.8 (3.4, 7.2) 62 (34, 168)
Trout, Saltwater 0.26 ppm 13 (9, 35) 4.9 (3.5, 7.4) 68 (38, 186)
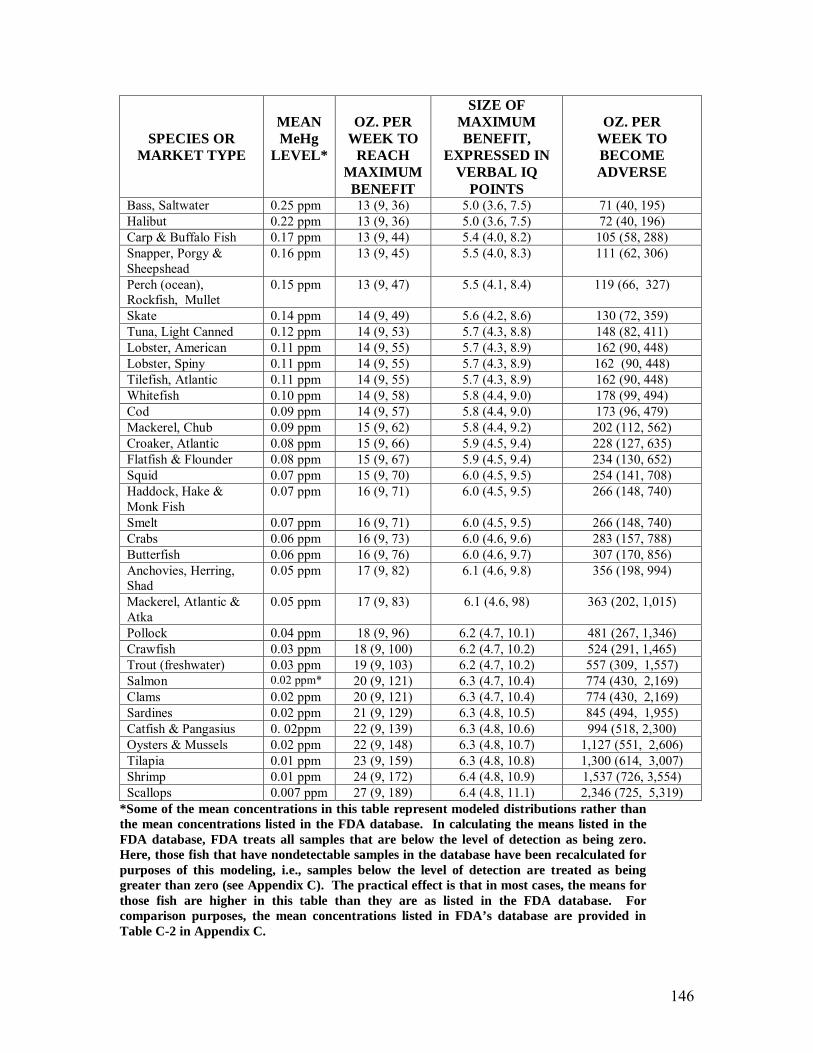
146
SPECIES OR MARKET TYPE
MEAN MeHg
LEVEL*
OZ. PER
WEEK TO REACH
MAXIMUM BENEFIT
SIZE OF MAXIMUM BENEFIT,
EXPRESSED IN VERBAL IQ
POINTS
OZ. PER
WEEK TO BECOME ADVERSE
Bass, Saltwater 0.25 ppm 13 (9, 36) 5.0 (3.6, 7.5) 71 (40, 195) Halibut 0.22 ppm 13 (9, 36) 5.0 (3.6, 7.5) 72 (40, 196) Carp & Buffalo Fish 0.17 ppm 13 (9, 44) 5.4 (4.0, 8.2) 105 (58, 288) Snapper, Porgy & Sheepshead
0.16 ppm 13 (9, 45) 5.5 (4.0, 8.3) 111 (62, 306)
Perch (ocean), Rockfish, Mullet
0.15 ppm 13 (9, 47) 5.5 (4.1, 8.4) 119 (66, 327)
Skate 0.14 ppm 14 (9, 49) 5.6 (4.2, 8.6) 130 (72, 359) Tuna, Light Canned 0.12 ppm 14 (9, 53) 5.7 (4.3, 8.8) 148 (82, 411) Lobster, American 0.11 ppm 14 (9, 55) 5.7 (4.3, 8.9) 162 (90, 448) Lobster, Spiny 0.11 ppm 14 (9, 55) 5.7 (4.3, 8.9) 162 (90, 448) Tilefish, Atlantic 0.11 ppm 14 (9, 55) 5.7 (4.3, 8.9) 162 (90, 448) Whitefish 0.10 ppm 14 (9, 58) 5.8 (4.4, 9.0) 178 (99, 494) Cod 0.09 ppm 14 (9, 57) 5.8 (4.4, 9.0) 173 (96, 479) Mackerel, Chub 0.09 ppm 15 (9, 62) 5.8 (4.4, 9.2) 202 (112, 562) Croaker, Atlantic 0.08 ppm 15 (9, 66) 5.9 (4.5, 9.4) 228 (127, 635) Flatfish & Flounder 0.08 ppm 15 (9, 67) 5.9 (4.5, 9.4) 234 (130, 652) Squid 0.07 ppm 15 (9, 70) 6.0 (4.5, 9.5) 254 (141, 708) Haddock, Hake & Monk Fish
0.07 ppm 16 (9, 71) 6.0 (4.5, 9.5) 266 (148, 740)
Smelt 0.07 ppm 16 (9, 71) 6.0 (4.5, 9.5) 266 (148, 740) Crabs 0.06 ppm 16 (9, 73) 6.0 (4.6, 9.6) 283 (157, 788) Butterfish 0.06 ppm 16 (9, 76) 6.0 (4.6, 9.7) 307 (170, 856) Anchovies, Herring, Shad
0.05 ppm 17 (9, 82) 6.1 (4.6, 9.8) 356 (198, 994)
Mackerel, Atlantic & Atka
0.05 ppm 17 (9, 83) 6.1 (4.6, 98) 363 (202, 1,015)
Pollock 0.04 ppm 18 (9, 96) 6.2 (4.7, 10.1) 481 (267, 1,346) Crawfish 0.03 ppm 18 (9, 100) 6.2 (4.7, 10.2) 524 (291, 1,465) Trout (freshwater) 0.03 ppm 19 (9, 103) 6.2 (4.7, 10.2) 557 (309, 1,557) Salmon 0.02 ppm* 20 (9, 121) 6.3 (4.7, 10.4) 774 (430, 2,169) Clams 0.02 ppm 20 (9, 121) 6.3 (4.7, 10.4) 774 (430, 2,169) Sardines 0.02 ppm 21 (9, 129) 6.3 (4.8, 10.5) 845 (494, 1,955) Catfish & Pangasius 0. 02ppm 22 (9, 139) 6.3 (4.8, 10.6) 994 (518, 2,300) Oysters & Mussels 0.02 ppm 22 (9, 148) 6.3 (4.8, 10.7) 1,127 (551, 2,606) Tilapia 0.01 ppm 23 (9, 159) 6.3 (4.8, 10.8) 1,300 (614, 3,007) Shrimp 0.01 ppm 24 (9, 172) 6.4 (4.8, 10.9) 1,537 (726, 3,554) Scallops 0.007 ppm 27 (9, 189) 6.4 (4.8, 11.1) 2,346 (725, 5,319)
*Some of the mean concentrations in this table represent modeled distributions rather than the mean concentrations listed in the FDA database. In calculating the means listed in the FDA database, FDA treats all samples that are below the level of detection as being zero. Here, those fish that have nondetectable samples in the database have been recalculated for purposes of this modeling, i.e., samples below the level of detection are treated as being greater than zero (see Appendix C). The practical effect is that in most cases, the means for those fish are higher in this table than they are as listed in the FDA database. For comparison purposes, the mean concentrations listed in FDA’s database are provided in Table C-2 in Appendix C.

147
Table A-12: LATER AGE VERBAL DEVELOPMENT BY NINE YEARS OF AGE, WHEN OMEGA-3 FATTY ACIDS IN FISH ARE THE SOLE SOURCE OF THE BENEFICIAL EFFECT. For later early age verbal development, the table presents: (a) the amount of each fish during pregnancy that would achieve the maximum net benefit obtainable from that fish; (b) the size of that maximum net benefit; and (c) the amount of each fish that would cause a net adverse effect. For each fish, methylmercury provides the adverse contribution to the net effects while omega-3 fatty acids provide the beneficial contribution to the net effects.
SPECIES OR MARKET
TYPE
MEAN MeHg
LEVEL*
MEAN OMEGA-3 FATTY
ACID LEVEL
(g PUFA/ 100 g FISH)
OZ. PER WEEK TO
REACH MAXIMUM
BENEFIT
SIZE OF MAXIMUM BENEFIT,
EXPRESSED IN VERBAL IQ POINTS
OZ. PER
WEEK TO BECOME ADVERSE
Tilefish, Gulf 1.45 ppm 0.8 0 6 (1, 10) 2.1 (0.0, 4.0) 11 (0, 27) Swordfish 1.00 ppm 0.90 6 (5, 12) 3.5 (1.8, 5.3) 17 (9, 46) Shark 0.98 ppm 0.69 8 (6, 14) 2.9 (0.9, 4.7) 18 (9, 44) Mackerel, King 0.73 ppm 0.40 13 (3, 20) 2.1 (0.0, 4.4) 23 (4, 55) Orange Roughy 0.57 ppm 0.03 0 (0, 0) 0.0 (0.0, 0.0) 0 (0, 0) Grouper 0.46 ppm 0.25 20 (5, 31) 2.0 (0.0, 4.0) 35 (0, 87) Tuna, Fresh 0.39 ppm 0.65 10 (7, 25) 4.7 (3.2, 7.0) 45 (25, 123) Mackerel, Spanish 0.37 ppm 1.24 6 (4, 19) 5.5(4.0, 8.4) 48 (27, 133) Sable Fish 0.37 ppm 1.81 4 (3, 16) 5.8 (4.3, 8.9) 48 (27, 133) Bluefish 0.35 ppm 0.99 7 (5, 22 ) 5.2 (3.8, 8.0) 48 (27, 132) Tuna, Albacore Canned
0.35 ppm 0.86 8 (5, 24) 5.2 (3.7, 7.8) 51 (28, 139)
Croaker, Pacific 0.30 ppm 0.30 19 (14, 40) 3.7 (2.2, 5.5) 58 (31, 154) Lingcod & Scorpion Fish
0.29 ppm 0.26 21 (16, 43) 3.6 (1.9, 5.4) 61 (33, 161)
Trout, Saltwater 0.26 ppm 0.62 11 (7, 32) 5.1 (3.7, 7.7) 68 (38, 187) Bass, Saltwater 0.25 ppm 0.97 7 (5, 27) 5.6 (4.2, 8.6) 72 (40, 198) Halibut 0.22 ppm 0.71 10 (7, 31) 5.3 (3.9, 8.1) 72 (40, 198) Carp & Buffalo Fish
0.17 ppm 0.45 15 (10, 47) 5.3 (389, 8.0) 104 (58, 287)
Snapper, Porgy & Sheepshead
0.16 ppm 0.26 25 (18, 62) 4.7 (3.1, 6.9) 110 (61, 299)
Perch (ocean), Rockfish, Mullet
0.15 ppm 0.29 22 (16, 61) 4.9 (3.5, 7.4) 118 (66, 322)
Skate 0.14 ppm 0.30 22 (15, 63) 5.0 (3.6, 7.6) 129 (72, 354) Tuna, Light Canned
0.12 ppm 0.27 24 (17, 71) 5.1 (3.6, 7.6) 148 (82, 404)
Lobster, American 0.11 ppm 0.20 34 (24, 86) 4.8 (3.3, 7.1) 161 (89, 437) Lobster, Spiny 0.11 ppm 0.48 15 (10, 57) 5.7 (4.3, 8.8) 162 (90, 448) Tilefish, Atlantic 0.11 ppm 0.91 9 (5, 42) 6.0 (4.6, 9.6) 162 (90, 451) Whitefish 0.10 ppm 0.91 9 (5, 44) 6.0 (4.6, 9.7) 178 (99, 497) Cod 0.09 ppm 0.16 40 (29, 98) 4.6 (3.1, 6.8) 171 (94, 463) Mackerel, Chub 0.09 ppm 1.23 8 (4, 40) 6.2 (4.7, 10.1) 202 (112, 566) Croaker, Atlantic 0.08 ppm 0.20 33 (23, 103) 5.2 (3.8, 7.9) 228 (127, 624) Flatfish & Flounder
0.08 ppm 0.30 24 (15, 87) 5.7 (4.2, 8.6) 234 (130, 647)
Squid 0.07 ppm 0.54 15 (9, 68) 6.0 (4.5, 9.5) 254 (141, 709) Haddock, Hake & 0.07 ppm 0.16 42 (29, 125) 5.1 (3.7, 7.8) 265 (147, 607)
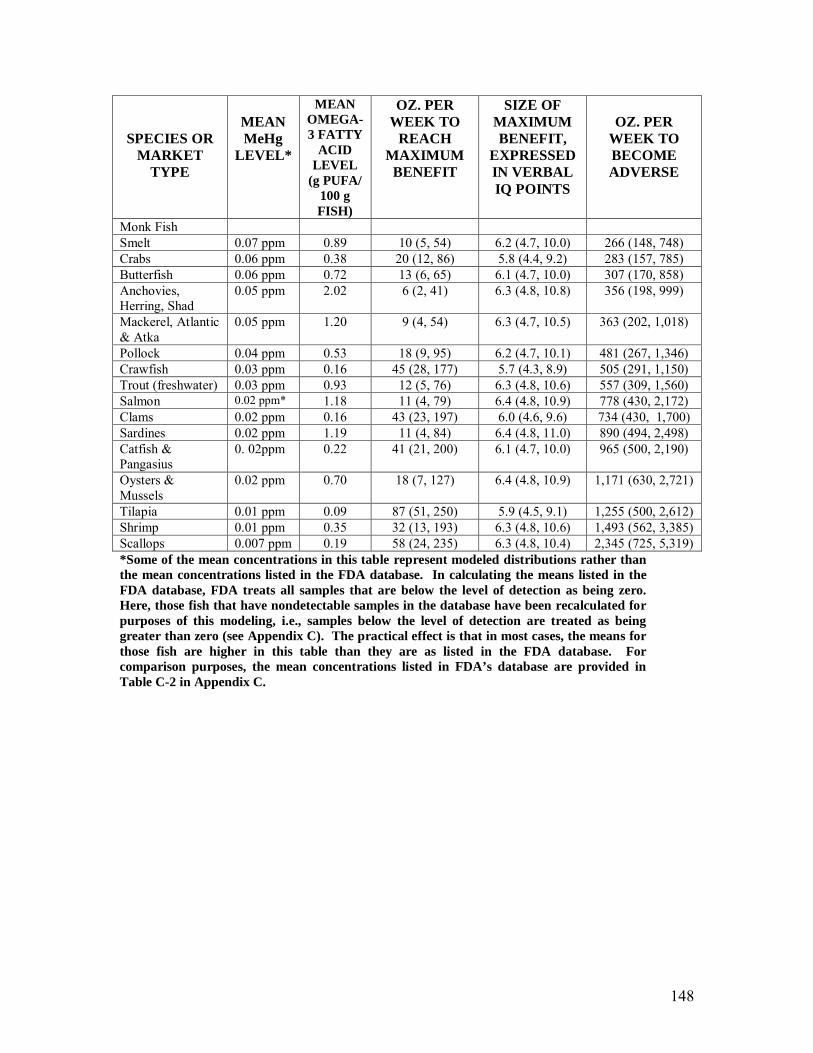
148
SPECIES OR MARKET
TYPE
MEAN MeHg
LEVEL*
MEAN OMEGA-3 FATTY
ACID LEVEL
(g PUFA/ 100 g FISH)
OZ. PER WEEK TO
REACH MAXIMUM
BENEFIT
SIZE OF MAXIMUM BENEFIT,
EXPRESSED IN VERBAL IQ POINTS
OZ. PER
WEEK TO BECOME ADVERSE
Monk Fish Smelt 0.07 ppm 0.89 10 (5, 54) 6.2 (4.7, 10.0) 266 (148, 748) Crabs 0.06 ppm 0.38 20 (12, 86) 5.8 (4.4, 9.2) 283 (157, 785) Butterfish 0.06 ppm 0.72 13 (6, 65) 6.1 (4.7, 10.0) 307 (170, 858) Anchovies, Herring, Shad
0.05 ppm 2.02 6 (2, 41) 6.3 (4.8, 10.8) 356 (198, 999)
Mackerel, Atlantic & Atka
0.05 ppm 1.20 9 (4, 54) 6.3 (4.7, 10.5) 363 (202, 1,018)
Pollock 0.04 ppm 0.53 18 (9, 95) 6.2 (4.7, 10.1) 481 (267, 1,346) Crawfish 0.03 ppm 0.16 45 (28, 177) 5.7 (4.3, 8.9) 505 (291, 1,150) Trout (freshwater) 0.03 ppm 0.93 12 (5, 76) 6.3 (4.8, 10.6) 557 (309, 1,560) Salmon 0.02 ppm* 1.18 11 (4, 79) 6.4 (4.8, 10.9) 778 (430, 2,172) Clams 0.02 ppm 0.16 43 (23, 197) 6.0 (4.6, 9.6) 734 (430, 1,700) Sardines 0.02 ppm 1.19 11 (4, 84) 6.4 (4.8, 11.0) 890 (494, 2,498) Catfish & Pangasius
0. 02ppm 0.22 41 (21, 200) 6.1 (4.7, 10.0) 965 (500, 2,190)
Oysters & Mussels
0.02 ppm 0.70 18 (7, 127) 6.4 (4.8, 10.9) 1,171 (630, 2,721)
Tilapia 0.01 ppm 0.09 87 (51, 250) 5.9 (4.5, 9.1) 1,255 (500, 2,612) Shrimp 0.01 ppm 0.35 32 (13, 193) 6.3 (4.8, 10.6) 1,493 (562, 3,385) Scallops 0.007 ppm 0.19 58 (24, 235) 6.3 (4.8, 10.4) 2,345 (725, 5,319) *Some of the mean concentrations in this table represent modeled distributions rather than the mean concentrations listed in the FDA database. In calculating the means listed in the FDA database, FDA treats all samples that are below the level of detection as being zero. Here, those fish that have nondetectable samples in the database have been recalculated for purposes of this modeling, i.e., samples below the level of detection are treated as being greater than zero (see Appendix C). The practical effect is that in most cases, the means for those fish are higher in this table than they are as listed in the FDA database. For comparison purposes, the mean concentrations listed in FDA’s database are provided in Table C-2 in Appendix C.
149
APPENDIX B: Summary of Research and Modeling Results
(a) Summary and Interpretation of Research Results (a)(1) Research Results Relating to Prenatal Exposure The published research consistently indicates that maternal consumption of fish during pregnancy can affect fetal neurodevelopment. These effects appear to include adverse and beneficial contributions from methylmercury37 and nutrients in fish respectively. The evidence from this research consists of associational relationships between fish consumption during pregnancy and/or exposure to methylmercury during pregnancy and scores on neurodevelopmental tests at various ages after the children are born. Higher fish consumption, or greater exposure to methylmercury, is either significantly associated with higher or lower scores, or is not significantly associated with scores. Whether a net effect on a child is adverse or beneficial appears to depend largely on amounts of methylmercury relative to beneficial nutrients in the fish consumed by the mother during pregnancy. Where a net effect is beneficial, it is estimated to be smaller than it otherwise would have been if there had been no methylmercury in the fish. Increasing exposure to methylmercury can reduce a beneficial net effect and eventually replace with an adverse net effect. An adverse net effect is likely to be reduced to some degree by beneficial nutrients. Net effects in study populations in the United States and in locations where similar amounts of fish are eaten have been mostly beneficial, presumably because methylmercury was often low relative to beneficial nutrients in the fish, and because consumption did not generally reach amounts needed for methylmercury to become the dominant effect. The beneficial effects increased along with consumption until they started to level off or reach a plateau. The largest reported beneficial net effects have involved consumption at or somewhat above 12 ounces of fish per week during pregnancy. Additionally, once a beneficial plateau is reached, there is evidence that more fish consumption can cause a net beneficial effect to become smaller as exposure to methylmercury increases. There is no evidence for a plateau in methylmercury toxicity. When exposure to methylmercury becomes high enough relative to beneficial nutrients there is evidence that a net effect can be adverse. 37 While other chemicals that can accumulate in fish, such as polychlorinated biphenyls (PCBs), can also affect neurodevelopment (IOM 2006), they are not common to commercial species sold in the United States or to commercial species generally, and we do not regard them as significant contributors to the net effects in most of the research studies. Whether they may have contributed to results in the Faroe Islands (and possibly in the Poland study) remains an open scientific question (Risher et al., 2003).
150
This picture may require adjustment and filling in as new research is published. For example, the relative contributions of various nutrients in fish to the beneficial effects on neurodevelopment are not well understood. (a)(2) Research Results Relating to Postnatal Exposure It is a reasonable hypothesis that fish consumption by young children can affect their neurodevelopment because their nervous systems are still developing. They might be especially vulnerable to methylmercury and could also be especially receptive to beneficial nutrients in fish. In summary, there is consistent evidence that young children can benefit from their own fish consumption but the evidence is not consistent about whether young children are especially vulnerable to adverse effects from methylmercury from postnatal exposure. This is an area in need of additional research. One study with 72 participants has found an adverse association between post-natal exposure to methylmercury and neurodevelopmental outcomes. Four studies with just under a total of 10,000 participants have found beneficial associations with either methylmercury (three studies) or fish consumption (one study). These studies cover ages from 12 months to 14 years, and a broad range of exposures to methylmercury, from relatively low in the United States through a mean mercury hair level of 14.9 ppm in the Seychelles Islands. (The NHANES survey has estimated a mean of 0.22 ppm for U.S. children one to five years of age (McDowell et al., 2004)). On the question of whether and how maternal fish consumption during lactation may affect neurodevelopment, the evidence from human studies is limited to two studies. Each provides evidence that a beneficial effect is possible. An adverse net effect from methylmercury in mother’s milk remains a theoretical possibility, but this subject will require additional research. (b) Summary and Interpretation of Modeling Results This assessment estimates the net effects of commercial fish consumption during pregnancy on fetal neurodevelopment. To do so, dose-response relationships were developed for adverse effects from methylmercury and beneficial effects from fish, the latter presumably caused by one or more nutrients in the fish, then added together to estimate the net effects. We assume that the adverse and beneficial effects are independent of one another and that net effects from commercial fish are essentially sums of the two. The assessment estimates net effects on fetal neurodevelopment by estimating net effects on IQ through nine years of age (the primary model) and on verbal development through about 18 months of age (the secondary model). We assume that both endpoints are representative of the effects of fish consumption on fetal neurodevelopment generally.
151
For purposes of comparison, the assessment also estimates the effects on verbal development through six to nine years of age. As modeled, the net effects on this endpoint appear to be particularly sensitive to both methylmercury and to fish nutrients and not representative of net effects generally. The dose-response function for methylmercury was primarily derived from results on the Boston Naming Test, which appeared to be sensitive to methylmercury in the Faroe Islands Study. The dose-response function for beneficial nutrients was derived from results on tests of verbal IQ (a subset of full IQ), which appeared to be particularly beneficial in a study in the United Kingdom. Regardless of endpoint, the assessment estimates that both adverse effects from methylmercury and beneficial effects from nutrients are contributing to the net effects on fetal neurodevelopment from eating commercial fish during pregnancy in the United States. The adverse contributions from methylmercury are estimated to increase indefinitely in proportion to exposure. The beneficial contributions from nutrients are estimated to increase substantially at relatively low levels of fish consumption but then reach a plateau beyond which there are no further increases. The beneficial contributions are initially larger than the adverse contributions. Consequently, net effects for most species become beneficial at relatively low levels of fish consumption, although the size of any particular net benefit is somewhat smaller than it otherwise would have been due to methylmercury. Net benefits increase with consumption until a maximum net benefit is reached. When consumption exceeds this amount, the net benefits decrease gradually due to increasing exposure to methylmercury. If consumption becomes high enough, net benefits are replaced by net adverse effects. This phenomenon occurs for nearly all species of commercial fish, as described in the species-by-species results, below.
(b)(1) Species-By-Species Results Involving Individual Consumption The assessment evaluated 47 commercial fish species and market types to estimate for each species: (a) the amount of fish needed per week to obtain the maximum benefit; (b) the size of that maximum benefit; and (c) the amount of fish needed per week for the net effect to become adverse. The assessment modeled two different assumptions, as follows: Fish are Assumed to be Identical “Packages” of Beneficial Nutrients: When this assumption is modeled, all of the 47 commercial fish species and market types are likely to become net beneficial at relatively low levels of consumption, as reflected by the central estimates. IQ When Fish are Identical “Packages” of Nutrients:
• The mean amount at which the 47 species reach a maximum net benefit is 9.1 ounces per week. This amount represents current consumption above the 90th
152
percentile, meaning that less than 10 percent of women aged 16-45 presently eat that much fish (see Table V-1).
• The size of this maximum net benefit ranges from a low of 1.4 IQ points (95%
C.I. of 0.0 – 2.7 IQ points) to a high of 3.3 IQ points (95% C.I. of 2.7 – 4.3 IQ points), depending on the amount of methylmercury in the fish being consumed, with a mean for all fish of 3 IQ points. Less methylmercury results in a larger maximum net benefit. The mean maximum net benefit for the top 10 species by market share is 3.2 IQ points (see Table II-1 in Section II). By contrast, the average effect that U.S. children are now getting from maternal fish consumption is estimated to be a benefit of 0.7 of an IQ point.
• The four commercial fish highest in methylmercury that have been recommended
for avoidance by pregnant and nursing women and young children (shark, swordfish, king mackerel and tilefish from the Gulf of Mexico) are estimated to become net adverse between 16 ounces per week (95% C.I. of 0 – 30 oz/wk) and 32 ounces per week (95% C.I. of 16 – 59 oz/wk). These amounts are between the 95th and the 99.5th percentiles of consumption. There is a small possibility, however, that Gulf tilefish convey no benefit and are immediately adverse.
• The remainder of commercial fish do not become net adverse until consumption
reaches the 99.5th percentile. For many species, especially those relatively low in methylmercury, the amounts per week needed to become net adverse are too high to be realistically consumed.
Early Age Verbal Development When Fish are Identical “Packages” of Nutrients:
• For all 47 types of fish, the mean amount that must be eaten per week to reach a
maximum net benefit is 8.1 ounces. This amount also represents current consumption just below the 90th percentile.
• The size of the maximum net benefit ranges from 1.1 IQse points (95% C.I. of 0.0
– 2.3 IQse points) to 2.2 IQse points (95% C.I. of 1.4 – 3.0 IQse points) depending on the amount of methylmercury in the fish being consumed, with a mean for all fish of 1.7 IQse points. For the top 10 species by market share, the mean maximum net benefit is 2.1 IQse points. By comparison, the population-level benefit to early age verbal development that children are now getting from maternal fish consumption is estimated to be 1.02 IQse, i.e., equivalent in size to 1.02 IQ points.
• The four commercial fish highest in methylmercury that have been recommended
for avoidance are estimated to become net adverse between the 90th and 99th percentiles of consumption, i.e., between 9 ounces per week (95% C.I. of 0 – 24 oz/wk) and 20 ounces per week (95% C.I. of 11– 48 oz/wk). There is a small possibility, as indicated by the confidence limits, that Gulf tilefish, swordfish, and
153
shark are never beneficial and that king mackerel is only slightly beneficial before becoming adverse.
• The remainder of commercial fish become net adverse above the 99th percentile of
consumption, i.e., above 26 ounces per week (95% C.I. of 15 – 62 oz/wk). For many species, especially those relatively low in methylmercury, the amounts per week needed to become net adverse are too high to be realistically consumed.
Later Age Verbal Development When Fish are Identical “Packages” of Nutrients: The apparent sensitivity of the endpoint results in higher amounts that must be eaten to obtain a maximum net benefit. On the other hand, the largest net benefits are also greater.
• The mean amount that must be eaten to reach a maximum net benefit is 14.7
ounces per week. This amount represents current consumption above the 95th percentile.
• The size of the maximum net benefit ranges from 0.3 verbal IQ points (95% C.I. of -0.6 – 3.2 verbal IQ points) to 6.4 verbal IQ points (95% C.I. of 4.8 – 11.1 IQ points), depending on the amount of methylmercury in the fish being consumed, with a mean for all fish of 5.3 verbal IQ points. The mean for the top 10 species by market share is six verbal IQ points. For comparison, the population-level benefit to later age verbal development that children are now getting from maternal fish consumption is estimated to be 1.41 verbal IQ points.
• The four commercial fish highest in methylmercury recommended for avoidance
are estimated to become net adverse between the 90th and the 99th percentiles of current consumption, i.e., 11 ounces per week (95% C.I. of 0 – 27 oz/wk) through 23 ounces per week (95% C.I. of 4 – 55 oz/wk).
• The remainder of commercial fish become net adverse above the 99.5th percentile
of current consumption, i.e., above 33 ounces per week (95% C.I. of 18 – 83 oz/wk). For many species, especially those relatively low in methylmercury, the amounts per week needed to become net adverse are too high to be realistically consumed.
When omega-3 fatty acids are assumed to be the sole source of the beneficial effect: When this assumption is modeled for the above three endpoints, fish that contain higher than average concentrations of omega-3 fatty acids generally require less consumption per week to reach their maximum beneficial effect and the size of that effect is somewhat higher than for fish that contain below average concentrations of omega-3 fatty acids. There is still an overall trend toward smaller net benefits at peak and smaller amounts needed to become net adverse when the fish are higher in methylmercury. These trends are not as straightforward as they are when fish are deemed to be identical “packages” of nutrients, since the amounts of omega-3 fatty acids also affect these outcomes.

154
Orange roughy is unique, however, in that it is unlikely to provide a net benefit at any amount of consumption and is likely and to be net adverse almost immediately, if not immediately, for all three endpoints (i.e., full IQ, early age verbal development, and later age verbal development). This fish is higher in mean methylmercury concentration than most commercial fish but is very low in omega-3 fatty acids. Also, there is some possibility, as presented in the confidence intervals, that tilefish from the Gulf of Mexico and king mackerel are never beneficial for early age verbal development and that these fish plus grouper are never beneficial for later age verbal development. When methylmercury is increased by 20 percent in all fish: We repeated the species-by-species analysis for full IQ by increasing the average methylmercury concentrations in all the fish by 20 percent in order to determine how the modeling results would be affected if we were underestimating these concentrations. As can be seen in Table B-1, a 20 percent increase causes little change in the amounts of fish needed per week to reach the maximum benefits or in the sizes of the peak benefits. The largest changes are in the smaller amounts per week needed for each fish to become net adverse. The central estimates for all these amounts remain above the 95th percentile of consumption for the four fish recommended for avoidance, however, and above the 99.5th percentile for all other fish. The exception is orange roughy, which is immediately net adverse when omega-3 fatty acids are assumed to be the sole source of the beneficial effect. Table B-1: SUMMARY OF THE RESULTS FROM THE SPECIES-BY-SPECIES MODELING. This modeling covers 47 commercial fish and market types.
Fish Are Assumed to be Identical “Packages” of Beneficial Nutrients
IQ (through 9 years
of age)
IQ Sensitivity Analysis
(methylmercury in all fish increased
by 20%)
Early Age Verbal Development (through about 18
months of age)
Later Age Verbal Development
(through 6-9 years of age)
Mean Amount to Reach Max Benefit: All Fish
9.1 oz/wk 8.8 oz/wk 8.1 oz/wk 14.7 oz/wk
Range of Sizes of Max Benefit: All Fish
1.4 (0.0, 2.7) – 3.3 (2.7, 4.3) IQ points
1.0 (0.0, 2.3) – 3.3 (2.7, 4.3) IQ points
1.1 (0.0, 2.3) – 2.2 (1.4, 3.0) IQse points
0.3 (-0.6, 3.2) – 6.4 (4.8, 11.1)
verbal IQ points Mean Size of Max Benefit: All Fish
3.0 IQ points 2.8 IQ points 1.7 IQse points 5.3 verbal IQ points
Mean Size of Max Benefit: Top 10 Fish by Market Share*
3.2 IQ points 3.2 IQ points 2.1 IQse points 6 verbal IQ points
Range of Amounts to Become Net Adverse: 4 “Avoid” Species**
16 (0, 30) – 32 (16, 59) oz/wk
14 (0, 25) – 27 (14, 49) oz/wk
9 (0, 24) – 20 (11, 48) oz/wk
10 (0, 26) – 24 (12, 60)
oz/wk
Range of 41 (21, 76) – 34 (18, 63) – 26 (15, 62) – 31 (16, 81) –
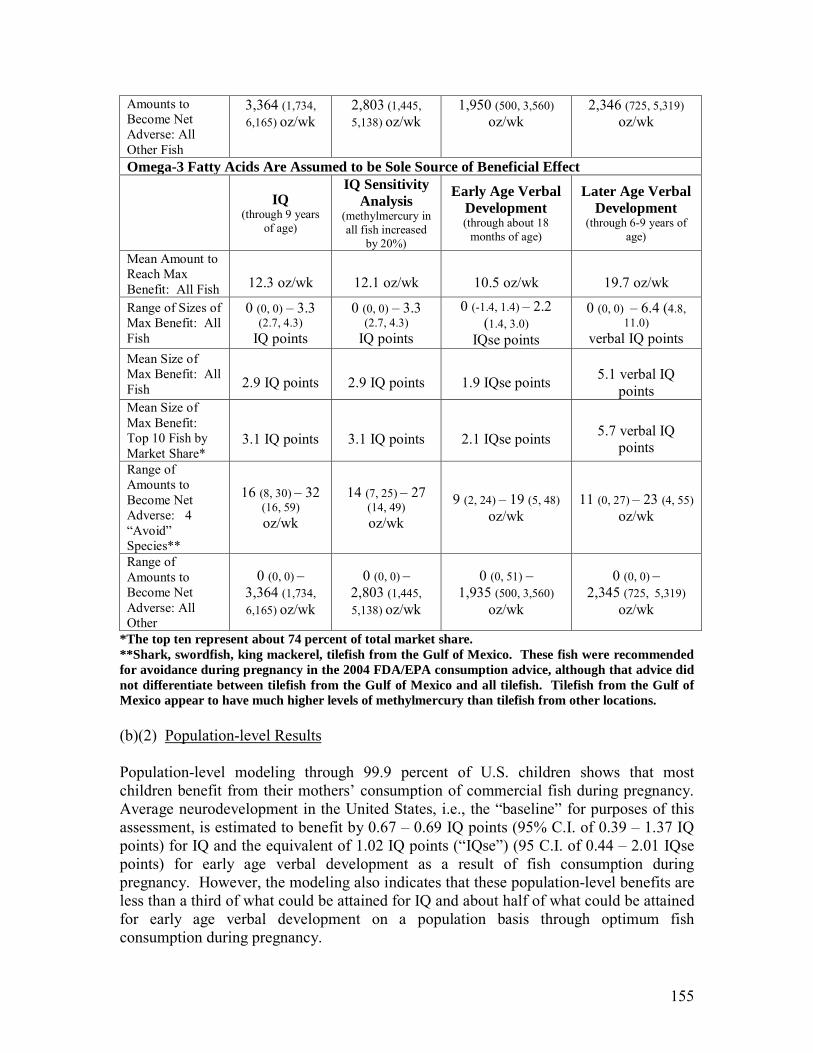
155
Amounts to Become Net Adverse: All Other Fish
3,364 (1,734, 6,165) oz/wk
2,803 (1,445, 5,138) oz/wk
1,950 (500, 3,560) oz/wk
2,346 (725, 5,319) oz/wk
Omega-3 Fatty Acids Are Assumed to be Sole Source of Beneficial Effect
IQ
(through 9 years of age)
IQ Sensitivity Analysis
(methylmercury in all fish increased
by 20%)
Early Age Verbal Development (through about 18
months of age)
Later Age Verbal Development
(through 6-9 years of age)
Mean Amount to Reach Max Benefit: All Fish
12.3 oz/wk
12.1 oz/wk
10.5 oz/wk
19.7 oz/wk
Range of Sizes of Max Benefit: All Fish
0 (0, 0) – 3.3 (2.7, 4.3)
IQ points
0 (0, 0) – 3.3 (2.7, 4.3)
IQ points
0 (-1.4, 1.4) – 2.2 (1.4, 3.0)
IQse points
0 (0, 0) – 6.4 (4.8, 11.0)
verbal IQ points Mean Size of Max Benefit: All Fish
2.9 IQ points
2.9 IQ points
1.9 IQse points
5.1 verbal IQ
points Mean Size of Max Benefit: Top 10 Fish by Market Share*
3.1 IQ points
3.1 IQ points
2.1 IQse points
5.7 verbal IQ
points Range of Amounts to Become Net Adverse: 4 “Avoid” Species**
16 (8, 30) – 32 (16, 59) oz/wk
14 (7, 25) – 27 (14, 49) oz/wk
9 (2, 24) – 19 (5, 48) oz/wk
11 (0, 27) – 23 (4, 55) oz/wk
Range of Amounts to Become Net Adverse: All Other
0 (0, 0) – 3,364 (1,734, 6,165) oz/wk
0 (0, 0) – 2,803 (1,445, 5,138) oz/wk
0 (0, 51) – 1,935 (500, 3,560)
oz/wk
0 (0, 0) – 2,345 (725, 5,319)
oz/wk
*The top ten represent about 74 percent of total market share. **Shark, swordfish, king mackerel, tilefish from the Gulf of Mexico. These fish were recommended for avoidance during pregnancy in the 2004 FDA/EPA consumption advice, although that advice did not differentiate between tilefish from the Gulf of Mexico and all tilefish. Tilefish from the Gulf of Mexico appear to have much higher levels of methylmercury than tilefish from other locations. (b)(2) Population-level Results Population-level modeling through 99.9 percent of U.S. children shows that most children benefit from their mothers’ consumption of commercial fish during pregnancy. Average neurodevelopment in the United States, i.e., the “baseline” for purposes of this assessment, is estimated to benefit by 0.67 – 0.69 IQ points (95% C.I. of 0.39 – 1.37 IQ points) for IQ and the equivalent of 1.02 IQ points (“IQse”) (95 C.I. of 0.44 – 2.01 IQse points) for early age verbal development as a result of fish consumption during pregnancy. However, the modeling also indicates that these population-level benefits are less than a third of what could be attained for IQ and about half of what could be attained for early age verbal development on a population basis through optimum fish consumption during pregnancy.
156
The modeling also estimates that methylmercury influences the net neurodevelopmental outcomes for all fish. In most cases it reduces the size of net benefits but does not eliminate it or cause the net effect to become adverse. In a minority of cases, however, adverse net effects on IQ are estimated to be likely. The modeling for IQ estimates that adverse net effects are likely between one and five percent of children, with the size of the deficits ranging from -0.01 to -0.05 of an IQ point (central estimates). While significant consumption of high methylmercury fish is an obvious explanation for any adverse net effect, another possibility is extremely low fish consumption. This possibility shows up in the model due to the inclusion of data from the ALSPAC study population in the United Kingdom suggesting that that beneficial effects do not begin until some minimal amount of fish is consumed, e.g., over three ounces per week. If that is so, then consumption below some minimal amount could also be somewhat adverse. For five percent of children to be experiencing adverse net effects (or even more than five percent per confidence intervals that include a small possibility of adverse effects at greater percentiles), a combination of both factors, i.e., diets emphasizing high methylmercury fish by some pregnant women and diets involving very low fish consumption by many pregnant women, would seem to be the most likely explanation given the very low amounts of fish eaten by many women and the relatively low market shares for fish highest in methylmercury. Because the population-level modeling does not estimate effects above the 99.9th percentile, it omits the most extreme one-tenth of one percent of consumers, both in terms of amount of fish they eat and their exposures to methylmercury. It is reasonable to assume that net adverse effects are occurring within that subset of the population, especially for those whose diets include high methylmercury fish. These adverse effects would be in addition to those estimated for one-tenth of one percent of children who are within the 99.9th percentile, as described above. In hypothetical modeling involving eight consumption scenarios, the greatest population-wide benefits occurred when all pregnant women ate 12 ounces of fish per week, or approximately the amount needed to obtain the maximum improvement for many fish.38 By contrast, pregnant women in an FDA survey ate a median of under two ounces per week (Lando et al., 2012). In scenarios in which all pregnant women ate exactly eight ounces per week and 18 ounces per week, population gains also occurred, but these gains were slightly smaller due to increases in net benefits above eight ounces and reductions in net benefits beyond 12 ounces per week for most fish. Smaller gains also occurred when amounts of fish were not restricted but the types of fish were limited to those with mean methylmercury concentrations of 0.23 ppm or less. Although this concentration is above the average for commercial fish weighted for consumption, changes in types of fish people eat would still not be extensive on a population-wide basis since only a minority of fish has mean concentrations above this 38 On an individual level this hypothetical would include some losses, however, by those who increase their consumption of high methylmercury fish up to 12 ounces per week.

157
amount. Nonetheless, this result indicates that pregnant women should take into account types of fish they eat during pregnancy as well as amounts. Types of fish that provide the highest possible improvement are typically those that are lower in methylmercury. Table B-2 provides the current population-wide net effects estimated in this assessment. Table B-2: NET EFFECTS BY POPULATION PERCENTILE. For IQ the net effects are measured by changes in IQ points. IQ was modeled twice. For early age verbal development the net effects are measured by “IQ size equivalents” (IQse), which are units of measurement the size of IQ points. For later age verbal development, net effects are measured in terms of verbal IQ points. Verbal IQ is a subset of full IQ. Each percentile in the column represents the percentage of children who are at or below that percentile.
Cumulative Percentiles
of U.S. Children
The Net Effects on Full IQ as Measured by
Changes in Full IQ Points
(Includes Axelrad et al., 2007
Primary Analysis)
The Net Effects on Full IQ as Measured by
Changes in Full IQ Points
(Includes Axelrad et al., 2007 Secondary Analysis)
The Net Effects on Early Age
Verbal Development as
Measured by Changes in IQse
Points
The Net Effects on Later Age
Verbal Development as Measured
by Changes in Verbal IQ
Points
0.1 -0.05 (-0.56, 0.00)
-0.04 (-0.42, 0.00)
0.00 (-0.63, 0.00)
0.00 (-0.58, 0.00)
0.5 -0.02 (-0.27, 0.00)
-0.01 (-0.20, 0.00)
0.00 (-0.05, 0.00)
0.00 (-0.17, 0.00)
1st -0.02 (-0.23, 0.00)
-0.01 (-0.16, 0.00)
0.00 (-0.03, 0.00)
0.00 (-0.14, 0.00)
5th -0.01 (-0.13, 0.00)
0.00 (-0.10, 0.00)
0.00 (-0.02, 0.00)
0.00 (-0.07, 0.00)
10th 0.00 (-0.10, 0.09)
0.00 (-0.07, 0.09)
0.00 (-0.01, 0.50)
0.00 (-0.04, 0.14)
25th 0.00 (-0.05, 0.38)
0.00 (-0.04, 0.39)
0.39 (0.00, 1.91)
0.26 (-0.02, 0.53)
50th 0.03 (-0.02, 0.90)
0.11 (-0.01, 0.92)
1.06 (0.24, 2.36)
0.79 (0.00, 1.28)
75th 0.69 (0.00, 2.03)
0.82 (0.00, 2.04
1.69 (0.61, 2.74)
2.12 (1.26, 3.05)
90th 2.99 (1.92, 3.97)
3.06 (2.01, 4.03)
1.91 (1.12, 2.81)
4.31 (3.21, 5.44)
95th 3.28 (2.40, 4.32)
3.36 (2.50, 4.34)
2.06 (1.23, 2.85)
5.14 (3.93, 6.33)
99th 3.41 (2.56, 4.51)
3.45 (2.63, 4.54)
2.17 (1.37, 2.96)
5.68 (4.24, 7.71)
99.5th 3.42 (2.57, 4.59)
3.46 (2.65, 4.60)
2.20 (1.39, 3.01)
5.80 (4.29, 8.20)
99.9th 3.46 (2.60, 4.62)
3.49 (2.68, 4.63)
2.25 (1.43, 3.11)
5.95 (4.40, 8.98)
Average for all children
0.67 (0.38, 1.34)
0.69 (0.39, 1.37)
1.02 (0.44, 2.01)
1.43 (0.94, 1.94)
158
APPENDIX C: TECHNICAL DESCRIPTION OF THE ASSESSMENT METHODOLOGY
(a) Methylmercury and Fish Exposure Assessment (a)(1) Fish Consumption Overview – Data Sources Estimates of daily fish consumption were developed from several different data sources: 1) The U. S. Department of Agriculture’s (USDA) Continuing Survey of Food Intake by Individuals (CSFII) survey conducted between 1989 and 1991 (USDA 1993); 2) the National Health and Nutrition Survey (NHANES) conducted in 1999-2000 (CDC 2003); and 3) market share data obtained from the National Marine Fisheries Service (NMFS 2008). The aspects of the consumption estimate addressed with the use data from each of these sources is listed in Table C-1. CSFII: As the exposure model was designed to generate estimates for each individual in the CSFII survey, the data from this source figured in just about every aspect of the estimates. Records for all fish consumption events were selected for all individuals for whom a full three-day record was included in the survey (3,525 individuals). The survey data were provided with demographic weights that were used to project the survey to the U.S. population. Although more recent data are available, the 1989-91 data were accumulated from surveys which tabulated consumption over a three-day period, rather than more recent data which contained records for only two days (CSFII 94-98 or NHANES 2003-2006). The additional day makes the 1989-91 survey a better instrument for characterizing the chronic behavior of fish consumers. Daily intakes from CSFII 89-91 and CSFII 1994-98 are similar. NHANES: Data from the 30-day fish consumption survey from NHANES were used for two purposes. First, they were used to adjust the short-term population distribution to generate long term fish consumption frequency population distributions and to estimate. Second, they were used to estimate the extent to which different individuals eat a variety of different fish. In addition, data from later surveys (USDA/HHS 2007) were used to validate the model estimates. NMFS Market Share: Data describing the extent to which different fish species are marketed in the United States were obtained from the NMFS. Market share data were used to allocate frequency of consumption under two different circumstances. First, they were used to allocate species consumption for CSFII food categories that were composed of multiple species. Second, they were used to allocate species consumption when the short-term survey was considered inadequate for a particular serving (see Variation in Fish Species Consumed, below). In addition, a correction factor was applied to portion sizes from the CSFII survey so that total intake matched per capita estimates from NMFS.
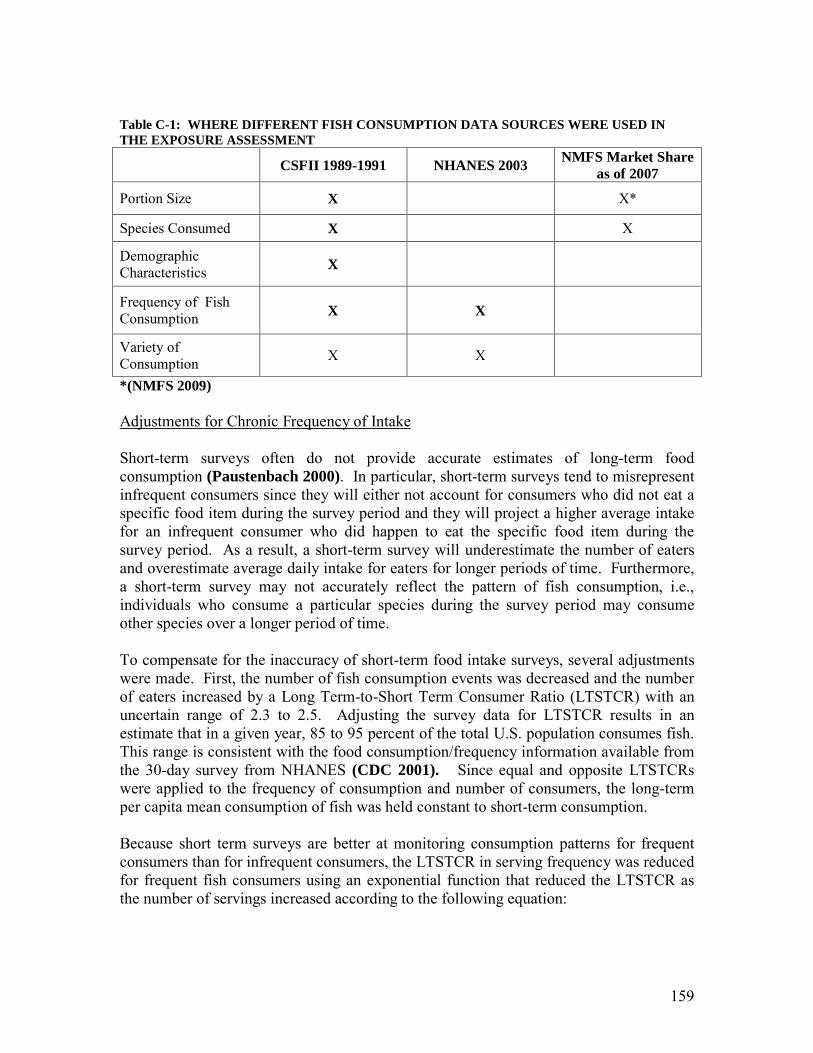
159
Table C-1: WHERE DIFFERENT FISH CONSUMPTION DATA SOURCES WERE USED IN THE EXPOSURE ASSESSMENT
CSFII 1989-1991 NHANES 2003 NMFS Market Share as of 2007
Portion Size X X*
Species Consumed X X
Demographic Characteristics X
Frequency of Fish Consumption X X
Variety of Consumption X X
*(NMFS 2009) Adjustments for Chronic Frequency of Intake Short-term surveys often do not provide accurate estimates of long-term food consumption (Paustenbach 2000). In particular, short-term surveys tend to misrepresent infrequent consumers since they will either not account for consumers who did not eat a specific food item during the survey period and they will project a higher average intake for an infrequent consumer who did happen to eat the specific food item during the survey period. As a result, a short-term survey will underestimate the number of eaters and overestimate average daily intake for eaters for longer periods of time. Furthermore, a short-term survey may not accurately reflect the pattern of fish consumption, i.e., individuals who consume a particular species during the survey period may consume other species over a longer period of time. To compensate for the inaccuracy of short-term food intake surveys, several adjustments were made. First, the number of fish consumption events was decreased and the number of eaters increased by a Long Term-to-Short Term Consumer Ratio (LTSTCR) with an uncertain range of 2.3 to 2.5. Adjusting the survey data for LTSTCR results in an estimate that in a given year, 85 to 95 percent of the total U.S. population consumes fish. This range is consistent with the food consumption/frequency information available from the 30-day survey from NHANES (CDC 2001). Since equal and opposite LTSTCRs were applied to the frequency of consumption and number of consumers, the long-term per capita mean consumption of fish was held constant to short-term consumption. Because short term surveys are better at monitoring consumption patterns for frequent consumers than for infrequent consumers, the LTSTCR in serving frequency was reduced for frequent fish consumers using an exponential function that reduced the LTSTCR as the number of servings increased according to the following equation:
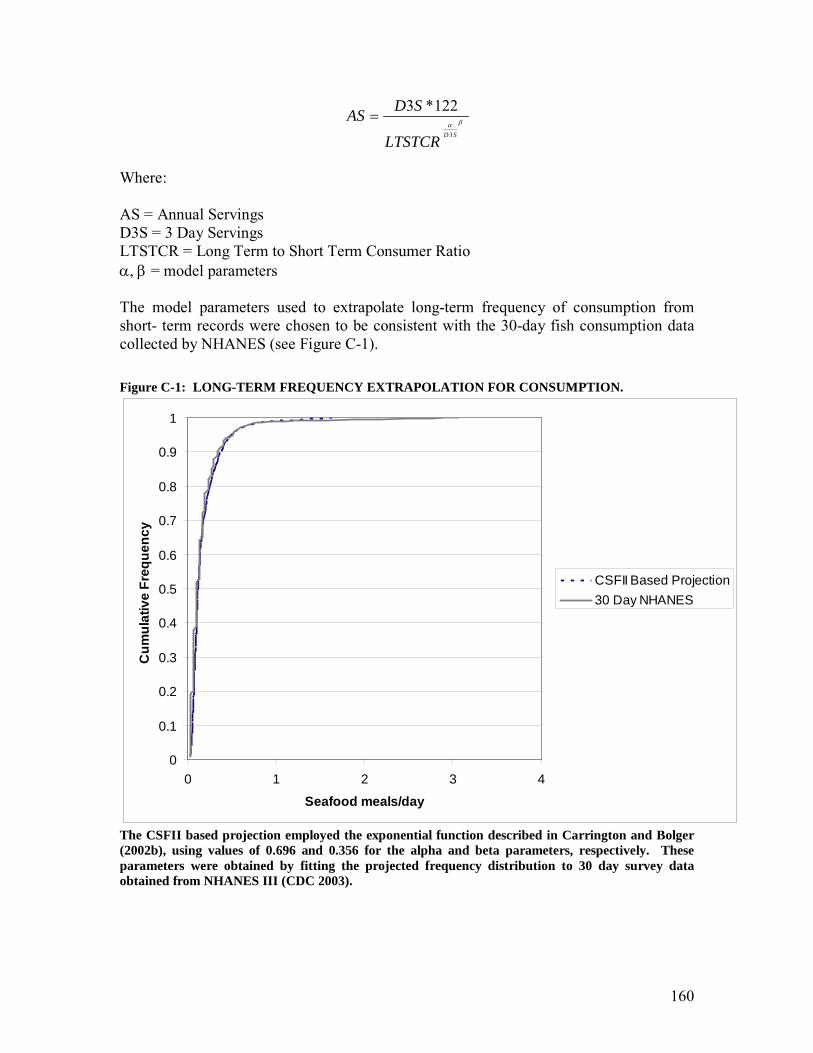
160
βαSDLTSTCR
SDAS3
122*3=
Where: AS = Annual Servings D3S = 3 Day Servings LTSTCR = Long Term to Short Term Consumer Ratio
α, β = model parameters The model parameters used to extrapolate long-term frequency of consumption from short- term records were chosen to be consistent with the 30-day fish consumption data collected by NHANES (see Figure C-1). Figure C-1: LONG-TERM FREQUENCY EXTRAPOLATION FOR CONSUMPTION.
0
0.1
0.2
0.3
0.4
0.5
0.6
0.7
0.8
0.9
1
0 1 2 3 4
Seafood meals/day
Cum
ulat
ive
Freq
uenc
y
CSFII Based Projection30 Day NHANES
The CSFII based projection employed the exponential function described in Carrington and Bolger (2002b), using values of 0.696 and 0.356 for the alpha and beta parameters, respectively. These parameters were obtained by fitting the projected frequency distribution to 30 day survey data obtained from NHANES III (CDC 2003).
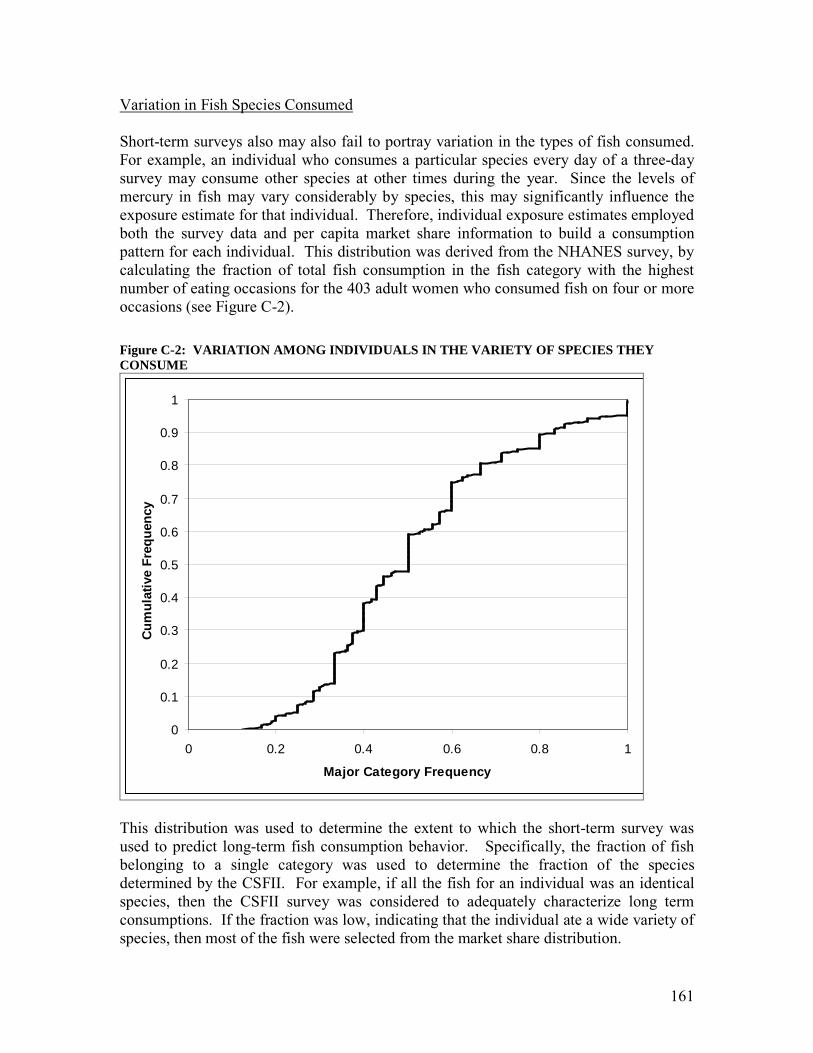
161
Variation in Fish Species Consumed Short-term surveys also may also fail to portray variation in the types of fish consumed. For example, an individual who consumes a particular species every day of a three-day survey may consume other species at other times during the year. Since the levels of mercury in fish may vary considerably by species, this may significantly influence the exposure estimate for that individual. Therefore, individual exposure estimates employed both the survey data and per capita market share information to build a consumption pattern for each individual. This distribution was derived from the NHANES survey, by calculating the fraction of total fish consumption in the fish category with the highest number of eating occasions for the 403 adult women who consumed fish on four or more occasions (see Figure C-2). Figure C-2: VARIATION AMONG INDIVIDUALS IN THE VARIETY OF SPECIES THEY CONSUME
0
0.1
0.2
0.3
0.4
0.5
0.6
0.7
0.8
0.9
1
0 0.2 0.4 0.6 0.8 1
Major Category Frequency
Cum
ulat
ive
Freq
uenc
y
This distribution was used to determine the extent to which the short-term survey was used to predict long-term fish consumption behavior. Specifically, the fraction of fish belonging to a single category was used to determine the fraction of the species determined by the CSFII. For example, if all the fish for an individual was an identical species, then the CSFII survey was considered to adequately characterize long term consumptions. If the fraction was low, indicating that the individual ate a wide variety of species, then most of the fish were selected from the market share distribution.

162
Individual variation in species consumption and overall frequency of consumption were assumed to be independent. The assumption is supported by the observation that the repetition ratio and 30-day frequency of seafood in NHANES was used to determined the extent of variation in species consumption is largely uncorrelated (r = -0.11). Some of the overall variation in species selection by each consumer also comes from CSFII. Since these data are paired, whatever correlation there is between species variation and frequency is represented in the exposure model. However, because the behavior of repetitive consumers are based on an older survey, the model probably over represents fish that were consumed more twenty years ago (e.g. tuna and cod) and under represents those that are consumed more now (e.g. salmon, shrimp, and tilapia). Water Loss during Food Preparation A concentration factor was applied to serving sizes to reflect water loss during food preparation. These factors were based on water loss of 11 percent for fried fish, 21 percent for poached or steamed fish, and 25 percent for baked or broiled fish (EPA 2002, pages 2-5 and 2-6). Group specific correction factors were calculated based on the frequency of different food preparation procedures (e.g., baking, steaming, or frying) within each fish group. A value of 20 percent was used for fish groups represented in the methylmercury surveillance data but not in the CSFII survey. The resulting concentration factors are listed in Table C-3. That table also includes methylmercury concentrations after the application of the correction factors, i.e., after water loss during cooking. Correction factors were not needed for canned tuna since the methylmercury concentration values in that fish group were obtained after cooking and draining of water or oil from the can. Portion Size Adjustment A correction factor of 1.15 was applied to portion sizes from the CSFII survey so that total intake matched per capita estimates from NMFS. This correction was factor was calculated as follows: Average Intake from CSFII (1989-91): 14.3 g/day Average Intake from NMFS (2005): 16.2 lbs/year = 20.1 g/day Weight loss During Cooking: 20 percent Correction factor = 20.1 * 0.8/ 14.2 = 1.125 In addition, a correction factor was added to account for consumption of noncommercial fish which is not included in NMFS landings data. NMFS estimated that an additional nine percent of marine species are caught by recreational fisherman (NMFS 2009). However, this value is not adjusted for domestic consumption and does not include non marine species. Because of these uncertainties, noncommercial fish was estimated to represent somewhere between and additional five and 15 percent of the commercial fish consumption rate.

163
(a)(2) Methylmercury Levels in Fish Methylmercury Concentrations in Individual Species Most surveys of methylmercury in fish, as well as biomarkers in blood and hair, measure total mercury and as a result do not distinguish between inorganic mercury and methylmercury. However, when the forms are speciated it has been shown that most (over 90 percent) of the mercury in fish is methylmercury (WHO 1990; Hight & Cheng, 2006). In order to combine the fish consumption data with the levels of mercury in fish, it was necessary to map the 268 food codes employed in the CSFII survey with the groups used for reporting methylmercury levels (see Table C-2). The mapping resulted in a total of 51 fish groups. In most cases, the correspondence was either direct or the fish ingredient in the survey food code was a member of a methylmercury contamination group. For several species, an analog (or surrogate) was chosen. If there was no other species that was very similar, several new distributions were created that combined multiple methylmercury contamination groups. Specifically, groups were created for crabs, lobster, shellfish, finfish, and all other fish. Per capita market share was used to assign histogram frequencies for each group. Distributions of methylmercury levels in fish were constructed for each of the 51 fish groups which represented over 99 percent of the fish consumed in the United States. Three different methods were used to construct the distributions:
• For fish categories (fresh tuna, canned light tuna, canned albacore tuna, shark, and swordfish) for which there were over 100 observations, distributions were generated empirically by directly sampling from FDA surveillance data.
• For other species for which additional raw survey data are available, distributions
were developed by fitting the distributions to the portions of the cumulative distribution above the levels of detection. A battery of ten distributions was fit to each data set and the four that provided the best fit were used to construct a probability tree. An example is shown in Figure C-3. See Carrington (1996) for further description of the methodology.
• Since raw data were unavailable for some species, distributions were generated
with modeled distributions that reflected reported arithmetic mean values published from a NMFS survey (NMFS 1978) for each group and a range analogous to those obtained from tuna, shark, and swordfish. Log normal and Gamma distributions were used to represent the data, with each model assigned a probability of 0.5 to represent model uncertainty. The magnitude of the shape parameters (the geometric standard deviation of the lognormal distribution and the beta parameter of the gamma distribution) were represented as uniform distributions that encompassed the range of values resulting from fitting the shark, swordfish, and tuna data. The scale parameters (the geometric mean of the
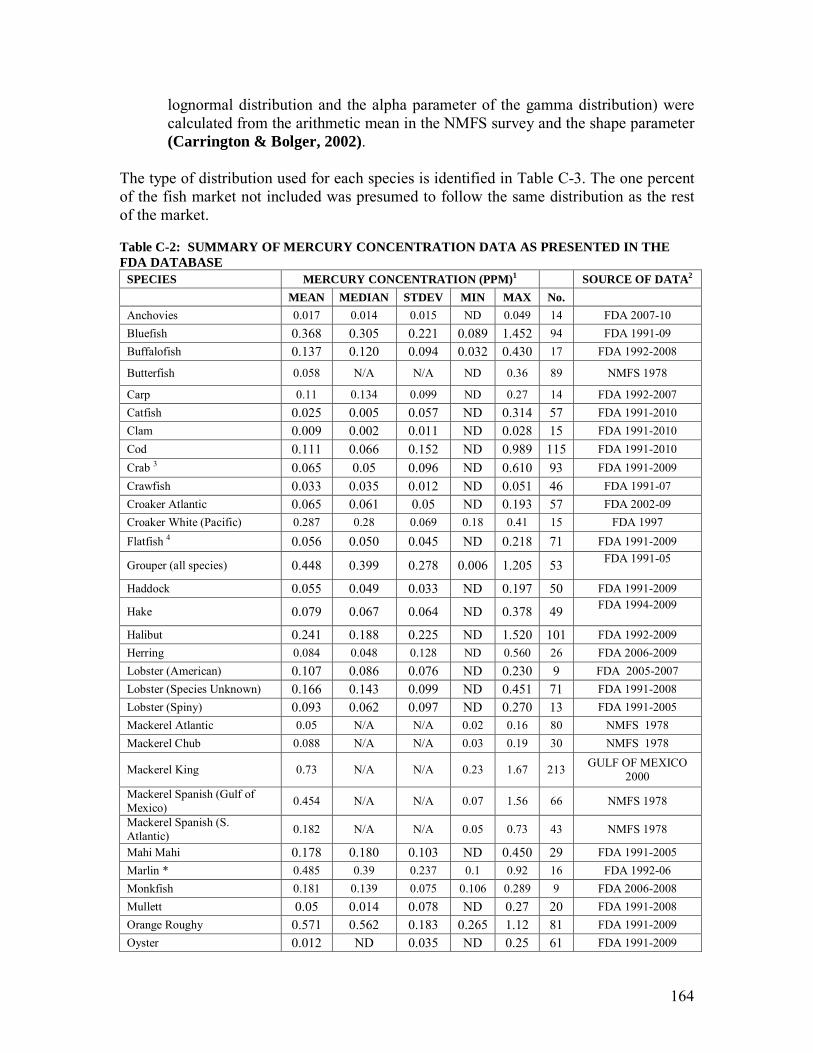
164
lognormal distribution and the alpha parameter of the gamma distribution) were calculated from the arithmetic mean in the NMFS survey and the shape parameter (Carrington & Bolger, 2002).
The type of distribution used for each species is identified in Table C-3. The one percent of the fish market not included was presumed to follow the same distribution as the rest of the market. Table C-2: SUMMARY OF MERCURY CONCENTRATION DATA AS PRESENTED IN THE FDA DATABASE
SPECIES MERCURY CONCENTRATION (PPM)1 SOURCE OF DATA2 MEAN MEDIAN STDEV MIN MAX No. Anchovies 0.017 0.014 0.015 ND 0.049 14 FDA 2007-10 Bluefish 0.368 0.305 0.221 0.089 1.452 94 FDA 1991-09 Buffalofish 0.137 0.120 0.094 0.032 0.430 17 FDA 1992-2008
Butterfish 0.058 N/A N/A ND 0.36 89 NMFS 1978
Carp 0.11 0.134 0.099 ND 0.27 14 FDA 1992-2007 Catfish 0.025 0.005 0.057 ND 0.314 57 FDA 1991-2010 Clam 0.009 0.002 0.011 ND 0.028 15 FDA 1991-2010 Cod 0.111 0.066 0.152 ND 0.989 115 FDA 1991-2010 Crab 3 0.065 0.05 0.096 ND 0.610 93 FDA 1991-2009 Crawfish 0.033 0.035 0.012 ND 0.051 46 FDA 1991-07 Croaker Atlantic 0.065 0.061 0.05 ND 0.193 57 FDA 2002-09 Croaker White (Pacific) 0.287 0.28 0.069 0.18 0.41 15 FDA 1997 Flatfish 4 0.056 0.050 0.045 ND 0.218 71 FDA 1991-2009
Grouper (all species) 0.448 0.399 0.278 0.006 1.205 53 FDA 1991-05
Haddock 0.055 0.049 0.033 ND 0.197 50 FDA 1991-2009
Hake 0.079 0.067 0.064 ND 0.378 49 FDA 1994-2009
Halibut 0.241 0.188 0.225 ND 1.520 101 FDA 1992-2009 Herring 0.084 0.048 0.128 ND 0.560 26 FDA 2006-2009 Lobster (American) 0.107 0.086 0.076 ND 0.230 9 FDA 2005-2007 Lobster (Species Unknown) 0.166 0.143 0.099 ND 0.451 71 FDA 1991-2008 Lobster (Spiny) 0.093 0.062 0.097 ND 0.270 13 FDA 1991-2005 Mackerel Atlantic 0.05 N/A N/A 0.02 0.16 80 NMFS 1978 Mackerel Chub 0.088 N/A N/A 0.03 0.19 30 NMFS 1978
Mackerel King 0.73 N/A N/A 0.23 1.67 213 GULF OF MEXICO 2000
Mackerel Spanish (Gulf of Mexico) 0.454 N/A N/A 0.07 1.56 66 NMFS 1978
Mackerel Spanish (S. Atlantic) 0.182 N/A N/A 0.05 0.73 43 NMFS 1978
Mahi Mahi 0.178 0.180 0.103 ND 0.450 29 FDA 1991-2005 Marlin * 0.485 0.39 0.237 0.1 0.92 16 FDA 1992-06 Monkfish 0.181 0.139 0.075 0.106 0.289 9 FDA 2006-2008 Mullett 0.05 0.014 0.078 ND 0.27 20 FDA 1991-2008 Orange Roughy 0.571 0.562 0.183 0.265 1.12 81 FDA 1991-2009 Oyster 0.012 ND 0.035 ND 0.25 61 FDA 1991-2009
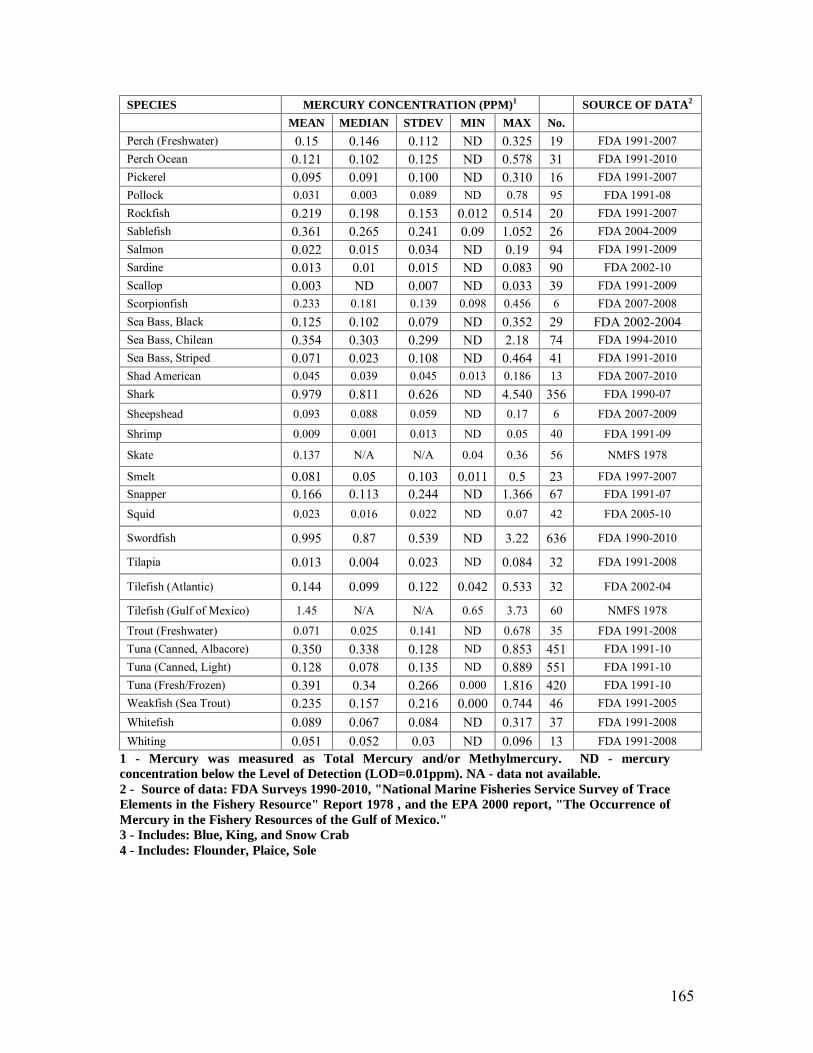
165
SPECIES MERCURY CONCENTRATION (PPM)1 SOURCE OF DATA2 MEAN MEDIAN STDEV MIN MAX No. Perch (Freshwater) 0.15 0.146 0.112 ND 0.325 19 FDA 1991-2007 Perch Ocean 0.121 0.102 0.125 ND 0.578 31 FDA 1991-2010 Pickerel 0.095 0.091 0.100 ND 0.310 16 FDA 1991-2007 Pollock 0.031 0.003 0.089 ND 0.78 95 FDA 1991-08 Rockfish 0.219 0.198 0.153 0.012 0.514 20 FDA 1991-2007 Sablefish 0.361 0.265 0.241 0.09 1.052 26 FDA 2004-2009 Salmon 0.022 0.015 0.034 ND 0.19 94 FDA 1991-2009 Sardine 0.013 0.01 0.015 ND 0.083 90 FDA 2002-10 Scallop 0.003 ND 0.007 ND 0.033 39 FDA 1991-2009 Scorpionfish 0.233 0.181 0.139 0.098 0.456 6 FDA 2007-2008 Sea Bass, Black 0.125 0.102 0.079 ND 0.352 29 FDA 2002-2004 Sea Bass, Chilean 0.354 0.303 0.299 ND 2.18 74 FDA 1994-2010 Sea Bass, Striped 0.071 0.023 0.108 ND 0.464 41 FDA 1991-2010 Shad American 0.045 0.039 0.045 0.013 0.186 13 FDA 2007-2010 Shark 0.979 0.811 0.626 ND 4.540 356 FDA 1990-07
Sheepshead 0.093 0.088 0.059 ND 0.17 6 FDA 2007-2009
Shrimp 0.009 0.001 0.013 ND 0.05 40 FDA 1991-09
Skate 0.137 N/A N/A 0.04 0.36 56 NMFS 1978
Smelt 0.081 0.05 0.103 0.011 0.5 23 FDA 1997-2007 Snapper 0.166 0.113 0.244 ND 1.366 67 FDA 1991-07
Squid 0.023 0.016 0.022 ND 0.07 42 FDA 2005-10
Swordfish 0.995 0.87 0.539 ND 3.22 636 FDA 1990-2010
Tilapia 0.013 0.004 0.023 ND 0.084 32 FDA 1991-2008
Tilefish (Atlantic) 0.144 0.099 0.122 0.042 0.533 32 FDA 2002-04
Tilefish (Gulf of Mexico) 1.45 N/A N/A 0.65 3.73 60 NMFS 1978
Trout (Freshwater) 0.071 0.025 0.141 ND 0.678 35 FDA 1991-2008 Tuna (Canned, Albacore) 0.350 0.338 0.128 ND 0.853 451 FDA 1991-10 Tuna (Canned, Light) 0.128 0.078 0.135 ND 0.889 551 FDA 1991-10 Tuna (Fresh/Frozen) 0.391 0.34 0.266 0.000 1.816 420 FDA 1991-10 Weakfish (Sea Trout) 0.235 0.157 0.216 0.000 0.744 46 FDA 1991-2005 Whitefish 0.089 0.067 0.084 ND 0.317 37 FDA 1991-2008 Whiting 0.051 0.052 0.03 ND 0.096 13 FDA 1991-2008
1 - Mercury was measured as Total Mercury and/or Methylmercury. ND - mercury concentration below the Level of Detection (LOD=0.01ppm). NA - data not available. 2 - Source of data: FDA Surveys 1990-2010, "National Marine Fisheries Service Survey of Trace Elements in the Fishery Resource" Report 1978 , and the EPA 2000 report, "The Occurrence of Mercury in the Fishery Resources of the Gulf of Mexico." 3 - Includes: Blue, King, and Snow Crab 4 - Includes: Flounder, Plaice, Sole
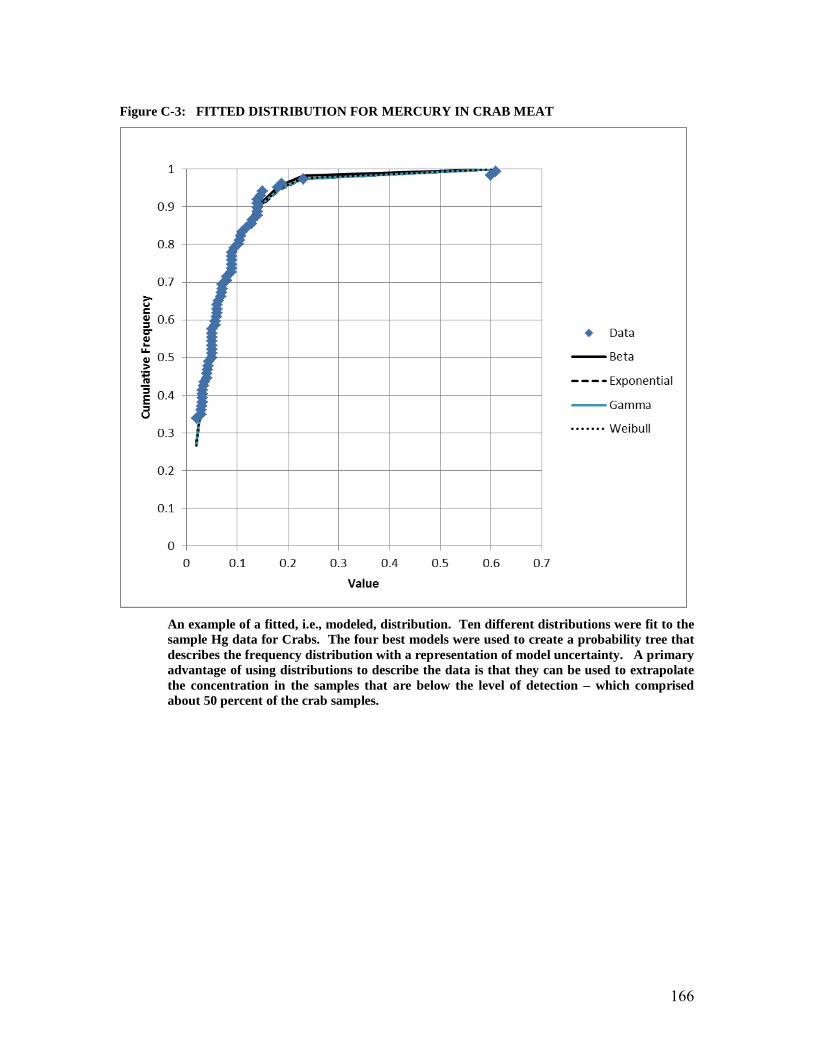
166
Figure C-3: FITTED DISTRIBUTION FOR MERCURY IN CRAB MEAT
An example of a fitted, i.e., modeled, distribution. Ten different distributions were fit to the sample Hg data for Crabs. The four best models were used to create a probability tree that describes the frequency distribution with a representation of model uncertainty. A primary advantage of using distributions to describe the data is that they can be used to extrapolate the concentration in the samples that are below the level of detection – which comprised about 50 percent of the crab samples.
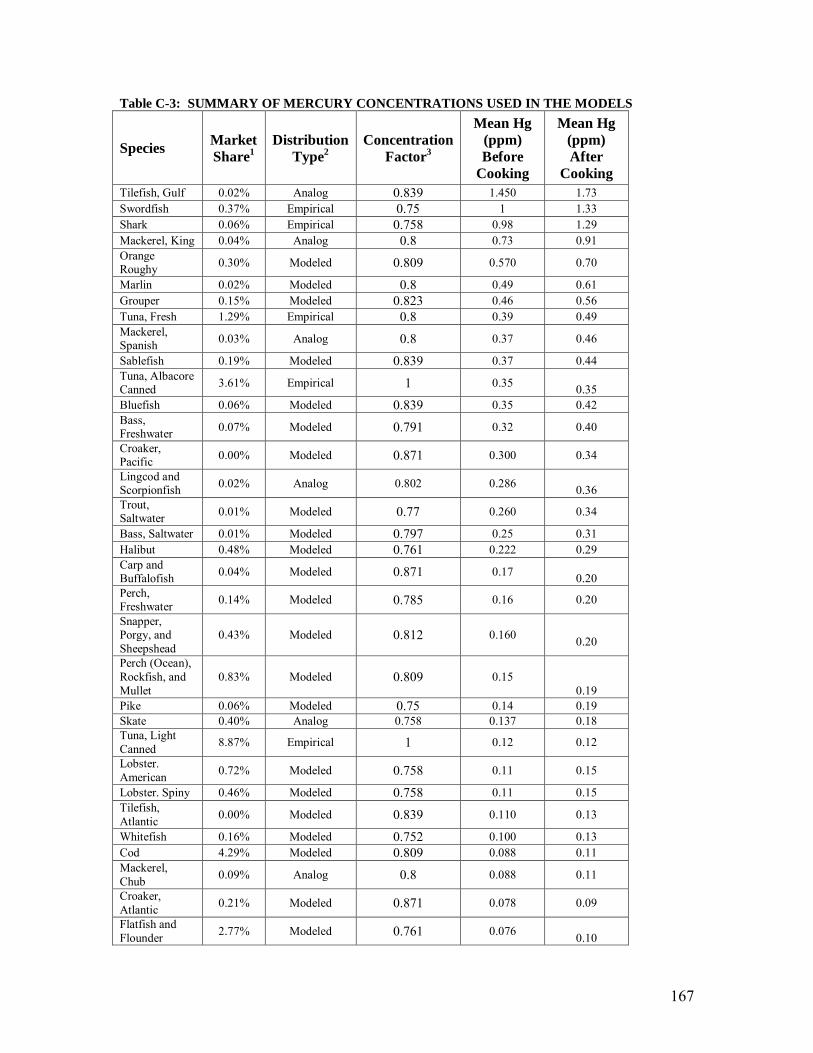
167
Table C-3: SUMMARY OF MERCURY CONCENTRATIONS USED IN THE MODELS
Species Market Share1
Distribution Type2
Concentration Factor3
Mean Hg (ppm) Before
Cooking
Mean Hg (ppm) After
Cooking Tilefish, Gulf 0.02% Analog 0.839 1.450 1.73 Swordfish 0.37% Empirical 0.75 1 1.33 Shark 0.06% Empirical 0.758 0.98 1.29 Mackerel, King 0.04% Analog 0.8 0.73 0.91 Orange Roughy 0.30% Modeled 0.809 0.570 0.70
Marlin 0.02% Modeled 0.8 0.49 0.61 Grouper 0.15% Modeled 0.823 0.46 0.56 Tuna, Fresh 1.29% Empirical 0.8 0.39 0.49 Mackerel, Spanish 0.03% Analog 0.8 0.37 0.46
Sablefish 0.19% Modeled 0.839 0.37 0.44 Tuna, Albacore Canned 3.61% Empirical 1 0.35
0.35 Bluefish 0.06% Modeled 0.839 0.35 0.42 Bass, Freshwater 0.07% Modeled 0.791 0.32 0.40
Croaker, Pacific 0.00% Modeled 0.871 0.300 0.34
Lingcod and Scorpionfish 0.02% Analog 0.802 0.286
0.36 Trout, Saltwater 0.01% Modeled 0.77 0.260 0.34
Bass, Saltwater 0.01% Modeled 0.797 0.25 0.31 Halibut 0.48% Modeled 0.761 0.222 0.29 Carp and Buffalofish 0.04% Modeled 0.871 0.17
0.20 Perch, Freshwater 0.14% Modeled 0.785 0.16 0.20
Snapper, Porgy, and Sheepshead
0.43% Modeled 0.812 0.160 0.20
Perch (Ocean), Rockfish, and Mullet
0.83% Modeled 0.809 0.15
0.19 Pike 0.06% Modeled 0.75 0.14 0.19 Skate 0.40% Analog 0.758 0.137 0.18 Tuna, Light Canned 8.87% Empirical 1 0.12 0.12
Lobster. American 0.72% Modeled 0.758 0.11 0.15
Lobster. Spiny 0.46% Modeled 0.758 0.11 0.15 Tilefish, Atlantic 0.00% Modeled 0.839 0.110 0.13
Whitefish 0.16% Modeled 0.752 0.100 0.13 Cod 4.29% Modeled 0.809 0.088 0.11 Mackerel, Chub 0.09% Analog 0.8 0.088 0.11
Croaker, Atlantic 0.21% Modeled 0.871 0.078 0.09
Flatfish and Flounder 2.77% Modeled 0.761 0.076
0.10
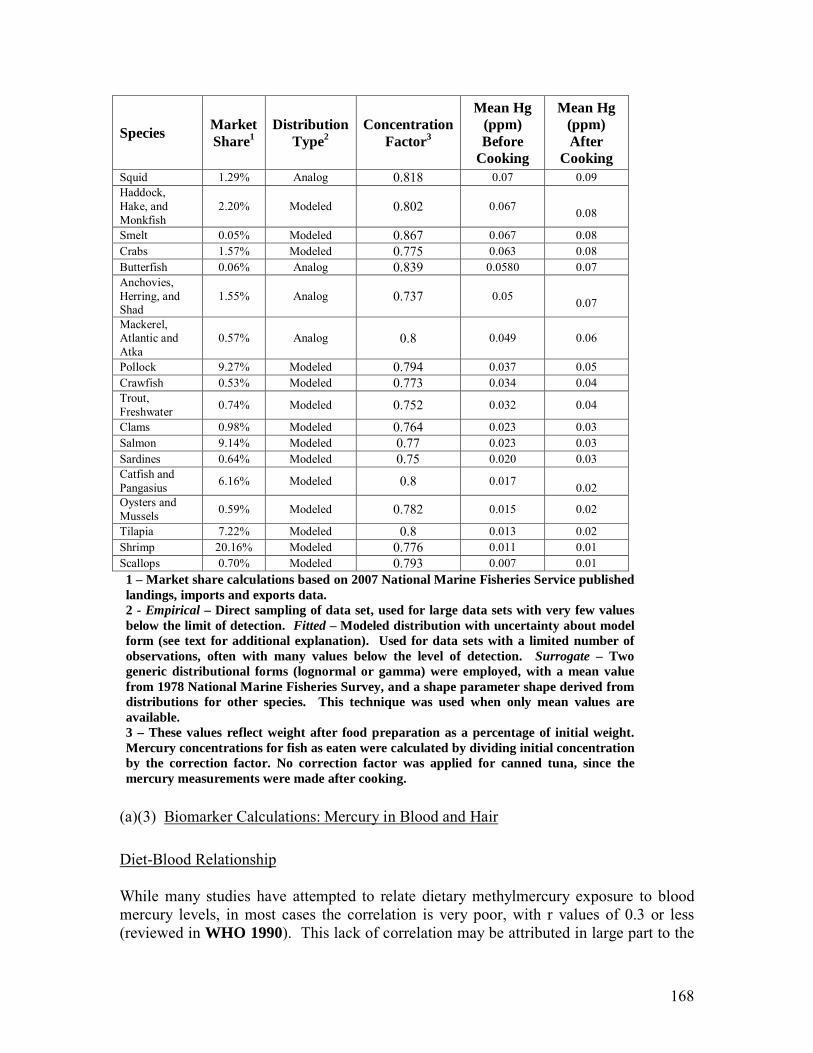
168
Species Market Share1
Distribution Type2
Concentration Factor3
Mean Hg (ppm) Before
Cooking
Mean Hg (ppm) After
Cooking Squid 1.29% Analog 0.818 0.07 0.09 Haddock, Hake, and Monkfish
2.20% Modeled 0.802 0.067 0.08
Smelt 0.05% Modeled 0.867 0.067 0.08 Crabs 1.57% Modeled 0.775 0.063 0.08 Butterfish 0.06% Analog 0.839 0.0580 0.07 Anchovies, Herring, and Shad
1.55% Analog 0.737 0.05 0.07
Mackerel, Atlantic and Atka
0.57% Analog 0.8 0.049 0.06
Pollock 9.27% Modeled 0.794 0.037 0.05 Crawfish 0.53% Modeled 0.773 0.034 0.04 Trout, Freshwater 0.74% Modeled 0.752 0.032 0.04
Clams 0.98% Modeled 0.764 0.023 0.03 Salmon 9.14% Modeled 0.77 0.023 0.03 Sardines 0.64% Modeled 0.75 0.020 0.03 Catfish and Pangasius 6.16% Modeled 0.8 0.017
0.02 Oysters and Mussels 0.59% Modeled 0.782 0.015 0.02
Tilapia 7.22% Modeled 0.8 0.013 0.02 Shrimp 20.16% Modeled 0.776 0.011 0.01 Scallops 0.70% Modeled 0.793 0.007 0.01 1 – Market share calculations based on 2007 National Marine Fisheries Service published landings, imports and exports data. 2 - Empirical – Direct sampling of data set, used for large data sets with very few values below the limit of detection. Fitted – Modeled distribution with uncertainty about model form (see text for additional explanation). Used for data sets with a limited number of observations, often with many values below the level of detection. Surrogate – Two generic distributional forms (lognormal or gamma) were employed, with a mean value from 1978 National Marine Fisheries Survey, and a shape parameter shape derived from distributions for other species. This technique was used when only mean values are available. 3 – These values reflect weight after food preparation as a percentage of initial weight. Mercury concentrations for fish as eaten were calculated by dividing initial concentration by the correction factor. No correction factor was applied for canned tuna, since the mercury measurements were made after cooking.
(a)(3) Biomarker Calculations: Mercury in Blood and Hair Diet-Blood Relationship While many studies have attempted to relate dietary methylmercury exposure to blood mercury levels, in most cases the correlation is very poor, with r values of 0.3 or less (reviewed in WHO 1990). This lack of correlation may be attributed in large part to the
169
failure of short-term measurements of mercury exposure to gauge long-term dietary exposure (Sherlock & Quinn 1988). The study by Sherlock et al. (1984), in which 20 male volunteers consumed controlled fish diets with known methylmercury concentrations over a 100-day exposure period, was selected for use in this assessment. Mercury blood values monitored for the duration of the study were used to project equilibrium values for a chronic diet-blood relationship. The mean body weight for the subjects was 71 kg, with a range of 52 to 102 kg. The relationship between dietary exposure and mercury blood level appeared to be linear with respect to dose. Although the ratio of mercury blood level to dietary exposure was inversely related to body weight, it was not directly proportional to body weight. Therefore, Sherlock et al. (1984) suggested using a body weight (BW) dose conversion factor of BW.1/3 We have determined that a conversion factor of BW0.44 will result in corrected values that have no correlation with body weight (i.e. r=0; see Figure AH-4) . Sherlock et al. (1984) extrapolated steady-state blood levels from two other parameters (a and b). The extrapolated steady-state levels reported in the paper were not corrected for body weight. Therefore, the values for each of the 20 subjects were recalculated using BW0.44 to normalize all values to a BW of 70 kg. In order to characterize the measurement error for each subject, 40 bootstrap data sets were generated from the standard deviations reported for each parameter estimate. Each bootstrap set was then fit by 10 different frequency distributions using least squares regression. Three weighted models were retained per bootstrap, which were assigned probabilities on the basis of goodness-of fit and number of parameters (Carrington 1996). The resulting 120 models were then employed as a probability tree to characterize uncertainty from measurement error and model selection. When used in a simulation, the contribution of body weight was calculated by applying BW0.44 to the weight of each subject in the food consumption survey.
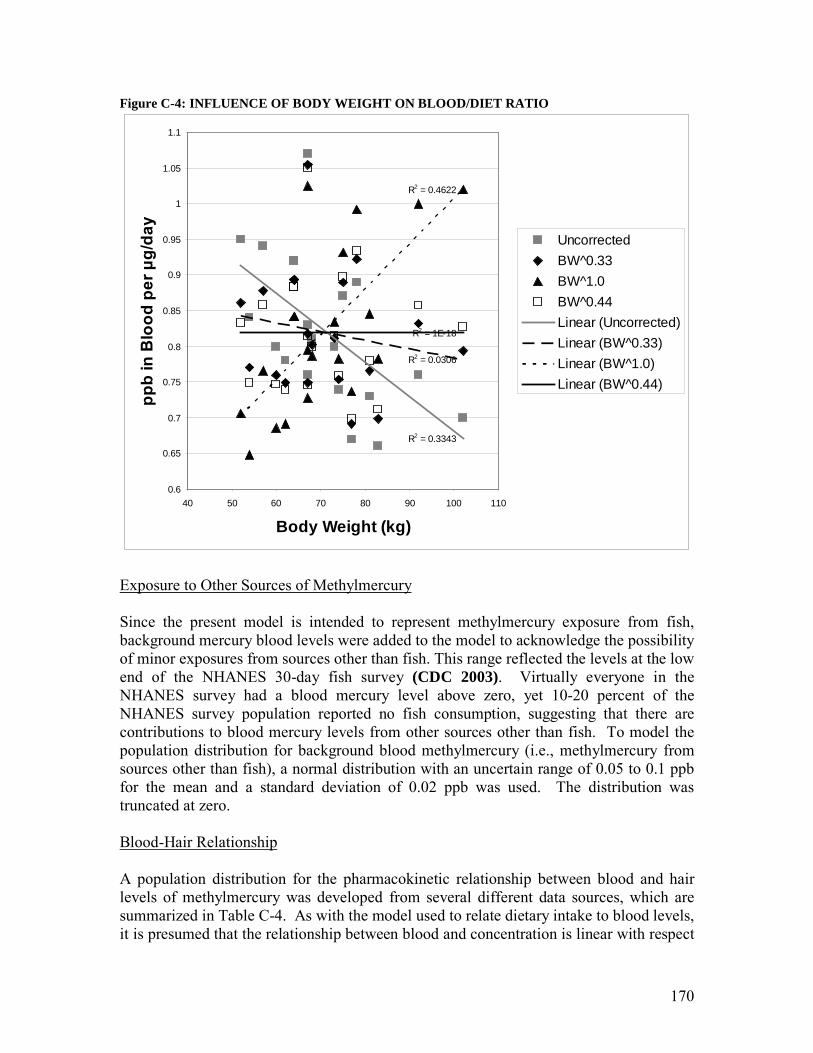
170
Figure C-4: INFLUENCE OF BODY WEIGHT ON BLOOD/DIET RATIO
R2 = 0.3343
R2 = 0.0306
R2 = 0.4622
R2 = 1E-18
0.6
0.65
0.7
0.75
0.8
0.85
0.9
0.95
1
1.05
1.1
40 50 60 70 80 90 100 110
Body Weight (kg)
ppb
in B
lood
per
μg/
day
UncorrectedBW^0.33BW^1.0BW^0.44Linear (Uncorrected)Linear (BW^0.33)Linear (BW^1.0)Linear (BW^0.44)
Exposure to Other Sources of Methylmercury Since the present model is intended to represent methylmercury exposure from fish, background mercury blood levels were added to the model to acknowledge the possibility of minor exposures from sources other than fish. This range reflected the levels at the low end of the NHANES 30-day fish survey (CDC 2003). Virtually everyone in the NHANES survey had a blood mercury level above zero, yet 10-20 percent of the NHANES survey population reported no fish consumption, suggesting that there are contributions to blood mercury levels from other sources other than fish. To model the population distribution for background blood methylmercury (i.e., methylmercury from sources other than fish), a normal distribution with an uncertain range of 0.05 to 0.1 ppb for the mean and a standard deviation of 0.02 ppb was used. The distribution was truncated at zero. Blood-Hair Relationship A population distribution for the pharmacokinetic relationship between blood and hair levels of methylmercury was developed from several different data sources, which are summarized in Table C-4. As with the model used to relate dietary intake to blood levels, it is presumed that the relationship between blood and concentration is linear with respect
171
to dose, and therefore, the pharmacokinetic variability may be described as a distribution of ratios. Since they were developed from a chronic study, the data from Hislop et al. (1983) are the most relevant to a chronic exposure assessment. However, hair values were only measured for five of the 20 subjects in the study, all of whom were male. In addition, only the ranges for the hair-blood ratios are reported. The other data sources listed in Table C-4 have more individual data points and are therefore potentially more useful at characterizing the full range of pharmacokinetic variability. However, there are a number of other problems with these data. First, blood measurements fluctuate and are dependent on the time since the last fish meal, and as a result, measurements made at a single point in time may not accurately reflect long-term exposure. Second, since inorganic mercury was not measured independently in hair, it is also possible that there is some contamination of hair from inorganic mercury – perhaps from environmental sources. Third, errors in the chemical analysis are more likely to be substantial at lower concentrations in blood or hair (i.e. near the limit of detection), resulting in either unrealistically high or low ratios. Regardless of the explanation, actual pharmacokinetic variation in the studies reporting single measurements of blood and hair is almost certainly narrower that the apparent distribution. How much remains as a source of uncertainty.
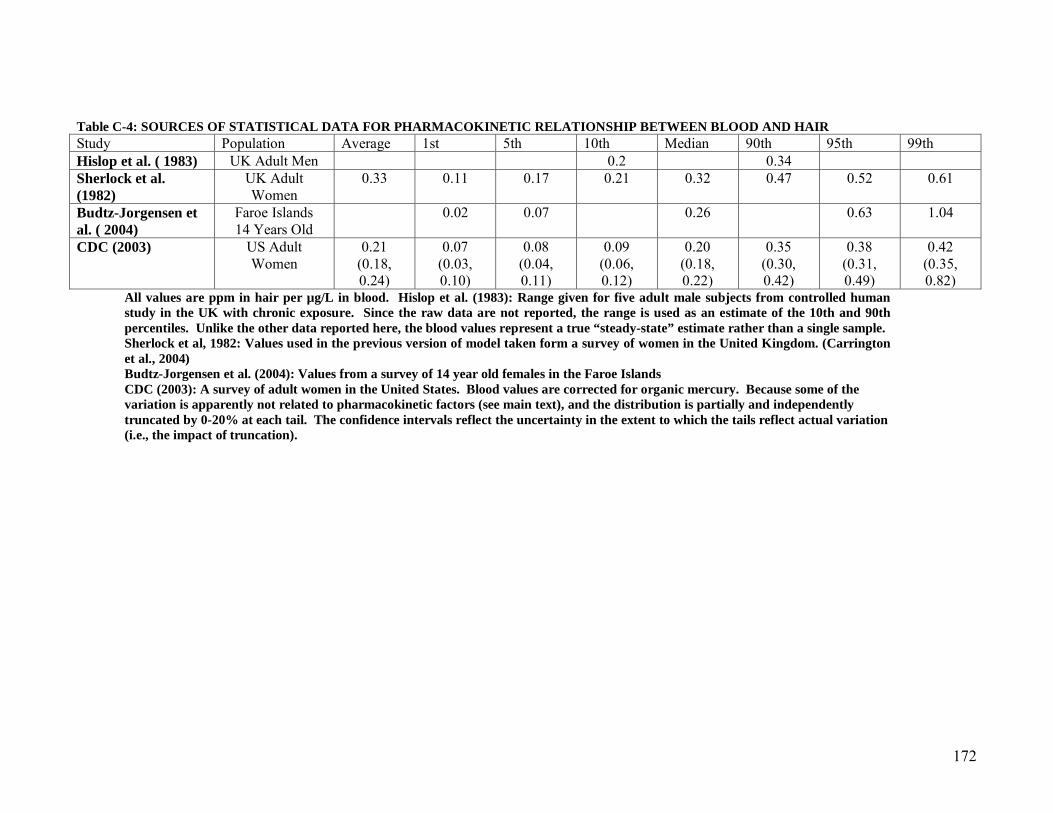
172
Table C-4: SOURCES OF STATISTICAL DATA FOR PHARMACOKINETIC RELATIONSHIP BETWEEN BLOOD AND HAIR Study Population Average 1st 5th 10th Median 90th 95th 99th Hislop et al. ( 1983) UK Adult Men 0.2 0.34 Sherlock et al. (1982)
UK Adult Women
0.33 0.11 0.17 0.21 0.32 0.47 0.52 0.61
Budtz-Jorgensen et al. ( 2004)
Faroe Islands 14 Years Old
0.02 0.07 0.26 0.63 1.04
CDC (2003) US Adult Women
0.21 (0.18, 0.24)
0.07 (0.03, 0.10)
0.08 (0.04, 0.11)
0.09 (0.06, 0.12)
0.20 (0.18, 0.22)
0.35 (0.30, 0.42)
0.38 (0.31, 0.49)
0.42 (0.35, 0.82)
All values are ppm in hair per µg/L in blood. Hislop et al. (1983): Range given for five adult male subjects from controlled human study in the UK with chronic exposure. Since the raw data are not reported, the range is used as an estimate of the 10th and 90th percentiles. Unlike the other data reported here, the blood values represent a true “steady-state” estimate rather than a single sample. Sherlock et al, 1982: Values used in the previous version of model taken form a survey of women in the United Kingdom. (Carrington et al., 2004) Budtz-Jorgensen et al. (2004): Values from a survey of 14 year old females in the Faroe Islands CDC (2003): A survey of adult women in the United States. Blood values are corrected for organic mercury. Because some of the variation is apparently not related to pharmacokinetic factors (see main text), and the distribution is partially and independently truncated by 0-20% at each tail. The confidence intervals reflect the uncertainty in the extent to which the tails reflect actual variation (i.e., the impact of truncation).
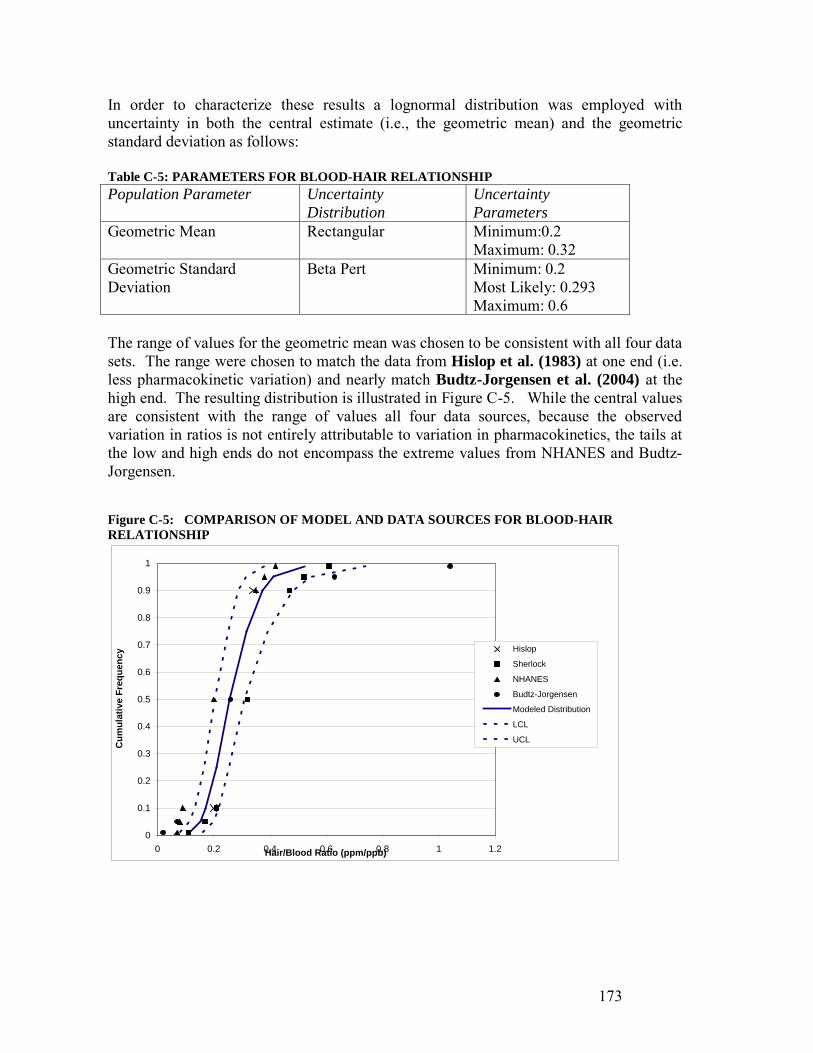
173
In order to characterize these results a lognormal distribution was employed with uncertainty in both the central estimate (i.e., the geometric mean) and the geometric standard deviation as follows: Table C-5: PARAMETERS FOR BLOOD-HAIR RELATIONSHIP Population Parameter Uncertainty
Distribution Uncertainty Parameters
Geometric Mean Rectangular Minimum:0.2 Maximum: 0.32
Geometric Standard Deviation
Beta Pert Minimum: 0.2 Most Likely: 0.293 Maximum: 0.6
The range of values for the geometric mean was chosen to be consistent with all four data sets. The range were chosen to match the data from Hislop et al. (1983) at one end (i.e. less pharmacokinetic variation) and nearly match Budtz-Jorgensen et al. (2004) at the high end. The resulting distribution is illustrated in Figure C-5. While the central values are consistent with the range of values all four data sources, because the observed variation in ratios is not entirely attributable to variation in pharmacokinetics, the tails at the low and high ends do not encompass the extreme values from NHANES and Budtz-Jorgensen.
Figure C-5: COMPARISON OF MODEL AND DATA SOURCES FOR BLOOD-HAIR RELATIONSHIP
0
0.1
0.2
0.3
0.4
0.5
0.6
0.7
0.8
0.9
1
0 0.2 0.4 0.6 0.8 1 1.2Hair/Blood Ratio (ppm/ppb)
Cum
ulat
ive
Freq
uenc
y Hislop
Sherlock
NHANES
Budtz-Jorgensen
Modeled Distribution
LCL
UCL
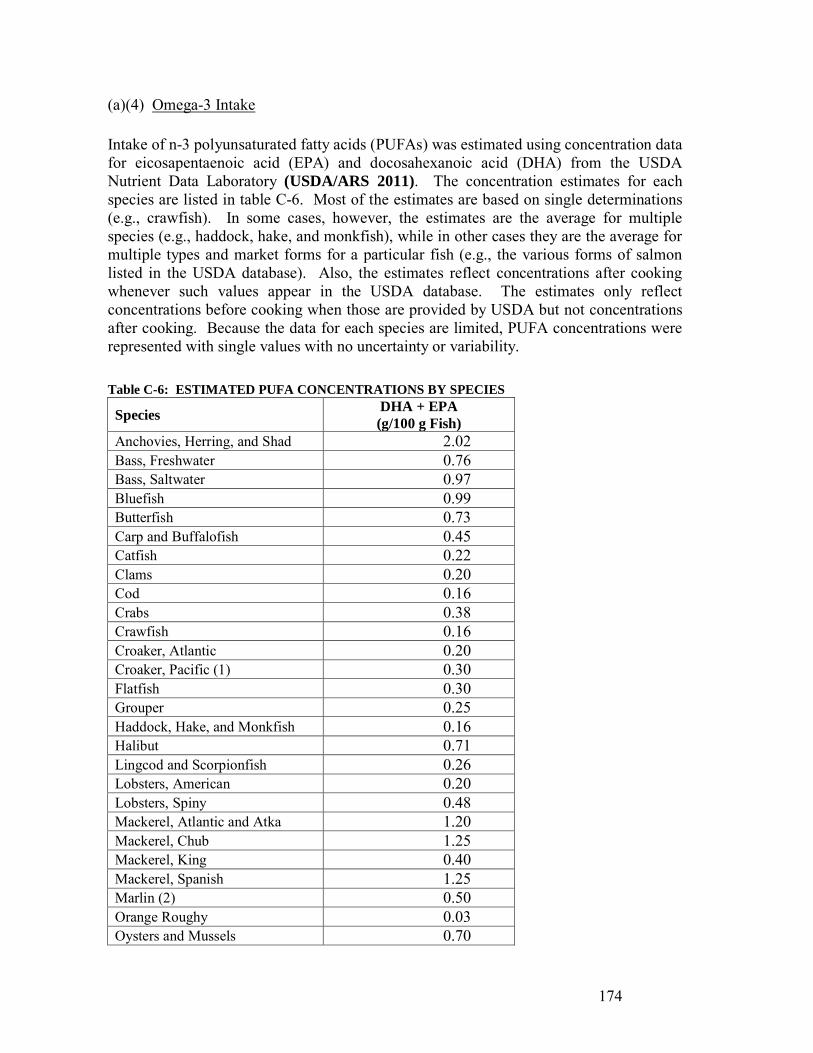
174
(a)(4) Omega-3 Intake Intake of n-3 polyunsaturated fatty acids (PUFAs) was estimated using concentration data for eicosapentaenoic acid (EPA) and docosahexanoic acid (DHA) from the USDA Nutrient Data Laboratory (USDA/ARS 2011). The concentration estimates for each species are listed in table C-6. Most of the estimates are based on single determinations (e.g., crawfish). In some cases, however, the estimates are the average for multiple species (e.g., haddock, hake, and monkfish), while in other cases they are the average for multiple types and market forms for a particular fish (e.g., the various forms of salmon listed in the USDA database). Also, the estimates reflect concentrations after cooking whenever such values appear in the USDA database. The estimates only reflect concentrations before cooking when those are provided by USDA but not concentrations after cooking. Because the data for each species are limited, PUFA concentrations were represented with single values with no uncertainty or variability. Table C-6: ESTIMATED PUFA CONCENTRATIONS BY SPECIES
Species DHA + EPA (g/100 g Fish)
Anchovies, Herring, and Shad 2.02 Bass, Freshwater 0.76 Bass, Saltwater 0.97 Bluefish 0.99 Butterfish 0.73 Carp and Buffalofish 0.45 Catfish 0.22 Clams 0.20 Cod 0.16 Crabs 0.38 Crawfish 0.16 Croaker, Atlantic 0.20 Croaker, Pacific (1) 0.30 Flatfish 0.30 Grouper 0.25 Haddock, Hake, and Monkfish 0.16 Halibut 0.71 Lingcod and Scorpionfish 0.26 Lobsters, American 0.20 Lobsters, Spiny 0.48 Mackerel, Atlantic and Atka 1.20 Mackerel, Chub 1.25 Mackerel, King 0.40 Mackerel, Spanish 1.25 Marlin (2) 0.50 Orange Roughy 0.03 Oysters and Mussels 0.70
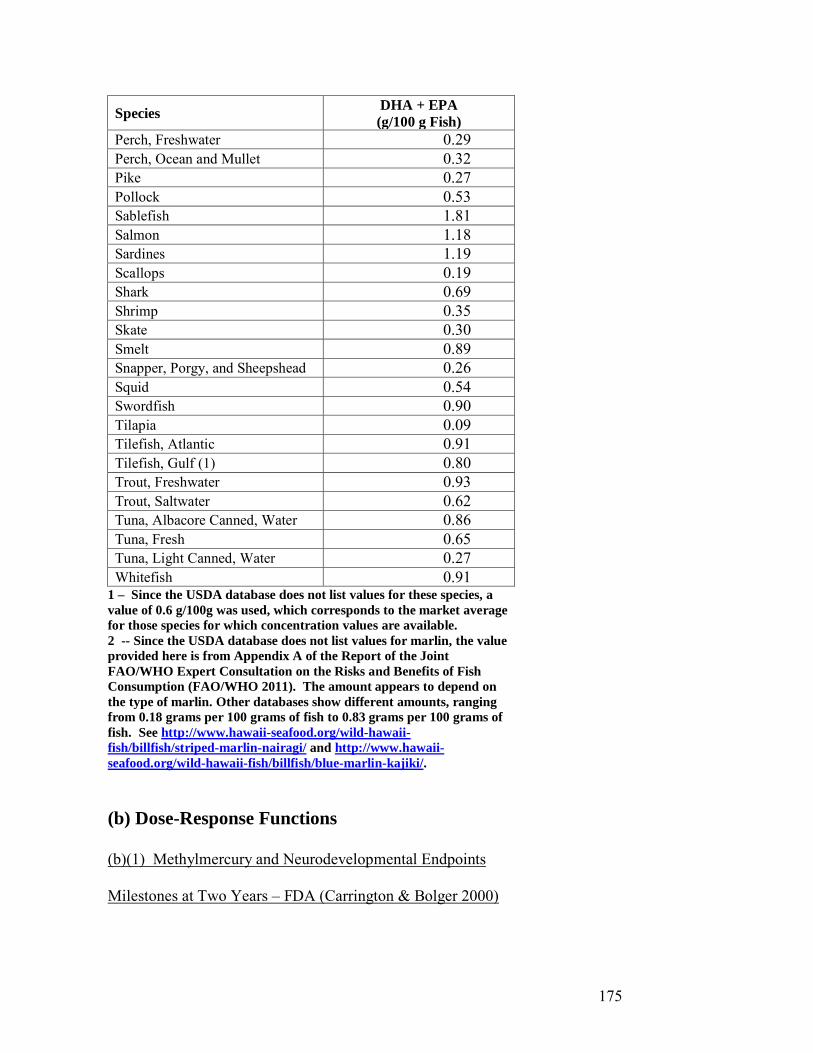
175
Species DHA + EPA (g/100 g Fish)
Perch, Freshwater 0.29 Perch, Ocean and Mullet 0.32 Pike 0.27 Pollock 0.53 Sablefish 1.81 Salmon 1.18 Sardines 1.19 Scallops 0.19 Shark 0.69 Shrimp 0.35 Skate 0.30 Smelt 0.89 Snapper, Porgy, and Sheepshead 0.26 Squid 0.54 Swordfish 0.90 Tilapia 0.09 Tilefish, Atlantic 0.91 Tilefish, Gulf (1) 0.80 Trout, Freshwater 0.93 Trout, Saltwater 0.62 Tuna, Albacore Canned, Water 0.86 Tuna, Fresh 0.65 Tuna, Light Canned, Water 0.27 Whitefish 0.91
1 – Since the USDA database does not list values for these species, a value of 0.6 g/100g was used, which corresponds to the market average for those species for which concentration values are available. 2 -- Since the USDA database does not list values for marlin, the value provided here is from Appendix A of the Report of the Joint FAO/WHO Expert Consultation on the Risks and Benefits of Fish Consumption (FAO/WHO 2011). The amount appears to depend on the type of marlin. Other databases show different amounts, ranging from 0.18 grams per 100 grams of fish to 0.83 grams per 100 grams of fish. See http://www.hawaii-seafood.org/wild-hawaii-fish/billfish/striped-marlin-nairagi/ and http://www.hawaii-seafood.org/wild-hawaii-fish/billfish/blue-marlin-kajiki/. (b) Dose-Response Functions
(b)(1) Methylmercury and Neurodevelopmental Endpoints Milestones at Two Years – FDA (Carrington & Bolger 2000)
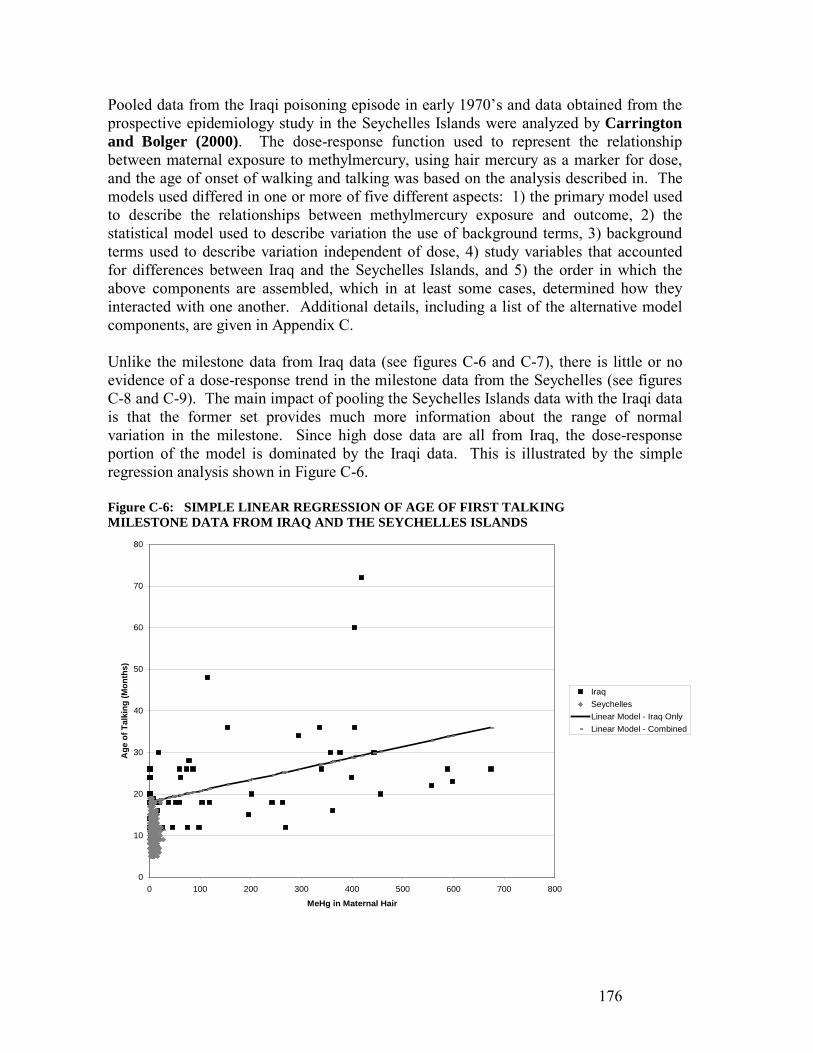
176
Pooled data from the Iraqi poisoning episode in early 1970’s and data obtained from the prospective epidemiology study in the Seychelles Islands were analyzed by Carrington and Bolger (2000). The dose-response function used to represent the relationship between maternal exposure to methylmercury, using hair mercury as a marker for dose, and the age of onset of walking and talking was based on the analysis described in. The models used differed in one or more of five different aspects: 1) the primary model used to describe the relationships between methylmercury exposure and outcome, 2) the statistical model used to describe variation the use of background terms, 3) background terms used to describe variation independent of dose, 4) study variables that accounted for differences between Iraq and the Seychelles Islands, and 5) the order in which the above components are assembled, which in at least some cases, determined how they interacted with one another. Additional details, including a list of the alternative model components, are given in Appendix C. Unlike the milestone data from Iraq data (see figures C-6 and C-7), there is little or no evidence of a dose-response trend in the milestone data from the Seychelles (see figures C-8 and C-9). The main impact of pooling the Seychelles Islands data with the Iraqi data is that the former set provides much more information about the range of normal variation in the milestone. Since high dose data are all from Iraq, the dose-response portion of the model is dominated by the Iraqi data. This is illustrated by the simple regression analysis shown in Figure C-6. Figure C-6: SIMPLE LINEAR REGRESSION OF AGE OF FIRST TALKING MILESTONE DATA FROM IRAQ AND THE SEYCHELLES ISLANDS
0
10
20
30
40
50
60
70
80
0 100 200 300 400 500 600 700 800
MeHg in Maternal Hair
Age
of T
alki
ng (M
onth
s)
IraqSeychellesLinear Model - Iraq OnlyLinear Model - Combined
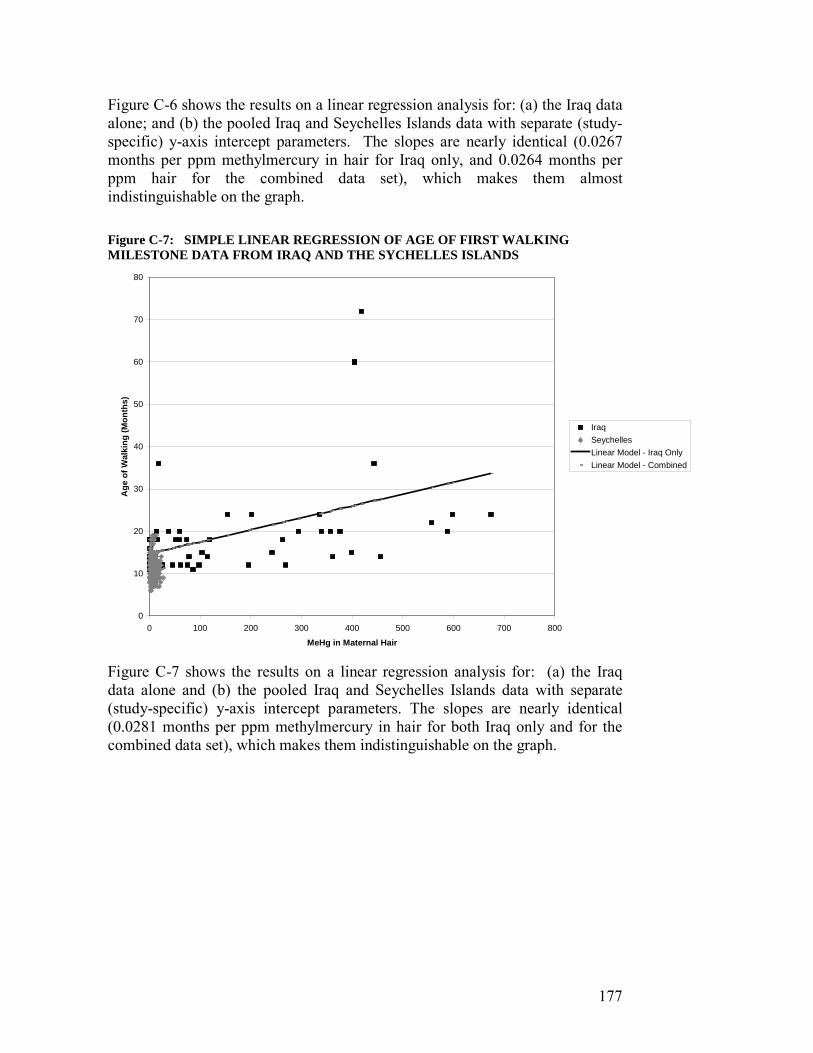
177
Figure C-6 shows the results on a linear regression analysis for: (a) the Iraq data alone; and (b) the pooled Iraq and Seychelles Islands data with separate (study-specific) y-axis intercept parameters. The slopes are nearly identical (0.0267 months per ppm methylmercury in hair for Iraq only, and 0.0264 months per ppm hair for the combined data set), which makes them almost indistinguishable on the graph. Figure C-7: SIMPLE LINEAR REGRESSION OF AGE OF FIRST WALKING MILESTONE DATA FROM IRAQ AND THE SYCHELLES ISLANDS
0
10
20
30
40
50
60
70
80
0 100 200 300 400 500 600 700 800
MeHg in Maternal Hair
Age
of W
alki
ng (M
onth
s)
IraqSeychellesLinear Model - Iraq OnlyLinear Model - Combined
Figure C-7 shows the results on a linear regression analysis for: (a) the Iraq data alone and (b) the pooled Iraq and Seychelles Islands data with separate (study-specific) y-axis intercept parameters. The slopes are nearly identical (0.0281 months per ppm methylmercury in hair for both Iraq only and for the combined data set), which makes them indistinguishable on the graph.
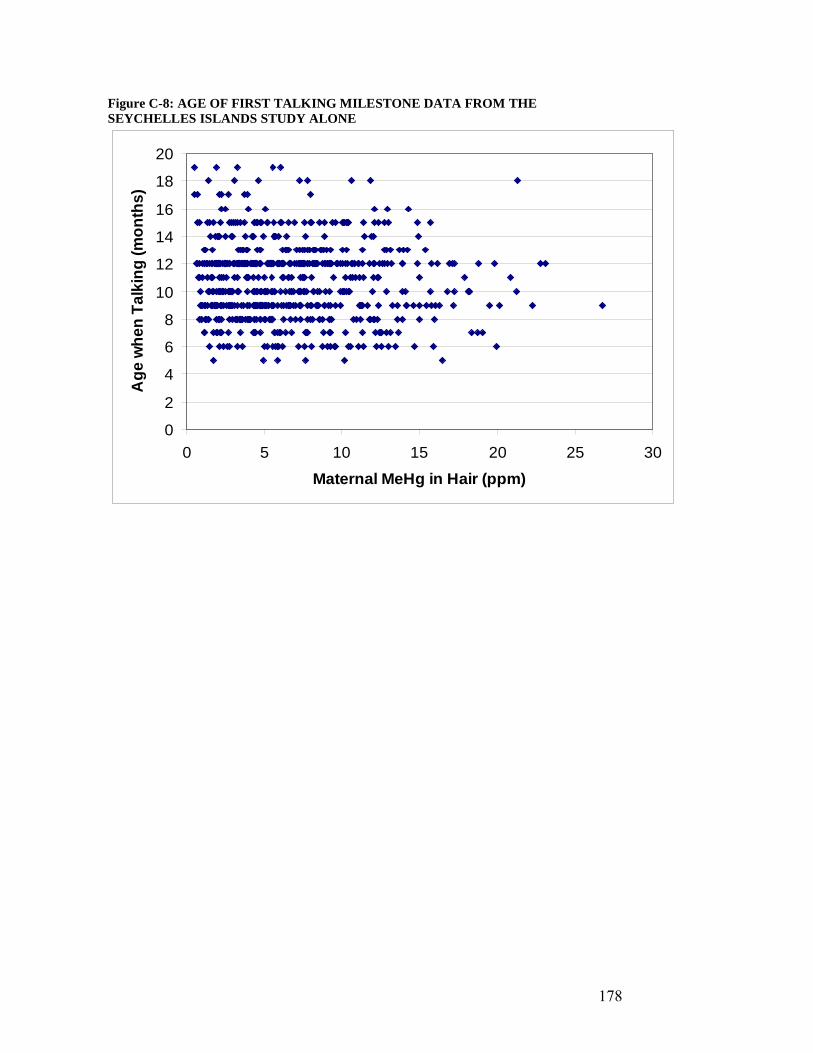
178
Figure C-8: AGE OF FIRST TALKING MILESTONE DATA FROM THE SEYCHELLES ISLANDS STUDY ALONE
0
2
4
6
8
10
12
14
16
18
20
0 5 10 15 20 25 30
Maternal MeHg in Hair (ppm)
Age
whe
n Ta
lkin
g (m
onth
s)
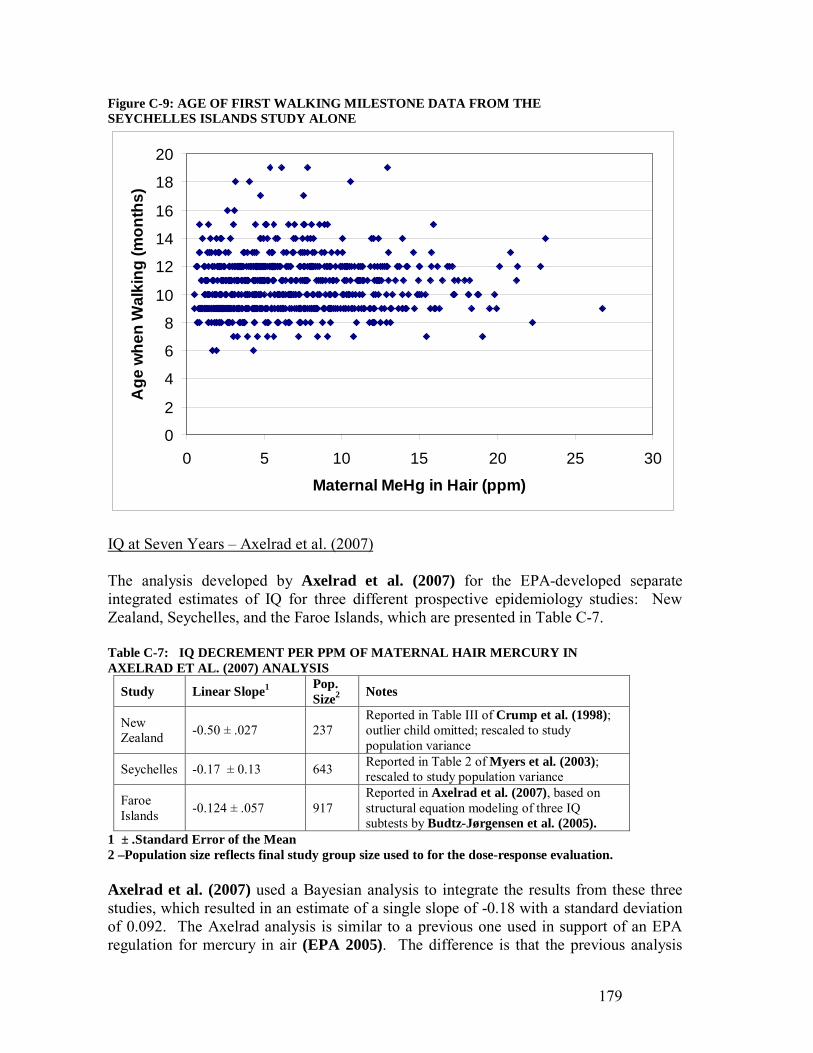
179
Figure C-9: AGE OF FIRST WALKING MILESTONE DATA FROM THE SEYCHELLES ISLANDS STUDY ALONE
0
2
4
6
8
10
12
14
16
18
20
0 5 10 15 20 25 30
Maternal MeHg in Hair (ppm)
Age
whe
n W
alki
ng (m
onth
s)
IQ at Seven Years – Axelrad et al. (2007) The analysis developed by Axelrad et al. (2007) for the EPA-developed separate integrated estimates of IQ for three different prospective epidemiology studies: New Zealand, Seychelles, and the Faroe Islands, which are presented in Table C-7. Table C-7: IQ DECREMENT PER PPM OF MATERNAL HAIR MERCURY IN AXELRAD ET AL. (2007) ANALYSIS
Study Linear Slope1 Pop. Size2 Notes
New Zealand -0.50 ± .027 237
Reported in Table III of Crump et al. (1998); outlier child omitted; rescaled to study population variance
Seychelles -0.17 ± 0.13 643 Reported in Table 2 of Myers et al. (2003); rescaled to study population variance
Faroe Islands -0.124 ± .057 917
Reported in Axelrad et al. (2007), based on structural equation modeling of three IQ subtests by Budtz-Jørgensen et al. (2005).
1 ± .Standard Error of the Mean 2 –Population size reflects final study group size used to for the dose-response evaluation. Axelrad et al. (2007) used a Bayesian analysis to integrate the results from these three studies, which resulted in an estimate of a single slope of -0.18 with a standard deviation of 0.092. The Axelrad analysis is similar to a previous one used in support of an EPA regulation for mercury in air (EPA 2005). The difference is that the previous analysis
180
used the IQ scales as originally reported, whereas Axelrad et al. (2007) rescaled the results using study population variances. IQ at Seven to Nine Years – Harvard Center for Risk Analysis (HCRA): Cohen et al. (2005b) The analysis conducted by Cohen et al. (2005a) was presented as part of a larger analysis concerned with the risks and benefits of fish consumption. This analysis integrated results from three different prospective epidemiology studies: New Zealand (Kjellström et al., 1988), the Seychelles Islands (Myers et al., 2003), and the Faroe Islands (Grandjean et al., 1997). The responses, or endpoints, were a wide range of behavioral tests of children aged seven to nine years of age. Instead of working with raw data, Cohen et al. (2005a) relied on regression analyses conducted by the original authors of the studies. However, because the regression analysis from the Faroe Islands use the log of maternal hair concentration as the dose metric, it was necessary to convert this dose metric by “linearizing” the regression, which involves assuming that the dose-response relationship is linear over a relatively narrow dose range. Since the use of the log (dose) transform in the original analysis and the method used to convert the original analysis to a linear slope greatly impact the analysis, this issue merits some discussion. As pointed out in the National Academy of Sciences (2000) report, the log (dose)-linear and linear models provide a similar description of at least some of the data from the Faroe Islands study. However, the models diverge greatly at doses both below and above the ranges encountered in the study. The NAS report contended that the log (dose) transform is implausible and gives theoretical reasons to support that argument. In addition, there are empirical grounds for discounting the log (dose) transform from other data in the literature and from common experience. First, the log (dose) transform predicts that the size of the effect increases as the dose decreases. In fact, the predicted increase in IQ approaches infinity as the dose approaches zero. If this were true, one would expect huge differences in the IQ of populations who do not consume fish. Second, the log (dose) transform predicts that there is relatively little additional effect on IQ at doses higher that those encountered in the Faroe Islands study. This prediction is inconsistent with the results from Iraq and Minamata where clinical effects that were much more severe than the relatively subtle effects modeled in the Faroe Islands study occurred at higher levels of exposure. In order to facilitate comparison to the New Zealand and Seychelles Islands analyses, linear coefficients were developed from the Faroe Islands study using the reported low end of the log (dose)-linear slope. This range was chosen because it most closely matches exposures in the United States and was used as the principal dose-response model in their cost-benefit analysis (Cohen et al., 2005b). However, because this slope is essentially employing the log(dose) transform to extrapolate from Faroe Islands exposures to much lower U.S. levels of exposure, they also reported a secondary “sensitivity” analysis where the linear coefficients were taken from the range of exposures that predominated in the Faroe Islands study (i.e. the first and third quartiles; see Figure C-10). Given the implausibility of the log (dose) transform and the fact that is
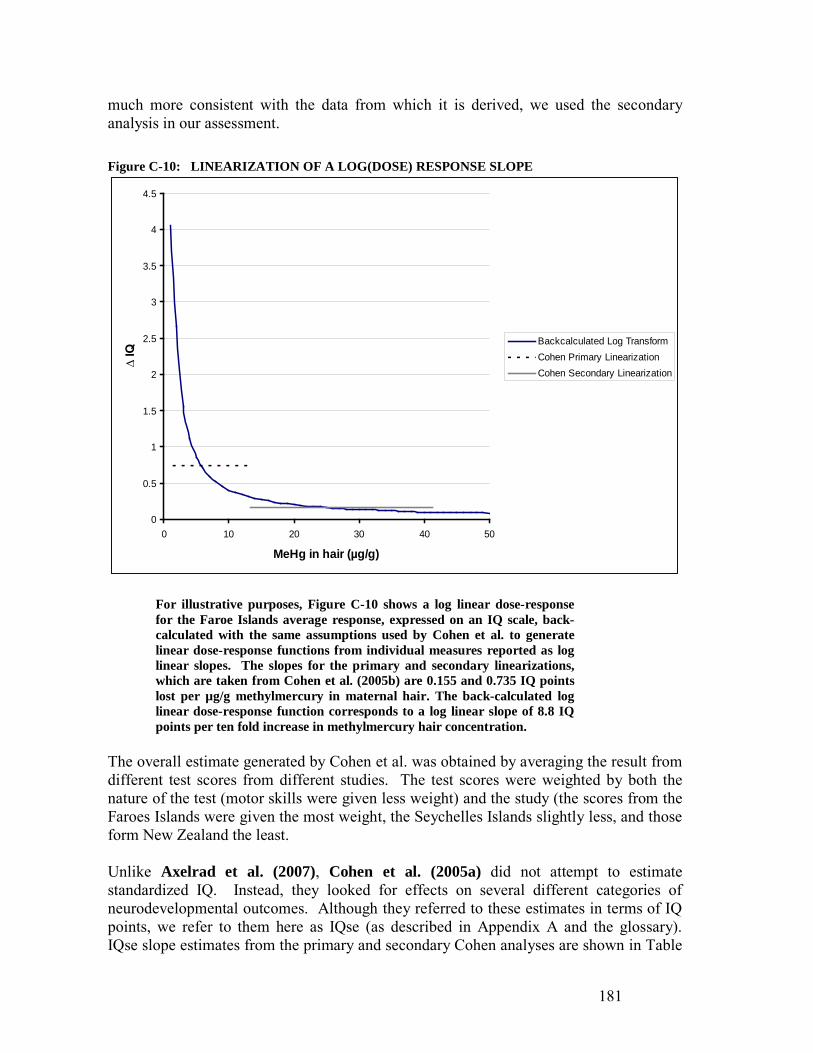
181
much more consistent with the data from which it is derived, we used the secondary analysis in our assessment. Figure C-10: LINEARIZATION OF A LOG(DOSE) RESPONSE SLOPE
0
0.5
1
1.5
2
2.5
3
3.5
4
4.5
0 10 20 30 40 50
MeHg in hair (µg/g)
∆ IQ
Backcalculated Log TransformCohen Primary LinearizationCohen Secondary Linearization
For illustrative purposes, Figure C-10 shows a log linear dose-response for the Faroe Islands average response, expressed on an IQ scale, back-calculated with the same assumptions used by Cohen et al. to generate linear dose-response functions from individual measures reported as log linear slopes. The slopes for the primary and secondary linearizations, which are taken from Cohen et al. (2005b) are 0.155 and 0.735 IQ points lost per µg/g methylmercury in maternal hair. The back-calculated log linear dose-response function corresponds to a log linear slope of 8.8 IQ points per ten fold increase in methylmercury hair concentration.
The overall estimate generated by Cohen et al. was obtained by averaging the result from different test scores from different studies. The test scores were weighted by both the nature of the test (motor skills were given less weight) and the study (the scores from the Faroes Islands were given the most weight, the Seychelles Islands slightly less, and those form New Zealand the least. Unlike Axelrad et al. (2007), Cohen et al. (2005a) did not attempt to estimate standardized IQ. Instead, they looked for effects on several different categories of neurodevelopmental outcomes. Although they referred to these estimates in terms of IQ points, we refer to them here as IQse (as described in Appendix A and the glossary). IQse slope estimates from the primary and secondary Cohen analyses are shown in Table
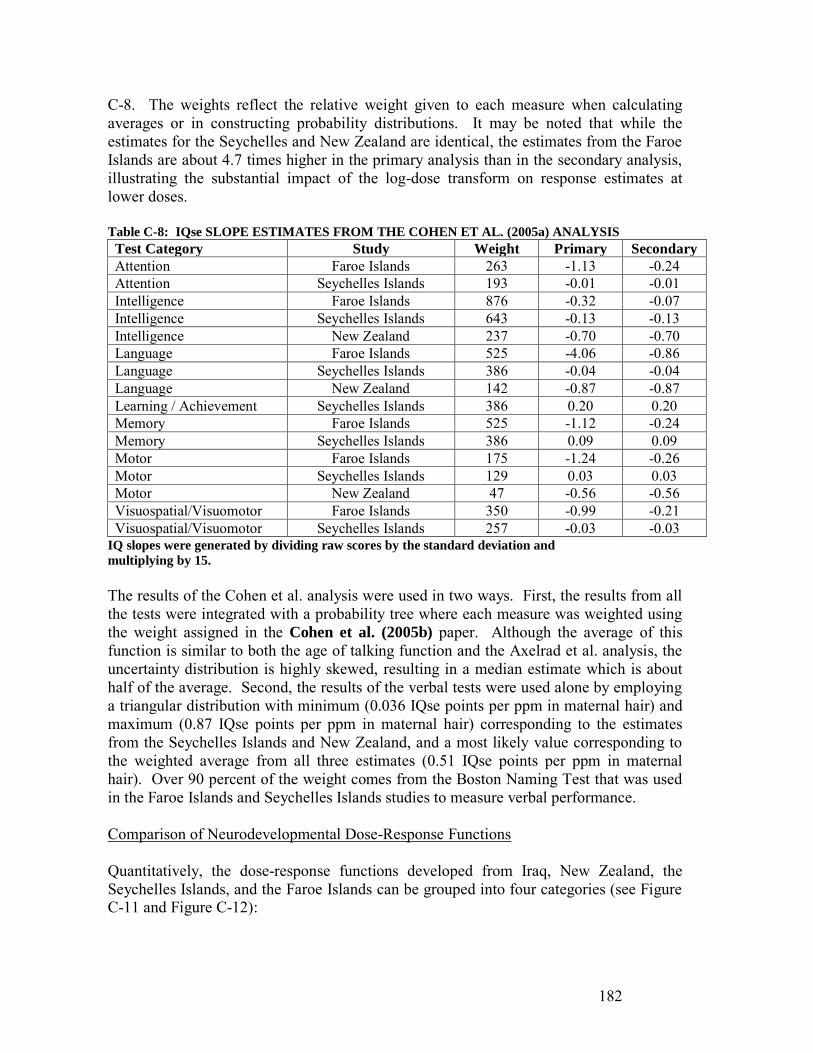
182
C-8. The weights reflect the relative weight given to each measure when calculating averages or in constructing probability distributions. It may be noted that while the estimates for the Seychelles and New Zealand are identical, the estimates from the Faroe Islands are about 4.7 times higher in the primary analysis than in the secondary analysis, illustrating the substantial impact of the log-dose transform on response estimates at lower doses. Table C-8: IQse SLOPE ESTIMATES FROM THE COHEN ET AL. (2005a) ANALYSIS Test Category Study Weight Primary Secondary Attention Faroe Islands 263 -1.13 -0.24 Attention Seychelles Islands 193 -0.01 -0.01 Intelligence Faroe Islands 876 -0.32 -0.07 Intelligence Seychelles Islands 643 -0.13 -0.13 Intelligence New Zealand 237 -0.70 -0.70 Language Faroe Islands 525 -4.06 -0.86 Language Seychelles Islands 386 -0.04 -0.04 Language New Zealand 142 -0.87 -0.87 Learning / Achievement Seychelles Islands 386 0.20 0.20 Memory Faroe Islands 525 -1.12 -0.24 Memory Seychelles Islands 386 0.09 0.09 Motor Faroe Islands 175 -1.24 -0.26 Motor Seychelles Islands 129 0.03 0.03 Motor New Zealand 47 -0.56 -0.56 Visuospatial/Visuomotor Faroe Islands 350 -0.99 -0.21 Visuospatial/Visuomotor Seychelles Islands 257 -0.03 -0.03
IQ slopes were generated by dividing raw scores by the standard deviation and multiplying by 15. The results of the Cohen et al. analysis were used in two ways. First, the results from all the tests were integrated with a probability tree where each measure was weighted using the weight assigned in the Cohen et al. (2005b) paper. Although the average of this function is similar to both the age of talking function and the Axelrad et al. analysis, the uncertainty distribution is highly skewed, resulting in a median estimate which is about half of the average. Second, the results of the verbal tests were used alone by employing a triangular distribution with minimum (0.036 IQse points per ppm in maternal hair) and maximum (0.87 IQse points per ppm in maternal hair) corresponding to the estimates from the Seychelles Islands and New Zealand, and a most likely value corresponding to the weighted average from all three estimates (0.51 IQse points per ppm in maternal hair). Over 90 percent of the weight comes from the Boston Naming Test that was used in the Faroe Islands and Seychelles Islands studies to measure verbal performance. Comparison of Neurodevelopmental Dose-Response Functions Quantitatively, the dose-response functions developed from Iraq, New Zealand, the Seychelles Islands, and the Faroe Islands can be grouped into four categories (see Figure C-11 and Figure C-12):
183
1. The primary Cohen slope derived from the Faroe Islands study is much higher than any of the other estimates. This difference may be attributed to the fact that it is derived from a supralinear dose-response function.
2. Both Z-Scores derived from the New Zealand study are relatively high compared
to most of the other estimates, but they are not that much larger than that developed from the walking milestone data from Iraq. Although results from this study were included in both the Cohen and Axelrad analyses, both gave the New Zealand study less weight.
3. There is a closely knit group of four Z-Score estimates which includes the
Carrington analysis of the talking milestone from the Iraqi poisoning episode, the Axelrad and secondary Cohen IQ functions derived from the Faroe Islands, and the and Axelrad slope for IQ in the Seychelles Islands.
4. The Cohen slope for IQse derived from the Seychelles Islands study is slightly
positive (i.e. the net decrease is negative), which is inconsistent with all of the other estimates.
The bases of the confidence intervals for the three dose-response functions considered in this analysis are different. These differences reflect the scientific rationale behind the derivation of the dose-response functions from their associated data. Although these differences have relatively little effect on the central estimates, they do affect the width and shape of the confidence intervals. In particular, some dose-response functions reflect statistical notions of probability (i.e., the uncertainty is related to an underlying frequency), while some do not. Uncertainties based on notions of frequency can be represented by continuous statistical distributions. The other sources of uncertainty may be represented with probability trees, where the sum of the probabilities of each model, study, or measure is one (Hacking, 1975; Rescher, 1993). The sources of uncertainty for each dose-response function considered are summarized in Table C-9. In spite of the differences in approach, the confidence intervals for the neurobehavioral dose-response functions have a breadth that are comparable (see Figure C-13).
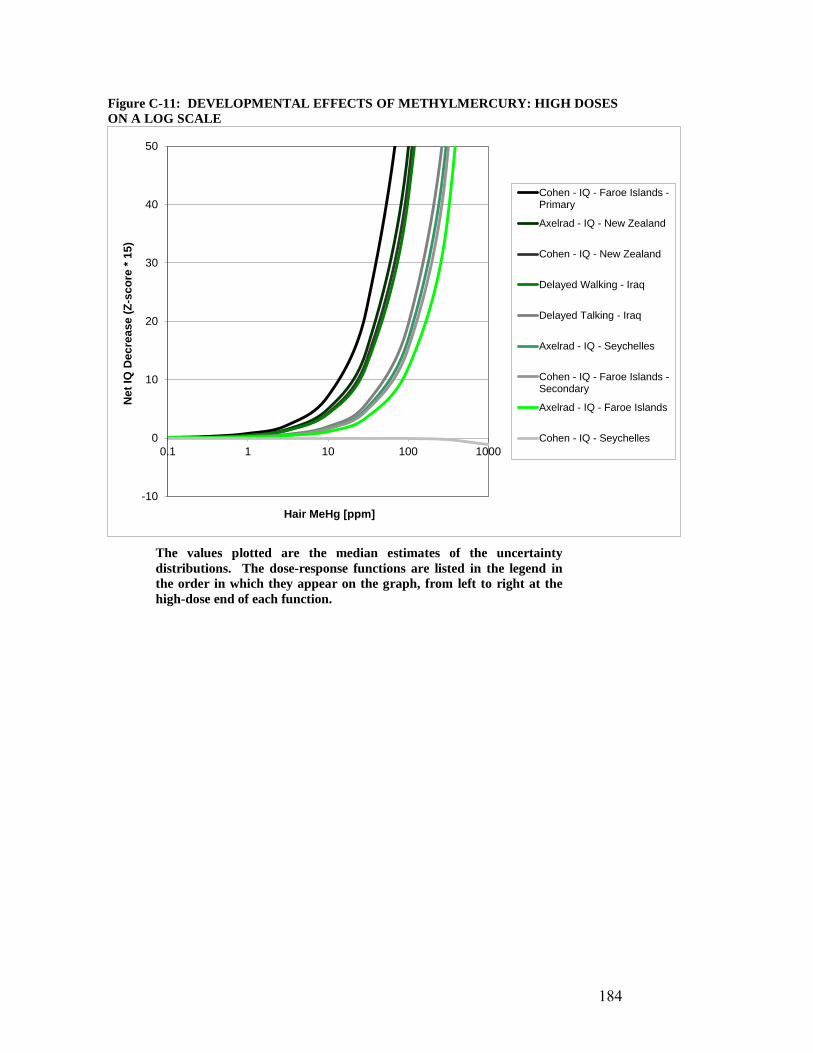
184
Figure C-11: DEVELOPMENTAL EFFECTS OF METHYLMERCURY: HIGH DOSES ON A LOG SCALE
-10
0
10
20
30
40
50
0.1 1 10 100 1000
Net
IQ D
ecre
ase
(Z-s
core
* 15
)
Hair MeHg [ppm]
Cohen - IQ - Faroe Islands -Primary
Axelrad - IQ - New Zealand
Cohen - IQ - New Zealand
Delayed Walking - Iraq
Delayed Talking - Iraq
Axelrad - IQ - Seychelles
Cohen - IQ - Faroe Islands -Secondary
Axelrad - IQ - Faroe Islands
Cohen - IQ - Seychelles
The values plotted are the median estimates of the uncertainty distributions. The dose-response functions are listed in the legend in the order in which they appear on the graph, from left to right at the high-dose end of each function.
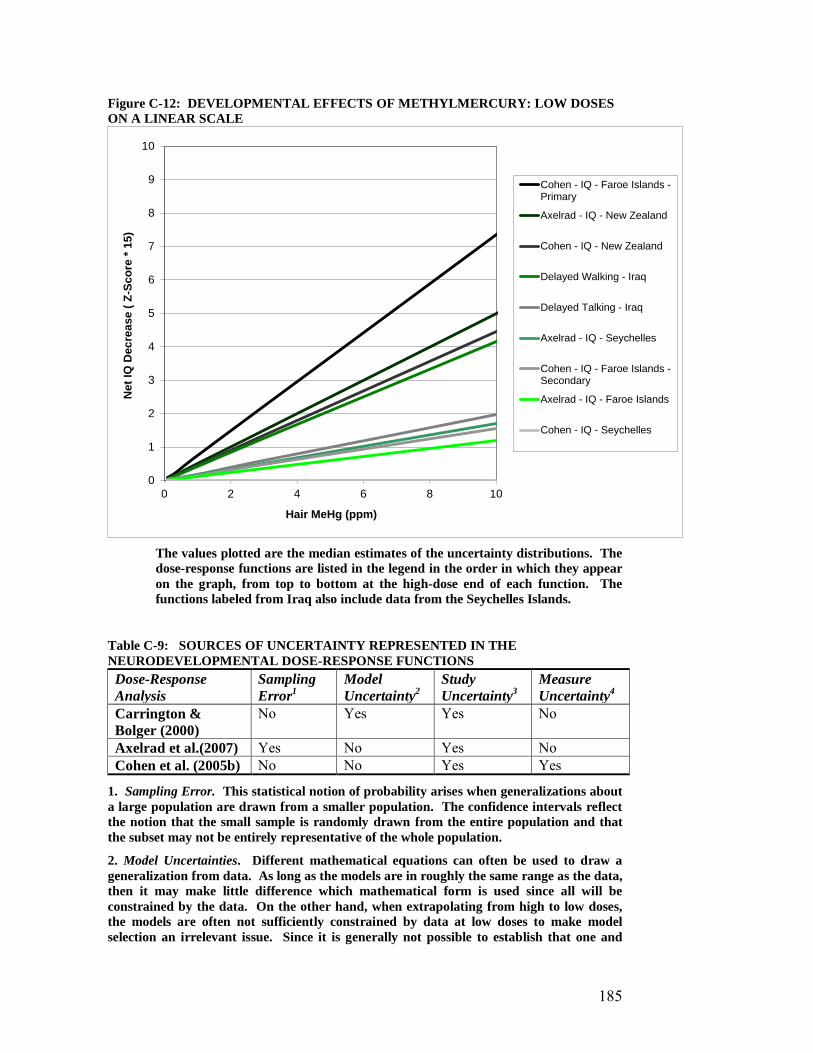
185
Figure C-12: DEVELOPMENTAL EFFECTS OF METHYLMERCURY: LOW DOSES ON A LINEAR SCALE
0
1
2
3
4
5
6
7
8
9
10
0 2 4 6 8 10
Net
IQ D
ecre
ase
( Z-S
core
* 15
)
Hair MeHg (ppm)
Cohen - IQ - Faroe Islands -Primary
Axelrad - IQ - New Zealand
Cohen - IQ - New Zealand
Delayed Walking - Iraq
Delayed Talking - Iraq
Axelrad - IQ - Seychelles
Cohen - IQ - Faroe Islands -Secondary
Axelrad - IQ - Faroe Islands
Cohen - IQ - Seychelles
The values plotted are the median estimates of the uncertainty distributions. The dose-response functions are listed in the legend in the order in which they appear on the graph, from top to bottom at the high-dose end of each function. The functions labeled from Iraq also include data from the Seychelles Islands.
Table C-9: SOURCES OF UNCERTAINTY REPRESENTED IN THE NEURODEVELOPMENTAL DOSE-RESPONSE FUNCTIONS Dose-Response Analysis
Sampling Error1
Model Uncertainty2
Study Uncertainty3
Measure Uncertainty4
Carrington & Bolger (2000)
No Yes Yes No
Axelrad et al.(2007) Yes No Yes No Cohen et al. (2005b) No No Yes Yes
1. Sampling Error. This statistical notion of probability arises when generalizations about a large population are drawn from a smaller population. The confidence intervals reflect the notion that the small sample is randomly drawn from the entire population and that the subset may not be entirely representative of the whole population.
2. Model Uncertainties. Different mathematical equations can often be used to draw a generalization from data. As long as the models are in roughly the same range as the data, then it may make little difference which mathematical form is used since all will be constrained by the data. On the other hand, when extrapolating from high to low doses, the models are often not sufficiently constrained by data at low doses to make model selection an irrelevant issue. Since it is generally not possible to establish that one and
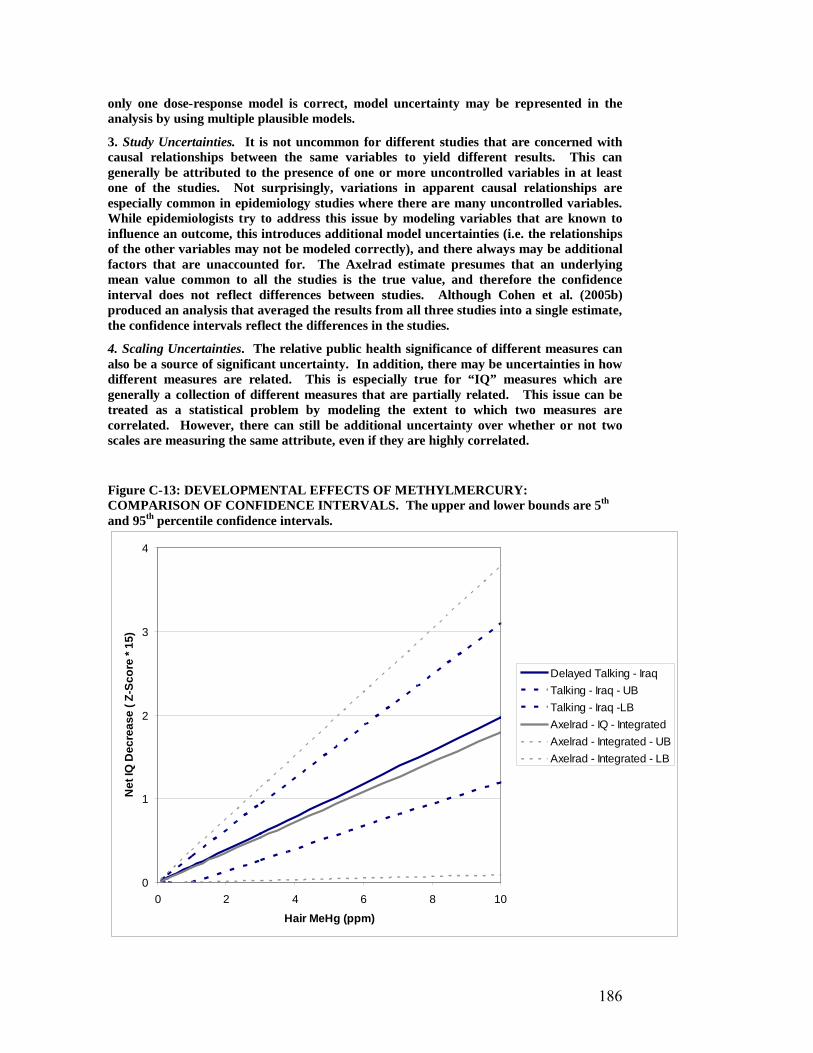
186
only one dose-response model is correct, model uncertainty may be represented in the analysis by using multiple plausible models.
3. Study Uncertainties. It is not uncommon for different studies that are concerned with causal relationships between the same variables to yield different results. This can generally be attributed to the presence of one or more uncontrolled variables in at least one of the studies. Not surprisingly, variations in apparent causal relationships are especially common in epidemiology studies where there are many uncontrolled variables. While epidemiologists try to address this issue by modeling variables that are known to influence an outcome, this introduces additional model uncertainties (i.e. the relationships of the other variables may not be modeled correctly), and there always may be additional factors that are unaccounted for. The Axelrad estimate presumes that an underlying mean value common to all the studies is the true value, and therefore the confidence interval does not reflect differences between studies. Although Cohen et al. (2005b) produced an analysis that averaged the results from all three studies into a single estimate, the confidence intervals reflect the differences in the studies.
4. Scaling Uncertainties. The relative public health significance of different measures can also be a source of significant uncertainty. In addition, there may be uncertainties in how different measures are related. This is especially true for “IQ” measures which are generally a collection of different measures that are partially related. This issue can be treated as a statistical problem by modeling the extent to which two measures are correlated. However, there can still be additional uncertainty over whether or not two scales are measuring the same attribute, even if they are highly correlated.
Figure C-13: DEVELOPMENTAL EFFECTS OF METHYLMERCURY: COMPARISON OF CONFIDENCE INTERVALS. The upper and lower bounds are 5th and 95th percentile confidence intervals.
0
1
2
3
4
0 2 4 6 8 10
Hair MeHg (ppm)
Net
IQ D
ecre
ase
( Z-S
core
* 15
)
Delayed Talking - IraqTalking - Iraq - UBTalking - Iraq -LBAxelrad - IQ - IntegratedAxelrad - Integrated - UBAxelrad - Integrated - LB

187
(b)(2) Neurodevelopmental Benefits from Nutrients in Fish Early Development Data: Daniels et al. (2004) studied the relationship between maternal fish intake during pregnancy and cognitive development using data from the Avon Longitudinal Study on Parents and Children (ALSPAC), which is comprised of English children born in 1991-1992. Fish consumption of mothers and children was quantified from questionnaires posed to 7,421 mothers during and after pregnancy. Each individual child’s cognitive development was evaluated using adaptations of the MacArthur Communicative Development Inventory at 15 months of age and the Denver Developmental Screening Test at 18 months. Prenatal measurement of methylmercury was collected in a subset of the stud population. Their study measured and categorized the maternal fish intake (“mum”) of oily and white fish intake as follows: rarely or never, once per two weeks, one to three times per week, and four or more times per week. The estimated average fish intake per meal was 4.5 ounces or 127.6 grams. The child’s fish intake was monitored at ages six months (child6) and 12 (child12) months by simply noting whether or not at least one fish meal was consumed per week. The study also recorded the age of the child in weeks (age) at the completion of the MacArthur Communicative Development Inventory (MCDI) and the Denver Developmental Screening Test (DDST). Preliminary Analysis: We analyzed the data from this study using multivariate linear regression analysis. Each of the six outcomes (i.e., three different MCDI scores and three different DDST scores) was analyzed four different ways:
1. Maternal fish consumption; age of child at testing; children’s fish consumption at six months, mercury concentration in cord tissue;
2. Maternal fish consumption; age of child at testing; children’s fish consumption at 12 months; mercury concentration in cord tissue;
3. Maternal fish consumption; age of child at testing; children’s fish consumption at six months;
4. Maternal fish consumption; age of child at testing; children’s fish consumption at 12 months;
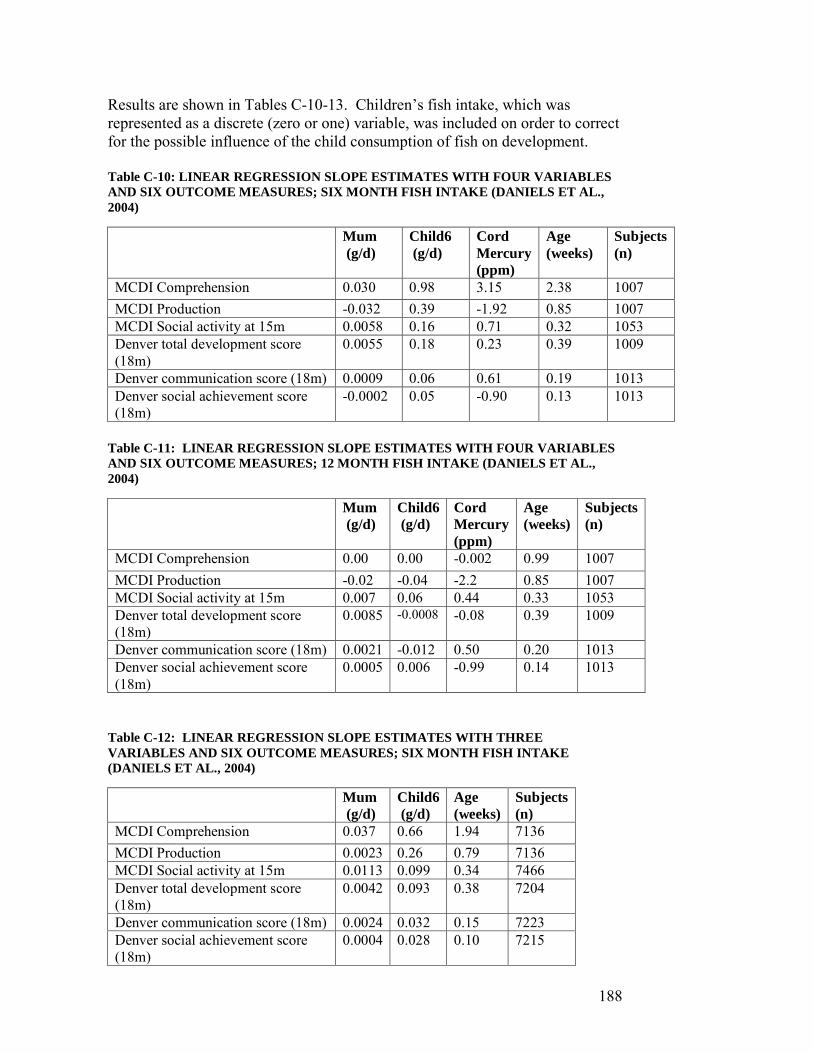
188
Results are shown in Tables C-10-13. Children’s fish intake, which was represented as a discrete (zero or one) variable, was included on order to correct for the possible influence of the child consumption of fish on development. Table C-10: LINEAR REGRESSION SLOPE ESTIMATES WITH FOUR VARIABLES AND SIX OUTCOME MEASURES; SIX MONTH FISH INTAKE (DANIELS ET AL., 2004)
Table C-11: LINEAR REGRESSION SLOPE ESTIMATES WITH FOUR VARIABLES AND SIX OUTCOME MEASURES; 12 MONTH FISH INTAKE (DANIELS ET AL., 2004)
Table C-12: LINEAR REGRESSION SLOPE ESTIMATES WITH THREE VARIABLES AND SIX OUTCOME MEASURES; SIX MONTH FISH INTAKE (DANIELS ET AL., 2004)
Mum (g/d)
Child6 (g/d)
Cord Mercury (ppm)
Age (weeks)
Subjects (n)
MCDI Comprehension 0.030 0.98 3.15 2.38 1007 MCDI Production -0.032 0.39 -1.92 0.85 1007 MCDI Social activity at 15m 0.0058 0.16 0.71 0.32 1053 Denver total development score (18m)
0.0055 0.18 0.23 0.39 1009
Denver communication score (18m) 0.0009 0.06 0.61 0.19 1013 Denver social achievement score (18m)
-0.0002 0.05 -0.90 0.13 1013
Mum (g/d)
Child6 (g/d)
Cord Mercury (ppm)
Age (weeks)
Subjects (n)
MCDI Comprehension 0.00 0.00 -0.002 0.99 1007 MCDI Production -0.02 -0.04 -2.2 0.85 1007 MCDI Social activity at 15m 0.007 0.06 0.44 0.33 1053 Denver total development score (18m)
0.0085 -0.0008 -0.08 0.39 1009
Denver communication score (18m) 0.0021 -0.012 0.50 0.20 1013 Denver social achievement score (18m)
0.0005 0.006 -0.99 0.14 1013
Mum (g/d)
Child6 (g/d)
Age (weeks)
Subjects (n)
MCDI Comprehension 0.037 0.66 1.94 7136 MCDI Production 0.0023 0.26 0.79 7136 MCDI Social activity at 15m 0.0113 0.099 0.34 7466 Denver total development score (18m)
0.0042 0.093 0.38 7204
Denver communication score (18m) 0.0024 0.032 0.15 7223 Denver social achievement score (18m)
0.0004 0.028 0.10 7215
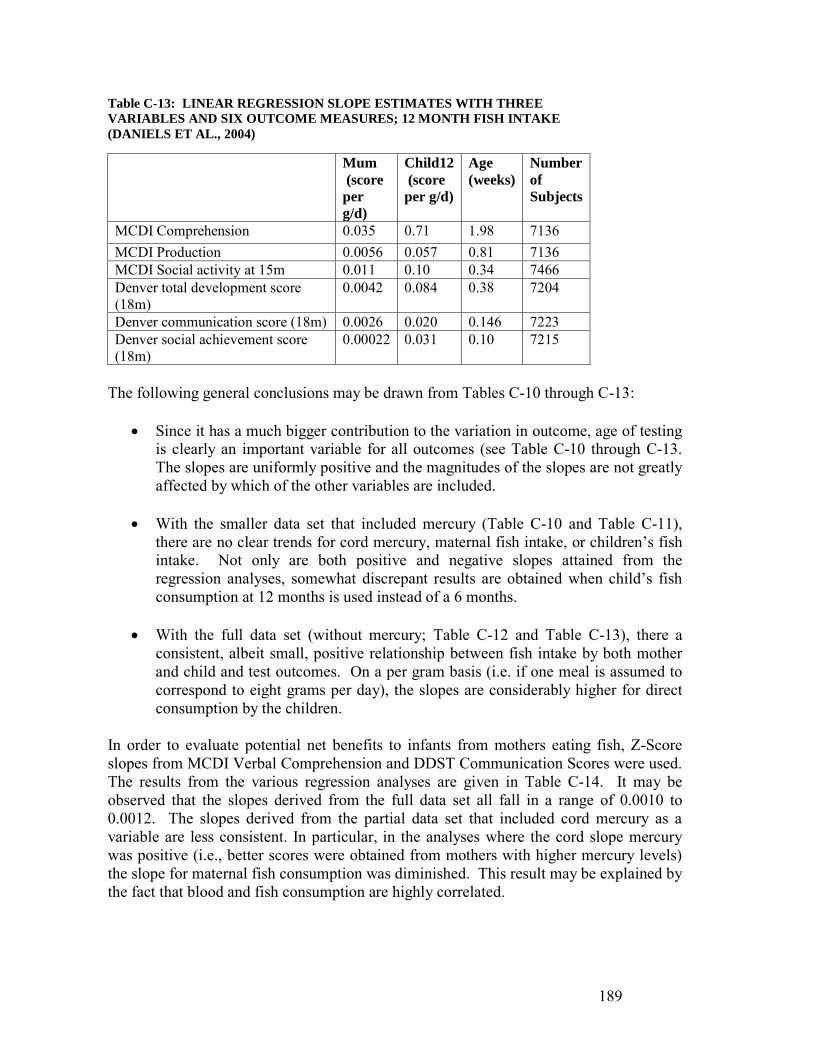
189
Table C-13: LINEAR REGRESSION SLOPE ESTIMATES WITH THREE VARIABLES AND SIX OUTCOME MEASURES; 12 MONTH FISH INTAKE (DANIELS ET AL., 2004)
The following general conclusions may be drawn from Tables C-10 through C-13:
• Since it has a much bigger contribution to the variation in outcome, age of testing is clearly an important variable for all outcomes (see Table C-10 through C-13. The slopes are uniformly positive and the magnitudes of the slopes are not greatly affected by which of the other variables are included.
• With the smaller data set that included mercury (Table C-10 and Table C-11),
there are no clear trends for cord mercury, maternal fish intake, or children’s fish intake. Not only are both positive and negative slopes attained from the regression analyses, somewhat discrepant results are obtained when child’s fish consumption at 12 months is used instead of a 6 months.
• With the full data set (without mercury; Table C-12 and Table C-13), there a
consistent, albeit small, positive relationship between fish intake by both mother and child and test outcomes. On a per gram basis (i.e. if one meal is assumed to correspond to eight grams per day), the slopes are considerably higher for direct consumption by the children.
In order to evaluate potential net benefits to infants from mothers eating fish, Z-Score slopes from MCDI Verbal Comprehension and DDST Communication Scores were used. The results from the various regression analyses are given in Table C-14. It may be observed that the slopes derived from the full data set all fall in a range of 0.0010 to 0.0012. The slopes derived from the partial data set that included cord mercury as a variable are less consistent. In particular, in the analyses where the cord slope mercury was positive (i.e., better scores were obtained from mothers with higher mercury levels) the slope for maternal fish consumption was diminished. This result may be explained by the fact that blood and fish consumption are highly correlated.
Mum (score per g/d)
Child12 (score per g/d)
Age (weeks)
Number of Subjects
MCDI Comprehension 0.035 0.71 1.98 7136 MCDI Production 0.0056 0.057 0.81 7136 MCDI Social activity at 15m 0.011 0.10 0.34 7466 Denver total development score (18m)
0.0042 0.084 0.38 7204
Denver communication score (18m) 0.0026 0.020 0.146 7223 Denver social achievement score (18m)
0.00022 0.031 0.10 7215
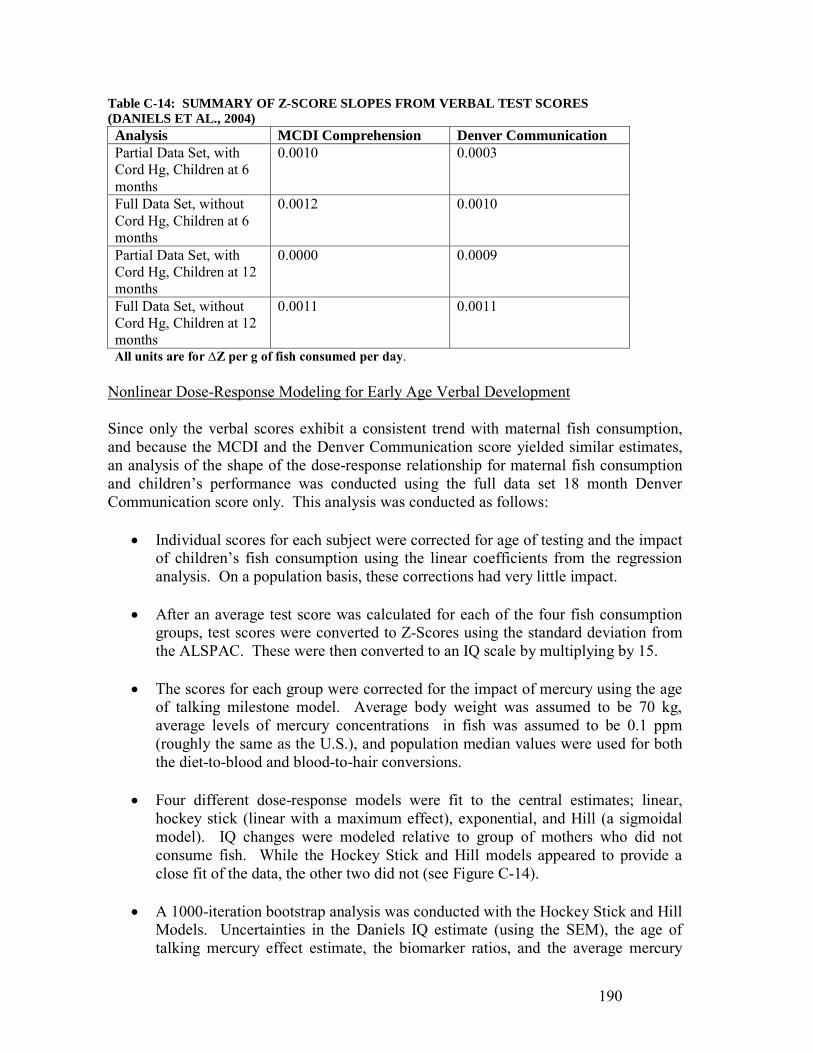
190
Table C-14: SUMMARY OF Z-SCORE SLOPES FROM VERBAL TEST SCORES (DANIELS ET AL., 2004) Analysis MCDI Comprehension Denver Communication Partial Data Set, with Cord Hg, Children at 6 months
0.0010 0.0003
Full Data Set, without Cord Hg, Children at 6 months
0.0012 0.0010
Partial Data Set, with Cord Hg, Children at 12 months
0.0000 0.0009
Full Data Set, without Cord Hg, Children at 12 months
0.0011
0.0011
All units are for ∆Z per g of fish consumed per day. Nonlinear Dose-Response Modeling for Early Age Verbal Development Since only the verbal scores exhibit a consistent trend with maternal fish consumption, and because the MCDI and the Denver Communication score yielded similar estimates, an analysis of the shape of the dose-response relationship for maternal fish consumption and children’s performance was conducted using the full data set 18 month Denver Communication score only. This analysis was conducted as follows:
• Individual scores for each subject were corrected for age of testing and the impact of children’s fish consumption using the linear coefficients from the regression analysis. On a population basis, these corrections had very little impact.
• After an average test score was calculated for each of the four fish consumption
groups, test scores were converted to Z-Scores using the standard deviation from the ALSPAC. These were then converted to an IQ scale by multiplying by 15.
• The scores for each group were corrected for the impact of mercury using the age
of talking milestone model. Average body weight was assumed to be 70 kg, average levels of mercury concentrations in fish was assumed to be 0.1 ppm (roughly the same as the U.S.), and population median values were used for both the diet-to-blood and blood-to-hair conversions.
• Four different dose-response models were fit to the central estimates; linear,
hockey stick (linear with a maximum effect), exponential, and Hill (a sigmoidal model). IQ changes were modeled relative to group of mothers who did not consume fish. While the Hockey Stick and Hill models appeared to provide a close fit of the data, the other two did not (see Figure C-14).
• A 1000-iteration bootstrap analysis was conducted with the Hockey Stick and Hill
Models. Uncertainties in the Daniels IQ estimate (using the SEM), the age of talking mercury effect estimate, the biomarker ratios, and the average mercury
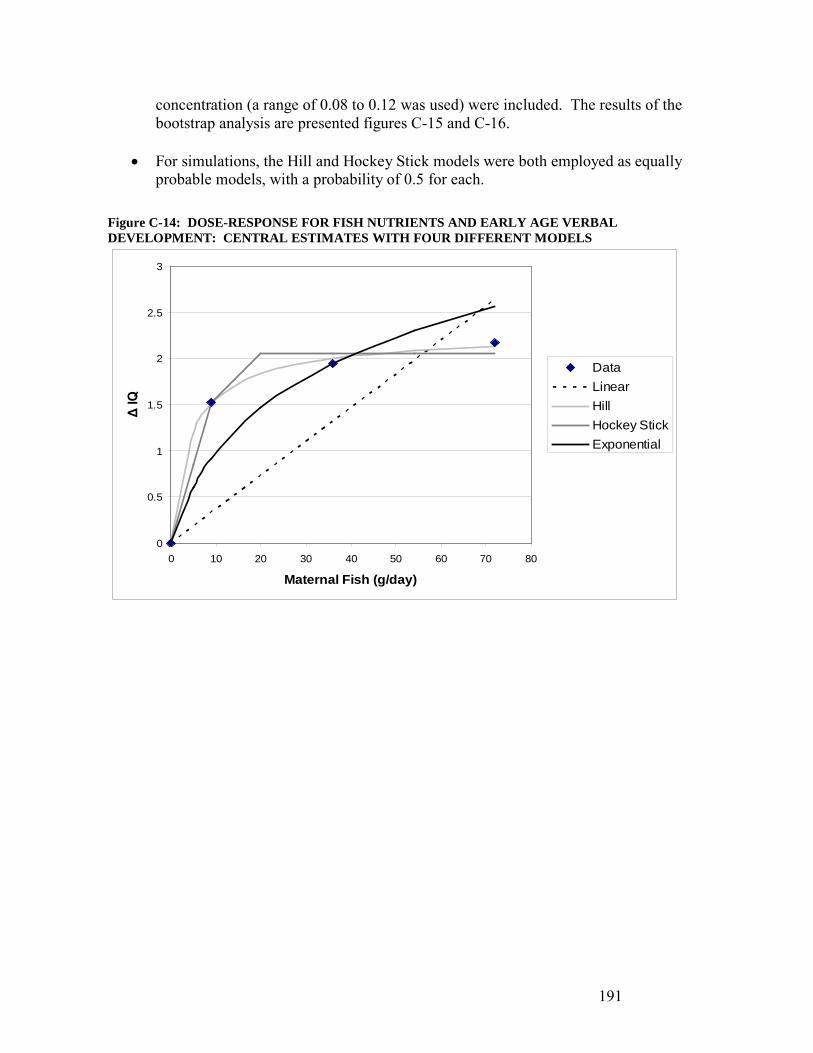
191
concentration (a range of 0.08 to 0.12 was used) were included. The results of the bootstrap analysis are presented figures C-15 and C-16.
• For simulations, the Hill and Hockey Stick models were both employed as equally
probable models, with a probability of 0.5 for each. Figure C-14: DOSE-RESPONSE FOR FISH NUTRIENTS AND EARLY AGE VERBAL DEVELOPMENT: CENTRAL ESTIMATES WITH FOUR DIFFERENT MODELS
0
0.5
1
1.5
2
2.5
3
0 10 20 30 40 50 60 70 80
Maternal Fish (g/day)
Δ IQ
DataLinearHillHockey StickExponential

192
Figure C-15: DOSE-RESPONSE FOR FISH NUTRIENTS AND EARLY AGE VERBAL DEVELOPMENT: HILL MODEL WITH CONFIDENCE INTERVALS.
0
0.5
1
1.5
2
2.5
3
3.5
0 10 20 30 40 50 60 70 80 90
Maternal Fish (g/day)
Δ IQ
Figure C-16: DOSE-RESPONSE FOR FISH NUTRIENTS AND EARLY AGE VERBAL DEVELOPMENT: HOCKEY STICK MODEL WITH CONFIDENCE INTERVALS
0
0.5
1
1.5
2
2.5
3
3.5
0 10 20 30 40 50 60 70 80 90
Maternal Fish (g/day)
Δ IQ
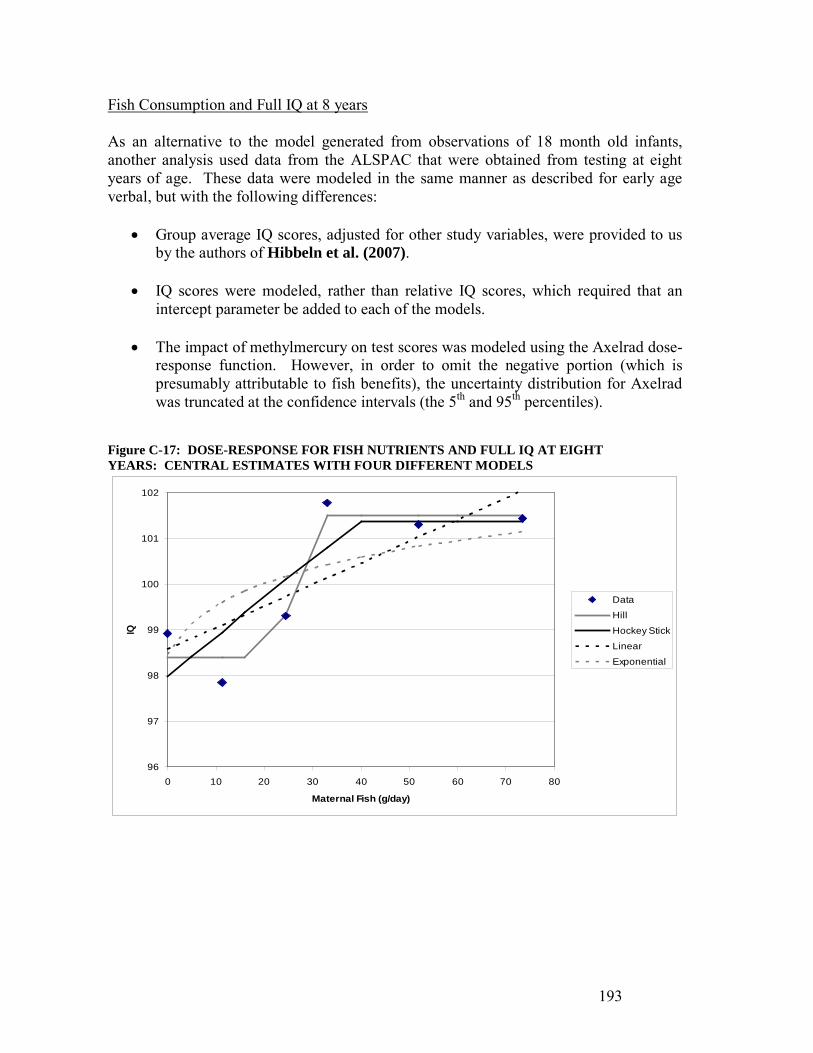
193
Fish Consumption and Full IQ at 8 years As an alternative to the model generated from observations of 18 month old infants, another analysis used data from the ALSPAC that were obtained from testing at eight years of age. These data were modeled in the same manner as described for early age verbal, but with the following differences:
• Group average IQ scores, adjusted for other study variables, were provided to us by the authors of Hibbeln et al. (2007).
• IQ scores were modeled, rather than relative IQ scores, which required that an
intercept parameter be added to each of the models.
• The impact of methylmercury on test scores was modeled using the Axelrad dose-response function. However, in order to omit the negative portion (which is presumably attributable to fish benefits), the uncertainty distribution for Axelrad was truncated at the confidence intervals (the 5th and 95th percentiles).
Figure C-17: DOSE-RESPONSE FOR FISH NUTRIENTS AND FULL IQ AT EIGHT YEARS: CENTRAL ESTIMATES WITH FOUR DIFFERENT MODELS
96
97
98
99
100
101
102
0 10 20 30 40 50 60 70 80
Maternal Fish (g/day)
IQ
Data
Hill
Hockey Stick
Linear
Exponential
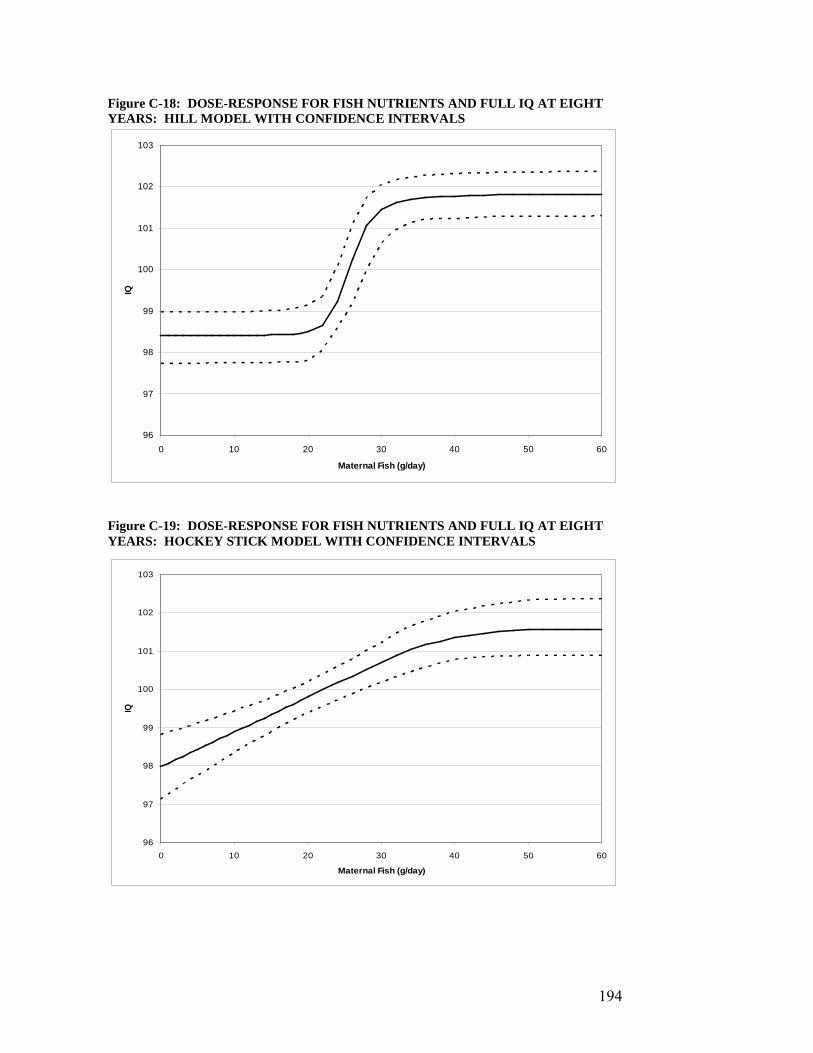
194
Figure C-18: DOSE-RESPONSE FOR FISH NUTRIENTS AND FULL IQ AT EIGHT YEARS: HILL MODEL WITH CONFIDENCE INTERVALS
96
97
98
99
100
101
102
103
0 10 20 30 40 50 60
Maternal Fish (g/day)
IQ
Figure C-19: DOSE-RESPONSE FOR FISH NUTRIENTS AND FULL IQ AT EIGHT YEARS: HOCKEY STICK MODEL WITH CONFIDENCE INTERVALS
96
97
98
99
100
101
102
103
0 10 20 30 40 50 60
Maternal Fish (g/day)
IQ
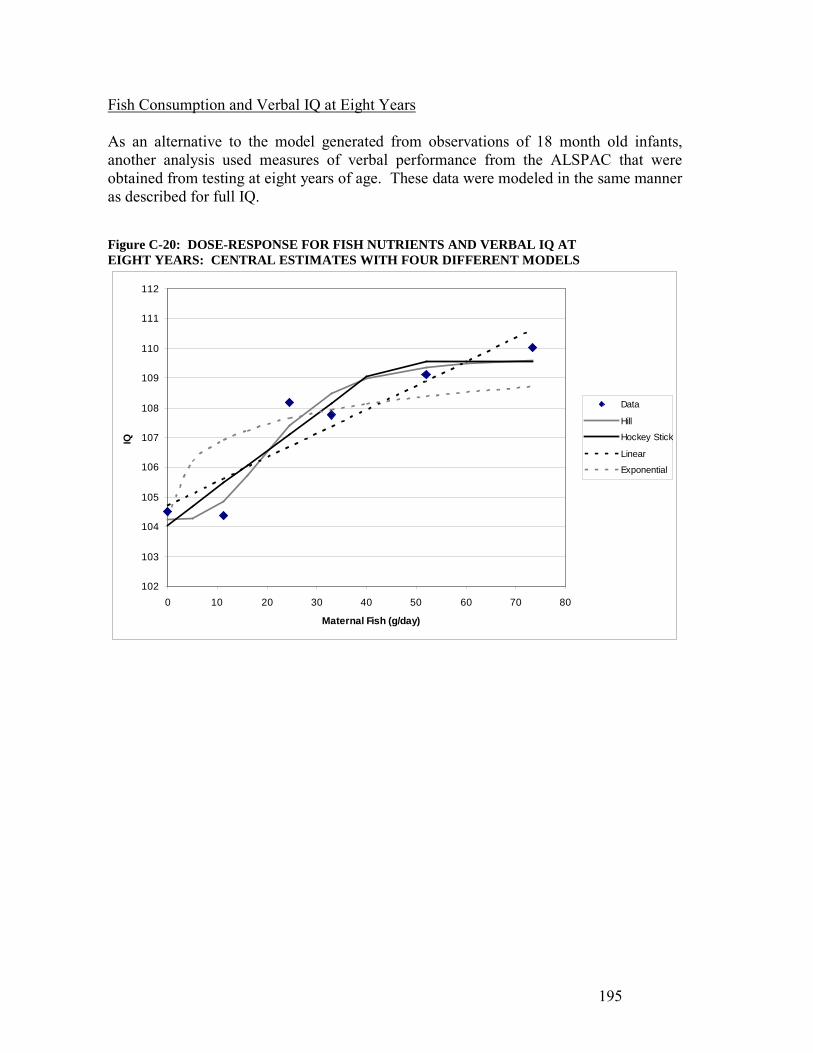
195
Fish Consumption and Verbal IQ at Eight Years As an alternative to the model generated from observations of 18 month old infants, another analysis used measures of verbal performance from the ALSPAC that were obtained from testing at eight years of age. These data were modeled in the same manner as described for full IQ.
Figure C-20: DOSE-RESPONSE FOR FISH NUTRIENTS AND VERBAL IQ AT EIGHT YEARS: CENTRAL ESTIMATES WITH FOUR DIFFERENT MODELS
102
103
104
105
106
107
108
109
110
111
112
0 10 20 30 40 50 60 70 80
Maternal Fish (g/day)
IQ
Data
Hill
Hockey Stick
Linear
Exponential
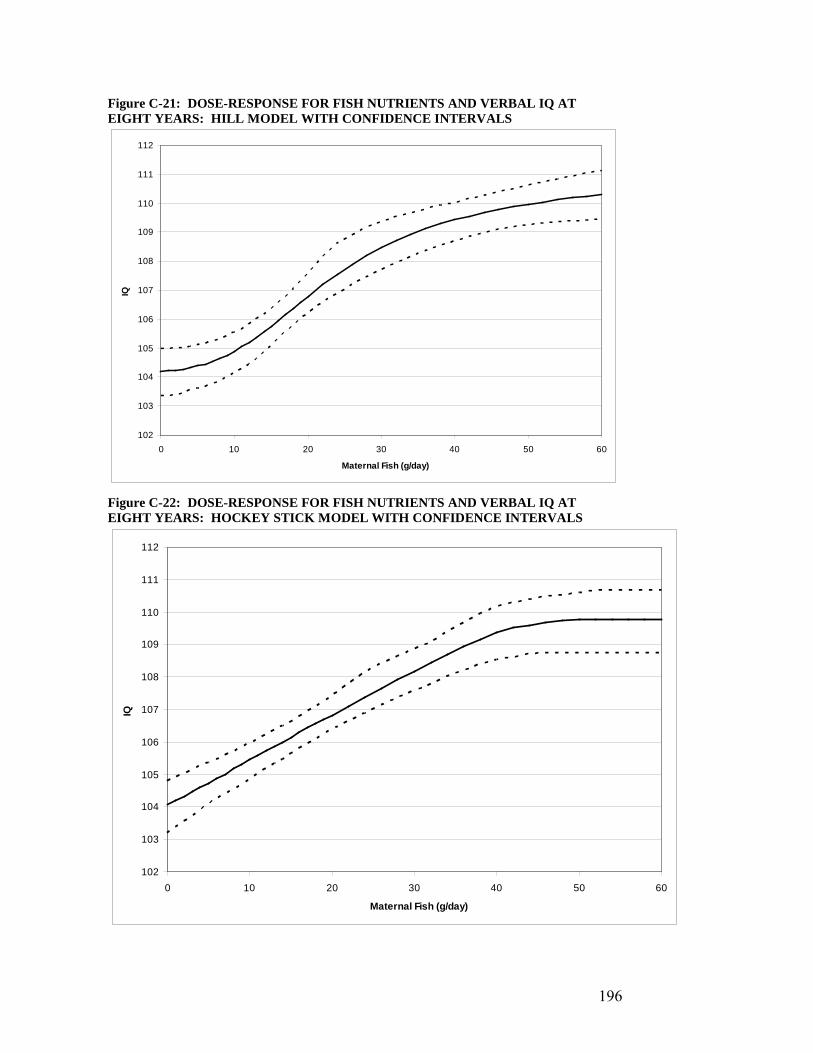
196
Figure C-21: DOSE-RESPONSE FOR FISH NUTRIENTS AND VERBAL IQ AT EIGHT YEARS: HILL MODEL WITH CONFIDENCE INTERVALS
102
103
104
105
106
107
108
109
110
111
112
0 10 20 30 40 50 60
Maternal Fish (g/day)
IQ
Figure C-22: DOSE-RESPONSE FOR FISH NUTRIENTS AND VERBAL IQ AT EIGHT YEARS: HOCKEY STICK MODEL WITH CONFIDENCE INTERVALS
102
103
104
105
106
107
108
109
110
111
112
0 10 20 30 40 50 60
Maternal Fish (g/day)
IQ
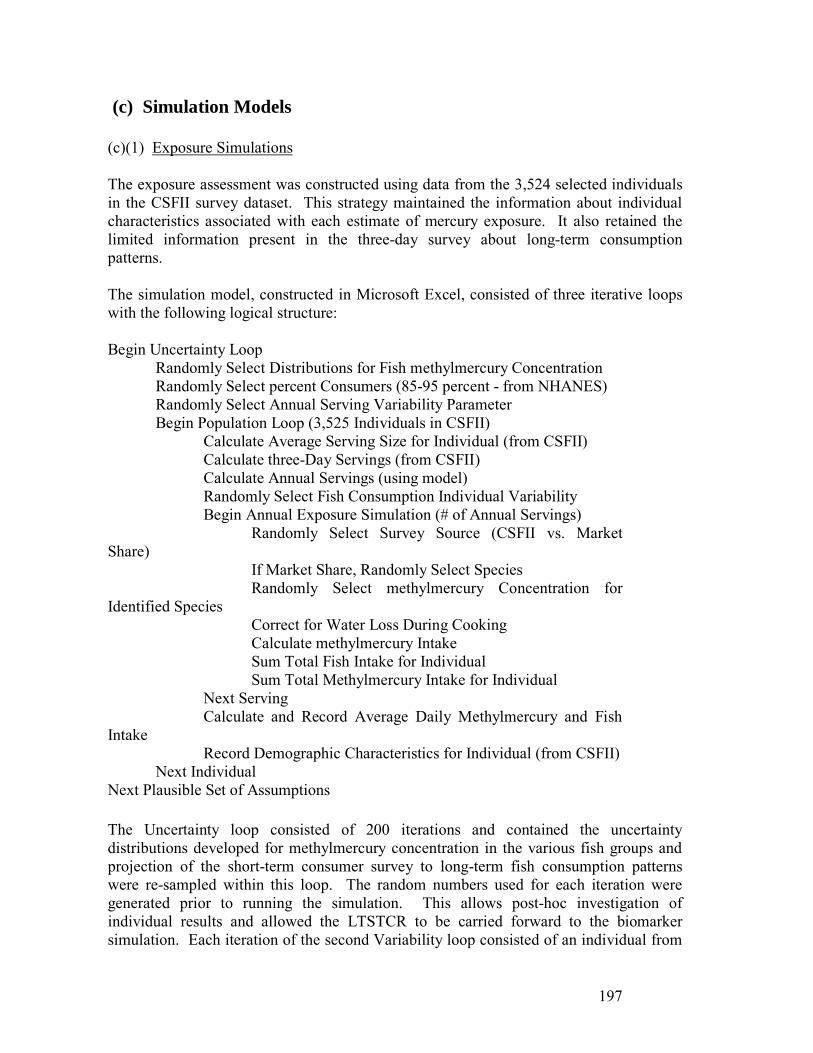
197
(c) Simulation Models (c)(1) Exposure Simulations The exposure assessment was constructed using data from the 3,524 selected individuals in the CSFII survey dataset. This strategy maintained the information about individual characteristics associated with each estimate of mercury exposure. It also retained the limited information present in the three-day survey about long-term consumption patterns. The simulation model, constructed in Microsoft Excel, consisted of three iterative loops with the following logical structure: Begin Uncertainty Loop Randomly Select Distributions for Fish methylmercury Concentration Randomly Select percent Consumers (85-95 percent - from NHANES) Randomly Select Annual Serving Variability Parameter Begin Population Loop (3,525 Individuals in CSFII) Calculate Average Serving Size for Individual (from CSFII) Calculate three-Day Servings (from CSFII) Calculate Annual Servings (using model) Randomly Select Fish Consumption Individual Variability Begin Annual Exposure Simulation (# of Annual Servings) Randomly Select Survey Source (CSFII vs. Market Share) If Market Share, Randomly Select Species Randomly Select methylmercury Concentration for Identified Species Correct for Water Loss During Cooking Calculate methylmercury Intake Sum Total Fish Intake for Individual Sum Total Methylmercury Intake for Individual Next Serving Calculate and Record Average Daily Methylmercury and Fish Intake Record Demographic Characteristics for Individual (from CSFII) Next Individual Next Plausible Set of Assumptions The Uncertainty loop consisted of 200 iterations and contained the uncertainty distributions developed for methylmercury concentration in the various fish groups and projection of the short-term consumer survey to long-term fish consumption patterns were re-sampled within this loop. The random numbers used for each iteration were generated prior to running the simulation. This allows post-hoc investigation of individual results and allowed the LTSTCR to be carried forward to the biomarker simulation. Each iteration of the second Variability loop consisted of an individual from
198
the CSFII survey who consumed one or more servings of fish during the three-day survey. The number of servings and average serving size for each individual are calculated at this step. The annual number of servings was then used to set the number of iterations for the third loop, in which each iteration simulated a fish consumption event. First, a random number was used to select the information source (CSFII or per capita) to be used for the serving. Specifically, if the random number was less than the percentile ranging from 0.2 to 0.8 selected at the outset of the uncertainty iterations, a randomly selected CSFII record for the individual was used to identify the species and the serving size. Otherwise, a species was randomly selected from a histogram distribution based on per capita disappearance rate, and the average serving size for the individual was used. Second, the mercury concentration for the species consumed by randomly sampling from either an empirical distribution (shark, swordfish, and tuna) or a modeled distribution using a mean value from NMFS data and a distribution selected at the outset of the uncertainty iteration. Methylmercury exposure from the serving was then calculated by multiplying serving size by concentration. After completion of the specified number of servings, total methylmercury exposure for the year was summed from all the servings, and then divided by 366 to yield an average daily methylmercury. This number was recorded along with the age, sex, body weight, and demographic weight for the individual. After completion of the middle and outer loops, a two-dimensional array was produced with dimensions of 200 uncertainty iterations by 3,525 variability iterations. These were stored and used as the basis for the subsequent biomarker simulation. At the end of each variability loop, per capita population percentiles were calculated. This was accomplished by generating a frequency histogram from the 3,525 estimates where the width is proportional to the demographic weight provided with the survey. Individuals not consuming fish were included in the distribution by introducing a value of zero for the fraction of non-consumers. The percentage of fish consumers was calculated by multiplying the number of consumers in the three-day survey by the LTSTCR for the current uncertainty iteration. Subtraction of the resulting value from one yielded the fraction of non-consumers. The 882 women of childbearing age in the CSFII dataset were used in the subsequent dose-response simulation. (c)(2) Dose-Response Simulations Each dose-response simulation consisted of a two-dimensional Monte-Carlo routine with an outer uncertainty loop and an inner variability loop with the following logical structure:
199
Begin Uncertainty Loop Randomly Select Uncertainty Iteration from Exposure Assessment Randomly Select Population Model for Diet-Blood Ratio Randomly Select Dose-Response Models Begin Population Loop Randomly Select Individual from Exposure Assessment Randomly select Diet-Blood Ratio from Population Model Correct for Body Weight Add other Mercury Exposures Calculate Blood methylmercury Randomly select Blood-Hair Ratio from Empirical Distribution Calculate Predicted Hair Value Calculate methylmercury-Dependent Neurobehavioral Outcomes Calculate Fish-Dependent Neurobehavioral Outcomes Calculate Net Neurobehavioral Outcome Record Output Next Individual Calculate Population Distributions for Neurobehavioral Outcomes Next Plausible Set of Assumptions A simulation for the entire population was run with 5,000 variability iterations and 300 uncertainty iterations. At the outset of each uncertainty iteration, one of the 200 uncertainty iterations from the exposure assessment and a population model for the diet to blood ratio were randomly selected. The variability loops were then run with random selection of the individual from the exposure assessment, the diet/blood ratio from the population model, and the blood/hair ratio from the empirical distribution. Random numbers for the variability iterations were generated prior to the simulation and the same set of values were used for each uncertainty iteration. These values were then used to calculate blood and hair values for each individual. At the conclusion of each variability loop, per capita population percentiles were calculated in the same manner the percentiles for daily methylmercury exposure.
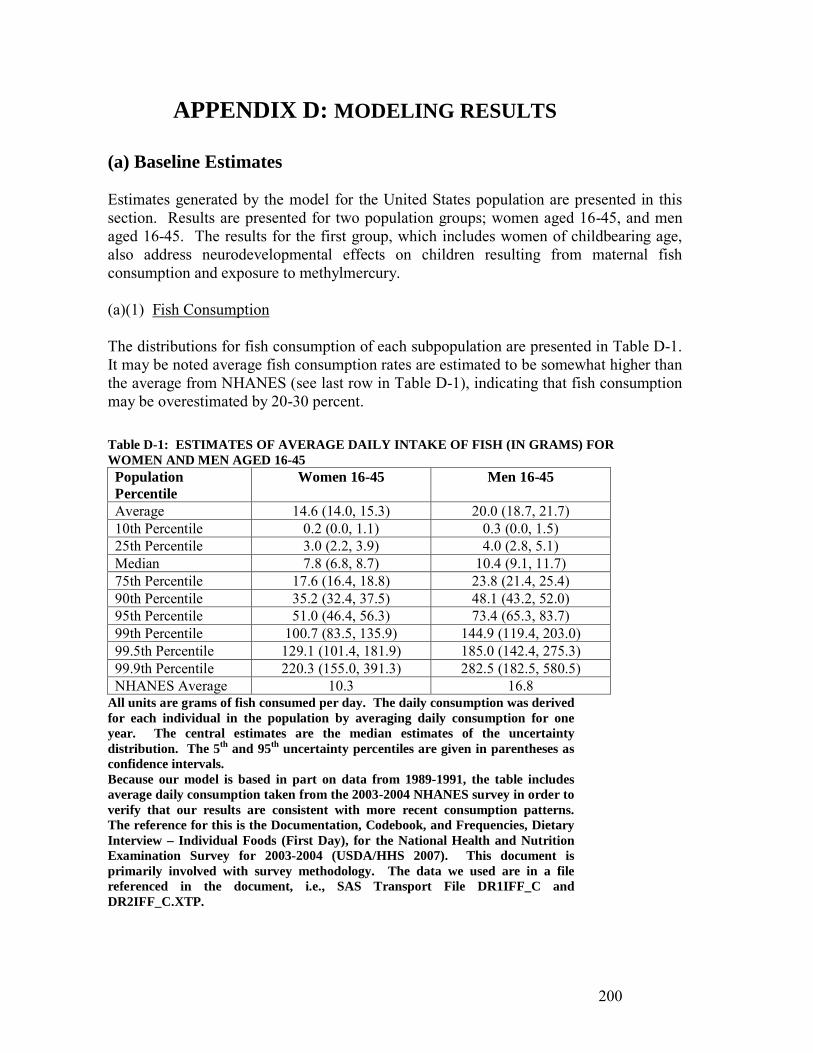
200
APPENDIX D: MODELING RESULTS (a) Baseline Estimates Estimates generated by the model for the United States population are presented in this section. Results are presented for two population groups; women aged 16-45, and men aged 16-45. The results for the first group, which includes women of childbearing age, also address neurodevelopmental effects on children resulting from maternal fish consumption and exposure to methylmercury. (a)(1) Fish Consumption The distributions for fish consumption of each subpopulation are presented in Table D-1. It may be noted average fish consumption rates are estimated to be somewhat higher than the average from NHANES (see last row in Table D-1), indicating that fish consumption may be overestimated by 20-30 percent. Table D-1: ESTIMATES OF AVERAGE DAILY INTAKE OF FISH (IN GRAMS) FOR WOMEN AND MEN AGED 16-45 Population Percentile
Women 16-45 Men 16-45
Average 14.6 (14.0, 15.3) 20.0 (18.7, 21.7) 10th Percentile 0.2 (0.0, 1.1) 0.3 (0.0, 1.5) 25th Percentile 3.0 (2.2, 3.9) 4.0 (2.8, 5.1) Median 7.8 (6.8, 8.7) 10.4 (9.1, 11.7) 75th Percentile 17.6 (16.4, 18.8) 23.8 (21.4, 25.4) 90th Percentile 35.2 (32.4, 37.5) 48.1 (43.2, 52.0) 95th Percentile 51.0 (46.4, 56.3) 73.4 (65.3, 83.7) 99th Percentile 100.7 (83.5, 135.9) 144.9 (119.4, 203.0) 99.5th Percentile 129.1 (101.4, 181.9) 185.0 (142.4, 275.3) 99.9th Percentile 220.3 (155.0, 391.3) 282.5 (182.5, 580.5) NHANES Average 10.3 16.8
All units are grams of fish consumed per day. The daily consumption was derived for each individual in the population by averaging daily consumption for one year. The central estimates are the median estimates of the uncertainty distribution. The 5th and 95th uncertainty percentiles are given in parentheses as confidence intervals. Because our model is based in part on data from 1989-1991, the table includes average daily consumption taken from the 2003-2004 NHANES survey in order to verify that our results are consistent with more recent consumption patterns. The reference for this is the Documentation, Codebook, and Frequencies, Dietary Interview – Individual Foods (First Day), for the National Health and Nutrition Examination Survey for 2003-2004 (USDA/HHS 2007). This document is primarily involved with survey methodology. The data we used are in a file referenced in the document, i.e., SAS Transport File DR1IFF_C and DR2IFF_C.XTP.

201
(a)(2) Blood and Hair Mercury Levels The distributions for blood and hair mercury levels in younger women are presented in Table D-2. For purposes of comparison, the model estimates are compared to results from NHANES in Figures D-1 and D-2. It may be observed that the blood and levels model are generally 5-10 percent lower than the levels observed in NHANES, with the largest discrepancies occurring at the upper percentiles. The predicted hair levels show a greater discrepancy at the upper percentiles. These discrepancies may be explained, at least in part, by two factors:
• While the NHANES measurements are for total mercury in both blood and hair, the model is intended to estimate concentrations of just methylmercury.
• The model has been updated with 2007 market data indicating that the consumption patterns have changed somewhat so that the average commercial fish weighted by frequency of consumption, now has less methylmercury in it than when the more recently reported NHANES mercury biomarker survey data were conducted, especially for hair (2000 for hair and 2006 for blood).
• The sample size for the NHANES hair values is much smaller than the sample size for the blood values, so there it is more likely that the upper percentile values are not representative of the general population.
Table D-2: MODEL ESTIMATES OF BLOOD AND HAIR METHYLMERCURY LEVELS IN WOMEN OF CHILDBEARING AGE Population Percentile
Dietary Hg from Fish
(μg/day)
Blood Hg (µg/L):
Hair Hg (ppm)
Average 1.4 (1.3, 1.5) 1.3 (1.2, 1.4) 0.35 (0.28, 0.44) 10th Percentile 0.0 (0.0, 0.1) 0.1 (0.1, 0.1) 0.02 (0.02, 0.04) 25th Percentile 0.2 (0.1, 0.3) 0.3 (0.2, 0.3) 0.06 (0.04, 0.09) Median 0.7 (0.6, 0.8) 0.7 (0.6, 0.7) 0.17 (0.13, 0.22) 75th Percentile 1.7 (1.5, 1.8) 1.5 (1.4, 1.6) 0.40 (0.31, 0.50) 90th Percentile 3.5 (3.2, 3.8) 3.1 (2.8, 3.3) 0.83 (0.66, 1.05) 95th Percentile 5.3 (4.5, 5.9) 4.5 (4.0, 5.2) 1.27 (1.01, 1.63) 99th Percentile 10.7 (8.8, 13.8) 9.5 (7.9, 11.8) 2.82 (2.06, 3.64) 99.5th Percentile 13.8 (10.9, 17.6) 12.2 (10.0, 16.4) 3.73 (2.66, 4.97) 99.9th Percentile 22.3 (15.6, 44.0) 20.8 (14.5, 34.4) 6.21 (3.98, 9.66)
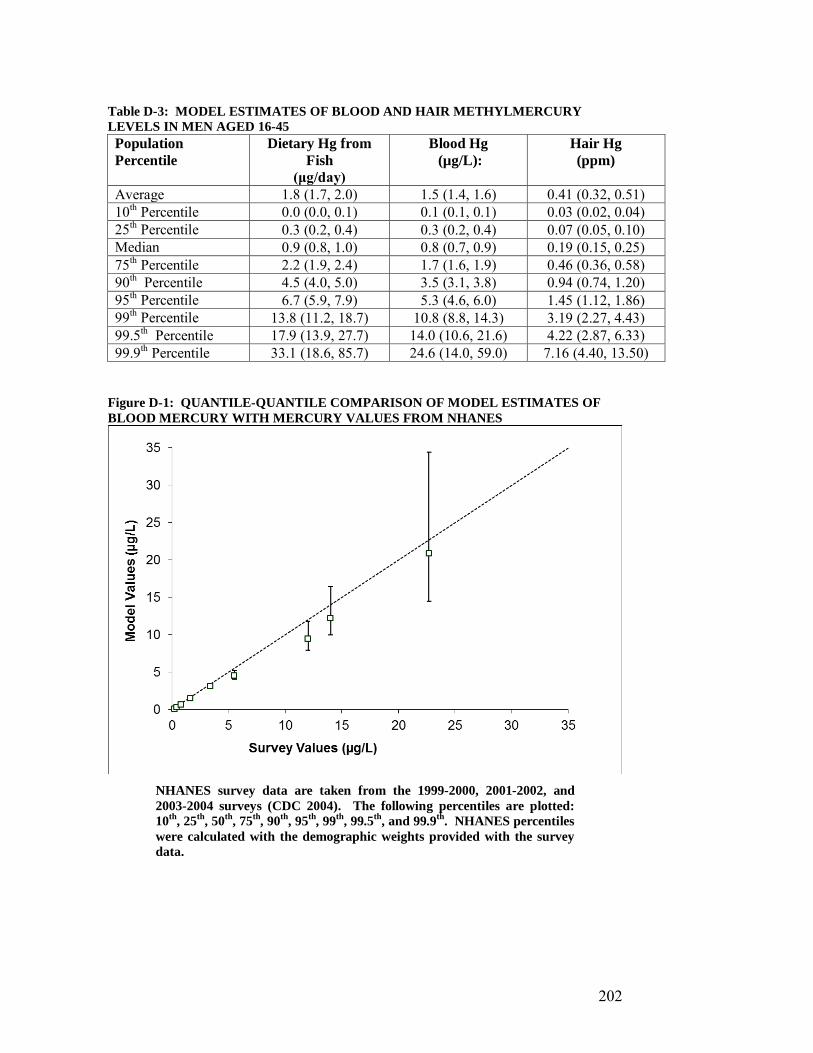
202
Table D-3: MODEL ESTIMATES OF BLOOD AND HAIR METHYLMERCURY LEVELS IN MEN AGED 16-45 Population Percentile
Dietary Hg from Fish
(μg/day)
Blood Hg (µg/L):
Hair Hg (ppm)
Average 1.8 (1.7, 2.0) 1.5 (1.4, 1.6) 0.41 (0.32, 0.51) 10th Percentile 0.0 (0.0, 0.1) 0.1 (0.1, 0.1) 0.03 (0.02, 0.04) 25th Percentile 0.3 (0.2, 0.4) 0.3 (0.2, 0.4) 0.07 (0.05, 0.10) Median 0.9 (0.8, 1.0) 0.8 (0.7, 0.9) 0.19 (0.15, 0.25) 75th Percentile 2.2 (1.9, 2.4) 1.7 (1.6, 1.9) 0.46 (0.36, 0.58) 90th Percentile 4.5 (4.0, 5.0) 3.5 (3.1, 3.8) 0.94 (0.74, 1.20) 95th Percentile 6.7 (5.9, 7.9) 5.3 (4.6, 6.0) 1.45 (1.12, 1.86) 99th Percentile 13.8 (11.2, 18.7) 10.8 (8.8, 14.3) 3.19 (2.27, 4.43) 99.5th Percentile 17.9 (13.9, 27.7) 14.0 (10.6, 21.6) 4.22 (2.87, 6.33) 99.9th Percentile 33.1 (18.6, 85.7) 24.6 (14.0, 59.0) 7.16 (4.40, 13.50)
Figure D-1: QUANTILE-QUANTILE COMPARISON OF MODEL ESTIMATES OF BLOOD MERCURY WITH MERCURY VALUES FROM NHANES
NHANES survey data are taken from the 1999-2000, 2001-2002, and 2003-2004 surveys (CDC 2004). The following percentiles are plotted: 10th, 25th, 50th, 75th, 90th, 95th, 99th, 99.5th, and 99.9th. NHANES percentiles were calculated with the demographic weights provided with the survey data.
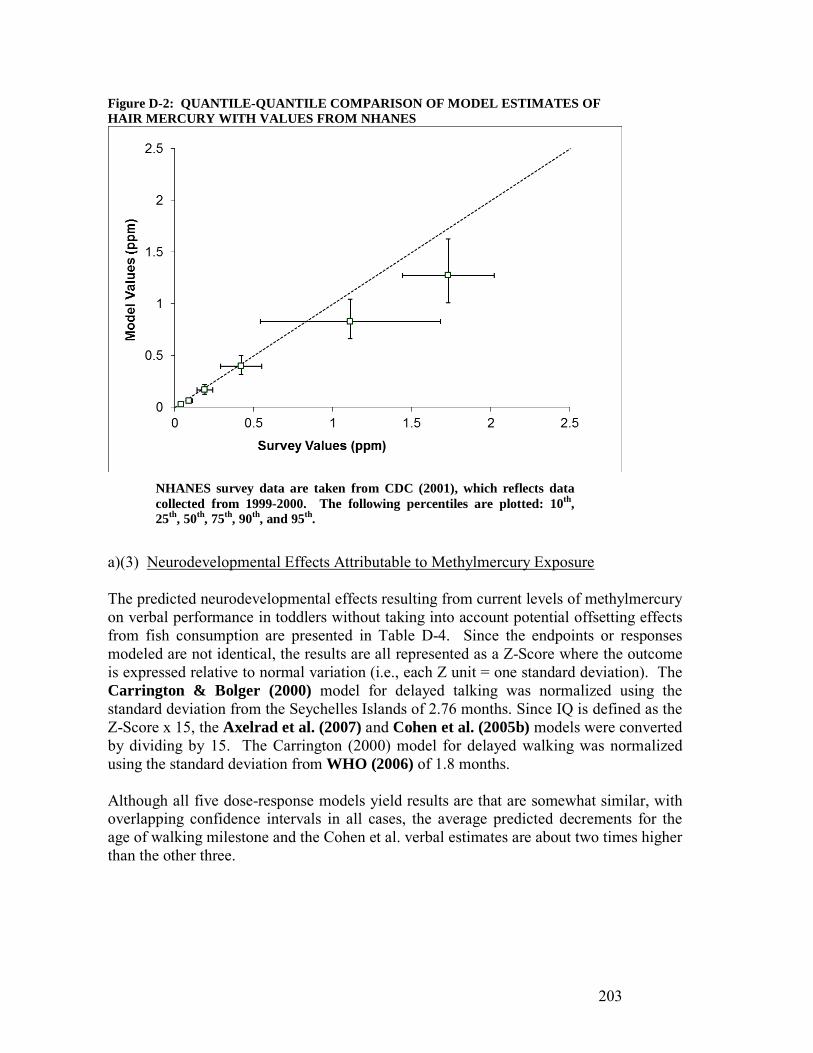
203
Figure D-2: QUANTILE-QUANTILE COMPARISON OF MODEL ESTIMATES OF HAIR MERCURY WITH VALUES FROM NHANES
NHANES survey data are taken from CDC (2001), which reflects data collected from 1999-2000. The following percentiles are plotted: 10th, 25th, 50th, 75th, 90th, and 95th.
a)(3) Neurodevelopmental Effects Attributable to Methylmercury Exposure The predicted neurodevelopmental effects resulting from current levels of methylmercury on verbal performance in toddlers without taking into account potential offsetting effects from fish consumption are presented in Table D-4. Since the endpoints or responses modeled are not identical, the results are all represented as a Z-Score where the outcome is expressed relative to normal variation (i.e., each Z unit = one standard deviation). The Carrington & Bolger (2000) model for delayed talking was normalized using the standard deviation from the Seychelles Islands of 2.76 months. Since IQ is defined as the Z-Score x 15, the Axelrad et al. (2007) and Cohen et al. (2005b) models were converted by dividing by 15. The Carrington (2000) model for delayed walking was normalized using the standard deviation from WHO (2006) of 1.8 months. Although all five dose-response models yield results are that are somewhat similar, with overlapping confidence intervals in all cases, the average predicted decrements for the age of walking milestone and the Cohen et al. verbal estimates are about two times higher than the other three.
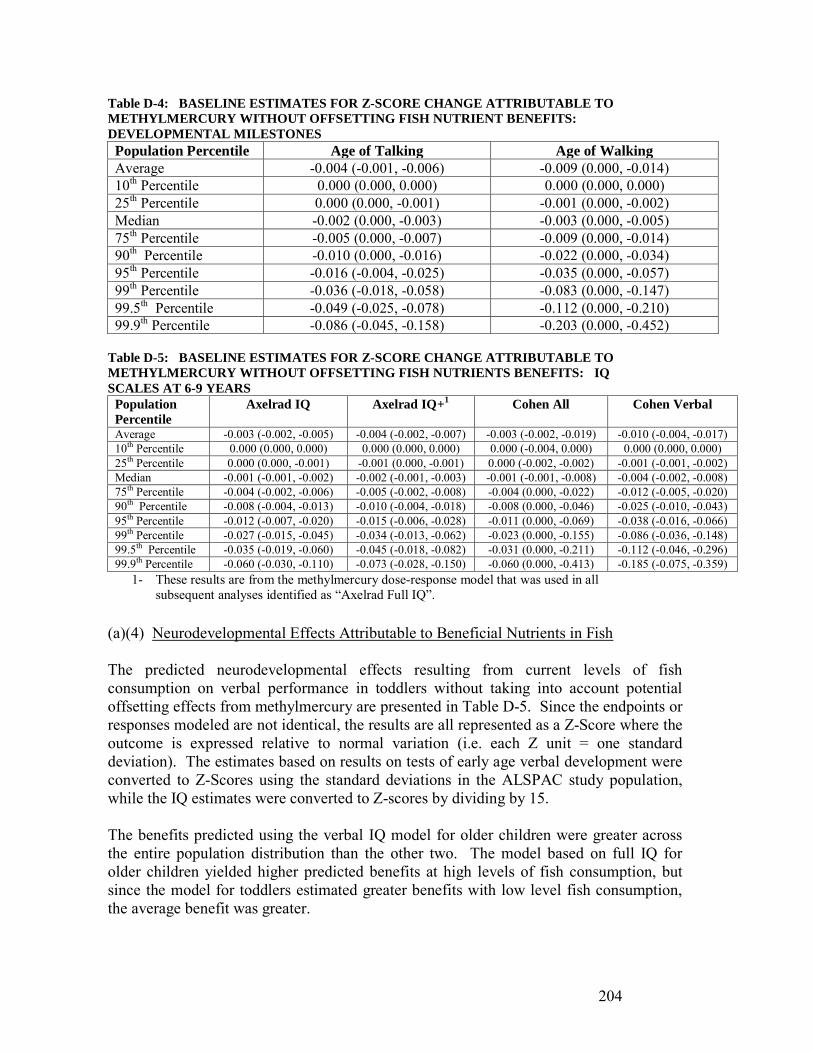
204
Table D-4: BASELINE ESTIMATES FOR Z-SCORE CHANGE ATTRIBUTABLE TO METHYLMERCURY WITHOUT OFFSETTING FISH NUTRIENT BENEFITS: DEVELOPMENTAL MILESTONES Population Percentile Age of Talking Age of Walking Average -0.004 (-0.001, -0.006) -0.009 (0.000, -0.014) 10th Percentile 0.000 (0.000, 0.000) 0.000 (0.000, 0.000) 25th Percentile 0.000 (0.000, -0.001) -0.001 (0.000, -0.002) Median -0.002 (0.000, -0.003) -0.003 (0.000, -0.005) 75th Percentile -0.005 (0.000, -0.007) -0.009 (0.000, -0.014) 90th Percentile -0.010 (0.000, -0.016) -0.022 (0.000, -0.034) 95th Percentile -0.016 (-0.004, -0.025) -0.035 (0.000, -0.057) 99th Percentile -0.036 (-0.018, -0.058) -0.083 (0.000, -0.147) 99.5th Percentile -0.049 (-0.025, -0.078) -0.112 (0.000, -0.210) 99.9th Percentile -0.086 (-0.045, -0.158) -0.203 (0.000, -0.452)
Table D-5: BASELINE ESTIMATES FOR Z-SCORE CHANGE ATTRIBUTABLE TO METHYLMERCURY WITHOUT OFFSETTING FISH NUTRIENTS BENEFITS: IQ SCALES AT 6-9 YEARS
Population Percentile
Axelrad IQ Axelrad IQ+1 Cohen All Cohen Verbal
Average -0.003 (-0.002, -0.005) -0.004 (-0.002, -0.007) -0.003 (-0.002, -0.019) -0.010 (-0.004, -0.017) 10th Percentile 0.000 (0.000, 0.000) 0.000 (0.000, 0.000) 0.000 (-0.004, 0.000) 0.000 (0.000, 0.000) 25th Percentile 0.000 (0.000, -0.001) -0.001 (0.000, -0.001) 0.000 (-0.002, -0.002) -0.001 (-0.001, -0.002) Median -0.001 (-0.001, -0.002) -0.002 (-0.001, -0.003) -0.001 (-0.001, -0.008) -0.004 (-0.002, -0.008) 75th Percentile -0.004 (-0.002, -0.006) -0.005 (-0.002, -0.008) -0.004 (0.000, -0.022) -0.012 (-0.005, -0.020) 90th Percentile -0.008 (-0.004, -0.013) -0.010 (-0.004, -0.018) -0.008 (0.000, -0.046) -0.025 (-0.010, -0.043) 95th Percentile -0.012 (-0.007, -0.020) -0.015 (-0.006, -0.028) -0.011 (0.000, -0.069) -0.038 (-0.016, -0.066) 99th Percentile -0.027 (-0.015, -0.045) -0.034 (-0.013, -0.062) -0.023 (0.000, -0.155) -0.086 (-0.036, -0.148) 99.5th Percentile -0.035 (-0.019, -0.060) -0.045 (-0.018, -0.082) -0.031 (0.000, -0.211) -0.112 (-0.046, -0.296) 99.9th Percentile -0.060 (-0.030, -0.110) -0.073 (-0.028, -0.150) -0.060 (0.000, -0.413) -0.185 (-0.075, -0.359)
1- These results are from the methylmercury dose-response model that was used in all subsequent analyses identified as “Axelrad Full IQ”.
(a)(4) Neurodevelopmental Effects Attributable to Beneficial Nutrients in Fish The predicted neurodevelopmental effects resulting from current levels of fish consumption on verbal performance in toddlers without taking into account potential offsetting effects from methylmercury are presented in Table D-5. Since the endpoints or responses modeled are not identical, the results are all represented as a Z-Score where the outcome is expressed relative to normal variation (i.e. each Z unit = one standard deviation). The estimates based on results on tests of early age verbal development were converted to Z-Scores using the standard deviations in the ALSPAC study population, while the IQ estimates were converted to Z-scores by dividing by 15. The benefits predicted using the verbal IQ model for older children were greater across the entire population distribution than the other two. The model based on full IQ for older children yielded higher predicted benefits at high levels of fish consumption, but since the model for toddlers estimated greater benefits with low level fish consumption, the average benefit was greater.

205
Table D-6: BASELINE ESTIMATES FOR Z-SCORE CHANGE ATTRIBUTABLE TO FISH WITH NO OFFSETTING METHYLMERCURY DECREMENTS Population Percentile
Verbal At About 18 mo
Full IQ At 6-9 yrs
Verbal IQ At 6-9 yrs
Average 0.073 (0.032, 0.138) 0.049 (0.029, 0.093) 0.104 (0.073, 0.140) 10th Percentile 0.000 (0.000, 0.034) 0.000 (0.000, 0.006) 0.000 (0.000, 0.009) 25th Percentile 0.027 (0.000, 0.132) 0.000 (0.000, 0.026) 0.019 (0.000, 0.039) Median 0.074 (0.017, 0.166) 0.003 (0.000, 0.063) 0.057 (0.004, 0.091) 75th Percentile 0.120 (0.046, 0.190) 0.051 (0.000, 0.139) 0.156 (0.095, 0.226) 90th Percentile 0.136 (0.083, 0.194) 0.215 (0.145, 0.283) 0.322 (0.247, 0.392) 95th Percentile 0.147 (0.091, 0.202) 0.232 (0.177, 0.303) 0.384 (0.299, 0.456) 99th Percentile 0.153 (0.097, 0.208) 0.233 (0.177, 0.311) 0.410 (0.301, 0.571) 99.5th Percentile 0.153 (0.097, 0.208) 0.233 (0.177, 0.311) 0.412 (0.301, 0.617) 99.9th Percentile 0.156 (0.097, 0.220) 0.233 (0.177, 0.311) 0.414 (0.301, 0.668)
(a)(5) Net Effects Attributable to Fish Consumption In order to investigate the possible consequences of net effects of maternal consumption of fish, three simulation models were constructed that included the sum of both methylmercury effects and beneficial effects. The first model characterized mercury effects with the Carrington & Bolger (2000) delayed talking analysis, and beneficial effects based on the analysis of the Denver verbal comprehension score at 18 months analysis from the ALSPAC (Daniels et al., 2004) study using the standard deviations in the ALSPAC study population. The second model used the Axelrad et al. (2007) analysis to estimate mercury effects and the full IQ ALSPAC model to characterize benefits. The third model used Cohen al. (2005a) to characterize later age verbal decrements and the verbal IQ ALSPAC model to characterize benefits. These results are presented in Table D-7. It may be noted that while the results from all three models indicate a benefit for most individuals, and the confidence intervals from all three include a negative component, the full IQ model has a negative central estimate through the fifth percentile.
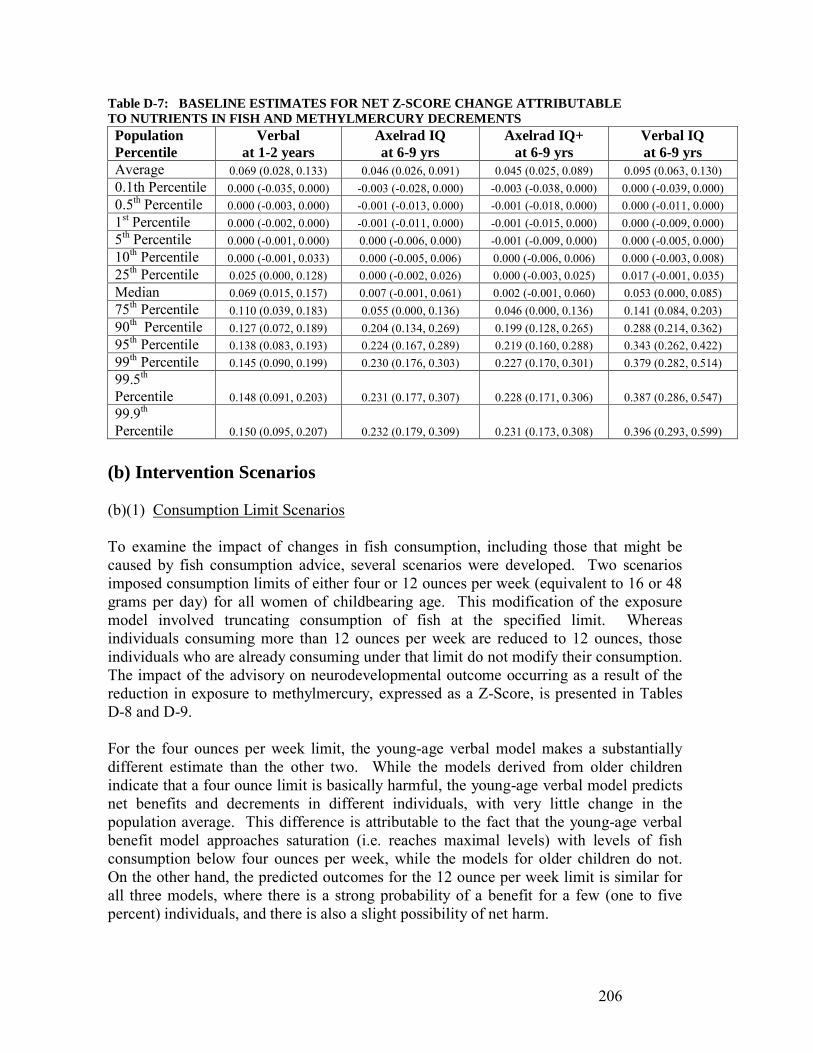
206
Table D-7: BASELINE ESTIMATES FOR NET Z-SCORE CHANGE ATTRIBUTABLE TO NUTRIENTS IN FISH AND METHYLMERCURY DECREMENTS Population Percentile
Verbal at 1-2 years
Axelrad IQ at 6-9 yrs
Axelrad IQ+ at 6-9 yrs
Verbal IQ at 6-9 yrs
Average 0.069 (0.028, 0.133) 0.046 (0.026, 0.091) 0.045 (0.025, 0.089) 0.095 (0.063, 0.130) 0.1th Percentile 0.000 (-0.035, 0.000) -0.003 (-0.028, 0.000) -0.003 (-0.038, 0.000) 0.000 (-0.039, 0.000) 0.5th Percentile 0.000 (-0.003, 0.000) -0.001 (-0.013, 0.000) -0.001 (-0.018, 0.000) 0.000 (-0.011, 0.000) 1st Percentile 0.000 (-0.002, 0.000) -0.001 (-0.011, 0.000) -0.001 (-0.015, 0.000) 0.000 (-0.009, 0.000) 5th Percentile 0.000 (-0.001, 0.000) 0.000 (-0.006, 0.000) -0.001 (-0.009, 0.000) 0.000 (-0.005, 0.000) 10th Percentile 0.000 (-0.001, 0.033) 0.000 (-0.005, 0.006) 0.000 (-0.006, 0.006) 0.000 (-0.003, 0.008) 25th Percentile 0.025 (0.000, 0.128) 0.000 (-0.002, 0.026) 0.000 (-0.003, 0.025) 0.017 (-0.001, 0.035) Median 0.069 (0.015, 0.157) 0.007 (-0.001, 0.061) 0.002 (-0.001, 0.060) 0.053 (0.000, 0.085) 75th Percentile 0.110 (0.039, 0.183) 0.055 (0.000, 0.136) 0.046 (0.000, 0.136) 0.141 (0.084, 0.203) 90th Percentile 0.127 (0.072, 0.189) 0.204 (0.134, 0.269) 0.199 (0.128, 0.265) 0.288 (0.214, 0.362) 95th Percentile 0.138 (0.083, 0.193) 0.224 (0.167, 0.289) 0.219 (0.160, 0.288) 0.343 (0.262, 0.422) 99th Percentile 0.145 (0.090, 0.199) 0.230 (0.176, 0.303) 0.227 (0.170, 0.301) 0.379 (0.282, 0.514) 99.5th Percentile 0.148 (0.091, 0.203) 0.231 (0.177, 0.307) 0.228 (0.171, 0.306) 0.387 (0.286, 0.547) 99.9th Percentile 0.150 (0.095, 0.207) 0.232 (0.179, 0.309) 0.231 (0.173, 0.308) 0.396 (0.293, 0.599)
(b) Intervention Scenarios (b)(1) Consumption Limit Scenarios To examine the impact of changes in fish consumption, including those that might be caused by fish consumption advice, several scenarios were developed. Two scenarios imposed consumption limits of either four or 12 ounces per week (equivalent to 16 or 48 grams per day) for all women of childbearing age. This modification of the exposure model involved truncating consumption of fish at the specified limit. Whereas individuals consuming more than 12 ounces per week are reduced to 12 ounces, those individuals who are already consuming under that limit do not modify their consumption. The impact of the advisory on neurodevelopmental outcome occurring as a result of the reduction in exposure to methylmercury, expressed as a Z-Score, is presented in Tables D-8 and D-9. For the four ounces per week limit, the young-age verbal model makes a substantially different estimate than the other two. While the models derived from older children indicate that a four ounce limit is basically harmful, the young-age verbal model predicts net benefits and decrements in different individuals, with very little change in the population average. This difference is attributable to the fact that the young-age verbal benefit model approaches saturation (i.e. reaches maximal levels) with levels of fish consumption below four ounces per week, while the models for older children do not. On the other hand, the predicted outcomes for the 12 ounce per week limit is similar for all three models, where there is a strong probability of a benefit for a few (one to five percent) individuals, and there is also a slight possibility of net harm.

207
Table D-8: NET Z-SCORE CHANGES WITH A FOUR OUNCE LIMIT (VS. BASELINE) Population Percentile Verbal
At About 18 Months Full IQ
at 6-9 yrs Verbal
at 6-9 yrs Average -0.001 (-0.015, 0.002) -0.028 (-0.042, -0.015) -0.034 (-0.048, -0.024) 0.1st Percentile -0.016 (-0.129, 0.000) -0.194 (-0.276, -0.106) -0.277 (-0.471, -0.158) 0.5th Percentile -0.014 (-0.125, 0.000) -0.187 (-0.271, -0.103) -0.267 (-0.406, -0.156) 1st Percentile -0.013 (-0.112, 0.000) -0.186 (-0.266, -0.101) -0.262 (-0.375, -0.153) 5th Percentile -0.010 (-0.098, 0.000) -0.183 (-0.256, -0.095) -0.223 (-0.294, -0.142) 10th Percentile -0.007 (-0.067, 0.000) -0.167 (-0.247, -0.068) -0.164 (-0.250, -0.106) 25th Percentile 0.000 (-0.008, 0.000) -0.003 (-0.018, 0.000) -0.018 (-0.050, -0.005) Median 0.000 (0.000, 0.000) 0.000 (0.000, 0.000) 0.000 (0.000, 0.000) 75th Percentile 0.000 (0.000, 0.001) 0.000 (0.000, 0.000) 0.000 (0.000, 0.000) 90th Percentile 0.000 (0.000, 0.007) 0.000 (0.000, 0.000) 0.000 (0.000, 0.000) 95th Percentile 0.000 (0.000, 0.014) 0.000 (0.000, 0.000) 0.000 (0.000, 0.000) 99th Percentile 0.015 (0.000, 0.042) 0.000 (0.000, 0.002) 0.000 (0.000, 0.000) 99.5th Percentile 0.024 (0.000, 0.068) 0.000 (0.000, 0.002) 0.000 (0.000, 0.000) 99.9th Percentile 0.052 (0.000, 0.132) 0.000 (0.000, 0.011) 0.000 (0.000, 0.066) Table D-9: NET Z-SCORE CHANGES WITH A 12 OUNCE LIMIT (VS. BASELINE) Population Percentile Verbal
At About 18 Months Full IQ
at 6-9 yrs Verbal
at 6-9 yrs Average 0.000 (-0.001, 0.000) 0.000 (-0.001, 0.000) -0.001 (-0.006, 0.001) 0.1st Percentile -0.054 (-0.114, -0.026) -0.047 (-0.111, -0.017) -0.137 (-0.337, -0.049) 0.5th Percentile -0.028 (-0.055, -0.014) -0.025 (-0.053, -0.009) -0.072 (-0.201, -0.029) 1st Percentile -0.020 (-0.037, -0.010) -0.018 (-0.040, -0.007) -0.055 (-0.153, -0.022) 5th Percentile -0.007 (-0.013, -0.002) -0.007 (-0.014, -0.003) -0.020 (-0.041, -0.008) 10th Percentile -0.004 (-0.006, 0.000) -0.004 (-0.007, -0.001) -0.010 (-0.019, -0.004) 25th Percentile -0.001 (-0.002, 0.000) -0.001 (-0.002, 0.000) -0.003 (-0.005, -0.001) Median 0.000 (0.000, 0.000) 0.000 (0.000, 0.000) 0.000 (0.000, 0.000) 75th Percentile 0.001 (0.000, 0.002) 0.001 (0.000, 0.002) 0.002 (0.001, 0.004) 90th Percentile 0.003 (0.000, 0.006) 0.003 (0.001, 0.006) 0.008 (0.003, 0.014) 95th Percentile 0.006 (0.001, 0.011) 0.006 (0.002, 0.012) 0.014 (0.005, 0.027) 99th Percentile 0.017 (0.006, 0.033) 0.016 (0.006, 0.034) 0.034 (0.011, 0.077) 99.5th Percentile 0.024 (0.010, 0.046) 0.022 (0.008, 0.048) 0.047 (0.015, 0.110) 99.9th Percentile 0.048 (0.018, 0.100) 0.044 (0.015, 0.100) 0.094 (0.027, 0.220) (b)(2) Fixed Consumption Amount Scenarios In these scenarios, the impact of consuming a specific amount of fish per week was examined. For these scenarios, the methylmercury concentration was presumed to correspond to the market average of 0.072 ppm. Four levels of fish intake, four, eight, 12, and 18 ounces per week (equivalent to 16, 32, 48, and 72 grams per day) were considered. The predicted impact of these scenarios relative to current levels of consumption is presented in Tables D-10 through D-13. For the four ounce per week exposure, the young-age verbal model again differs from the other two in that it predicts results that are almost entirely positive. With the models from tests on older children, there is a large negative component that presumably results from the reduction of fish
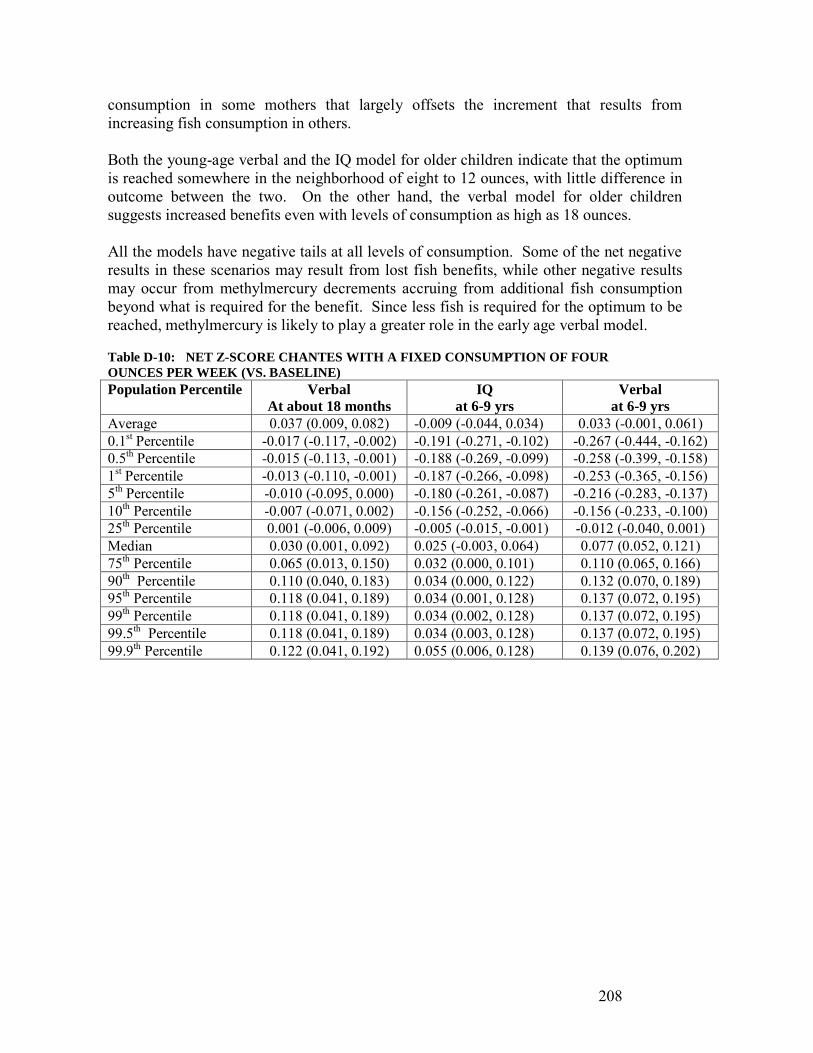
208
consumption in some mothers that largely offsets the increment that results from increasing fish consumption in others. Both the young-age verbal and the IQ model for older children indicate that the optimum is reached somewhere in the neighborhood of eight to 12 ounces, with little difference in outcome between the two. On the other hand, the verbal model for older children suggests increased benefits even with levels of consumption as high as 18 ounces. All the models have negative tails at all levels of consumption. Some of the net negative results in these scenarios may result from lost fish benefits, while other negative results may occur from methylmercury decrements accruing from additional fish consumption beyond what is required for the benefit. Since less fish is required for the optimum to be reached, methylmercury is likely to play a greater role in the early age verbal model. Table D-10: NET Z-SCORE CHANTES WITH A FIXED CONSUMPTION OF FOUR OUNCES PER WEEK (VS. BASELINE) Population Percentile Verbal
At about 18 months IQ
at 6-9 yrs Verbal
at 6-9 yrs Average 0.037 (0.009, 0.082) -0.009 (-0.044, 0.034) 0.033 (-0.001, 0.061) 0.1st Percentile -0.017 (-0.117, -0.002) -0.191 (-0.271, -0.102) -0.267 (-0.444, -0.162) 0.5th Percentile -0.015 (-0.113, -0.001) -0.188 (-0.269, -0.099) -0.258 (-0.399, -0.158) 1st Percentile -0.013 (-0.110, -0.001) -0.187 (-0.266, -0.098) -0.253 (-0.365, -0.156) 5th Percentile -0.010 (-0.095, 0.000) -0.180 (-0.261, -0.087) -0.216 (-0.283, -0.137) 10th Percentile -0.007 (-0.071, 0.002) -0.156 (-0.252, -0.066) -0.156 (-0.233, -0.100) 25th Percentile 0.001 (-0.006, 0.009) -0.005 (-0.015, -0.001) -0.012 (-0.040, 0.001) Median 0.030 (0.001, 0.092) 0.025 (-0.003, 0.064) 0.077 (0.052, 0.121) 75th Percentile 0.065 (0.013, 0.150) 0.032 (0.000, 0.101) 0.110 (0.065, 0.166) 90th Percentile 0.110 (0.040, 0.183) 0.034 (0.000, 0.122) 0.132 (0.070, 0.189) 95th Percentile 0.118 (0.041, 0.189) 0.034 (0.001, 0.128) 0.137 (0.072, 0.195) 99th Percentile 0.118 (0.041, 0.189) 0.034 (0.002, 0.128) 0.137 (0.072, 0.195) 99.5th Percentile 0.118 (0.041, 0.189) 0.034 (0.003, 0.128) 0.137 (0.072, 0.195) 99.9th Percentile 0.122 (0.041, 0.192) 0.055 (0.006, 0.128) 0.139 (0.076, 0.202)
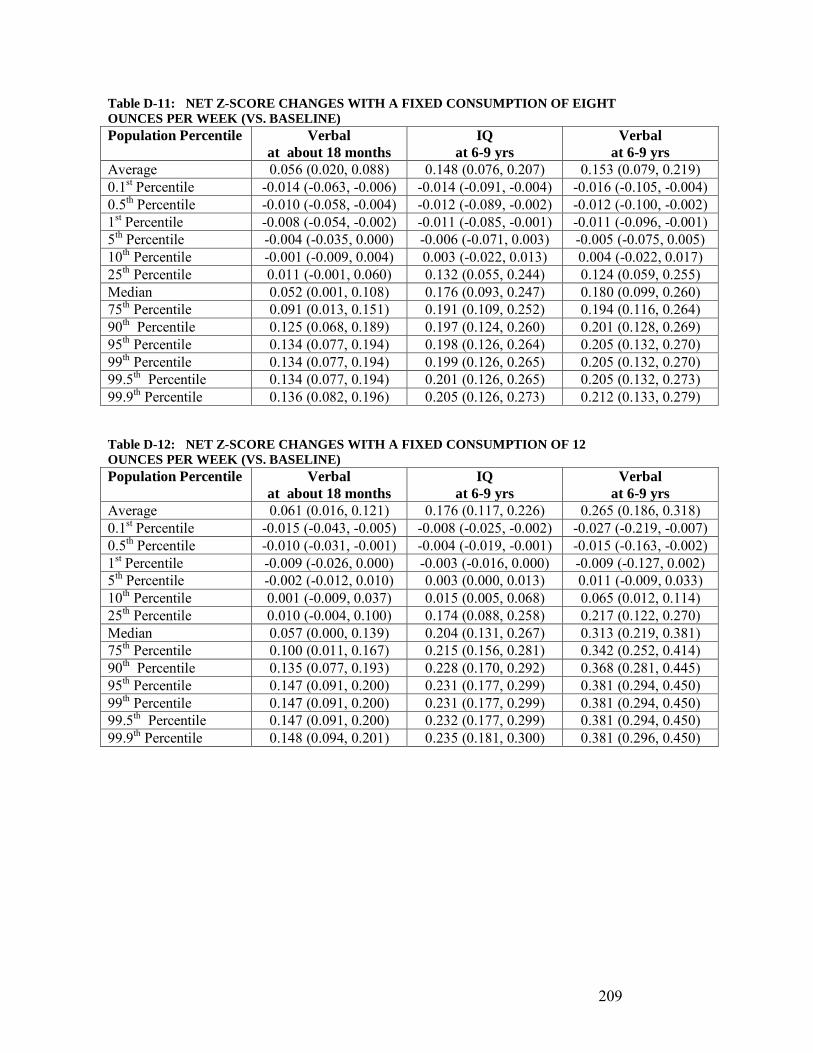
209
Table D-11: NET Z-SCORE CHANGES WITH A FIXED CONSUMPTION OF EIGHT OUNCES PER WEEK (VS. BASELINE) Population Percentile Verbal
at about 18 months IQ
at 6-9 yrs Verbal
at 6-9 yrs Average 0.056 (0.020, 0.088) 0.148 (0.076, 0.207) 0.153 (0.079, 0.219) 0.1st Percentile -0.014 (-0.063, -0.006) -0.014 (-0.091, -0.004) -0.016 (-0.105, -0.004) 0.5th Percentile -0.010 (-0.058, -0.004) -0.012 (-0.089, -0.002) -0.012 (-0.100, -0.002) 1st Percentile -0.008 (-0.054, -0.002) -0.011 (-0.085, -0.001) -0.011 (-0.096, -0.001) 5th Percentile -0.004 (-0.035, 0.000) -0.006 (-0.071, 0.003) -0.005 (-0.075, 0.005) 10th Percentile -0.001 (-0.009, 0.004) 0.003 (-0.022, 0.013) 0.004 (-0.022, 0.017) 25th Percentile 0.011 (-0.001, 0.060) 0.132 (0.055, 0.244) 0.124 (0.059, 0.255) Median 0.052 (0.001, 0.108) 0.176 (0.093, 0.247) 0.180 (0.099, 0.260) 75th Percentile 0.091 (0.013, 0.151) 0.191 (0.109, 0.252) 0.194 (0.116, 0.264) 90th Percentile 0.125 (0.068, 0.189) 0.197 (0.124, 0.260) 0.201 (0.128, 0.269) 95th Percentile 0.134 (0.077, 0.194) 0.198 (0.126, 0.264) 0.205 (0.132, 0.270) 99th Percentile 0.134 (0.077, 0.194) 0.199 (0.126, 0.265) 0.205 (0.132, 0.270) 99.5th Percentile 0.134 (0.077, 0.194) 0.201 (0.126, 0.265) 0.205 (0.132, 0.273) 99.9th Percentile 0.136 (0.082, 0.196) 0.205 (0.126, 0.273) 0.212 (0.133, 0.279) Table D-12: NET Z-SCORE CHANGES WITH A FIXED CONSUMPTION OF 12 OUNCES PER WEEK (VS. BASELINE) Population Percentile Verbal
at about 18 months IQ
at 6-9 yrs Verbal
at 6-9 yrs Average 0.061 (0.016, 0.121) 0.176 (0.117, 0.226) 0.265 (0.186, 0.318) 0.1st Percentile -0.015 (-0.043, -0.005) -0.008 (-0.025, -0.002) -0.027 (-0.219, -0.007) 0.5th Percentile -0.010 (-0.031, -0.001) -0.004 (-0.019, -0.001) -0.015 (-0.163, -0.002) 1st Percentile -0.009 (-0.026, 0.000) -0.003 (-0.016, 0.000) -0.009 (-0.127, 0.002) 5th Percentile -0.002 (-0.012, 0.010) 0.003 (0.000, 0.013) 0.011 (-0.009, 0.033) 10th Percentile 0.001 (-0.009, 0.037) 0.015 (0.005, 0.068) 0.065 (0.012, 0.114) 25th Percentile 0.010 (-0.004, 0.100) 0.174 (0.088, 0.258) 0.217 (0.122, 0.270) Median 0.057 (0.000, 0.139) 0.204 (0.131, 0.267) 0.313 (0.219, 0.381) 75th Percentile 0.100 (0.011, 0.167) 0.215 (0.156, 0.281) 0.342 (0.252, 0.414) 90th Percentile 0.135 (0.077, 0.193) 0.228 (0.170, 0.292) 0.368 (0.281, 0.445) 95th Percentile 0.147 (0.091, 0.200) 0.231 (0.177, 0.299) 0.381 (0.294, 0.450) 99th Percentile 0.147 (0.091, 0.200) 0.231 (0.177, 0.299) 0.381 (0.294, 0.450) 99.5th Percentile 0.147 (0.091, 0.200) 0.232 (0.177, 0.299) 0.381 (0.294, 0.450) 99.9th Percentile 0.148 (0.094, 0.201) 0.235 (0.181, 0.300) 0.381 (0.296, 0.450)
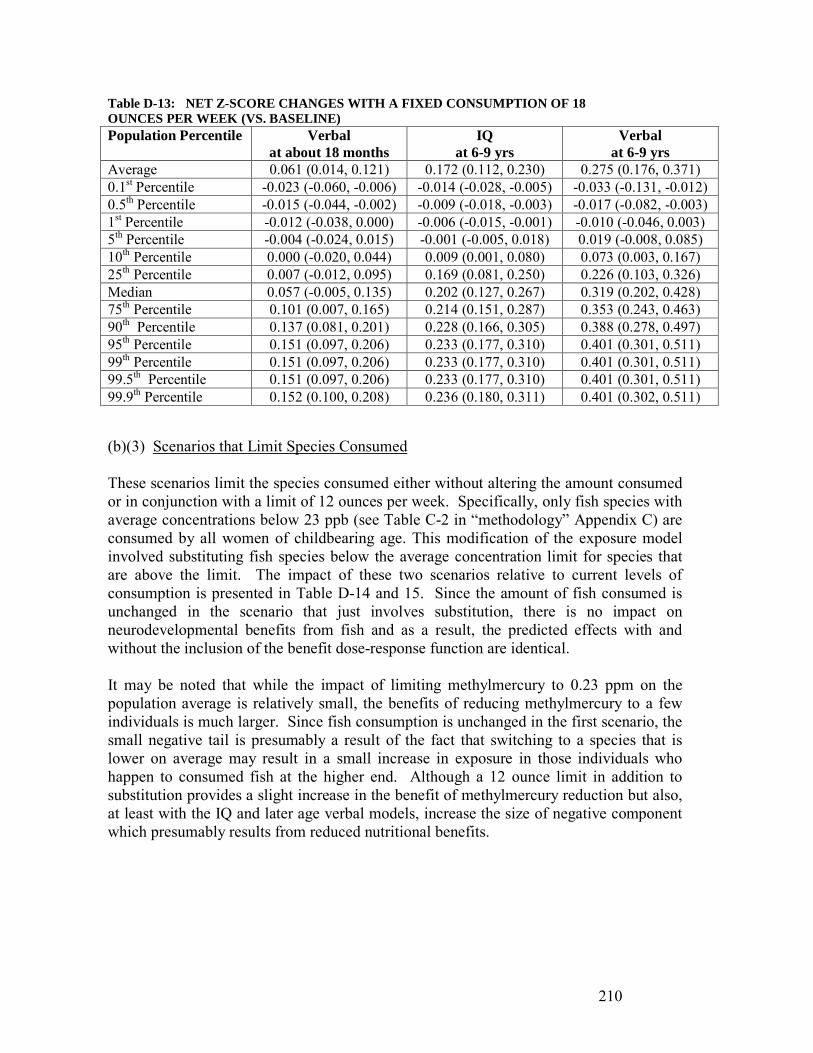
210
Table D-13: NET Z-SCORE CHANGES WITH A FIXED CONSUMPTION OF 18 OUNCES PER WEEK (VS. BASELINE) Population Percentile Verbal
at about 18 months IQ
at 6-9 yrs Verbal
at 6-9 yrs Average 0.061 (0.014, 0.121) 0.172 (0.112, 0.230) 0.275 (0.176, 0.371) 0.1st Percentile -0.023 (-0.060, -0.006) -0.014 (-0.028, -0.005) -0.033 (-0.131, -0.012) 0.5th Percentile -0.015 (-0.044, -0.002) -0.009 (-0.018, -0.003) -0.017 (-0.082, -0.003) 1st Percentile -0.012 (-0.038, 0.000) -0.006 (-0.015, -0.001) -0.010 (-0.046, 0.003) 5th Percentile -0.004 (-0.024, 0.015) -0.001 (-0.005, 0.018) 0.019 (-0.008, 0.085) 10th Percentile 0.000 (-0.020, 0.044) 0.009 (0.001, 0.080) 0.073 (0.003, 0.167) 25th Percentile 0.007 (-0.012, 0.095) 0.169 (0.081, 0.250) 0.226 (0.103, 0.326) Median 0.057 (-0.005, 0.135) 0.202 (0.127, 0.267) 0.319 (0.202, 0.428) 75th Percentile 0.101 (0.007, 0.165) 0.214 (0.151, 0.287) 0.353 (0.243, 0.463) 90th Percentile 0.137 (0.081, 0.201) 0.228 (0.166, 0.305) 0.388 (0.278, 0.497) 95th Percentile 0.151 (0.097, 0.206) 0.233 (0.177, 0.310) 0.401 (0.301, 0.511) 99th Percentile 0.151 (0.097, 0.206) 0.233 (0.177, 0.310) 0.401 (0.301, 0.511) 99.5th Percentile 0.151 (0.097, 0.206) 0.233 (0.177, 0.310) 0.401 (0.301, 0.511) 99.9th Percentile 0.152 (0.100, 0.208) 0.236 (0.180, 0.311) 0.401 (0.302, 0.511)
(b)(3) Scenarios that Limit Species Consumed These scenarios limit the species consumed either without altering the amount consumed or in conjunction with a limit of 12 ounces per week. Specifically, only fish species with average concentrations below 23 ppb (see Table C-2 in “methodology” Appendix C) are consumed by all women of childbearing age. This modification of the exposure model involved substituting fish species below the average concentration limit for species that are above the limit. The impact of these two scenarios relative to current levels of consumption is presented in Table D-14 and 15. Since the amount of fish consumed is unchanged in the scenario that just involves substitution, there is no impact on neurodevelopmental benefits from fish and as a result, the predicted effects with and without the inclusion of the benefit dose-response function are identical. It may be noted that while the impact of limiting methylmercury to 0.23 ppm on the population average is relatively small, the benefits of reducing methylmercury to a few individuals is much larger. Since fish consumption is unchanged in the first scenario, the small negative tail is presumably a result of the fact that switching to a species that is lower on average may result in a small increase in exposure in those individuals who happen to consumed fish at the higher end. Although a 12 ounce limit in addition to substitution provides a slight increase in the benefit of methylmercury reduction but also, at least with the IQ and later age verbal models, increase the size of negative component which presumably results from reduced nutritional benefits.
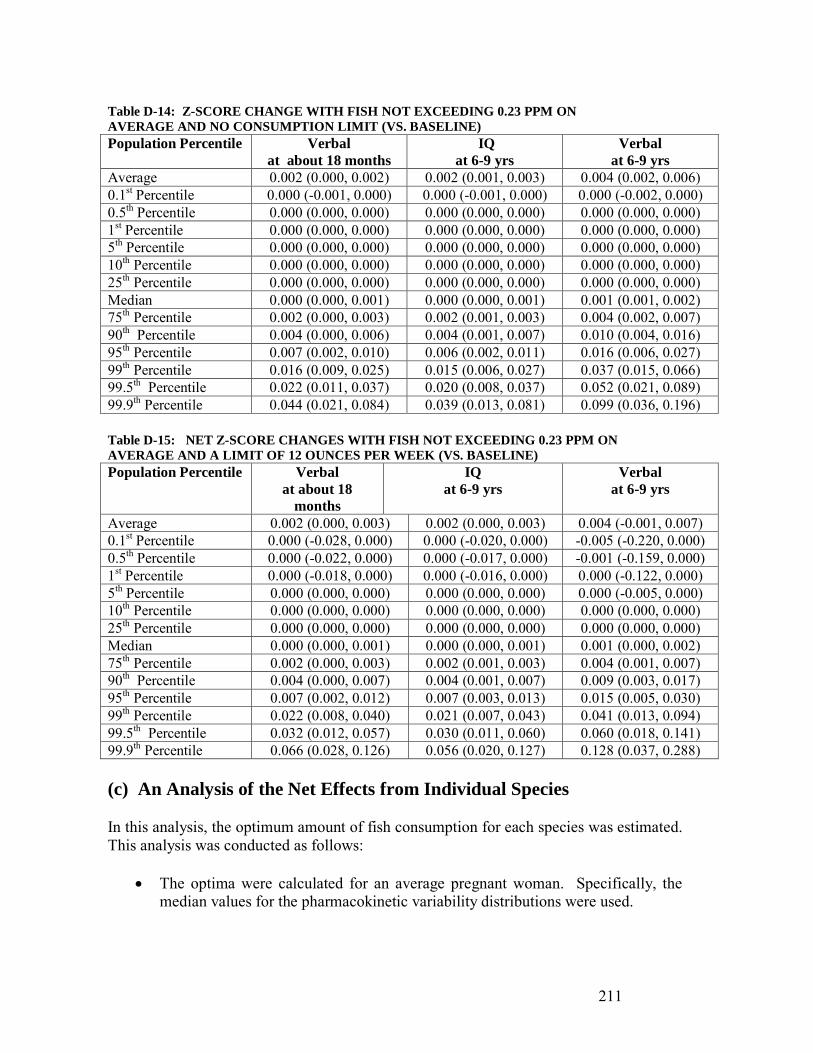
211
Table D-14: Z-SCORE CHANGE WITH FISH NOT EXCEEDING 0.23 PPM ON AVERAGE AND NO CONSUMPTION LIMIT (VS. BASELINE) Population Percentile Verbal
at about 18 months IQ
at 6-9 yrs Verbal
at 6-9 yrs Average 0.002 (0.000, 0.002) 0.002 (0.001, 0.003) 0.004 (0.002, 0.006) 0.1st Percentile 0.000 (-0.001, 0.000) 0.000 (-0.001, 0.000) 0.000 (-0.002, 0.000) 0.5th Percentile 0.000 (0.000, 0.000) 0.000 (0.000, 0.000) 0.000 (0.000, 0.000) 1st Percentile 0.000 (0.000, 0.000) 0.000 (0.000, 0.000) 0.000 (0.000, 0.000) 5th Percentile 0.000 (0.000, 0.000) 0.000 (0.000, 0.000) 0.000 (0.000, 0.000) 10th Percentile 0.000 (0.000, 0.000) 0.000 (0.000, 0.000) 0.000 (0.000, 0.000) 25th Percentile 0.000 (0.000, 0.000) 0.000 (0.000, 0.000) 0.000 (0.000, 0.000) Median 0.000 (0.000, 0.001) 0.000 (0.000, 0.001) 0.001 (0.001, 0.002) 75th Percentile 0.002 (0.000, 0.003) 0.002 (0.001, 0.003) 0.004 (0.002, 0.007) 90th Percentile 0.004 (0.000, 0.006) 0.004 (0.001, 0.007) 0.010 (0.004, 0.016) 95th Percentile 0.007 (0.002, 0.010) 0.006 (0.002, 0.011) 0.016 (0.006, 0.027) 99th Percentile 0.016 (0.009, 0.025) 0.015 (0.006, 0.027) 0.037 (0.015, 0.066) 99.5th Percentile 0.022 (0.011, 0.037) 0.020 (0.008, 0.037) 0.052 (0.021, 0.089) 99.9th Percentile 0.044 (0.021, 0.084) 0.039 (0.013, 0.081) 0.099 (0.036, 0.196) Table D-15: NET Z-SCORE CHANGES WITH FISH NOT EXCEEDING 0.23 PPM ON AVERAGE AND A LIMIT OF 12 OUNCES PER WEEK (VS. BASELINE) Population Percentile Verbal
at about 18 months
IQ at 6-9 yrs
Verbal at 6-9 yrs
Average 0.002 (0.000, 0.003) 0.002 (0.000, 0.003) 0.004 (-0.001, 0.007) 0.1st Percentile 0.000 (-0.028, 0.000) 0.000 (-0.020, 0.000) -0.005 (-0.220, 0.000) 0.5th Percentile 0.000 (-0.022, 0.000) 0.000 (-0.017, 0.000) -0.001 (-0.159, 0.000) 1st Percentile 0.000 (-0.018, 0.000) 0.000 (-0.016, 0.000) 0.000 (-0.122, 0.000) 5th Percentile 0.000 (0.000, 0.000) 0.000 (0.000, 0.000) 0.000 (-0.005, 0.000) 10th Percentile 0.000 (0.000, 0.000) 0.000 (0.000, 0.000) 0.000 (0.000, 0.000) 25th Percentile 0.000 (0.000, 0.000) 0.000 (0.000, 0.000) 0.000 (0.000, 0.000) Median 0.000 (0.000, 0.001) 0.000 (0.000, 0.001) 0.001 (0.000, 0.002) 75th Percentile 0.002 (0.000, 0.003) 0.002 (0.001, 0.003) 0.004 (0.001, 0.007) 90th Percentile 0.004 (0.000, 0.007) 0.004 (0.001, 0.007) 0.009 (0.003, 0.017) 95th Percentile 0.007 (0.002, 0.012) 0.007 (0.003, 0.013) 0.015 (0.005, 0.030) 99th Percentile 0.022 (0.008, 0.040) 0.021 (0.007, 0.043) 0.041 (0.013, 0.094) 99.5th Percentile 0.032 (0.012, 0.057) 0.030 (0.011, 0.060) 0.060 (0.018, 0.141) 99.9th Percentile 0.066 (0.028, 0.126) 0.056 (0.020, 0.127) 0.128 (0.037, 0.288) (c) An Analysis of the Net Effects from Individual Species In this analysis, the optimum amount of fish consumption for each species was estimated. This analysis was conducted as follows:
• The optima were calculated for an average pregnant woman. Specifically, the median values for the pharmacokinetic variability distributions were used.
212
• It was assumed that each individual would consume only one type of fish over a long period of time, therefore exposure would correspond to the average methylmercury and PUFA concentrations (given in Tables C-3 and C-6, respectively).
• Optimum values were calculated with six different models:
1) Verbal performance at one- two years using g/fish per day as the dose metric for benefit; 2) Full IQ years at six – nine years using grams of fish per day as the dose metric for benefit; 3) Verbal performance at six – nine years using grams of fish per day as the dose metric for benefit; 4) Verbal performance at one – two years using grams of PUFA per day as the dose metric for benefit; 5) Full IQ years at six – nine years using grams of PUFA per day as the dose metric for benefit 6) Verbal performance at six – nine years using g/PUFA per day as the dose metric for benefit.
For the latter three models, optimum levels are still reported as grams of fish per day, but the benefit is calculated by assuming that it is proportional to the PUFA content of each species.
• Three values were estimated for each species: 1) The maximum benefit obtainable for each fish on an IQ scale (i.e. Z-Score*15); 2) The average daily fish intake required to obtain that maximum; and 3) The amount of fish required for the net effect to be negative.
• Uncertainty distributions were retained in the analysis, and a bootstrap analysis
was used to generate uncertainty distributions. Results for all models and species are presented in Tables D-26 through D-31. In addition, the full net benefit curve over the range of 200 g/day (about two servings per day) for a subset of the many permutations of models, species, and benefit-dose metrics are shown in Figure D-3 through D-9. The following generalizations can be made:
• The optimum amount of fish consumed is dependent on a number of factors. When g/fish per day is used as the dose metric for benefits (i.e. all fish confer the same nutritional benefits), the amount of fish required to produce the maximum benefit varies from about 20-100 g/day (see table D-16 to 18).
213
• When g/fish/day is used as the dose metric for benefits, the optimum for different species is relatively independent of the methylmercury concentration (see tables D-16 to 18). However, reductions on the order of 1 IQ point are estimated for some species with particularly high methylmercury levels (e.g., shark vs. salmon, Figures D-4 vs. D-7)).
• When benefit is presumed to be proportional to PUFA concentration, the variation in optima between species becomes much more pronounced (see tables D-19 to D-21). Some species have lower optima because less is required to attain the benefit (e.g., salmon vs. tilapia, Figure D-4 vs. D-9) while others have lower optima and lower maximum achievable benefits as a result of greater methylmercury decrements (e.g. canned light tuna vs. canned albacore tuna, see Figures D-5 and D-6).
• The maximum benefit is most influenced by the benefit dose-response model, with the verbal IQ model having the largest and the early age verbal the smallest (see Figure D-3). Considering all three models, the estimated benefits range from less than 1 IQ point to as much a 9 IQ points. However, the relative maximum benefit is still inversely related to mercury concentration and, for the latter three models, PUFA concentration as well.
• The level where the nutritional increment and methylmercury decrement are offsetting is a function of the maximum benefit and the methylmercury concentration. It makes little difference whether benefits are gauged by fish or PUFA concentration, except in the rare instance where the PUFA concentrations are so low that the mercury decrement is not offset with even very small levels of consumption (e.g., orange roughy, see Figure D-8).
Fish high in PUFA levels and low in methylmercury (e.g. salmon, anchovies, sardines; see Figure 4) produce optimal estimates regardless of which model or dose metric is used.
• The optimum amount of fish consumed is dependent on a number of factors. Since the early age verbal model requires the smallest fish intake to achieve the maximum benefit, the optimum for different species is relatively independent of the methylmercury concentration, especially when all fish are considered to confer equal benefits. Because they require higher fish intakes, the optima calculated with the models for older children are slightly more sensitive to methylmercury. The consequences of mercury are more apparent when comparing the maximum achievable benefits (e.g., shark vs. salmon).
• When benefit is presumed to be proportional to PUFA concentration, the variation in optima between species becomes even more pronounced. Some species have lower optima because less consumption is required to attain the benefit (e.g., salmon vs. clams) while others have lower optima and lower maximum
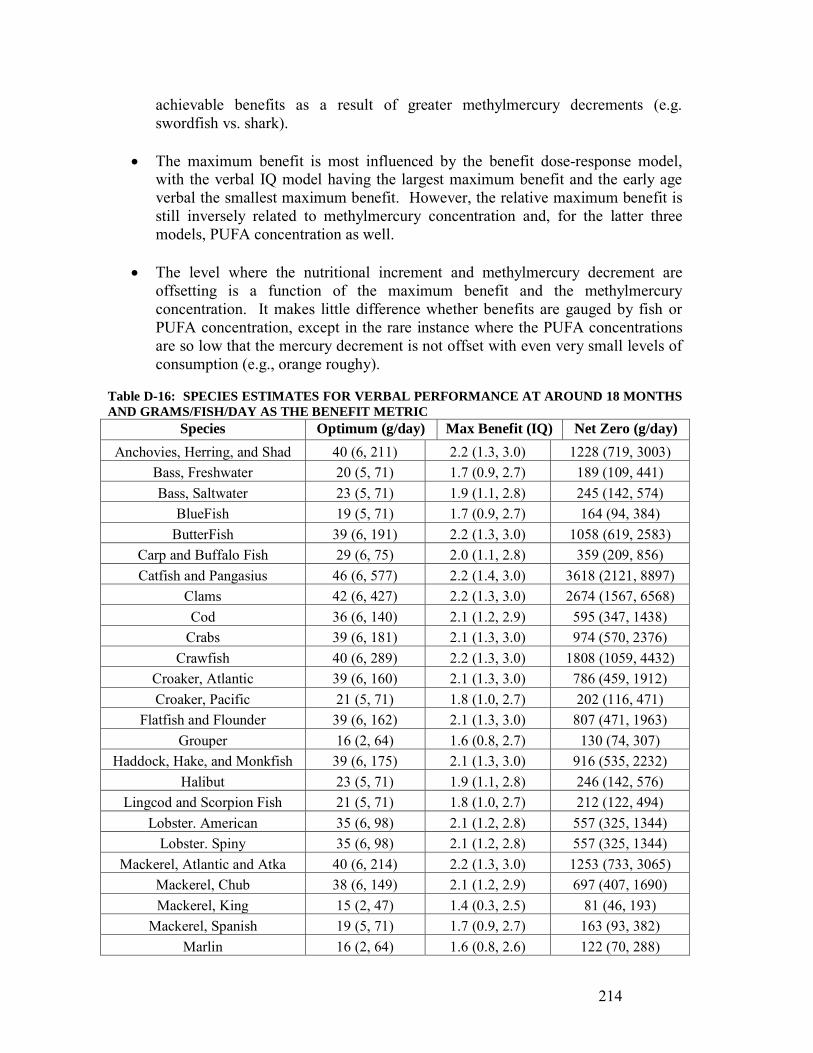
214
achievable benefits as a result of greater methylmercury decrements (e.g. swordfish vs. shark).
• The maximum benefit is most influenced by the benefit dose-response model, with the verbal IQ model having the largest maximum benefit and the early age verbal the smallest maximum benefit. However, the relative maximum benefit is still inversely related to methylmercury concentration and, for the latter three models, PUFA concentration as well.
• The level where the nutritional increment and methylmercury decrement are offsetting is a function of the maximum benefit and the methylmercury concentration. It makes little difference whether benefits are gauged by fish or PUFA concentration, except in the rare instance where the PUFA concentrations are so low that the mercury decrement is not offset with even very small levels of consumption (e.g., orange roughy).
Table D-16: SPECIES ESTIMATES FOR VERBAL PERFORMANCE AT AROUND 18 MONTHS AND GRAMS/FISH/DAY AS THE BENEFIT METRIC
Species Optimum (g/day) Max Benefit (IQ) Net Zero (g/day) Anchovies, Herring, and Shad 40 (6, 211) 2.2 (1.3, 3.0) 1228 (719, 3003)
Bass, Freshwater 20 (5, 71) 1.7 (0.9, 2.7) 189 (109, 441) Bass, Saltwater 23 (5, 71) 1.9 (1.1, 2.8) 245 (142, 574)
BlueFish 19 (5, 71) 1.7 (0.9, 2.7) 164 (94, 384) ButterFish 39 (6, 191) 2.2 (1.3, 3.0) 1058 (619, 2583)
Carp and Buffalo Fish 29 (6, 75) 2.0 (1.1, 2.8) 359 (209, 856) Catfish and Pangasius 46 (6, 577) 2.2 (1.4, 3.0) 3618 (2121, 8897)
Clams 42 (6, 427) 2.2 (1.3, 3.0) 2674 (1567, 6568) Cod 36 (6, 140) 2.1 (1.2, 2.9) 595 (347, 1438)
Crabs 39 (6, 181) 2.1 (1.3, 3.0) 974 (570, 2376) Crawfish 40 (6, 289) 2.2 (1.3, 3.0) 1808 (1059, 4432)
Croaker, Atlantic 39 (6, 160) 2.1 (1.3, 3.0) 786 (459, 1912) Croaker, Pacific 21 (5, 71) 1.8 (1.0, 2.7) 202 (116, 471)
Flatfish and Flounder 39 (6, 162) 2.1 (1.3, 3.0) 807 (471, 1963) Grouper 16 (2, 64) 1.6 (0.8, 2.7) 130 (74, 307)
Haddock, Hake, and Monkfish 39 (6, 175) 2.1 (1.3, 3.0) 916 (535, 2232) Halibut 23 (5, 71) 1.9 (1.1, 2.8) 246 (142, 576)
Lingcod and Scorpion Fish 21 (5, 71) 1.8 (1.0, 2.7) 212 (122, 494) Lobster. American 35 (6, 98) 2.1 (1.2, 2.8) 557 (325, 1344)
Lobster. Spiny 35 (6, 98) 2.1 (1.2, 2.8) 557 (325, 1344) Mackerel, Atlantic and Atka 40 (6, 214) 2.2 (1.3, 3.0) 1253 (733, 3065)
Mackerel, Chub 38 (6, 149) 2.1 (1.2, 2.9) 697 (407, 1690) Mackerel, King 15 (2, 47) 1.4 (0.3, 2.5) 81 (46, 193)
Mackerel, Spanish 19 (5, 71) 1.7 (0.9, 2.7) 163 (93, 382) Marlin 16 (2, 64) 1.6 (0.8, 2.6) 122 (70, 288)
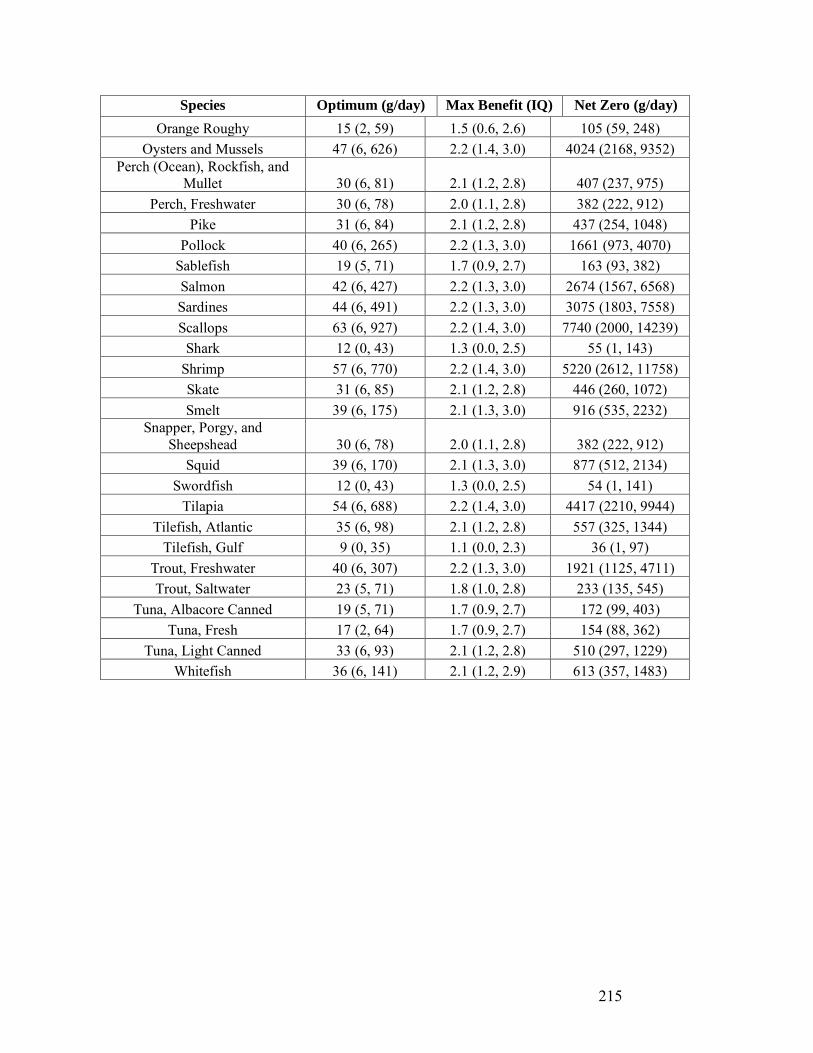
215
Species Optimum (g/day) Max Benefit (IQ) Net Zero (g/day) Orange Roughy 15 (2, 59) 1.5 (0.6, 2.6) 105 (59, 248)
Oysters and Mussels 47 (6, 626) 2.2 (1.4, 3.0) 4024 (2168, 9352) Perch (Ocean), Rockfish, and
Mullet 30 (6, 81) 2.1 (1.2, 2.8) 407 (237, 975) Perch, Freshwater 30 (6, 78) 2.0 (1.1, 2.8) 382 (222, 912)
Pike 31 (6, 84) 2.1 (1.2, 2.8) 437 (254, 1048) Pollock 40 (6, 265) 2.2 (1.3, 3.0) 1661 (973, 4070)
Sablefish 19 (5, 71) 1.7 (0.9, 2.7) 163 (93, 382) Salmon 42 (6, 427) 2.2 (1.3, 3.0) 2674 (1567, 6568) Sardines 44 (6, 491) 2.2 (1.3, 3.0) 3075 (1803, 7558) Scallops 63 (6, 927) 2.2 (1.4, 3.0) 7740 (2000, 14239)
Shark 12 (0, 43) 1.3 (0.0, 2.5) 55 (1, 143) Shrimp 57 (6, 770) 2.2 (1.4, 3.0) 5220 (2612, 11758) Skate 31 (6, 85) 2.1 (1.2, 2.8) 446 (260, 1072) Smelt 39 (6, 175) 2.1 (1.3, 3.0) 916 (535, 2232)
Snapper, Porgy, and Sheepshead 30 (6, 78) 2.0 (1.1, 2.8) 382 (222, 912)
Squid 39 (6, 170) 2.1 (1.3, 3.0) 877 (512, 2134) Swordfish 12 (0, 43) 1.3 (0.0, 2.5) 54 (1, 141)
Tilapia 54 (6, 688) 2.2 (1.4, 3.0) 4417 (2210, 9944) Tilefish, Atlantic 35 (6, 98) 2.1 (1.2, 2.8) 557 (325, 1344)
Tilefish, Gulf 9 (0, 35) 1.1 (0.0, 2.3) 36 (1, 97) Trout, Freshwater 40 (6, 307) 2.2 (1.3, 3.0) 1921 (1125, 4711) Trout, Saltwater 23 (5, 71) 1.8 (1.0, 2.8) 233 (135, 545)
Tuna, Albacore Canned 19 (5, 71) 1.7 (0.9, 2.7) 172 (99, 403) Tuna, Fresh 17 (2, 64) 1.7 (0.9, 2.7) 154 (88, 362)
Tuna, Light Canned 33 (6, 93) 2.1 (1.2, 2.8) 510 (297, 1229) Whitefish 36 (6, 141) 2.1 (1.2, 2.9) 613 (357, 1483)
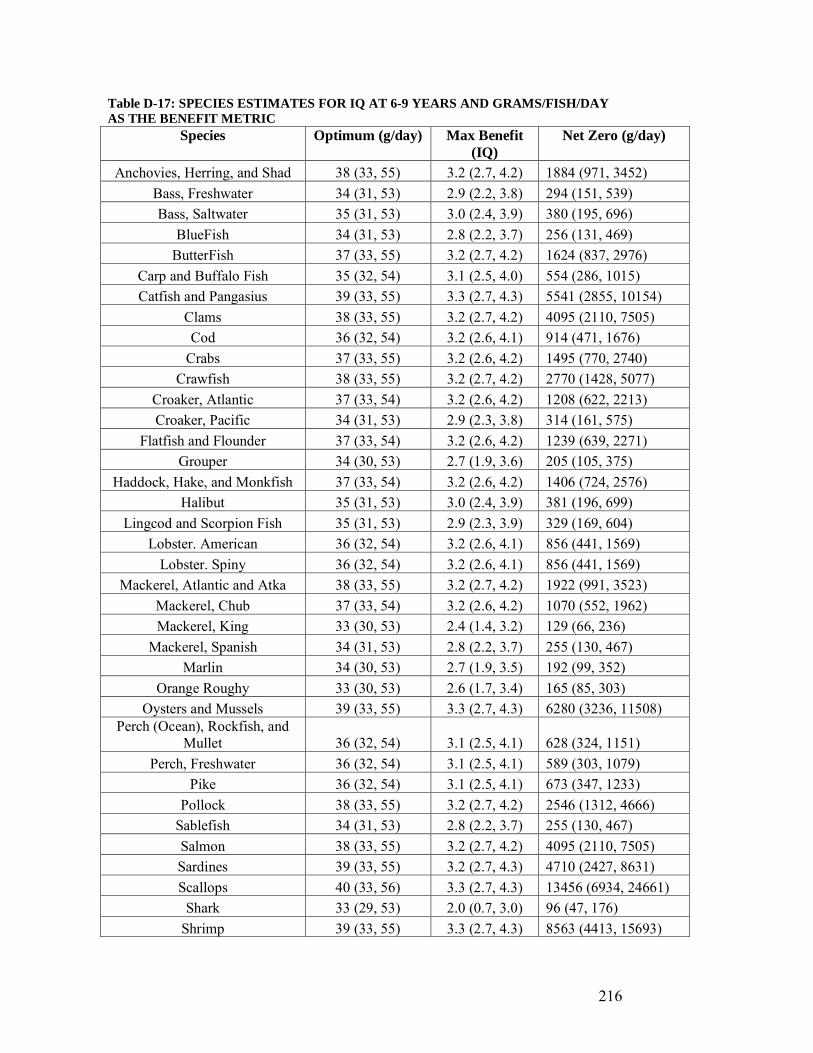
216
Table D-17: SPECIES ESTIMATES FOR IQ AT 6-9 YEARS AND GRAMS/FISH/DAY AS THE BENEFIT METRIC
Species Optimum (g/day) Max Benefit (IQ)
Net Zero (g/day)
Anchovies, Herring, and Shad 38 (33, 55) 3.2 (2.7, 4.2) 1884 (971, 3452) Bass, Freshwater 34 (31, 53) 2.9 (2.2, 3.8) 294 (151, 539) Bass, Saltwater 35 (31, 53) 3.0 (2.4, 3.9) 380 (195, 696)
BlueFish 34 (31, 53) 2.8 (2.2, 3.7) 256 (131, 469) ButterFish 37 (33, 55) 3.2 (2.7, 4.2) 1624 (837, 2976)
Carp and Buffalo Fish 35 (32, 54) 3.1 (2.5, 4.0) 554 (286, 1015) Catfish and Pangasius 39 (33, 55) 3.3 (2.7, 4.3) 5541 (2855, 10154)
Clams 38 (33, 55) 3.2 (2.7, 4.2) 4095 (2110, 7505) Cod 36 (32, 54) 3.2 (2.6, 4.1) 914 (471, 1676)
Crabs 37 (33, 55) 3.2 (2.6, 4.2) 1495 (770, 2740) Crawfish 38 (33, 55) 3.2 (2.7, 4.2) 2770 (1428, 5077)
Croaker, Atlantic 37 (33, 54) 3.2 (2.6, 4.2) 1208 (622, 2213) Croaker, Pacific 34 (31, 53) 2.9 (2.3, 3.8) 314 (161, 575)
Flatfish and Flounder 37 (33, 54) 3.2 (2.6, 4.2) 1239 (639, 2271) Grouper 34 (30, 53) 2.7 (1.9, 3.6) 205 (105, 375)
Haddock, Hake, and Monkfish 37 (33, 54) 3.2 (2.6, 4.2) 1406 (724, 2576) Halibut 35 (31, 53) 3.0 (2.4, 3.9) 381 (196, 699)
Lingcod and Scorpion Fish 35 (31, 53) 2.9 (2.3, 3.9) 329 (169, 604) Lobster. American 36 (32, 54) 3.2 (2.6, 4.1) 856 (441, 1569)
Lobster. Spiny 36 (32, 54) 3.2 (2.6, 4.1) 856 (441, 1569) Mackerel, Atlantic and Atka 38 (33, 55) 3.2 (2.7, 4.2) 1922 (991, 3523)
Mackerel, Chub 37 (33, 54) 3.2 (2.6, 4.2) 1070 (552, 1962) Mackerel, King 33 (30, 53) 2.4 (1.4, 3.2) 129 (66, 236)
Mackerel, Spanish 34 (31, 53) 2.8 (2.2, 3.7) 255 (130, 467) Marlin 34 (30, 53) 2.7 (1.9, 3.5) 192 (99, 352)
Orange Roughy 33 (30, 53) 2.6 (1.7, 3.4) 165 (85, 303) Oysters and Mussels 39 (33, 55) 3.3 (2.7, 4.3) 6280 (3236, 11508)
Perch (Ocean), Rockfish, and Mullet 36 (32, 54) 3.1 (2.5, 4.1) 628 (324, 1151)
Perch, Freshwater 36 (32, 54) 3.1 (2.5, 4.1) 589 (303, 1079) Pike 36 (32, 54) 3.1 (2.5, 4.1) 673 (347, 1233)
Pollock 38 (33, 55) 3.2 (2.7, 4.2) 2546 (1312, 4666) Sablefish 34 (31, 53) 2.8 (2.2, 3.7) 255 (130, 467) Salmon 38 (33, 55) 3.2 (2.7, 4.2) 4095 (2110, 7505) Sardines 39 (33, 55) 3.2 (2.7, 4.3) 4710 (2427, 8631) Scallops 40 (33, 56) 3.3 (2.7, 4.3) 13456 (6934, 24661)
Shark 33 (29, 53) 2.0 (0.7, 3.0) 96 (47, 176) Shrimp 39 (33, 55) 3.3 (2.7, 4.3) 8563 (4413, 15693)

217
Species Optimum (g/day) Max Benefit (IQ)
Net Zero (g/day)
Skate 36 (32, 54) 3.1 (2.5, 4.1) 688 (354, 1260) Smelt 37 (33, 54) 3.2 (2.6, 4.2) 1406 (724, 2576)
Snapper, Porgy, and Sheepshead 36 (32, 54) 3.1 (2.5, 4.1) 589 (303, 1079)
Squid 37 (33, 54) 3.2 (2.6, 4.2) 1346 (693, 2466) Swordfish 33 (29, 53) 2.0 (0.7, 3.0) 94 (46, 173)
Tilapia 39 (33, 55) 3.3 (2.7, 4.3) 7246 (3734, 13279) Tilefish, Atlantic 36 (32, 54) 3.2 (2.6, 4.1) 856 (441, 1569)
Tilefish, Gulf 32 (0, 51) 1.4 (0.0, 2.6) 65 (1, 119) Trout, Freshwater 38 (33, 55) 3.2 (2.7, 4.2) 2944 (1517, 5395) Trout, Saltwater 35 (31, 53) 3.0 (2.3, 3.9) 362 (186, 664)
Tuna, Albacore Canned 34 (31, 53) 2.8 (2.2, 3.8) 269 (138, 493) Tuna, Fresh 34 (31, 53) 2.8 (2.1, 3.7) 242 (124, 443)
Tuna, Light Canned 36 (32, 54) 3.1 (2.6, 4.1) 785 (405, 1439) Whitefish 36 (32, 54) 3.2 (2.6, 4.1) 942 (485, 1726)
Table D-18: SPECIES ESTIMATES FOR VERBAL PERFORMANCE AT 6-9 YEARS AND GRAMS/FISH/DAY AS THE BENEFIT METRIC
Species Optimum (g/day) Max Benefit (IQ)
Net Zero (g/day)
Anchovies, Herring, and Shad 67 (35, 329) 6.1 (4.6, 9.8) 1425 (791, 3977) Bass, Freshwater 50 (35, 123) 4.7 (3.2, 6.9) 221 (122, 598) Bass, Saltwater 51 (35, 142) 5.0 (3.6, 7.5) 286 (159, 780)
BlueFish 49 (35, 113) 4.5 (2.9, 6.6) 191 (104, 516) ButterFish 65 (35, 306) 6.0 (4.6, 9.7) 1228 (682, 3425)
Carp and Buffalo Fish 53 (35, 175) 5.4 (4.0, 8.2) 418 (233, 1151) Catfish and Pangasius 86 (35, 558) 6.3 (4.8, 10.6) 3977 (2073, 9199)
Clams 80 (35, 482) 6.3 (4.7, 10.4) 3097 (1719, 8675) Cod 56 (35, 228) 5.8 (4.4, 9.0) 691 (384, 1917)
Crabs 63 (35, 293) 6.0 (4.6, 9.6) 1130 (628, 3151) Crawfish 73 (35, 398) 6.2 (4.7, 10.2) 2095 (1163, 5860)
Croaker, Atlantic 60 (35, 263) 5.9 (4.5, 9.4) 913 (507, 2540) Croaker, Pacific 50 (35, 128) 4.8 (3.3, 7.1) 236 (130, 640)
Flatfish and Flounder 61 (35, 267) 5.9 (4.5, 9.4) 937 (520, 2608) Grouper 46 (34, 99) 4.0 (2.5, 6.0) 152 (81, 407)
Haddock, Hake, and Monkfish 62 (35, 284) 6.0 (4.5, 9.5) 1063 (590, 2962) Halibut 51 (35, 143) 5.0 (3.6, 7.5) 287 (159, 783)
Lingcod and Scorpion Fish 51 (35, 131) 4.8 (3.4, 7.2) 247 (137, 673) Lobster. American 56 (35, 221) 5.7 (4.3, 8.9) 647 (359, 1794)
Lobster. Spiny 56 (35, 221) 5.7 (4.3, 8.9) 647 (359, 1794)
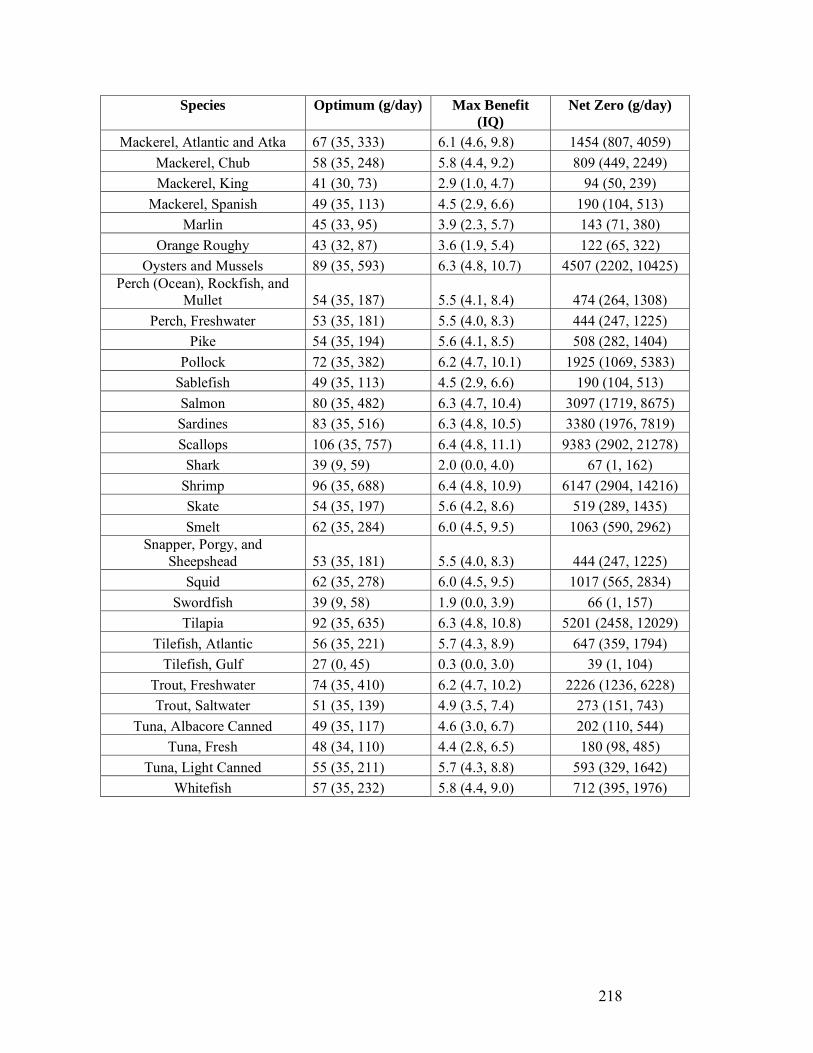
218
Species Optimum (g/day) Max Benefit (IQ)
Net Zero (g/day)
Mackerel, Atlantic and Atka 67 (35, 333) 6.1 (4.6, 9.8) 1454 (807, 4059) Mackerel, Chub 58 (35, 248) 5.8 (4.4, 9.2) 809 (449, 2249) Mackerel, King 41 (30, 73) 2.9 (1.0, 4.7) 94 (50, 239)
Mackerel, Spanish 49 (35, 113) 4.5 (2.9, 6.6) 190 (104, 513) Marlin 45 (33, 95) 3.9 (2.3, 5.7) 143 (71, 380)
Orange Roughy 43 (32, 87) 3.6 (1.9, 5.4) 122 (65, 322) Oysters and Mussels 89 (35, 593) 6.3 (4.8, 10.7) 4507 (2202, 10425)
Perch (Ocean), Rockfish, and Mullet 54 (35, 187) 5.5 (4.1, 8.4) 474 (264, 1308)
Perch, Freshwater 53 (35, 181) 5.5 (4.0, 8.3) 444 (247, 1225) Pike 54 (35, 194) 5.6 (4.1, 8.5) 508 (282, 1404)
Pollock 72 (35, 382) 6.2 (4.7, 10.1) 1925 (1069, 5383) Sablefish 49 (35, 113) 4.5 (2.9, 6.6) 190 (104, 513) Salmon 80 (35, 482) 6.3 (4.7, 10.4) 3097 (1719, 8675) Sardines 83 (35, 516) 6.3 (4.8, 10.5) 3380 (1976, 7819) Scallops 106 (35, 757) 6.4 (4.8, 11.1) 9383 (2902, 21278)
Shark 39 (9, 59) 2.0 (0.0, 4.0) 67 (1, 162) Shrimp 96 (35, 688) 6.4 (4.8, 10.9) 6147 (2904, 14216) Skate 54 (35, 197) 5.6 (4.2, 8.6) 519 (289, 1435) Smelt 62 (35, 284) 6.0 (4.5, 9.5) 1063 (590, 2962)
Snapper, Porgy, and Sheepshead 53 (35, 181) 5.5 (4.0, 8.3) 444 (247, 1225)
Squid 62 (35, 278) 6.0 (4.5, 9.5) 1017 (565, 2834) Swordfish 39 (9, 58) 1.9 (0.0, 3.9) 66 (1, 157)
Tilapia 92 (35, 635) 6.3 (4.8, 10.8) 5201 (2458, 12029) Tilefish, Atlantic 56 (35, 221) 5.7 (4.3, 8.9) 647 (359, 1794)
Tilefish, Gulf 27 (0, 45) 0.3 (0.0, 3.0) 39 (1, 104) Trout, Freshwater 74 (35, 410) 6.2 (4.7, 10.2) 2226 (1236, 6228) Trout, Saltwater 51 (35, 139) 4.9 (3.5, 7.4) 273 (151, 743)
Tuna, Albacore Canned 49 (35, 117) 4.6 (3.0, 6.7) 202 (110, 544) Tuna, Fresh 48 (34, 110) 4.4 (2.8, 6.5) 180 (98, 485)
Tuna, Light Canned 55 (35, 211) 5.7 (4.3, 8.8) 593 (329, 1642) Whitefish 57 (35, 232) 5.8 (4.4, 9.0) 712 (395, 1976)
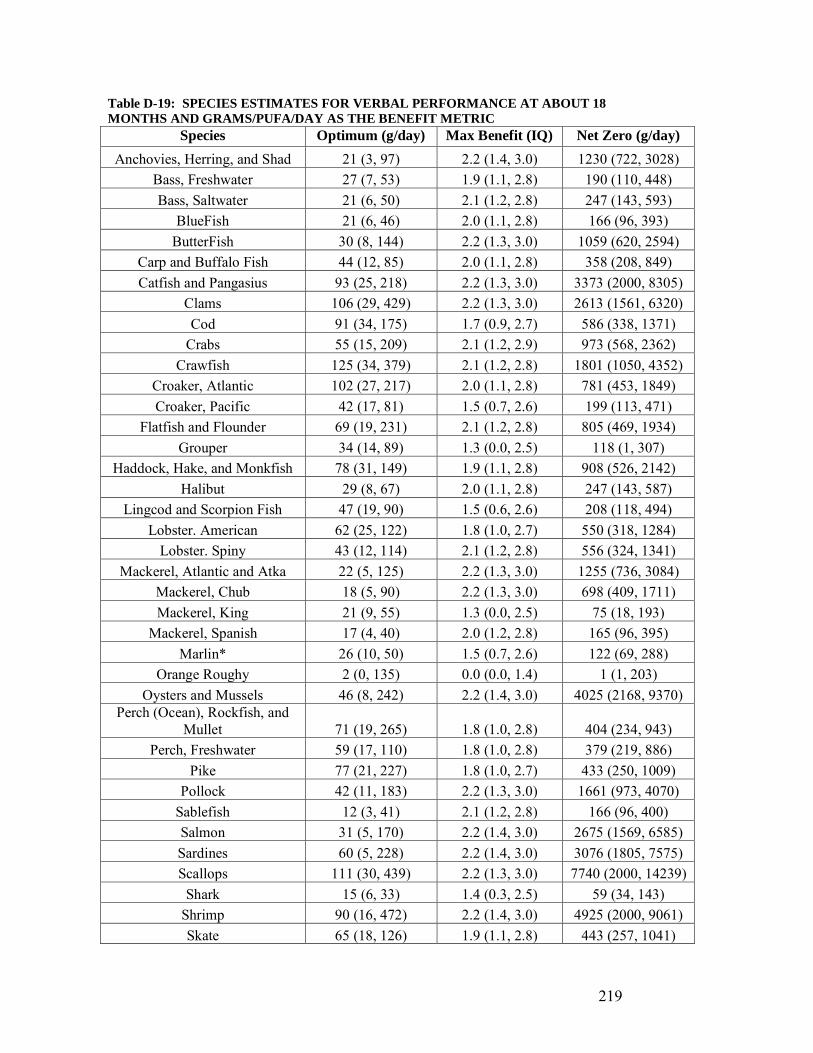
219
Table D-19: SPECIES ESTIMATES FOR VERBAL PERFORMANCE AT ABOUT 18 MONTHS AND GRAMS/PUFA/DAY AS THE BENEFIT METRIC
Species Optimum (g/day) Max Benefit (IQ) Net Zero (g/day) Anchovies, Herring, and Shad 21 (3, 97) 2.2 (1.4, 3.0) 1230 (722, 3028)
Bass, Freshwater 27 (7, 53) 1.9 (1.1, 2.8) 190 (110, 448) Bass, Saltwater 21 (6, 50) 2.1 (1.2, 2.8) 247 (143, 593)
BlueFish 21 (6, 46) 2.0 (1.1, 2.8) 166 (96, 393) ButterFish 30 (8, 144) 2.2 (1.3, 3.0) 1059 (620, 2594)
Carp and Buffalo Fish 44 (12, 85) 2.0 (1.1, 2.8) 358 (208, 849) Catfish and Pangasius 93 (25, 218) 2.2 (1.3, 3.0) 3373 (2000, 8305)
Clams 106 (29, 429) 2.2 (1.3, 3.0) 2613 (1561, 6320) Cod 91 (34, 175) 1.7 (0.9, 2.7) 586 (338, 1371)
Crabs 55 (15, 209) 2.1 (1.2, 2.9) 973 (568, 2362) Crawfish 125 (34, 379) 2.1 (1.2, 2.8) 1801 (1050, 4352)
Croaker, Atlantic 102 (27, 217) 2.0 (1.1, 2.8) 781 (453, 1849) Croaker, Pacific 42 (17, 81) 1.5 (0.7, 2.6) 199 (113, 471)
Flatfish and Flounder 69 (19, 231) 2.1 (1.2, 2.8) 805 (469, 1934) Grouper 34 (14, 89) 1.3 (0.0, 2.5) 118 (1, 307)
Haddock, Hake, and Monkfish 78 (31, 149) 1.9 (1.1, 2.8) 908 (526, 2142) Halibut 29 (8, 67) 2.0 (1.1, 2.8) 247 (143, 587)
Lingcod and Scorpion Fish 47 (19, 90) 1.5 (0.6, 2.6) 208 (118, 494) Lobster. American 62 (25, 122) 1.8 (1.0, 2.7) 550 (318, 1284)
Lobster. Spiny 43 (12, 114) 2.1 (1.2, 2.8) 556 (324, 1341) Mackerel, Atlantic and Atka 22 (5, 125) 2.2 (1.3, 3.0) 1255 (736, 3084)
Mackerel, Chub 18 (5, 90) 2.2 (1.3, 3.0) 698 (409, 1711) Mackerel, King 21 (9, 55) 1.3 (0.0, 2.5) 75 (18, 193)
Mackerel, Spanish 17 (4, 40) 2.0 (1.2, 2.8) 165 (96, 395) Marlin* 26 (10, 50) 1.5 (0.7, 2.6) 122 (69, 288)
Orange Roughy 2 (0, 135) 0.0 (0.0, 1.4) 1 (1, 203) Oysters and Mussels 46 (8, 242) 2.2 (1.4, 3.0) 4025 (2168, 9370)
Perch (Ocean), Rockfish, and Mullet 71 (19, 265) 1.8 (1.0, 2.8) 404 (234, 943)
Perch, Freshwater 59 (17, 110) 1.8 (1.0, 2.8) 379 (219, 886) Pike 77 (21, 227) 1.8 (1.0, 2.7) 433 (250, 1009)
Pollock 42 (11, 183) 2.2 (1.3, 3.0) 1661 (973, 4070) Sablefish 12 (3, 41) 2.1 (1.2, 2.8) 166 (96, 400) Salmon 31 (5, 170) 2.2 (1.4, 3.0) 2675 (1569, 6585) Sardines 60 (5, 228) 2.2 (1.4, 3.0) 3076 (1805, 7575) Scallops 111 (30, 439) 2.2 (1.3, 3.0) 7740 (2000, 14239)
Shark 15 (6, 33) 1.4 (0.3, 2.5) 59 (34, 143) Shrimp 90 (16, 472) 2.2 (1.4, 3.0) 4925 (2000, 9061) Skate 65 (18, 126) 1.9 (1.1, 2.8) 443 (257, 1041)
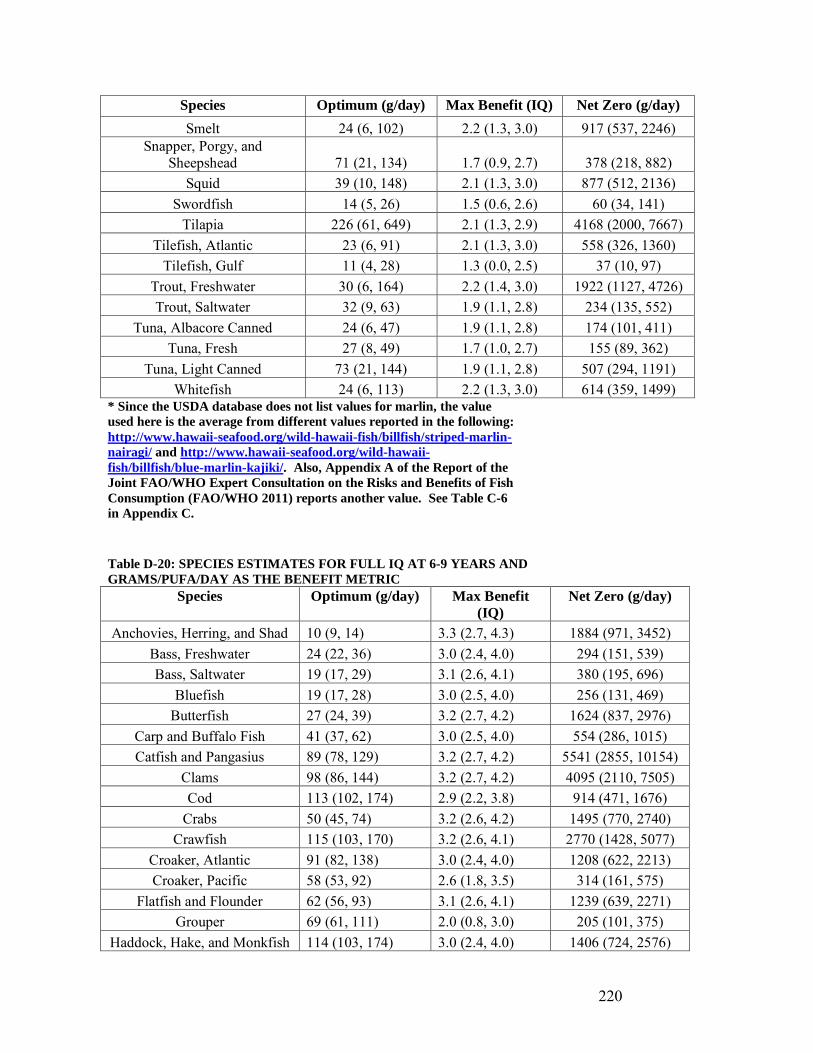
220
Species Optimum (g/day) Max Benefit (IQ) Net Zero (g/day) Smelt 24 (6, 102) 2.2 (1.3, 3.0) 917 (537, 2246)
Snapper, Porgy, and Sheepshead 71 (21, 134) 1.7 (0.9, 2.7) 378 (218, 882)
Squid 39 (10, 148) 2.1 (1.3, 3.0) 877 (512, 2136) Swordfish 14 (5, 26) 1.5 (0.6, 2.6) 60 (34, 141)
Tilapia 226 (61, 649) 2.1 (1.3, 2.9) 4168 (2000, 7667) Tilefish, Atlantic 23 (6, 91) 2.1 (1.3, 3.0) 558 (326, 1360)
Tilefish, Gulf 11 (4, 28) 1.3 (0.0, 2.5) 37 (10, 97) Trout, Freshwater 30 (6, 164) 2.2 (1.4, 3.0) 1922 (1127, 4726) Trout, Saltwater 32 (9, 63) 1.9 (1.1, 2.8) 234 (135, 552)
Tuna, Albacore Canned 24 (6, 47) 1.9 (1.1, 2.8) 174 (101, 411) Tuna, Fresh 27 (8, 49) 1.7 (1.0, 2.7) 155 (89, 362)
Tuna, Light Canned 73 (21, 144) 1.9 (1.1, 2.8) 507 (294, 1191) Whitefish 24 (6, 113) 2.2 (1.3, 3.0) 614 (359, 1499)
* Since the USDA database does not list values for marlin, the value used here is the average from different values reported in the following: http://www.hawaii-seafood.org/wild-hawaii-fish/billfish/striped-marlin-nairagi/ and http://www.hawaii-seafood.org/wild-hawaii-fish/billfish/blue-marlin-kajiki/. Also, Appendix A of the Report of the Joint FAO/WHO Expert Consultation on the Risks and Benefits of Fish Consumption (FAO/WHO 2011) reports another value. See Table C-6 in Appendix C. Table D-20: SPECIES ESTIMATES FOR FULL IQ AT 6-9 YEARS AND GRAMS/PUFA/DAY AS THE BENEFIT METRIC
Species Optimum (g/day) Max Benefit (IQ)
Net Zero (g/day)
Anchovies, Herring, and Shad 10 (9, 14) 3.3 (2.7, 4.3) 1884 (971, 3452) Bass, Freshwater 24 (22, 36) 3.0 (2.4, 4.0) 294 (151, 539) Bass, Saltwater 19 (17, 29) 3.1 (2.6, 4.1) 380 (195, 696)
Bluefish 19 (17, 28) 3.0 (2.5, 4.0) 256 (131, 469) Butterfish 27 (24, 39) 3.2 (2.7, 4.2) 1624 (837, 2976)
Carp and Buffalo Fish 41 (37, 62) 3.0 (2.5, 4.0) 554 (286, 1015) Catfish and Pangasius 89 (78, 129) 3.2 (2.7, 4.2) 5541 (2855, 10154)
Clams 98 (86, 144) 3.2 (2.7, 4.2) 4095 (2110, 7505) Cod 113 (102, 174) 2.9 (2.2, 3.8) 914 (471, 1676)
Crabs 50 (45, 74) 3.2 (2.6, 4.2) 1495 (770, 2740) Crawfish 115 (103, 170) 3.2 (2.6, 4.1) 2770 (1428, 5077)
Croaker, Atlantic 91 (82, 138) 3.0 (2.4, 4.0) 1208 (622, 2213) Croaker, Pacific 58 (53, 92) 2.6 (1.8, 3.5) 314 (161, 575)
Flatfish and Flounder 62 (56, 93) 3.1 (2.6, 4.1) 1239 (639, 2271) Grouper 69 (61, 111) 2.0 (0.8, 3.0) 205 (101, 375)
Haddock, Hake, and Monkfish 114 (103, 174) 3.0 (2.4, 4.0) 1406 (724, 2576)
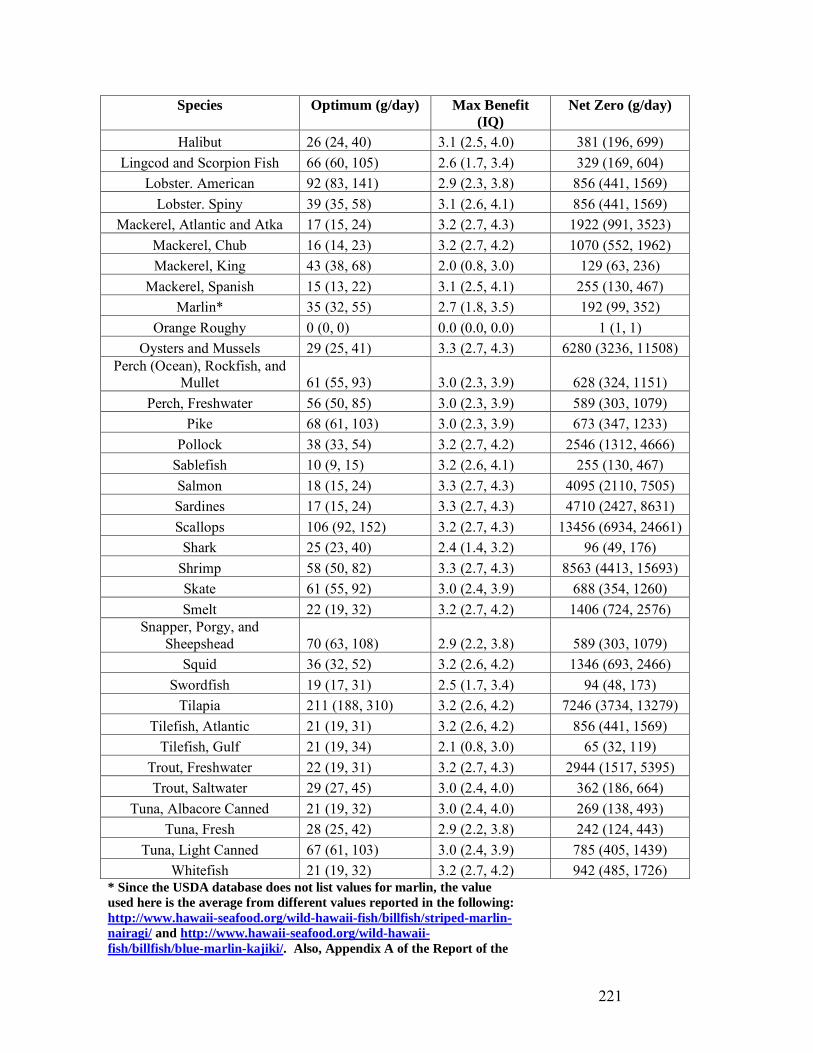
221
Species Optimum (g/day) Max Benefit (IQ)
Net Zero (g/day)
Halibut 26 (24, 40) 3.1 (2.5, 4.0) 381 (196, 699) Lingcod and Scorpion Fish 66 (60, 105) 2.6 (1.7, 3.4) 329 (169, 604)
Lobster. American 92 (83, 141) 2.9 (2.3, 3.8) 856 (441, 1569) Lobster. Spiny 39 (35, 58) 3.1 (2.6, 4.1) 856 (441, 1569)
Mackerel, Atlantic and Atka 17 (15, 24) 3.2 (2.7, 4.3) 1922 (991, 3523) Mackerel, Chub 16 (14, 23) 3.2 (2.7, 4.2) 1070 (552, 1962) Mackerel, King 43 (38, 68) 2.0 (0.8, 3.0) 129 (63, 236)
Mackerel, Spanish 15 (13, 22) 3.1 (2.5, 4.1) 255 (130, 467) Marlin* 35 (32, 55) 2.7 (1.8, 3.5) 192 (99, 352)
Orange Roughy 0 (0, 0) 0.0 (0.0, 0.0) 1 (1, 1) Oysters and Mussels 29 (25, 41) 3.3 (2.7, 4.3) 6280 (3236, 11508)
Perch (Ocean), Rockfish, and Mullet 61 (55, 93) 3.0 (2.3, 3.9) 628 (324, 1151)
Perch, Freshwater 56 (50, 85) 3.0 (2.3, 3.9) 589 (303, 1079) Pike 68 (61, 103) 3.0 (2.3, 3.9) 673 (347, 1233)
Pollock 38 (33, 54) 3.2 (2.7, 4.2) 2546 (1312, 4666) Sablefish 10 (9, 15) 3.2 (2.6, 4.1) 255 (130, 467) Salmon 18 (15, 24) 3.3 (2.7, 4.3) 4095 (2110, 7505) Sardines 17 (15, 24) 3.3 (2.7, 4.3) 4710 (2427, 8631) Scallops 106 (92, 152) 3.2 (2.7, 4.3) 13456 (6934, 24661)
Shark 25 (23, 40) 2.4 (1.4, 3.2) 96 (49, 176) Shrimp 58 (50, 82) 3.3 (2.7, 4.3) 8563 (4413, 15693) Skate 61 (55, 92) 3.0 (2.4, 3.9) 688 (354, 1260) Smelt 22 (19, 32) 3.2 (2.7, 4.2) 1406 (724, 2576)
Snapper, Porgy, and Sheepshead 70 (63, 108) 2.9 (2.2, 3.8) 589 (303, 1079)
Squid 36 (32, 52) 3.2 (2.6, 4.2) 1346 (693, 2466) Swordfish 19 (17, 31) 2.5 (1.7, 3.4) 94 (48, 173)
Tilapia 211 (188, 310) 3.2 (2.6, 4.2) 7246 (3734, 13279) Tilefish, Atlantic 21 (19, 31) 3.2 (2.6, 4.2) 856 (441, 1569)
Tilefish, Gulf 21 (19, 34) 2.1 (0.8, 3.0) 65 (32, 119) Trout, Freshwater 22 (19, 31) 3.2 (2.7, 4.3) 2944 (1517, 5395) Trout, Saltwater 29 (27, 45) 3.0 (2.4, 4.0) 362 (186, 664)
Tuna, Albacore Canned 21 (19, 32) 3.0 (2.4, 4.0) 269 (138, 493) Tuna, Fresh 28 (25, 42) 2.9 (2.2, 3.8) 242 (124, 443)
Tuna, Light Canned 67 (61, 103) 3.0 (2.4, 3.9) 785 (405, 1439) Whitefish 21 (19, 32) 3.2 (2.7, 4.2) 942 (485, 1726)
* Since the USDA database does not list values for marlin, the value used here is the average from different values reported in the following: http://www.hawaii-seafood.org/wild-hawaii-fish/billfish/striped-marlin-nairagi/ and http://www.hawaii-seafood.org/wild-hawaii-fish/billfish/blue-marlin-kajiki/. Also, Appendix A of the Report of the
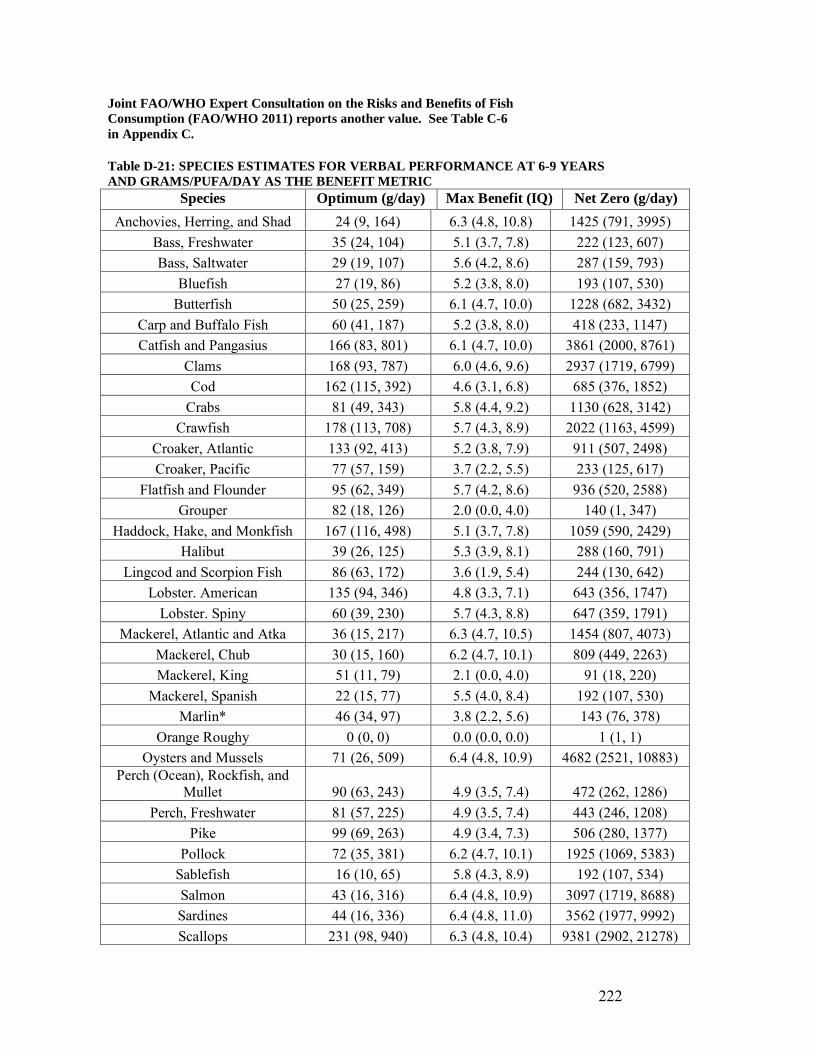
222
Joint FAO/WHO Expert Consultation on the Risks and Benefits of Fish Consumption (FAO/WHO 2011) reports another value. See Table C-6 in Appendix C. Table D-21: SPECIES ESTIMATES FOR VERBAL PERFORMANCE AT 6-9 YEARS AND GRAMS/PUFA/DAY AS THE BENEFIT METRIC
Species Optimum (g/day) Max Benefit (IQ) Net Zero (g/day) Anchovies, Herring, and Shad 24 (9, 164) 6.3 (4.8, 10.8) 1425 (791, 3995)
Bass, Freshwater 35 (24, 104) 5.1 (3.7, 7.8) 222 (123, 607) Bass, Saltwater 29 (19, 107) 5.6 (4.2, 8.6) 287 (159, 793)
Bluefish 27 (19, 86) 5.2 (3.8, 8.0) 193 (107, 530) Butterfish 50 (25, 259) 6.1 (4.7, 10.0) 1228 (682, 3432)
Carp and Buffalo Fish 60 (41, 187) 5.2 (3.8, 8.0) 418 (233, 1147) Catfish and Pangasius 166 (83, 801) 6.1 (4.7, 10.0) 3861 (2000, 8761)
Clams 168 (93, 787) 6.0 (4.6, 9.6) 2937 (1719, 6799) Cod 162 (115, 392) 4.6 (3.1, 6.8) 685 (376, 1852)
Crabs 81 (49, 343) 5.8 (4.4, 9.2) 1130 (628, 3142) Crawfish 178 (113, 708) 5.7 (4.3, 8.9) 2022 (1163, 4599)
Croaker, Atlantic 133 (92, 413) 5.2 (3.8, 7.9) 911 (507, 2498) Croaker, Pacific 77 (57, 159) 3.7 (2.2, 5.5) 233 (125, 617)
Flatfish and Flounder 95 (62, 349) 5.7 (4.2, 8.6) 936 (520, 2588) Grouper 82 (18, 126) 2.0 (0.0, 4.0) 140 (1, 347)
Haddock, Hake, and Monkfish 167 (116, 498) 5.1 (3.7, 7.8) 1059 (590, 2429) Halibut 39 (26, 125) 5.3 (3.9, 8.1) 288 (160, 791)
Lingcod and Scorpion Fish 86 (63, 172) 3.6 (1.9, 5.4) 244 (130, 642) Lobster. American 135 (94, 346) 4.8 (3.3, 7.1) 643 (356, 1747)
Lobster. Spiny 60 (39, 230) 5.7 (4.3, 8.8) 647 (359, 1791) Mackerel, Atlantic and Atka 36 (15, 217) 6.3 (4.7, 10.5) 1454 (807, 4073)
Mackerel, Chub 30 (15, 160) 6.2 (4.7, 10.1) 809 (449, 2263) Mackerel, King 51 (11, 79) 2.1 (0.0, 4.0) 91 (18, 220)
Mackerel, Spanish 22 (15, 77) 5.5 (4.0, 8.4) 192 (107, 530) Marlin* 46 (34, 97) 3.8 (2.2, 5.6) 143 (76, 378)
Orange Roughy 0 (0, 0) 0.0 (0.0, 0.0) 1 (1, 1) Oysters and Mussels 71 (26, 509) 6.4 (4.8, 10.9) 4682 (2521, 10883)
Perch (Ocean), Rockfish, and Mullet 90 (63, 243) 4.9 (3.5, 7.4) 472 (262, 1286)
Perch, Freshwater 81 (57, 225) 4.9 (3.5, 7.4) 443 (246, 1208) Pike 99 (69, 263) 4.9 (3.4, 7.3) 506 (280, 1377)
Pollock 72 (35, 381) 6.2 (4.7, 10.1) 1925 (1069, 5383) Sablefish 16 (10, 65) 5.8 (4.3, 8.9) 192 (107, 534) Salmon 43 (16, 316) 6.4 (4.8, 10.9) 3097 (1719, 8688) Sardines 44 (16, 336) 6.4 (4.8, 11.0) 3562 (1977, 9992) Scallops 231 (98, 940) 6.3 (4.8, 10.4) 9381 (2902, 21278)
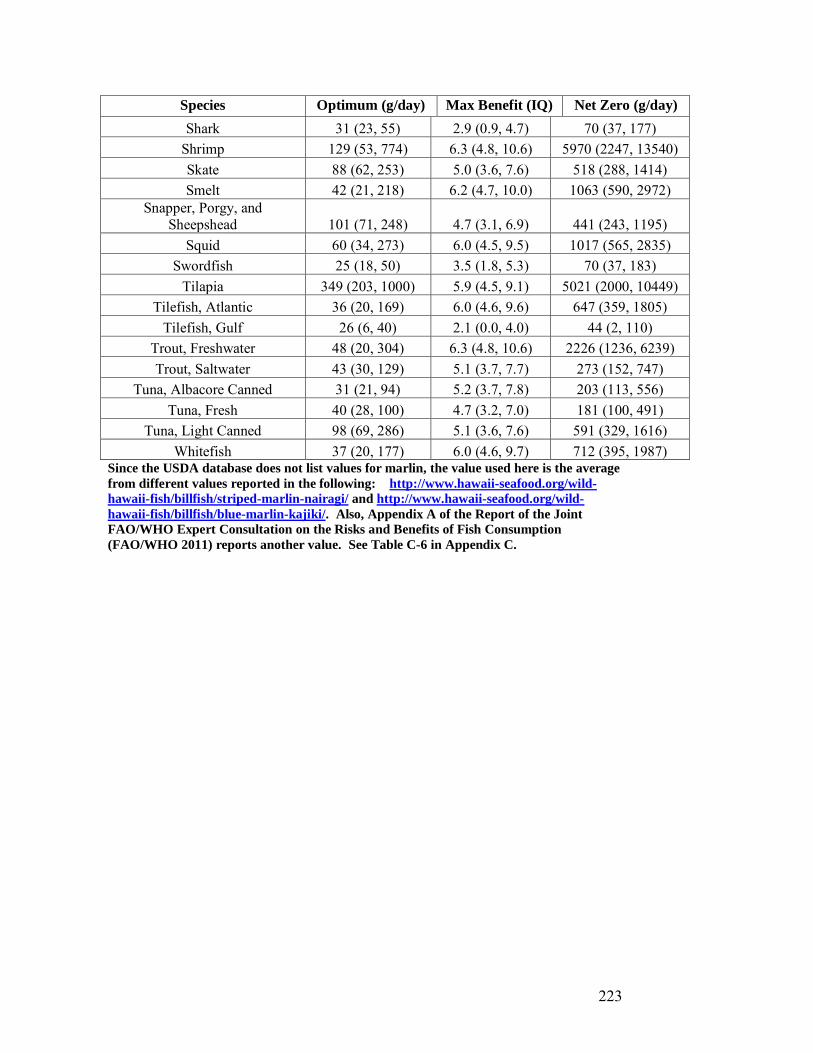
223
Species Optimum (g/day) Max Benefit (IQ) Net Zero (g/day) Shark 31 (23, 55) 2.9 (0.9, 4.7) 70 (37, 177)
Shrimp 129 (53, 774) 6.3 (4.8, 10.6) 5970 (2247, 13540) Skate 88 (62, 253) 5.0 (3.6, 7.6) 518 (288, 1414) Smelt 42 (21, 218) 6.2 (4.7, 10.0) 1063 (590, 2972)
Snapper, Porgy, and Sheepshead 101 (71, 248) 4.7 (3.1, 6.9) 441 (243, 1195)
Squid 60 (34, 273) 6.0 (4.5, 9.5) 1017 (565, 2835) Swordfish 25 (18, 50) 3.5 (1.8, 5.3) 70 (37, 183)
Tilapia 349 (203, 1000) 5.9 (4.5, 9.1) 5021 (2000, 10449) Tilefish, Atlantic 36 (20, 169) 6.0 (4.6, 9.6) 647 (359, 1805)
Tilefish, Gulf 26 (6, 40) 2.1 (0.0, 4.0) 44 (2, 110) Trout, Freshwater 48 (20, 304) 6.3 (4.8, 10.6) 2226 (1236, 6239) Trout, Saltwater 43 (30, 129) 5.1 (3.7, 7.7) 273 (152, 747)
Tuna, Albacore Canned 31 (21, 94) 5.2 (3.7, 7.8) 203 (113, 556) Tuna, Fresh 40 (28, 100) 4.7 (3.2, 7.0) 181 (100, 491)
Tuna, Light Canned 98 (69, 286) 5.1 (3.6, 7.6) 591 (329, 1616) Whitefish 37 (20, 177) 6.0 (4.6, 9.7) 712 (395, 1987)
Since the USDA database does not list values for marlin, the value used here is the average from different values reported in the following: http://www.hawaii-seafood.org/wild-hawaii-fish/billfish/striped-marlin-nairagi/ and http://www.hawaii-seafood.org/wild-hawaii-fish/billfish/blue-marlin-kajiki/. Also, Appendix A of the Report of the Joint FAO/WHO Expert Consultation on the Risks and Benefits of Fish Consumption (FAO/WHO 2011) reports another value. See Table C-6 in Appendix C.
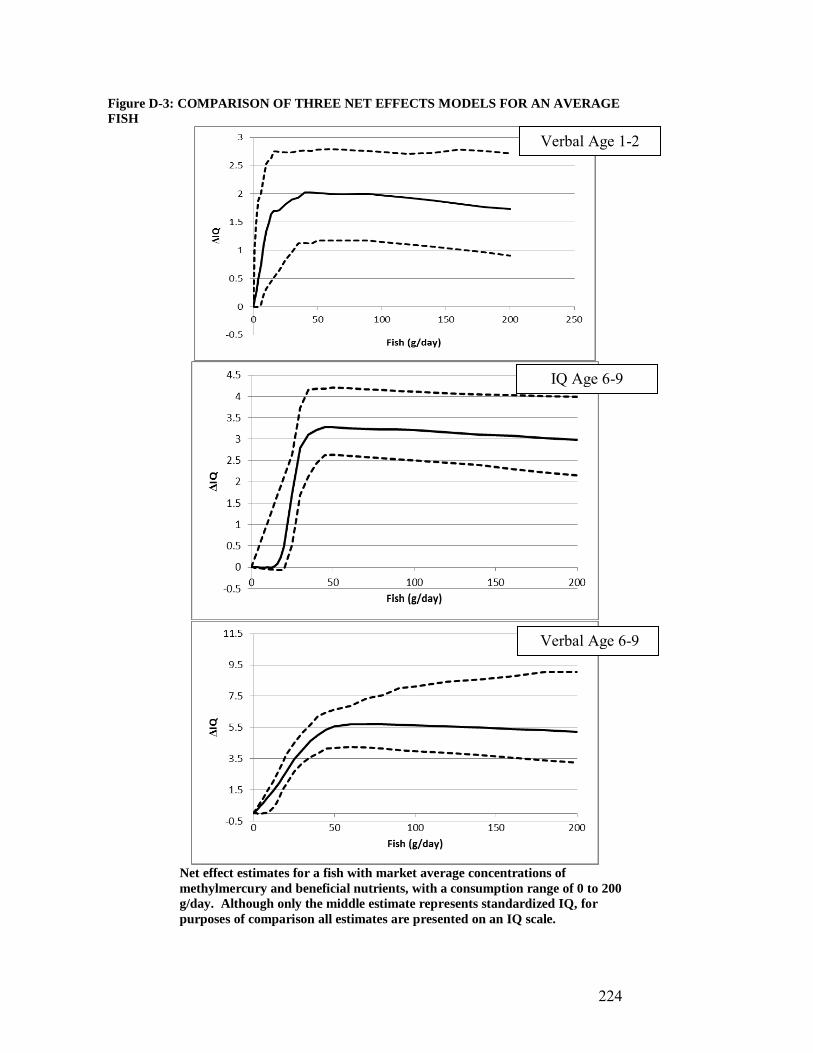
224
Figure D-3: COMPARISON OF THREE NET EFFECTS MODELS FOR AN AVERAGE FISH
Net effect estimates for a fish with market average concentrations of methylmercury and beneficial nutrients, with a consumption range of 0 to 200 g/day. Although only the middle estimate represents standardized IQ, for purposes of comparison all estimates are presented on an IQ scale.
Verbal Age 1-2
Verbal Age 6-9
IQ Age 6-9
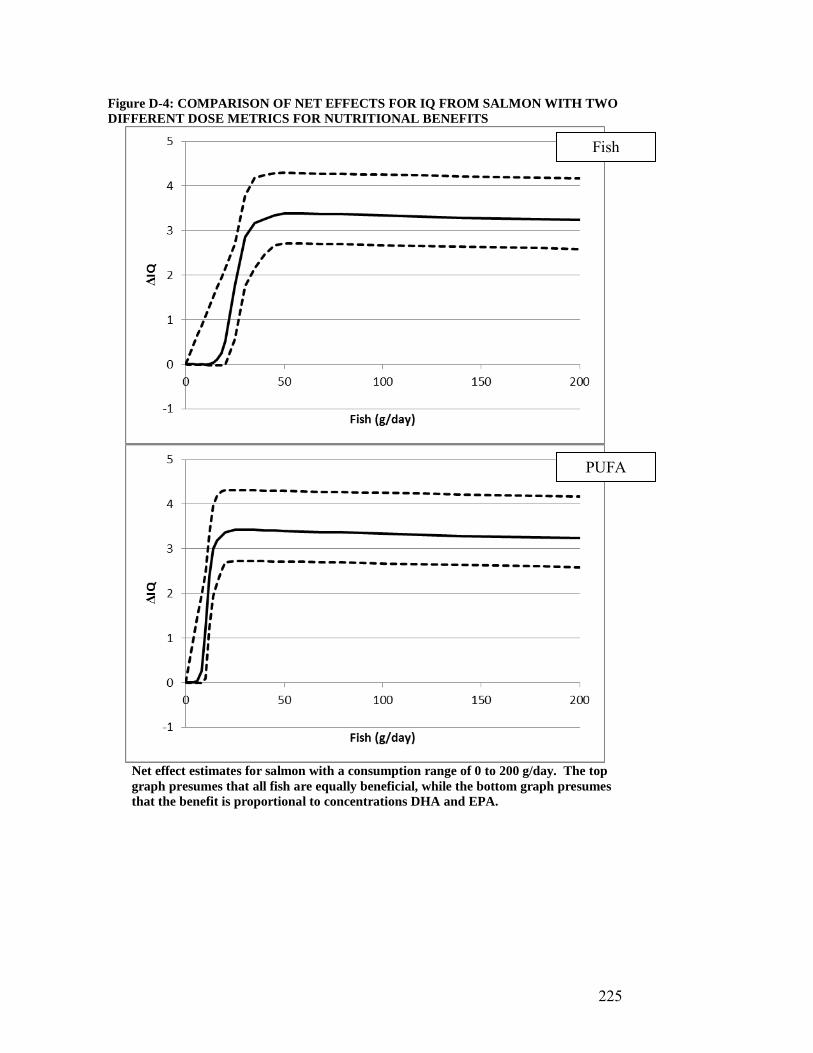
225
Figure D-4: COMPARISON OF NET EFFECTS FOR IQ FROM SALMON WITH TWO DIFFERENT DOSE METRICS FOR NUTRITIONAL BENEFITS
Net effect estimates for salmon with a consumption range of 0 to 200 g/day. The top graph presumes that all fish are equally beneficial, while the bottom graph presumes that the benefit is proportional to concentrations DHA and EPA.
Fish
PUFA
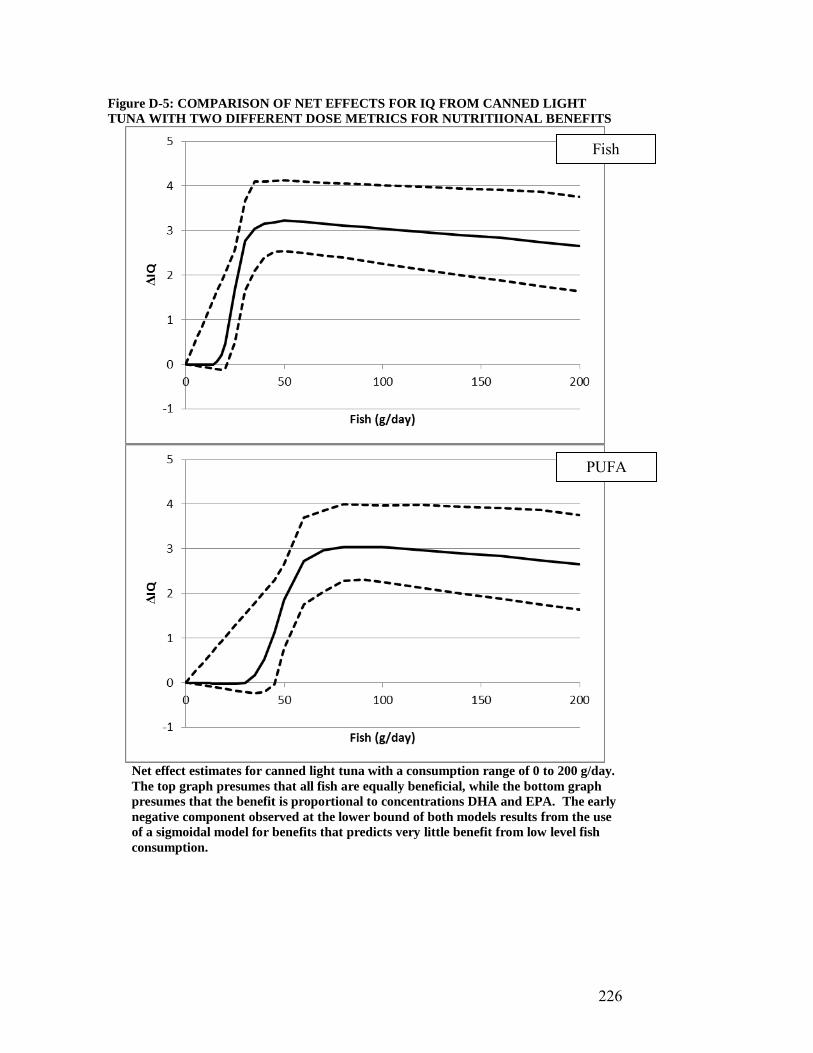
226
Figure D-5: COMPARISON OF NET EFFECTS FOR IQ FROM CANNED LIGHT TUNA WITH TWO DIFFERENT DOSE METRICS FOR NUTRITIIONAL BENEFITS
Net effect estimates for canned light tuna with a consumption range of 0 to 200 g/day. The top graph presumes that all fish are equally beneficial, while the bottom graph presumes that the benefit is proportional to concentrations DHA and EPA. The early negative component observed at the lower bound of both models results from the use of a sigmoidal model for benefits that predicts very little benefit from low level fish consumption.
Fish
PUFA
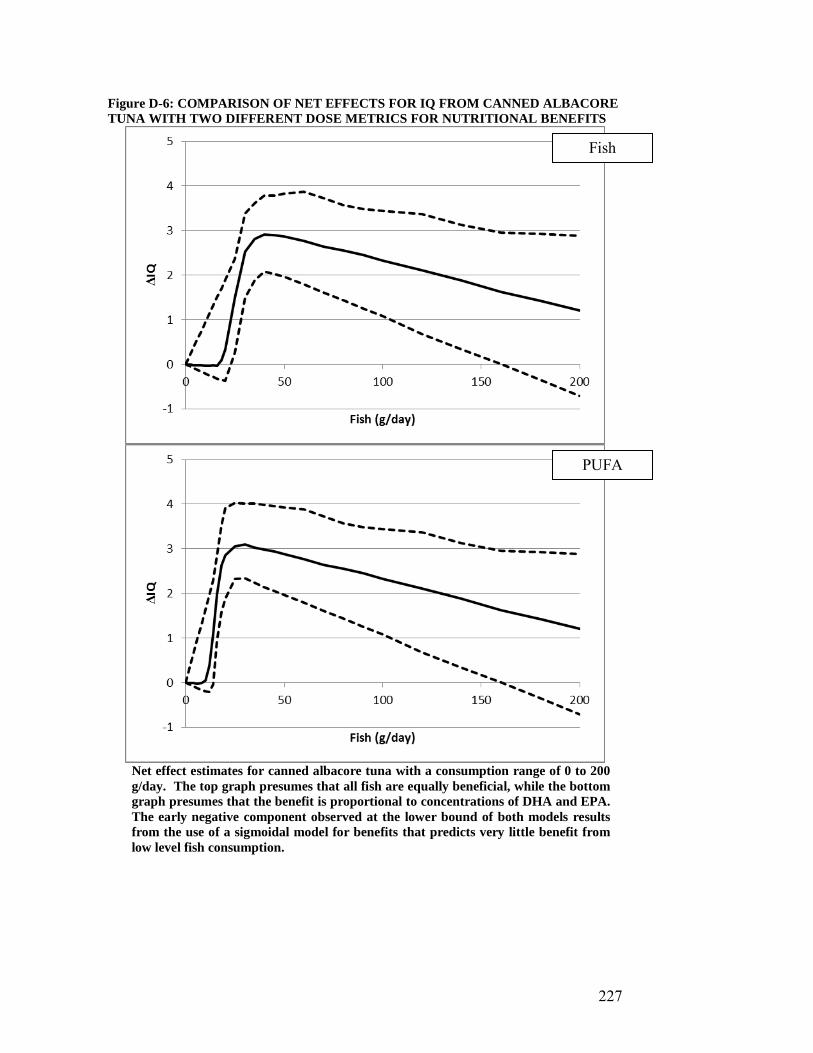
227
Figure D-6: COMPARISON OF NET EFFECTS FOR IQ FROM CANNED ALBACORE TUNA WITH TWO DIFFERENT DOSE METRICS FOR NUTRITIONAL BENEFITS
Net effect estimates for canned albacore tuna with a consumption range of 0 to 200 g/day. The top graph presumes that all fish are equally beneficial, while the bottom graph presumes that the benefit is proportional to concentrations of DHA and EPA. The early negative component observed at the lower bound of both models results from the use of a sigmoidal model for benefits that predicts very little benefit from low level fish consumption.
Fish
PUFA
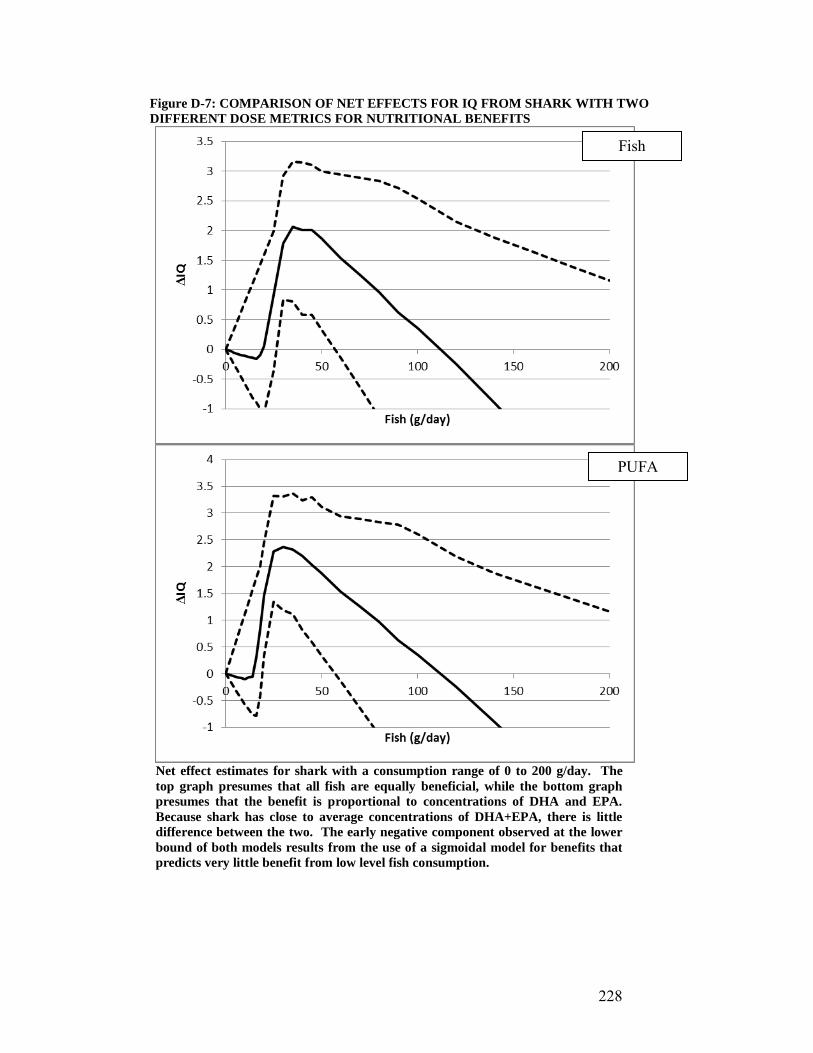
228
Figure D-7: COMPARISON OF NET EFFECTS FOR IQ FROM SHARK WITH TWO DIFFERENT DOSE METRICS FOR NUTRITIONAL BENEFITS
Net effect estimates for shark with a consumption range of 0 to 200 g/day. The top graph presumes that all fish are equally beneficial, while the bottom graph presumes that the benefit is proportional to concentrations of DHA and EPA. Because shark has close to average concentrations of DHA+EPA, there is little difference between the two. The early negative component observed at the lower bound of both models results from the use of a sigmoidal model for benefits that predicts very little benefit from low level fish consumption.
Fish
PUFA
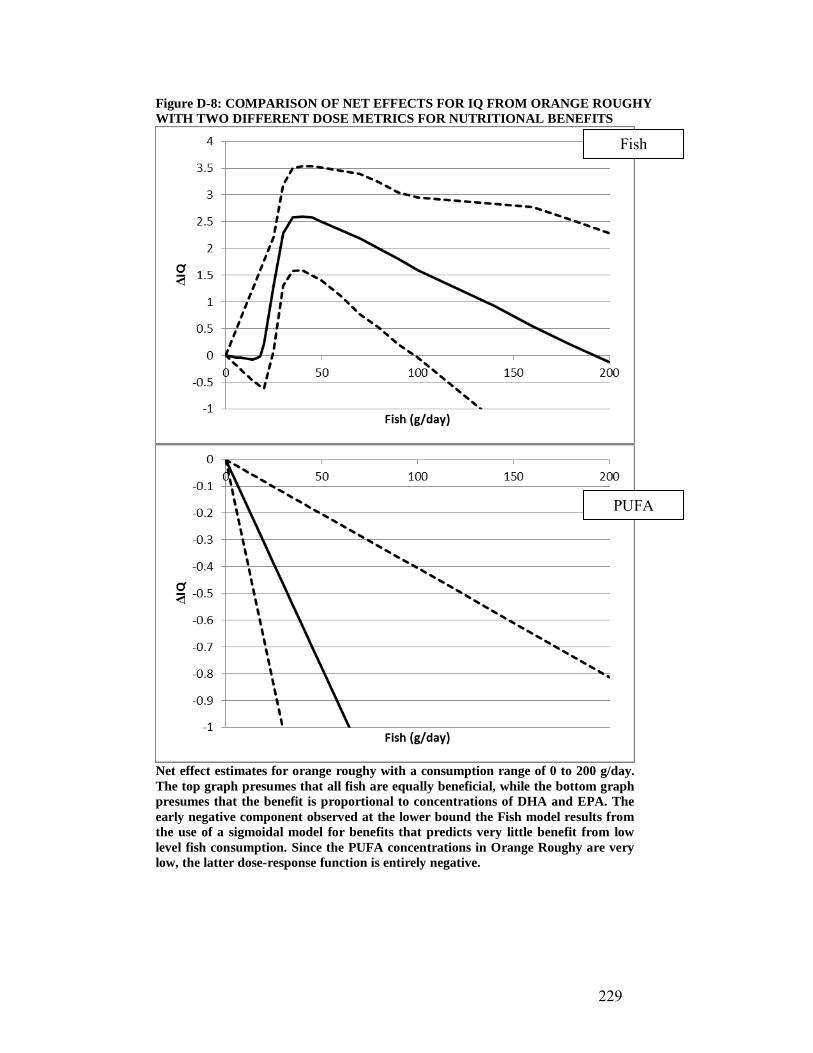
229
Figure D-8: COMPARISON OF NET EFFECTS FOR IQ FROM ORANGE ROUGHY WITH TWO DIFFERENT DOSE METRICS FOR NUTRITIONAL BENEFITS
Net effect estimates for orange roughy with a consumption range of 0 to 200 g/day. The top graph presumes that all fish are equally beneficial, while the bottom graph presumes that the benefit is proportional to concentrations of DHA and EPA. The early negative component observed at the lower bound the Fish model results from the use of a sigmoidal model for benefits that predicts very little benefit from low level fish consumption. Since the PUFA concentrations in Orange Roughy are very low, the latter dose-response function is entirely negative.
Fish
PUFA
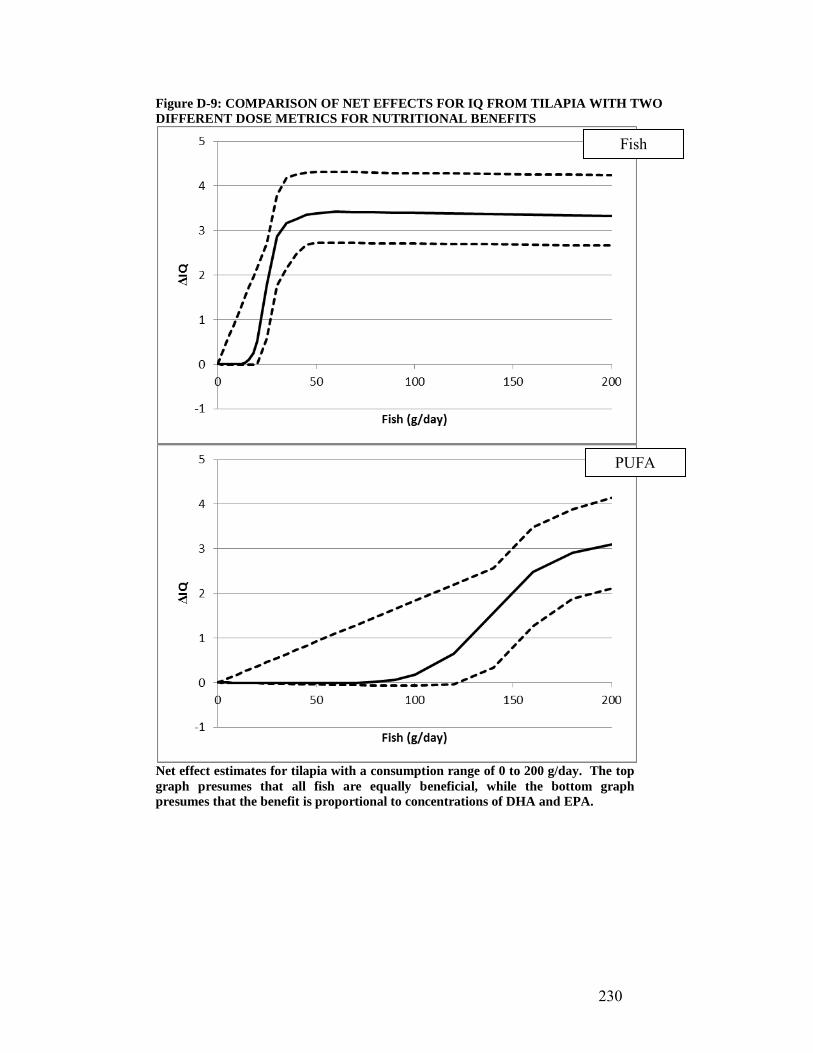
230
Figure D-9: COMPARISON OF NET EFFECTS FOR IQ FROM TILAPIA WITH TWO DIFFERENT DOSE METRICS FOR NUTRITIONAL BENEFITS
Net effect estimates for tilapia with a consumption range of 0 to 200 g/day. The top graph presumes that all fish are equally beneficial, while the bottom graph presumes that the benefit is proportional to concentrations of DHA and EPA.
Fish
PUFA
231
APPENDIX E: Methodology and Results from Carrington and Bolger (2000)
This is a slightly modified excerpt from Carrington and Bolger (2000) that describes the methodology used to model developmental milestone data from Iraq and the Seychelles Islands. The excerpt provides modeling details that are referenced in Appendix A but not specifically included. Data Sources The concern for exposure to mercury is primarily a result of two poisoning epidemics that occurred in Japan and Iraq. The latter epidemic, which occurred after exposure to contaminated grain, was the subject of an extensive epidemiological investigation that included an effort to relate the magnitude of exposure to methylmercury to health impact (Marsh et al., 1987). Because these were not prospective studies, the reports concerned with the Iraqi episode do not reflect the same degree of experimental control as subsequent studies. For risk assessment purposes, perhaps the major shortcoming of the Iraqi study is the presence of relatively few individuals at low doses. For instance, because there is little data on the extent of normal variation for the observed measures of development, it is difficult to discern whether a slightly higher frequency of “abnormal” responses (e.g. delayed walking) is attributable to mercury effects or normal variation. However, in spite of numerous shortcomings, the Iraqi study has a major advantage over more recent reports – there were high-dose health effects that were unequivocally attributable to methylmercury exposure. More recent prospective studies have searched for health effects of methylmercury in populations consuming whale or fish with much lower levels of exposure than those encountered in Iraq (Kjellström, et al, 1986; Marsh et al, 1995, Grandjean et al, 1997). For the present analysis, the results of the Iraqi study are combined with a more recent study in the Seychelles Islands (Marsh et al, 1995), where the exposure to methylmercury is from the consumption of marine fish. Data from the Seychelles Islands study were used because of the presence of some of the same measurements as those collected from Iraq and because the individual subject data was made available to us. The Seychelles Islands study has many more individual subjects and the range of mercury hair levels were much lower and more representative of levels typically found in consumers of fish, but which are still much higher than those typical of infrequent consumers of fish. Response Measures To combine results from two or more studies in an analysis, it is necessary that there be a common measure. For the present analysis, two endpoints that were collected in both the

232
Iraqi and Seychelles Islands studies were used as the common measure: 1) age of talking – the age at which the infants started talking, and 2) age of walking -- the age at which the infants became toddlers. Not only were these measures available from both studies, they have the advantage of being simple measures of neurological development. Construction of Cumulative Frequency Tables The data were used to construct separate (one for each study) two dimensional cumulative frequency tables for each study which tabulated frequency for groups spanning the range of hair levels and observed response. These were constructed by grouping the subjects from each study by dose, and calculating the frequency at which each of series of response levels were exceeded. Tables were then constructed for age of talking and age of walking. Plots of cumulative frequency tables for both the Iraqi and Seychelles Islands studies for age of talking and age of walking are shown in Figure E-2, respectively. Modeling Comparative Modeling The analysis presented here is an exercise in comparative modeling where a large number of alternative mathematical models are examined with respect to their ability to describe historical data. Analyses of epidemiological data often undertake evaluation that are designed to identify which of a number of different parameters (e.g. confounding variables or modifying factors) are to be included in a final model. The present analysis differs in two important respects. First, it evaluates models that are different in form rather than just complexity. Second, rather than concluding the analysis with a final or best model, a probability tree that employs probabilities for a set of alternative models to characterize the uncertainty associated with an estimation. To conduct a comparative modeling exercise, the first step is to assemble a list of candidate models. Dose-response models often have multiple sources of theoretical uncertainty. These include the dose-response relationship itself, the influence of factors other than dose on the outcome, and the extent of the variability among individual subjects. In addition, when multiple studies are being used to evaluate the models, it may be desirable to accommodate differences in the studies within the model. As a result, models were formulated from four submodels, each of which had several theoretical alternatives. Each of the four submodels represent a potential source of model uncertainty: 1) A dose-response function (relating hair level to age of talking or age of walking); 2) a statistical distribution describing population variability; 3) dose-independent factors; and 4) study dependent factors. With several variations of the mathematical form (see Table E-1) and relative position of each of the submodels (see Figure E-1), a series of 1092 candidate models were assembled. All the models were relatively simple and contained three to seven adjustable parameters (e.g. slope, standard deviation, dose-independent age of talking) which could be altered to improve the fit.
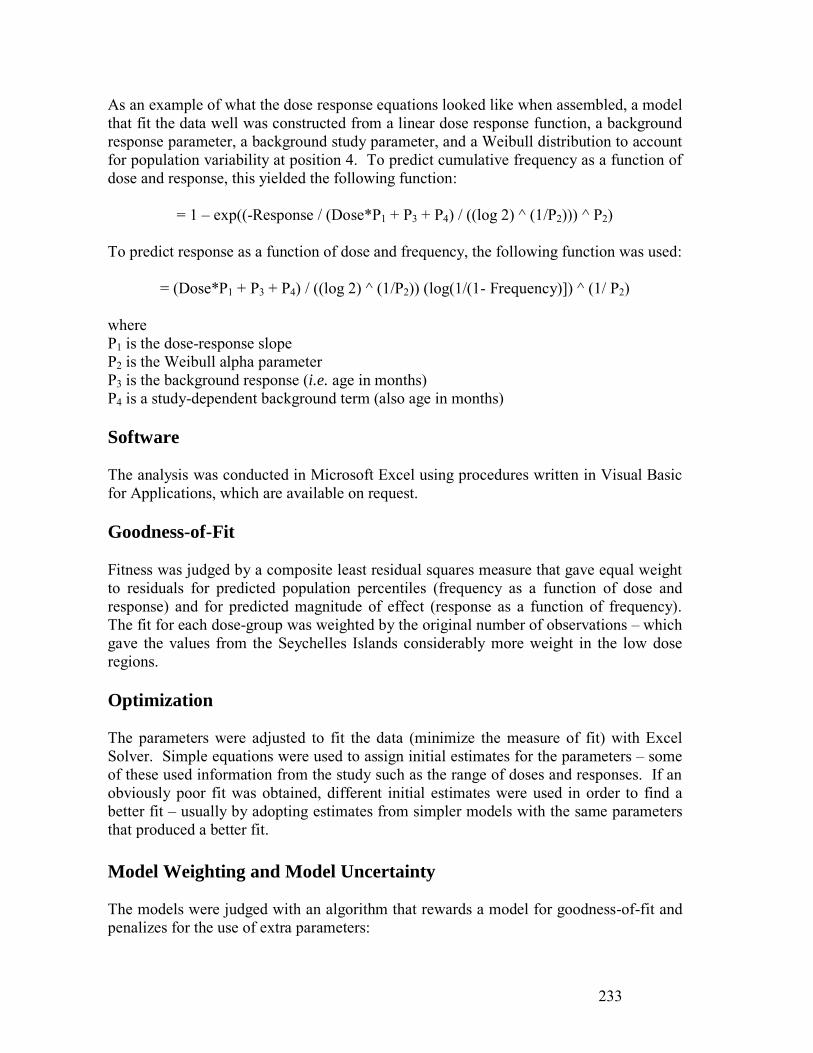
233
As an example of what the dose response equations looked like when assembled, a model that fit the data well was constructed from a linear dose response function, a background response parameter, a background study parameter, and a Weibull distribution to account for population variability at position 4. To predict cumulative frequency as a function of dose and response, this yielded the following function:
= 1 – exp((-Response / (Dose*P1 + P3 + P4) / ((log 2) ^ (1/P2))) ^ P2) To predict response as a function of dose and frequency, the following function was used:
= (Dose*P1 + P3 + P4) / ((log 2) ^ (1/P2)) (log(1/(1- Frequency)]) ^ (1/ P2) where P1 is the dose-response slope P2 is the Weibull alpha parameter P3 is the background response (i.e. age in months) P4 is a study-dependent background term (also age in months) Software The analysis was conducted in Microsoft Excel using procedures written in Visual Basic for Applications, which are available on request. Goodness-of-Fit Fitness was judged by a composite least residual squares measure that gave equal weight to residuals for predicted population percentiles (frequency as a function of dose and response) and for predicted magnitude of effect (response as a function of frequency). The fit for each dose-group was weighted by the original number of observations – which gave the values from the Seychelles Islands considerably more weight in the low dose regions. Optimization The parameters were adjusted to fit the data (minimize the measure of fit) with Excel Solver. Simple equations were used to assign initial estimates for the parameters – some of these used information from the study such as the range of doses and responses. If an obviously poor fit was obtained, different initial estimates were used in order to find a better fit – usually by adopting estimates from simpler models with the same parameters that produced a better fit. Model Weighting and Model Uncertainty The models were judged with an algorithm that rewards a model for goodness-of-fit and penalizes for the use of extra parameters:
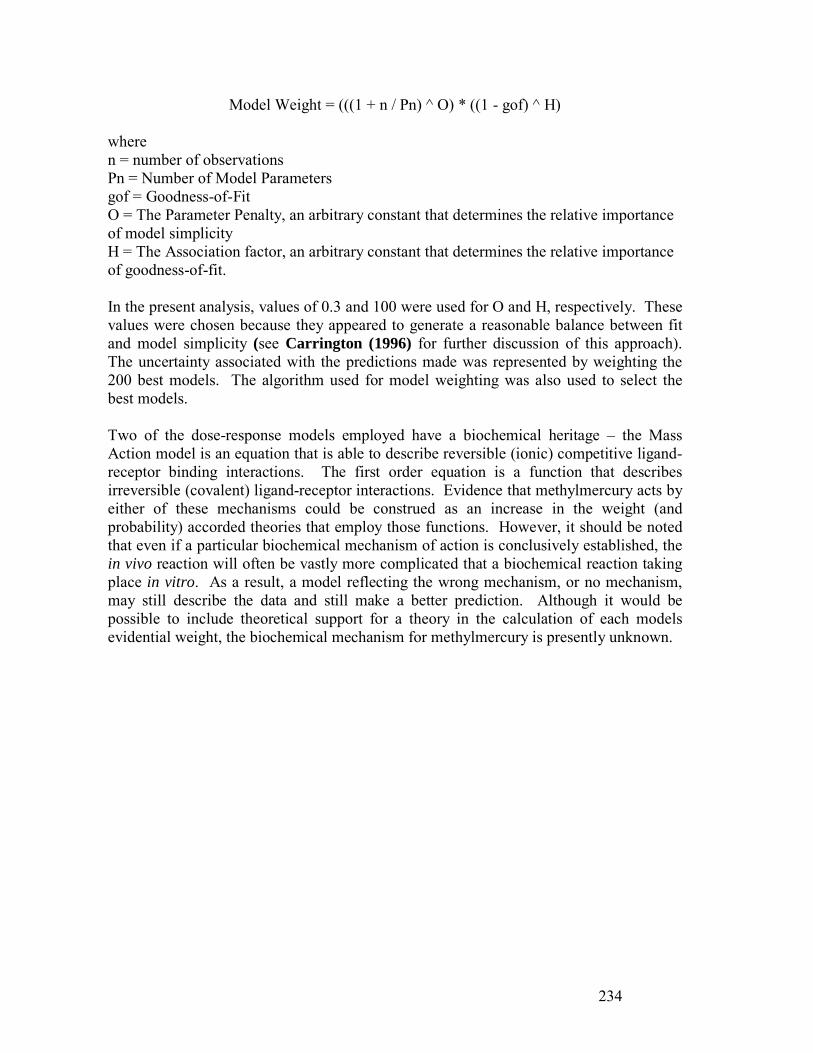
234
Model Weight = (((1 + n / Pn) ^ O) * ((1 - gof) ^ H) where n = number of observations Pn = Number of Model Parameters gof = Goodness-of-Fit O = The Parameter Penalty, an arbitrary constant that determines the relative importance of model simplicity H = The Association factor, an arbitrary constant that determines the relative importance of goodness-of-fit. In the present analysis, values of 0.3 and 100 were used for O and H, respectively. These values were chosen because they appeared to generate a reasonable balance between fit and model simplicity (see Carrington (1996) for further discussion of this approach). The uncertainty associated with the predictions made was represented by weighting the 200 best models. The algorithm used for model weighting was also used to select the best models. Two of the dose-response models employed have a biochemical heritage – the Mass Action model is an equation that is able to describe reversible (ionic) competitive ligand-receptor binding interactions. The first order equation is a function that describes irreversible (covalent) ligand-receptor interactions. Evidence that methylmercury acts by either of these mechanisms could be construed as an increase in the weight (and probability) accorded theories that employ those functions. However, it should be noted that even if a particular biochemical mechanism of action is conclusively established, the in vivo reaction will often be vastly more complicated that a biochemical reaction taking place in vitro. As a result, a model reflecting the wrong mechanism, or no mechanism, may still describe the data and still make a better prediction. Although it would be possible to include theoretical support for a theory in the calculation of each models evidential weight, the biochemical mechanism for methylmercury is presently unknown.

235
Results Age of Talking. For the age of talking endpoint, the best model was comprised of a linear dose-response relationship, a Weibull population distribution, and a background response parameter, and a study-dependent dose parameter (see Figure E-1). The exponential, hockey stick, and mass action dose-response relations were also heavily represented among the top-rated models (see Table E-2). The first-order and logistic models tended to not fit as well. The Weibull distribution was clearly the best fitting population distribution - regardless of the dose-response function used. The lognormal distribution consistently provided a better fit than the other two distributions. The poorer fit with either the normal or logistic distribution functions is indicative of a skewed distribution. All the top rated models included parameters for both dose-independent and study-dependent effects, reflecting the notions that a) children do not speak at age 0, and that there are differences in the Iraqi and Seychelles Islands studies that are not attributable to methylmercury. Age of Walking. For the age of walking endpoint, the best model was comprised of a linear dose-response relationship, a Weibull population distribution, a background dose and response parameters, and a study-dependent dose parameter (see E-3). All the dose-response functions were represented among the top-rated models. The Weibull and lognormal distributions were again the clear favorites for modeling population variability. All the top rated models included two parameters for dose-independent effects. All of the best models also included a study dependent parameter, again reflecting differences in the Iraqi and Seychelles Islands populations. Function Output. The output of the best model for each of the three endpoints is plotted in Figures E-2 and E-3 for both the Iraqi and Seychelles Islands studies. Probability trees comprised of the top 200 models yield uncertainty distributions when used as a predictive tools. As an example, sample output from the age of talking function that weights the frequency of use of the best 200 models is given in E-3. In a two-dimensional Monte-Carlo simulation used to simulate both variability and uncertainty, this function will impact the distribution in both dimensions. Because the models contain study-dependent variables, the study for which a prediction is required must be specified. If the resulting models are to be used in a risk assessment, this requires a decision about which study population is more representative of the population of concern to the assessment. This decision would revolve around speculation about the source of the differences between the studies (e.g. cultural or genetic), and would be a source of both variability and uncertainty. For instance, the population of concern may be variable with regard to the percentage of the population for which each study is more appropriate, while the extent of that frequency for each may be uncertain.
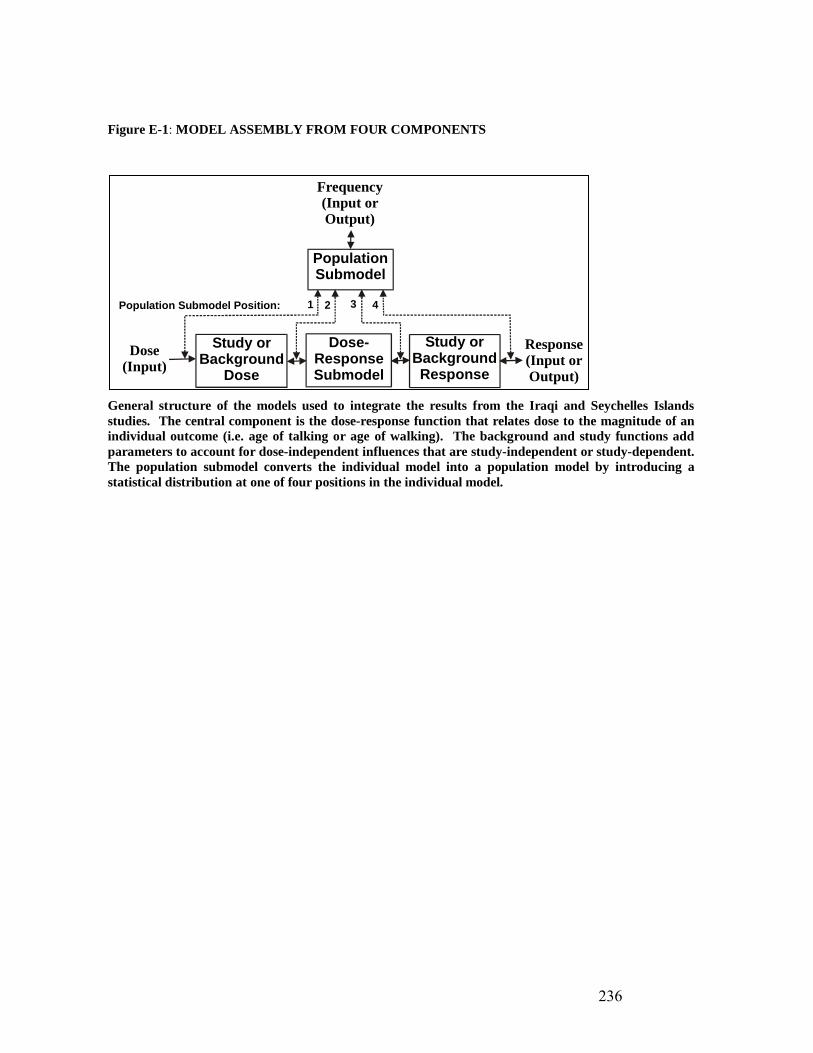
236
Figure E-1: MODEL ASSEMBLY FROM FOUR COMPONENTS
General structure of the models used to integrate the results from the Iraqi and Seychelles Islands studies. The central component is the dose-response function that relates dose to the magnitude of an individual outcome (i.e. age of talking or age of walking). The background and study functions add parameters to account for dose-independent influences that are study-independent or study-dependent. The population submodel converts the individual model into a population model by introducing a statistical distribution at one of four positions in the individual model.
Dose(Input)
Population Submodel Position:
Frequency(Input or Output)
Response(Input or Output)
Study or Background
Dose
Dose-ResponseSubmodel
PopulationSubmodel
Study or BackgroundResponse
1 2 3 4

237
Figure E-2: AGE OF TALKING, DATA, AND A MODEL
The charts at the top reflect the cumulative incidence tables constructed from the raw data (age of talking) from the Iraqi (left) and Seychelles Islands (right). The charts at the bottom reflect a common model fit to both data sets. The Z-axis reflects the percent of the population in each dose group (Y-axis) with an age of talking above the X-axis value. The X-axis values are chosen to represent the range of value encountered in the studies, and therefore do not necessarily generate incidences of 0 or 1 at all dose groups.
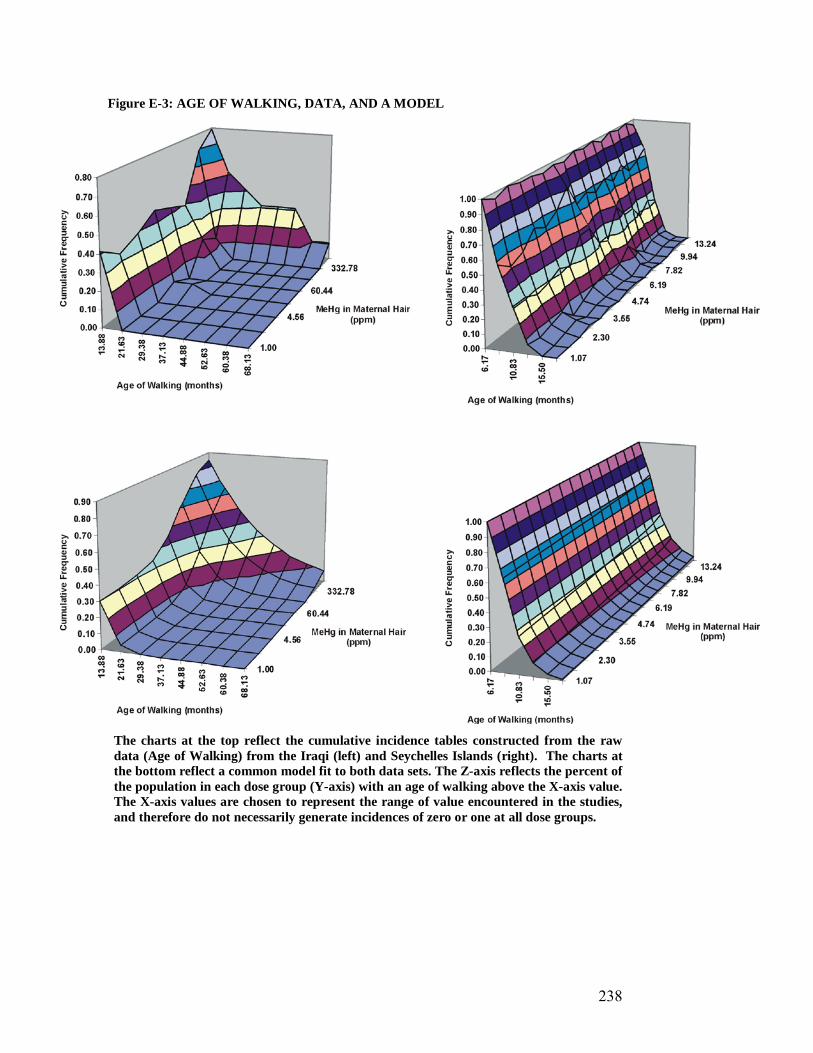
238
Figure E-3: AGE OF WALKING, DATA, AND A MODEL
The charts at the top reflect the cumulative incidence tables constructed from the raw data (Age of Walking) from the Iraqi (left) and Seychelles Islands (right). The charts at the bottom reflect a common model fit to both data sets. The Z-axis reflects the percent of the population in each dose group (Y-axis) with an age of walking above the X-axis value. The X-axis values are chosen to represent the range of value encountered in the studies, and therefore do not necessarily generate incidences of zero or one at all dose groups.
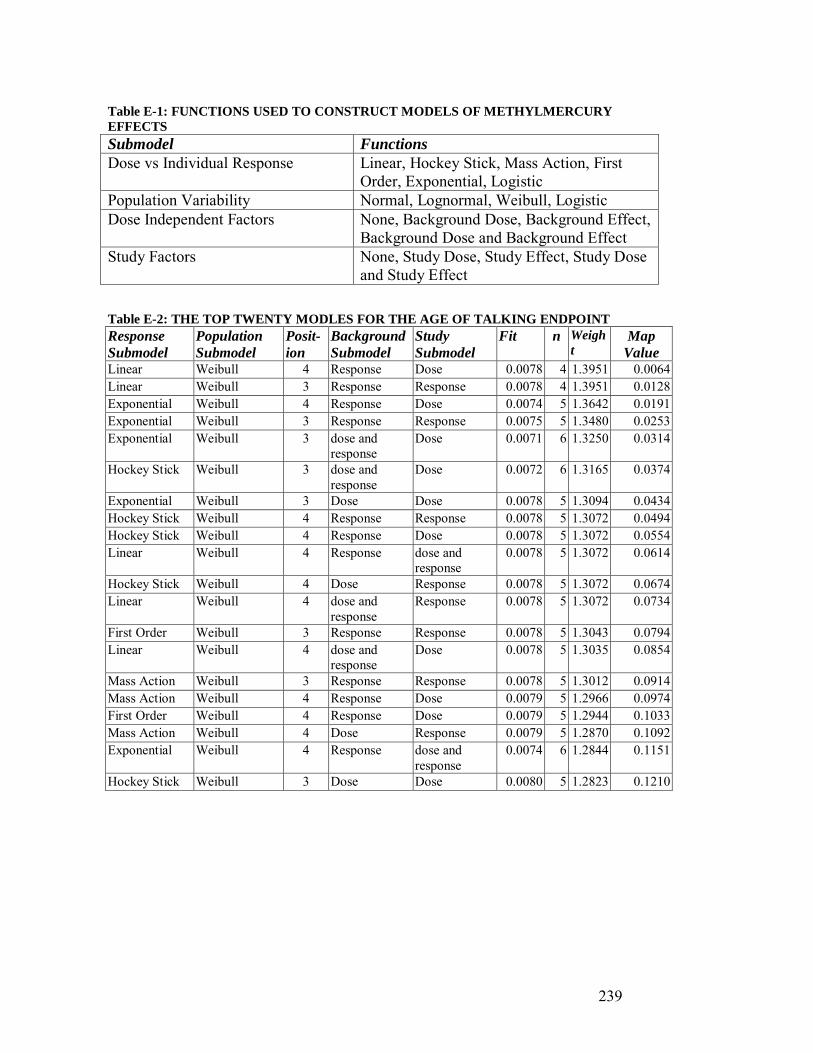
239
Table E-1: FUNCTIONS USED TO CONSTRUCT MODELS OF METHYLMERCURY EFFECTS Submodel Functions Dose vs Individual Response Linear, Hockey Stick, Mass Action, First
Order, Exponential, Logistic Population Variability Normal, Lognormal, Weibull, Logistic Dose Independent Factors None, Background Dose, Background Effect,
Background Dose and Background Effect Study Factors None, Study Dose, Study Effect, Study Dose
and Study Effect Table E-2: THE TOP TWENTY MODLES FOR THE AGE OF TALKING ENDPOINT Response Submodel
Population Submodel
Posit-ion
Background Submodel
Study Submodel
Fit n Weight
Map Value
Linear Weibull 4 Response Dose 0.0078 4 1.3951 0.0064 Linear Weibull 3 Response Response 0.0078 4 1.3951 0.0128 Exponential Weibull 4 Response Dose 0.0074 5 1.3642 0.0191 Exponential Weibull 3 Response Response 0.0075 5 1.3480 0.0253 Exponential Weibull 3 dose and
response Dose 0.0071 6 1.3250 0.0314
Hockey Stick Weibull 3 dose and response
Dose 0.0072 6 1.3165 0.0374
Exponential Weibull 3 Dose Dose 0.0078 5 1.3094 0.0434 Hockey Stick Weibull 4 Response Response 0.0078 5 1.3072 0.0494 Hockey Stick Weibull 4 Response Dose 0.0078 5 1.3072 0.0554 Linear Weibull 4 Response dose and
response 0.0078 5 1.3072 0.0614
Hockey Stick Weibull 4 Dose Response 0.0078 5 1.3072 0.0674 Linear Weibull 4 dose and
response Response 0.0078 5 1.3072 0.0734
First Order Weibull 3 Response Response 0.0078 5 1.3043 0.0794 Linear Weibull 4 dose and
response Dose 0.0078 5 1.3035 0.0854
Mass Action Weibull 3 Response Response 0.0078 5 1.3012 0.0914 Mass Action Weibull 4 Response Dose 0.0079 5 1.2966 0.0974 First Order Weibull 4 Response Dose 0.0079 5 1.2944 0.1033 Mass Action Weibull 4 Dose Response 0.0079 5 1.2870 0.1092 Exponential Weibull 4 Response dose and
response 0.0074 6 1.2844 0.1151
Hockey Stick Weibull 3 Dose Dose 0.0080 5 1.2823 0.1210
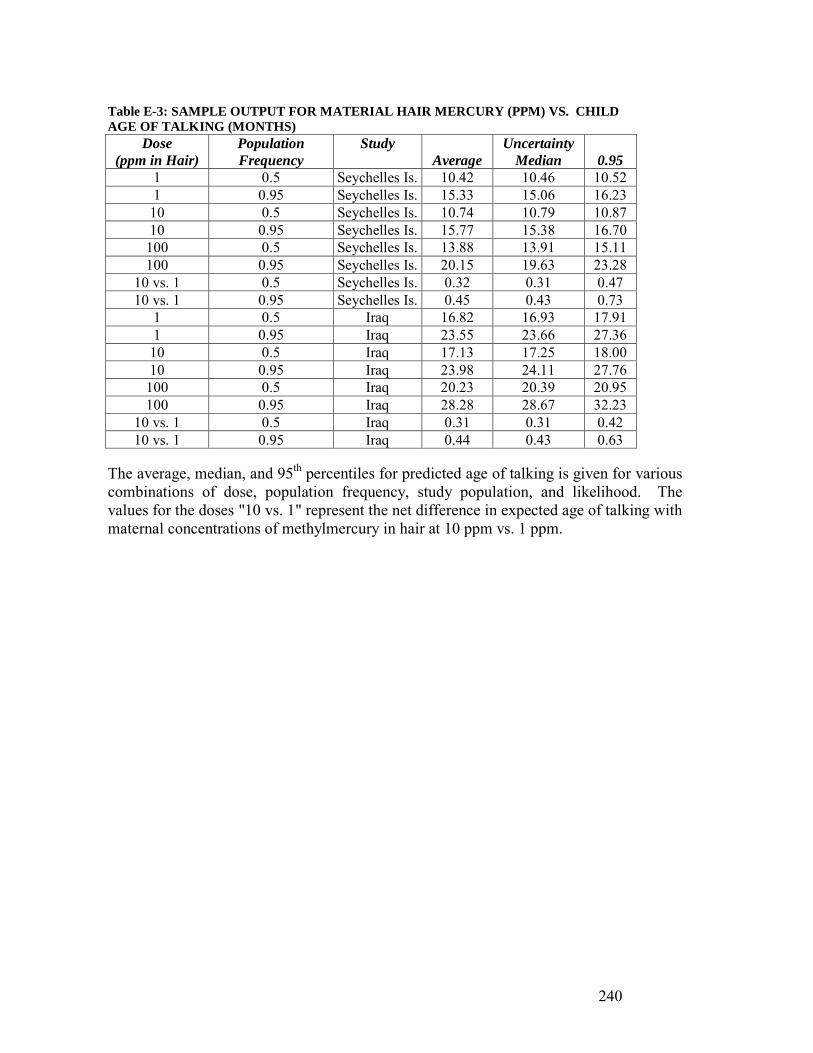
240
Table E-3: SAMPLE OUTPUT FOR MATERIAL HAIR MERCURY (PPM) VS. CHILD AGE OF TALKING (MONTHS)
Dose (ppm in Hair)
Population Frequency
Study Average
Uncertainty Median
0.95
1 0.5 Seychelles Is. 10.42 10.46 10.52 1 0.95 Seychelles Is. 15.33 15.06 16.23
10 0.5 Seychelles Is. 10.74 10.79 10.87 10 0.95 Seychelles Is. 15.77 15.38 16.70
100 0.5 Seychelles Is. 13.88 13.91 15.11 100 0.95 Seychelles Is. 20.15 19.63 23.28
10 vs. 1 0.5 Seychelles Is. 0.32 0.31 0.47 10 vs. 1 0.95 Seychelles Is. 0.45 0.43 0.73
1 0.5 Iraq 16.82 16.93 17.91 1 0.95 Iraq 23.55 23.66 27.36
10 0.5 Iraq 17.13 17.25 18.00 10 0.95 Iraq 23.98 24.11 27.76
100 0.5 Iraq 20.23 20.39 20.95 100 0.95 Iraq 28.28 28.67 32.23
10 vs. 1 0.5 Iraq 0.31 0.31 0.42 10 vs. 1 0.95 Iraq 0.44 0.43 0.63
The average, median, and 95th percentiles for predicted age of talking is given for various combinations of dose, population frequency, study population, and likelihood. The values for the doses "10 vs. 1" represent the net difference in expected age of talking with maternal concentrations of methylmercury in hair at 10 ppm vs. 1 ppm.
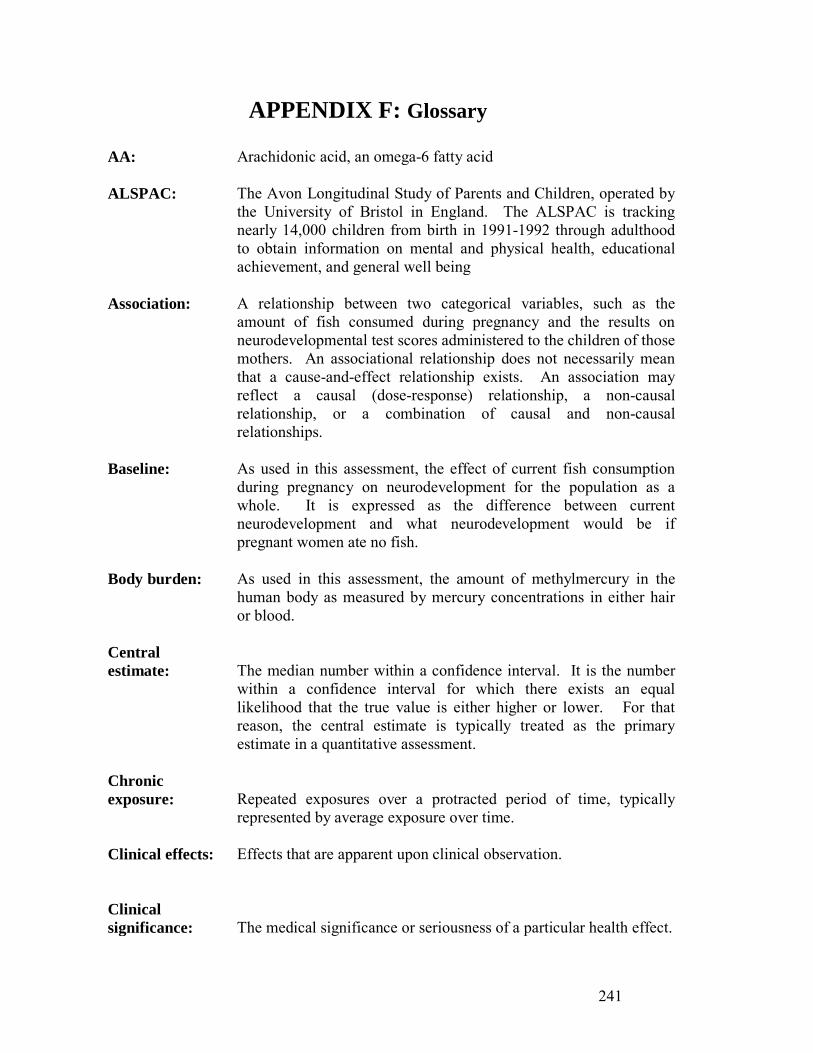
241
APPENDIX F: Glossary
AA: Arachidonic acid, an omega-6 fatty acid ALSPAC: The Avon Longitudinal Study of Parents and Children, operated by
the University of Bristol in England. The ALSPAC is tracking nearly 14,000 children from birth in 1991-1992 through adulthood to obtain information on mental and physical health, educational achievement, and general well being
Association: A relationship between two categorical variables, such as the
amount of fish consumed during pregnancy and the results on neurodevelopmental test scores administered to the children of those mothers. An associational relationship does not necessarily mean that a cause-and-effect relationship exists. An association may reflect a causal (dose-response) relationship, a non-causal relationship, or a combination of causal and non-causal relationships.
Baseline: As used in this assessment, the effect of current fish consumption
during pregnancy on neurodevelopment for the population as a whole. It is expressed as the difference between current neurodevelopment and what neurodevelopment would be if pregnant women ate no fish.
Body burden: As used in this assessment, the amount of methylmercury in the
human body as measured by mercury concentrations in either hair or blood.
Central estimate:
The median number within a confidence interval. It is the number within a confidence interval for which there exists an equal likelihood that the true value is either higher or lower. For that reason, the central estimate is typically treated as the primary estimate in a quantitative assessment.
Chronic exposure:
Repeated exposures over a protracted period of time, typically represented by average exposure over time.
Clinical effects: Effects that are apparent upon clinical observation. Clinical significance:
The medical significance or seriousness of a particular health effect.
242
Commercial fish:
“Commercial fish” are fish that are bought and sold in interstate commerce. Interstate commerce means (1) commerce between any State or Territory and any place outside thereof, and (2) commerce within the District of Columbia or within any other Territory not organized with a legislative body (21 U.S.C. 321(b)).
Concentration: As used in this assessment, the amount of methylmercury or omega-
3 fatty acids in fish, blood or hair, measured in relative terms, e.g., parts per million.
Confidence Intervals (C.I.):
The margin of error surrounding an estimate. It is expressed as a range of numbers on both sides of the estimate. This assessment uses a 90 percent confidence limit (i.e., the 5th and 95th percentiles of the uncertainty distribution) to summarize the range of plausible estimates.
Confounder: A variable or factor that can influence the results of a study if not
controlled for in that study. Developmental Milestone:
A functional skill or task that most children develop the ability to perform.
DHA: Docosahexanoic acid, an omega-3 fatty acid Dose-response: The relationship between the amount of an agent (“dose”) to which
a person is exposed and a particular health effect (“response”). DPA: Docosapentaenoic acid Epidemiological study:
The study of the incidence of disease in a human population.
Exposure: As used in this assessment, exposure refers to intake into the human
body of either methylmercury or nutrients from fish. EPA (the agency):
The U.S. Environmental Protection Agency.
EPA: Eicosapentaenoic acid, an omega-3 fatty acid. Fetal neuro- development:
The development and growth of the nervous system before birth.
243
The fetal neurodevelopment referred to in this assessment manifests itself primarily as cognitive ability measured during childhood.
FDA: The U.S. Food and Drug Administration, a public health agency
within the Department of Health and Human Services. Fish: Fresh and saltwater finfish, crustaceans, molluscan shellfish (e.g.,
clams and oysters) and other forms of aquatic animal life intended for human consumption, either wild-caught or aquacultured.
Full IQ: A measure of global intellectual functioning derived from
standardized composite scores on subtests IQ. As used in this assessment, it refers primarily to all the subtests within the Wechsler Intelligence Scales for Children. (See Axelrad et al., 2007, page 610, for cognitive tests in addition to the Wechsler that were used to measure methylmercury’s effect on full IQ.)
Hill model: A sigmoidal model (see below for definitions of “model” and
“sigmodial model”) with three parameters: maximum effect (amplitude), median effective dose, and power.
Hg: Mercury, of which methylmercury is an organic form. Hockey stick model:
A linear model (see below for definitions of “model” and linear model”) where the magnitude of the effect is proportional to the magnitude of the cause above a threshold (see below for definition of “threshold”).
IQ: Intelligence quotient, which is a number used to express a person’s
intelligence as measured on a standardized test. IQ size equivalents (IQse):
A term used to refer to results on tests of neurodevelopment that are not based on standardized IQ tests. In order to make the scale of the results quantitatively comparable to actual IQ, the raw score is rescaled by multiplying the Z-Score by 15 (which is the approximate standard deviation on standardized IQ tests).
Linear model: A “straight” dose-response model in which the magnitude of the
response is directly proportional to the magnitude of the dose. LTSTCR: Long Term-to-Short Term Consumer Ratio. The ratio of the
number of consumers in a long-term survey relative to the number of consumers in a short-term survey.

244
MeHg: Methylmercury. Maximum Effect:
The maximum response that a dose is capable of producing.
Model: A mathematical expression used to describe or draw inferences
from a set of observations. For example, the dose-response models used in this assessment describe quantitative dose-response relationships through a range of doses based on dose-response observations from a smaller number of doses.
Monte-Carlo routine:
As used in this assessment, a modeling technique that involved the repeated use of random numbers to account for: (a) variation among individuals in a population; and (b) a plausible range of possible outcomes.
MDI: The Mental Developmental Index of the Bayley Scales of Infant
Development-II, a test of neurodevelopment in children. Net Effect: As used in this assessment, the overall effect on an individual’s
neurodevelopment from his/her mother’s consumption of commercial fish during pregnancy.
Neurotoxic: Toxic to the nervous system. As used in this assessment,
neurotoxicity that primarily manifests itself as affecting cognitive ability, such as IQ.
NHANES: The National Health and Nutrition Evaluation Study conducted by
the Centers for Disease Control and Prevention. NMFS: The National Marine Fisheries Service within the U.S. Department
of Commerce. Observational study:
Research in a free-living human population that measures associations between exposure to a substance and a health outcome.
PDI: The Psychomotor Developmental Index of the Bayley Scales of
Infant Development-II, a test of neurodevelopment in children. Plateau: The maximum response magnitude that any dose is capable of
producing. Same as “maximum effect.”
245
Population-wide effect:
As used in this assessment, a shift upward or downward in the average score for the entire population on a neurodevelopmental test.
Prospective Observational study:
An observational study in which investigators recruit subjects and observe them prior to the occurrence of the health outcome. Prospective observational studies described in this assessment typically measured fish consumption by pregnant women and/or their exposure to methylmercury and then performed neurodevelopmental tests on their children at various ages.
Postnatal exposure:
As used in this assessment, exposure to methylmercury or to fish nutrients after birth, either as a result of nursing or one’s own consumption of fish.
ppb: Parts per billion. As typically used in this assessment, it refers to
the concentration, by weight, of mercury in blood. Equivalent to nanograms per gram and micrograms per kilogram.
ppm: Parts per million. As used in this assessment, it refers to the
concentration, by weight, of mercury in fish, i.e., the muscle tissue, or in human hair.
PPVT: The Peabody Picture Vocabulary Test. This test evaluates receptive
vocabulary. Prenatal exposure:
As used in this assessment, exposure to methylmercury or to nutrients from fish that occurs before birth as a consequence of the mother’s exposure.
PUFAs: Omega-3 polyunsaturated fatty acids Risk: As used in this assessment, the probability of an adverse effect on
neurodevelopment and the severity of that effect. Sigmoidal model:
A dose-response model that is shaped like an “S.”
Subclinical effects:
Subtle effects in an individual that are not detectable by normal clinical tests.
246
Threshold: The dose at which a response begins to occur. µg/day: Micrograms per day. As used in this assessment, it refers to
amounts of dietary mercury from fish to which people are exposed. µg/L: Micrograms per liter. As used in this assessment, it refers to
amounts of mercury per liter of blood as a measure of exposure in individuals.
USDA: United States Department of Agriculture. Verbal IQ: As used in this assessment, results on tests of neurodevelopment
that constitute, or have been deemed to be equivalent to, the verbal component of full IQ. For the effect of methylmercury on verbal IQ, these tests were the Boston Naming Test, with and without cues as administered in the Faroe and Seychelles Islands, and the Test of Language Development – Spoken Language Score as administered in New Zealand (see Cohen et al., 2005b). For the beneficial effect of fish consumption, the test was the verbal component of the Wechsler Intelligence Scales for Children III as administered in the United Kingdom (see Hibbeln et al., 2007).
WRAVMA: The Wide Range Assessment of Visual Motor Abilities. This test
includes a matching test for visual-spatial development, a drawing test for visual-motor development, and a pegboard test for fine-motor skills development.
Z-Score: A statistical tool that converts a raw score to a relative score to
describe how far above or below the average of a group a particular result is, relative to normal variation (i.e., a standard deviation).

247
APPENDIX G: Research Needs Relating to Neurologic Endpoints
1. Confirmation is needed to ensure that the observed associational effects between fish
consumption during pregnancy and neurodevelopment are causally related and are indeed real at levels of fish consumption and exposures to methylmercury relevant to U.S. consumers. This confirmation is needed for both the low dose methylmercury effects and the neurodevelopmental benefits that have been reported to date. To the extent practicable, identification of appropriate statistical designs of randomized controlled intervention trials would be highly useful for evaluating cause and effect on the benefit side of that equation. Randomized controlled trials might not be possible for the purpose of confirming cause and effect for methylmercury.
2. Confirmation through appropriate integration of information from observational
studies and intervention trials is also needed to ensure the true effect sizes, whether the relationships are real, and whether they are of public health significance, that is, whether: (a) the methylmercury effects, (b) the beneficial effects, and (c) the overall net effects are large enough to be meaningful with respect to everyday functioning of children born to mothers consuming recommended amounts of fish.
3. Additionally, a better understanding is needed on the underlying basis for beneficial
associations that have been reported between fish consumption during pregnancy and neurodevelopment. Are the beneficial associations due to a “package” of nutrients and if so, which nutrients? What role do omega-3 fatty acids play? To what extent might the beneficial associations be affected by differences in dietary and/or lifestyle patterns, environmental and socioeconomic factors among mothers who consume fish vs. those who do not? Ideally, these questions may best be addressed through well designed randomized controlled intervention trials instead of through observational studies that served as the source of data for this assessment.
4. Research is needed that relates fish intakes of breastfeeding mothers to
neurodevelopmental outcomes in their offspring. The current evidence focuses largely on effects from fish consumption during pregnancy.
5. There is consistent evidence that young children can benefit to some extent from their
own fish consumption but evidence about whether young children are especially vulnerable to adverse effects from methylmercury from postnatal exposure is limited and not consistent. These are both areas that could benefit from additional research.
6. Questions remain on the relationship between selenium and methylmercury. One
hypothesis, consistent with results in some animal studies and known chemical reactions, is that methylmercury toxicity is actually a shortage of available selenium once methylmercury bonds with it in the human body. The shortage can be overcome by an adequate amount of remaining selenium in the body. Questions that need elucidation include (a) to what extent does selenium sufficiency mitigate effects from
248
methylmercury; and (b) can some or all of the toxic effects of methylmercury be attributed to blockage of selenium effects. These questions are not easily addressed in human studies.
7. Food consumption surveys, especially those used in epidemiological studies, need to
cover a longer period of time than they typically do (i.e., weeks or months rather than one or two days) in order to provide a better characterization of fish consumption and to exposure to methylmercury as well as to other contaminants in food where chronic exposure is the predominant concern within the U.S. population. Ideally, the best method would be to have subjects keep food diaries over extended periods of time, but most researchers have regarded doing so as imposing too large a burden on their subjects. Bar code data have become available for keeping track of home consumption over time, but cannot cover consumption away from home, e.g., in restaurants. New approaches to this problem may be needed. As an additional matter, food consumption surveys should better distinguish between commercial and non-commercial species of fish that are being consumed. This differentiation can be important because data on net effects derive primarily from consumption of commercially available species. Net effects from non-commercial species have not yet been studied.
8. A better understanding of genetic susceptibility to methylmercury would enable risk
assessment modeling of methylmercury effects in the U.S. population to be more certain.
9. The evidence for neurological effects from fish consumption in the general U.S.
population, i.e., older children and adults, largely derive from anecdotal accounts and individual case reports. Large, well developed prospective studies in the United States are needed that explore whether net effects are occurring, i.e., whether fish are conveying neurologic benefits, harm, or both.
10. More research is needed on the effects of other contaminants in fish on the same
health neurodevelopmental endpoints as may be affected by methylmercury. 11. Continued monitoring is needed on whether methylmercury levels in commercial
species are changing and in so, at what rate. So far, the limited data on this subject do not reveal measurable differences over time in methylmercury concentrations in commercial fish generally, nor does the FDA data base reveal a trend toward increasing concentrations. However, there is some evidence of significant increases in average total mercury levels in at least some ocean waters. As mercury emissions from human activity convert to methylmercury in the world’s water bodies, methylmercury concentrations can be affected at some point.
12. There is some evidence that very low levels of fish consumption during pregnancy
can be net adverse to the developing fetus because the beneficial effect from nutrients require greater than very low consumption before they become evident. More

249
research is needed to determine whether this is true. If it is true, it may have a bearing on advice to pregnant women.

250
REFERENCES
1. Agency for Toxic Substances and Disease Registry, CDC, DHHS (1999, March). Toxicological Profile for Mercury. CAS# 7439-97-6, at http://www.atsdr.cdc.gov/toxprofiles/tp.asp?id=115&tid=24
2. Avon Longitudinal Study of Parents and Children, University of Bristol, at
http://www.bristol.ac.uk/alspac/.
3. Axelrad, D.A., Bellinger, D.C., Ryan, L.M., Woodruff, T.J. (2007, April). Dose-Response Relationship of Prenatal Mercury Exposure and IQ: An Integrative Analysis of Epidemiological Data. Environmental Health Perspectives, 115(4), 609-615.
4. Bakir, F., Damluji, S.F., Amin-Zaki, L., Murtadha, M., Kahalidi, A., Al-Rawi, N.Y.,
Tikriti, S., Dhahir, H.I., Clarkson, T.W., Smith, J.C., Doherty, R.A. (1973, July 22). Methylmercury Poisoning in Iraq, Science, 181, 230-241.
5. Barber, R.T., Vijayakumar, A., Cross, F.A. (1972). Mercury Concentrations in Recent
and Ninety-Year-Old Benthopelagic Fish. Science, 178, 636-639.
6. Björnberg, K.A., Vahter, M., Berglund, B., Niklasson, B., Blennow, M., Sandborgh-Englund, G. (2005). Transport of Methylmercury and Inorganic Mercury to the Fetus and Breast-Fed Infant. Environmental Health Perspectives, 113(10), 1381-1385.
7. Boffetta, P. and Trichopoulos, D. (2008). Biomarkers in Cancer Epidemiology.
Chapter 5 in Adami H-O, Hunter, D., Trichopoulos, D., Textbook of Cancer Epidemiology, Second Edition. Oxford University Press, New York.
8. Budtz-Jørgensen, E., Grandjean, P., Jorgensen, P.J., Weihe, P., Keiding, N. (2004).
Association between mercury concentrations in blood and hair in methylmercury-exposed subjects at different ages. Environmental Research, 95, 385-393.
9. Budtz-Jørgensen, E., Debes, F., Weihe, P., Grandjean, P. (2005). Adverse mercury
effects in 7 year-old children expressed as loss in “IQ.” Final report for the U.S. EPA.
10. Budtz-Jørgensen, E., Grandjean, P., Weihe, P. (2007, March). Separation of Risks
and Benefits of Seafood Intake. Environmental Health Perspectives, 115(3), 323-327.
11. Cao, Y., Chen, A., Jones, R.L., Radcliffe, J., Caldwell, K.L., Dietrich, K.N., Rogan, W.J. (2010). Does background postnatal methyl mercury exposure in toddlers affect cognition and behavior? NeuroToxicology, 32, 1-9.

251
12. Carrington, C.D. (1996). Logical Probability and Risk Assessment. Human Ecology Risk Assessment, 2, 62-78.
13. Carrington, C.D., Cramer, G.M., Bolger, P.M. (1997). A Risk Assessment for
Methylmercury in Tuna. Water, Air and Soil Pollution, 97, 273-283.
14. Carrington, C.D. & Bolger, P.M. (2000). A Pooled Analysis of the Iraqi and Seychelles Methylmercury Studies. Human Ecological Risk Assessment, 6, 323-340.
15. Carrington, C.D. & Bolger, P.M. (2002). An Exposure Assessment for
Methylmercury from Seafood for Consumers in the United States. Risk Analysis, 22(4), 689-699.
16. Carrington, C.D., Montwill, B., Bolger, P.M. (2004, December). An Intervention
Analysis for the Reduction of Exposure to Methylmercury from the Consumption of Fish by Women of Child-bearing Age. Regulatory Toxicology and Pharmacology, 40(3), 272-280.
17. Center for Food Safety and Applied Nutrition Risk Analysis Working Group. (2002,
March). Initiation and Conduct of All ‘Major’ Risk Assessments within a Risk Analysis Framework.
18. Centers for Disease Control and Prevention. (2001, March 2). Blood and Hair
Mercury Levels in Young Children and Women of Childbearing Age -- United States, 1999. Morbidity and Mortality Weekly Report, 50(8), 140-3.
19. Centers for Disease Control and Prevention. (2003). National Center for Health
Statistics, National Health and Nutrition Examination Survey, 1999-2000 data files at http://www.cdc.gov/nchs/about/major/nhanes/NHANES99_00.htm. 30-Day Fish Frequency Survey data. At http://www.cdc.gov/nchs/about/major/nhanes/frequency/drxtot.htm
20. Centers for Disease Control and Prevention. (2004). National Center for Health
Statistics, National Health and Nutrition Examination Survey, 2001-2002 data files. At : http://wwwn.cdc.gov/nchs/nhanes/search/nhanes01_02.aspx
21. Centers for Disease Control and Prevention. (2005). National Center for Health
Statistics, National Health and Nutrition Examination Survey, 2003-2004 data files. At http://www.cdc.gov/nchs/about/major/nhanes/nhanes2003-2004/nhanes03_04.htm
22. Codex Alimentarius Commission. (2006). Report of the 38th Session of the Codex
Committee on Food Additives and Contaminants, The Hague, The Netherlands, 24-28 April, 2006, ALINORM 6/29/12.
23. Codex Alimentarius Commission. (2009). Official website at
http://www.codexalimentarius.net/web/index_en.jsp.

252
24. Codex Committee on Food Additives and Contaminants. (2006, April 24-28).
Discussion Paper on the Guideline Levels for Methylmercury in Fish. CX/FAC 06/38/37. The Hague, the Netherlands.
25. Cohen, J.T., Bellinger, D.C., Connor, W.E., Kris-Etherton, P.M., Lawrence, R.S.,
Savitz, D.A., Shaywitz B.A., Teutsch, S.M., Gray, G.M. (2005a, November). A quantitative risk–benefit analysis of changes in population fish consumption. American Journal of Preventive Medicine, 29(4), 325-334.
26. Cohen, J.T., Bellinger, D.C., Shaywitz, B.A. (2005b, November). A Quantitative
Analysis of Prenatal Methyl Mercury Exposure and Cognitive Development. American Journal of Preventive Medicine, 29(4), 353-365.
27. Cohen, J.T., Bellinger, D.C., Connor, W.E., Shaywitz, B.A. (2005c, November). A
Quantitative Analysis of Prenatal Intake of n-3 Polyunsaturated Fatty Acids and Cognitive Development. American Journal of Preventive Medicine, 29(4), 366-74.
28. Crump, K.S., Kjellström, T., Shipp, A.M., Silvers, A., Stewart, A. (1998). Influence
of Prenatal Mercury Exposure Upon Scholastic and Psychological Test Performance: Benchmark Analysis of a New Zealand Cohort. Risk Analysis, 18(6), 701-713.
29. Daniels, J. L., Longnecker, M. P., Rowland, A. S., Golding, J., and the ALSPAC
Study Team-University of Bristol Institute of Child Health. (2004, July). Fish Intake During Pregnancy and Early Cognitive Development of Offspring. Epidemiology, 15(4), 394-402.
30. Davidson, P., Myers, G., Cox, C., Shamlaye, C., Clarkson, T., Marsh, D., Tanner, M.,
Berlin, M., Sloane-Reves, J., Cernichiari, E., Choisy, O., Chor, A. (1995). Longitudinal Neurodevelopmental Study of Seychellois Children Following In Utero Exposure to MeHg from Maternal fish Ingestion: Outcomes at 19 and 29 Months. Neurotoxicology, 16, 677-688.
31. Davidson, P. W., Myers, G. J., Cox, C., Axtell, C., Shamlaye, C., Sloane-Reeves, J.,
Cernichiari, E., Needham, L., Choi, A., Wang, Y., Berlin, M., Clarkson, T. W. (1998, August 26). Effects of Prenatal and Postnatal Methylmercury Exposure From Fish Consumption on Neurodevelopment, Outcomes at 66 Months in the Seychelles Child Development Study. Journal of the American Medical Association, 280(8), 701-707.
32. Davidson, P.W., Strain, J.J., Myers, G.J., Thurston, S.W., Bonham, M.P., Shamlaye,
C.F., Stokes-Riner, A., Wallace, J.M.W., Robson, P.J., Duffy, E.M., Georger, L.A., Sloane-Reeves, J., Cernichairi, E., Canfield, R.L., Cox, C., Huang, L.S., Janciuras, J., Clarkson, T.W. (2008). Neurodevelopmental effects of maternal nutritional status and exposure to methylmercury from eating fish during pregnancy. NeuroToxicology 29, 767-775.
253
33. Davidson, P.W., Cory-Slechta, D.A., Thurston, S.W., Huang, L-S., Shamlaye, C.F., Gunzler, D., Watson, G., van Wijngaarden, E., Zareba, G., Klein, J.D., Clarkson, T.W., Strain, J.J., Myers, G.J. (2011). Fish consumption and prenatal methylmercury exposure: Cognitive and behavioral outcomes in the main cohort at 17 years from the Seychelles child development study. NeuroToxicology, 32, 711-717.
34. Debes, F., Budtz-Jørgensen, E., Weihe, P., White, R.F., Grandjean, P. (2006, May-
June). Impact of prenatal methylmercury exposure on neurobehavioral function at age 14 years. Neurotoxicology and Teratology, 28(3), 63-375.
35. Department of Agriculture, Agricultural Research Service. (1993). The Continuing
Survey of Food Intakes by Individuals (CCFII) and the Diet and Health Knowledge Survey (DHKS) 1989-91.
36. Department of Agriculture, Agricultural Research Service. (2011). USDA National
Nutrient Database for Standard Reference, Release 24. Nutrient Data Laboratory Home Page, at http://www.ars.usda.gov/ba/bhnrc/ndl.
37. Department of Agriculture, Agricultural Research Service, Beltsville Human
Nutrition Research Center, Food Surveys Research Group (Beltsville, MD) and Department of Health and Human Services, Centers for Disease Control and Prevention, National Center for Health Statistics (Hyattsville, MD). (2007, November). What We Eat in America, NHANES 2003-2004 Documentation: Dietary Interview - Individual Foods -- Days One and Two (DR1IFF_C & DR2IFF_C). (November 2007). Available at http://www.ars.usda.gov/Services/docs.htm?docid=8964.
38. Department of Agriculture and Department of Health and Human Services. (2010).
Dietary Guidelines for Americans 2010. 7th Edition, Washington D.C. U.S. Government Printing Office. Available at http://health.gov/dietaryguidelines/2010.asp
39. Dorea, J.G. (2004, July). Mercury and lead during breast-feeding. British Journal of
Nutrition, 92(1), 21-40.
40. EFSA Scientific Committee, European Food Safety Authority. (2010). Scientific Opinion on guidance on Human Health Risk-Benefit Assessment of Foods. EFSA Journal, 8(7):4. [48pp] doi:10.2903/j.efsa.2010.1674. Available at www.efsa.europa.eu.
41. Environmental Protection Agency. (2000). Gulf of Mexico Program. The Occurrence
of Mercury in the Fishery Resources of the Gulf of Mexico. At http://www.epa.gov/gmpo/mercury.html
254
42. Environmental Protection Agency. (2002). Estimated Per Capita Fish Consumption in the Untied States. EPA-821-C-02-003. Washington, D.C., 20460. At http://www.epa.gov/waterscience/fish/consumption_report.pdf>.
43. Environmental Protection Agency. (2005). Regulatory Impact Analysis of the Final
Clean Air Mercury Rule. Research Triangle Park, NC: Office of Air Quality Planning and Standards, Air Quality Strategies and Standards Division. EPA-452/R-05-003. Research Triangle Park, N.C. 27711.
44. European Food Safety Authority. (2005). Opinion of the Scientific Panel on
Contaminants in the Food Chain on a Request from the European Parliament Related to the Safety Assessment of Wild and Farmed Fish. Question N° EFSA-Q-2004-23. Adopted on 22 June 2005. The EFSA Journal, 236, 1 – 118. At http://www.efsa.europa.eu/en/efsajournal/pub/236.htm
45. FAO/WHO Joint Expert Committee on Food Additives (JECFA). (2007). WHO Food Additives Series: 58; Safety Evaluation of certain food additives and contaminants. Prepared by the Sixty-Seventh Meeting of the Joint FAO/WHO Expert Committee on Food Additives (JECFA). World Health Organization, Geneva. At http://whqlibdoc.who.int/publications/2007/9789241660587_eng.pdf.
46. FAO/WHO. (2009). Joint FAO/WHO Expert Consultation on the Risks and Benefits
of Fish Consumption, Call for Experts.
47. FAO/WHO. (2011). Report of the Joint FAO/WHO Expert Consultation on the Risks and Benefits of Fish Consumption. Rome, 25-29 January 2010. FAO Fisheries and Aquaculture Report No. 978, FIPM/R978(En). At www.fao.org/docrep/014/ba0136e/ba0136e00.pdf.
48. Food and Drug Administration. (2009, January). Guidance for Industry, Evidence-
Based Review System for the Scientific Evaluation of Health Claims – Final. At http://www.fda.gov/Food/GuidanceRegulation/ucm073332.htm
49. Food and Drug Administration. (2010, January). Mercury levels in Commercial Fish
and Shellfish. At http://www.fda.gov/Food/FoodborneIllnessContaminants/Metals/ucm115644.htm.
50. Food and Drug Administration and Environmental Protection Agency. (2004). What
You Need to Know About Mercury in Fish and Shellfish; 2004 EPA and FDA Advice For: Women Who Might Become Pregnant, Woman Who Are Pregnant, Nursing Mothers, and Young Children. At http://www.fda.gov/Food/FoodborneIllnessContaminants/BuyStoreServeSafeFood/ucm10591.htm.
51. Freire, C., Ramos, R., Lopez-Espinosa, M-J., Diez, S., Vioque, J., Ballester, F.,
Fernández, M-F. (2010). Hair mercury levels, fish consumption, and cognitive

255
development in preschool children from Granada, Spain. Environmental Research, 110, 96-104.
52. Gibbs, R.H., Jarosewich, E., Windom, H.L. (1974, April). Heavy Metal
Concentrations in Museum Fish Specimens: Effects of Preservatives and Time. Science, 184, 475-477.
53. Grandjean, P., Weihe, P., Jørgensen, P.J., Clarkson, T. Cernichiari, E., Viderø, T.
(1992). Impact of Maternal Seafood Diet on Fetal Exposure to Mercury, Selenium, and Lead. Archives of Environmental Health, 47(3), 185-195.
54. Grandjean, P., Weihe, P., White, R.F. (1995). Milestone Development in Infants
Exposed to Methylmercury from Human Milk. NeuroToxicology 16(1), 27-34.
55. Grandjean, P., Weihe, P., White, R., Debes, F., Araki, S., Yokoyama, K., Murata, K., Sorensen, N., Dahl, R., Jorgensen, P. (1997). Cognitive deficit in 7-year-old children with prenatal exposure to methylmercury. Neurotoxicology and Teratology, 19(6), 417-428.
56. Grandjean, P., Weihe, P., White, R.F., Debes, F. (1998) Cognitive Performance of
Children Prenatally Exposed to “Safe” Levels of Methylmercury. Environmental Research, section A 77, 165-172.
57. Grandjean, P., Budtz-Jørgensen, E., White, R., Jørgensen, P. J., Weihe, P., Debes, F.,
Keiding, N. (1999). Methylmercury Exposure Biomarkers as Indicators of Neurotoxicity in Children Aged 7 Years. American Journal of Epidemiology, 150(3), 301-305.
58. Grandjean, P., Bjerve, K.S., Weihe P.; Steuerwald, U. (2001). Birthweight in a
fishing community: significance of essential fatty acids and food contaminants. International Journal of Epidemiology, 30, 1272-1278.
59. Hacking, I. (1975). The Emergence of Probability. Cambridge: Cambridge
University Press.
60. Harada, M. (1995). Minamata Disease: Methylmercury Poisoning in Japan Caused by Environmental Pollution. Critical Reviews in Toxicology 15(1), 1-24.
61. He, K. & Daviglus, M.L. (2005, March). A few more thoughts about fish and fish
oil. Journal of the American Dietetic Association, 105(3), 350-1.
62. Health Canada, Bureau of Chemical Safety, Food Directorate, Health Products and Food Branch. (2007, March). Human Health Risk Assessment of Mercury in Fish and Health Benefits of Fish Consumption, Appendices I, II, and III.

256
63. Hibbeln, J.R., Davis, J.M., Steer, C., Emmett, P., Rogers, I., Williams, C., Golding, J. (2007, February 17). Maternal seafood consumption in pregnancy and neurodevelopmental outcomes in childhood (ALSPAC study): an observational cohort study. Lancet, 369, 578-85.
64. Hibbeln, J.R. (2007). Omega-3 fatty acid deficiencies and the global burden of
psychiatric disorders. Biologiske skrifter/Det Kongelige Danske videnskabernes selskab, 56, ISBN 987-87-7304-327-1, 25-32.
65. Hight, S.C. & Cheng, J. (2006). Determination of methylmercury and estimation of
total mercury in seafood using high performance liquid chromatography (HPLC) and inductively coupled plasma-mass spectrometry (ICP-MS): Method development and validation. Analytica Chemica Acta, 567, 160-172.
66. Hightower, J.M. & Moore, D. (2003, April). Mercury Levels in High-End
Consumers of Fish. Environmental Health Perspectives, 111(4), 604-608.
67. Hislop, J.S., Collier, T.R., White, G.F., Khathing, D.T., French, E. (1983). The Use of Keratinised Tissues to Monitor the Detailed Exposure of Man to Methyl Mercury from Fish. Chemical Toxicology and Clinical Chemistry of Metals, edited by Brown, S.S. and Savory, J. Academic Press, New York, 145-148.
68. Institute of Medicine, Committee on Nutrient Relationships in Seafood: Selections to
Balance Benefits and Risks. (2006). Seafood Choices, Balancing Benefits and Risks. The National Academies Press, Washington, D.C.
69. Jedrychowski, W., Jankowski, J., Flak, E., Skarupa, A., Mroz, E., Sochacka-Tatara,
E., Lisowska-Miszczyk, I., Szpanowska-Wohn, A., Rauh, V., Skolicki, A., Kaim, I., Perera, F. (2006, June). Effects of Prenatal Exposure to Mercury on Cognitive and Psychomotor Function in One-Year-Old Infants: Epidemiologic Cohort Study in Poland. Annals of Epidemiology, 16(6), 439-47.
70. Jedrychowski, W., Perera, F., Jankowski, J., Rauh, V., Flak, E., Caldwell K.L., Jones,
R.L., Agnieszka, P., Lisowska-Miszczyk, I. (2007). Fish consumption in pregnancy, cord blood mercury level and cognitive and psychomotor development of infants followed over the first three years of life. Krakow epidemiologic study. Environment International, 33, 1057-1062.
71. Kaaks, R.J. (1997). Biochemical Markers as Additional Measurements in Studies of
the Accuracy of Dietary Questionnaire Measurements; Conceptual Issues. American Journal of Clinical Nutrition 65, 1232S-1239S.
72. Kjellström, T., Kennedy, P., Wallis, S., Mantell, C. (1986). Physical and Mental
Development of Children with Prenatal Exposure to Mercury from Fish. Stage 1: Preliminary Tests and Age 4. Solna, Sweden: National Swedish Environmental Protection Board.

257
73. Kjellström, T., Kennedy, P., Wallis, S., Stewart, A., Friberg, L., Lind, B., Pine, T.,
Wutherspoon, T., Mantell, C. (1988, September). Physical and Mental Development of Children with Prenatal Exposure to Methylmercury from Fish. Stage II: Interviews and Psychological Tests at Age 6. (Draft). Solna, Sweden: National Swedish Environmental Protection Board.
74. Kraepiel, A.M.L., Keller, K., Chin, H.B., Malcolm, E.G., Morel, F.M.M. Sources and
Variations of Mercury in Tuna. (2003). Environmental Science and Technology, 37(24) 5,551-8.
75. Kris-Etherton, P.M., Harris, W.S., Appel, L.J. (2002). Fish consumption, fish oil,
omega-3 fatty acids, and cardiovascular disease. Circulation 106 (21), 2747-57. Erratum in: Circulation. (2003, January 28), 107(3), 512. At http://circ.ahajournals.org/cgi/content/full/106/21/2747
76. Lando, A.M., Fein, S.B., Choiniére, C.J. (2012). Awareness of methylmercury in fish
and fish consumption among pregnant and postpartum women and women of childbearing age in the United States. Environmental Research, 116, 85-92.
77. Lederman, S.A., Jones, R.L., Caldwell, K.L., Rauh, V., Sheets, V., Sheets, S.E.,
Tang, D., Viswanathan, S., Becker, M., Stein, J.L., Wang, R.Y., Perera, F.P. (2008, August). Relation between Cord Blood Mercury Levels and Early Child Development in a World Trade Center Cohort. Environmental Health Perpectives, 116(8), 1085-1091.
78. Lindberg, A., Ask Björnberg, K., Vahter, M., Bergland, M. (2004). Exposure to
methylmercury in non-fish eating people in Sweden. Environmental Research, 96, 28-33.
79. Lynch, M.L., Huang, L-S., Cox, C., Strain, J.J., Myers, G.J., Bonham, M., Shamlaye,
C.F., Stokes-Riner, A., Wallace, J.M.W., Duffy, E.M., Clarkson, T.W., Davidson, P.W. (2011). Varying coefficient function models to explore interactions between maternal nutritional status and prenatal methylmercury toxicity in the Seychelles Child Development Nutrition Study. Environmental Research, 111, 75-80.
80. Magos, L. & Clarkson, T.W. (2006). Overview of the clinical toxicity of mercury.
Annals of Clinical Biochemistry, 43, 257-268.
81. Mahaffey, K., Clickner, R., Bodurow, C. (2004). Blood Organic Mercury Intake: National Health and Nutrition Examination Survey, 1999 and 2000. Environmental Health Perspectives, 112, 562-570.
82. Marsh, D.O., Clarkson, T.W., Cox, C., Myers, G.J., Amin-Zaki, L., Al-Tikriti, S.
(1987, October). Fetal Methylmercury Poisoning, Relationship Between

258
Concentration in Single Strands of Maternal Hair and Child Effects. Archives of Neurology, 44, 1017-1022.
83. Marsh, D.O., Clarkson, T.W., Myers, G.W., Davidson, P.W. Cox, C., Cernichiari, E.,
Tanner, M.A., Lednar, W., Shamlaye, C., Choisy, O., Hoareau, C., Berlin, M. (1995). The Seychelles Study of Fetal Methylmercury Exposure and Child Development; Introduction. NeuroToxicology, 16(4), 583-596.
84. Marsh, D.O., Turner, M.D., Smith, J.C., Allen, P., Richdale, N. (1995a). Fetal
Methylmercury Study in Peruvian Fish-Eating Population. NeuroToxicology 16(4), 717-726.
85. McDowell, M.A., Dillon, C.F., Osterloh, J., Bolger, P.M., Pellizzari, E., Fernando, R.,
Montes de Oca, R., , Schober, S. E., Sinks, T., Jones, R. L., Mahaffey, K. R. (2004, August). Hair Mercury Levels in U.S. Children and Women of Childbearing Age: Reference Range Data from NHANES 1999-2000. Environmental Health Perspectives, 112(11), 1165 – 1171.
86. Miller, G.E., Grant, P.M., Kishore, R., Steinkruger, F.J., Roland, F.S., Guinn, V.P.
(1972, March 10). Mercury Concentrations in Museum Specimens of Tuna and Swordfish. Science, 175, 1121-2.
87. Montwill, B. (2007, August 1). E mail to Spiller P.: U.S. and U.K. MeHg Data for Commercial Fish.
88. Montwill, B. (2008, January 9). E mail to Spiller, P: Market share 2005 calculations.
89. Murray, G.K., Jones, P.B., Kuh, D., Richards, M. (2007). Infant Developmental Milestones and Subsequent Cognitive Function. Annals of Neurology, 62(2), 128-136.
90. Myers, G.J., Marsh, D.O., Davidson, P.W., Cox C., Samlaye, C.F., Tanner, M, Choi, A., Cernichiari, E., Choisy, O., Clarkson, T.W. (1995). Main Neurodevelopmental Study of Seychellois Children Following in utero Exposure to Methylmercury from a Maternal Fish Diet: Outcome at Six Months. NeuroToxicology 16(4), 653-664.
91. Myers, G.J., Davidson, P.W., Shamlaye, C.F., Axtell, C.D., Cernichiari, E., Choisy, O., Choi, A., Cox, C., Clarkson, T.W. (1997). Effects of Prenatal Methylmercury Exposure From a High Fish Diet on Developmental Milestones in the Seychelles Child Development Study. NeuroToxicology 18(3), 819-830.
92. Myers, G.J., Davidson, P.W., Cox C., Shamlaye, C.F., Palumbo, D., Cernichiari, E., Sloane-Reeves, J., Wilding, G.E., Kost, J., Huang, L., Clarkson, T.W. (2003, May 17). Prenatal methylmercury exposure from ocean fish consumption in the Seychelles child development study. Lancet, 361, 1686-1692.

259
93. Myers, G.J., Davidson, P.W., Strain, J.J. (2007). Nutrient and Methyl Mercury Exposure from Consuming Fish. The Journal of Nutrition, 137, 2805-2808.
94. National Marine Fisheries Service. (1978). National Marine Fisheries Service Survey of Trace Elements in the Fishery Resource. NOAA Technical Report NMFS SSRF-721.
95. National Marine Fisheries Service, Office of Science and Technology. (2008). Access
to key databases, at http://www.st.nmfs.noaa.gov/st1/index.html.
96. National Marine Fisheries Service, Office of Science and Technology. (2009). Fisheries of the United States 2009.
97. National Research Council, Committee on the Toxicological Effects of Methylmercury. (2000). Toxicological Effects of Methylmercury. The National Academies Press, Washington, D.C.
98. Oken, E., Wright, R.O., Kleinman, K.P., Bellinger. D., Amarasiriwardena, C. J., Hu,
H., Rich-Edwards, J. W., Gillman, M.W. (2005, October). Maternal Fish Consumption, Hair Mercury, and Infant Cognition in a U.S. Cohort. Environmental Health Perspectives, 113(10), 1,376-1,380.
99. Oken, E., Radesky, J.S., Wright, R.O., Bellinger, D.C., Amarasiriwardena, C.J.,
Kleinman, K.P., Hu, H., Gillman, M.W. (2008). Maternal fish Intake during Pregnancy, Blood Mercury Levels, and Child Cognition at Age 3 Years in a US Cohort. American Journal of Epidemiology, 167(10), 1,171-1,181.
100. Oken, E., Østerdal, M. L.M., Gilman, M.W., Knudsen, V.K., Halldorsson, M.S.,
Bellinger, D.C., Hadders-Algra, M., Michaelsen, K.F., Olsen, S.F. (2008a). Associations of maternal fish intake during pregnancy and breastfeeding duration with attainment of developmental milestones in early childhood: a study from the Danish National Birth Cohort. American Journal of Clinical Nutrition, 88, 789-796.
101. Paustenbach, D.J. (2000). The practice of exposure assessment: A state-of-the-art
review. Journal of Toxicology and Environmental Health B 3, 179-291.
102. Potischman, N. (2003). Biologic and Methodologic Issues for Nutritional Biomarkers. The Journal of Nutrition 133(8), 8755-8805.
103. Ralston, N.V.C., Raymond, L.J. (2010). Dietary selenium’s protective effects against
methylmercury toxicity. Toxicology 278, 112-123.
104. Rescher, N. (1993). Probability Logic: A Non-Truth-Functional system. In: Many-Valued Logic, 2nd Ed. Gregg Revivals, Aldershot. 184-187.

260
105. Risher, J.F., De Rosa, C.T., Murray, H.E., Jones, D.E. (2003). Joint PCB-Methylmercury Exposures and Neurobehavioral Outcomes. Human and Ecological Risk Assessment, 9(4), 1003-1010.
106. Sagiv, S.K., Thurston, S.W., Bellinger, D.C., Amarasiriwardena, C., Korrik, S.A.
(2012). Prenatal Exposure to Mercury and Fish Consumption During Pregnancy and Attention-Deficit/Hyperactivity Disorder-Related Behavior in Children. Archives of Pediatrics & Adolescent Medicine, 166(12), 1123-1131.
107. Shamlaye, C.F., Marsh, D.O., Myers, G.J., Cox, C., Davidson, P.W., Choisy, O.,
Cernichiari, E., Choi, A., Tanner, M.A., Clarkson, T.W. (1995). The Seychelles Child Development Study on Neurodevelopmental Outcomes in Children Following in utero Exposure to Methylmercury from a Maternal Fish Diet: Background and Demographics. NeuroToxicology, 16(4), 597-612.
108. Sherlock, J.C., Hislop, J.E., Evans, W.H., Collier, T.R. (1982). Duplication Diet
Study on Mercury Intake by Fish Consumers in the United Kingdom. Archives of Environmental Health, 37(5), 271-278.
109. Sherlock, J., Hislop, D., Newton, G., Topping, G., Whittle, K. (1984). Elevation of
mercury in human blood from controlled ingestion of methylmercury in fish. Human Toxicology, 3, 117-131.
110. Sherlock, J.C. & Quinn, M. (1988). Underestimation of dose-response relationship
with particular reference to the relationship between the dietary intake of mercury and its concentration in blood. Human Toxicology, 7, 129-132.
111. Shimshack, J.P., & Ward, M.P. (2010). Mercury advisories and household health
trade-offs. Journal of Health Economics, 29, 674-685.
112. Strain, J.J., Davidson, P.W., Bonham, M.P., Duffy, E.M., Stokes-Riner, A., Thurston, S.W., Wallace, J.M.W., Robson, P.J., Shamlaye C.F., Georger, L.A., Sloane-Reeves, J., Cernichiari, E., Canfield, R.L., Cox, C., Huang, L.S., Janciuras, J., Myers, G.J., Clarkson, T.W. (2008). Associations of maternal long-chain polyunsaturated fatty acids, methyl mercury, and infant development in the Seychelles Child Development Nutrition Study. NeuroToxicology, 29, 776-782.
113. Sunderland, E.M., Krabbenhoft, D.P., Moreau, J.W., Strode, S.A., Landing, W.M.
(2009). Mercury sources, distribution, and bioavailability in the North Pacific Ocean: Insights from data and models. Global Biogeochemical Cycles, 23, DOI:10.1029/2008GB003425.
114. Suzuki, K., Nakai, K., Sugawara, T., Nakamura, T., Ohba, T., Shimada, M.,
Hosokawa, T., Okamura, K., Sakai, T., Kurokawa, N., Murata, K., Satoh, C., Satoh, H. (2010). Neurobehavioral effects of prenatal exposure to methylmercury and
261
PCBs, and seafood intake: Neonatal behavioral assessment scale results of Tohoku study of child development. Environmental Research, 110, 699-704.
115. Van Wijngaarden, E., Thurston, S.W., Myers, G.J., Strain, J.J., Weiss, B., Zarcone,
T., Watson, G.E., Zareba, G., McSorley, E.M., Mulhern, M.S., Yeates, A.J., Henderson, J., Gedeon, J. (2013). Prenatal methyl mercury exposure in relation to neurodevelopment and behavior at 19 years of age in the Seychelles Child Development Study. Neurotoxicology and Teratology, 39, 19-25.
116. Van Wijngaarden E., Davidson, P.W., Smith, T.H., Evans, K., Yost, K., Love, T.,
Thurston, S.W., Watson, G.E., Zareba, G., Burns, C.M., Shamlaye, C.F., Myers, G.J. (2013a). Autism Spectrum Disorder Phenotypes and Prenatal Exposure to Methylmercury. Epidemiology, 24(5), 1-9.
117. Weihe, P., Grandjean, P., Debes, F., White, R. (1996). Health Implications for Faroe
Islanders of Heavy Metals and PCBs from Pilot Whales. The Science of the Total Environment, 186, 141-148.
118. Williams, C., Birch, E.E., Emmett, P.M., Northstone, K., Avon Longitudinal Study of
Pregnancy and Childhood Study Team. (2001, February). Stereoacuity at age 3.5 y in children born full-term is associated with prenatal and postnatal dietary factors: a report from a population-based cohort study. American Journal of Clinical Nutrition, 73(2), 316-22.
119. World Health Organization. (1990). International Programme on Chemical Safety,
Environmental Health Criteria 101: Methylmercury. World Health Organization, Geneva. At http://www.inchem.org/documents/ehc/ehc/ehc101.htm.
120. World Health Organization. (2006). WHO Motor Development Study: Windows of
achievement for six gross motor development milestones. WHO Multicentre Growth Reference Study Group. Acta Paediatrica, Suppl 450, 86-95.