Embed Size (px)
DESCRIPTION
This is the sixth report that has been prepared under the ESCAP/ADB/UNDP regional partnership programme on achieving the Millennium Development Goals in Asia and th Pacific region. The report continues to be the most authoritative regional assessment of the progress so far achieved and obstacles encountered in achieving the MDGs in Asia and the Pacific region. It provides a basic for conducting policy dialogue at senior level and generating regional consensus on some of the most pressing development issues facing the region.
Citation preview
Accelerating Equitable Achievement of the MDGs Closing Gaps in Health and Nutrition Outcomes

Contents
Foreword vii
Acknowledgements viii
Abbreviations ix
OVERVIEW Accelerating Equitable Achievement of the MDGs: 1Closing Gaps in Health and Nutrition Outcomes
Diagnosing disparities 1
Closing the health gaps 3
Mutual inspiration 5
CHAPTER I
MDGs in Asia and the Pacific: where we stand 7
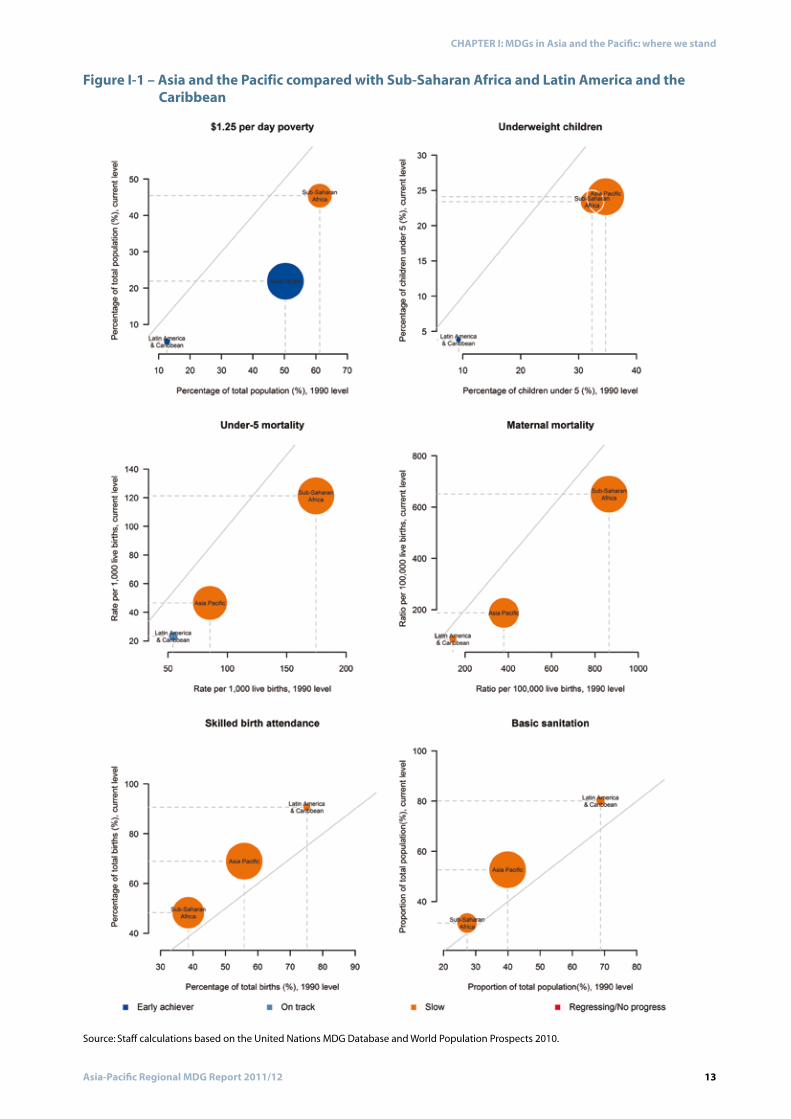
Asia and the Pacific on the global stage 12
Health – diagnosing the deficits 12
Number of people in off-track countries who will gain 27if targets are reached
Chapter I Endnote 28
CHAPTER II
Diagnosing disparities 29
The extent of disparities 30
Measuring disparities between countries and over time 30
Why some countries do better than others in health 35
Accounting for disparities 40
Disparities within countries 41
Explaining disparities within countries 46
Mining the data 55
Chapter II Endnotes 55
CHAPTER III
Closing the health gaps 57
Mutual inspiration 72
Chapter III Endnotes 73
CHAPTER IV
Way Forward 75 MDGs Beyond 2015 76
Chapter IV Endnotes 77
BIBLIOGRAPHY 78
STATISTICAL APPENDIX 00
Technical Note 1: MDG progress classification 81Technical Note 2: Factors explaining disparities between 85 countries Technical Note 3: Accounting for disparities between 88 countries Technical Note 4: Analysis of disparities within countries 90Technical Note 5: Selected MDG Indicators 97
BOXES
TABLES
FIGURES
viiAsia-Pacific Regional MDG Report 2011/12
Foreword
Noeleen Heyzer Bindu N. Lohani Ajay Chhibber
viii Asia-Pacific Regional MDG Report 2011/12
Acknowledgements
ixAsia-Pacific Regional MDG Report 2011/12
Abbreviations

1Asia-Pacific Regional MDG Report 2011/12
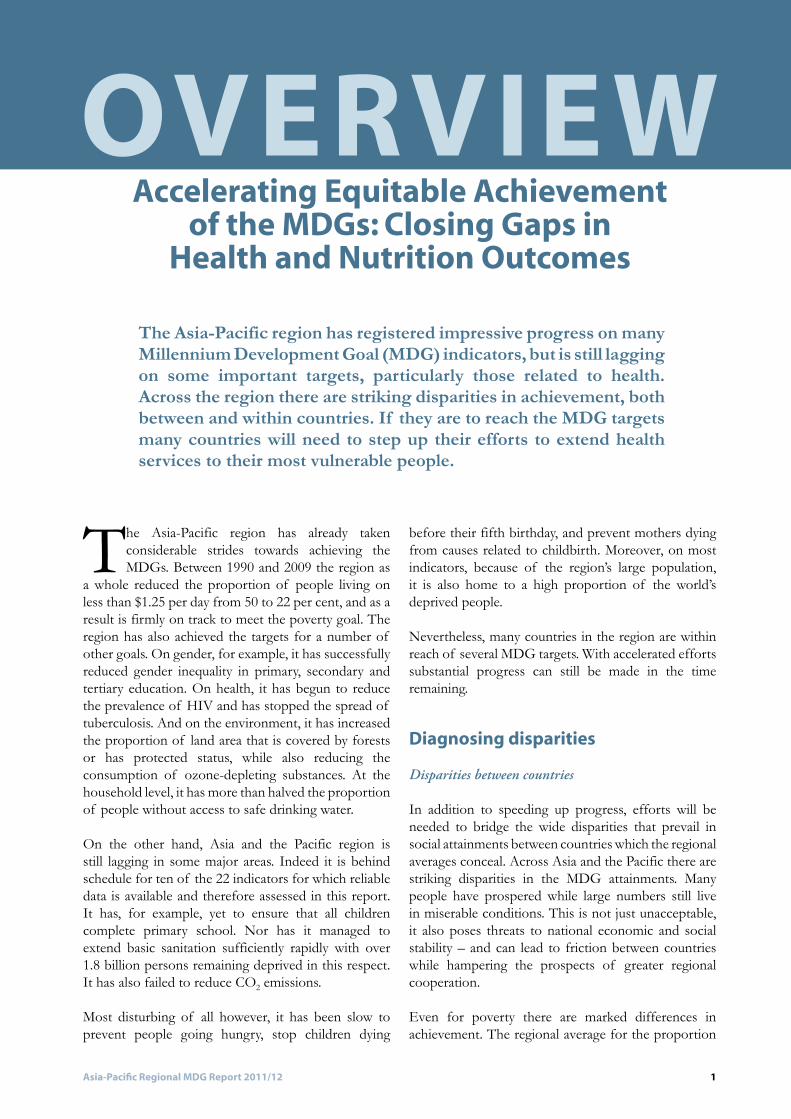
OVERVIEW
Diagnosing disparities
Disparities between countries
Accelerating Equitable Achievement of the MDGs: Closing Gaps in
Health and Nutrition Outcomes
2 Asia-Pacific Regional MDG Report 2011/12
OVERVIEW: Accelerating equitable achievement of the MDGs: closing the gaps in health and nutrition
Disparities within countries
3Asia-Pacific Regional MDG Report 2011/12
OVERVIEW: Accelerating equitable achievement of the MDGs: closing the gaps in health and nutrition
Closing the health gaps
1. Address the social determinants of health
2. Expand access to primary health care
3. Integrate child and maternal health into a continuum of care
4 Asia-Pacific Regional MDG Report 2011/12
OVERVIEW: Accelerating equitable achievement of the MDGs: closing the gaps in health and nutrition
4. Act on the health needs of the urban poor
5. Devise sustainable financial strategies
6. Improve the governance of health systems
7. Enhance the affordability of medicines through generics
5Asia-Pacific Regional MDG Report 2011/12
OVERVIEW: Accelerating equitable achievement of the MDGs: closing the gaps in health and nutrition
8. Strengthen international partnership and regional cooperation
Mutual inspiration

7Asia-Pacific Regional MDG Report 2011/12
CHAPTER IMDGs in Asia and the Pacific:
where we stand
8 Asia-Pacific Regional MDG Report 2011/12
CHAPTER I: MDGs in Asia and the Pacific: where we stand
Box I-1 – Ensuring comparable data
Source: Most of this box is based on E/ESCAP/CST(2)/INF/5, available at http://www.unescap.org/stat/cst/2/CST2-INF5.pdf, paragraphs 4-8. Annex I of E/ESCAP/CST(2)/INF/5 lists the international agencies responsible for the compilation of international data on the official MDG indicators.
9Asia-Pacific Regional MDG Report 2011/12
CHAPTER I: MDGs in Asia and the Pacific: where we stand
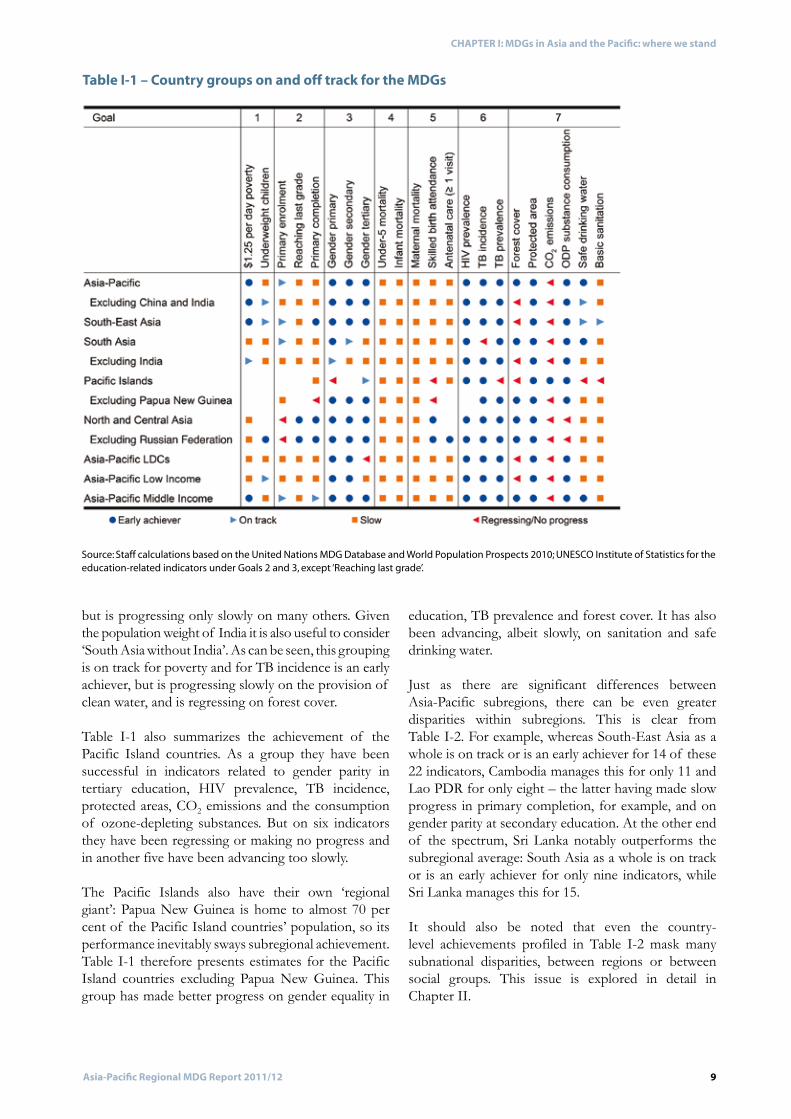
Source: Staff calculations based on the United Nations MDG Database and World Population Prospects 2010; UNESCO Institute of Statistics for the education-related indicators under Goals 2 and 3, except ‘Reaching last grade’.
Table I-1 – Country groups on and off track for the MDGs
10 Asia-Pacific Regional MDG Report 2011/12
CHAPTER I: MDGs in Asia and the Pacific: where we stand
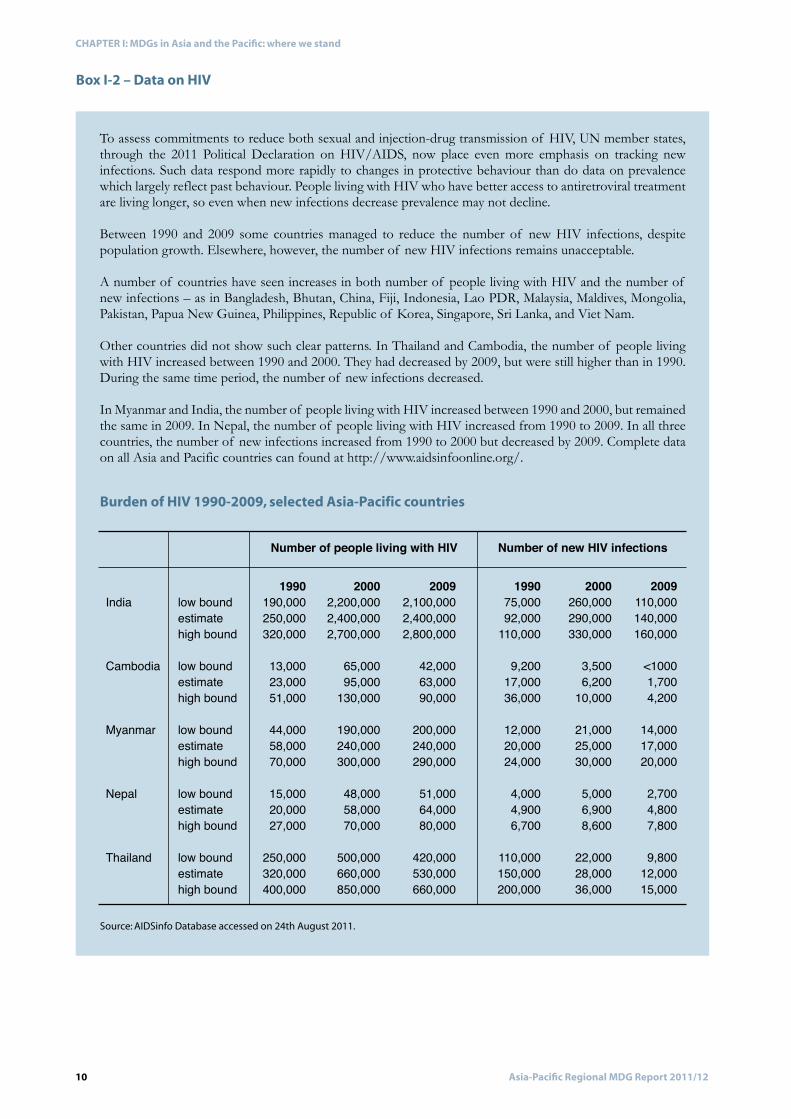
Box I-2 – Data on HIV
Source: AIDSinfo Database accessed on 24th August 2011.
Burden of HIV 1990-2009, selected Asia-Pacific countries
11Asia-Pacific Regional MDG Report 2011/12
CHAPTER I: MDGs in Asia and the Pacific: where we stand
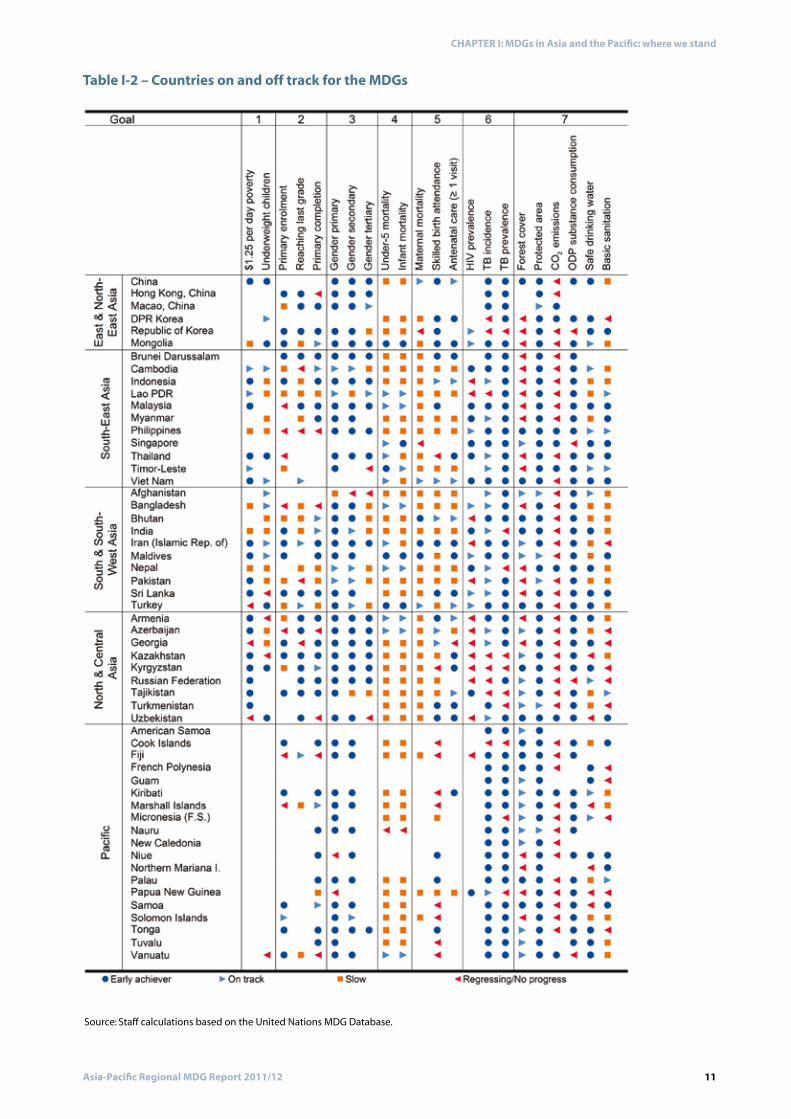
Table I-2 – Countries on and off track for the MDGs
Source: Staff calculations based on the United Nations MDG Database.
12 Asia-Pacific Regional MDG Report 2011/12
CHAPTER I: MDGs in Asia and the Pacific: where we stand
Asia and the Pacific on the global stage
Health – diagnosing the deficits
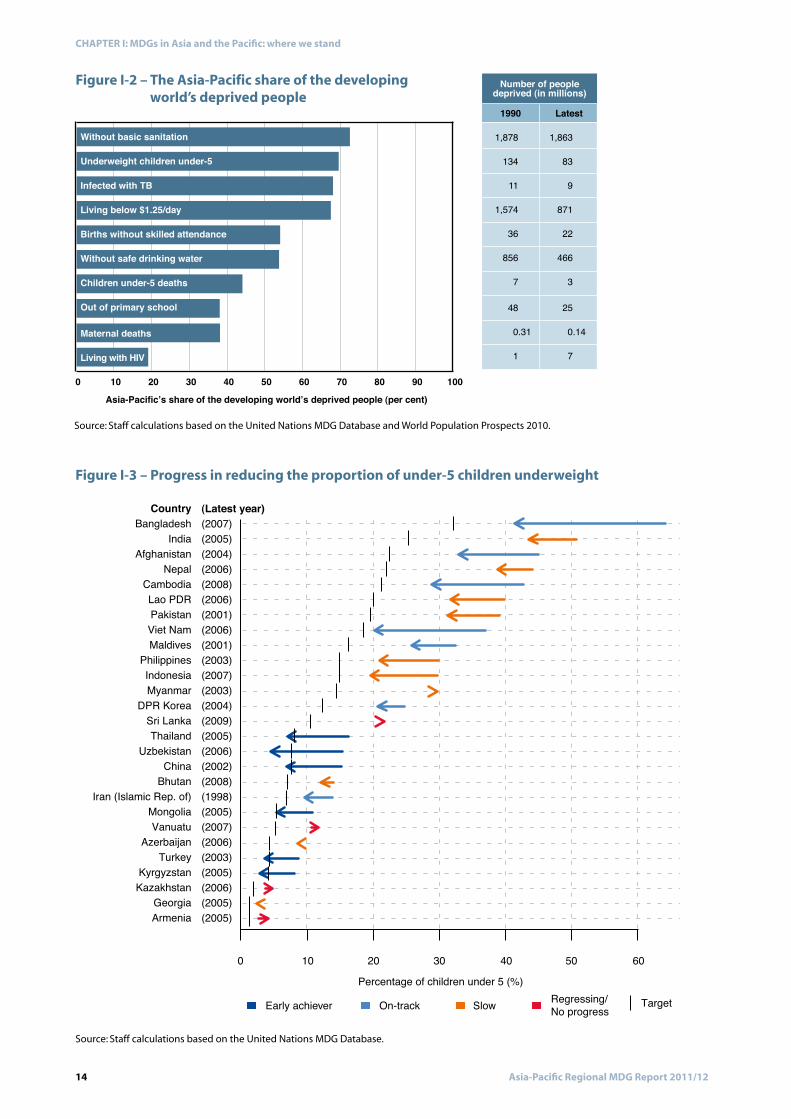
Feeding our children
Preventing child deaths
13Asia-Pacific Regional MDG Report 2011/12
CHAPTER I: MDGs in Asia and the Pacific: where we stand
Source: Staff calculations based on the United Nations MDG Database and World Population Prospects 2010.
Figure I-1 – Asia and the Pacific compared with Sub-Saharan Africa and Latin America and the Caribbean
14 Asia-Pacific Regional MDG Report 2011/12
CHAPTER I: MDGs in Asia and the Pacific: where we stand
Figure I-3 – Progress in reducing the proportion of under-5 children underweight
Source: Staff calculations based on the United Nations MDG Database.
CountryBangladesh
IndiaAfghanistan
NepalCambodiaLao PDRPakistanViet NamMaldives
PhilippinesIndonesiaMyanmar
DPR KoreaSri LankaThailand
UzbekistanChina
BhutanIran (Islamic Rep. of)
MongoliaVanuatu
AzerbaijanTurkey
KyrgyzstanKazakhstan
GeorgiaArmenia
(Latest year)(2007)(2005)(2004)(2006)(2008)(2006)(2001)(2006)(2001)(2003)(2007)(2003)(2004)(2009)(2005)(2006)(2002)(2008)(1998)(2005)(2007)(2006)(2003)(2005)(2006)(2005)(2005)
Percentage of children under 5 (%)0 10 20 30 40 50 60
Early achiever On-track Slow Regressing/No progress Target
Figure I-2 – The Asia-Pacific share of the developing world’s deprived people
Source: Staff calculations based on the United Nations MDG Database and World Population Prospects 2010.
15Asia-Pacific Regional MDG Report 2011/12
CHAPTER I: MDGs in Asia and the Pacific: where we stand
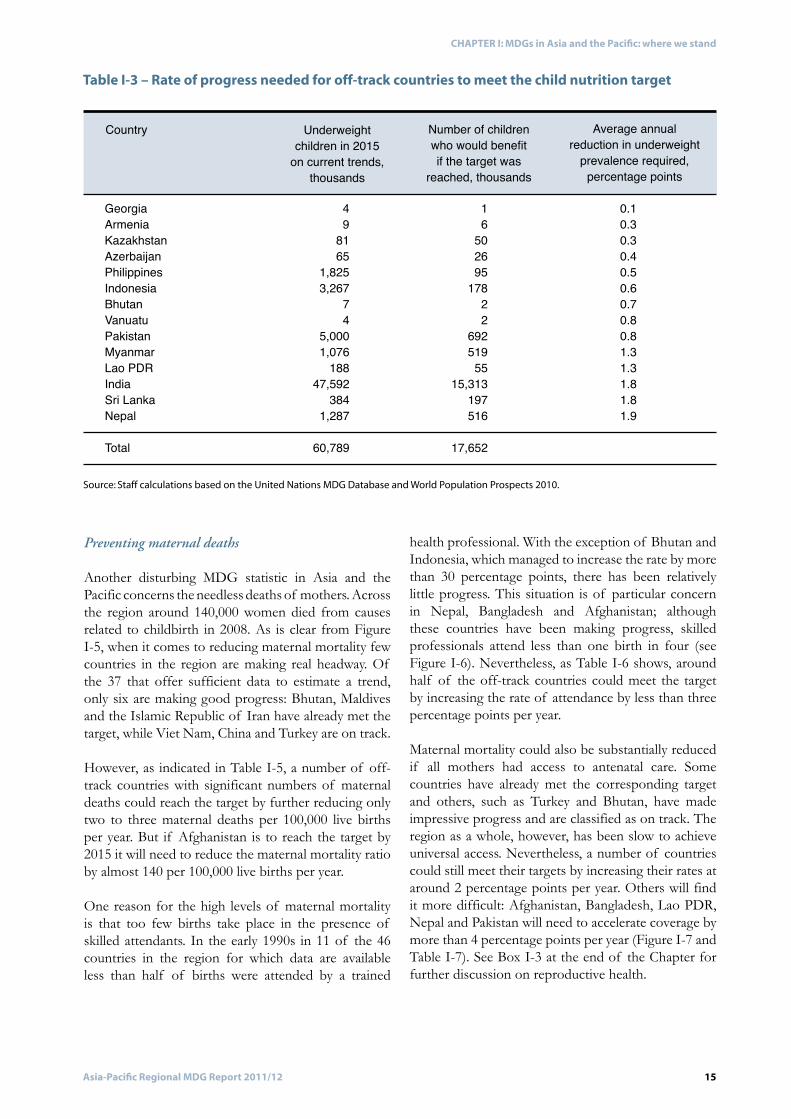
Table I-3 – Rate of progress needed for off-track countries to meet the child nutrition target
Source: Staff calculations based on the United Nations MDG Database and World Population Prospects 2010.
Preventing maternal deaths
16 Asia-Pacific Regional MDG Report 2011/12
CHAPTER I: MDGs in Asia and the Pacific: where we stand
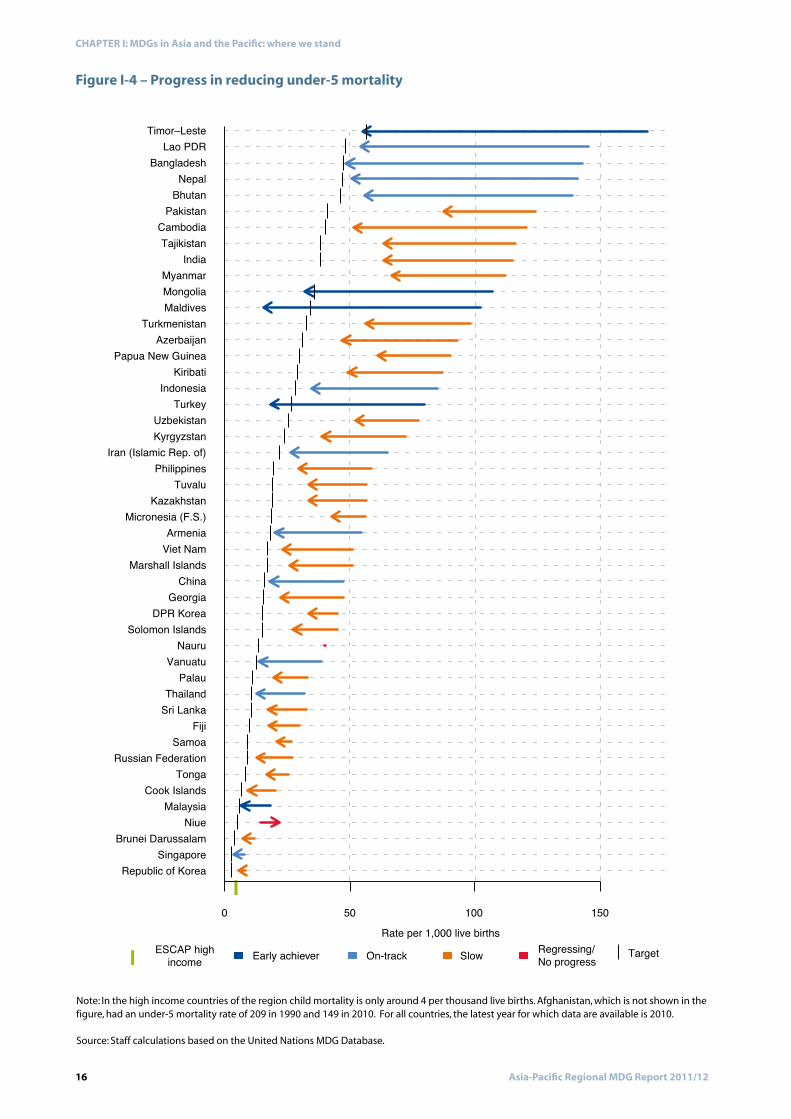
Figure I-4 – Progress in reducing under-5 mortality
Timor–LesteLao PDR
BangladeshNepal
BhutanPakistan
CambodiaTajikistan
IndiaMyanmarMongoliaMaldives
TurkmenistanAzerbaijan
Papua New GuineaKiribati
IndonesiaTurkey
UzbekistanKyrgyzstan
Iran (Islamic Rep. of)Philippines
TuvaluKazakhstan
Micronesia (F.S.)Armenia
Viet NamMarshall Islands
ChinaGeorgia
DPR KoreaSolomon Islands
NauruVanuatu
PalauThailand
Sri LankaFiji
SamoaRussian Federation
TongaCook Islands
MalaysiaNiue
Brunei DarussalamSingapore
Republic of Korea
0 50 100 150Rate per 1,000 live births
Early achieverESCAP highincome On-track Slow Regressing/
No progress Target
Note: In the high income countries of the region child mortality is only around 4 per thousand live births. Afghanistan, which is not shown in the figure, had an under-5 mortality rate of 209 in 1990 and 149 in 2010. For all countries, the latest year for which data are available is 2010.
Source: Staff calculations based on the United Nations MDG Database.
17Asia-Pacific Regional MDG Report 2011/12
CHAPTER I: MDGs in Asia and the Pacific: where we stand
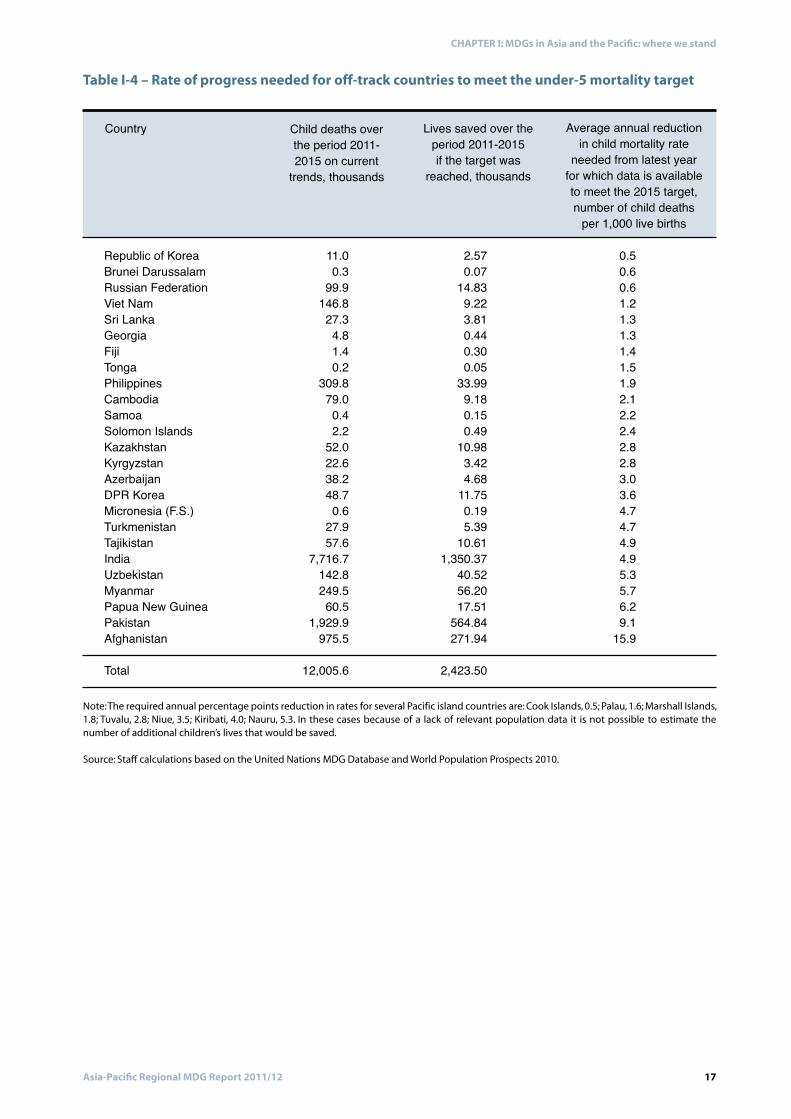
Table I-4 – Rate of progress needed for off-track countries to meet the under-5 mortality target
Note: The required annual percentage points reduction in rates for several Pacific island countries are: Cook Islands, 0.5; Palau, 1.6; Marshall Islands, 1.8; Tuvalu, 2.8; Niue, 3.5; Kiribati, 4.0; Nauru, 5.3. In these cases because of a lack of relevant population data it is not possible to estimate the number of additional children’s lives that would be saved.
Source: Staff calculations based on the United Nations MDG Database and World Population Prospects 2010.
18 Asia-Pacific Regional MDG Report 2011/12
CHAPTER I: MDGs in Asia and the Pacific: where we stand
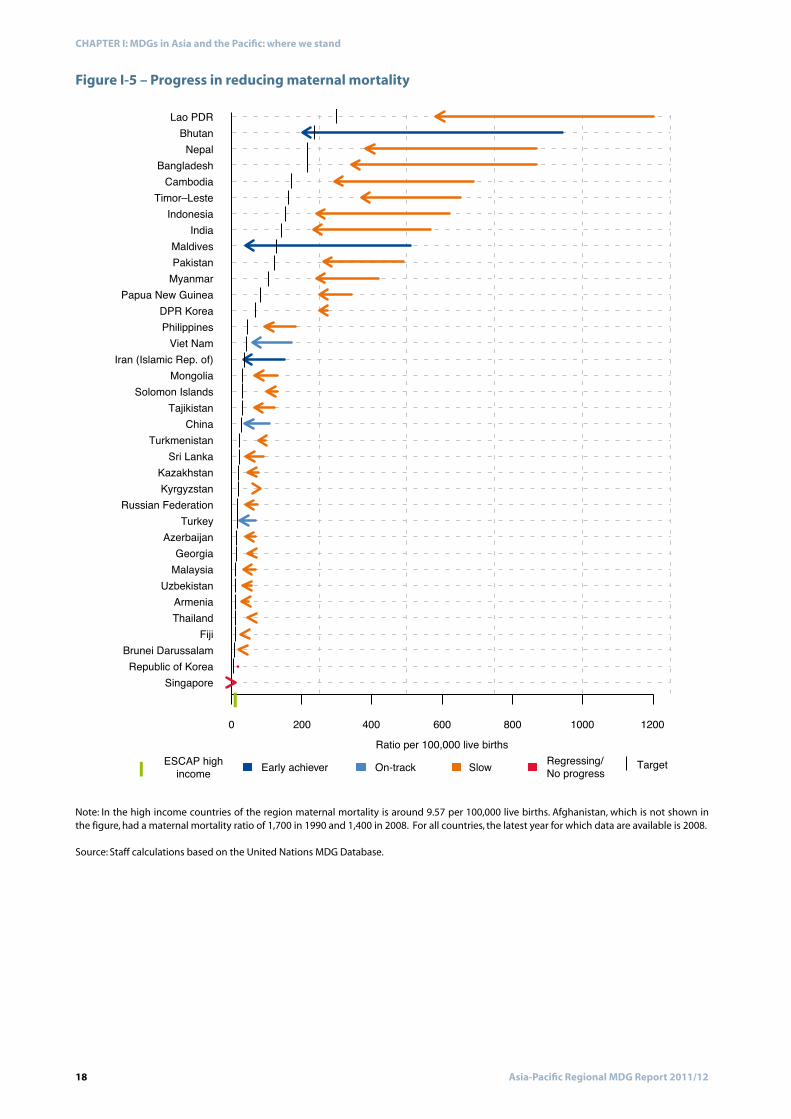
Figure I-5 – Progress in reducing maternal mortality
Note: In the high income countries of the region maternal mortality is around 9.57 per 100,000 live births. Afghanistan, which is not shown in the figure, had a maternal mortality ratio of 1,700 in 1990 and 1,400 in 2008. For all countries, the latest year for which data are available is 2008.
Source: Staff calculations based on the United Nations MDG Database.
Ratio per 100,000 live births0 200 400 600 800 1000 1200
Early achieverESCAP highincome On-track Slow Regressing/
No progress Target
Lao PDRBhutan
NepalBangladesh
CambodiaTimor–Leste
IndonesiaIndia
MaldivesPakistan
MyanmarPapua New Guinea
DPR KoreaPhilippines
Viet NamIran (Islamic Rep. of)
MongoliaSolomon Islands
TajikistanChina
TurkmenistanSri Lanka
KazakhstanKyrgyzstan
Russian FederationTurkey
AzerbaijanGeorgia
MalaysiaUzbekistan
ArmeniaThailand
FijiBrunei DarussalamRepublic of Korea
Singapore
19Asia-Pacific Regional MDG Report 2011/12
CHAPTER I: MDGs in Asia and the Pacific: where we stand
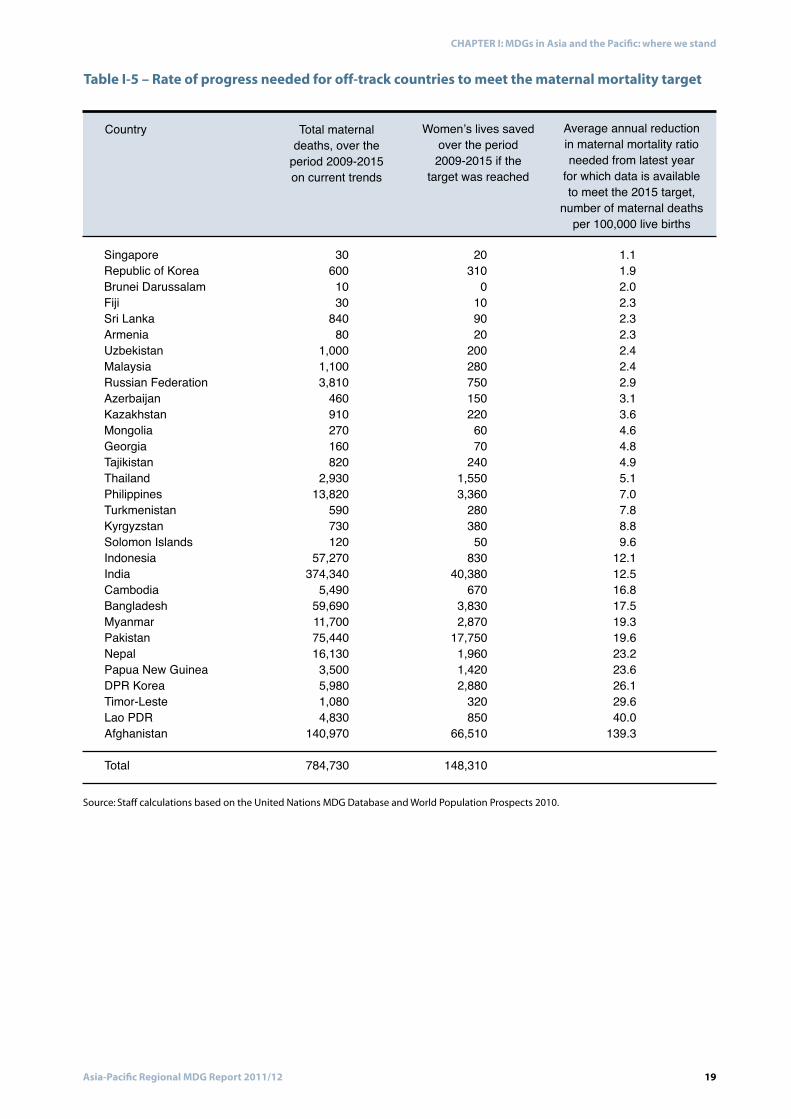
Table I-5 – Rate of progress needed for off-track countries to meet the maternal mortality target
Source: Staff calculations based on the United Nations MDG Database and World Population Prospects 2010.
20 Asia-Pacific Regional MDG Report 2011/12
CHAPTER I: MDGs in Asia and the Pacific: where we stand
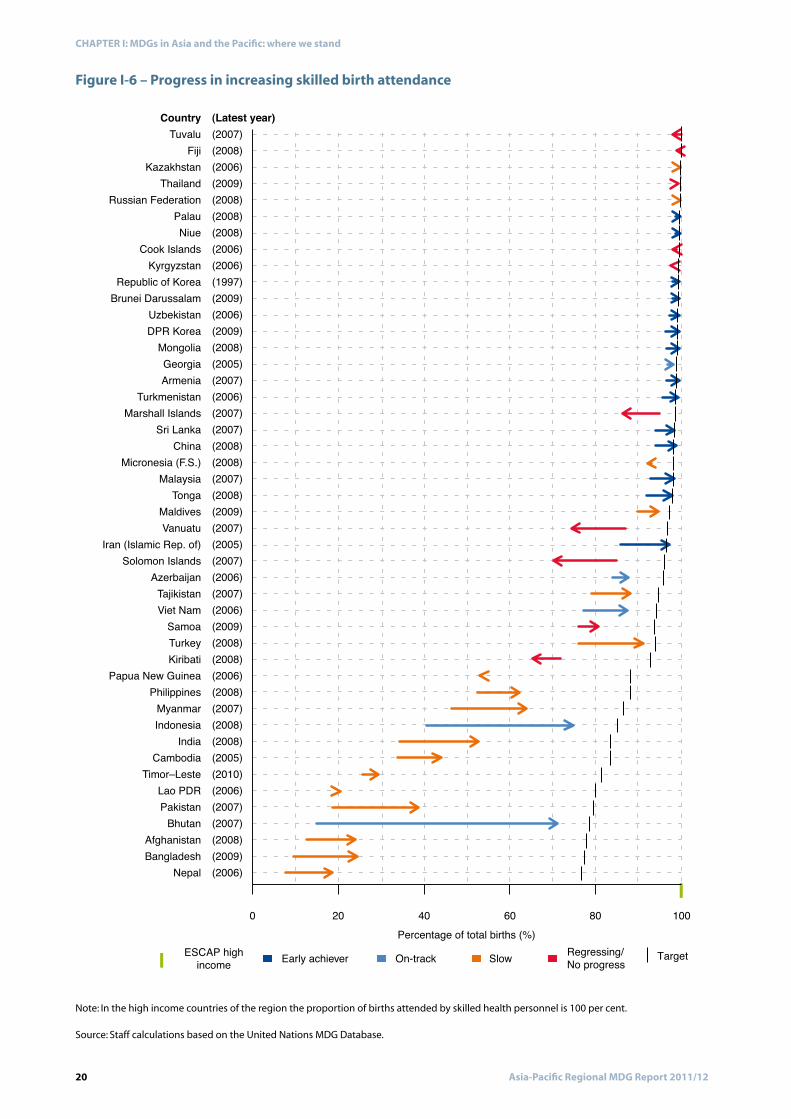
Note: In the high income countries of the region the proportion of births attended by skilled health personnel is 100 per cent.
Source: Staff calculations based on the United Nations MDG Database.
Figure I-6 – Progress in increasing skilled birth attendance
0 20 40 60 80 100
Early achieverESCAP highincome On-track Slow Regressing/
No progress Target
CountryTuvalu
Fiji Kazakhstan
ThailandRussian Federation
PalauNiue
Cook IslandsKyrgyzstan
Republic of KoreaBrunei Darussalam
UzbekistanDPR Korea
MongoliaGeorgiaArmenia
TurkmenistanMarshall Islands
Sri LankaChina
Micronesia (F.S.)Malaysia
TongaMaldivesVanuatu
Iran (Islamic Rep. of)Solomon Islands
AzerbaijanTajikistanViet Nam
SamoaTurkeyKiribati
Papua New GuineaPhilippines
MyanmarIndonesia
IndiaCambodia
Timor–LesteLao PDRPakistan
BhutanAfghanistanBangladesh
Nepal
(Latest year) (2007)(2008)(2006)(2009)(2008)(2008)(2008)(2006)(2006)(1997)(2009)(2006)(2009)(2008)(2005)(2007)(2006)(2007)(2007)(2008)(2008)(2007)(2008)(2009)(2007)(2005)(2007)(2006)(2007)(2006)(2009)(2008)(2008)(2006)(2008)(2007)(2008)(2008)(2005)(2010)(2006)(2007)(2007)(2008)(2009)(2006)
Percentage of total births (%)
21Asia-Pacific Regional MDG Report 2011/12
CHAPTER I: MDGs in Asia and the Pacific: where we stand
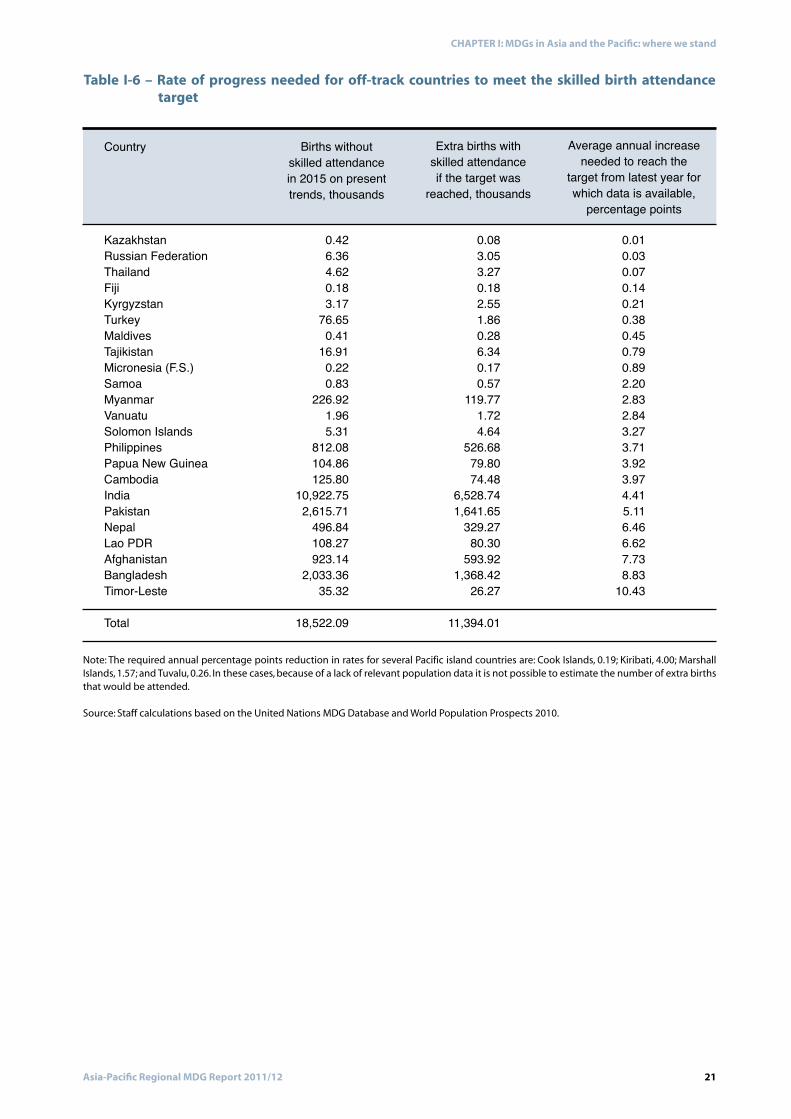
Table I-6 – Rate of progress needed for off-track countries to meet the skilled birth attendance target
Note: The required annual percentage points reduction in rates for several Pacific island countries are: Cook Islands, 0.19; Kiribati, 4.00; Marshall Islands, 1.57; and Tuvalu, 0.26. In these cases, because of a lack of relevant population data it is not possible to estimate the number of extra births that would be attended.
Source: Staff calculations based on the United Nations MDG Database and World Population Prospects 2010.
22 Asia-Pacific Regional MDG Report 2011/12
CHAPTER I: MDGs in Asia and the Pacific: where we stand
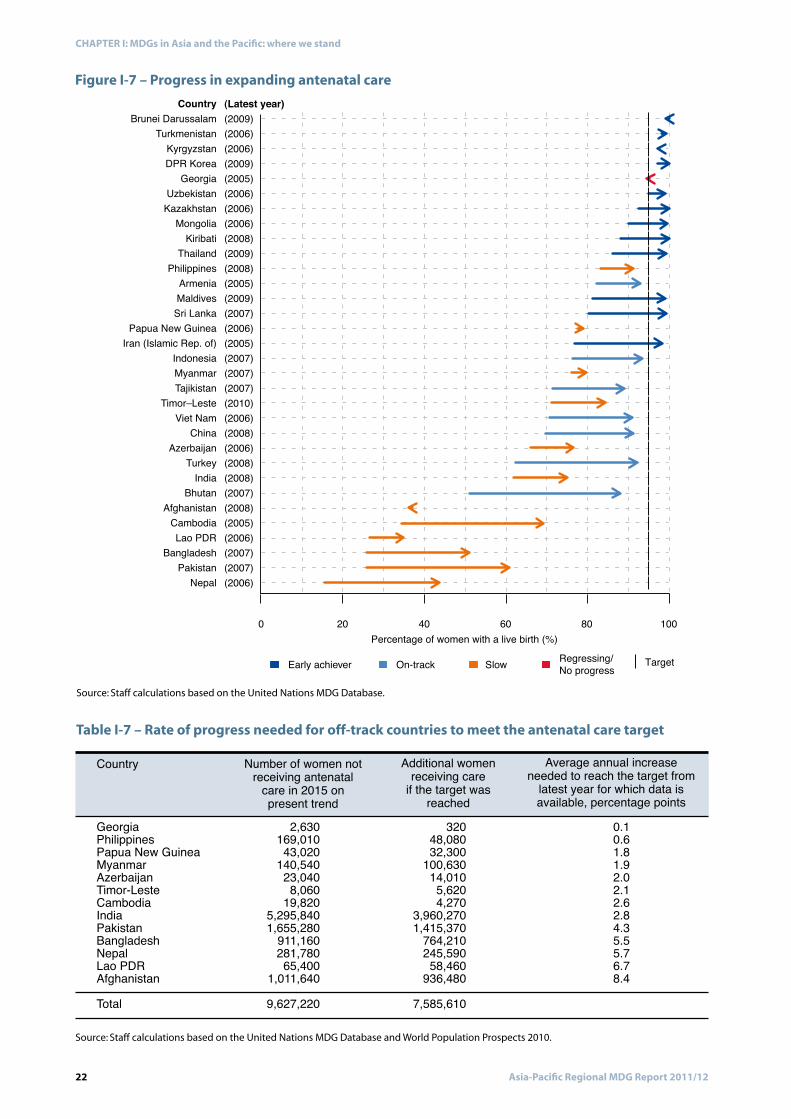
Figure I-7 – Progress in expanding antenatal care
Source: Staff calculations based on the United Nations MDG Database.
0 20 40 60 80 100
Early achiever On-track Slow Regressing/No progress Target
Percentage of women with a live birth (%)
CountryBrunei Darussalam
TurkmenistanKyrgyzstanDPR Korea
GeorgiaUzbekistan
KazakhstanMongolia
KiribatiThailand
PhilippinesArmeniaMaldives
Sri LankaPapua New Guinea
Iran (Islamic Rep. of)IndonesiaMyanmarTajikistan
Timor–LesteViet Nam
ChinaAzerbaijan
TurkeyIndia
BhutanAfghanistan
CambodiaLao PDR
BangladeshPakistan
Nepal
(Latest year)(2009)(2006)(2006)(2009)(2005)(2006)(2006)(2006)(2008)(2009)(2008)(2005)(2009)(2007)(2006)(2005)(2007)(2007)(2007)(2010)(2006)(2008)(2006)(2008)(2008)(2007)(2008)(2005)(2006)(2007)(2007)(2006)
Table I-7 – Rate of progress needed for off-track countries to meet the antenatal care target
Source: Staff calculations based on the United Nations MDG Database and World Population Prospects 2010.
23Asia-Pacific Regional MDG Report 2011/12
CHAPTER I: MDGs in Asia and the Pacific: where we stand
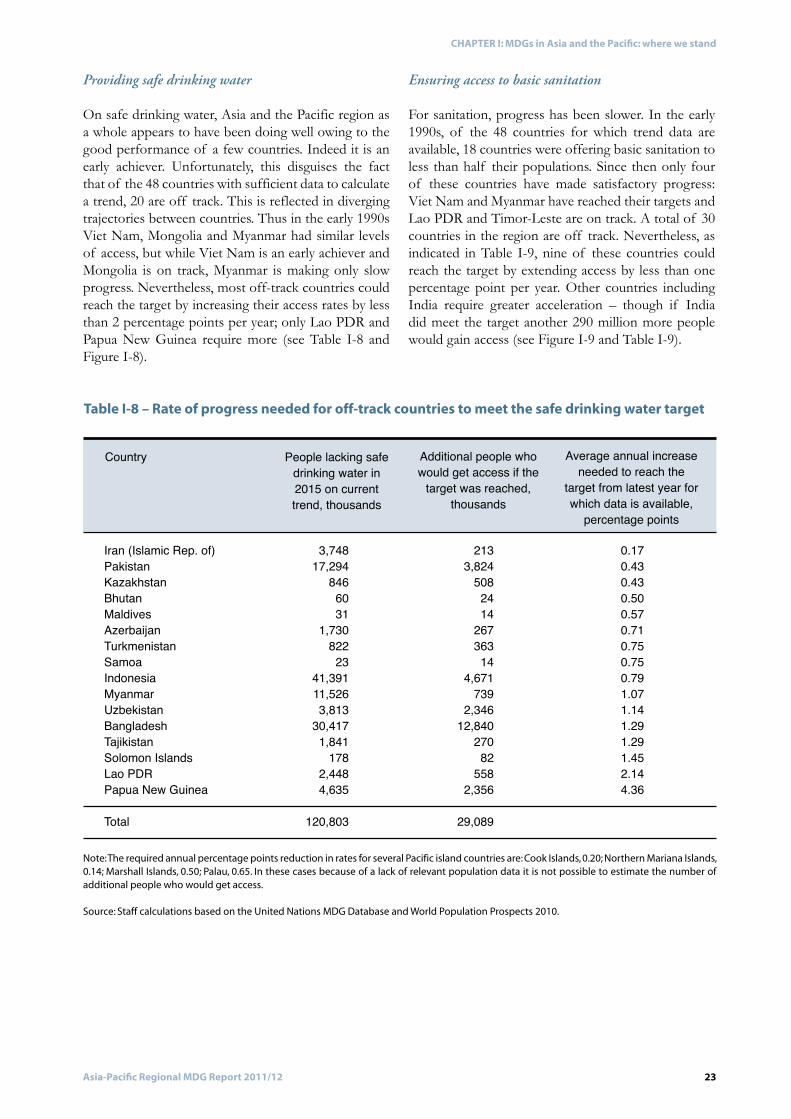
Table I-8 – Rate of progress needed for off-track countries to meet the safe drinking water target
Note: The required annual percentage points reduction in rates for several Pacific island countries are: Cook Islands, 0.20; Northern Mariana Islands, 0.14; Marshall Islands, 0.50; Palau, 0.65. In these cases because of a lack of relevant population data it is not possible to estimate the number of additional people who would get access.
Source: Staff calculations based on the United Nations MDG Database and World Population Prospects 2010.
Providing safe drinking water Ensuring access to basic sanitation
24 Asia-Pacific Regional MDG Report 2011/12
CHAPTER I: MDGs in Asia and the Pacific: where we stand
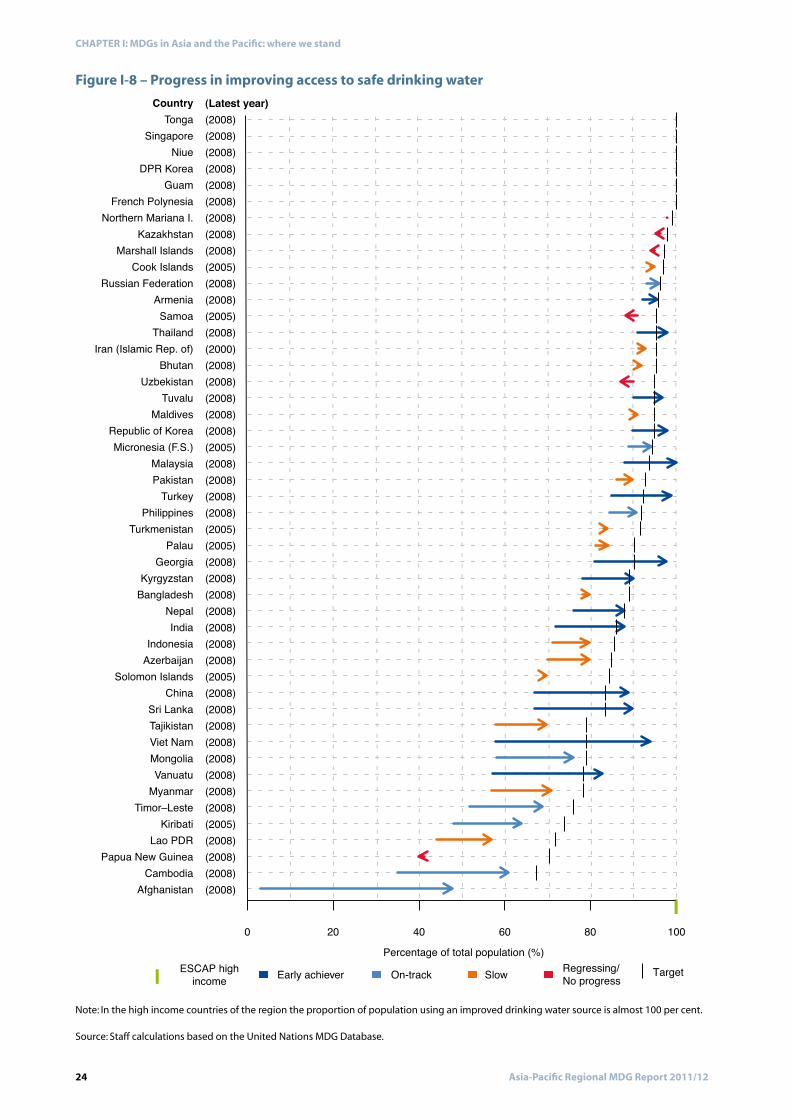
Figure I-8 – Progress in improving access to safe drinking water
Note: In the high income countries of the region the proportion of population using an improved drinking water source is almost 100 per cent.
Source: Staff calculations based on the United Nations MDG Database.
0 20 40 60 80 100
Early achieverESCAP highincome On-track Slow Regressing/
No progress TargetPercentage of total population (%)
CountryTonga
SingaporeNiue
DPR KoreaGuam
French PolynesiaNorthern Mariana I.
KazakhstanMarshall Islands
Cook IslandsRussian Federation
ArmeniaSamoa
ThailandIran (Islamic Rep. of)
BhutanUzbekistan
TuvaluMaldives
Republic of KoreaMicronesia (F.S.)
MalaysiaPakistan
TurkeyPhilippines
TurkmenistanPalau
GeorgiaKyrgyzstan
BangladeshNepalIndia
IndonesiaAzerbaijan
Solomon IslandsChina
Sri LankaTajikistanViet NamMongoliaVanuatu
MyanmarTimor–Leste
KiribatiLao PDR
Papua New GuineaCambodia
Afghanistan
(Latest year)(2008)(2008)(2008)(2008)(2008)(2008)(2008)(2008)(2008)(2005)(2008)(2008)(2005)(2008)(2000)(2008)(2008)(2008)(2008)(2008)(2005)(2008)(2008)(2008)(2008)(2005)(2005)(2008)(2008)(2008)(2008)(2008)(2008)(2008)(2005)(2008)(2008)(2008)(2008)(2008)(2008)(2008)(2008)(2005)(2008)(2008)(2008)(2008)
25Asia-Pacific Regional MDG Report 2011/12
CHAPTER I: MDGs in Asia and the Pacific: where we stand
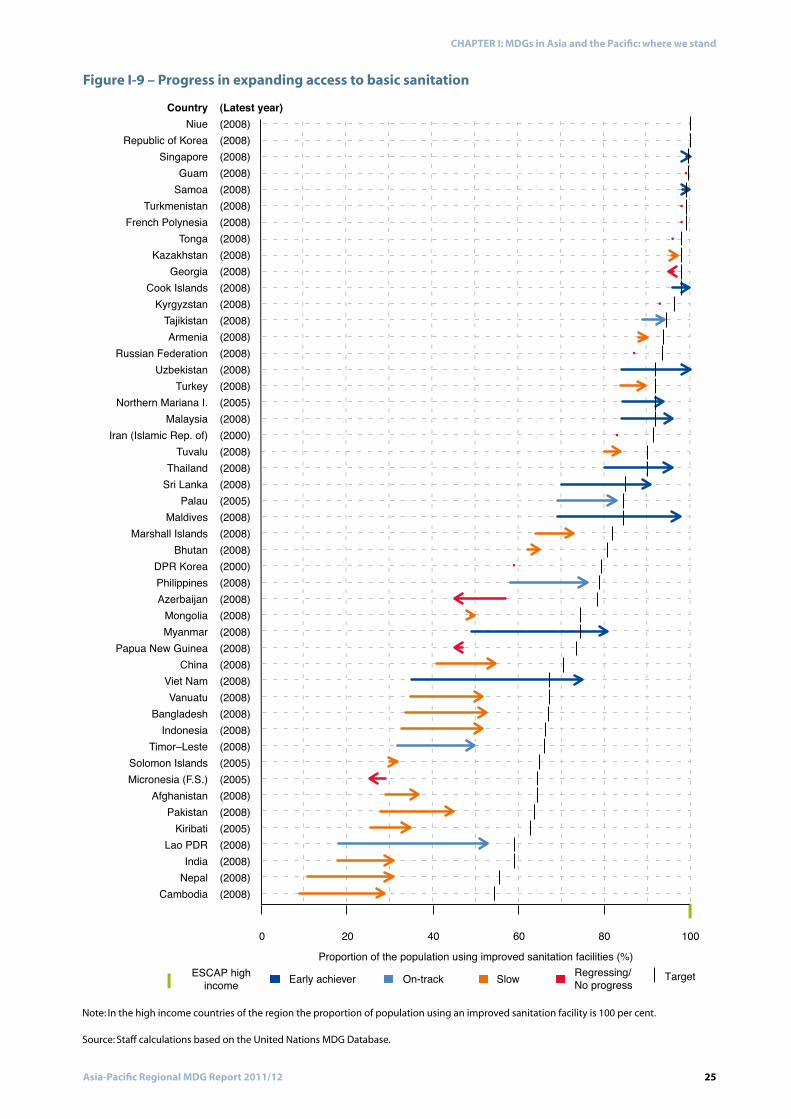
Figure I-9 – Progress in expanding access to basic sanitation
Note: In the high income countries of the region the proportion of population using an improved sanitation facility is 100 per cent.
Source: Staff calculations based on the United Nations MDG Database.
(Latest year)(2008)(2008)(2008)(2008)(2008)(2008)(2008)(2008)(2008)(2008)(2008)(2008)(2008)(2008)(2008)(2008)(2008)(2005)(2008)(2000)(2008)(2008)(2008)(2005)(2008)(2008)(2008)(2000)(2008)(2008)(2008)(2008)(2008)(2008)(2008)(2008)(2008)(2008)(2008)(2005)(2005)(2008)(2008)(2005)(2008)(2008)(2008)(2008)
0 20 40 60 80 100
Early achieverESCAP highincome On-track Slow Regressing/
No progress TargetProportion of the population using improved sanitation facilities (%)
CountryNiue
Republic of KoreaSingapore
GuamSamoa
TurkmenistanFrench Polynesia
TongaKazakhstan
GeorgiaCook Islands
KyrgyzstanTajikistanArmenia
Russian FederationUzbekistan
TurkeyNorthern Mariana I.
MalaysiaIran (Islamic Rep. of)
TuvaluThailand
Sri LankaPalau
MaldivesMarshall Islands
BhutanDPR KoreaPhilippinesAzerbaijan
MongoliaMyanmar
Papua New GuineaChina
Viet NamVanuatu
BangladeshIndonesia
Timor–LesteSolomon IslandsMicronesia (F.S.)
AfghanistanPakistan
KiribatiLao PDR
IndiaNepal
Cambodia
26 Asia-Pacific Regional MDG Report 2011/12
CHAPTER I: MDGs in Asia and the Pacific: where we stand
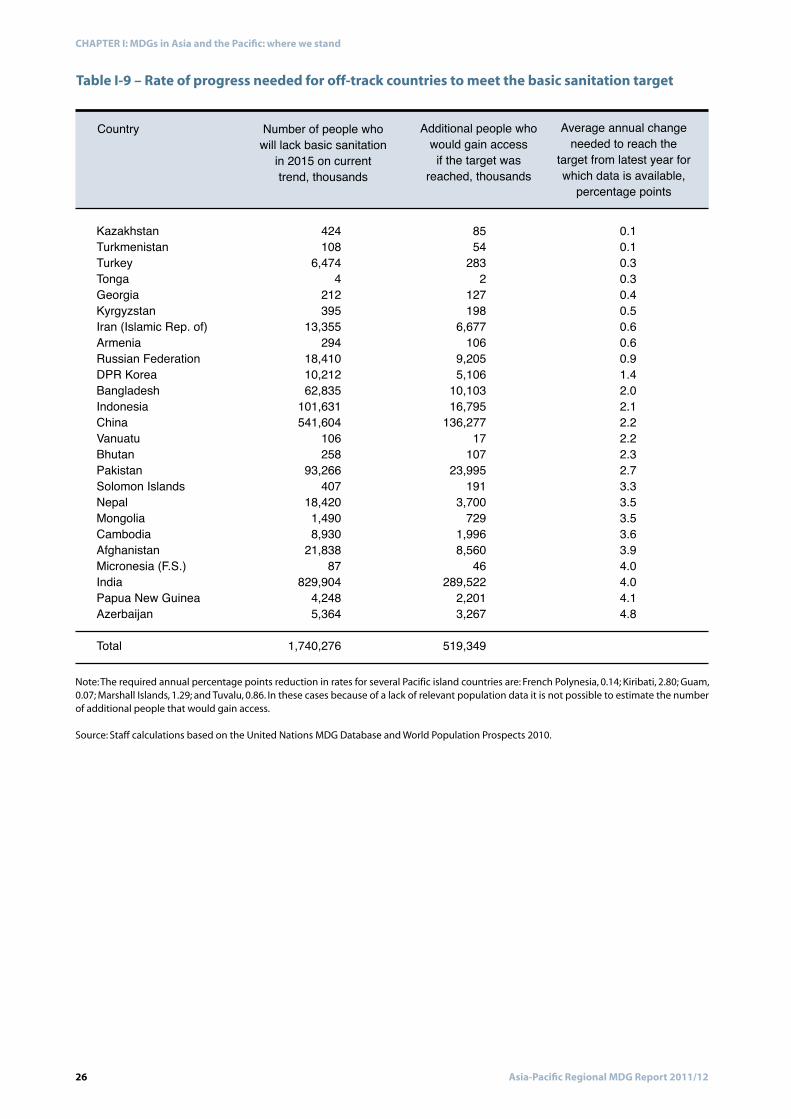
Table I-9 – Rate of progress needed for off-track countries to meet the basic sanitation target
Note: The required annual percentage points reduction in rates for several Pacific island countries are: French Polynesia, 0.14; Kiribati, 2.80; Guam, 0.07; Marshall Islands, 1.29; and Tuvalu, 0.86. In these cases because of a lack of relevant population data it is not possible to estimate the number of additional people that would gain access.
Source: Staff calculations based on the United Nations MDG Database and World Population Prospects 2010.
27Asia-Pacific Regional MDG Report 2011/12
CHAPTER I: MDGs in Asia and the Pacific: where we stand
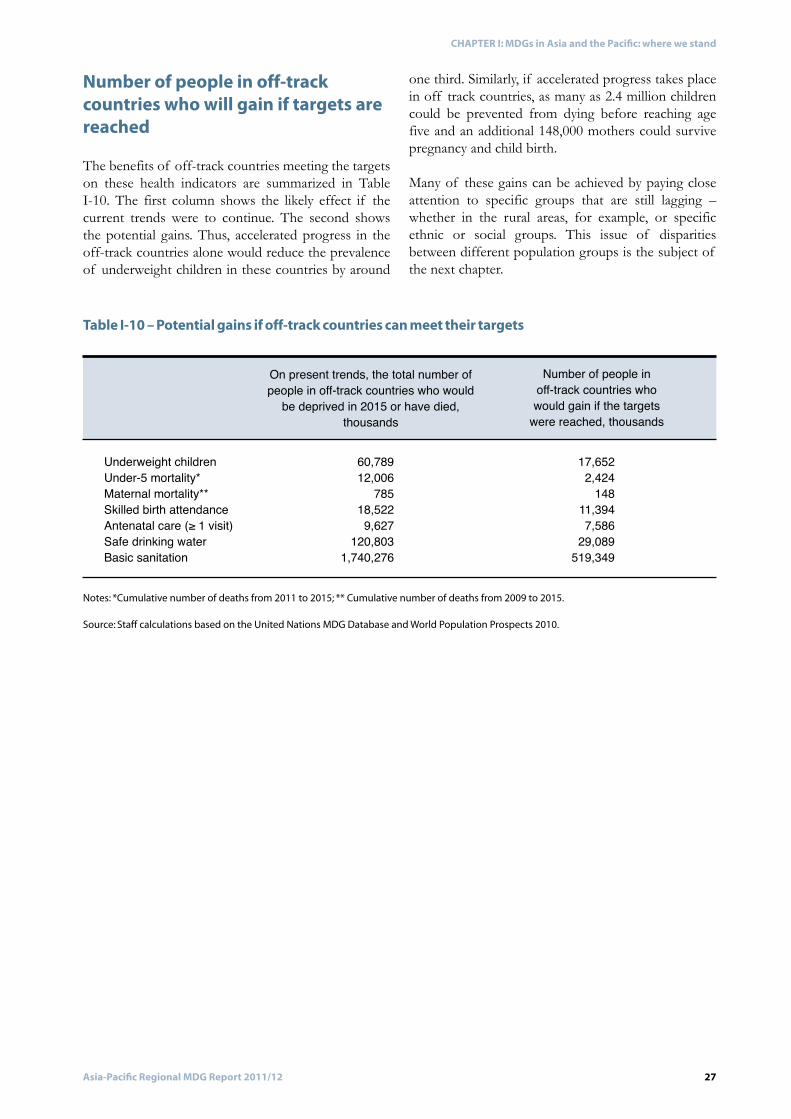
Number of people in off-track countries who will gain if targets are reached
Notes: *Cumulative number of deaths from 2011 to 2015; ** Cumulative number of deaths from 2009 to 2015.
Source: Staff calculations based on the United Nations MDG Database and World Population Prospects 2010.
Table I-10 – Potential gains if off-track countries can meet their targets
28 Asia-Pacific Regional MDG Report 2011/12
CHAPTER I: MDGs in Asia and the Pacific: where we stand
Chapter I Endnote
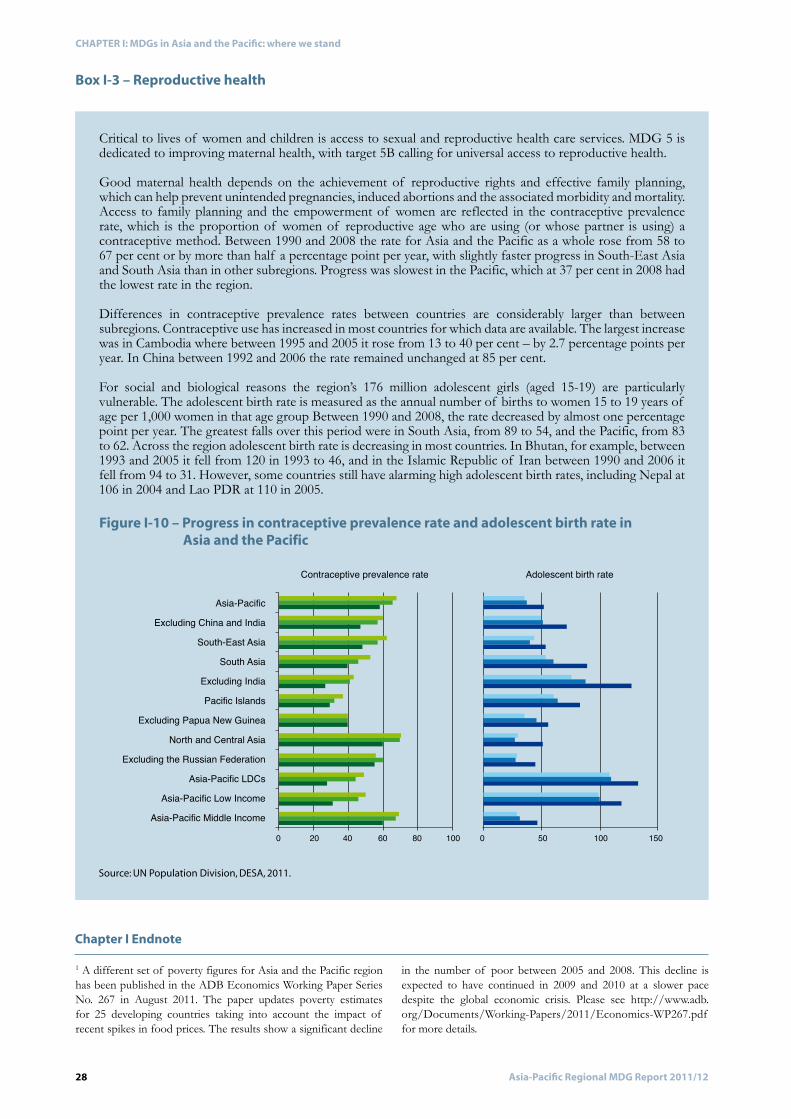
Box I-3 – Reproductive health
Figure I-10 – Progress in contraceptive prevalence rate and adolescent birth rate in Asia and the Pacific
Asia-PacificExcluding China and India
South-East AsiaSouth Asia
Excluding IndiaPacific Islands
Excluding Papua New GuineaNorth and Central Asia
Excluding the Russian FederationAsia-Pacific LDCs
Asia-Pacific Low IncomeAsia-Pacific Middle Income
Contraceptive prevalence rate
0 20 40 60 80 100
1990 2000 2008
Adolescent birth rate
0 50 100 150
1990 2000 2008Source: UN Population Division, DESA, 2011.
29Asia-Pacific Regional MDG Report 2011/12
CHAPTER IIDiagnosing disparities
30 Asia-Pacific Regional MDG Report 2011/12
CHAPTER II: Diagnosing disparities
The extent of disparitiesMeasuring disparities between countries and over time
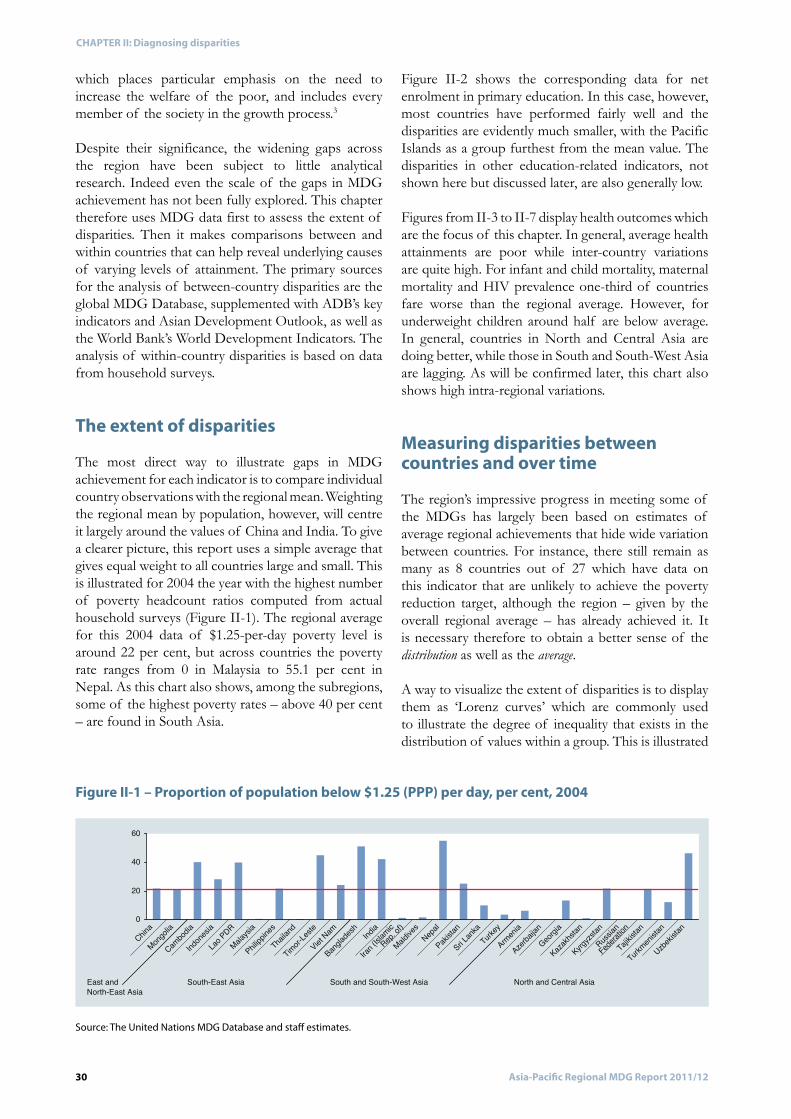
Figure II-1 – Proportion of population below $1.25 (PPP) per day, per cent, 2004
Source: The United Nations MDG Database and staff estimates.
0
20
40
60
East andNorth-East Asia
China
Thailan
d
Timor-Les
te
Viet Nam
Banglad
esh India
Iran (Is
lamic
Rep. of)
Maldive
sNepa
l
Pakista
n
Sri Lank
aTurk
ey
Armenia
Azerbai
jan
Georgia
Kazakhs
tan
Kyrgyzs
tan
Russian
Tajikista
n
Turkmeni
stan
Uzbekis
tan
Federati
on
Mongolia
Cambod
ia
Indone
sia
Lao PDR
Malaysi
a
Philippi
nes
South-East Asia South and South-West Asia North and Central Asia
31Asia-Pacific Regional MDG Report 2011/12
CHAPTER II: Diagnosing disparities
0
20
40
60
80
100103
East andNorth-East Asia
South-East Asia South and South-West Asia North and Central Asia Pacific
China
DPR Korea
Rep of K
orea
Mongolia
Brunei D
arussa
lam
Cambod
ia
Indone
sia
Lao PDR
Malaysi
a
Myanmar
Philippi
nes
Singapo
re
Thailan
d
Timor-Les
te
Viet Nam
Afghani
stan
Banglad
eshBhut
anIndia
Iran (Is
lamic R
ep of)
Maldive
sNepa
l
Pakista
n
Sri Lank
aTurk
ey
Armenia
Azerbai
jan
Georgia
Kazakhs
tan
Kyrgyzs
tan
Russian
Federati
on
Tajikista
n
Turkmeni
stan
Uzbekis
tan FijiKirib
ati
Marshal
l Is.
Micrones
ia (F.S.)
Palau
Papua N
ew GuineaSam
oa
Solomon
Is.Tong
aTuva
lu
Vanuatu
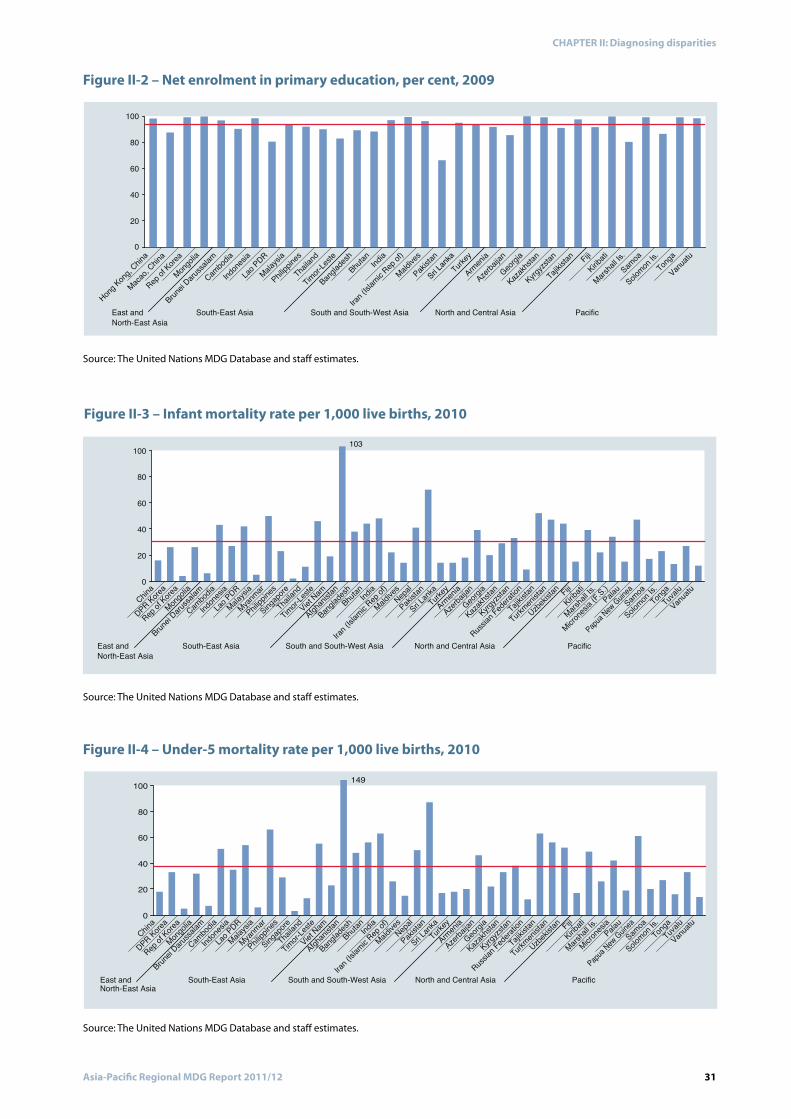
Figure II-2 – Net enrolment in primary education, per cent, 2009
Source: The United Nations MDG Database and staff estimates.
Figure II-3 – Infant mortality rate per 1,000 live births, 2010
Source: The United Nations MDG Database and staff estimates.
Figure II-4 – Under-5 mortality rate per 1,000 live births, 2010
Source: The United Nations MDG Database and staff estimates.
0
20
40
60
80
100
Hong Kong
, Chin
a
Macao, C
hina
Rep of K
orea
Mongolia
Brunei D
arussa
lam
Cambod
ia
Indone
sia
Lao PDR
Malaysi
a
Philippi
nes
Thailan
d
Timor-Les
te
Banglad
eshBhut
an India
Iran (Is
lamic R
ep of)
Maldive
s
Pakista
n
Sri Lank
a
East and North-East Asia
South-East Asia South and South-West Asia North and Central Asia Pacific
Turkey
Armenia
Azerbai
jan
Georgia
Kazakhs
tan
Kyrgyzs
tan
Tajikista
n FijiKirib
ati
Marshal
l Is.Sam
oa
Solomon
Is.Tong
a
Vanuatu
0
20
40
60
80
100 149
East andNorth-East Asia
South-East Asia South and South-West Asia North and Central Asia Pacific
China
DPR Korea
Rep of K
orea
Mongolia
Brunei D
arussa
lam
Cambod
ia
Indone
sia
Lao PDR
Malaysi
a
Myanmar
Philippi
nes
Singapo
re
Thailan
d
Timor-Les
te
Viet Nam
Afghani
stan
Banglad
eshBhut
anIndia
Iran (Is
lamic R
ep of)
Maldive
sNepa
l
Pakista
n
Sri Lank
aTurk
ey
Armenia
Azerbai
jan
Georgia
Kazakhs
tan
Kyrgyzs
tan
Russian
Federati
on
Tajikista
n
Turkmeni
stan
Uzbekis
tan FijiKirib
ati
Marshal
l Is.
Micrones
iaPala
u
Papua N
ew GuineaSam
oa
Solomon
Is.Tong
aTuva
lu
Vanuatu
32 Asia-Pacific Regional MDG Report 2011/12
CHAPTER II: Diagnosing disparities
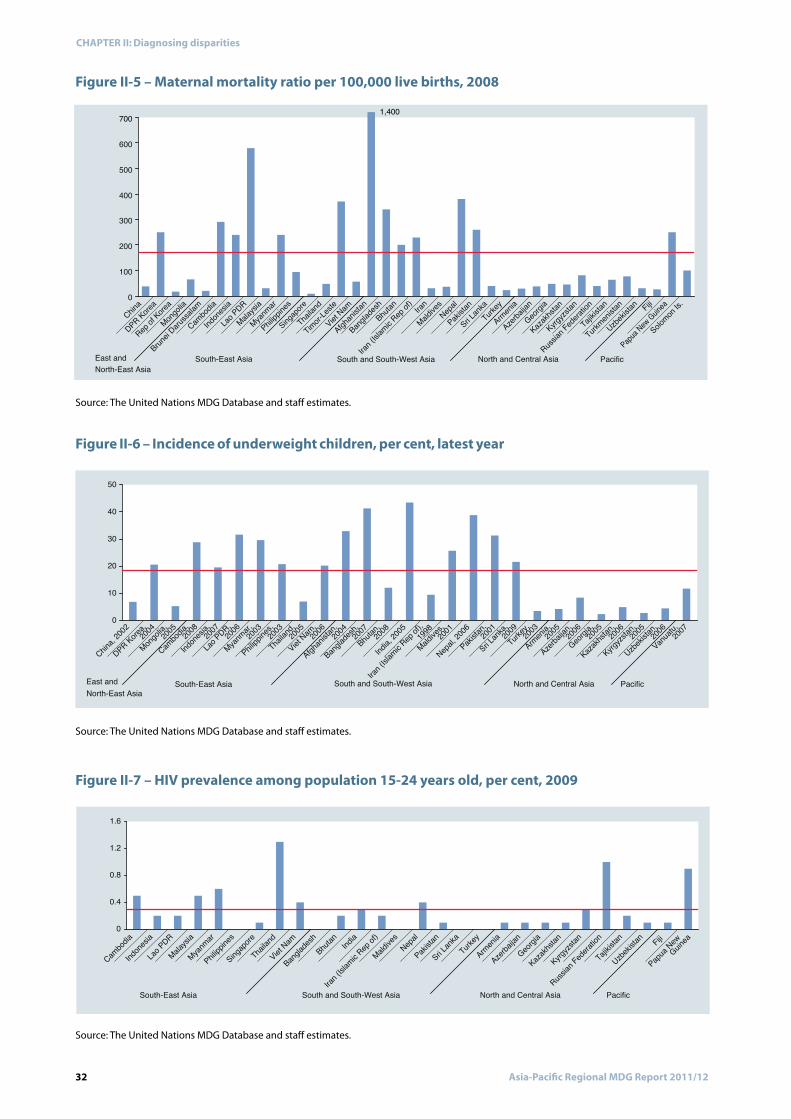
Figure II-5 – Maternal mortality ratio per 100,000 live births, 2008
Source: The United Nations MDG Database and staff estimates.
Figure II-6 – Incidence of underweight children, per cent, latest year
Source: The United Nations MDG Database and staff estimates.
Figure II-7 – HIV prevalence among population 15-24 years old, per cent, 2009
Source: The United Nations MDG Database and staff estimates.
0
100
200
300
400
500
600
7001,400
East and North-East Asia
South-East Asia South and South-West Asia North and Central Asia Pacific
China
DPR Korea
Rep of K
orea
Mongolia
Brunei D
arussa
lam
Cambod
ia
Indone
sia
Lao PDR
Malaysi
a
Myanmar
Philippi
nes
Singapo
re
Thailan
d
Timor-Les
te
Viet Nam
Afghani
stan
Banglad
eshBhut
an
Iran (Is
lamic R
ep of) Iran
Maldive
sNepa
l
Pakista
n
Sri Lank
aTurk
ey
Armenia
Azerbai
jan
Georgia
Kazakhs
tan
Kyrgyzs
tan
Russian
Federati
on
Tajikista
n
Turkmeni
stan
Uzbekis
tan Fiji
Papua N
ew Guinea
Solomon
Is.
0
10
20
30
40
50
East and North-East Asia
South-East Asia South and South-West Asia North and Central Asia Pacific
China, 2
002
DPR Korea,200
4
Mongolia
,200
5
Cambod
ia,2008
Indone
sia,200
7
Lao PDR,
2006
Myanmar,200
3
Philippi
nes,200
3
Thailan
d,200
5
Viet Nam
,200
6
Afghani
stan,200
4
Banglad
esh,200
7Bhut
an,2008
India,
2005
Iran (Is
lamic R
ep of),
Maldive
s,200
1
Nepal, 2
006
Pakista
n,200
1
Sri Lank
a,200
9Turk
ey,2003
Armenia,200
5
Azerbai
jan,200
6
Georgia
,200
5
Kazakhs
tan,200
6
Kyrgyzs
tan,200
5
Uzbekis
tan,200
6
Vanuatu
,200
7199
8
0
0.4
0.8
1.2
1.6
South-East Asia South and South-West Asia North and Central Asia Pacific
Cambod
ia
Indone
sia
Lao PDR
Malaysi
a
Myanmar
Philippi
nes
Singapo
re
Thailan
d
Viet Nam
Banglad
eshBhut
an India
Iran (Is
lamic R
ep of)
Maldive
sNepa
l
Pakista
n
Sri Lank
aTurk
ey
Uzbekis
tan
Armenia
Azerbai
jan
Georgia
Kazakhs
tan
Kyrgyzs
tan
Russian
Federati
on
Tajikista
n Fiji
Papua N
ewGuin
ea
33Asia-Pacific Regional MDG Report 2011/12
CHAPTER II: Diagnosing disparities
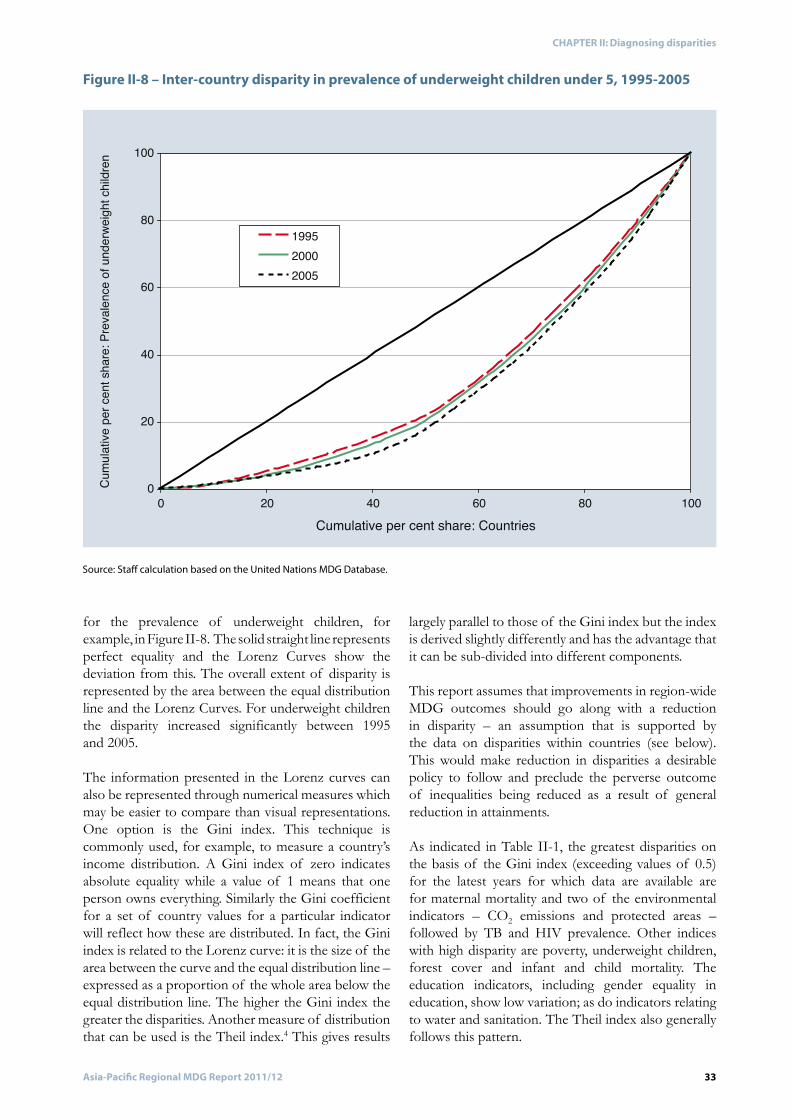
Figure II-8 – Inter-country disparity in prevalence of underweight children under 5, 1995-2005
Source: Staff calculation based on the United Nations MDG Database.
0
20
40
60
80
100
0 20 40 60 80 100Cumulative per cent share: Countries
199520002005
Cumu
lative
per
cent
shar
e: P
reva
lence
of u
nder
weigh
t chil
dren
34 Asia-Pacific Regional MDG Report 2011/12
CHAPTER II: Diagnosing disparities
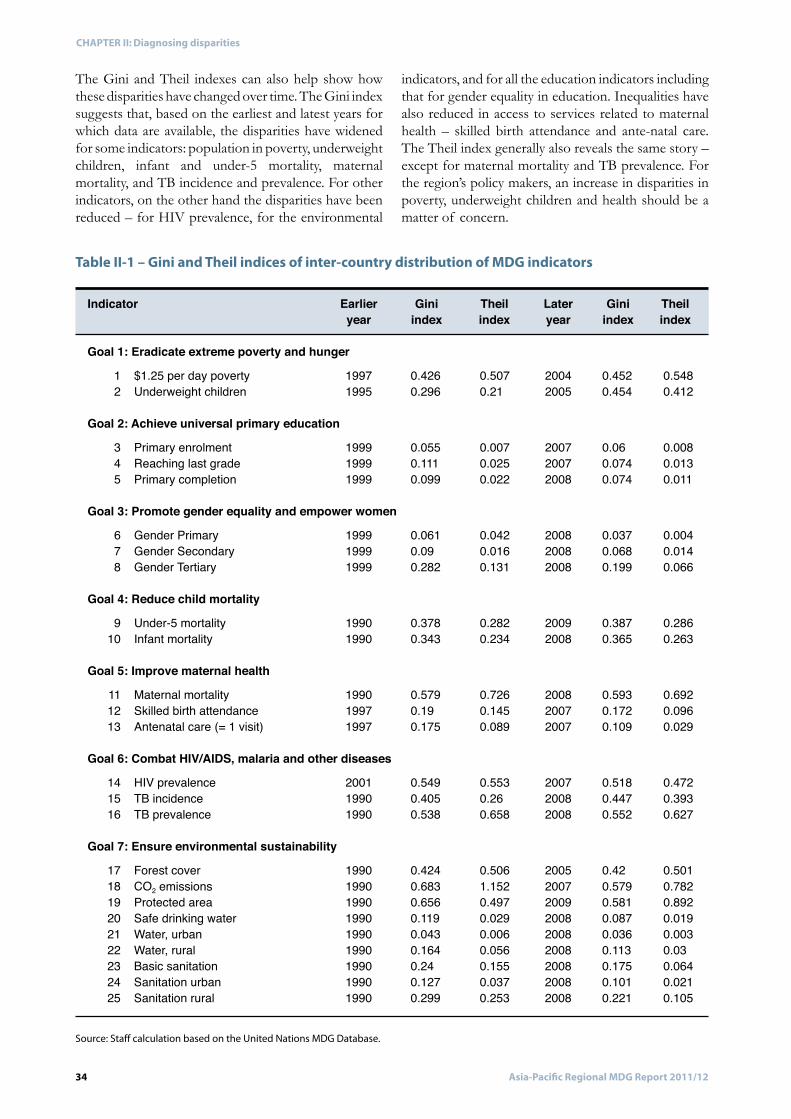
Table II-1 – Gini and Theil indices of inter-country distribution of MDG indicators
Source: Staff calculation based on the United Nations MDG Database.
35Asia-Pacific Regional MDG Report 2011/12
CHAPTER II: Diagnosing disparities
Why some countries do better than others in health
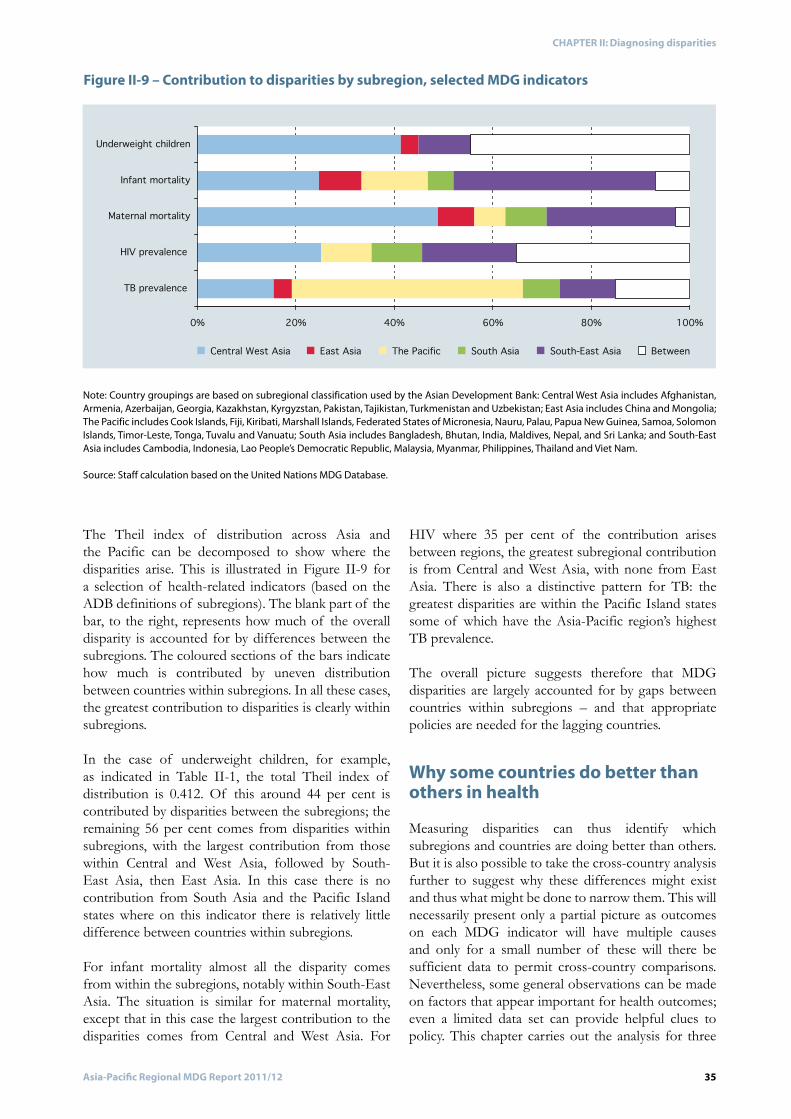
Figure II-9 – Contribution to disparities by subregion, selected MDG indicators
Note: Country groupings are based on subregional classification used by the Asian Development Bank: Central West Asia includes Afghanistan, Armenia, Azerbaijan, Georgia, Kazakhstan, Kyrgyzstan, Pakistan, Tajikistan, Turkmenistan and Uzbekistan; East Asia includes China and Mongolia; The Pacific includes Cook Islands, Fiji, Kiribati, Marshall Islands, Federated States of Micronesia, Nauru, Palau, Papua New Guinea, Samoa, Solomon Islands, Timor-Leste, Tonga, Tuvalu and Vanuatu; South Asia includes Bangladesh, Bhutan, India, Maldives, Nepal, and Sri Lanka; and South-East Asia includes Cambodia, Indonesia, Lao People’s Democratic Republic, Malaysia, Myanmar, Philippines, Thailand and Viet Nam.
Source: Staff calculation based on the United Nations MDG Database.
0% 20% 40% 60% 80% 100%
TB prevalence
HIV prevalence
Maternal mortality
Infant mortality
Underweight children
Central West Asia East Asia The Pacific South Asia South-East Asia Between
36 Asia-Pacific Regional MDG Report 2011/12
CHAPTER II: Diagnosing disparities
Economic growth
Health expenditure
Better governance
Number of health personnel
37Asia-Pacific Regional MDG Report 2011/12
CHAPTER II: Diagnosing disparities
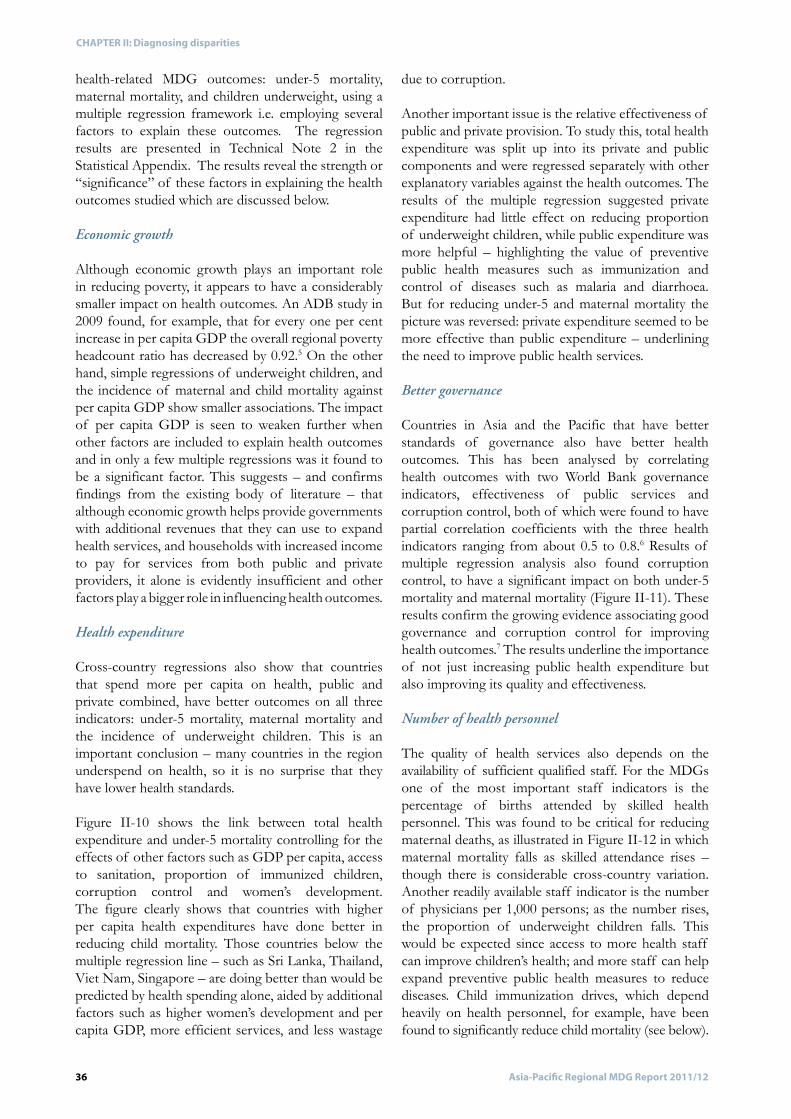
Figure II-10 – Cross-country variation in under-5 mortality explained by differences in per capita health spending
Source: The United Nations MDG Database for under-5 mortality and on the World Bank, World Development Indicators online database for health expenditure per capita.
Figure II-11 – Cross-country variation in maternal mortality explained by differences in corruption control
Sources: The Brookings Institution, World Bank Development Economics Research Group, and the World Bank Institute, World Governance Indicators online database for corruption control index and the United Nations MDG Database for maternal mortality ratio.
ARMAZE
BGD
KHM
CHN
GEO
IND
IDNKAZ
KGZLAO
MYS
MDV
MNGNPL PAK
PNG
PHL
RUS
SGP
LKA
TJK
THATUR
UZBVNM
0.0
1.0
2.0
3.0
4.0
5.0
2.0 3.0 4.0 5.0 6.0 7.0 8.0ln (Health expenditure per capita)
ln (U
nder
-5 m
orta
lity)
ARM
AZE
BGD KHM
CHN
INDIDN
KAZ
KOR
KGZ
LAO
MDVMNG
NPL PAK
PNG PHL
RUS
SGP
LKAMYS
TJKTHA
TURUZB
VNM
-1.0
0.5
2.0
3.5
5.0
6.5
8.0
-2.0 -1.0 0.0 1.0 2.0 3.0
Corruption control index
ln (M
ater
nal m
orta
lity)
38 Asia-Pacific Regional MDG Report 2011/12
CHAPTER II: Diagnosing disparities
Gender equality and women’s development Infrastructure
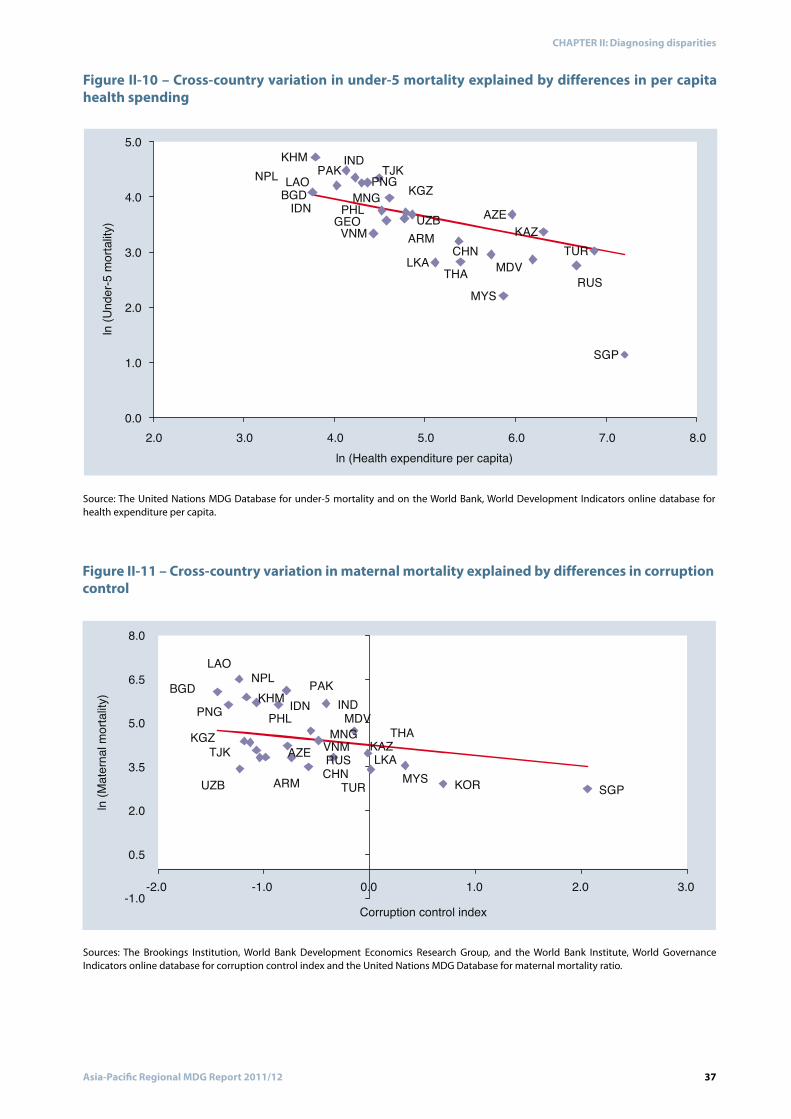
Figure II-12 – Cross-country variation in maternal mortality explained by differences in percentage of births attended by skilled health personnel
Source: Staff calculations based on the United Nations MDG Database.
ARM
AZE
BGD
KHM
CHN
IND
IDN
KAZ
KOR
KGZ
LAO
MYS
MDV
MNG
NPL
PAK
PNG
PHL
RUS
SGP
LKA
TJK
THA
TUR
UZB
VNM
0.0
1.0
2.0
3.0
4.0
5.0
6.0
7.0
2.5 3.0 3.5 4.0 4.5 5.0
ln (Skilled birth attendance)
ln
(M
ate
rn
al m
orta
lity ra
te
)
39Asia-Pacific Regional MDG Report 2011/12
CHAPTER II: Diagnosing disparities
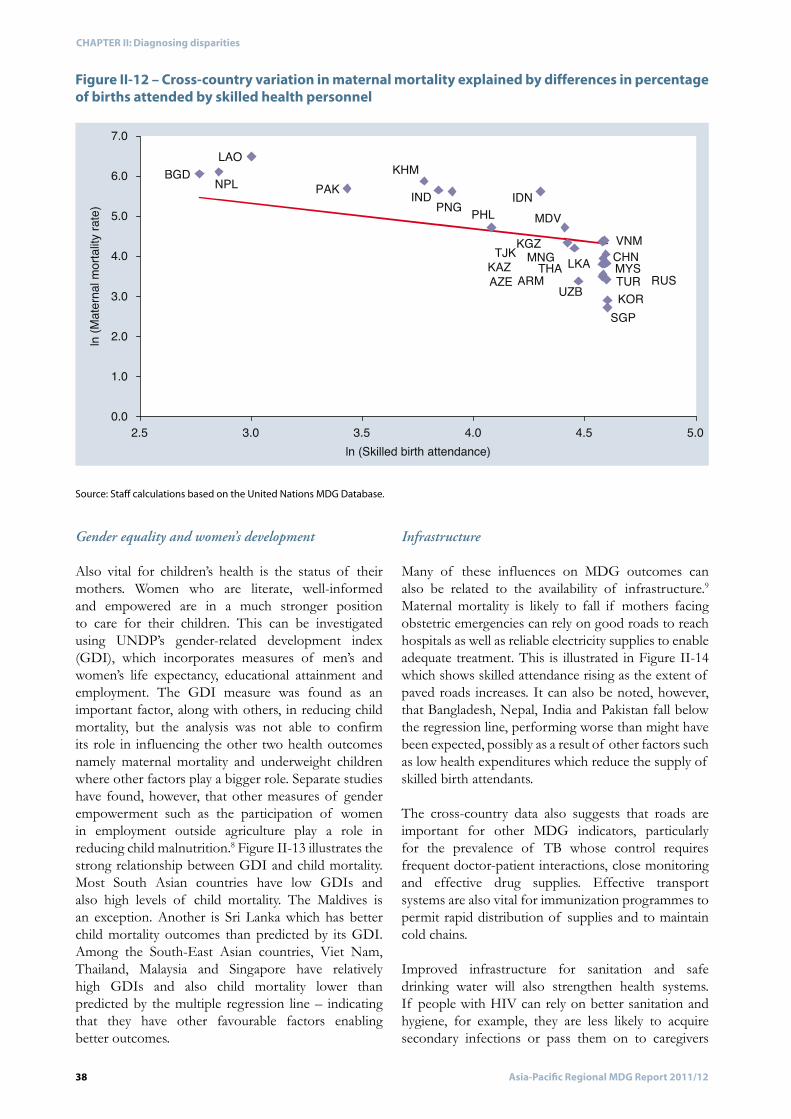
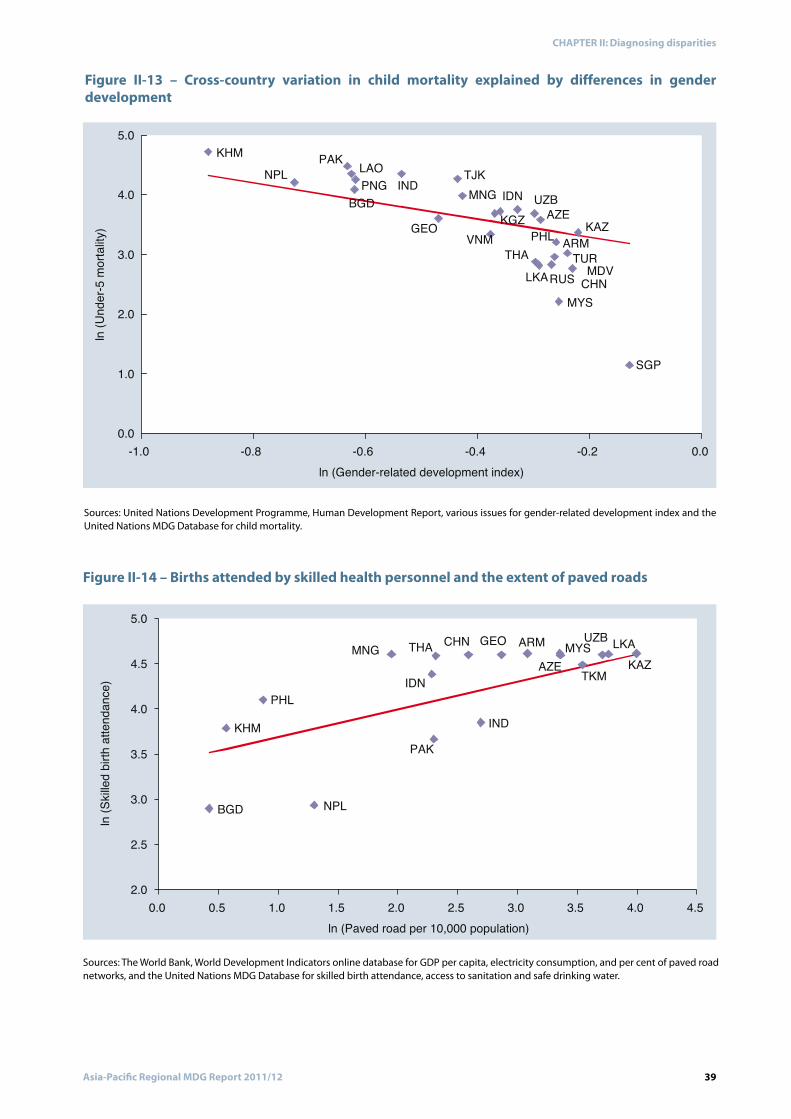
Figure II-13 – Cross-country variation in child mortality explained by differences in gender development
Sources: United Nations Development Programme, Human Development Report, various issues for gender-related development index and the United Nations MDG Database for child mortality.
Figure II-14 – Births attended by skilled health personnel and the extent of paved roads
Sources: The World Bank, World Development Indicators online database for GDP per capita, electricity consumption, and per cent of paved road networks, and the United Nations MDG Database for skilled birth attendance, access to sanitation and safe drinking water.
ARM
AZEBGD
KHM
CHN
GEO
INDIDN
KAZKGZ
LAO
MYS
MDV
MNGNPL
PAK
PNG
PHL
RUS
SGP
LKA
TJK
THA TUR
UZB
VNM
0.0
1.0
2.0
3.0
4.0
5.0
-1.0 -0.8 -0.6 -0.4 -0.2 0.0ln (Gender-related development index)
ln (U
nder
-5 m
orta
lity)
ARM
AZE
BGD
KHM
CHN
GEO
IND
IDN
KAZ
MYS
MNG
NPL
PAK
PHL
LKA
THA
TKM
UZB
2.0
2.5
3.0
3.5
4.0
4.5
5.0
0.0 0.5 1.0 1.5 2.0 2.5 3.0 3.5 4.0 4.5
ln (Paved road per 10,000 population)
ln (S
killed
birth attendance)

40 Asia-Pacific Regional MDG Report 2011/12
CHAPTER II: Diagnosing disparities
Child immunization
Sanitation and water supplies
Population growth
Literacy
Accounting for disparities
41Asia-Pacific Regional MDG Report 2011/12
CHAPTER II: Diagnosing disparities
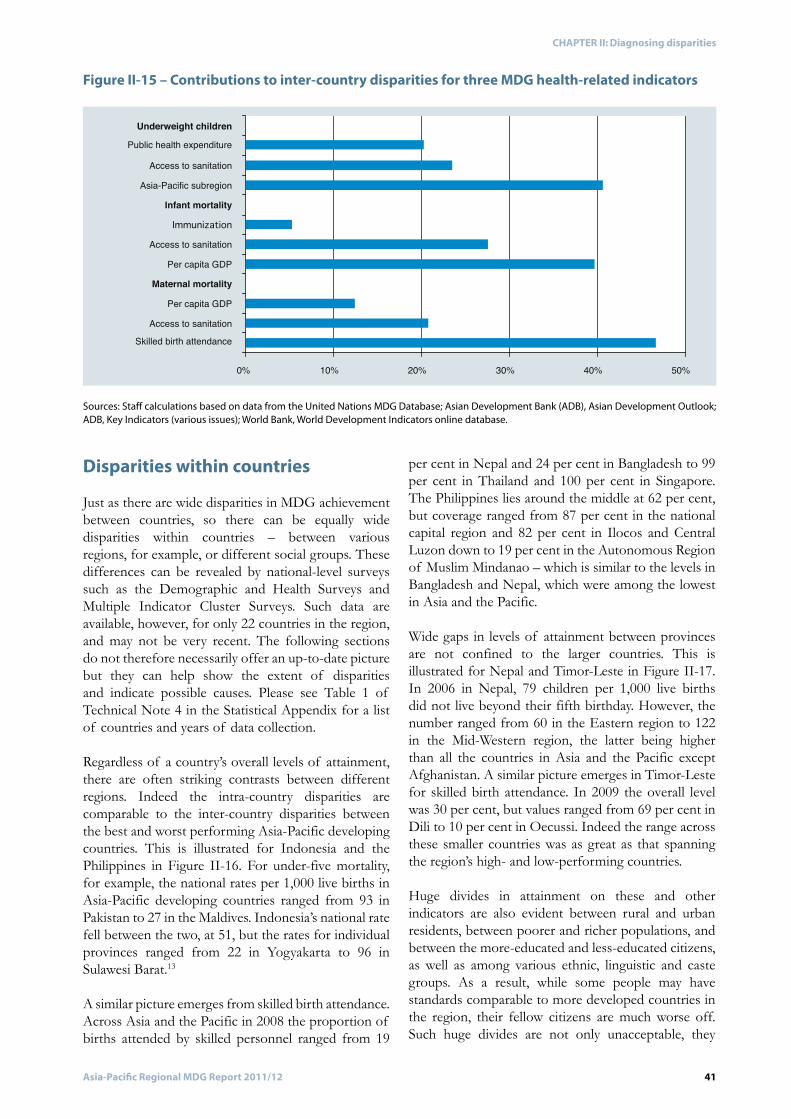
Figure II-15 – Contributions to inter-country disparities for three MDG health-related indicators
Sources: Staff calculations based on data from the United Nations MDG Database; Asian Development Bank (ADB), Asian Development Outlook; ADB, Key Indicators (various issues); World Bank, World Development Indicators online database.
Disparities within countries
0% 10% 20% 30% 40% 50%
Skilled birth attendanceAccess to sanitation
Per capita GDP
Maternal mortalityPer capita GDP
Access to sanitation
ImmunizationInfant mortality
Asia-Pacific subregion
Access to sanitation
Public health expenditureUnderweight children
42 Asia-Pacific Regional MDG Report 2011/12
CHAPTER II: Diagnosing disparities
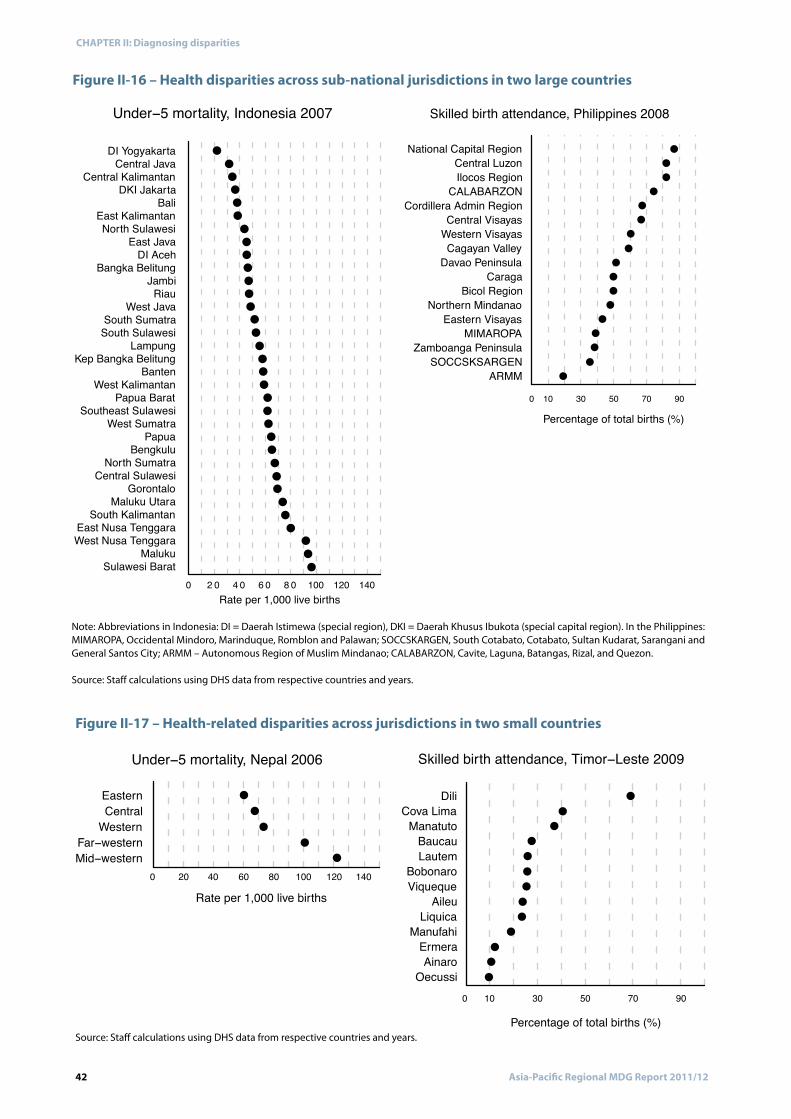
Figure II-17 – Health-related disparities across jurisdictions in two small countries
Source: Staff calculations using DHS data from respective countries and years.
Mid!westernFar!western
WesternCentralEastern
0 20 40 60 80 100 120 140
Under!5 mortality, Nepal 2006
Rate per 1,000 live births
OecussiAinaro
ErmeraManufahi
LiquicaAileu
ViquequeBobonaro
LautemBaucau
ManatutoCova Lima
Dili
0 10 30 50 70 90
Skilled birth attendance, Timor!Leste 2009
Percentage of total births (%)
Figure II-16 – Health disparities across sub-national jurisdictions in two large countries
Note: Abbreviations in Indonesia: DI = Daerah Istimewa (special region), DKI = Daerah Khusus Ibukota (special capital region). In the Philippines: MIMAROPA, Occidental Mindoro, Marinduque, Romblon and Palawan; SOCCSKARGEN, South Cotabato, Cotabato, Sultan Kudarat, Sarangani and General Santos City; ARMM – Autonomous Region of Muslim Mindanao; CALABARZON, Cavite, Laguna, Batangas, Rizal, and Quezon.
Source: Staff calculations using DHS data from respective countries and years.
Sulawesi BaratMaluku
West Nusa TenggaraEast Nusa Tenggara
South KalimantanMaluku Utara
GorontaloCentral Sulawesi
North SumatraBengkulu
PapuaWest Sumatra
Southeast SulawesiPapua Barat
West KalimantanBanten
Kep Bangka BelitungLampung
South SulawesiSouth Sumatra
West JavaRiau
JambiBangka Belitung
DI AcehEast Java
North SulawesiEast Kalimantan
BaliDKI Jakarta
Central KalimantanCentral Java
DI Yogyakarta
0 2 0 4 0 6 0 8 0 100 120 140
Under!5 mortality, Indonesia 2007
Rate per 1,000 live births
ARMMSOCCSKSARGEN
Zamboanga PeninsulaMIMAROPA
Eastern VisayasNorthern Mindanao
Bicol RegionCaraga
Davao PeninsulaCagayan Valley
Western VisayasCentral Visayas
Cordillera Admin RegionCALABARZON
Ilocos RegionCentral Luzon
National Capital Region
Skilled birth attendance, Philippines 2008
0 10 30 50 70 90
Percentage of total births (%)
43Asia-Pacific Regional MDG Report 2011/12
CHAPTER II: Diagnosing disparities
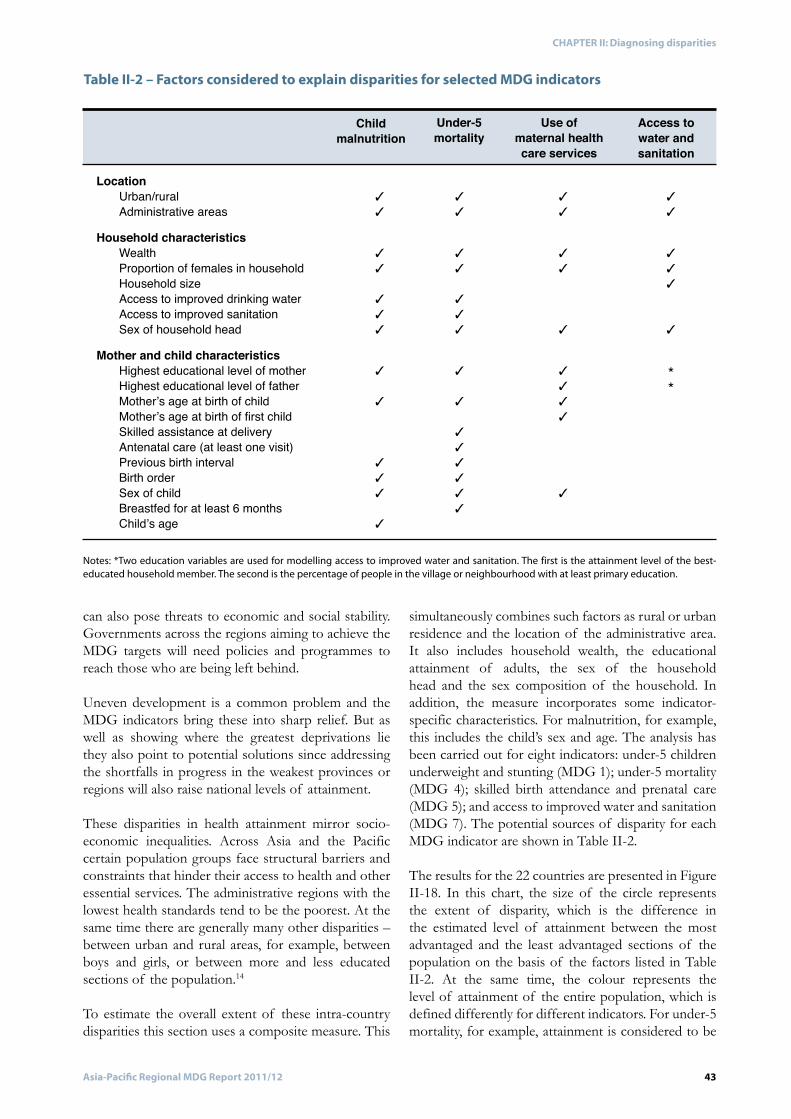
Table II-2 – Factors considered to explain disparities for selected MDG indicators
Notes: *Two education variables are used for modelling access to improved water and sanitation. The first is the attainment level of the best-educated household member. The second is the percentage of people in the village or neighbourhood with at least primary education.
44 Asia-Pacific Regional MDG Report 2011/12
CHAPTER II: Diagnosing disparities
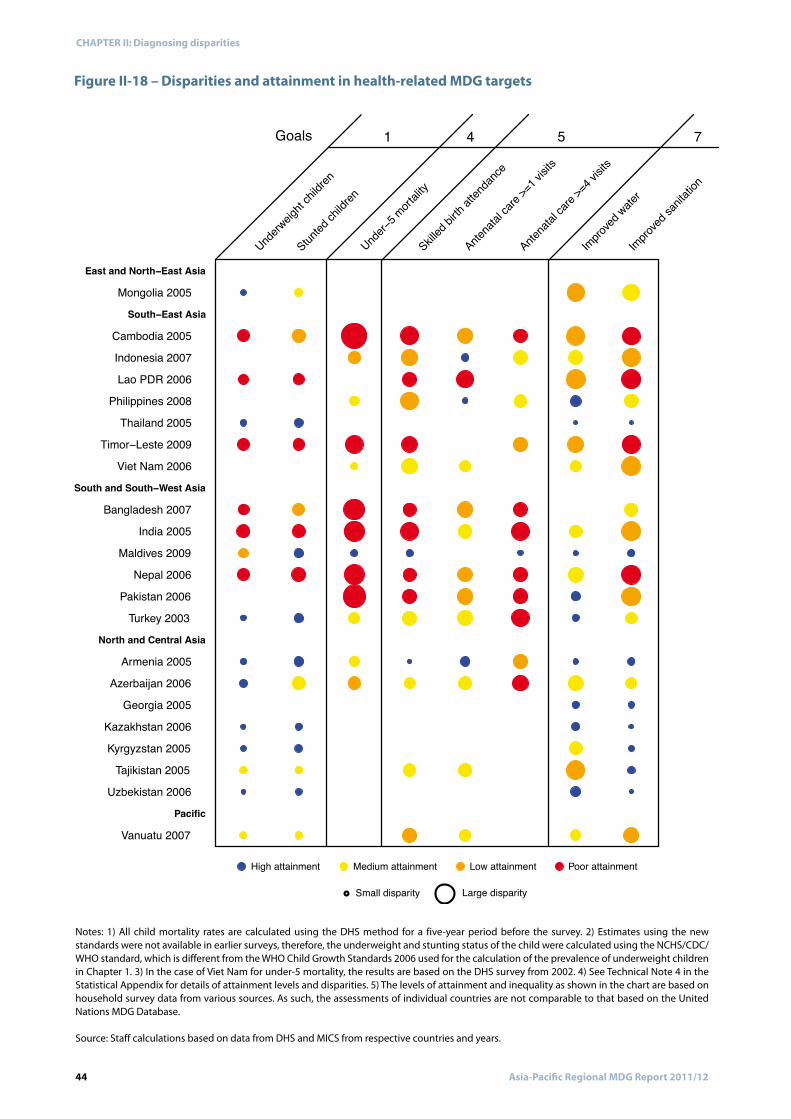
Figure II-18 – Disparities and attainment in health-related MDG targets
Notes: 1) All child mortality rates are calculated using the DHS method for a five-year period before the survey. 2) Estimates using the new standards were not available in earlier surveys, therefore, the underweight and stunting status of the child were calculated using the NCHS/CDC/WHO standard, which is different from the WHO Child Growth Standards 2006 used for the calculation of the prevalence of underweight children in Chapter 1. 3) In the case of Viet Nam for under-5 mortality, the results are based on the DHS survey from 2002. 4) See Technical Note 4 in the Statistical Appendix for details of attainment levels and disparities. 5) The levels of attainment and inequality as shown in the chart are based on household survey data from various sources. As such, the assessments of individual countries are not comparable to that based on the United Nations MDG Database.
Source: Staff calculations based on data from DHS and MICS from respective countries and years.
Vanuatu 2007
Uzbekistan 2006Tajikistan 2005
Kyrgyzstan 2005Kazakhstan 2006
Georgia 2005Azerbaijan 2006
Armenia 2005
Turkey 2003Pakistan 2006
Nepal 2006Maldives 2009
India 2005Bangladesh 2007
Viet Nam 2006Timor!Leste 2009
Thailand 2005Philippines 2008
Lao PDR 2006Indonesia 2007Cambodia 2005
Mongolia 2005
Pacific
North and Central Asia
South and South!West Asia
South!East Asia
East and North!East Asia
Underweig
ht child
ren
Stunted
childr
en
Under!5
mortalit
y
Skilled b
irth att
endanc
e
Antenat
al care
>=1 v
isits
Antenat
al care
>=4 v
isits
Improved
water
Improved
sanita
tion
Small disparity Large disparity
High attainment Medium attainment Low attainment Poor attainment
1 4 5 7Goals
45Asia-Pacific Regional MDG Report 2011/12
CHAPTER II: Diagnosing disparities
Raising the attainment levels while reducing disparities
46 Asia-Pacific Regional MDG Report 2011/12
CHAPTER II: Diagnosing disparities
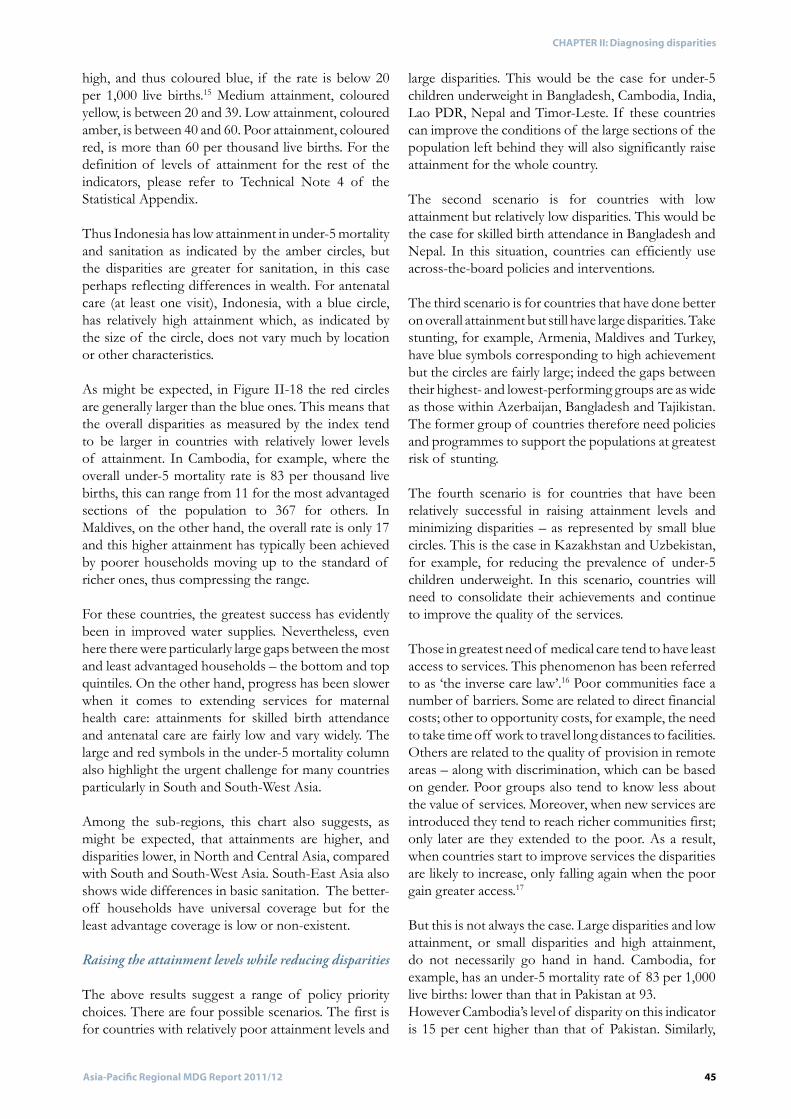
Figure II-19 – Drivers of disparities in underweight prevalence among under-5 children
Vanuatu 2007
Uzbekistan 2006Tajikistan 2005
Kyrgyzstan 2005Kazakhstan 2006Azerbaijan 2006
Armenia 2005
Turkey 2003Nepal 2006
Maldives 2009India 2005
Bangladesh 2007
Timor!Leste 2009Thailand 2005Lao PDR 2006
Cambodia 2005
Mongolia 2005
Pacific
North and Central Asia
South and South!West Asia
South!East Asia
East and North!East Asia
Urban
(compar
ed to r
ural)
Wealth i
ndex
(5th qu
intile c
ompar
ed
to 1st q
uintile
)Prop
ortion
of fem
ale
househ
old mem
bers
(5th qu
intile c
ompar
ed
to 1st q
uintile
)
Househo
ld head
being
male
(compar
ed to f
emale
)
Educatio
n of m
other
(highes
t level
compar
ed
to low
est lev
el)
Child be
ing a b
oy
(compar
ed to g
irl)
0 0 0 0 0 050 50 50 50 50 50
Disparity < Change in disparity
Source: Staff calculations based on data from DHS and MICS from respective countries and years.
Explaining disparities within countries
47Asia-Pacific Regional MDG Report 2011/12
CHAPTER II: Diagnosing disparities
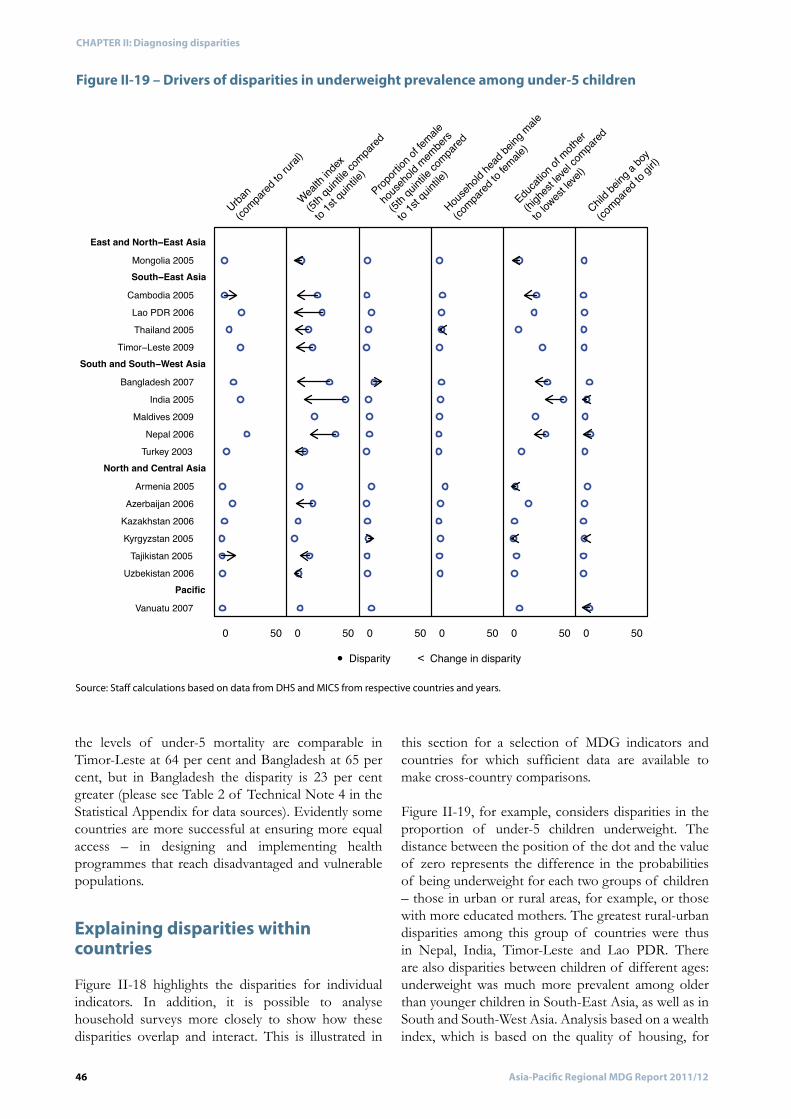
Figure II-20 – Drivers of disparities in the prevalence of under-5 mortality
Azerbaijan 2006
Armenia 2005
Turkey 2003
Pakistan 2006
Nepal 2006
Maldives 2009
India 2005
Bangladesh 2007
Viet Nam 2002
Timor!Leste 2009
Philippines 2008
Indonesia 2007
Cambodia 2005
North and Central Asia
South and South!West Asia
South!East Asia
Urban
(compar
ed to r
ural)
Wealth i
ndex
(5th qu
intile c
ompar
ed
to 1st q
uintile
)
Educatio
n of m
other
(highes
t level
compar
ed
to low
est lev
el)
Skillled
assista
nce at
delive
ry
(compar
ed to n
ot havi
ng
been a
ssiste
d)
Child be
ing a b
oy
(compar
ed to g
irl)
0 0 0 0 0 0100 100 100 100 100 600
Disparity < Change in disparity
Child ha
ving b
een bre
astfed
av
(compar
ed to n
ot hing
been b
reastfe
d)
for at l
east 6
months
Source: Staff calculations based on data from DHS from respective countries and years.
48 Asia-Pacific Regional MDG Report 2011/12
CHAPTER II: Diagnosing disparities
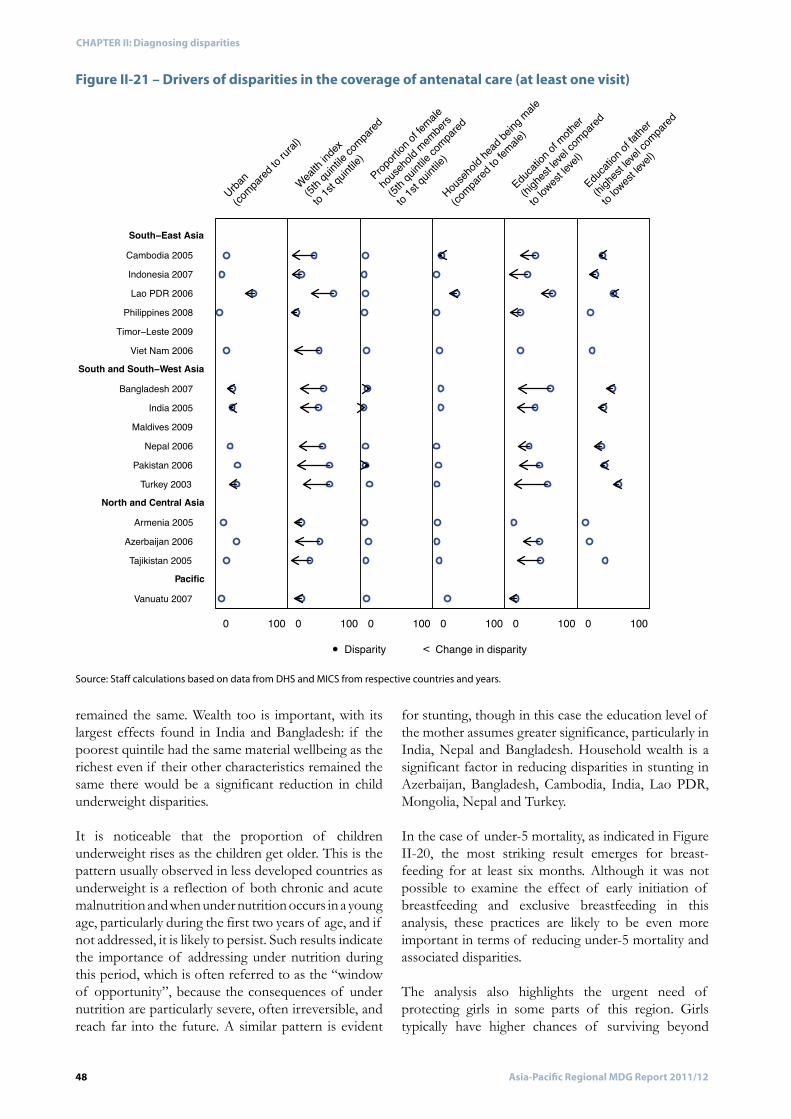
Source: Staff calculations based on data from DHS and MICS from respective countries and years.
Figure II-21 – Drivers of disparities in the coverage of antenatal care (at least one visit)
Vanuatu 2007
Tajikistan 2005Azerbaijan 2006
Armenia 2005
Turkey 2003Pakistan 2006
Nepal 2006Maldives 2009
India 2005Bangladesh 2007
Viet Nam 2006Timor!Leste 2009
Philippines 2008Lao PDR 2006
Indonesia 2007Cambodia 2005
Pacific
North and Central Asia
South and South!West Asia
South!East Asia
Urban
(compar
ed to r
ural)
Wealth i
ndex
(5th qu
intile c
ompar
ed
to 1st q
uintile
)Prop
ortion
of fem
ale
househ
old mem
bers
(5th qu
intile c
ompar
ed
to 1st q
uintile
)
Househo
ld head
being
male
(compar
ed to f
emale
)
Educatio
n of m
other
(highes
t level
compar
ed
to low
est lev
el)
Educatio
n of fa
ther
(highes
t level
compar
ed
to low
est lev
el)
0 0 0 0 0 0100 100 100 100 100 100
Disparity < Change in disparity
49Asia-Pacific Regional MDG Report 2011/12
CHAPTER II: Diagnosing disparities
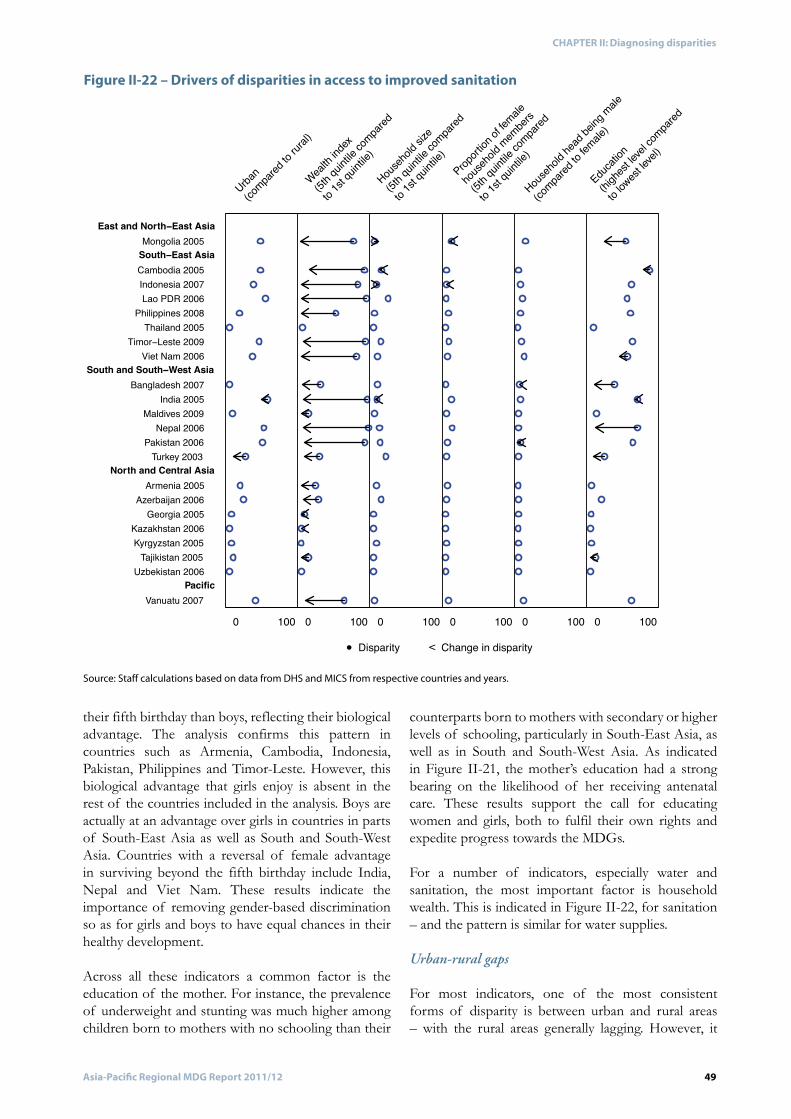
Urban-rural gaps
Figure II-22 – Drivers of disparities in access to improved sanitation
Source: Staff calculations based on data from DHS and MICS from respective countries and years.
Vanuatu 2007
Uzbekistan 2006Tajikistan 2005
Kyrgyzstan 2005Kazakhstan 2006
Georgia 2005Azerbaijan 2006
Armenia 2005
Turkey 2003Pakistan 2006
Nepal 2006Maldives 2009
India 2005Bangladesh 2007
Viet Nam 2006Timor!Leste 2009
Thailand 2005Philippines 2008
Lao PDR 2006Indonesia 2007Cambodia 2005
Mongolia 2005
Pacific
North and Central Asia
South and South!West Asia
South!East Asia
East and North!East Asia
Urban
(compar
ed to r
ural)
Wealth i
ndex
(5th qu
intile c
ompar
ed
to 1st q
uintile
)
Househo
ld size
(5th qu
intile c
ompar
ed
to 1st q
uintile
)Prop
ortion
of fem
ale
househ
old mem
bers
(5th qu
intile c
ompar
ed
to 1st q
uintile
)
Househo
ld head
being
male
(compar
ed to f
emale
)
Educatio
n
(highes
t level
compar
ed
to low
est lev
el)
0 0 0 0 0 0100 100 100 100 100 100
Disparity < Change in disparity
50 Asia-Pacific Regional MDG Report 2011/12
CHAPTER II: Diagnosing disparities
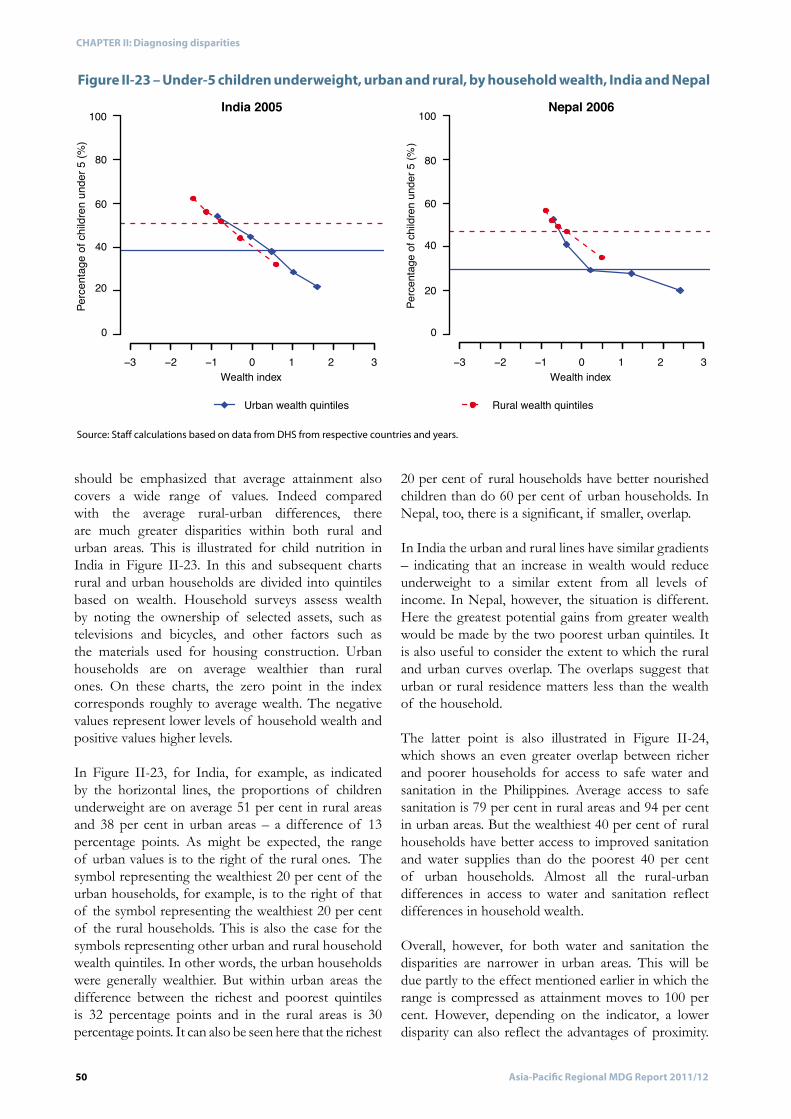
Source: Staff calculations based on data from DHS from respective countries and years.
Figure II-23 – Under-5 children underweight, urban and rural, by household wealth, India and Nepal
!3 !2 !1 0 1 2 3
0
20
40
60
80
100India 2005
Wealth index
Perce
ntag
e of
child
ren
unde
r 5 (%
)
Urban wealth quintiles
!3 !2 !1 0 1 2 3
0
20
40
60
80
100 Nepal 2006
Wealth index
Perce
ntag
e of
child
ren
unde
r 5 (%
)Rural wealth quintiles
51Asia-Pacific Regional MDG Report 2011/12
CHAPTER II: Diagnosing disparities
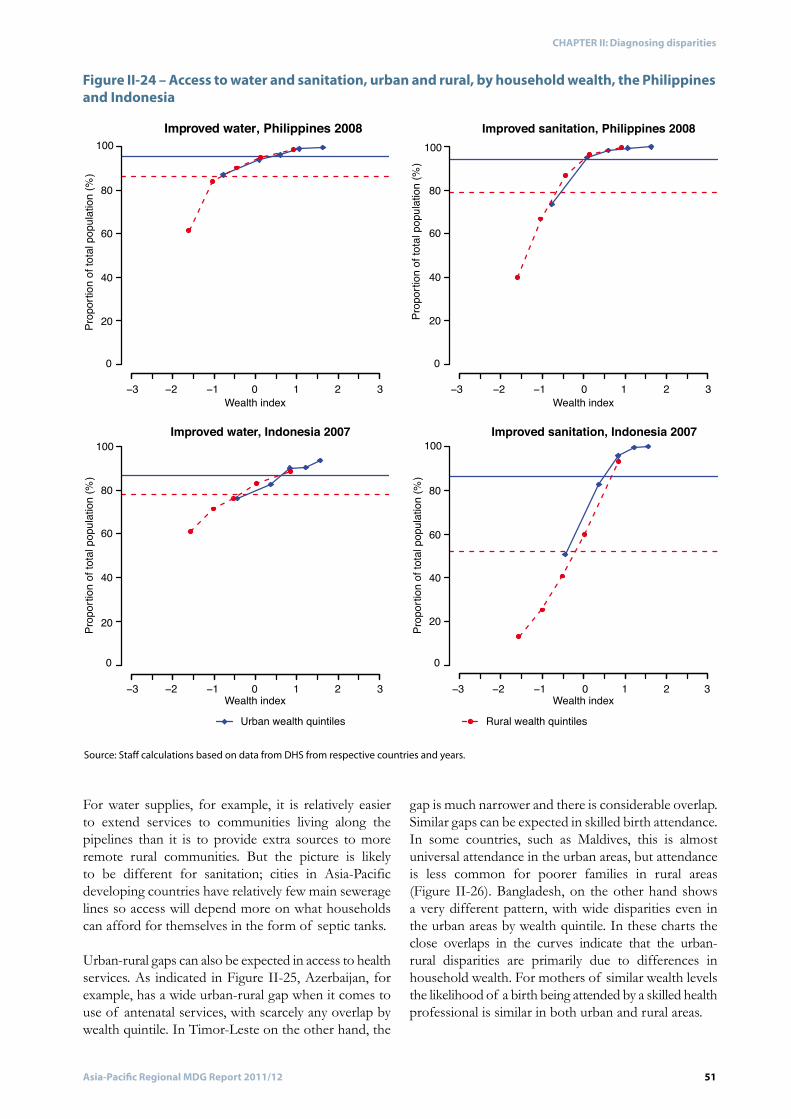
Figure II-24 – Access to water and sanitation, urban and rural, by household wealth, the Philippines and Indonesia
!3 !2 !1 1 20 3
0
20
40
60
80
100Improved water, Philippines 2008
Wealth index
Prop
ortio
n of
tota
l pop
ulatio
n (%
)
!3 !2 !1 1 20 3
0
20
40
60
80
100Improved sanitation, Philippines 2008
Wealth indexPr
opor
tion
of to
tal p
opula
tion
(%)
!3 !2 !1 1 20 3
0
20
40
60
80
100Improved water, Indonesia 2007
Wealth index
Prop
ortio
n of
tota
l pop
ulatio
n (%
)
Urban wealth quintiles
!3 !2 !1 1 20 3
0
20
40
60
80
100Improved sanitation, Indonesia 2007
Wealth index
Prop
ortio
n of
tota
l pop
ulatio
n (%
)
Rural wealth quintiles
Source: Staff calculations based on data from DHS from respective countries and years.
52 Asia-Pacific Regional MDG Report 2011/12
CHAPTER II: Diagnosing disparities
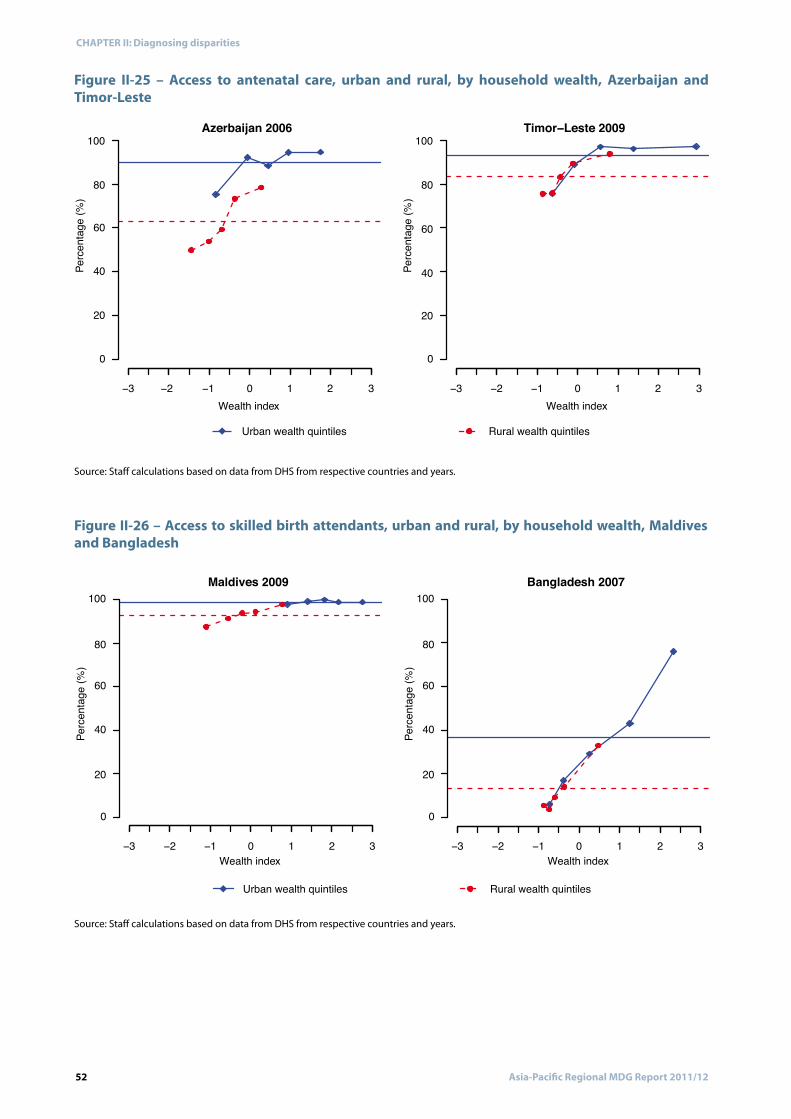
Source: Staff calculations based on data from DHS from respective countries and years.
Source: Staff calculations based on data from DHS from respective countries and years.
Figure II-25 – Access to antenatal care, urban and rural, by household wealth, Azerbaijan and Timor-Leste
!3 !2 !1 0 1 2 3
0
20
40
60
80
100Azerbaijan 2006
Wealth index
Perce
ntag
e (%
)
Urban wealth quintiles
!3 !2 !1 0 1 2 3
0
20
40
60
80
100Timor!Leste 2009
Wealth indexPe
rcent
age
(%)
Rural wealth quintiles
Figure II-26 – Access to skilled birth attendants, urban and rural, by household wealth, Maldives and Bangladesh
!3 !2 !1 0 1 2 3
0
20
40
60
80
100Maldives 2009
Wealth index
Perce
ntag
e (%
)
Urban wealth quintiles
!3 !2 !1 0 1 2 3
0
20
40
60
80
100Bangladesh 2007
Wealth index
Perce
ntag
e (%
)
Rural wealth quintiles
53Asia-Pacific Regional MDG Report 2011/12
CHAPTER II: Diagnosing disparities
Caste, ethnicity and language group
The importance of economic status
Regional differences in policies and programmes
54 Asia-Pacific Regional MDG Report 2011/12
CHAPTER II: Diagnosing disparities
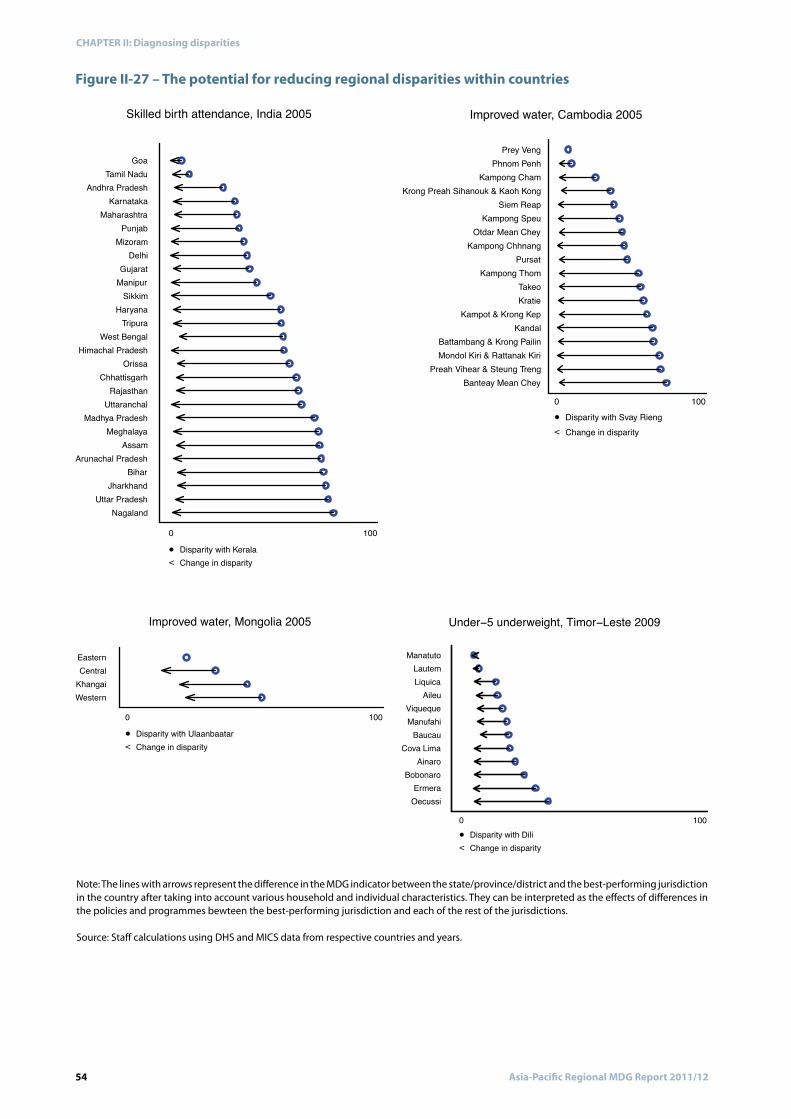
Figure II-27 – The potential for reducing regional disparities within countries
Note: The lines with arrows represent the difference in the MDG indicator between the state/province/district and the best-performing jurisdiction in the country after taking into account various household and individual characteristics. They can be interpreted as the effects of differences in the policies and programmes bewteen the best-performing jurisdiction and each of the rest of the jurisdictions.
Source: Staff calculations using DHS and MICS data from respective countries and years.
NagalandUttar Pradesh
JharkhandBihar
Arunachal PradeshAssam
MeghalayaMadhya Pradesh
UttaranchalRajasthan
ChhattisgarhOrissa
Himachal PradeshWest Bengal
TripuraHaryana
SikkimManipurGujarat
DelhiMizoram
PunjabMaharashtra
KarnatakaAndhra Pradesh
Tamil NaduGoa
0 100Disparity with Kerala
< Change in disparity
Skilled birth attendance, India 2005
Banteay Mean CheyPreah Vihear & Steung Treng
Mondol Kiri & Rattanak KiriBattambang & Krong Pailin
KandalKampot & Krong Kep
KratieTakeo
Kampong ThomPursat
Kampong ChhnangOtdar Mean Chey
Kampong SpeuSiem Reap
Krong Preah Sihanouk & Kaoh KongKampong Cham
Phnom PenhPrey Veng
0 100Disparity with Svay Rieng
< Change in disparity
Improved water, Cambodia 2005
WesternKhangaiCentralEastern
0 100Disparity with Ulaanbaatar
< Change in disparity
Improved water, Mongolia 2005
OecussiErmera
BobonaroAinaro
Cova LimaBaucau
ManufahiViqueque
AileuLiquicaLautem
Manatuto
0 100Disparity with Dili
< Change in disparity
Under!5 underweight, Timor!Leste 2009
55Asia-Pacific Regional MDG Report 2011/12
CHAPTER II: Diagnosing disparities
Mining the data
Chapter II Endnotes

57Asia-Pacific Regional MDG Report 2011/12
1. Address the social determinants of health
CHAPTER IIIClosing the health gaps
58 Asia-Pacific Regional MDG Report 2011/12
CHAPTER III: Closing the health gaps
Box III-1– Unlikely alliances for reducing HIV-related stigma
Source: UNICEF EAPRO, 2010 – Achieving the MDGs with Equity.
59Asia-Pacific Regional MDG Report 2011/12
CHAPTER III: Closing the health gaps
2. Expand access to primary health care
Box III-2 – Primary health care in China
60 Asia-Pacific Regional MDG Report 2011/12
CHAPTER III: Closing the health gaps
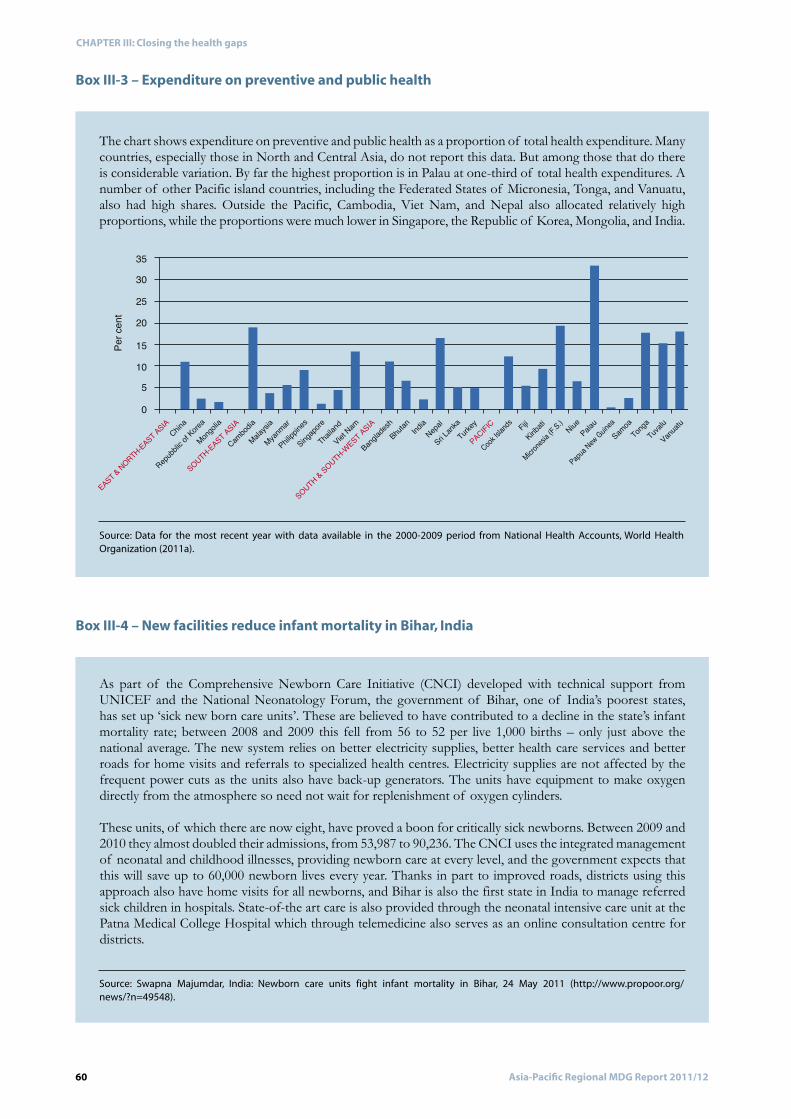
Box III-3 – Expenditure on preventive and public health
Source: Data for the most recent year with data available in the 2000-2009 period from National Health Accounts, World Health Organization (2011a).
EAST & NORTH-EAST ASIAChin
a
Repubbl
ic of K
orea
Mongolia
SOUTH-EAST ASIA
Cambod
ia
Malaysi
a
Myanmar
Philippi
nes
Singapo
re
Thailan
d
Viet Nam
SOUTH & SOUTH-WEST ASIA
Banglad
eshBhut
an India
Nepal
Sri Lank
aTurk
ey
PACIFIC FijiKirib
atiPala
uNiue
Papua N
ew Guinea
Micrones
ia (F.S.)
Cook Isla
ndsSam
oaTong
aTuva
lu
Vanuatu
35
30
25
20
15
105
0
Per c
ent
Box III-4 – New facilities reduce infant mortality in Bihar, India
Source: Swapna Majumdar, India: Newborn care units fight infant mortality in Bihar, 24 May 2011 (http://www.propoor.org/news/?n=49548).
61Asia-Pacific Regional MDG Report 2011/12
CHAPTER III: Closing the health gaps
3. Integrate child and maternal health into a continuum of care
62 Asia-Pacific Regional MDG Report 2011/12
CHAPTER III: Closing the health gaps
4. Act on the health needs of the urban poor
63Asia-Pacific Regional MDG Report 2011/12
CHAPTER III: Closing the health gaps
5. Devise sustainable financial strategies
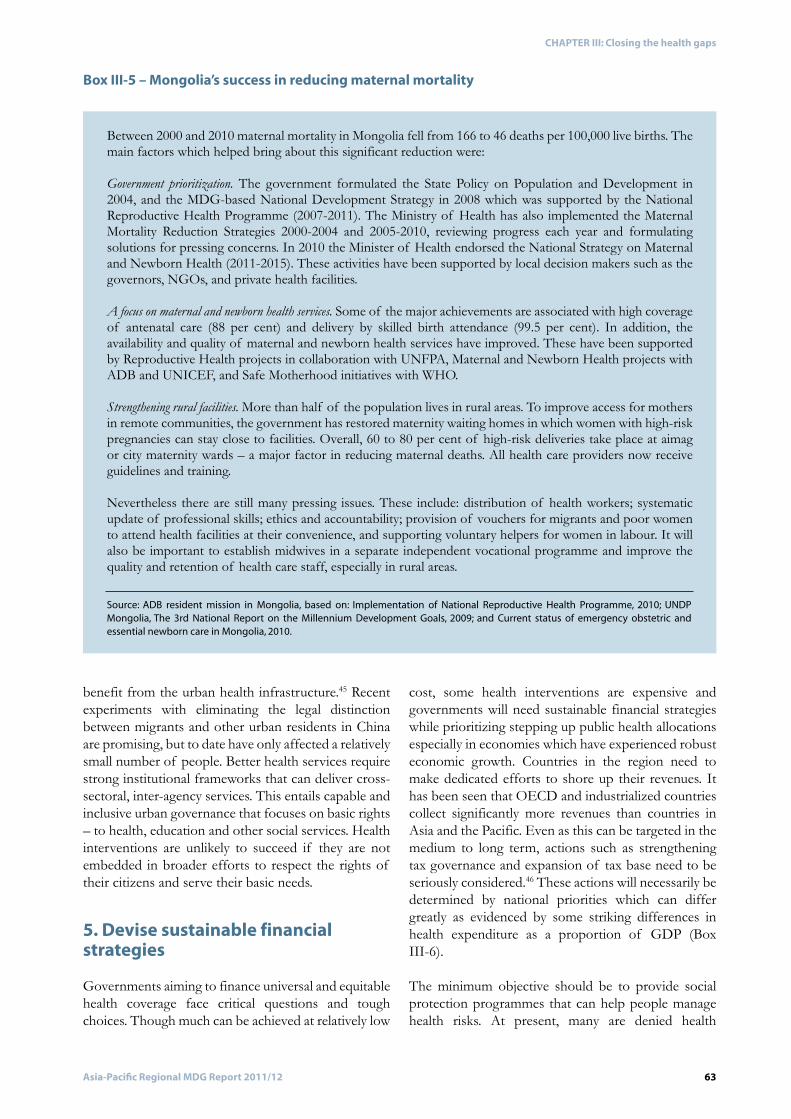
Box III-5 – Mongolia’s success in reducing maternal mortality
Source: ADB resident mission in Mongolia, based on: Implementation of National Reproductive Health Programme, 2010; UNDP Mongolia, The 3rd National Report on the Millennium Development Goals, 2009; and Current status of emergency obstetric and essential newborn care in Mongolia, 2010.
64 Asia-Pacific Regional MDG Report 2011/12
CHAPTER III: Closing the health gaps
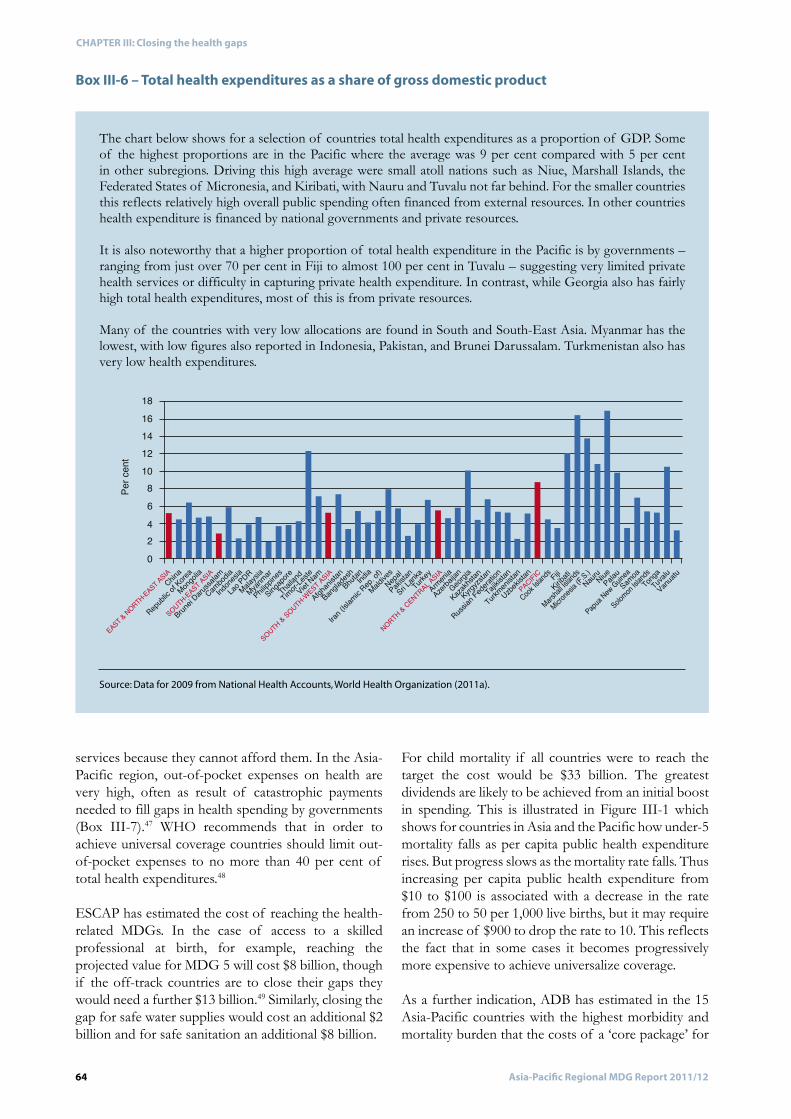
Box III-6 – Total health expenditures as a share of gross domestic product
Source: Data for 2009 from National Health Accounts, World Health Organization (2011a).
EAST & NORTH-EAST ASIAChin
a
Republic
of Kore
a
Mongolia
SOUTH-EAST ASIA
Cambod
ia
Brunei D
arussa
lam
Malaysi
a
Lao PDR
Indone
sia
Myanmar
Philippi
nes
Singapo
re
Thailan
d
Viet Nam
Timor-Les
te
SOUTH & SOUTH-WEST ASIA
Afghani
stan
Banglad
eshBhut
anIndia
Iran (Is
lamic R
ep. of)
Maldive
sNepa
l
Pakista
n
Sri Lank
aTurk
ey
NORTH & CENTRAL ASIA
Armenia
Azerbai
jan
Georgia
Kazakhs
tan
Kyrgyzs
tan
Russian
Federati
on
Tajikista
n
Turkmeni
stan
Uzbekis
tan
PACIFIC FijiKirib
atiPala
uNiue
Nauru
Papua N
ew Guinea
Micrones
ia (F.S.)
Marshal
l Island
s
Solomon
Islands
Cook Isla
ndsSam
oaTong
aTuva
lu
Vanuatu
1816141210
86420
Per c
ent
65Asia-Pacific Regional MDG Report 2011/12
CHAPTER III: Closing the health gaps
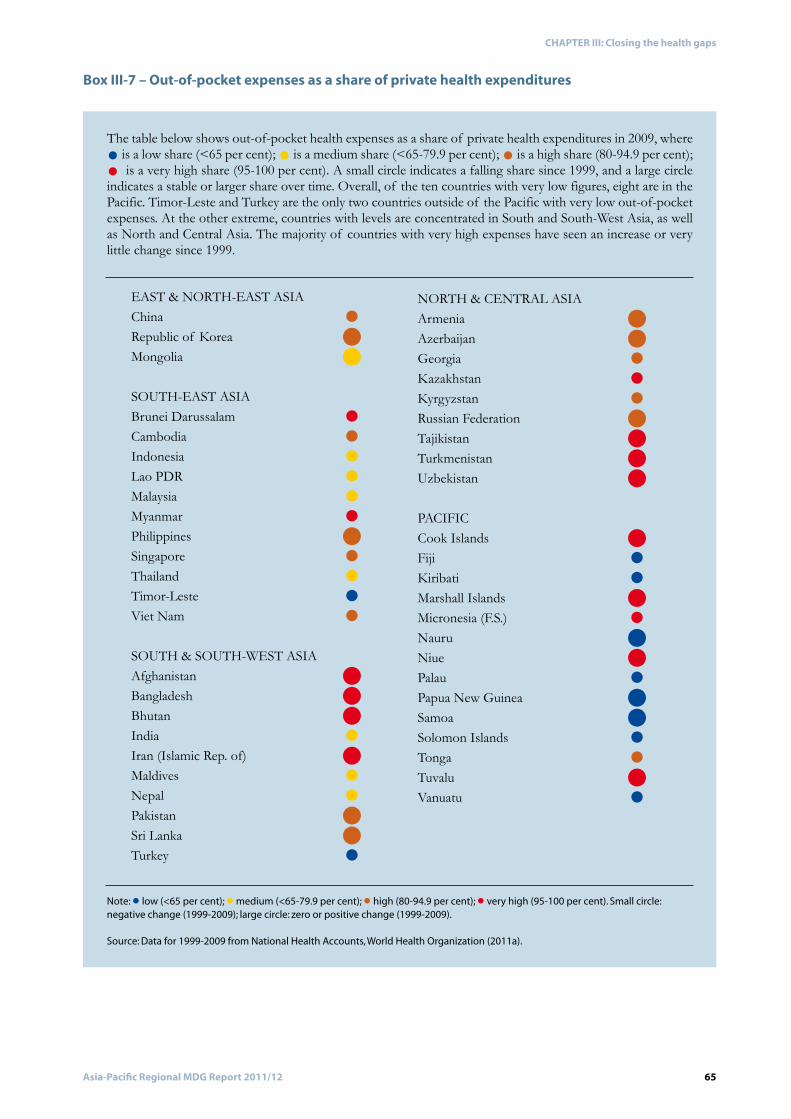
Box III-7 – Out-of-pocket expenses as a share of private health expenditures
Note: • low (<65 per cent); • medium (<65-79.9 per cent); • high (80-94.9 per cent); • very high (95-100 per cent). Small circle: negative change (1999-2009); large circle: zero or positive change (1999-2009).
Source: Data for 1999-2009 from National Health Accounts, World Health Organization (2011a).
66 Asia-Pacific Regional MDG Report 2011/12
CHAPTER III: Closing the health gaps
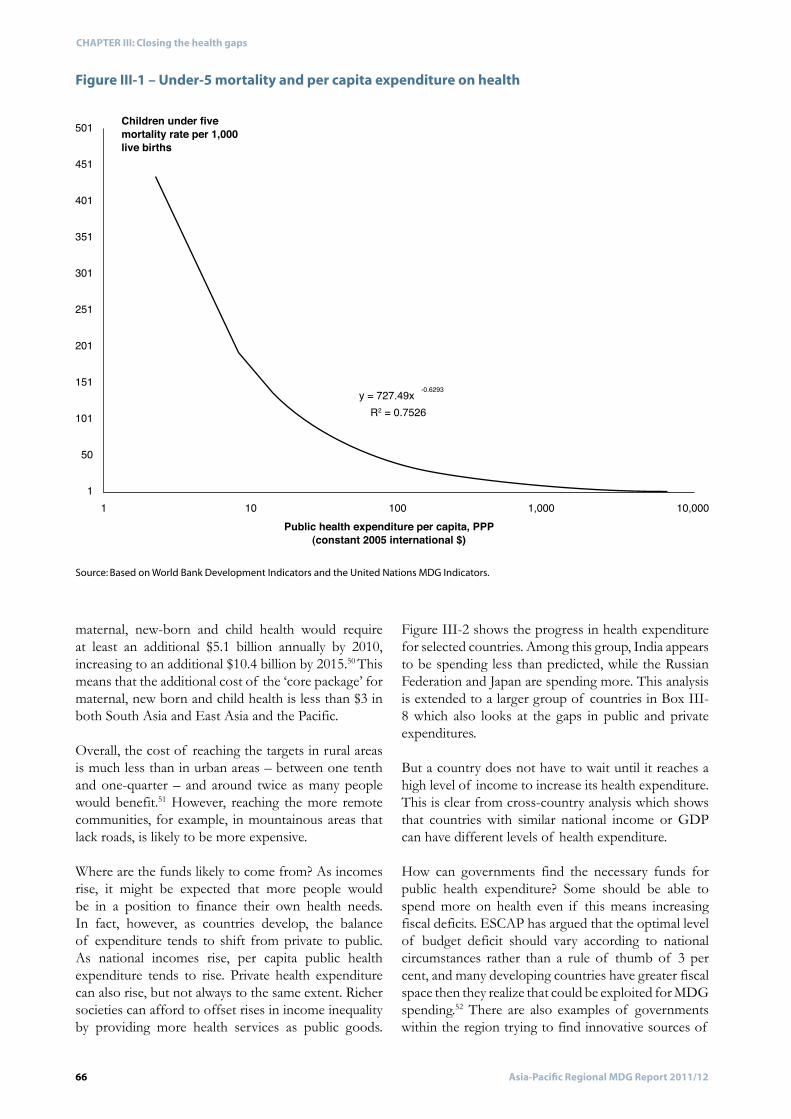
Figure III-1 – Under-5 mortality and per capita expenditure on health
Source: Based on World Bank Development Indicators and the United Nations MDG Indicators.
501
451
401
351
301
251
201
151
101
50
11 10
y = 727.49xR2 = 0.7526
-0.6293
100Public health expenditure per capita, PPP
(constant 2005 international $)
Children under fivemortality rate per 1,000live births
1,000 10,000
67Asia-Pacific Regional MDG Report 2011/12
CHAPTER III: Closing the health gaps
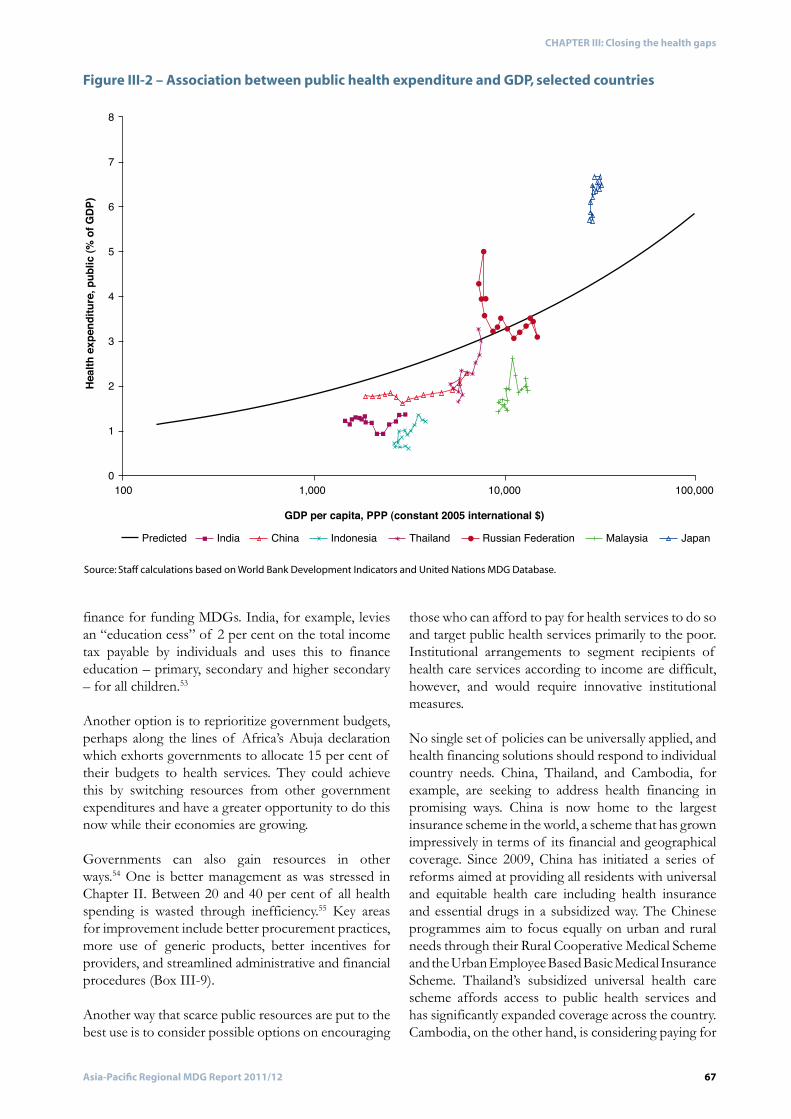
Figure III-2 – Association between public health expenditure and GDP, selected countries
Source: Staff calculations based on World Bank Development Indicators and United Nations MDG Database.
GDP per capita, PPP (constant 2005 international $)
Healt
h ex
pend
iture
, pub
lic (%
of G
DP)
100 1,000 10,000 100,000
8
7
6
5
4
3
2
1
0
Predicted India China Indonesia Thailand Russian Federation Malaysia Japan
68 Asia-Pacific Regional MDG Report 2011/12
CHAPTER III: Closing the health gaps
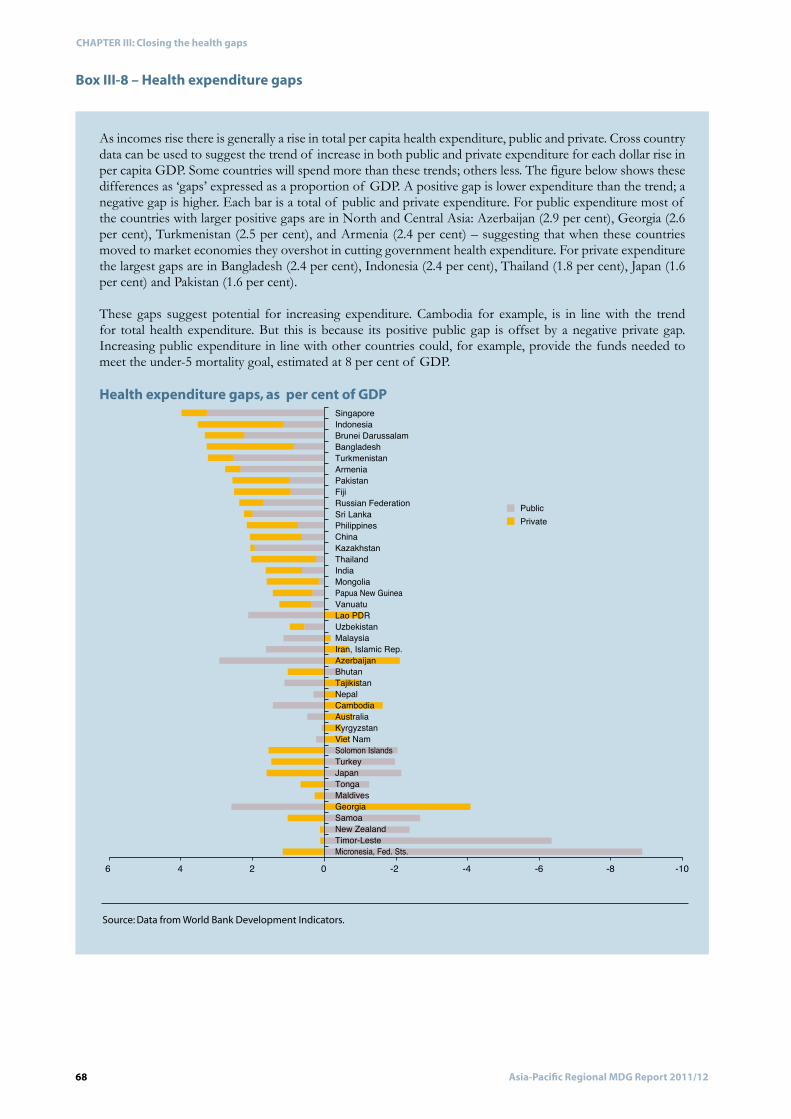
Box III-8 – Health expenditure gaps
Health expenditure gaps, as per cent of GDP
Source: Data from World Bank Development Indicators.
PublicPrivate
6 4 2 0 -2 -4 -6 -8 -10
SingaporeIndonesiaBrunei DarussalamBangladeshTurkmenistanArmeniaPakistanFijiRussian FederationSri LankaPhilippinesChinaKazakhstanThailandIndiaMongoliaPapua New GuineaVanuatuLao PDRUzbekistanMalaysiaIran, Islamic Rep.AzerbaijanBhutanTajikistanNepalCambodiaAustraliaKyrgyzstanViet NamSolomon IslandsTurkeyJapanTongaMaldivesGeorgiaSamoaNew ZealandTimor-LesteMicronesia, Fed. Sts.
69Asia-Pacific Regional MDG Report 2011/12
CHAPTER III: Closing the health gaps
6. Improve the governance of health systems
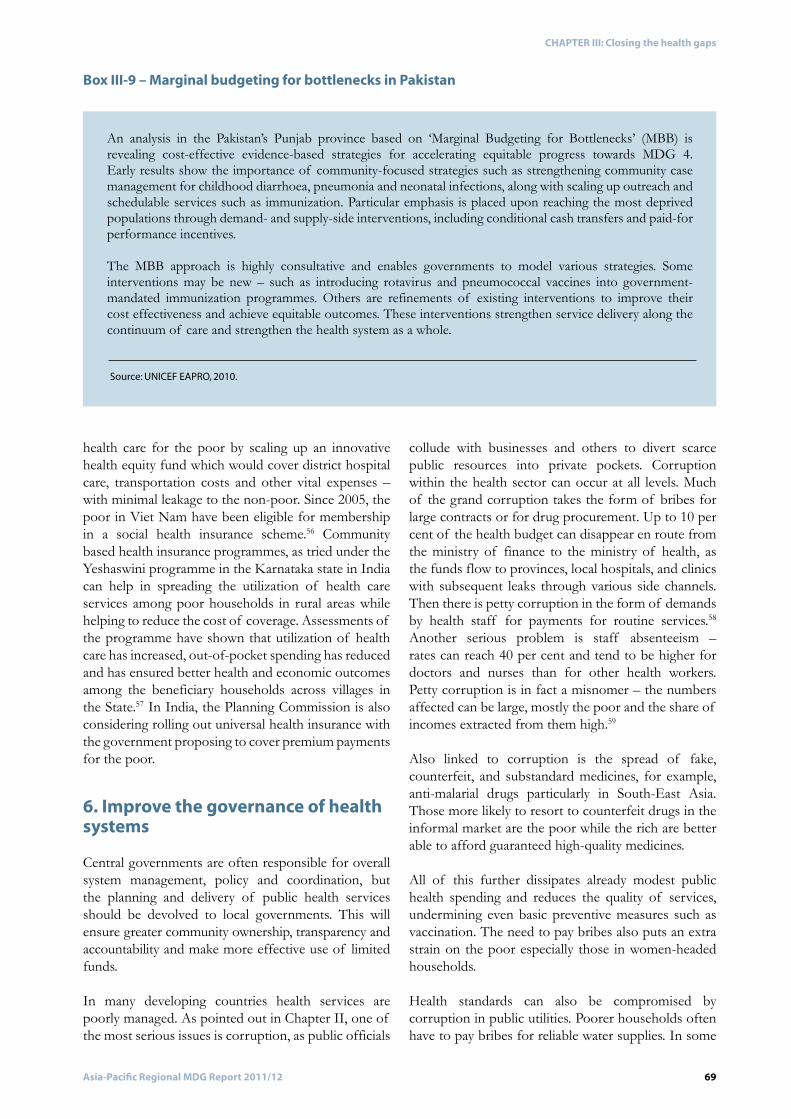
Box III-9 – Marginal budgeting for bottlenecks in Pakistan
Source: UNICEF EAPRO, 2010.
70 Asia-Pacific Regional MDG Report 2011/12
CHAPTER III: Closing the health gaps
7. Enhance the affordability of medicines through generics
71Asia-Pacific Regional MDG Report 2011/12
CHAPTER III: Closing the health gaps
8. Strengthen international partnership and regional cooperation
72 Asia-Pacific Regional MDG Report 2011/12
CHAPTER III: Closing the health gaps
Mutual inspiration
73Asia-Pacific Regional MDG Report 2011/12
CHAPTER III: Closing the health gaps
Chapter III Endnotes

75Asia-Pacific Regional MDG Report 2011/12
CHAPTER IV: Way Forward
CHAPTER IVWay Forward
76 Asia-Pacific Regional MDG Report 2011/12
CHAPTER IV: Way Forward
MDGs Beyond 20151
77Asia-Pacific Regional MDG Report 2011/12
CHAPTER IV: Way Forward
Chapter IV Endnotes
78 Asia-Pacific Regional MDG Report 2011/12
BIBLIOGRAPHY
BIBLIOGRAPHY
79Asia-Pacific Regional MDG Report 2011/12
BIBLIOGRAPHY
80 Asia-Pacific Regional MDG Report 2011/12
BIBLIOGRAPHY
81Asia-Pacific Regional MDG Report 2011/12
STATISTICAL APPENDIX
STATISTICAL APPENDIXTechnical Note 1: MDG process classification
Data sources
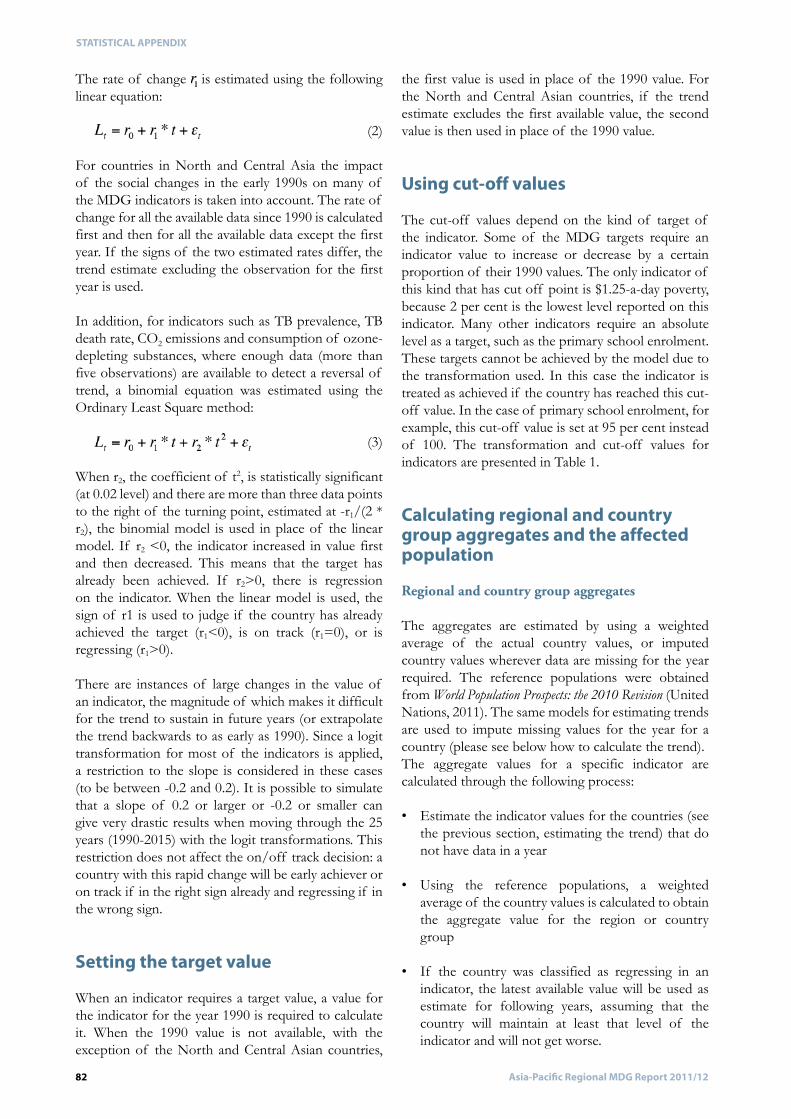
Determining the progress in achieving a MDG target
82 Asia-Pacific Regional MDG Report 2011/12
STATISTICAL APPENDIX
Setting the target value
Using cut-off values
Calculating regional and country group aggregates and the affected population
Regional and country group aggregates
83Asia-Pacific Regional MDG Report 2011/12
STATISTICAL APPENDIX
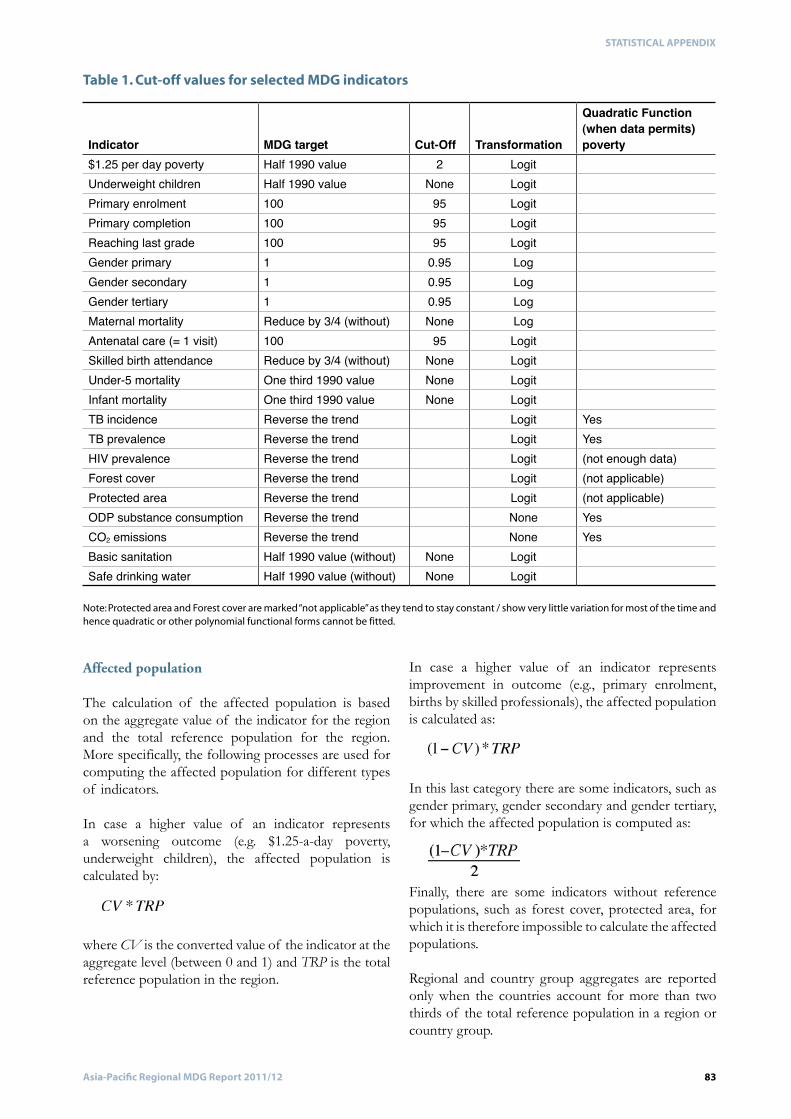
Table 1. Cut-off values for selected MDG indicators
Note: Protected area and Forest cover are marked “not applicable” as they tend to stay constant / show very little variation for most of the time and hence quadratic or other polynomial functional forms cannot be fitted.
Affected population
84 Asia-Pacific Regional MDG Report 2011/12
STATISTICAL APPENDIX
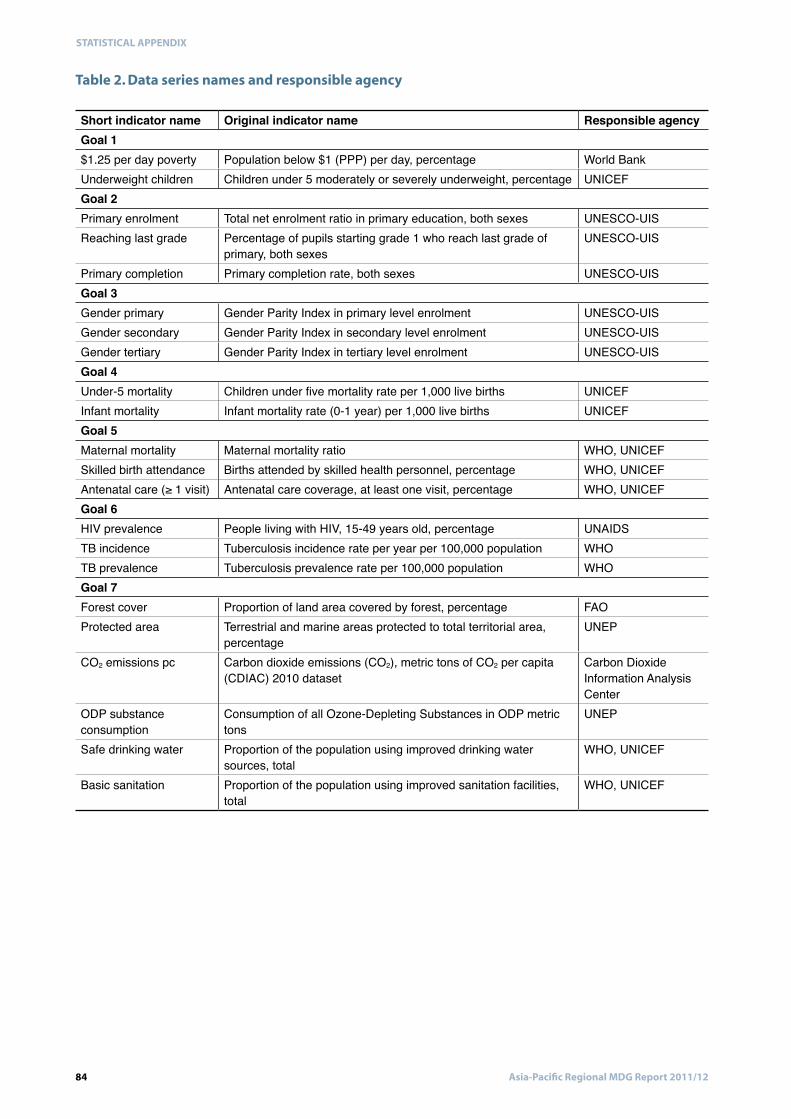
Table 2. Data series names and responsible agency
85Asia-Pacific Regional MDG Report 2011/12
STATISTICAL APPENDIX
Data and Methodology Results
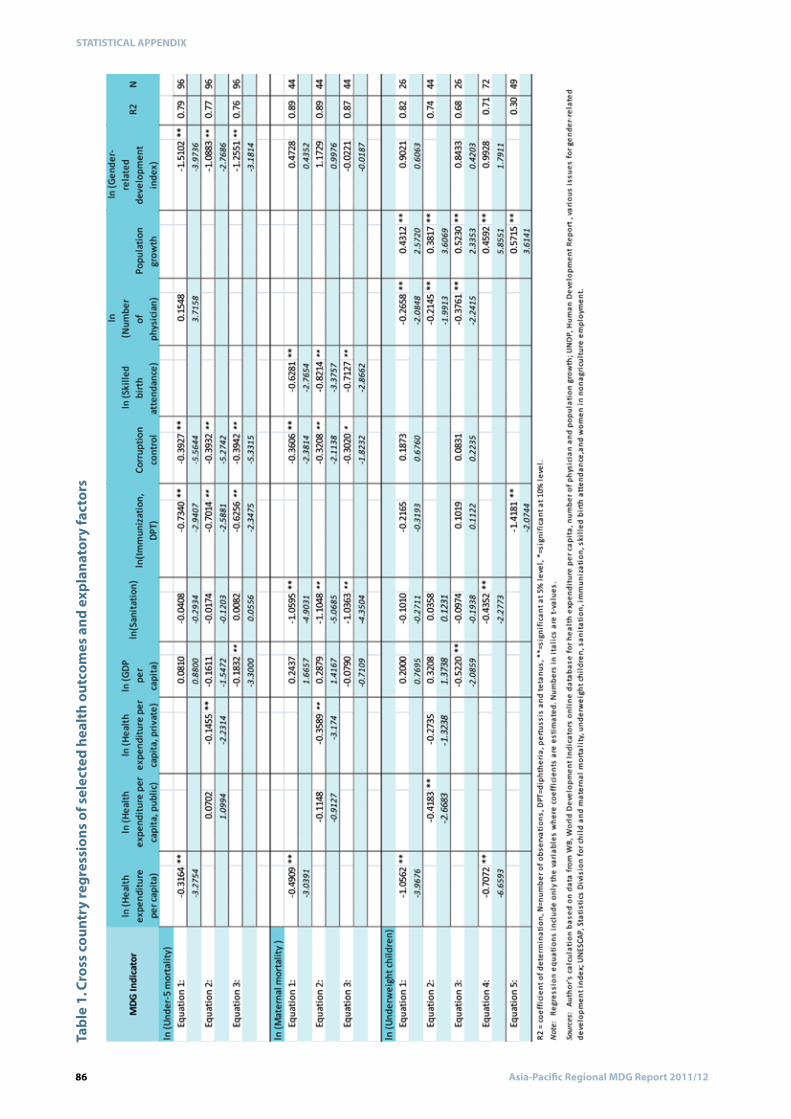
Technical Note 2: Factors explaining disparities between countries
86 Asia-Pacific Regional MDG Report 2011/12
STATISTICAL APPENDIX
Tab
le 1
. Cro
ss c
ount
ry re
gre
ssio
ns
of s
elec
ted
hea
lth
ou
tcom
es a
nd
exp
lan
ator
y fa
ctor
s
87Asia-Pacific Regional MDG Report 2011/12
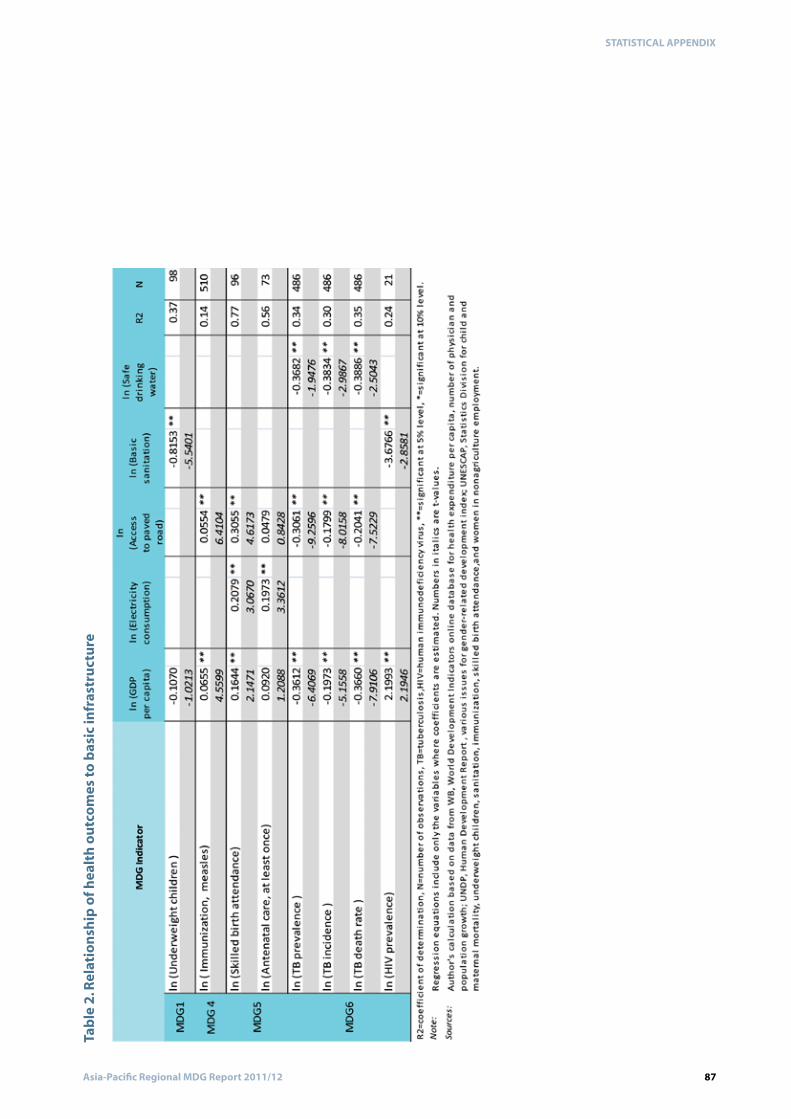
STATISTICAL APPENDIX
Tab
le 2
. Rel
atio
nsh
ip o
f hea
lth
ou
tcom
es to
bas
ic in
fras
tru
ctu
re
88 Asia-Pacific Regional MDG Report 2011/12
STATISTICAL APPENDIX
Technical Note 3: Accounting for disparities between countries
89Asia-Pacific Regional MDG Report 2011/12
STATISTICAL APPENDIX
References
90 Asia-Pacific Regional MDG Report 2011/12
STATISTICAL APPENDIX
Definitions
i. Child nutrition status
ii. Child mortality
iii. Use of maternal health care services
Technical Note 4: Analysis of disparities within countries
91Asia-Pacific Regional MDG Report 2011/12
STATISTICAL APPENDIX
iv. Access to improved drinking water source and improved sanitation facility
Data sources
92 Asia-Pacific Regional MDG Report 2011/12
STATISTICAL APPENDIX
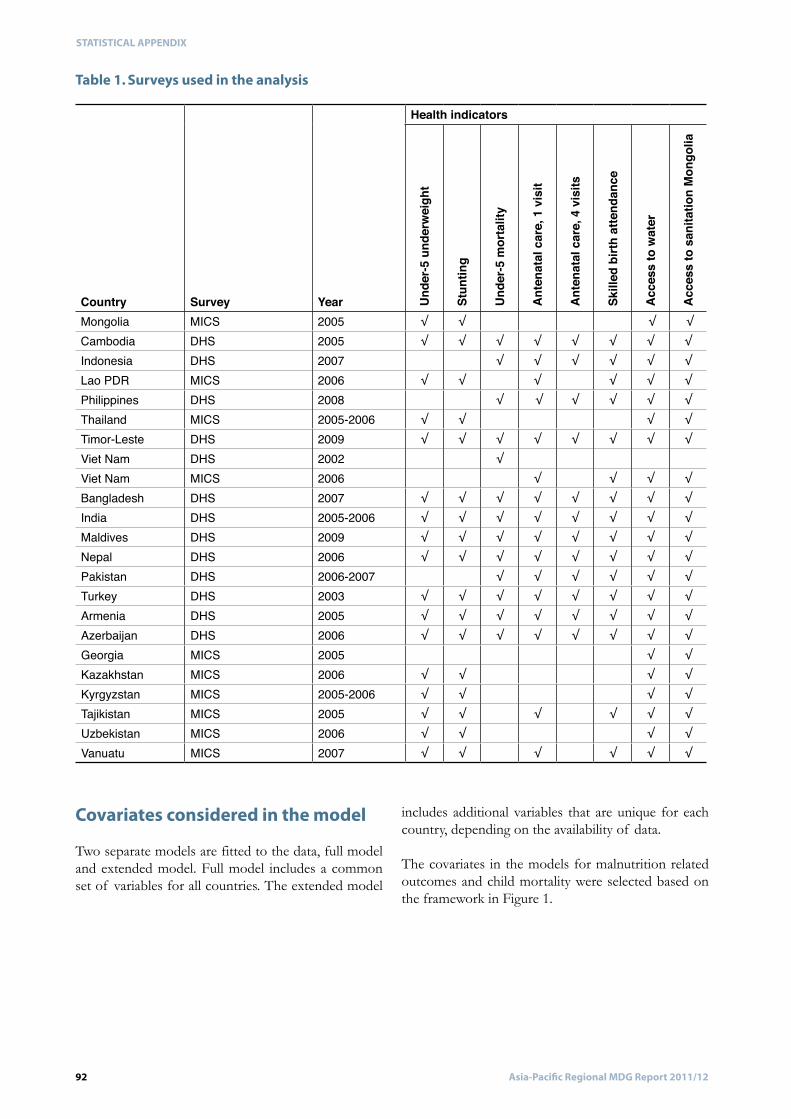
Table 1. Surveys used in the analysis
Covariates considered in the model
93Asia-Pacific Regional MDG Report 2011/12
STATISTICAL APPENDIX
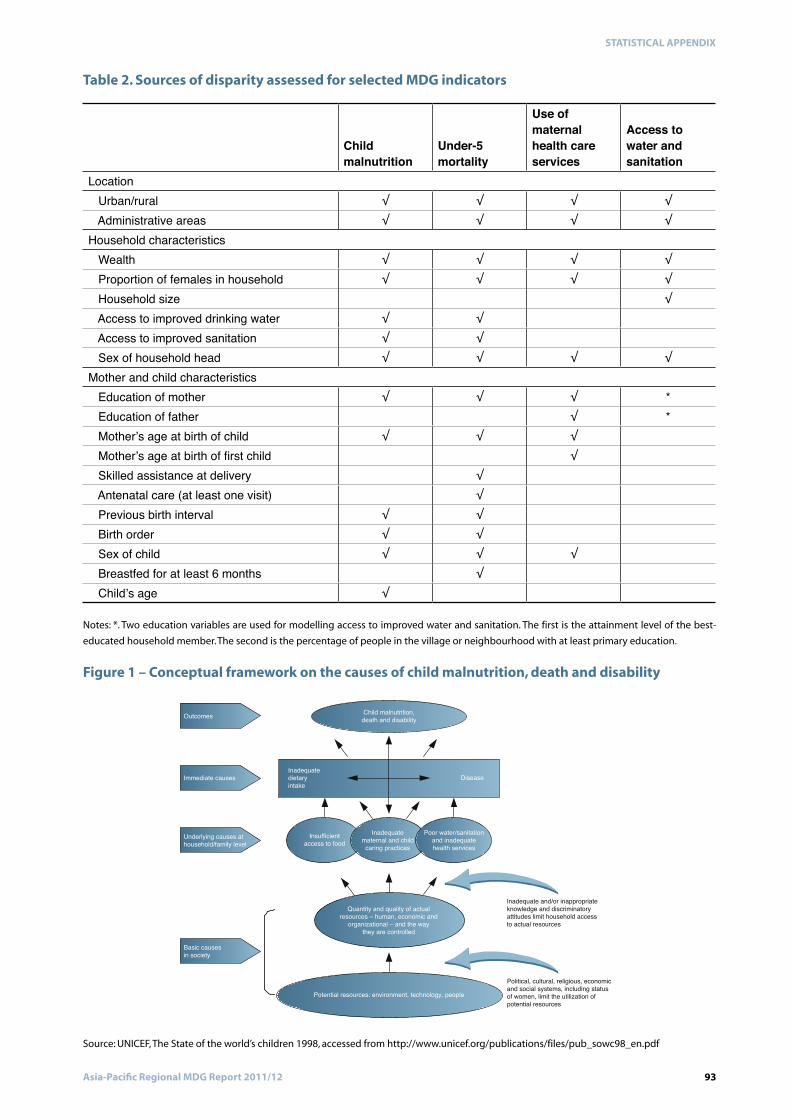
Table 2. Sources of disparity assessed for selected MDG indicators
Notes: *. Two education variables are used for modelling access to improved water and sanitation. The first is the attainment level of the best-
educated household member. The second is the percentage of people in the village or neighbourhood with at least primary education.
Figure 1 – Conceptual framework on the causes of child malnutrition, death and disability
Source: UNICEF, The State of the world’s children 1998, accessed from http://www.unicef.org/publications/files/pub_sowc98_en.pdf
94 Asia-Pacific Regional MDG Report 2011/12
STATISTICAL APPENDIX
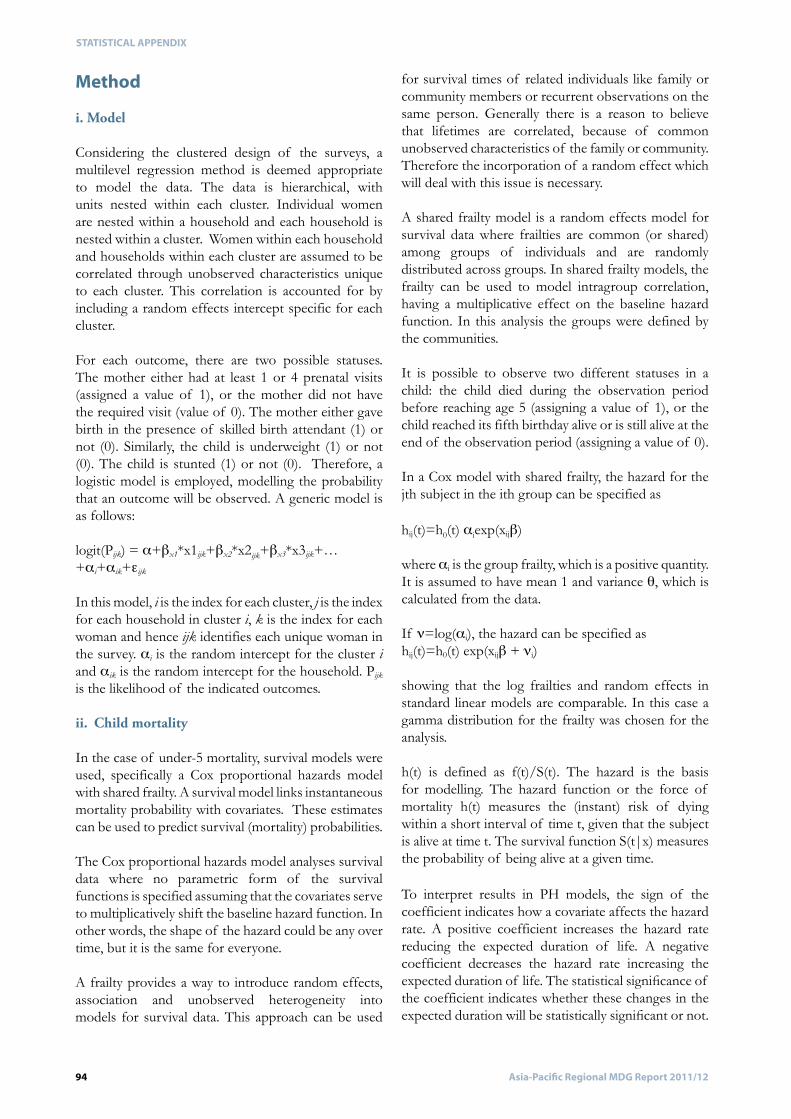
Method
i. Model
ii. Child mortality
95Asia-Pacific Regional MDG Report 2011/12
STATISTICAL APPENDIX
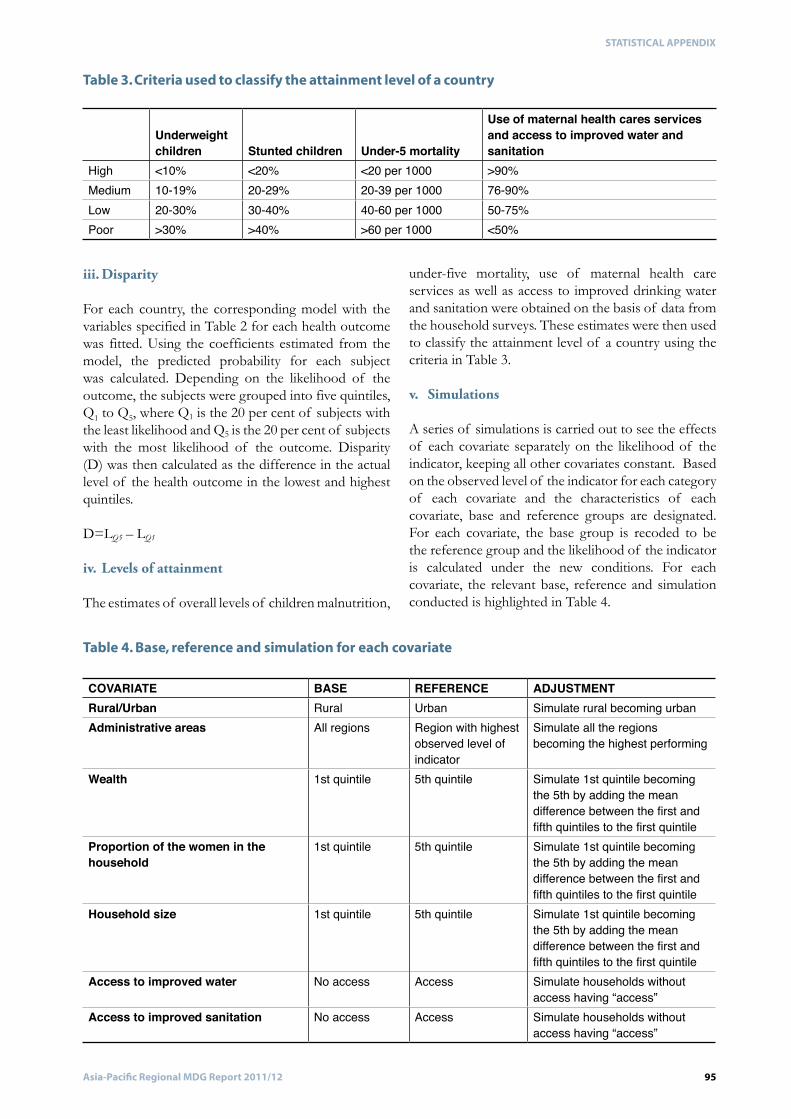
iii. Disparity
iv. Levels of attainment
v. Simulations
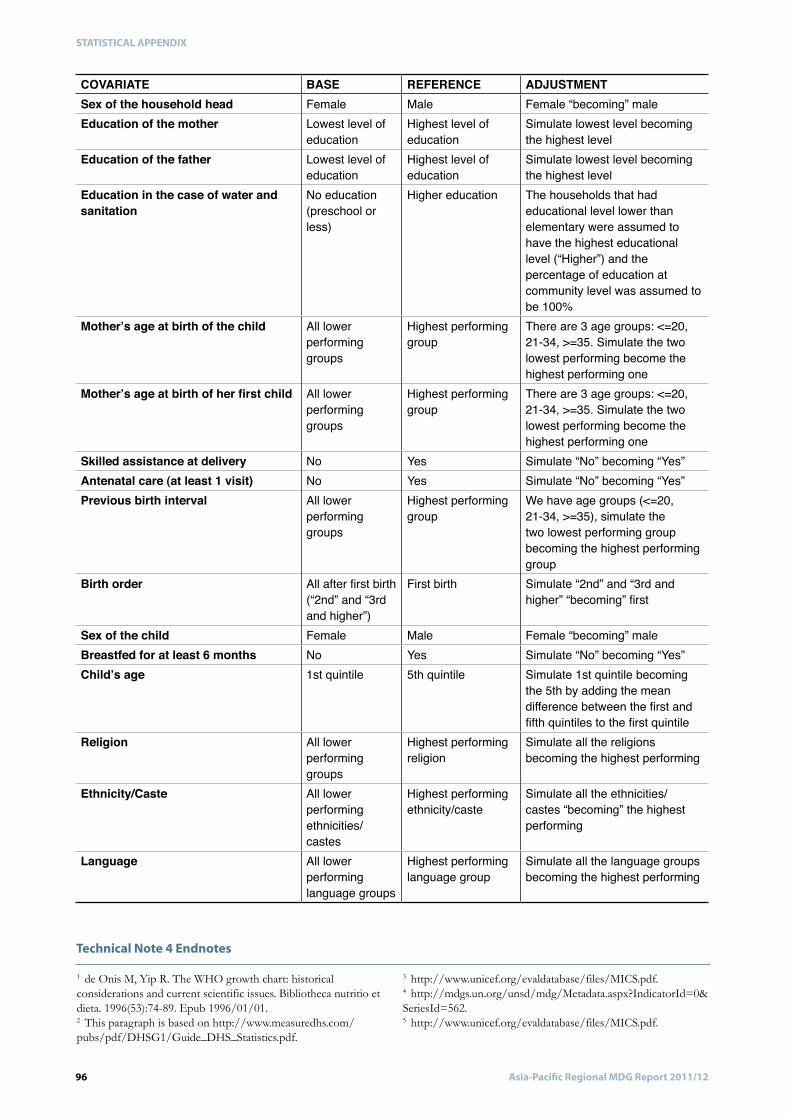
Table 4. Base, reference and simulation for each covariate
Table 3. Criteria used to classify the attainment level of a country
96 Asia-Pacific Regional MDG Report 2011/12
STATISTICAL APPENDIX
Technical Note 4 Endnotes
97Asia-Pacific Regional MDG Report 2011/12
STATISTICAL APPENDIX
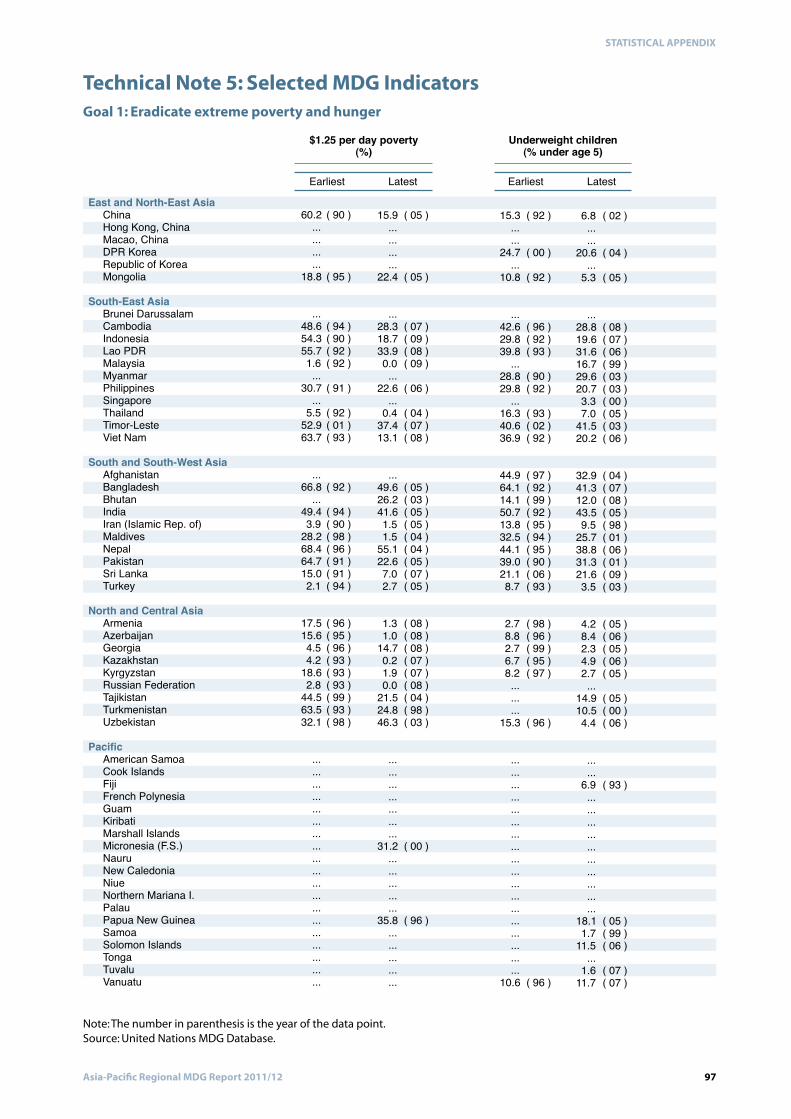
Goal 1: Eradicate extreme poverty and hunger
Note: The number in parenthesis is the year of the data point. Source: United Nations MDG Database.
Technical Note 5: Selected MDG Indicators
98 Asia-Pacific Regional MDG Report 2011/12
STATISTICAL APPENDIX
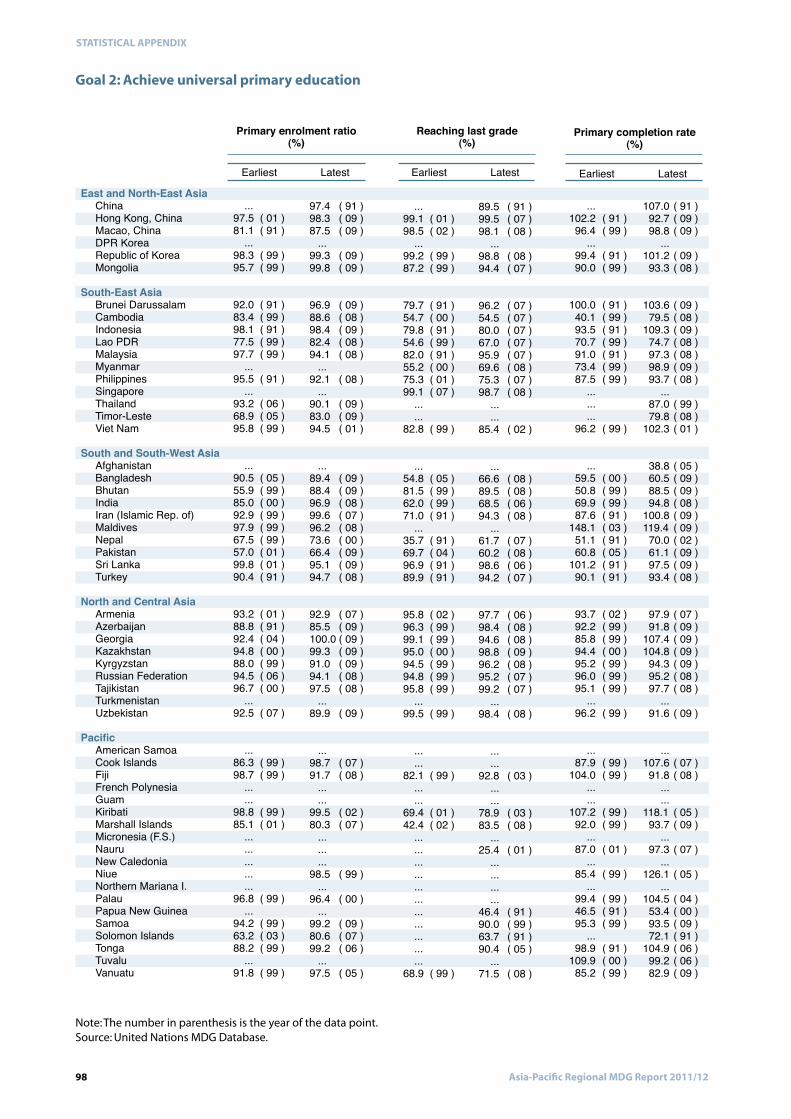
Goal 2: Achieve universal primary education
Note: The number in parenthesis is the year of the data point. Source: United Nations MDG Database.
99Asia-Pacific Regional MDG Report 2011/12
STATISTICAL APPENDIX
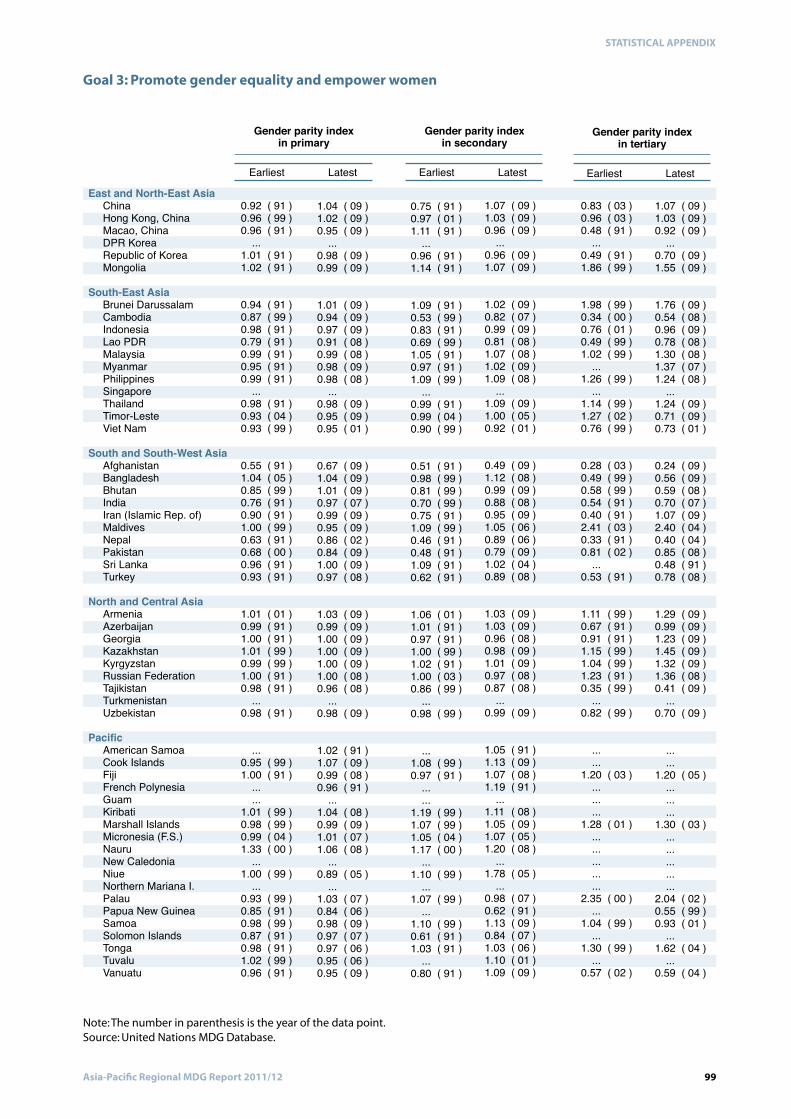
Goal 3: Promote gender equality and empower women
Note: The number in parenthesis is the year of the data point. Source: United Nations MDG Database.
100 Asia-Pacific Regional MDG Report 2011/12
STATISTICAL APPENDIX
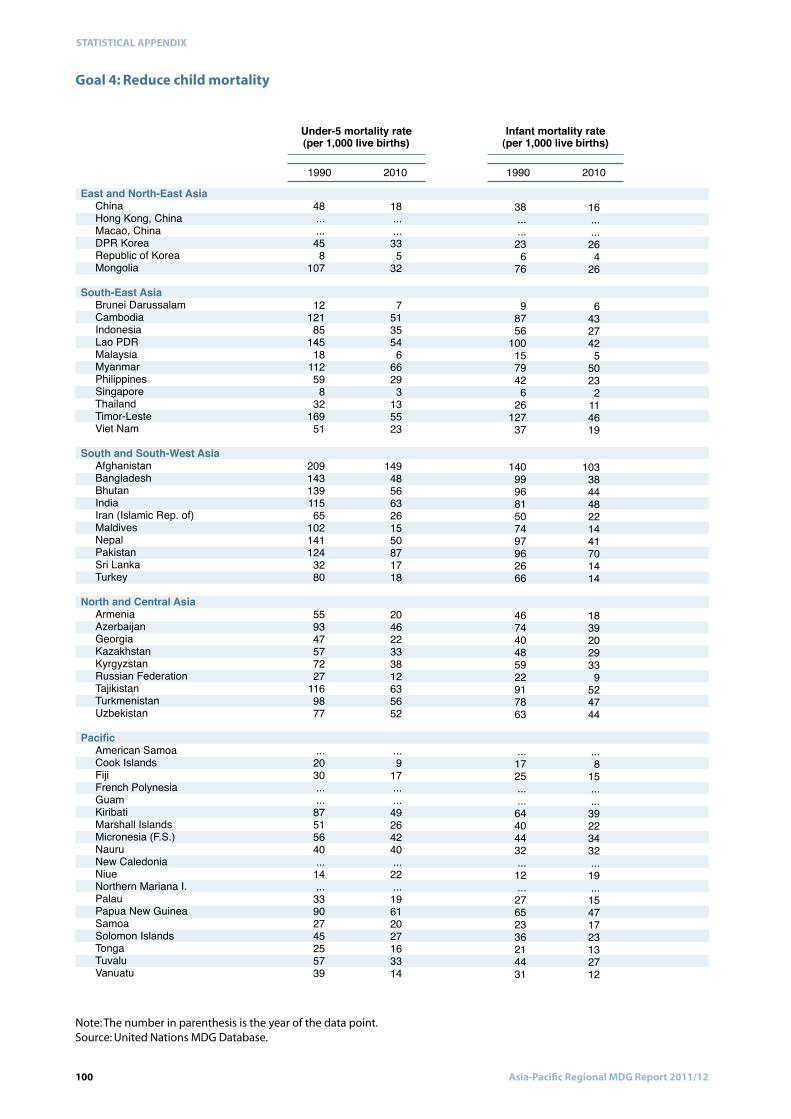
Goal 4: Reduce child mortality
Note: The number in parenthesis is the year of the data point. Source: United Nations MDG Database.
101Asia-Pacific Regional MDG Report 2011/12
STATISTICAL APPENDIX
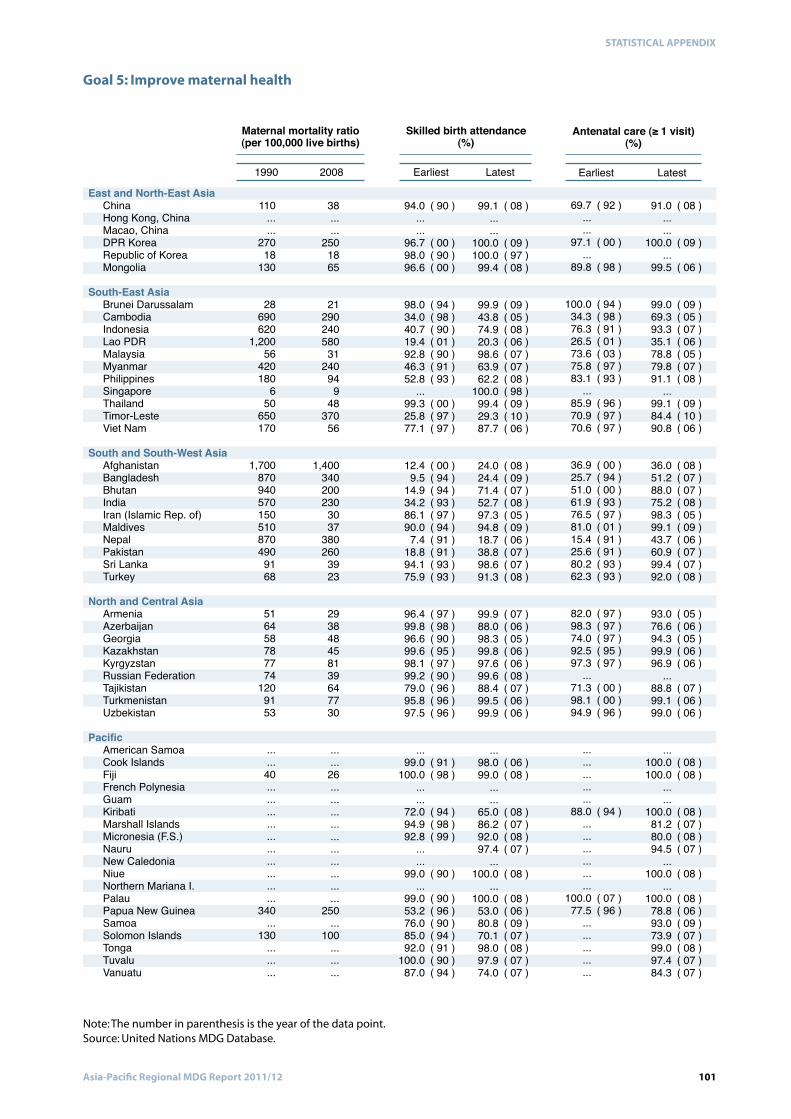
Goal 5: Improve maternal health
Note: The number in parenthesis is the year of the data point. Source: United Nations MDG Database.
102 Asia-Pacific Regional MDG Report 2011/12
STATISTICAL APPENDIX
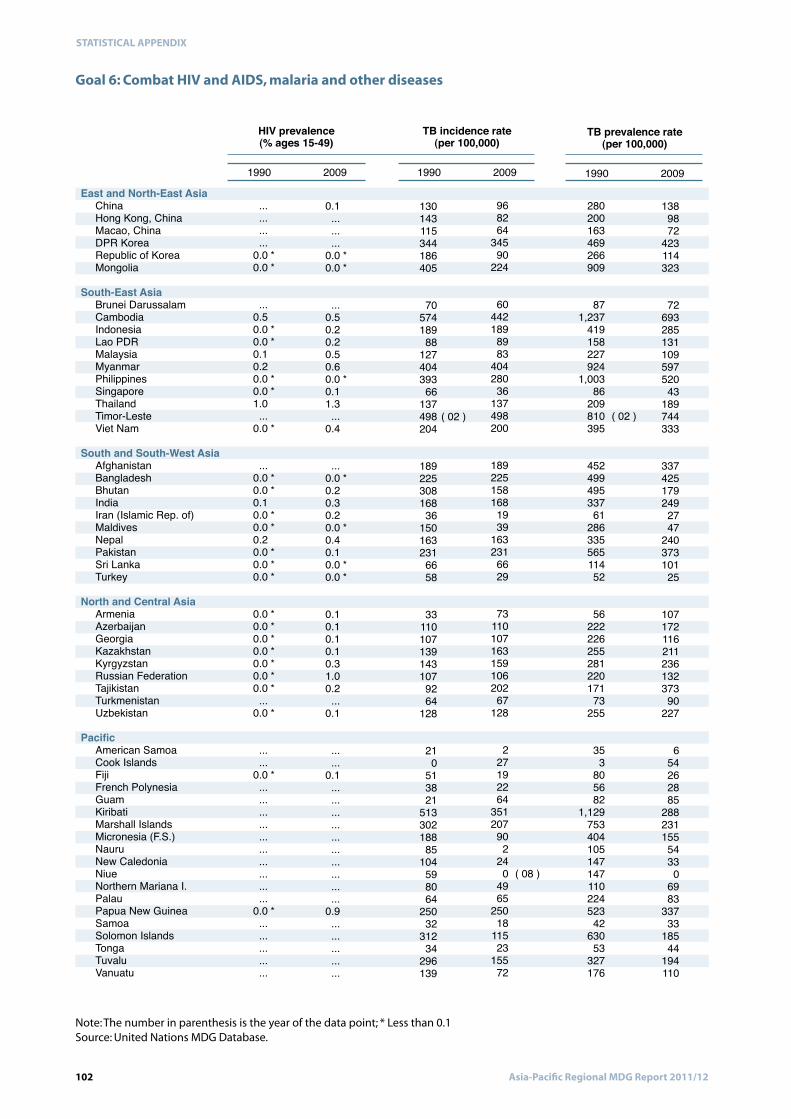
Goal 6: Combat HIV and AIDS, malaria and other diseases
Note: The number in parenthesis is the year of the data point; * Less than 0.1 Source: United Nations MDG Database.
103Asia-Pacific Regional MDG Report 2011/12
STATISTICAL APPENDIX
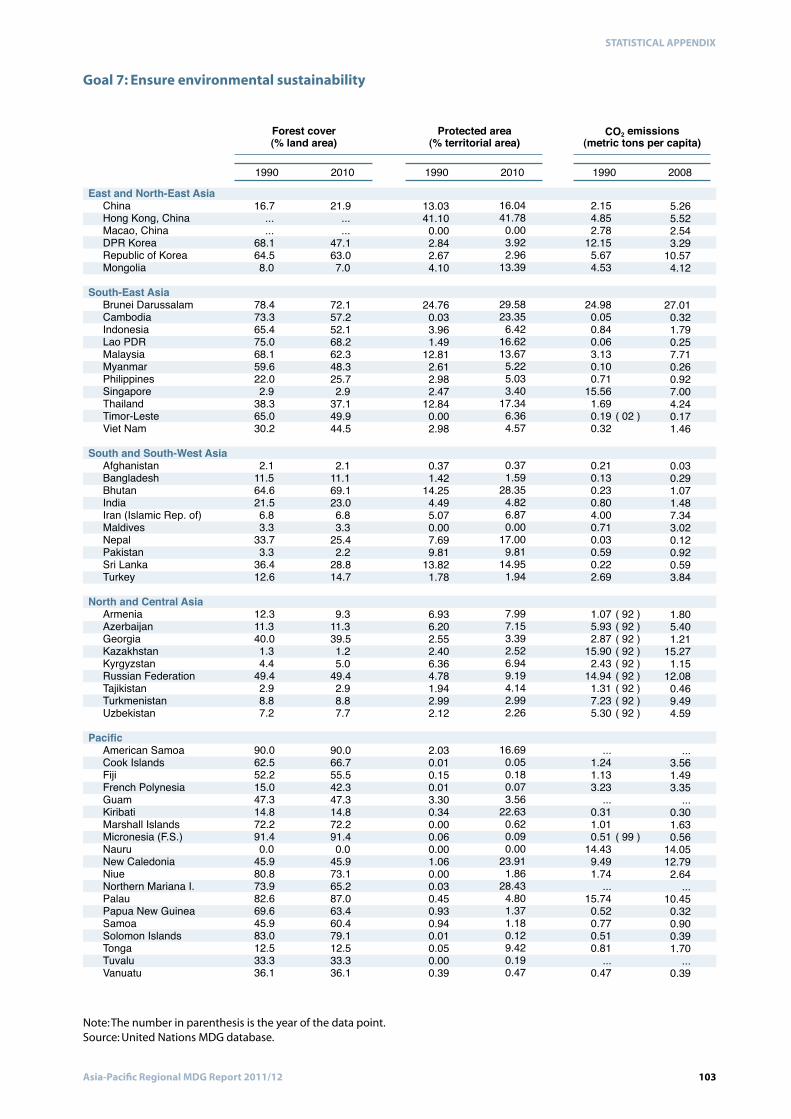
Goal 7: Ensure environmental sustainability
Note: The number in parenthesis is the year of the data point. Source: United Nations MDG database.
104 Asia-Pacific Regional MDG Report 2011/12
STATISTICAL APPENDIX
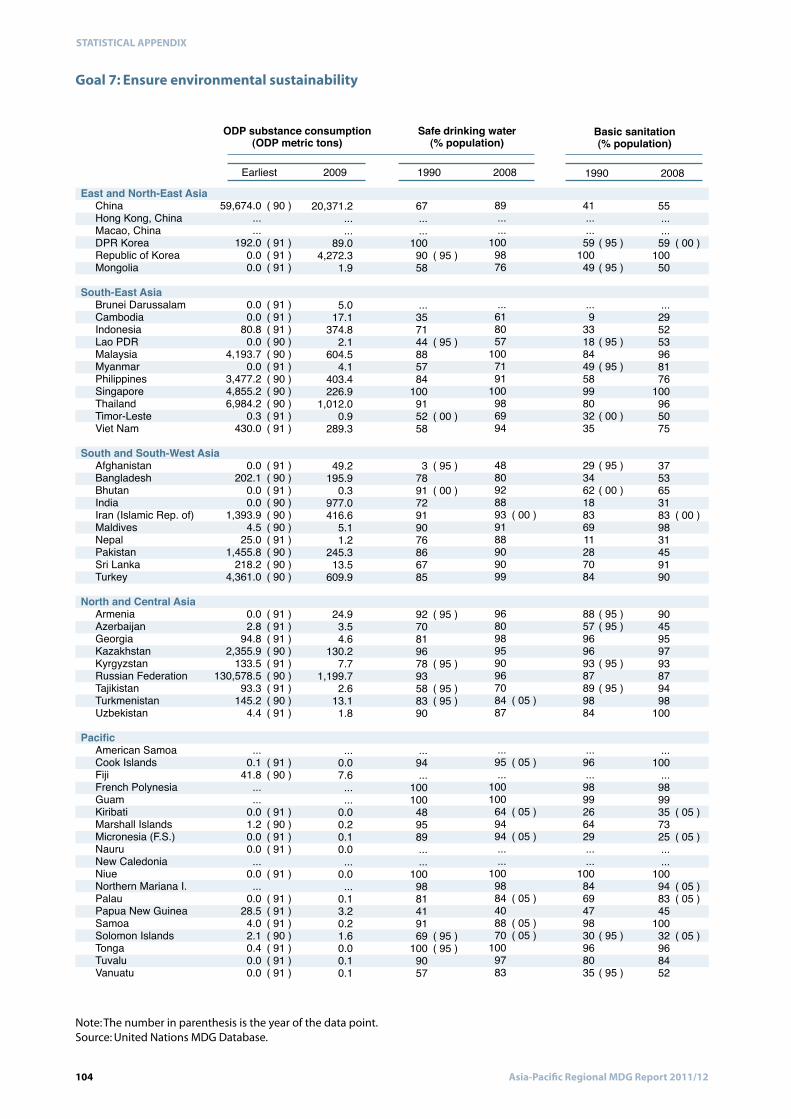
Goal 7: Ensure environmental sustainability
Note: The number in parenthesis is the year of the data point. Source: United Nations MDG Database.