Embed Size (px)
Citation preview
|企画書タイトル|March 1, 2015 1|企画書タイトル|March 1, 2015
Acquisition of HCC
June 10, 2015
Significant international expansion by Tokio Marine
Tokio Marine Holdings, Inc.President, Tsuyoshi Nagano
Additional Important Information About the Proposed Merger and Where to Find It This communication relates to a proposed merger between HCC and a subsidiary of Tokio Marine Holdings, Inc. that will be the subject of a proxy statement that HCC intends to file with the U.S. Securities and Exchange Commission (the “SEC”). This communication does not constitute an offer to sell or the solicitation of an offer to buy any securities or a solicitation of any vote or approval, and is not a substitute for the proxy statement or any other document that HCC may file with the SEC or send to its stockholders in connection with the proposed merger. Investors and stockholders are urged to read the proxy statement and all other relevant documents filed with the SEC or sent to HCC’s stockholders as they become available, because they will contain important information about the proposed merger. All documents, when filed, will be available free of charge at the SEC’s website (www.sec.gov). You may also obtain documents filed by HCC with the SEC by contacting HCC at Investor Relations, HCC Insurance Holdings, Inc., 13403 Northwest Freeway, Houston, Texas 77040, by email at [email protected] or by visiting HCC’s website at www.hcc.com.
Participants in the SolicitationTokio Marine Holdings, Inc. and HCC and its directors, executive officers and other members of management and employees may be deemed to be participants in any solicitation of proxies in connection with the proposed merger. Information about HCC’s directors and executive officers is available in HCC’s proxy statement dated April 9, 2015 for its 2015 Annual Meeting of Stockholders. Other information regarding the participants in the proxy solicitation and a description of their direct and indirect interests, by security holdings or otherwise, will be contained in the proxy statement and other relevant materials to be filed with the SEC regarding the merger when they become available. Investors and stockholders should read the proxy statement carefully when it becomes available before making any investment or voting decisions.
Cautionary Statement Regarding Forward-Looking Statements This communication and other written or oral statements made by or on behalf of HCC or Tokio Marine contain forward-looking statements within the meaning of Section 27A of the Securities Act of 1933, as amended, and Section 21E of the Securities Exchange Act of 1934, as amended, that are made under the “safe harbor” provisions of The Private Securities Litigation Reform Act of 1995. In particular, statements using words such as “may,” “will,” “should,” “estimate,” “expect,” “anticipate,” “intend,” “believe,” “predict,” “plan,” “project,” “continue” or “potential,” or their negatives or variations, and similar terminology and words of similar import, generally involve forward-looking statements. Forward-looking statements reflect HCC’s or Tokio Marine’s current views, plans or expectations with respect to future events and financial performance. They are inherently subject to significant business, economic, competitive and other risks, uncertainties and contingencies. The inclusion of forward-looking statements in this or any other communication should not be considered as a representation by HCC, Tokio Marine or any other person that current plans or expectations will be achieved. Forward-looking statements speak only as of the date on which they are made, and neither HCC nor Tokio Marine undertakes any obligation to update publicly or revise any forward-looking statement, whether as a result of new information, future developments or otherwise, except as otherwise required by law.There are or will be important factors that could cause actual results to differ materially from those expressed in any such forward-looking statements, including but not limited to the following: the occurrence of any event, change or other circumstance that could give rise to the termination of the merger agreement; required governmental approvals of the merger may not be obtained or may not be obtained on the terms expected or on the anticipated schedule, and adverse regulatory conditions may be imposed in connection with any such governmental approvals; HCC’s stockholders may fail to approve the merger; the parties to the merger agreement may fail to satisfy other conditions to the completion of the merger, or may not be able to meet expectations regarding the timing and completion of the merger; operating costs, customer loss and business disruption (including, without limitation, difficulties in maintaining relationships with employees, customers or suppliers) may be greater than expected following the announcement of the proposed merger; HCC may be unable to retain key personnel; the amount of the costs, fees, expenses and other charges related to the proposed merger; and other factors affecting future results disclosed in HCC’s filings with the SEC, including but not limited to those discussed under Item 1A, “Risk Factors”, in HCC’s Annual Report on Form 10-K for the year ended December 31, 2014, which are incorporated herein by reference.
Disclaimer
2

Discussion Topics
Overview of the Transaction
Key Strengths of HCC
Strategic Rationale of the Transaction
Appendices
3
1
2
3
Strategic Rationale of the Transaction
Key Strengths of HCC
Transaction Highlights
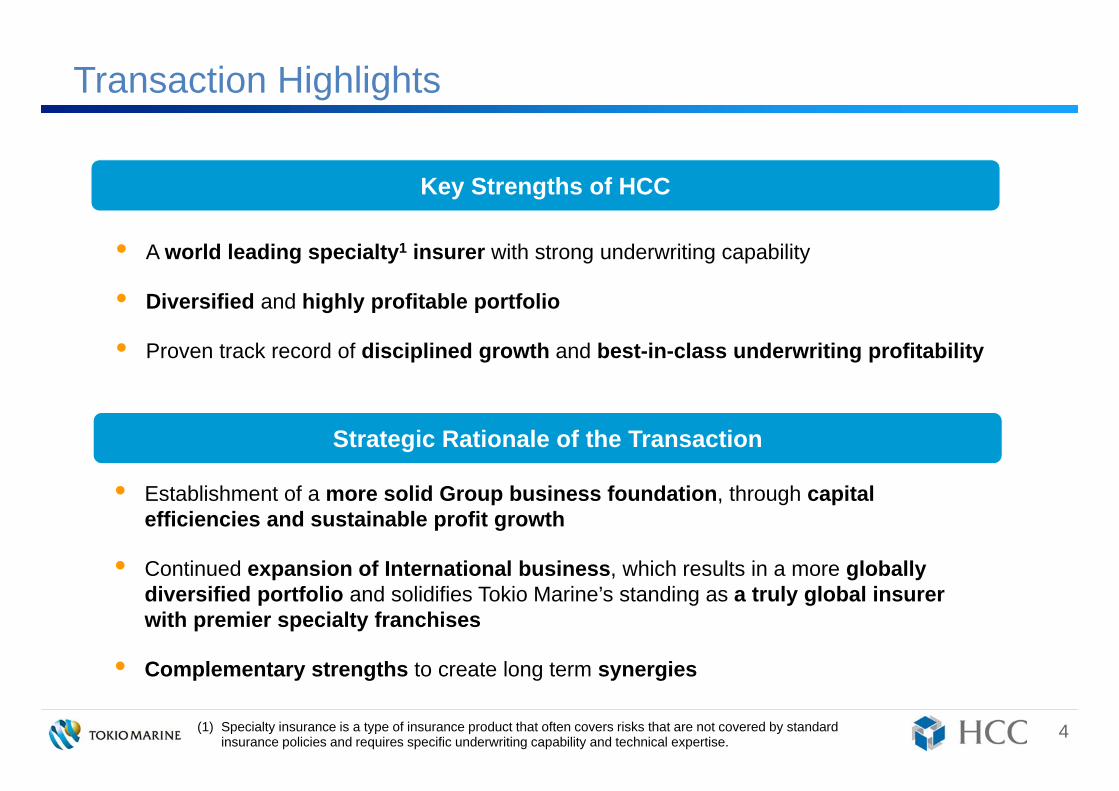
• Establishment of a more solid Group business foundation, through capital efficiencies and sustainable profit growth
• Continued expansion of International business, which results in a more globally diversified portfolio and solidifies Tokio Marine’s standing as a truly global insurer with premier specialty franchises
• Complementary strengths to create long term synergies
• A world leading specialty1 insurer with strong underwriting capability
• Diversified and highly profitable portfolio
• Proven track record of disciplined growth and best-in-class underwriting profitability
4(1) Specialty insurance is a type of insurance product that often covers risks that are not covered by standard insurance policies and requires specific underwriting capability and technical expertise.

Overview of the Transaction1
5

Transaction Structure
Transaction Structure and Key Terms
• Acquisition of 100% of the outstanding shares of HCC by TMNF in cash
Consideration
• $78.00 per HCC share / approximately $7.5 billion1 (JPY 940 billion2) total consideration
• 1.90x book value per share as of March 31, 2015• 35.8% premium to HCC’s average share price over the past one month,
37.6% premium to closing price of $56.69 on June 9, 2015• Implied maximum goodwill of $4.5 billion (JPY 560 billion2)
• Cash on hand together with external funding (no equity financing)
Required Approvals
• Approval of HCC shareholders• Customary regulatory approvals
ExpectedClosing Date
• During October to December in 2015
Management • Highly experienced HCC management team to continue to lead the business
Funding
6
(1) Tokio Marine received opinions from each of Credit Suisse Securities (USA) LLC and Evercore Group LLC, dated June 9, 2015, to the effect that, based upon and subject to assumptions made, procedures followed, matters considered and limitations on review undertaken by each such financial advisor, in each case noted in the respective opinion, the consideration to be paid in the Transaction was fair, from a financial point of view, to Tokio Marine. (2) FX rate ($1=125 JPY).

Key Strengths of HCC 2
7

Key Strengths of HCC
A World Leading Specialty Insurer
Disciplined Growth and Best-in-Class
Underwriting Profitability
Diverse and Highly Profitable
Portfolio
• Specialty businesses that require strong underwriting technical expertise
• Market leading positions in A&H, D&O, agriculture and other specialty lines
• Over 100 classes of largely non-correlated lines of business• Less dependent on the traditional P&C market cycles• Limited exposure to natural catastrophe risks
• History of disciplined growth / best-in-class underwriting profitability
• Sustainable profit generation with low volatility• Superior long term value creation• Financial strength with solid Enterprise Risk Management
8

Pre-Tax Earnings (2014)
North America P&C
Accident & Health
International
Details of Key Segments
A World Leading Specialty Insurer
Company Overview• Founded in 1974; listed on NYSE with a market cap of $5.5 billion (JPY
688 billion2)
• Headquartered in Houston, Texas with offices in the United States, the United Kingdom, Spain and Ireland
• Chairman: Robert A. Rosholt; CEO: Christopher J.B. Williams
• Credit ratings: S&P: AA (Very Strong) <ERM: strong>; AM Best: A+ (Superior); Moody’s A1 (Good Security); Fitch: AA (Very Strong)
• Approximately 2,500 employees
• Comprised of D&O, agriculture, primary casualty, aviation, surety, sports & entertainment disability / contingency, public risk, etc.
• Comprised of medical stop-loss and other short term medical products, etc.
• Comprised of energy & marine, property, A&H, D&O, professional indemnity, surety and credit, etc.
Financial Highlights (2014)
• GWP: $3,002M1
• Net Earnings: $458M
• Total Assets: $10,714M
• Book Value: $3,903M
• COR: 82.5%
• ROE: 12.1%
(1) On a proforma basis including ProAg acquisition on 1/1/15, GWP is $3.6bn. (2) FX rate ($1=125 JPY).
International(19%)
North America
P&C (49%)Accident
& Health (32%)
9

• Over 100 classes of specialty insurance products which are largely non-correlated • The vast majority of the lines of business are less dependent on the traditional
P&C market cycles• Limited exposure to natural catastrophe risks
Diverse and Highly Profitable Portfolio
After-Tax PML2 as % of Shareholders’ EquityHCC’s Gross Written Premiums1 Mix (2014)
(1) Proforma including agriculture; (2) 1/1/15 PML excludes reinstatement premium and is based on 1 in 250 year estimates from RMS models and internal PML estimates for lines not modeled in RMS.
0.7%
1.1%0.9%
2.1%
1.1%
2.0%
1 in 100 1 in 250
CA Earthquake European Wind US Named Wind
10
LOBs that are less dependent
on the P&C market cycles (approx. 58%)
D&O 15%US Liability 5%Aviation 4%Energy & Marine 4%Property Treaty 4%Other Specialty 4%International Liability 3%Other International 2%Public Risk 2%
Medical Stop-loss 25%Agriculture 16%US Surety 5%Sports & Entertainment 4%International Surety & Credit 3%Other A&H 3%US Credit 2%
Total 58%
Total 42%

History of Disciplined Growth
11
Disciplined profit growth due to its consistent underwriting expertiseand lowest expense ratio among its industry peers
Total Historical Net Earnings
Source: 10K reports of HCC and HCC management.
$160m$192m
$338m$392m
$302m$354m $345m
$255m
$391m $407m$458m
2004 2005 2006 2007 2008 2009 2010 2011 2012 2013 2014
CAGR: 11.1%

Combined Ratio – HCC vs. Peers
Best-in-Class Underwriting Profitability
(1) Source: HCC investor presentation. SEC filings. Peers reflect average for peer companies (AFG, Argo, Chubb, Markel, Navigators, Old Republic, RLI, Travelers and WRB). (2) Reflects average for three-year, five-year and ten-year result.
COR of HCC is consistently lower than the peer average, demonstrating strong focus on underwriting profitability
HCC Peers1
1 Year 3-Year2 5-Year2
HCC Peers1 HCC Peers1 HCC Peers1
10-Year2
Outperformance (10.1%) (11.1%) (10.6%) (8.0%)
12
82.5% 83.5%85.5% 86.0%
92.6%94.6%
96.1%94.0%

Comparison of 10-Year Average Combined Ratio and its Variance (Standard Deviation) with Peers
Source:HCC investor presentation. Dowling & Partners; data through 12/31/14.
Sustainable Profit Generation with Low Volatility
HCC has one of the lowest average COR and the lowest volatility inCOR over the past 10 years
13
10 Y
ear A
vera
ge C
OR
Standard Deviation in COR
2nd Quintile 1st Quintile(Lowest)
5th Quintile (Highest) 4th Quintile 3rd Quintile
5th Quintile(Highest)
1st Quintile(Lowest)
2nd Quintile
3rd Quintile
4th Quintile
HCC◆Chubb
◆
W.R.Berkley◆
CNA◆
RLI◆
American Financial◆
Arch Capital◆
Markel◆
◆
Navigators◆
Travelers◆
White Mountains◆
Alleghany◆AXIS
Capital◆
Aspen◆
Everest Re◆
Allied World◆
ProAssurance ◆
Partner Re◆ Endurance
◆
ACE◆
XL Group◆
Hartford◆
Argo Group◆Baldwin & Lyons

15.9%15.4%14.1%13.9%13.8%13.8%
12.6%12.1%12.1%11.9%11.9%11.8%11.4%10.8%10.7%
10.1% 9.8% 9.7% 9.5%
6.8%6.2%
4.8%
1.8% 1.7%
Arch
HC
C
ACE
Trav
eler
s
ProA
ssur
ance
WR
Ber
kley
Chu
bb
Partn
er R
e
Mar
kel
AFG
RLI
AXIS
Allie
d W
orld
Nav
igat
ors
Ever
est R
e
Argo
Endu
ranc
e
Alle
ghan
y
Aspe
n
Whi
te M
ount
ains
Bald
win
& L
yons
CN
A
Har
tford
XL G
roup
Superior Long Term Value Creation
Source: HCC investor presentation. Dowling & Partners; data through 12/31/14.
Note: Total Value Creation is growth in tangible book value per share including dividends.
Total Value Creation CAGR (2004-2014)
• 15-Year Total Value Creation: HCC ranks 1st (19%)
• 20-Year Total Value Creation: HCC ranks 3rd (14%)
HCC is one of the best P&C companies in terms of long term value creation
14

Strategic Rationale of the Transaction
3
15
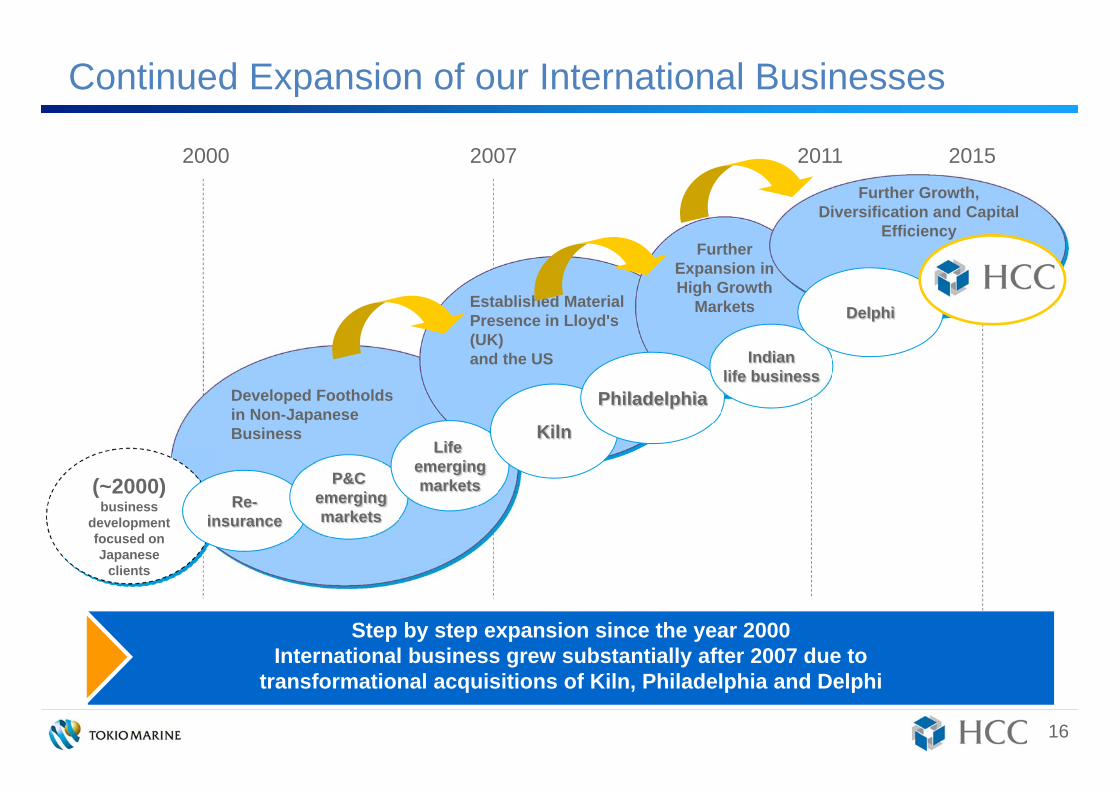
2000 2007 2011 2015
Continued Expansion of our International Businesses
Developed Footholds in Non-Japanese Business
Established Material Presence in Lloyd's (UK) and the US
Further Expansion in High Growth
Markets
(~2000)business
development focused on Japanese
clients
Re-insurance
P&Cemergingmarkets
Life emergingmarkets
Kiln
Philadelphia
Indianlife business
Delphi
Further Growth, Diversification and Capital
Efficiency
Step by step expansion since the year 2000International business grew substantially after 2007 due to
transformational acquisitions of Kiln, Philadelphia and Delphi
16

Our Proven Track Record in M&A
2012 2013 2014
Group totaladjusted EPS*
Trend of adjusted EPS*
2011
¥40
¥ 212
¥ 317
¥423
¥10
Significant Contribution to the Group’s Profit Growth through M&A Strategy and Smooth PMI
Mar. 2008
Total adjusted EPS* of 3 companies
* Group: adjusted net income per share3 companies: total of business unit profits per share
Dec. 2008
May 2012
Continue to consider new business investment opportunities both in developed and emerging markets while maintaining M&A discipline
Acquisition Principles Management strength and compatibility
(High quality management sharing our values )
Robust business model
High growth potential
Smooth PMI (Post Merger Integration) Establishing strong relationship with local management based on
mutual trust
Implementing effective governance structure while respecting local management
Expanding group synergies through sharing and transferring competitive advantages of each company
Solid track record of growth post merger
¥54
¥119
¥133
17

18
Establishment of a More Solid Group Business Foundation
Capital Efficiencies and Sustainable Profit Growth
+
(Post Acquisition) Tokio Marine Group’s Portfolio will be More Diversified
Established a More Solid Group Business Foundation
HCC’s Diversified Portfolio Tokio Marine Group’s Portfolio
Complementary Portfolio
Limited Overlap
+

Establishment of a More Solid Group Business Foundation
Post transaction, the proforma adjusted ROE will increase by 1.5% and EPS will improve by 12%
Impact on Adjusted EPSImpact on Adjusted ROE
* Adjusted basis: Adjusted Net Income includes amount of claims related to natural disasters is adjusted to the average level. Adjusted Net Assets include share price and exchange rates which were adjusted to the level at the end of March 2015.
**Post acquisition illustrative: Calculated based on TMHD’s preliminary estimates of full year profit contribution net of expenses in relation to the acquisition.
8.2%8.9%
7.8%*(Pre-acquisition)
2013 2014 2015Forecast
7.6%*6.7%*
9.3%(Post acquisition
illustrative**)
2013 2014 2015Forecast
317
423 ¥430(Pre-acquisition)
¥480(Post acquisition
illustrative**)
Impact on Adj. Net Income
244
323
¥327B*(Pre-acquisition)
2013 2014 2015Forecast
298*255*
¥370B(Post acquisition
illustrative**)
19
The figures shown here are the simulated simple sum of the annual projection for TMHD’s FY2015 results and TMHD’s preliminary estimates for HCC’s 2015 calendar year results. We will disclose the financial impact of this Acquisition on Tokio Marine Group’s consolidated results for the fiscal year ending 2015 when available during our standard reporting period.
Refer to appendices for the definitions of Adjusted Net Income, Adjusted Net Assets and Adjusted ROE.FX rate as of end 3/31/15 ($1=120.17 JPY).

Further Expansion of International Business
20
The figures shown here are the simulated simple sum of the annual projection for TMHD’s FY2015 results and TMHD’s preliminary estimates for HCC’s 2015 calendar year results. We will disclose the financial impact of this Acquisition on Tokio Marine Group’s consolidated results for the fiscal year ending 2015 when available during our standard reporting period.
Pre-Acquisition Post Acquisition (Pro forma Basis)
Business Unit
Profits**
Insurance Premiums*
¥3,540B
■Domestic Business
■International Business¥1,145B
¥3,890B
40%¥334B ¥382B
38%
46%
¥127B¥175B
¥1,500B
68%
32%
62%29%
62%
38%
54%33%
9%(HCC)
13%(HCC)
• Post Acquisition, the share of premiums for International will increase from 32% to 38% • The share of profits for International will increase from 38% to 46%
<2015 Forecast>
Note: *Includes net written premiums and Life Insurance premium. **Includes Domestic Non-Life, Domestic Life, International business and Financial and General businesses. FX rate as of end 3/31/15 ($1=120.17 JPY).

Adjusted Earnings Growth of our Past Acquisitions (2014 vs. First Year after Acquisition)
A Truly Global Insurer with Premier Specialty Franchises
Note: (*)In 2012, Delphi’s profit was consolidated for half year only, so it is annualized for the calculation of the multiple.
+
Combining HCC with Tokio Marine Kiln, Philadelphia and Delphi, the transaction solidifies Tokio Marine’s standing as a truly global insurer with premier
specialty insurance franchises
• All three acquired specialty companies grew significantly post acquisition as part of Tokio Marine Group
21
Tokio Marine Kiln (in 100 Mn Yen) (in 100 Mn Yen) (in 100 Mn Yen)
Philadelphia Delphi*
2008 2014 2009 2014 2012 20140
100
200
300
400
500
0
100
200
300
400
500
0
100
200
300
400
500
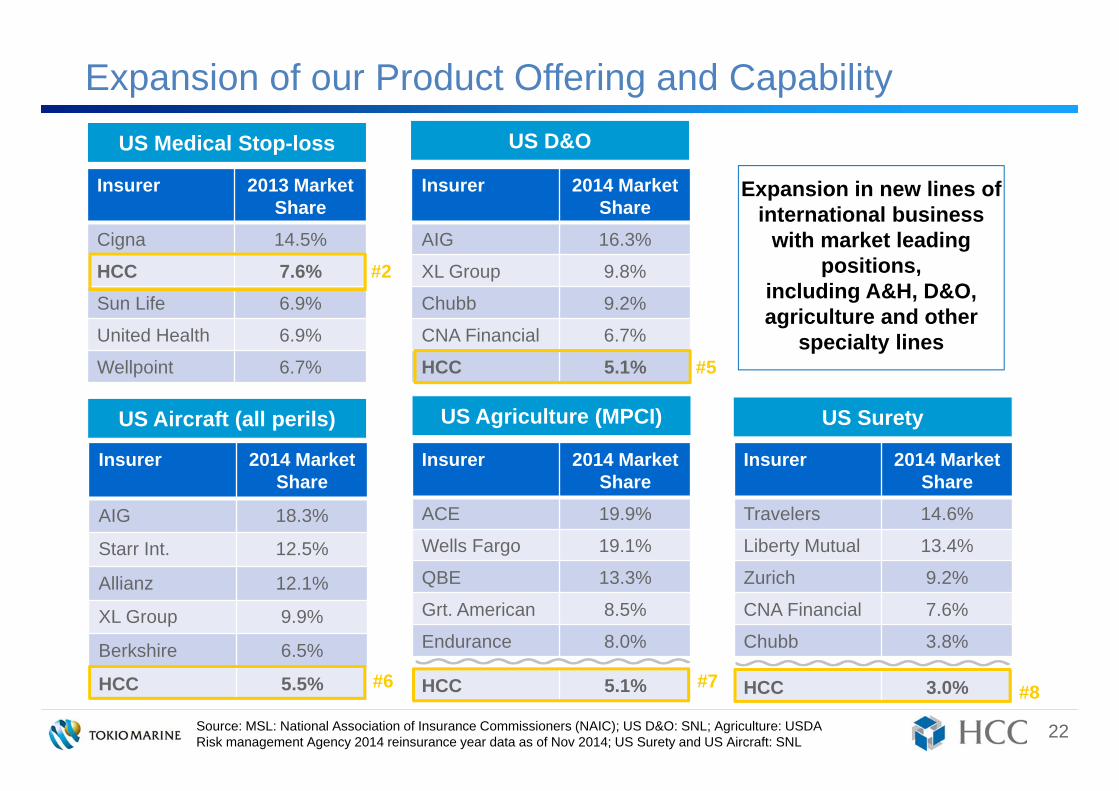
Insurer 2014 MarketShare
AIG 16.3%
XL Group 9.8%
Chubb 9.2%
CNA Financial 6.7%
HCC 5.1%
Expansion of our Product Offering and Capability
Insurer 2013 MarketShare
Cigna 14.5%
HCC 7.6%Sun Life 6.9%
United Health 6.9%
Wellpoint 6.7%
US Medical Stop-loss US D&O
US Agriculture (MPCI)
Source: MSL: National Association of Insurance Commissioners (NAIC); US D&O: SNL; Agriculture: USDA Risk management Agency 2014 reinsurance year data as of Nov 2014; US Surety and US Aircraft: SNL
#2
#5
Expansion in new lines of international business
with market leading positions,
including A&H, D&O, agriculture and other
specialty lines
22
US SuretyUS Aircraft (all perils)
Insurer 2014 Market Share
AIG 18.3%
Starr Int. 12.5%
Allianz 12.1%
XL Group 9.9%
Berkshire 6.5%
HCC 5.5% #6
Insurer 2014 Market Share
ACE 19.9%
Wells Fargo 19.1%
QBE 13.3%
Grt. American 8.5%
Endurance 8.0%
HCC 5.1% #7
Insurer 2014 Market Share
Travelers 14.6%
Liberty Mutual 13.4%
Zurich 9.2%
CNA Financial 7.6%
Chubb 3.8%
HCC 3.0% #8

Complementary Strengths to Create Long Term Synergies
Leverage Tokio Marine’s Global Footprint
• Cross sell A&H, D&O and other specialty products to Tokio Marine’s existing clients, in both developed (including Japan) and emerging markets
Leverage Delphi’s Investment Expertise
Leverage Tokio Marine’s Financial Strengths /
Underwriting Capacity
• Larger underwriting capacity
• Efficiencies on outward reinsurance treaty programs
Significant synergy potential by combining HCC’s underwriting expertise in diverse classes of business with Tokio Marine’s global footprint, financial strength / underwriting capacity and investment expertise
• Utilize Delphi’s superior investment expertise to enhance investment return
23

Strategic Rationale of the Transaction
Key Strengths of HCC
Transaction Highlights
• A world leading specialty insurer with strong underwriting capability
• Diversified and highly profitable portfolio
• Proven track record of disciplined growth and best-in-class underwriting profitability
24
• Establishment of a more solid Group business foundation, through capital efficiencies and sustainable profit growth
• Continued expansion of International business, which results in a more globally diversified portfolio and solidifies Tokio Marine’s standing as a truly global insurer with premier specialty franchises
• Complementary strengths to create long term synergies

Appendices
25

(1) Expense, loss and combined ratios are revised to reflect a change in the basis of calculation in the first quarter of 2015.
Appendix: Financial Statements
HCC Historical Income Statement
26
($ in millions) 2010 2011 2012 2013 2014 Q1 2015Revenues
Gross written premiums $2,579 $2,649 $2,784 $2,880 $3,002 $826Net written premiums $2,026 $2,182 $2,253 $2,255 $2,373 669Net premiums earned $2,042 $2,127 $2,243 $2,239 $2,324 601Net investment income 204 212 223 220 222 53Other operating income 45 36 30 35 41 9Net realized investment gains / OTTI 12 (1) 30 42 66 13Total revenues $2,302 $2,374 $2,526 $2,537 $2,653 $676
Expense
Losses and LAE incurred $1,242 $1,429 $1,338 $1,322 $1,327 $365Policy acquisition costs 255 266 281 279 295 75Other operating expense 294 300 326 336 341 77Interest expense 21 23 26 26 28 8Total expenses $1,812 $2,019 $1,971 $1,964 $1,991 $526
Income (loss) before income taxes $490 $355 $554 $573 $662 $151( - ) Tax (provision) / benefit (145) (100) (163) (166) (203) (38)Net income after tax $345 $255 $391 $407 $458 $113
Main indicatorsROE 11.0% 7.8% 11.5% 11.3% 12.1% 11.5%Expense ratio(1) 24.7% 24.4% 24.4% 24.8% 25.4% 25.7%Loss ratio(1) 60.8% 67.2% 59.7% 59.1% 57.1% 60.8%Combined ratio(1) 85.5% 91.6% 84.1% 83.9% 82.5% 86.5%
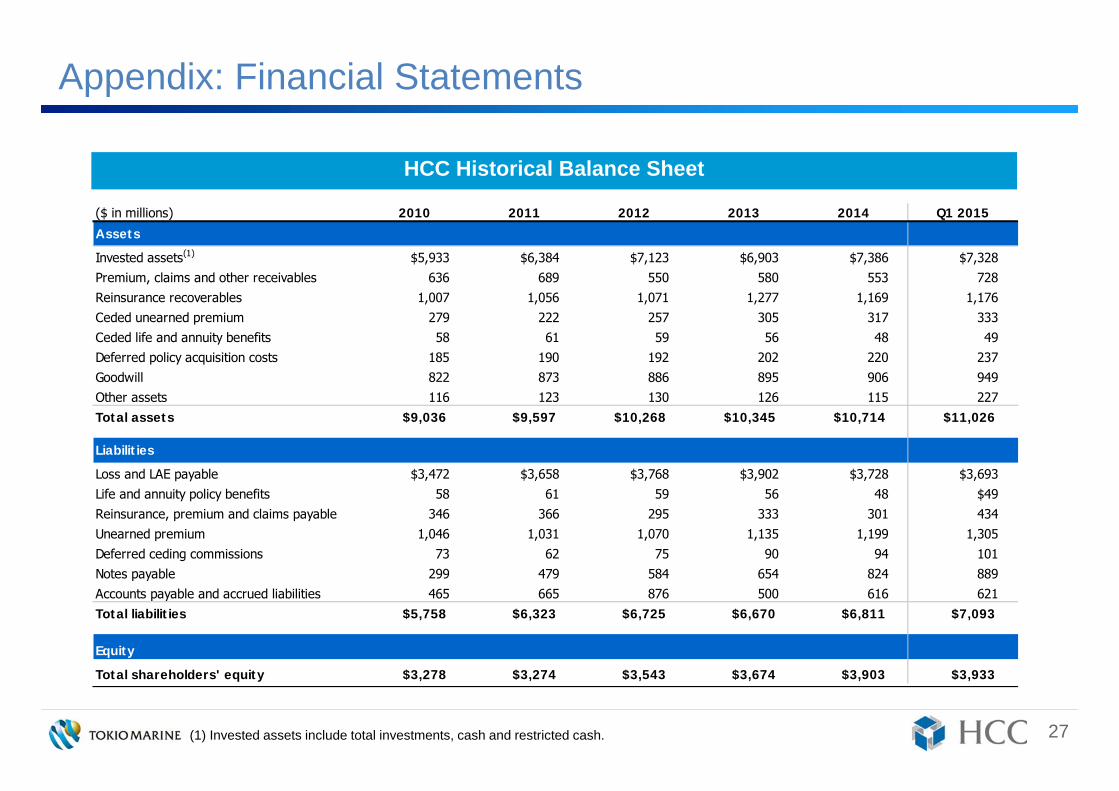
27(1) Invested assets include total investments, cash and restricted cash.
Appendix: Financial Statements
HCC Historical Balance Sheet
($ in millions) 2010 2011 2012 2013 2014 Q1 2015
Assets
Invested assets(1) $5,933 $6,384 $7,123 $6,903 $7,386 $7,328Premium, claims and other receivables 636 689 550 580 553 728Reinsurance recoverables 1,007 1,056 1,071 1,277 1,169 1,176Ceded unearned premium 279 222 257 305 317 333Ceded life and annuity benefits 58 61 59 56 48 49Deferred policy acquisition costs 185 190 192 202 220 237Goodwill 822 873 886 895 906 949Other assets 116 123 130 126 115 227Total assets $9,036 $9,597 $10,268 $10,345 $10,714 $11,026
Liabilities
Loss and LAE payable $3,472 $3,658 $3,768 $3,902 $3,728 $3,693Life and annuity policy benefits 58 61 59 56 48 $49Reinsurance, premium and claims payable 346 366 295 333 301 434Unearned premium 1,046 1,031 1,070 1,135 1,199 1,305Deferred ceding commissions 73 62 75 90 94 101Notes payable 299 479 584 654 824 889Accounts payable and accrued liabilities 465 665 876 500 616 621Total liabilities $5,758 $6,323 $6,725 $6,670 $6,811 $7,093
Equity
Total shareholders' equity $3,278 $3,274 $3,543 $3,674 $3,903 $3,933

28Source: HCC investor presentation. Data as of 3/31/15.
Appendix: HCC Asset Allocation (as of March 31, 2015)
MunisMBS
Corporate
ABS
Equity
Short-Term
Foreign Gov’tU.S. Gov’t
5%
19%
16% 47%
5%5%
2%1%
Asset Allocation Fixed Maturity Securities
‒ Average Rating AA
‒ Average Duration 4.7 years
‒ Average Yield 3.3%

29
Appendix: Definition of Adjusted Net Income, Adjusted ROE
Adjusted Net Income*1
Adjusted
Net Income
Net income
(consolidated) *2
Provision for
catastrophe loss
reserves*3
Provision for
contingency
reserves*3
Provision for
price fluctuation
reserves*3
Gains or losses on sales or
valuation of ALM*4 bonds
and interest rate swaps
= + + + -
Amortization of goodwill and other intangible
fixed assets
Gains or losses on sales or valuation of
fixed assets
Other extraordinary
gains/losses,
valuation allowances, etc
+ - -
Adjusted
Net Assets
Net assets
(consolidated)
Catastrophe
loss reserves
Contingency
reserves
Price fluctuation
reserves= + + + -Goodwill and other
intangible fixed assets
Adjusted
ROE
Adjusted
Net Income
Adjusted
Net Assets= ÷
Adjusted Net Assets*1(average balance basis)
Adjusted ROE
*1: Each adjustment is on an after-tax basis*2: Net income is attributable to owners of the parent*3: Reversals are subtracted*4: ALM:
Asset Liability Management. Excluded as counter balance items against market value fluctuations of liabilities under ALM

Investor Relations Contact
For further information, please contact:
Tokio Marine Holdings, Inc.
Corporate Planning Dept.
Corporate Communications and Investor Relations Group
Shiro Sasaki
Email: [email protected]
URL: http://www.tokiomarinehd.com/en/
Tel: +81-3-3285-0350
30