Embed Size (px)
Citation preview

Acta Structilia2013:20(1)Tydskrif vir die fisiese en ontwikkelingswetenskappe
Acta Structilia is ’n Suid-Afrikaanse geakkrediteerde tydskrif, wat publikasie- geleenthede bied vir onafhanklik-gerefereerde artikels deur plaaslike en buitelandse navorsers op die ter-reine van die fisiese en ontwikkelings-wetenskappe. Elke gekeurde artikel word as sodanig aangedui. Die redaksie oorweeg Afrikaanse of Engelse artikels oor onderwerpe binne studie velde soos: argitektuur, stads- en streekbe-planning, bourekenkunde, konstruk-sie- en projekbestuur, bou-ekonomie, ingenieurswese, die eiendomsbe-dryf en die ontwikkelingsveld rondom gemeenskapsbouprojekte. Acta Struc-tilia verskyn twee keer per jaar onder die vaandel van die Universiteit van die Vrystaat. Die tydskrif word gelewer aan die betrokke navorsingsinstansies, Suider-Afrikaanse universiteite met bogemelde navorsingsdepartemente, Suid-Afrikaanse navorsingsbiblioteke, geselekteerde buitelandse instansies en intekenaars. Menings en kritiek in die tydskrif is dié van die outeur(s). Publikasie daarvan is nie ’n aanvaar- ding dat die Redaksie of die Universiteit van die Vrystaat verantwoordelikheid daarvoor aanvaar nie.
Intekengeld:
Suid-Afrika: R40 per kopie Internasionaal: VSA$40 per kopie
Journal for the physical and development sciences
Acta Structilia is a South African accredited journal for independently adjudicated research articles on any topic in the field of the physical and development sciences. Each peer refereed article is indicated as such in the journal. The editorial staff con-siders articles in English and Afrikaans, written from any responsible point of view on subjects in any applicable field of scholarship, i.e. architecture, urban and regional planning, quantity surveying, construction management and project management, building economy, engineering and property or community development. Acta Structilia is published biannually by the University of the Free State. The journal is forwarded to all relevant research units and universities, Southern African research libraries, selected research institutions and libraries abroad, and to subscribers. Views and opinions expressed in this journal are those of the author(s). Publication thereof does not indicate that the Editorial Staff or the University of the Free State accept responsibility for it.
Subscription fees:
South Africa: R40 per copy International: US$40 per copy
Redaksie • Editorial Staff
Redakteur • Editor Professor JJP Verster Departement Bourekenkunde en Konstruksiebestuur (UV) Department of Quantity Surveying and Construction Management (UFS)
Adjunkredakteur • Deputy Editor Professor JJ Steÿn Departement Stads- en Streekbeplanning (UV) Department of Town and Regional Planning (UFS)
Me MM Bitzer Departement Argitektuur(UV) Department of Architecture (UFS)
Assistentredakteurs • Assistant Editors Professor MJ Maritz Departement Bourekenkunde (UP) Department of Construction Economics (UP)
Dr HJ Marx Departement Bourekenkunde en Konstruksiebestuur (UV) Department of Quantity Surveying and Construction Management(UFS)
Me AE Beukes Departement Bourekenkunde en Konstruksiebestuur (UV) Department of Quantity Surveying and Construction Management(UFS)
Redaksionele medewerkers • Editorial Associates Emeritus Professor D Holm Omgewingsontwerp en – Bestuur (UP) Environmental Design and Management (UP)
Mr P Smith Faculty of Design, Architecture and Building University of Technology, Sydney, Australia
Redaksionele Raad • Editorial Board
Emeritus Professor AS Stevens (Department of Construction Economics and Management, University of Cape Town, South Africa)Emeritus Professor WJ van H Botha (Practising urban and regional planner, Bloemfontein, South Africa)Emeritus Professor B Britz (Practising architect, Bloemfontein, South Africa)Professor D Wills (Pro-Vice Chancellor, University of Greenwich, United Kingdom)Professor O Joubert (Department of Architecture, University of Pretoria, South Africa)Professor G Ofori (Head of Department of Building, School of Design and Environment, National University of Singapore)Professor TC Haupt (Programme Director, Building Construction Science, College of Architecture, Art and Design, Mississippi State University, Mississippi State, USA)Dr S Brown (Royal Institution of Chartered Surveyors [RICS], UK)Mr G di Castri (Chair of Italian Association for Total Cost Management, Milan, Italy)Mr A Kerin (Vice President of Slovenian Project Management Board, Slovenia)Mr MA Aladapo (Chief Executive, Murty International Limited, Nigeria)

Acta Structilia Jaargang 20 Volume
Nommer 1 Number Junie 2013 June
Inhoud • ContentsNavorsingsartikels • Research articles
Investigating Automated Valuation Models (AVM’s) DGB Boshoff use in the South African commercial property market L de Kock 1
Organisational culture of the N Harinarain South African construction industry CL Bornman M Botha 22
Exploring communication challenges due to language and cultural diversity F Emuze on South African construction sites M James 44
Health and safety management practices JN Agumba in small and medium enterprises JH Pretorius in the South African construction industry TC Haupt 66
Post occupancy evaluation of office buildings F Emuze in a Johannesburg country club estate H Mashili B Botha 89
Oorsigartikels • Review articles
Die volwassenheid van die bourekenaar se FH Berry kontraktuele kommunikasievermoë JJP Verster 111
Implementation of broad-based black economic empowerment in construction: F Emuze A South African metropolitan area study R Adlam 126
Inligting aan outeurs • Information for authors 155

The South African Council for the Quantity Surveying Profession endorses
Acta StructiliaThe South African Council for the Quantity Surveying Profession (SACQSP) has simplified the submission and assessment of Continuining Professional Development (CPD) requirements of registered persons. CPD submission now requires disclosure of the number of hours invested meaningfully in activities in two main categories. Category 1 activities are those arranged or presented by or to ‘external’ organisatins such as participation in conferences, congresses, workshops or seminars, presentation of lectures, external examination for academic programmes, publication of articles in journals or magazines, other similar activities. Category 2 activities are less formal ‘internal’ activities such as in-house training or seminars, small group discussions, self-study of journals, magazines, articles on web pages, etc.
To assist registered persons with access to journal articles related to quantity surveying and, more generally, built environment issues, the SACQSP at its meeting in March 2007 adopted a recommendation to endorse the journal, Acta Structilia, which publishes quality, peer-reviewed articles and is accredited by the Department of Education.
Council encourages registered persons to peruse Acta Structilia and similar peer-reviewed journals as one of the alternative options to accumulate CPD credits in Category 2 activities. For a limited period, Council will encourage the circulation of Acta Structilia to registered persons.
Professor RN NkadoPresident
Royal Institution of Chartered Surveyors (RICS) supports Acta Structilia
Royal Institution of Chartered Surveyors (RICS) supports the aims and objectives of Acta Structilia and welcomes the efforts being made to improve our knowledge and understanding of the built environment, particularly in an African context.

1
Douw Boshoff & Leane de Kock
Investigating the use of Automated Valuation Models (AVMs) in the South African commercial property market
Peer reviewed and revised
AbstractThe adoption of Automated Valuation Models (AVMs) in the field of property valuation is a trend, considered controversial and not readily accepted by the valuation profession. The aim of the article is to report on a study conducted in an attempt to determine whether the commercial property sector in South Africa is ready to accept and adopt or reject AVMs and to investigate the possibility of AVMs replacing professional valuation services for commercial property valuations.Limited research was available both nationally and internationally on commercial property AVMs. It was found that AVMs utilised for the valuation of commercial property are still in the development phase and cannot be considered feasible as yet. The major concerning factor is that commercial property markets are heterogeneous. AVMs offer various advantages over traditional methods, but there are also some disadvantages, which were identified in the study.Structured interviews were conducted to determine the opinions and sentiments of commercial property professionals towards commercial property AVMs. As no AVM system exists for commercial property in South Africa, no factual opinion or experience was obtained. The general attitudes towards AVMS were negative and a small percentage of respondents indicated that there may be future potential. AVMs were also regarded as a threat to the valuation profession.It was established that there is scope for commercial property AVMS, however, on a limited basis, and the results could be improved by combining these with traditional valuation techniques. Commercial property AVMs will never replace traditional valuations and can be implemented as a useful tool for verification and auditing of values.Keywords: Property valuation, Automated Valuation Models, commercial property
Dr Douw (Gert Brand) Boshoff, Lecturer, University of Pretoria, Lynnwood Road, Hatfield, 0002, South Africa. Phone: 012 420 3781, email: <[email protected]>
Ms Leane de Kock, Regional Valuer Inland, Transnet, Office 4031, Carlton Centre, Marshalltown, Johannesburg, 2000, South Africa. Phone: 011 308 1114, email: <[email protected]>
Navorsingsartikels • Research articles

Acta Structilia 2013: 20(1)
2
AbstrakDie aanvaarding van Automatiseerde Waardasie Modelle (AVMs) in die veld van eiendomswaardasies is ‘n tendens wat beskou word as kontroversieël en word nie geredelik deur die waardasieberoep aanvaar nie.Die doel van die artikel is om verslag te doen oor ‘n studie wat gedoen is in ‘n poging om te bepaal of die kommersiële eiendomsektor in Suid-Afrika gereed is om AVMs te aanvaar en aan te neem of te verwerp asook om ondersoek in te stel of daar ‘n moontlikheid is dat AVMs professionele waardasiedienste sal kan vervang rakende kommersiële eiendomswaardasies.Beperkte navorsing kon plaaslik en internasionaal in hierdie verband gevind word. Bevindings dui daarop dat die gebruik van AVMs vir die waardasie van kommersiële eiendom steeds in die ontwikkelingsfase is en kan nog nie as lewensvatbaar beskou word nie. Die grootste beperkende faktor is dat kommersiële markte baie heterogeen is. AVMs bied verskeie voordele bo tradisionele waardasiemetodes, maar het ook verskeie nadele, wat in die studie geïdentifiseer is.Gestruktureerde onderhoude is gevoer om die opinie en sentimente van kommersiële eiendomswaardeerders teenoor kommersiële AVMs te bepaal. Aangesien geen so model tans in Suid-Afrika bestaan nie, kon geen feitelike opinie of ervaring verkry word nie. Die algemene houding teenoor AVMs was negatief en ‘n klein aantal terugvoere is ontvang wat aandui dat daar wel toekomstige potensiaal kan bestaan. AVMs is ook beskou as ‘n bedreiging tot die waardasieprofessie.Die studie het bevind dat daar wel ‘n plek vir kommersiële AVMs bestaan, alhoewel op ‘n beperkte basis en dit kan verbeter word deur die kombinasie saam met tradisionele waardasietegnieke. AVMs sal nooit tradisionele waardeerders kan vervang nie, maar kan wel as ‘n handige ondersteunende of ouditinstrument gebruik word.Sleutelwoorde: Eiendomswaardasie, Automatiseerde Waardasie Modelle, kommersiële eiendomme
1. IntroductionLimited research has been done globally and in South Africa regarding the use of AVMs for commercial property valuations. It is assumed that there is currently no commercial property AVM in use in South Africa. Neither could the research conducted establish whether such a model is currently in use worldwide.
AVMs are a relatively new concept in South Africa; however, they have been operational in various countries for a number of years. In South Africa, these models are used for municipal valuation purposes for all types of properties and, in the mortgage sector, primarily for residential property valuations. Residential mortgage valuations are currently moving from traditional valuation approaches and are adopting AVMs. In both these fields, the correct property value needs to be determined. Incorrect values will lead to over- or

Boshoff & De Kock • Investigating the use of AVMs
3
undervalued properties, with a negative influence on the general property market and municipal property taxation bases.
The primary objective of this article is to determine whether the commercial property sector in South Africa is ready to accept and adopt or reject AVMs for commercial property valuations. The secondary aim is to establish whether AVMs pose a threat to the valuation profession and can replace professional valuation services for commercial property valuations.
This article focuses on the use of commercial property AVMs for all purposes of valuation. Municipal commercial property valuations, also known as Computer-Assisted Mass Appraisal (CAMA), are excluded.
2. Literature reviewA survey of the literature reveals a paucity of studies on the use of AVMs for commercial property valuation, as limited information is available on commercial property AVMs. This overview will provide background information, indicate current uses and summarise opinions regarding the future development of commercial property AVMs.
AVMs are categorised under both valuation services and valuation methods.
2.1 Valuation services
There is a range of different valuation services available from the most comprehensive and costly report to the least comprehensive result indicated only as a value at a reduced cost. Robson & Downie (2007: 20-22) defined the range of valuation services typically offered in property markets as follows:
• Gold standard – After a physical internal and external inspection of the property, a qualified and registered valuer prepares the professional standard of valuation in writing, and supported by market information.
• Drive by and broker price opinions – The next service level down from the gold standard is a drive by or external valuation, which involves an external physical inspection in order to confirm the property’s existence and some of its physical characteristics.
• Desktop – A desktop valuation excludes any inspection of the property, and the valuer may use satellite photos, owner

Acta Structilia 2013: 20(1)
4
contact and market knowledge to establish information, as well as select and analyse appropriate comparables.
• AVM – An AVM, at its most basic, provides only a valuation output; however, some AVM systems supplement the figure with various features, the most important being a list of comparable transactions and a measure of the expected accuracy, expressed as a confidence score.
In each case, there must be a balance between savings in time and cost versus the property risk factors. More automated models replace traditional valuation approaches. It is important to review the cost benefit relationship of replacing gold standard valuations with automated valuations or values. Gold standard valuations are referred to as high quality, comprehensive reports, which include a physical inspection and a detailed market analysis.
2.2 Valuation methods
Valuation methods include traditional and advanced methods. Traditional methods include the sales comparison method, the investment method or discounted cash flow analysis, the cost method, the profits method and the residual method. Advanced valuation or data-analysis methods developed from advanced technology and include hedonic pricing methods, artificial neural networks, spatial analysis methods, fuzzy logic, autoregressive integrated moving average, real options method and rough set method. Advanced valuation methods are mainly used for the construction of AVMs, and a better terminology includes data-analysis methods or decision support tools for values (Lorenz & Lützkendorf, 2008: 501).
2.3 Automated Valuation Models
The first signs of AVMs originated in 1960 and the models are currently used globally for security valuations (Rossini & Kershaw, 2008: 1). The use of technology to automate the residential lending process elicited the development of AVMs in the private sector. Cassens Zillioux (2005) stated that a prolonged period of low interest rates and related increase in lending activity, along with the Internet, are the key stimulants for the development of AVMs.
The Collateral Risk Management Consortium (2003: 4) indicated that an AVM can be defined as the generic term for any electronic analytic algorithm, process or model that is intended to estimate the value of an individual property, without human assistance (other

Boshoff & De Kock • Investigating the use of AVMs
5
than the initial entry of the data). Specific to this report, the term applies to models designed to value residential properties.
The IAAO (2011: 14-15) describes an AVM as a mathematically based computer software programme that produces an estimate of market value based on analysis of location, market conditions, and real estate characteristics from information collected. The distinguishing feature of an AVM is that it produces a market valuation through mathematical modelling. The credibility of an AVM is dependent on the data used and the skills of the modeller or operator producing the AVM.
AVMs offers various advantages such as lower cost, time-saving, consistency, transparency, easier data management, and the ability to combat fraud and valuer bias. Disadvantages include data limitations, public opinion, the lack of property inspections, financial regulation, risk acceptance, and transparency, as indicated by Tretton (2007: 505-506) and Robson & Downie (2007: 33). One limitation is that, as a rule, the property is not inspected when an AVM is used. AVMs cannot capture information about a specific property’s internal or external condition, improvements or disrepair (Fitch ratings, 2006: 1). However, adding photographs and mapping information can help overcome some situational omissions. Fitch ratings (2006) pointed out that the greatest weakness of a stand-alone AVM is that it assumes that the property is in a marketable condition with vacant possession and improved internally to normal standards, where a physical inspection can verify these factors (Robson & Downie, 2007:4).
Technological advancements have led to the use of AVMs for establishing property values. Technology in property valuations, as in many other industries, has transformed business operations. Gilbertson & Preston (2005: 127-128) indicated that competition between lending institutions and valuers in terms of speed and cost of valuation services and the availability of data is stimulating greater use of technology. Technology assists with the collection, organisation and formatting of data utilised for valuations. The development of AVMs in the private sector was driven by the use of technology to automate the residential lending process.
The following categories of AVMs, according to Robson & Downie (2007: 12), are currently available:
• Hedonic models – This method mirrors the process used by valuers and uses regression techniques to estimate the contribution of each feature of the property to the overall value.

Acta Structilia 2013: 20(1)
6
• Intelligent systems – The hedonic model method can be used to develop neural network or artificial intelligence models, which identify the variables relevant to value and learn about changes in the relationships between these variables and value, continually updating the model based on new transaction data.
• Hybrid AVMs Appraiser Assisted AVMs – Robson & Downie (2007: 58) indicated an intermediate service level between a stand-alone AVM and a desktop or drive by valuation named the Appraiser Assisted AVM (AAAVM). An AAAVM starts by providing an AVM and comparable transactions. The valuer verifies the valuation and accepts or refers it for further investigation.
2.4 The use of AVMs in the valuation of commercial properties
The use of AVMs is far more complex for commercial valuations than for residential valuations, as limited comparable data is generally available, as stated by Gilbertson & Preston (2005: 127). Tretton (2007: 486-489) shares this opinion, stating that the scarcity of evidence makes the consideration of AVMs for commercial property much more complex. The complexity and the lack of recorded transactions require professional judgement to analyse the data. Tretton (2007: 486-489) further states that there are limited AVM models in use for commercial property valuation and it is suggested that these models be a supportive tool rather than a fully automated valuation, as the degree of human involvement varies.
Gilbertson & Preston (2005: 127) question whether AVMs for commercial property could be viewed as valuations. The argument is based on the sole use of a computer without valuer input, the evidence and assumptions used and the interpretation of the data. Commercial property AVMs are a subjective-objective balancing act and require a safety mechanism to verify the valuation.
Tretton (2007: 508) commented that full valuation automation is not the answer. A fully automated process with the AVMs producing annual tax base values would be an ideal. However, this is not feasible, given the variety of commercial property.
2.5 Automated Valuation Models in South Africa
AVMs are a relatively new concept in South Africa and traditional valuations have previously been the preferred choice.
According to a case study compiled by Robson & Downie (2007: 37), South Africa is categorised as an early-stage AVM

Boshoff & De Kock • Investigating the use of AVMs
7
market. The Financial Services Board and the South African Reserve Bank effectively regulate the well-developed South African banking system. Data availability is satisfactory and electronic registration of title and transactions started in 1993. The Municipal Property Rates Act 6 of 2004 requires regular valuations, necessitating mass valuations and the collection of property and value data (South Africa, 2004).
Electronic tools and web-based data on property transfers have been available for ten years, and the providers are moving towards residential property AVMs. An AVM model became available in 2006, providing output with a confidence score. The data utilised is sourced primarily from the Deeds Office, banks and valuers. In addition to the AVM, the provider offers from 2007 a repeated sales residential index, using data from the AVM, which gives specific price change detail (Robson & Downie, 2007: 37).
Another AVM product, launched on the consumer market, gives free valuations online and sells the product to brokers and property agents.
Robson & Downie (2007: 38) found that all the main South African banks are piloting, or investigating AVMs for loan origination and second mortgages. Banks are using their own models alongside commercial products, with collateral risk policies being developed to determine when they are acceptable.
There is concern regarding AVM accuracy, and the expectation is that 30% of valuations will in future be done by AVM for easy-to-value standard properties in the mid-range market. According to Seota (2011: personal communication), the South African Council for the Property Valuers Profession (SACPVP) does not favour the use of AVMs and no guideline has been formulated to date. The accelerated adoption of residential AVMs by the commercial banks, combined with the limited consultation held with the valuation profession regarding these models, are cause for concern. One should address this approach for future commercial property AVM use or implementation.
2.6 Future of AVMs and the valuer’s profession
There is currently a shortage of supply of valuation service providers, according to Robson & Downie (2007: 33). This is evident in South Africa where there is a shortage of valuers, as the majority of them are approaching retirement age. AVMs can alleviate this problem to some extent; however, they are also viewed as a threat to jobs. In addition, professional bodies initially regarded AVMs as a threat

Acta Structilia 2013: 20(1)
8
to valuers’ employment. In mature markets, guidance to members on using them is now incorporated in professional standards. Valuers are open to the notion of using AVMs as a supplement rather than a replacement for their traditional services.
In a South African study, Mooya (2011: 2267) stated that the rise in the use of AVMs poses questions about the long-term survival of the property valuation profession. AVMs provide quick and cheaper valuations, which, in this very competitive market place, put them at a distinct advantage over traditional approaches.
According to Gilbertson & Preston (2005: 128), there is an opportunity for valuers, as developments in technology provide a process-driven “valuation”. If properly understood and used, AVMs will become a valuable part of the valuation process rather than the process or the result itself. The greatest risk to the valuation profession is commoditisation and automation, which reluctant professional valuers ignore. There is no substitute for the skill of a competent and experienced valuer. As part of what is essentially a risk-management exercise, data and output analysis by appropriately trained valuers can avoid pitfalls.
Gilbertson & Preston (2005: 135) concluded that professionals offering financial or business skills are essential in one section of the valuation services market, and those with technical skills are essential in another part. The profession will have to consider how to train more technicians equipped to handle more of the routine work.
It is difficult to predict the future of the valuation profession, as the profession is constantly under scrutiny and pressure. Costs and speed of delivery are major drivers for AVM development; however, one should consider the quality of valuations. In order to survive the development and implementation of AVMs, valuers in practice will have to change and adapt. The availability and quality of data are key factors, which will distinguish between valuers and valuation companies. The valuation profession is moving from a service to a product-oriented industry.
3. MethodologyThe researchers conducted structured interviews with a number of property valuers currently active in the profession. The sample chosen was based on valuers from a residential, commercial and property taxation or municipal background. Valuers in private practice as well as valuers employed by banks were interviewed. Furthermore, valuers specialising in commercial as well as residential

Boshoff & De Kock • Investigating the use of AVMs
9
property valuations were consulted. A combination of Professional, Associate Professional and Candidate valuers were included in the sample. A total number of 60 valuers based in Gauteng were approached, of whom 40 responded and were interviewed. This constitutes a response rate of 67%. The interviewees represented a well-balanced profile of the South African valuer profession. Similar questions were posed and the interviews evolved with additional data and information. The structured interviews were conducted during October and November 2011.
Interviews were conducted personally as well as telephonically, and the general response was good. The interviews conducted were strictly guided by the nine questions in the question sheet in order to avoid bias and any influence on the respondents. The responses were categorised and summarised, with various repetitions of responses that were received indicating consensus within the valuation profession in South Africa. The researchers compiled the open-ended questions in such a way as to stimulate additional answers and opinions.
4. Results and discussionIn South Africa, no AVM model currently exists for commercial property valuations; only one service provider is in the process of developing such a model. The structured interviews therefore revealed opinion and speculation regarding the future of such models.
4.1 Prior knowledge of or experience with AVMs
The first question, “Do you have any knowledge of or experience with AVMs?”, tested the respondent’s prior knowledge of or experience with AVMs.
Approximately 95% of the interviewees had prior knowledge of AVMs, as residential AVM systems have been in use in South Africa since 2008. These systems were utilised for mortgage valuation purposes by banks in South Africa as well as, to a limited degree, for property tax valuations.
The municipal valuers interviewed indicated that AVMs were previously introduced to the property tax field. The development costs of these proposed AVMs were too high to justify the product. Municipalities in South Africa are under severe budgetary restrictions and do not have the funds to support AVM development. It may change in future, if the property taxes collected or municipal funds

Acta Structilia 2013: 20(1)
10
can be allocated to AVM development. However, at this stage, the municipalities are uninformed about AVMs, and it is estimated that it will take some years before this is addressed or incorporated. CAMA has been introduced to South Africa and has been utilised by the City of Cape Town Municipality since 2001. This system is based on an international software system, and residential properties are valued on a mass basis. However, commercial property valuations are based on the Income Capitalisation Approach and CAMA is therefore not applicable in this instance.
A small number equating to 5% of interviewees had no prior knowledge of or experience with AVMs. A number of these valuers mainly practise agricultural property valuations, and no AVM model has been considered for agricultural valuations in South Africa.
Furthermore, property valuation students who were interviewed did not have any or a limited knowledge of AVMs, as these models are a relatively recent development in the valuations field. The current academic curriculum does not cover this topic; however, some universities such as the University of Cape Town provide limited tuition on CAMA approaches.
Finally, property professionals employed by the listed property sector had limited knowledge of AVMs, as their portfolios mostly comprise commercial properties.
The South African property market distinguishes clearly between AVMs and desktop valuations. The distinction is based on the human-intervention element. AVMs are fully automated computer models with human involvement limited to data-base inputs and compilation. By contrast, desktop valuations require human intervention and certain inputs, although this excludes a physical inspection of the property. Desktop valuations are more detailed and properties are individually verified. In conclusion, 95% of the interviewees all had knowledge of or experience with residential AVM models.
4.2 Prior use of AVMs for residential or commercial valuationsThe second question, “Do you or your company currently use AVMs for valuations and, if so, was this for residential or commercial valuations?”, tested respondents opinions on prior use of AVMs for either residential or commercial valuations.
The majority, 80% of the interviewees, used residential AVMs previously and a large number were involved in the testing phase

Boshoff & De Kock • Investigating the use of AVMs
11
of residential AVMs for bank purposes. Currently, there are a small number of residential AVM service providers.
In addition, a representative from one of the service providers was interviewed and indicated that their system is currently used for high-volume mortgage valuations for residential purposes. They are currently in the process of developing a commercial property AVM and this programme is in the research and development stage. A person was recently employed to research, develop and market their proposed system.
AVMs are used on a large scale for residential valuations by the commercial banks in South Africa. These models are generally used for second-mortgage valuations; however, the banks still prefer to physically inspect first-mortgage properties. The purpose of valuation also affects the use of an AVM; for example, arrears valuations will always require physical inspections. Higher priced properties above R3 000 000.00 are generally not valued using AVMs, and this is based mainly on the risk factor. The loan-to-value ratio is also an important consideration and banks generally do not use AVMs where the ratio is above 90%. Furthermore, AVMs are not used for the valuation of vacant land, agricultural holdings and building loans. Most of the banks have risk policies in place to regulate the use of AVMs.
The public also know about the use of AVMs, which excludes a physical property inspection. Fraud and corruption have occurred based on price fixing of false comparable sale transactions, where these properties did not exist. The lack of physical inspections created this opportunity for fraud.
A high percentage (95%) of the interviewees had no prior knowledge of or experience with a commercial property AVM, as this has not been the practice in South Africa to date. In recent years, there has been speculation and discussion about commercial AVMs; however, no product has been developed or presented to the market.
4.3 Successful employment of AVMs applications in the South African commercial property market
The third question, “Do you believe that these applications can be successfully employed in the South African commercial property market?”, tested respondents’ opinions on the successful employment of AVM applications in the South African commercial property market.

Acta Structilia 2013: 20(1)
12
Half (50%) of the interviewees indicated that, in their opinion, AVMs can only be used to a certain degree of accuracy for residential valuations, and this places doubt on more intricate valuation applications.
Furthermore, their confidence levels were low with regard to the current application of residential AVMs. In their opinion, commercial property is a much more involved valuation exercise and the risks associated with this type of property need to be balanced and managed.
The main cause for concern was the lack of physical property inspections, which generally verify property use, building condition, occupancy, tenants in place, compliance with zoning rights, available parking, access and building orientation. These factors all contribute to the value of a commercial property and are known as the value-forming attributes of a commercial property.
In addition, the interviewees mentioned that commercial property is a complex property class to value. The market consists of heterogeneous properties, sometimes situated next to each other, and this complicates the development of reliable homogeneous market information. The variables are too complex to account for in each valuation instance, thus complicating the development of such models.
A commercial valuation involves various activities and analyses of value-forming factors that need to be taken into account. This includes adjustments to the value calculations. The interviewees doubted whether an automated valuation process would be able to perform all these functions and incorporate all these factors.
A small percentage (5%) of the interviewees indicated that there is scope for commercial AVMs. Their responses are summarised in the following section.
The purpose of valuation and the associated end-user requirements were factors that had to be considered. The interviewees stated that the purpose of valuation would determine whether AVM use is suitable. They mentioned the example of commercial property building loans, where a physical inspection is paramount to determining actual building progress. Another example included first mortgages, as the end-user needs to determine, for example, the existence, condition and tenancy of the commercial building.
The respondents raised risk management as an important issue. Generally, representatives of commercial banks responded that the

Boshoff & De Kock • Investigating the use of AVMs
13
constraints of using AVMs overshadowed the benefits. This statement was based on the higher risk that will result from not inspecting properties. It was stated that the banks were generally opposed to AVMs. The main advantages of cost and time reductions were favoured, but the implementation of commercial property AVMs is considered unlikely. South African banks are conservative and will always favour traditional valuations.
One statement indicated that AVM development was previously attempted in South Africa, but with limited success.
Banks undertake desktop commercial property valuations based on a priority basis where certain properties are flagged or placed on a watch list. The Basel Accord is also incorporated in South Africa and this requires annual revaluations of commercial property portfolios. Older loan agreements as well as the South Africa Credit Act limit the recuperation of costs associated with revaluations. Valuation fees are therefore, in many instances, directly transferred to the banks who subscribe to the Basel Accord. This increase in demand for revaluations has driven the use of desktop commercial property valuations. The majority (95%) of the interviewees were opposed to desktop valuations and were of the opinion that traditional valuations were more suitable for commercial properties. There are certain policies and standards in place where, for example, a substantial difference in value will lead to the request for a full physical valuation. Professional valuers in practice generally do not agree with the use of desktop valuations for commercial properties. Other divisions of banks have driven and implemented these applications.
South African banks require that property valuations include an insurance replacement cost. It is impossible for an AVM to determine an insurance replacement cost, as there is no physical inspection. A physical inspection is, therefore, crucial in the South African bank valuation context.
In conclusion, the majority (95%) of the respondents believed that these models cannot be employed in the South African commercial property market.
4.4 Requirements for successful implementation of these models
The fourth question, “How can these applications work in your opinion?”, tested respondents’ opinions on the requirements for successful implementation of these models.

Acta Structilia 2013: 20(1)
14
A small number (5%) of interviewees indicated that the im -plementation of AVMs for commercial property could work. The responses indicated that the emphasis should fall on the accuracy and reliability of data which they regarded as the most important driver of the success of such a proposed model.
From a property taxation viewpoint, they replied that following property data should be built into this model:
• Title deed information;• Zoning details;• Location analysis;• Market sales prices;• Market rental levels;• Market expense rates;• Market-related vacancy levels;• Market-derived capitalisation rates;• Incorporating GIS mapping, Google Aerial and Streetview,
and• Incorporating current electronic property tax billing systems.
These valuers work on property tax valuations and indicated that South Africa’s metropolitan councils have a large volume of data available, which could be integrated to compile a powerful software system. Of crucial importance to the municipal valuer is the ability to revalue properties on an annual basis, with the use of an AVM; this could be feasible.
Interviewees involved in mortgage valuations of commercial properties indicated that AVMs can be utilised as a beneficial tool. The issues raised include the risk acceptance of the banks, with the use of these models, which needs to be drafted in a policy format in order to protect valuers from legal claims. Another issue is the integrity of data in the form of market information and property information. In South Africa, a distinction is made between AVMs and desktop valuations. AVMs are automated processes without human intervention and desktop valuations require operator input and adjustments. Both methods do not utilise physical property inspections. Interviewees were more comfortable using a desktop valuation approach, as the degree of interaction of property data is higher.
Interviewees suggested that a software programme be developed with the following functions:
Boshoff & De Kock • Investigating the use of AVMs
15
• Input of property description data.• GIS mapping, Google Aerial and Streetview incorporation.• Market research and analysis.• Based on the above, predictive market value inputs for
income, expenses, vacancies and capitalisation rates.• Adjustments, if needed.• Calculations.• Quality control.• Valuation audit.• Generation of property indices.
The importance of testing the model and value outputs was firmly stated. In addition, the limitations of commercial property AVMs should be considered and communicated to all stakeholders involved, especially the end-user, in order to avoid confusion. This measure is essential in order to protect the integrity of the valuation profession.
One interviewee indicated that there should be a constant interchange and input of new data to keep the model data up-to-date.
In terms of listed property funds, The Johannesburg Stock Exchange (JSE) regulations do not require annual physical inspections of the portfolio valuations. It was indicated that the application of AVMs for this purpose may be acceptable. Updating rental schedules in the financial calculations and a full portfolio analysis are important.
4.5 General attitude towards these models
The fifth question, “Are you generally inclined or opposed to these models?”, tested respondents’ opinions on the general attitude towards these models.
A limited number (9%) of interviewees had a positive response to AVMs in general. AVMs are relatively new in South Africa, and a limited number of service providers are currently available for residential properties. This has led to some concerns regarding open-market competition. This type of valuation has negative connotations, due mainly to various inaccuracies experienced in the testing and development phase.
The respondents against AVMs are senior people in the valuation industry who are nearing retirement and who were trained in

Acta Structilia 2013: 20(1)
16
traditional valuation methods and approaches. They regard technology as an impostor, which can reduce employment from the current valuation profession. Some traditionalists believe that the physical inspection of a property is required in order to determine a value and that AVMs are a shortcut method.
After its initial development and phasing, a well-known AVM system, has matured and currently predicts more accurate residential property values. A safety or confidence score measures this and the results indicate a well-established database and model delivering relatively accurate valuations.
For commercial property applications, the general sentiment was negative. The respondents indicated that higher value mortgages presented a higher risk profile to banks and these properties need physical verification. In South Africa, fraud and corruption are widespread and property valuations are a vulnerable target. Fraud generally transpires from false statements of clients, unethical bank officials or during the valuation process. A physical valuation inspection is viewed as one measure to combat dishonesty and misrepresentation. The banks indicated that the commercial property mortgage business is a competitive environment. Challenges in this environment with regard to valuations include accuracy, speed of execution and risk management. The most important factor was the risk associated with commercial properties, as property values are normally much higher compared to general residential properties. Higher property values construct higher mortgage risk and the loan-to-value ratio is constantly under pressure. Therefore, banks are adverse to risk and are unlikely to employ AVMs for high-risk transactions.
A number (60%) of interviewees stated that the risk involved in property tax valuations is significantly less, and that the adoption of AVMs in this field has a better opportunity to be accepted. The high volumes of properties included in municipal valuations also substantiated this comment, which justifies AVM use and development. In addition, the periods are easier to manage with the additional public input or assistance in the appeals process, compared to a high-pressure banking environment. The most favourable response or consideration of AVMs came from the municipal valuations field.
As there is currently no commercial AVM system in South Africa, the respondents were unable to provide an educated opinion based on experience for this question.

Boshoff & De Kock • Investigating the use of AVMs
17
In conclusion, the South African valuation profession is generally opposed to AVMs. It is known that the South African Council for the Property Valuers profession (SACPVP) and the South African Institute of Property Valuers (SAIV) are opposed to AVMs. However, to date, no policy or statement document has been published to highlight this view.
4.6 Level of professionalism or skill required for operating these models
Question six, “In your opinion, what type of profession or skilled individual should operate these models?”, tested respondents’ opinions on the level of professionalism or skill required to operate these models.
All the interviewees indicated that a person with a valuation background should operate AVMs. In addition, they noted that experienced valuers, with a Professional or Associated Professional status, should be the senior personnel involved. Candidate Valuers may also be employed in a data-collection capacity, with training and career enhancement opportunities.
As AVMs are based on statistical analysis, a statistician is required to build the models. Individuals with a combination of valuation and statistical skills are scarce in the marketplace and would be ideal to develop these models. The mathematical analyses of transactions and data are required to verify the inputs of AVMs, to avoid populating poor data in the software system.
Data is the key to any AVM, and the verification and cleaning of data require special skills. Individuals with knowledge of commercial property markets, such as property brokers, researchers, economists, statisticians and valuation auditors, may be employed to manage the data inputs to the AVM.
4.7 VerificationofAVMvalues
Question seven, “How can these AVM values be verified or checked?”, tested respondents’ opinions on the verification of AVM values.
All the respondents indicated that practising professional valuers should verify AVMs. They suggested that the verification process review the following valuation inputs:
• Rental rate on a R/m² basis;• Vacancy rate on a % basis;
Acta Structilia 2013: 20(1)
18
• Expenses applied on a R/m² as well as % basis;• Capitalisation rate on a % basis;• Final value on a Rand amount basis, and • Final value on a R/m² basis.
Furthermore, once the final value is calculated, a basket or portfolio of properties should be analysed to determine any discrepancies. Values that fall out of the normal distribution require additional verification. The discrepancies need to be analysed in order to determine the reason for the difference.
All the respondents indicated that valuation auditors should verify AVM values, in a similar process to traditional valuation verification. Generally, commercial banks have a number of valuation auditors who verify the day-to-day valuations received. The audit process generally comprises the following:
1. Verification of traditional valuation report.2. If required, queries are reverted to the service provider
(valuer).3. If required, amendments after the queries are verified.4. The same or another service provider (valuer) should request
a revaluation, if required.5. If correct, the valuations are accepted and signed off.
The respondents stated that AVM audits should follow the same basic steps, indicated above.
4.8 Affect of AVMs on the valuation profession
Question eight, “In your opinion, will AVMs affect the valuation profession?”, tested respondents’ opinions on the affect of AVMs on the valuation profession.
The majority (95%) of the interviewees indicated that AVMs pose a threat to the valuation profession.
First, they stated that employment opportunities would be reduced, as the demand for traditional valuers will decrease due to fewer volumes of work.
Secondly, the interviewees indicated that poor-quality valuations by AVMs would damage the reputation of the valuation profession.

Boshoff & De Kock • Investigating the use of AVMs
19
Finally, there was a concern that AVMs are statistical tools and not based on traditional valuation methods. This will create inaccurate valuations based on incorrect methodologies employed.
4.9 Future of AVMs
Question nine, “What is the future, in your opinion, of these models?”, tested the respondents’ opinions on the future of AVMs.
The majority (95%) of the respondents indicated that they did not see a future for AVMs for commercial property valuations. They stated that a commercial property valuation would always require a physical inspection. The banks operating in the commercial property market also require a physical inspection and a market analysis to manage the risk of the portfolios.
A small percentage (5%) of the interviewees indicated that there may be a future for AVMs; however, the databases and calculations need to be accurate. The interviewees speculated that the development of these models would require substantial financial investment, as well as cooperation between banks, valuers, property funds, and property data of specialists. It will be a mammoth task to obtain collaboration between these parties, as competition and confidentiality of information are major factors that influence the sharing of data.
Automated software programmes in the form of Discounted Cash Flow applications such as Cougar and Argus are regularly employed; however, these programmes are tools for cash-flow analysis and cannot be regarded as automated models. In addition, property management systems and cash-flow analysis programmes are not integrated. These applications differ significantly and still require physical inputs by the operators. Internationally, data integration of various applications is available, and this improves speed, ease and accuracy of cash flow-based valuations.
The future of AVM development in South Africa for commercial property valuations is, therefore, uncertain and highly unlikely. The South African property market is stable; however, the degree of adoption and incorporation of technology applications has always lagged behind international trends.
5. ConclusionAVMs for residential properties have been incorporated and are being used with acceptable hit rates and confidence scores. In South Africa, the accelerated adoption and implementation of

Acta Structilia 2013: 20(1)
20
residential AVMs by banks or other entities are cause for concern. The main concerns are the lack of physical inspection of properties, the undefined scientific base of computerised value estimation, and the threat to the valuation profession.
In South Africa, the demand for commercial property AVMs is limited; traditional valuations are the preferred option. Banks make use, to a certain extent, of desktop valuation models in order to satisfy Basel revaluation requirements. Commercial property poses higher risk investments and high value-to-loan ratios, which require a detailed assessment of the properties based on a traditional property valuation report.
The incorporation of AVMs for commercial property valuations is more complex than that for residential property, and this originates from the heterogeneous nature of commercial properties. Responses from interviews and tests conducted indicated that the development of AVMs is feasible; however, the cost, data-collection, and model calibration are obstacles.
South African valuers are generally traditionalists and the implementation of AVMs will be challenging to be accepted by them, as the valuation profession indicated that AVMs pose a threat to employment opportunities. The valuer profession does not drive the demand for AVMs; pressure from other role players in the property industry will stimulate AVM development. The valuation profession is under pressure following the implementation of AVMs. Valuers will need to adapt to the changes in technology, and the role of the valuer is showing signs of change. In South Africa, a high percentage of the valuer demographic indicates valuers nearing retirement; AVMs can alleviate this problem. AVMs can be utilised as a value-added tool in terms of automating repetitive valuation processes, testing valuations, and for database compilation.
Research indicates that AVMs will never be able to replace valuers, but may reduce the number of valuers required in practice. However, the services of a skilled and professional valuer will always be required.
References listCassens Zillioux, V. 2005. Automated valuation models: Past, present and future. Paper presented to the European Real Estate Conference, 15-18 June, Dublin.

Boshoff & De Kock • Investigating the use of AVMs
21
Collateral Risk Management Consortium. 2003. The CRC Guide to Automatic Valuation Model (AVM) Performance Testing. pp. 1-21. Costa Mesa: Collateral Risk Management Consortium.
Fitch ratings. 2006. New Treatment of AVMs in U.S.RMBS. [online] Available from: <http://www.fitchratings.com> [Accessed: 12 June 2012].
Gilbertson, B. & Preston, D. 2005. A vision for valuation. Journal of Property Investment and Finance, 23(2), pp. 123-140.
International Association of Assessing Officers (IAAO). 2011. Standard on mass appraisal of real property 2011. Kansas City: International Association of Assessing Officers.
Lorenz, D. & Lützkendorf, T. 2008. Sustainability in property valuation: Theory and practice. Journal of Property Investment and Finance, 26(6), pp. 482-521.
Mooya, M.M. 2011. Of mice and men: Automated valuation models and the valuation profession. Urban Studies, 48(11), pp. 2265-2281.
Robson, G. & Downie, M. 2007. Automated valuation models: An international perspective. London: The Council of Mortgage Lenders.
Rossini, P. & Kershaw, P. 2008. Automated valuation model accuracy: Some empirical testing. Paper presented to the 14th Annual Pacific Rim Real Estate Society Conference, 20-23 January, Kuala Lumpur.
Seota, M. 2011. Registrar of the South African Council for the Property Valuer’s Profession. Personal communication on the SACPVP’s view for the use of AVMs. Pretoria, 12 September.
South Africa. 2004. Municipal Property Rates Act (Act 6 of 2004). Pretoria: Government Printer.
Tretton, D. 2007. Where is the world of property valuation for taxation purposes going? Journal of Property Investment and Finance, 25(5), pp. 482‐514.

22
Nishani Harinarain, Christina-Louise Bornman & Mandie Botha
Organisational culture of the South African construction industry
Peer reviewed and revised
AbstractConstant change and globalisation of the construction industry has prompted an international query into the understanding of organisations’ culture, highlighting its impact on effectiveness and performance. Assessment of the likely culture type of the South African construction industry has been conducted. The aim of this article is to investigate the organisational culture of the South African construction industry by utilising the Competing Values Framework, with its measurement scale, the Organisational Culture Assessment Instrument. This model will identify the industry as either one of the following dominant cultures, namely the clan, adhocracy, market or hierarchy. The systematic sampling method was used and every third participant from a list of quantity surveyors and contractors was selected for the sample group. Each participant was emailed a standard questionnaire. From a sample of 235 quantity-surveying firms a total of 39 valid responses were received. From the 270 contractors that were emailed, 32 valid responses were received. The results revealed the market culture to be the predominant organisational culture in the South African construction industry, followed by the clan, hierarchy and, lastly, the adhocracy cultures. Understanding of their own and other firms’ organisational culture could reduce conflict and misunderstanding between stakeholders, and enable managers to make business decisions that could improve competitiveness and create a more harmonious working environment.Keywords: Organisational culture, construction industry, competing values, framework, Organisational Culture Assessment Instrument
AbstrakVoortdurende verandering en globalisasie van die konstruksie-industrie, het die belangstelling in organisasiekultuur as ‘n rolspeler in die produktiwiteit en werkverrigting aangevuur. Navorsing het al beramings gemaak omtrent die waarskynlike organisasiekultuur van die Suid-Afrikaanse konstruksie-industrie,
Me Nishani Harinarain, Lecturer, School of Engineering, Property Development Programme, University of KwaZulu-Natal, King George V Avenue, Durban, 4041, South Africa. Phone: +27(0)312602687, email: <[email protected]>
Me Christina-Louise Bornman, Student, School of Engineering, Property Development Programme, University of KwaZulu-Natal, King George V Avenue, Durban, 4041, South Africa. Phone: +27(0)312602687, email: <[email protected]>
Me Mandie Botha, Student, School of Engineering, Property Development Programme, University of KwaZulu-Natal, King George V Avenue, Durban, 4041, South Africa. Phone: +27(0)312602687, email: <[email protected]>

Harinarain et al • Organisational culture
23
maar die voorspellings is nog nie bevestig nie. Hierdie artikel beoog om deur middel van die Competing Values Framework met sy maatstaf, die Organisational Culture Assessment Instrument, die organisasiekultuur van die industrie te bepaal. Die model het vier hoofkultuurtipes, naamlik clan, adhocracy, market en hierarchy, en identifiseer die dominante eienskappe van ‘n organisasie as een van die kulture. Die beskikbaarheidssteekproefmetode is gebruik en elke derde deelnemer uit ‘n lys van bourekenaar en kontrakteurs is gekies vir die steekproef. Daar is ‘n vraelys aan elke deelnemer per epos gestuur. Uit die steekproef van 235 bourekenaarmaatskappye was daar ‘n totaal van 39 geldige antwoorde. Uit die 270 kontrakteurs wat vraelyste ontvang het, is slegs 32 geldige antwoorde ontvang. Die resultate het getoon dat die market kultuur as die oorheersende organisasiekultuur in Suid-Afrika aangewys is, gevolg deur die clan, hierarchy en adhocracy kulture. ‘n Begrip vir organisasiekultuur in verskeie firmas kan konflik en misverstande tussen belanghebbendes verminder en bestuurders bemagtig in hul besluite om hul mededingende posisie in die industrie te verbeter en tot ‘n meer harmonieuse werksomgewing by te dra.Sleutelwoorde: Organisasiekultuur, konstruksie-industrie, Competing Values Framework, Organisational Culture Assessment Instrument
1. IntroductionKnowledge of organisational culture has become a matter of increasing importance as organisations realise the impact such knowledge could have on their effectiveness and sustainability. Globalisation and the ever-growing demand of clients force organisations to adapt in order to remain competitive. The construction industry is dynamic and fragmented, and stakeholders are constantly confronted with new organisations in a changing environment. Understanding their organisational culture will enable firms to better manage their business and prevent misunderstandings and conflict often due to cultural differences. This could further enhance performance, quality and customer satisfaction ensuring their long-term success.
This article uses the Competing Values Framework (CVF) to assess the dominant organisational culture of the South African construction industry, through the assessment of the organisational culture of quantity-surveying and construction firms. In order to adequately understand the culture of the industry, the results were analysed according to the following criteria:
• The organisational culture of quantity-surveying and con-struction firms;
• The organisational culture of different size firms; • The organisational culture in the different provinces, and• The overall culture of the South African construction industry.

Acta Structilia 2013: 20(1)
24
Companies differ in how to effectively and efficiently manage and control the construction process, due to the various inputs. The behaviour of organisations involved in the process is perceived to be caused by different organisational cultures, developed from differing control systems and structures (Harkink & Tijhuis, 2006: 43).
Culture is a powerful, tacit and often unconscious force, which determines the behaviour of both the individual and the group, the way they perceive things, their thought patterns, and their values. Organisational culture is important, because these cultural elements determine strategy, goals and modes of operating. In order to make organisations more efficient and effective, it is essential to comprehend the role of culture in organisational life (Schein, 2009: 19).
Wagner & Spencer (1996: 71) defined organisational culture as “the personality of the company”. This personality includes what is valued, the dominant leadership style, language and symbols, procedures and routines, and the definitions of success that characterise an organisation (Cameron & Quinn, 2011: 17). Shared beliefs and a way of thinking enable people to distinguish different aspects in a situation. This is also described as the subconscious values and assumptions, people’s expectations and their collective memories in an organisation (Schein, 1992; Cameron & Quinn, 2011: 16).
In his explanation of the origin of organisational culture, Schein (1986: 20) defines it as a group’s shared learning or the development of its ability to survive. In order to survive, a company needs to have a mission or a reason for existing, definite goals relating to the mission and sufficient means such as structures to reach the set goals.
Culture in organisations provides a sense of meaning depending on the organisation’s ability to reinforce its cultural characteristics and the extent to which the culture clarifies any ambiguity for employees. It also provides them with a sense of identity or belonging that becomes part of their own identification. As collective success increases, the culture strengthens, in turn, increasing member stability and improving their natural tendency to act in given situations (Wagner & Spencer, 1996: 67-8). It holds employees together and stimulates employees to commit and perform. Organisational culture has the potential to set the tone in organisations.
Managing cultural units has become increasingly important, due to:
• Mergers, acquisitions and joint ventures that require organisations to align;
Harinarain et al • Organisational culture
25
• Globalisation diversifies the once traditional environment with multicultural units based on nationality, language and ethnicity;
• Technological complexity that must be considered when designing work flow, and
• Information technology that changes the location and timeframe of the work environment (Schein, 2009).
Culture gives direction or basic rules and reassures people how to respond as it provides predictability and stability (Wagner & Spencer, 1996: 67-87). It has been found that organisations that developed and maintained an adaptive culture performed well financially (Naoum, 2001: 180).
1.1 Organisational culture in construction
The globalisation of construction companies has increased their dependency on knowledge of cultural characteristics. Research shows that stakeholders in the construction environment share an understanding of how to behave and what is expected of all participants, but misunderstandings and conflict are often due to cultural differences (Oney-Yazi et al., 2006). All firms in the industry need to establish and understand their own organisational culture which will enable them to adjust their ways and traditions when conducting business with other firms and give them a competitive advantage (Oney-Yazi, Arditi & Uwakweh, 2006: 219-228).
Oney-Yazi et al. (2006: 219-228) pointed out that, because of the fragmented nature of the construction industry, sensitivity must be shown to the cultural differences of the participants. Culture in the construction industry is also considered an international phenomenon; different cultures should be approached with sensitivity (Kwan & Ofori, 2001).
The influence of culture within the construction industry has focused on many different aspects. Investigations include the impact of organisational culture on project goals and the procurement process (Liu & Fellows, 1999); partnering and performance of stakeholders (Latham, 1994); poor project performance (Rwelamila, Talukhaba & Kivaa, 2000: 457-466), and the cultural differences between various construction professionals (Ankrah & Langford, 2005: 426-438; Rameezdeen & Gunarathna, 2003: 19-27).
Studies on organisational culture in the construction industry have been carried out in countries such as Sri Lanka (Rameezdeen &

Acta Structilia 2013: 20(1)
26
Gunarathna, 2003: 19-27), Australia (Igo & Skitmore, 2006: 121), China (Liu, Shuibo & Meiyung, 2006: 327-342), Finland (Nummelin, 2006: 57-68), Thailand (Novana & Ogunlana, 2006: 279-288), Turkey (Giritli, Oney-Yazici, Topcu-Oraz & Acar, 2006: 1-9), Indonesia (Coffey, Willar & Trigunarsyah, 2011: 1-6) and the United States of America (Oney-Yazic et al., 2006: 219). The different organisational cultures within different countries’ construction industries revealed that the characteristics of a specific country’s industry differ from those of other countries. This raised the question as to which organisational culture would dominate the South African construction industry. In consideration of this argument, assessment of the findings from the studies conducted in various countries led to the prediction by Bornman, Botha & Harinarain (2012) that the organisation culture in the South African construction industry was that of the market culture. This study was carried out in order investigate the organisational culture of the South African construction industry by utilising the Competing Values Framework and to understand the relationship between the different types of culture that exist in the industry, so that companies can use this information to improve the working environment within the industry.
1.2 The organisational culture framework
The organisational culture framework is built upon a theoretical model called the Competing Values Framework (CVF) developed by Cameron & Quinn (1999). The framework and its matched scale, the Organisational Culture Assessment Instrument (OCAI), have, according to Yu & Wu (2009: 39), become the “dominant model in quantitative research on organisational culture”.
The purpose of the framework is to determine the predominant type of culture by utilising the OCAI, which identifies characteristics relating to the six dimensions of the organisation’s core dimensions that accumulatively represent culture. These dimensions are the basis on which organisational culture is judged and estimated.
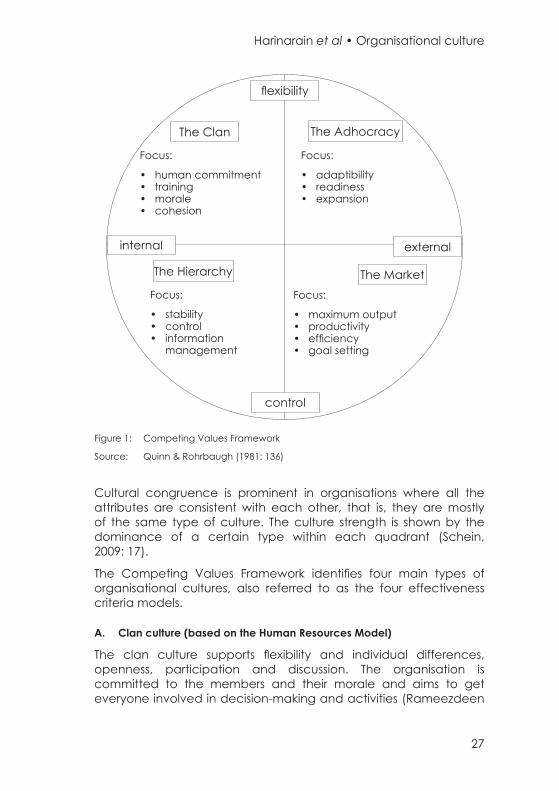
The CVF has two major dimensions and four main clusters (cf. Figure 1). The first dimension distinguishes between organisational focus (internal versus external), while the second one indicates the preference about structure (stability and control versus flexibility and discretion). These two dimensions form four quadrants, each representing a different set of organisational culture indicators. Each quadrant is given a distinguishing label that denotes its most notable cultural characteristic. They are the Clan, Adhocracy, Market and Hierarchy cultures (Cameron & Quinn, 2011: 39-40).
Harinarain et al • Organisational culture
27
Figure 1: Competing Values Framework
Source: Quinn & Rohrbaugh (1981: 136)
Cultural congruence is prominent in organisations where all the attributes are consistent with each other, that is, they are mostly of the same type of culture. The culture strength is shown by the dominance of a certain type within each quadrant (Schein, 2009: 17).
The Competing Values Framework identifies four main types of organisational cultures, also referred to as the four effectiveness criteria models.
A. Clan culture (based on the Human Resources Model)
The clan culture supports flexibility and individual differences, openness, participation and discussion. The organisation is committed to the members and their morale and aims to get everyone involved in decision-making and activities (Rameezdeen
flexibility
The Clan The Adhocracy
internal external
control
The Hierarchy The Market
Focus:
• human commitment• training• morale• cohesion
Focus:
• adaptibility• readiness• expansion
Focus:
• stability• control• information
management
Focus:
• maximum output• productivity• efficiency• goal setting

Acta Structilia 2013: 20(1)
28
& Gunarathna, 2003: 21). Shared values and common goals are common features and create an atmosphere of collectivity and mutual help (Yu & Wu, 2009: 38). Members put the advancement of the organisation before themselves. Cameron & Quinn (2011: 46-48) define the clan culture as a family-type organisation. They operate through teamwork, programmes to get employees involved, and corporate commitment to employees. They treat their employees as family and clients as partners. Teamwork and information-sharing is the key in an organisation of predominantly the clan culture. Rewards are based on organisational or group performance (Rameezdeen & Gunarathna, 2003: 21). Berrio (2003: 2) describes the clan culture as one that focuses on internal maintenance, is flexible, is customer sensitive and focuses on employees’ needs.
These organisations are often viewed as a friendly workplace where people share of themselves. Tradition and loyalty holds these organisations together and their success is defined in terms of their concern for people (Hooijberg & Petrock, 1993: 31). The clan culture has a high moral and collegial decision-making style (Smart & Hamm, 1993: 96-100).
B. Adhocracy culture (based on the Open System Model)
Cameron & Quinn (2011: 49-51) view adhocracy culture in an organisation as creative and dynamic. The major goal is to achieve creativity, flexibility and adaptability in a constantly changing environment. The firm focuses on external positioning, with innovativeness as the key to its success. Entrepreneurial activity, creativity and acquiring resources are prominent features in the organisation, which is also known for its commitment to risk, innovation and development (Rameezdeen & Gunarathna, 2003: 21-22). The leaders are risk-takers and innovators, and employees share a commitment to experimentation. Their goal emphasises adaptability and being ahead of the latest developments. In the long term, they aim for growth and the acquisition of new resources (Hooijberg & Petrock, 1993: 31).
Yu & Wu (2009: 38) associate this culture with temporary institutions, which are established for the purpose of performing a specific task and disintegrates once the task is completed. Berrio (2003: 2) describes the adhocracy culture as the focus on external positioning and allowing employees to be flexible and focus on individuality.

Harinarain et al • Organisational culture
29
C. Market culture (based on the Rational Goal Model)
This organisation focuses on external maintenance and transactions (Berrio, 2003: 2; Yu & Wu, 2009: 38). These result-oriented organisations are led by hard-driving, tough and demanding leaders (Hooijberg & Petrock, 1993: 31). It is rational and goal-oriented, emphasising maximum output, being decisive, and providing direction. It prides itself on accomplishment, productivity and making a profit or having an impact. Order, rational production, external interaction and goal accomplishment are the most significant factors of the market culture. Members have a clear instruction and are rewarded financially for their performance (Rameezdeen & Gunarathna, 2003: 22).
This culture has a competitive orientation, focusing on the achievement of goals (Yu & Wu, 2009: 38). Its success is defined by its market share and penetration (Hooijberg & Petrock, 1993: 31). The market culture focuses on its relationship between suppliers, clients and regulators and is more externally oriented (Cameron & Quinn, 2011: 43-45). Berrio (2003: 2) describes this type of organisation as one that functions with a high degree of stability and control, and with focus on external maintenance; it is proactive in adopting strong market initiatives (Smart & Hamm, 1993: 95-106).
D. Hierarchy culture (based on the Internal Process Model)
Also known as the bureaucratic culture, hierarchy culture strives towards equilibrium and consolidation and is characterised by internal bureaucracy (Rameezdeen & Gunarathna, 2003: 22). A clear organisational structure and standardised rules and procedures give well-defined responsibilities (Yu & Wu, 2009: 38). Leaders are often good coordinators and organisers (Hooijberg & Petrock, 1993: 31). Stability, control and continuity are achieved through measurement, documentation and information management. The internal system is highly regarded and maintained, and members are expected to follow the rules and procedures that govern their actions in well-defined roles (Rameezdeen & Gunarathna, 2003: 22).
The hierarchy culture is visible in a structured and formalised workplace. Their long-term goals are predictable and their business environment is stable and efficient (Cameron & Quinn, 2011: 41-43). A definite mechanistic structure can be observed.

Acta Structilia 2013: 20(1)
30
2. Research methodologyA quantitative research design was adopted to gather data and explain the outcomes of this article. A broad overview and understanding of the research topic was gained through a literature review, followed by analysis of quantitative data collected via the use of the Organisational Culture Assessment Instrument (OCAI). The purpose of the OCAI is to investigate the core values, assumptions, interpretations, and approaches that characterise organisations. It consists of six questions with four alternatives that will categorise the orientation of the organisation. The six questions deal with the dominant characteristics of the organisation; the style of the organisation leader; organisational glue; the nature of organisational climate; success criteria of the organisation, and management style towards the employees. The reliability of this study was ensured because the framework was scrutinised and tested by multiple researchers, including Howard (1998), Lamond (2003) and Deshpande & Farley (2004).
The two target populations, quantity surveyors and construction firms, are major stakeholders in the industry. The systemic sampling method was used to randomly select a sample in each group, as illustrated in Figure 2.
Figure 2: Response rate for the study
Construction Industry
Construction firms Quantity surveying firms
Population: 934 Population: 623
Sample: 270 Sample: 235
Invalid email: 97 Invalid email: 41
Remain: 173 Remain: 194
No response: 138 No response: 149Responses: 45Responses: 35
Invalid responses: 3 Invalid responses: 6
Usable response: 32 Usable response: 39

Harinarain et al • Organisational culture
31
Members on the Association for South African Quantity Surveyors’ (ASAQS) website were used as the population for the quantity-surveying firms in South Africa, where a total of 623 members were identified. The ASAQS divides the QS firms into eight juristic areas, namely Cape province, Eastern Cape, Free State, Gauteng South, Gauteng North, KwaZulu-Natal, Limpopo and North-West.
According to Bartlett, Kotrlik & Higgins (2001: 43-50), a reliable analysis of the population size would require a sample of at least 235 participants. The sampling formula used, as suggested by Bartlett et al. (2001: 47), is as follows:
Where: t = value for selected alpha level of 1.96 (0.25 in each tail).
Where (p)(q) = estimate of variance = 0.25.
Where d = acceptable margin of error for proportion being estimated = 0.05.
Figure 3: Formula for sample size determination
The systematic sampling method was used and every third participant was selected for the sample group, starting at a random place on the list of the whole population. The standard questionnaire was emailed to each participant. All initial questionnaires were followed up with a reminder email a month later. Out of a sample of 235 QS firms, 41 (17.45%) had invalid email addresses. Of the remaining respondents (n=194), there was a total of 39 (20%) valid responses.
A population of 934 registered members was obtained from the Master Builders Association (MBA) websites for seven of the nine juristic areas, namely Boland, Eastern Cape, Free State, Gauteng, KwaZulu-Natal, Northern Cape and Western Cape. A reliable analysis of a population size of 934 would require a sample of at least 270 participants (Bartlett et al. 2001). Once again, the systematic sampling method was used and every third participant was selected for the sample group, starting at a random place on the list of the whole population. From the 270 participants emailed, 97 (35.9%) emails failed to deliver. Out of the remaining 173 participants, 35 participants responded (of which 32 responses were valid.

Acta Structilia 2013: 20(1)
32
3. Data analysisAnalysis of the data gathered through questionnaires from the participants of construction and quantity-surveying firms illustrated the dominant and desired organisational culture in each of the respective groups. The results were also analysed in terms of different firm sizes and the organisational culture of firms in different provinces. This quantitative research used radial graphs to summarise the results, making it easier to interpret. In some instances, two or more organisational cultures were found to be equal for a single firm, being referred to as a dual culture.
Table 1 shows the total number of QS firms that possess each of the dominant or desired culture types.
Table 1: QS firms’ organisational culture
Clan Adhocracy Market Hierarchy Dual Total
Current 14 0 15 6 4 39
Desired 7 4 21 3 4 39
The majority of the QS firms had a dominant market culture, followed by a clan, hierarchy and adhocracy culture. The majority of the QS firms desired a market culture, followed by the clan, adhocracy and hierarchy culture. Four firms had dual dominant or desired cultures. Figures 4 and 5 illustrate the organisational culture in all QS firms.
Figure 4: Dominant culture in QS firms
The current dominant organisational culture of QS firms in South Africa is the market culture.
Figure 5: Desired culture in QS firms
The desired organisational culture of QS firms in South Africa is the market culture.

Harinarain et al • Organisational culture
33
The majority of the construction firms had a dominant market culture, as depicted in Table 2, followed by a clan, hierarchy and adhocracy culture. An analysis of these results also revealed that most construction firms desired a market culture, followed by the clan, hierarchy and adhocracy culture. Three firms had dual dominant cultures and four firms had dual desired cultures.
Table 2: Construction firms’ organisational culture
Clan Adhocracy Market Hierarchy Dual Total
Current 9 0 16 4 3 32
Desired 10 0 13 5 4 32
Figures 6 and 7 illustrate the average organisational culture when all the results received from the construction firms were analysed.
Figure 6: Dominant culture in construction firms
The current dominant organisational culture of construction firms in South Africa is the market culture.
Figure 7: Desired culture in construction firms
The desired organisational culture of construction firms in South Africa is the market culture.
The data gathered could be analysed, in order to establish the different organisational cultures within firms of different size. There are various classifications for firm sizes. For the purpose of this research, small firms were defined as firms with less than 50 employees. Medium firms with 50 to 150 employees, and large firms with over 150 employees (Angelini & Generale, 2008: 427).
The average dominant and desired organisational culture for small, medium and large firms was established, as illustrated in Figures 8 to 13.

Acta Structilia 2013: 20(1)
34
Figure 8: Dominant and desired culture in small QS firms
The current and desired dominant culture is the market culture.
Figure 9: Dominant and desired culture in small construction firms
The current and desired culture is the market culture.
Figure 10: Dominant and desired culture in medium QS firms
The current and desired dominant culture is the market culture.
Figure 11: Dominant and desired culture in medium construction firms
The current and desired culture is the clan culture.
Figure 12: Dominant and desired culture in large QS firms
The dominant culture is the hierarchy, while the desired culture is the clan culture.
Figure 13: Dominant and desired culture in large construction firms
The current and desired organisational culture is the market culture.

Harinarain et al • Organisational culture
35
Table 3 shows the total number of quantity-surveying firms of each size that possess and desire each organisational culture type.
Table 3: Dominant culture of quantity-surveying organisations of each size
Clan Adhocracy Market Hierarchy Dual TotalC
urre
nt
Des
ired
Cur
rent
Des
ired
Cur
rent
Des
ired
Cur
rent
Des
ired
Cur
rent
Des
ired
Cur
rent
Des
ired
Small 3 2 0 2 9 8 0 0 2 2 14 14
Medium 8 3 0 1 6 8 2 2 0 2 16 16
Large 3 2 0 0 1 5 3 1 2 1 9 9
39 39
As illustrated, the dominant culture type for small firms is the market culture, which is also the desired culture for small QS firms. The market culture was also found to be the dominant and desired culture for medium-size firms. The average culture of a large firm, however, had a dominant hierarchy culture, but desired a clan culture.
In the case of the construction firms, Table 4 shows the number of firms of each size that possess a certain dominant culture.
Table 4: Dominant culture of construction organisations of each size
Clan Adhocracy Market Hierarchy Dual Total
Cur
rent
Des
ired
Cur
rent
Des
ired
Cur
rent
Des
ired
Cur
rent
Des
ired
Cur
rent
Des
ired
Cur
rent
Des
ired
Small 0 0 0 0 3 2 2 3 1 1 6 6
Medium 6 6 0 0 6 7 2 3 1 0 15 16
Large 3 4 0 0 7 5 0 0 1 1 11 10
32 32

Acta Structilia 2013: 20(1)
36
The dominant organisational culture type for small and large construction firms is the market culture, which is also the desired culture for small and large construction firms. The clan culture was found to be the dominant and desired culture for medium-size firms.
Analysis of the gathered data further enabled an assessment of the organisational culture within the juristic areas of the population. The following section illustrates the dominant and desired organisational culture in each juristic area
Figure 14: QS firms in the Cape province
The dominant and desired culture is the clan culture.
Figure 15: QS firms in the Eastern Cape
The dominant and desired culture is the market culture.
Figure 16: QS firms in the Free State
The dominant culture is the clan culture, but the desired culture is a market culture.
Figure 17: QS firms in Gauteng North
The dominant culture is the market culture, which is also its desired culture.

Harinarain et al • Organisational culture
37
Figure 18: QS firms in Gauteng South
The dominant culture is the hierarchy culture, but the desired culture is the adhocracy culture.
Figure 19: QS firms in KwaZulu-Natal
The dominant and desired culture is the clan culture.
Figure 20: QS firms in Limpopo
The dominant culture is the clan culture, but the desired culture is the market culture.
Figure 21: QS firms in North-West
The dominant culture is the market culture, but the desired culture is the clan culture.
The analysis revealed that the clan culture is the dominant and desired culture in quantity-surveying firms in both the Cape province and KwaZulu-Natal; the market culture is the dominant and desired culture in the Eastern Cape and Gauteng North. The Free State has a dominant clan culture, but desires a market culture. Gauteng South has a dominant hierarchy culture and desires an adhocracy culture. Limpopo has a dominant clan culture, but desires a market culture. North-West has a dominant market culture, but desires a clan culture.

Acta Structilia 2013: 20(1)
38
The dominant organisational culture for construction firms in each of the Master Builders Associations’ seven approachable areas is illustrated below.
Figure 22: Construction firms in the Boland
Boland has a dominant clan culture, which is also its desired culture.
Figure 23: Construction firms in the Eastern Cape
Eastern Cape has a dominant market culture, which is also its desired culture.
Figure 24: Construction firms in the Free State
The Free State has a dominant hierarchy culture, which is also its desired culture.
Figure 25: Construction firms in Gauteng
Gauteng has a dominant market culture, which is also its desired culture.

Harinarain et al • Organisational culture
39
Figure 26: Construction firms in KwaZulu-Natal
KwaZulu-Natal has a dominant market culture, which is also its desired culture.
Figure 27: Construction firms in the Western Cape
The Western Cape has a dominant market culture, which is also its desired culture.
The national survey revealed that the market culture was the dominant and desired culture of organisations in the Eastern Cape, Gauteng, KwaZulu-Natal and the Western Cape. In the Boland, the clan culture was the dominant and desired organisational culture, and the hierarchy culture was the dominant and desired culture in the Free State. There were no respondents from the Northern Cape.
Finally, the survey questionnaires were analysed to establish the dominant and desired organisational culture of the South African construction industry. The findings are illustrated in Figures 28 and 29.
Figure 28: Dominant culture of the South African construction industry
The current dominant organisational culture of the South African construction industry is the market culture.

Acta Structilia 2013: 20(1)
40
Figure 29: Desired culture of the South African construction industry
The desired organisational culture of the South African construction industry is the market culture.
The results revealed that the organisational culture in the South African construction industry is the predominant market culture. This is followed by the clan culture, the hierarchy culture and, lastly, the adhocracy culture. The market culture was also found to be the desired organisational culture, followed by the clan, the hierarchy and, lastly, the adhocracy culture.
4. Conclusion and recommendationsThis primary study of organisational culture in the South African construction industry revealed the market culture to be the predominant organisational culture in the South African construction industry. The South African construction industry, therefore, possesses the majority of the market culture characteristics. This means that it has an external competitive focus. These organisations are result-oriented, taking pride in accomplishment, productivity and turning a profit. The leaders are demanding and focus on the stability and control of the organisation. Firms in the South African construction industry can thus use this data to help improve managerial and organisational performance. It can also be used to improve their relationship between the various stakeholders and prevent misunderstandings and conflict, often due to cultural differences.
References listAngelini, P. & Generale, A. 2008. On the evolution of firm size distributions. American Economic Review, 98(1), pp. 426-438.
Harinarain et al • Organisational culture
41
Ankrah, N.A. & Langford, D.A. 2005. Architects and contractors: A comparative study of organizational Cultures. Construction Management and Economics, 23(5), pp. 595-607.
Anthony, P. 1994. Managing culture. Buckingham: Open University Press.
Bartlett, J.E., Kotrlik, J.W. & Higgins, C.C. 2001. Organizational research: Determining appropriate sample size in survey research. Information Technology, Learning and Performance Journal, 19(1), pp. 43-50.
Berrio, A.A. 2003. An organisational culture assessment using the competing values framework: A profile of Ohio State University extension. Journal of Extension, 41(2), pp. 1-15.
Bornman, C., Botha, M. & Harinarain, N. 2012. Assessment of organisational culture in the South African construction industry. In: Pearl, R.G. & Verster, J.J.P. (eds), Proceedings of the ICC, International Cost Engineering Council 8th World Congress, Quest for Quality: Professionalism in Practice, 23-27 June. Durban, South Africa, pp. 32-41.
Cameron, K.S. & Quinn, R.E. 1999. Diagnosing and changing organisational culture: Based on the Competing Values Framework. Reading, MA: Addison-Wesley.
Cameron, K.S. & Quinn, R.E. 2011. Diagnosing and changing organisational culture. 3rd ed. Reading, MA: Addison-Wesley.
Coffey, V., Willar, D. & Trigunarsyah, B. 2011. Profiles of organisational culture in Indonesian construction companies. In: Sai, On Cheung (eds), Proceedings of the 6th International Structural Engineering and Construction Conference (ISEC-6), 21-26 June, ETH Zurich, Zurich, pp.1-6.
Deshpande, R., Farley, J.U. & Webster, F.E. 1993. Corporate culture, customer orientation, and innovativeness in Japanese firms: A quadrad analysis. The Journal of Marketing, 57(1), pp. 23-27.
Giritli, H., Oney-Yazici, E., Topcu-Oraz, G. & Acar, E. 2006. Organizational culture: A comparative analysis from the Turkish construction industry. In: Proceedings of the British University in Dubai, Joint International Conference on Construction Culture, Innovation and Management: Sustainable. Dubai, United Arab Emirates (UAE), 26-29 November. Dubai: The British University in Dubai, pp. 1-9.
Harkink, E. & Tijhuis, W. 2006. Innovation strategy: Choosing a central or decentral approach in construction business? In: Proceedings

Acta Structilia 2013: 20(1)
42
of the British University in Dubai, Joint International Conference on Construction Culture, Innovation and Management: Sustainable. Dubai, United Arab Emirates (UAE), 26-29 November. Dubai: The British University in Dubai, pp. 43-56.
Hooijberg, R. & Petrock, F. 1993. On cultural change: Using the Competing Values Framework to help leaders execute a transformational strategy. Human Resource Management, 32(1), pp. 29-50.
Howard, L.W. 1998. Validating the Competing Values Model as a representation of organizational cultures. The International Journal of Organizational Analysis, 6(3), pp. 231-250.
Igo, T. & Skitmore, M. 2006. Diagnosing the organisational culture of an Australian engineering consultancy using the Competing Values Framework. Construction Innovation, 6(2), pp. 121-139.
Kwan, A. & Ofori, G. 2001. Chinese culture and successful implementation of partnering in Singapore’s construction industry. Construction Management and Economics, 19(6), pp. 619-632.
Lamond, D. 2003. The value of Quinn’s Competing Values Model in an Australian context. Journal of Managerial Psychology, 19(1), pp. 46-59.
Latham, M. 1994. Constructing the team. London: HMSO.
Liu, A.M.M. & Fellows, R.F. 1999. The impact of culture on project goals. In: Ogunlana, S.O. (ed.), Profitability partnering in construction procurement. London: E. and F.N Spon, pp. 523-532.
Liu, A.M.M., Shuibo, Z. & Meiyung, L. 2006. A framework for assessing organisational culture of Chinese construction enterprises. Engineering, Construction and Architectural Management, 13(4), pp. 327-342.
Naoum, S. 2001. People and organizational management in construction. London: Telford.
Novana, M. & Ogunlana, S.O. 2006. Organisational culture profile of construction companies in Thailand. In: Proceedings of the British University in Dubai, Joint International Conference on Construction Culture, Innovation and Management: Sustainable. Dubai, United Arab Emirates (UAE), 26-29 November. Dubai: The British University in Dubai, pp. 279-288.
Nummelin, J. 2006. Measuring organisational culture in construction sector – Finnish sample. In: Proceedings of the British University in

Harinarain et al • Organisational culture
43
Dubai, Joint International Conference on Construction Culture, Innovation and Management: Sustainable. Dubai, United Arab Emirates (UAE), 26-29 November. Dubai: The British University in Dubai, pp. 57-68.
Oney-Yazic, E., Arditi, D. & Uwakweh, B.O. 2006. Organizational culture in U.S. construction companies. In: Proceedings of the British University in Dubai, Joint International Conference on Construction Culture, Innovation and Management: Sustainable. Dubai, United Arab Emirates (UAE), 26-29 November. Dubai: The British University in Dubai, pp. 219-228.
Quinn, R.E. & Rohrbaugh, J. 1981. A competing values approach to organizational effectiveness. Public Productivity Review, 5(2), pp. 122-140.
Rameezdeen, R. & Gunarathna, N. 2003. Organisational culture in construction: An employee perspective. Australian Journal of Construction Economics and Building, 3(1), pp. 19-27.
Rwelamila, P.D., Talukhaba, A.A. & Kivaa, T.P. 2000. African intelligentsia: Why we have embraced “hyper bare-foot empiricism” in procurement practices? Challenges facing the construction industry in development countries. In: Proceedings of the 2nd International Conferences of CIB TG29, 15-17 November. Gaborone, Botswana, pp. 457-66.
Schein, E.H. 1986. How culture forms, develops, and changes. In: Kilmann, R.H., Saxton, M.J., Serpa, R. & Associates (eds.). Gaining control of the corporate culture. San Francisco, CA: Jossey-Bass.
Schein, E.H. 1992. Organizational culture and leadership. 2nd edition. San Francisco, CA: Jossey-Bass.
Schein, E.H. 2009. The corporate culture survival guide: Sense and nonsense about culture. San Francisco, CA: Jossey-Bass.
Smart, J.C. & Hamm, R.E. 1993. Organisational culture and effectiveness in two-year colleges. Research in Higher Education, 34(1), pp. 95-106.
Wagner, D.B. & Spencer, J.L. 1996. The role of surveys in transforming culture: Data, knowledge, and action. In: Kraut, A.I. (eds), Organizational surveys: Tools for assessment and change. San Francisco, CA: Jossey-Bass, pp. 67-87.
Yu, T. & Wu, N. 2009. A review of study on the Competing Values Framework. International Journal of Business and Management, 4(7), pp. 37-42.

44
Fidelis Emuze & Matthew James
Exploring communication challenges due to language and cultural diversity on South African construction sites
Peer reviewed and revised
AbstractCommunication can be traced to, among others, an individual’s language and cultural background. These aspects play a fundamental role in ensuring effective communication. Literature surveys show that language and culture have contributed to ineffective communication, giving rise to a wide range of problems in the construction industry. These problems include an increase in rework and poor product quality, and low employee morale. Given the multicultural environment in which construction activities occur in South Africa, communication can potentially dictate the extent of project performance. In order to explore the impact of this phenomenon, a survey was undertaken among general workers and site managers employed by five general contractors (GCs) in the Eastern Cape province of South Africa. Salient findings include that communication problems occur on construction sites due to language- and cultural diversity-related barriers; site managers are generally effective at communicating; the South African workforce is diversely cultured, which potentially leads to misunderstandings on sites, and language barriers between site management and site workers impede performance improvement.Keywords: Communication, construction, culture, language, site managers, site workers, Eastern Cape, South Africa
AbstrakKommunikasie kan teruggevoer word na, onder andere, ‘n individu se taal en kulturele agtergrond. Hierdie aspekte speel ‘n belangrike rol in effektiewe kommunikasie. Literatuuroorsigte toon dat taal en kultuur bygedra het tot oneffektiewe kommunikasie, wat aanleiding gee tot ‘n wye verskeidenheid probleme in die konstruksiebedryf. Hierdie probleme sluit in ‘n toename in werkherhaling en swak produkkwaliteit asook lae werknemersmoraal. Gegewe die multikulturele omgewing waarbinne konstruksie aktiwiteite in Suid-Afrika voorkom, kan kommunikasie potensieel die omvang van projekprestasie voorspel. Ten einde die impak van hierdie verskynsel te voorspel, is ‘n opname gedoen onder algemene werkers en die bestuurders werksaam by vyf algemene kontrakteurs in die Oos-Kaap provinsie van Suid-Afrika. Belangrike bevindinge
Dr Fidelis Emuze, Senior Lecturer, Department of Built Environment, Central University of Technology, Free State (CUT), Private Bag X20539, Bloemfontein, 9300, South Africa. Phone: +27 51 507 3661, Fax: +27 51 507 3254, email: <[email protected]>
Matthew James, BSc (Hon.), Graduate at the Department of Construction Management, Nelson Mandela Metropolitan University, PO Box 77000, Port Elizabeth, 6031, South Africa. Phone: +27 41 504 2790, Fax: +27 41 504 2345, email: <[email protected]>

Emuze & James • Exploring communication challenges
45
sluit in dat kommunikasieprobleme plaasvind op konstruksieterreine as gevolg van taal- en kulturele verskeidenheid-verwante hindernisse; terreinbestuurders kommunikeer in die algemeen effektief; die Suid-Afrikaanse werkerskorps kom uit verskeie kulturele agtergronde wat potensieel tot misverstande op bouterreine mag lei, en taalgrense tussen terreinbestuurders en -werkers hinder prestasieverbetering.Sleutelwoorde: Kommunikasie, konstruksie, kultuur, taal, terreinbestuurders, terreinwerkers, Oos-Kaap, Suid-Afrika
1. IntroductionCommunication affects all aspects of work to some extent, and is crucial in the construction industry. Without effective communication among people, work progress would become an uphill task in construction. In the modern fast-paced world, the workforce has become a diverse, multicultural group of employees worldwide. In this environment, it is fundamental to recognise the ever-growing diverse workforce with regard to language and culture. South Africa may be a good example.
Macleod (2002: 7) explains that there are five major ethnic groups in South Africa, eleven different languages, besides the seven non-official languages, and four main religions. These backgrounds create a vastly diverse workforce. It is, therefore, obvious that contractors need to have a good understanding of the diverse groups employed by firms, in order to learn how to deal with them in the correct manner. In the dynamic and evolving world of project management, communication remains constant as a desirable and critical competency for managing projects. Krahn & Hartment (2006: 51) found that experts rated listening and verbal communication among the top 10 competencies important for project managers to be successful. Indeed, the continuing growth of virtual contexts, with geographically dispersed work teams, necessitates the use of communication by competent project managers (Gibson & Cohen, 2003: 214-230).
According to Varner & Beamer (2005: 40), culture and language are intertwined and shape each other. Every time words are chosen, a sentence is formed and a message sent (either oral or written), cultural choices are made. While language helps in communicating with people from different backgrounds, cultural literacy is necessary to understand the language being used. If language is selected without an awareness of the cultural implications, at best, communication may not be effective and, at worst, the wrong message may be sent.

Acta Structilia 2013: 20(1)
46
As teams grow in size, sub-teams often form around individual elements within the system. While team members are often aware of with whom they must directly collaborate on shared components, the fact is that activities can rarely be considered in isolation. Most aspects of complicated technologies have dependencies, some of which may be owned by other teams. These dependencies across teams may not be instantly obvious to team members, and may require extra communication beyond standard patterns (Sosa, Eppinger & Rowles, 2004: 1673). As teams increase in complexity and spread across sites, communication and coordination requirements also increase (Cataldo, Herbsleb & Carley, 2008: 9).
The purpose of this article is to report on the effect that language and culture have on communication in the workplace and to emphasise the importance of clear and effective communication. The research was conducted to identify the effects of poor communication, in order to improve the overall performance of firms that employ a culturally diverse workforce.
2. Communication and cultureAccording to Stanton (2009: 1), the objectives of communication are to receive, understand and accept information, and to obtain a response. Such response may be a change in behaviour and/or attitude. Stanton (2009: 13-15) also states that basic speaking skills allow for effective communication between parties. These skills are not limited to personal qualities such as clarity, accuracy, empathy, sincerity, relaxation, eye contact, appearance and posture and to vocal qualities such as speech, pitch, volume, diction and accent, vocal tension, speed, the use of the pause and tone. Parties involved in communication need to be aware of the factors that cause problems, in order to overcome them and minimise their effects. Stanton (2009: 4-5) contends that differences in perception, jumping to conclusions, stereotyping, lack of knowledge, lack of interest, difficulties in self-expression and emotions are the factors that cause problems for effective communication.
Verwey & Du Plooy-Cilliers (2003: 7) agree with regard to stereotyping and add that insufficient motivation for effective communication leads to reliance on stereotypes, in order to understand past and anticipate future behaviours. Without direct interaction, people have less psychological empathy for each other’s work environment and limitations. Parties should have the opportunity to discuss their perceptions of each other and find ways to correct misconceptions. Verwey & Du Plooy-Cilliers (2003: 7) discussed ways of minimising the

Emuze & James • Exploring communication challenges
47
effects of some of the above factors. They explain that introducing intergroup mirroring with the assistance of a trained facilitator can be beneficial. The objective is for the conflicting groups to express their perceptions, discuss their differences, and then work out strategies to mend relationships.
Henderson (2004: 474) regards the satisfaction of project team members as equal to productivity, because it is a critical goal of overall project efforts. Turner & Müller (2005: 58) elaborate further, stating that project managers play a significant role in their relationships with teams in terms of satisfaction and productivity. Brill, Bishop & Walker (2006: 23-24) found that listening effectively, and having strong verbal communication skills were among the most important competencies and characteristics required of a project manager.
2.1 Understandingculturalinfluencesoncommunication
According to Macleod (2002: 3), culture consists of behaviours related to language, religion, values, standards, and customs that are shared by a group of people and learned from birth. Individual behaviour does not represent either the communal or the individualistic culture; it is often a blending of both. DiTomaso, Post & Parks-Yancy (2007: 474) elaborate on Macleod’s explanation of culture by explaining that workforce diversity refers to
the composition of work units in terms of the cultural or demographic characteristics that are salient and symbolically meaningful in the relationships among group members.
According to Macleod (2002: 9), there are two major cultural influences in South Africa, namely communal and individualistic. Communal cultures are found mostly in African culture, and place a high regard on teamwork, conformity and collective unity and on achieving group goals both within the family and in the work environment.
Individualistic cultures, also known as western culture, are typically found in Britain and the United States of America (USA), and have a higher emphasis on individual goals. These include goals such as attaining wealth and status rather than group goals. Both of these cultures exist in South Africa, communal being represented by the African, some rural Coloured, Malay and Indian ethnic groups. Individualistic or western culture is represented by the White culture group.

Acta Structilia 2013: 20(1)
48
According to Verwey & Du Plooy-Cilliers (2003: 257), communication across cultures and races is complex and involves interaction with not only other South Africans alone. People may use different sets of symbols, or the same symbols with a different understanding of their meanings. The non-verbal aspects of intercultural communication cause additional issues. Research has shown that those individuals who are comfortable with themselves, because they are secure in their identity and possess high self-esteem, cope best with diversity and intercultural communication. Harrison, Price, Gavin & Florey (2002: 1040) reported that people who collaborate in diverse teams learn about each other’s values, which over time become more influential to group outcomes than demographic ones. This allows diverse groups to develop unique interests and values that promote integration and cohesiveness. Increased intergroup contact, however, does not always result in intergroup integration. Harrison & Klein (2007: 1223) and Lau & Murnighan (2005: 652) agree that increased contact with members of other cultures can also lead to adverse outcomes and even create worse problems over time, if people pay more attention to information confirming bias and prejudice. It can also emphasise social group distinctions and continue with ideas and beliefs that encourage social group separation or marginalisation. Such adverse outcomes are likely to occur when increasing diversity results in configurations that emphasise separation and dispersion.
2.2 Diversity in the workplace and its societal dimensionsDiversity is important in the workplace, because it can help to create an environment that offers mutual respect and support, appreciation of different and unique individuals and the non-reliance on biases that can exist due to lack of education, information and knowledge. Viewing biases logically would afford the opportunity to accurately perceive others and gain better exposure to, and knowledge of a diverse group (Thiederman, 2003: 93). The new knowledge and perspectives brought by diversity can become a resource for innovation and adaptability (Ely & Thomas 2001: 269). Experiencing greater creativity and innovation can breed positive intergroup relations and commitment to change, if members of an organisation understand the strategic resource potential of diversity. As diversity becomes a learning resource that influences future change, diversity change can gain momentum or succumb to inertia.
Those who believe that diversity is a source of creativity and learning are more likely to show behavioural support and facilitate

Emuze & James • Exploring communication challenges
49
its implementation with greater focus, persistence, and effort. Positive attitudes and emotions can counter dysfunctional reactions and create upward spirals through contagion (Fredrickson, 2003: 330-331).
Change in all elements brings new collective schemas, values, and beliefs about diversity, that is, a new interpretive scheme (Amis, Slack & Hinings, 2004: 26). This would influence the manner in which the organisation deals with future outcomes and unintended side effects. For instance, intergroup conflict can be regarded as substantive and a source of debate and dissent instead of a problem. How to sustain diversity change would be evident if an organisation builds resilience, that is, the ability to bounce back and recover from declining diversity change by learning from past events. The new perspective, knowledge, and ideas brought by diversity can become a resource for knowledge and innovation (Ely & Thomas, 2001: 269).
Programmes that increase diversity in the workplace are generally viewed positively, as they improve the workforce by giving opportunities to individuals who may or may not have received them. Currently, organisations are realising the importance of diversity and are employing what is called ‘change management’ which according to Verwey & Du Plooy-Cilliers (2003: 185), can be defined as
the management of organisational features and functions such as strategies, structures, systems, processes, people and culture, to continually renew the organisation’s directions and capabilities to serve the ever-changing needs of the marketplace, the organisation and the employees.
Again, the South African experience can be used to illustrate diversity. As mentioned earlier, Macleod (2002: 7) explains that there are five major ethnic groups, eleven different languages, besides the seven other non-official languages, and four main religions in South Africa. The reality may cause significant diversity in the South African workplace. In addition to these groups, there are others that are intermingled, causing a greater diversity of cultures influenced by other ‘primary’ cultures. Although diversity can be regarded as a means to create communication problems, enormous potential synergies can be derived by combining the strengths and richness of cultural diversity to improve the economic performance and well-being of all South Africans. In other words, living and working in a culturally diverse setting should be exciting and challenging. This argument is reinforced by the view that individuals join and leave groups and organisations throughout their careers, bringing their

Acta Structilia 2013: 20(1)
50
own individual past experiences with diversity to a new context with each transition (Hopkins & Hopkins, 2002: 549).
Verwey & Du Plooy-Cilliers (2003: 134) explain that the South African business environment is particularly dynamic and challenging, as it consists of both developed and developing components. South Africa’s communities are still highly segmented. During the previous dispensation, the focus was on differences, and thus former legislation affected the different population groups in varying ways, which often led to conflict. Current constitutional, legal and societal pressures are used to encourage firms to implement unbiased, democratic and representative policies and structures. With these new pressures, business leaders should focus on how diversity in the workplace can strengthen, rather than weaken, organisations. It is increasingly common for firms to become aware of the value and power of diversity by employing people from different backgrounds. The advantages of becoming aware of the value and power of diversity include a better understanding of cultural similarities and differences. These can lead to improved teamwork through effective communication that can enhance decision-making and team performance on complex tasks. This may eventually give an organisation a competitive advantage in the marketplace.
3. Research methodologyThe sample stratum consisted of five construction firms currently operating in the Eastern Cape province of South Africa. These firms were chosen based on two fundamental criteria. The first criterion pertains to logistics and accessibility in terms of the fieldwork. The second criterion was the company size in terms of annual turnover and number of employees. The purposively selected firms have regional operational footprints throughout the province. From the list of these five construction firms, 15 members were randomly selected from each firm, giving a total sample size of 75 possible respondents. The selection was made among middle- and site-management employees with job titles ranging from project managers to site agents. Of the 75 randomly selected members, 63 members replied. This amounts to an 84% response rate. The respondents belong to multiple ethnic backgrounds such as Xhosa, Afrikaans, Zulu, Shona, and Sesotho. Thus, the descriptive survey method was employed to process the data obtained through observation. Leedy & Ormond (2005: 179) suggest that this type of research involves identifying the characteristics of an observed phenomenon. The survey was designed with closed-ended questions and one open-ended

Emuze & James • Exploring communication challenges
51
question so that respondents could identify communication impediments, and their effects based on the literature reviewed, and offer general comments.
The construction firms, identified in the sample stratum, were sent a covering letter requesting their assistance in this study and a copy of the questionnaire. Willing participants were required to complete the questionnaire and return it by a pre-determined date. Once the data were captured from the completed questionnaires that were returned, the subsequent results became the primary data. The questionnaire consisted of twenty-two (22) questions and included the use of a five-point rating scale predominantly. While one question requested general comments, four questions addressed the respondents’ demographic background. Seventeen (17) structured questions, contained within the questionnaire, were specifically aimed at determining the consensus of respondents’ attitudes towards, and opinions of communication with regard to language and culture in the construction industry. The analysis of the data included descriptive statistics and the central tendency of the responses. These responses were then computed and presented in ‘text’ and ‘tables’ formats. The findings, presented in the next section, were based on the computed percentage (%) and mean score (MS), based on the analysis that was carried out.
4. Results and discussion
4.1 Importance of language and culture in understanding site instructions
Table 1 shows the perceived importance of language and culture in the ability to understand instructions given to workers.
Table 1: Perceived importance of language and culture concerning understanding instructions given to workers
Response (%)Mean score Rank
FactorNot important Very important
Unsure1 2 3 4 5
Language 0.0 1.6 11.1 31.7 55.6 0.0 4.41 1Culture 3.2 12.9 30.6 27.4 22.6 3.3 3.55 2
The responses are tabulated in terms of percentage responses ranging from 1 (not important) to 5 (very important), and an MS ranging from 1 to 5. It is notable that language was ranked first, with an MS of 4.41; this indicates that language plays a crucial role with

Acta Structilia 2013: 20(1)
52
regard to understanding the instructions given to site workers. With an MS of 3.55, culture also plays an important role in understanding the instructions given to site workers. As language and culture are above the midpoint 3.00, it can be deduced that they are important factors when it comes to understanding instructions given on site. However, it was perceived that language plays a significantly more important role than culture.
Table 2 shows the results on the question that tested the concurrence to site managers’ ability to convey clear instructions to workers.
Table 2: Concurrence to site managers’ ability to convey clear instructions to workers
Response (%)Mean scoreStrongly disagree Strongly agree
Unsure1 2 3 4 5
1.6 7.9 30.2 42.9 15.9 1.6 3.65
The analysed data show that 42.9% of the respondents agreed that site managers tend to convey clear instructions to workers. This suggests that significant effort is expended for effective communication to take place between site management and workers in the South African construction.
Table 3 shows the results on the question that reviewed the extent of diversity in the workplace.
Table 3: Concurrence to the extent of diversity in the workplaceResponse (%)
Mean scoreStrongly disagree Strongly agree
Unsure1 2 3 4 5
4.8 9.5 22.2 30.2 31.7 1.6 3.76
The majority of the respondents agreed that the workforce in their firms is culturally diverse, as 31.7% and 30.2% of them, respectively, strongly agreed or agreed with the view. Thus, a typical construction site in South Africa would have people of different cultures working side by side to deliver a project.
Table 4 shows the results on the question testing perceived frequency of sharing a common culture between site managers and site workers being important to communication and morale.

Emuze & James • Exploring communication challenges
53
Table 4: Perceived frequency of sharing a common culture between site managers and site workers being important to communication and morale
Response (%)Mean scoreNever Always
Unsure1 2 3 4 5
0.0 17.5 23.8 36.5 22.2 0.0 3.63
The MS of 3.63 indicates that sharing a common culture between site managers and workers is sometimes important in terms of communication and morale. It is important to note that none of the respondents indicated that sharing a common culture between site managers and workers is never important, thus implying that incidences where it is important to share a common culture may have occurred on their sites.
Table 5 shows the results on the question that reviewed the degree of effectiveness of communication on site with regard to a diversely cultured workforce.
Table 5: The degree of effectiveness of communication on site with regard to a diversely cultured workforce
Response (%)Mean scoreNot effective Very effective
Unsure1 2 3 4 5
1.6 17.5 42.9 25.4 9.5 3.2 3.25
The MS of 3.25 shows that the effectiveness of communication on site with regard to a diversely cultured workforce is perceived to be marginally effective, as only 9.5% of the respondents were of the opinion that it is very effective. This MS may explain why the majority of the respondents were undecided as to whether a multicultural workforce has a negative or positive effect on site productivity.
4.2 Occurrence of miscommunication and misinterpretation on sites
Table 6 indicates the extent to which respondents perceive that incidences of miscommunication and misinterpretation occur on site due to language and culture differences.

Acta Structilia 2013: 20(1)
54
Table 6: Perceived frequency of miscommunication and misinterpretation due to language and culture differences
Response (%)Mean scoreNever Always
Unsure1 2 3 4 5
3.3 15.9 41.3 30.2 7.9 1.6 3.24
The responses are tabulated in terms of percentage responses within a range of 1 (never) to 5 (always) and an MS ranging between 1 and 5. The MS of 3.24 indicates that incidents of miscommunication and misinterpretation, due to language and culture, sometimes occur on site (Table 6). This shows that miscommunication and misinterpretation do occur on site, but not to a significant degree. It is important to note the high percentage of respondents who indicated that ‘miscommunication and misinterpretation’ sometimes (41.3%) and/or often (30.2%) occur on site, due to language and culture differences.
4.3 Respect for different cultures in the workplace
Table 7 indicates the perceived negative/positive level of respect shown to other members of the workforce and their culture, assuming the organisation is diversely cultured.
Table 7: Perceived level of respect shown to other members of the workforce and their culture
Response (%)Mean scoreStrongly negative Strongly positive
Unsure1 2 3 4 5
1.6 18.0 21.3 42.6 14.8 1.7 3.52
The responses are tabulated in terms of percentage responses within a range of 1 (strongly negative) to 5 (strongly positive) and an MS ranging between 1 and 5. The MS of 3.52 indicates that the respondents perceive the level of respect given to other members of the workforce and their culture to be positive. The high number of respondents (42.6%) who indicated that the level of respect shown to other members of the workforce and their culture was positive is notable. It is important that the respect shown to members of other cultures is positive, as it promotes understanding and cohesiveness within a firm.
When asked if misunderstandings between site managers and workers lead to rework, poor product quality and time overruns, an
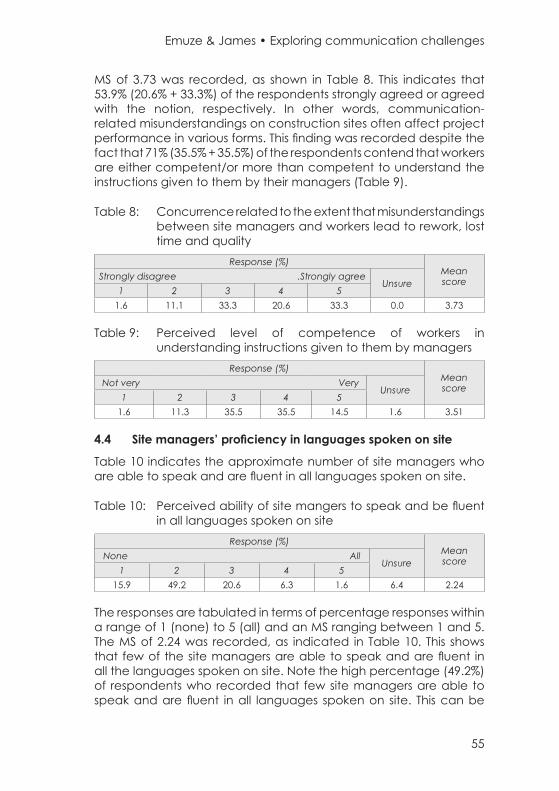
Emuze & James • Exploring communication challenges
55
MS of 3.73 was recorded, as shown in Table 8. This indicates that 53.9% (20.6% + 33.3%) of the respondents strongly agreed or agreed with the notion, respectively. In other words, communication-related misunderstandings on construction sites often affect project performance in various forms. This finding was recorded despite the fact that 71% (35.5% + 35.5%) of the respondents contend that workers are either competent/or more than competent to understand the instructions given to them by their managers (Table 9).
Table 8: Concurrence related to the extent that misunderstandings between site managers and workers lead to rework, lost time and quality
Response (%)Mean scoreStrongly disagree .Strongly agree
Unsure1 2 3 4 5
1.6 11.1 33.3 20.6 33.3 0.0 3.73
Table 9: Perceived level of competence of workers in understanding instructions given to them by managers
Response (%)Mean scoreNot very Very
Unsure1 2 3 4 5
1.6 11.3 35.5 35.5 14.5 1.6 3.51
4.4 Sitemanagers’proficiencyinlanguagesspokenonsite
Table 10 indicates the approximate number of site managers who are able to speak and are fluent in all languages spoken on site.
Table 10: Perceived ability of site mangers to speak and be fluent in all languages spoken on site
Response (%)Mean scoreNone All
Unsure1 2 3 4 5
15.9 49.2 20.6 6.3 1.6 6.4 2.24
The responses are tabulated in terms of percentage responses within a range of 1 (none) to 5 (all) and an MS ranging between 1 and 5. The MS of 2.24 was recorded, as indicated in Table 10. This shows that few of the site managers are able to speak and are fluent in all the languages spoken on site. Note the high percentage (49.2%) of respondents who recorded that few site managers are able to speak and are fluent in all languages spoken on site. This can be

Acta Structilia 2013: 20(1)
56
related to the results in Table 9 in that, although few site managers are able to speak and are fluent in all the languages spoken on site, understanding of instructions given to workers is sometimes misinterpreted. Improving site managers’ ability to speak and be fluent in the major languages spoken on site is perceived to positively influence the understanding of instructions given to site workers.
4.5 Availability of site rules and regulations in multiple languages
Table 11 indicates whether site rules and regulations are available in all the languages of the workforce.
Table 11: Perceived availability of site rules and regulations in all the languages of the workforce
Response (%)No Yes Unsure21.0 52.4 14.3
The responses are tabulated in terms of percentage responses of either no, yes or unsure. While 12.3% of the respondents failed to respond, the findings show that 52.4% of the respondents agree that site rules and regulations are available in all languages spoken on site. This suggests that not all site workers may be able to understand the site rules and regulations, assuming they can only understand written documentation in their own language. This is crucial to ensure that the entire workforce has the same understanding of site rules and regulations, without which there is no cohesion and no common goal for the workforce.
In addition, Table 12 indicates the level of concurrence perceived by the respondents as to whether a diversely cultured workforce leads to misunderstandings on site.
Table 12: Views concerning whether a diversely cultured workforce leads to misunderstandings on site
Response (%)Mean scoreStrongly disagree Strongly agree
Unsure1 2 3 4 5
6.5 22.6 32.3 22.6 12.9 3.3 3.13
The responses are tabulated in terms of percentage responses within a range of 1 (strongly disagree) to 5 (strongly agree) and an MS ranging between 1 and 5. The MS of 3.13 indicates that respondents were neutral with respect to a diversely cultured workforce leading to misunderstanding on site.
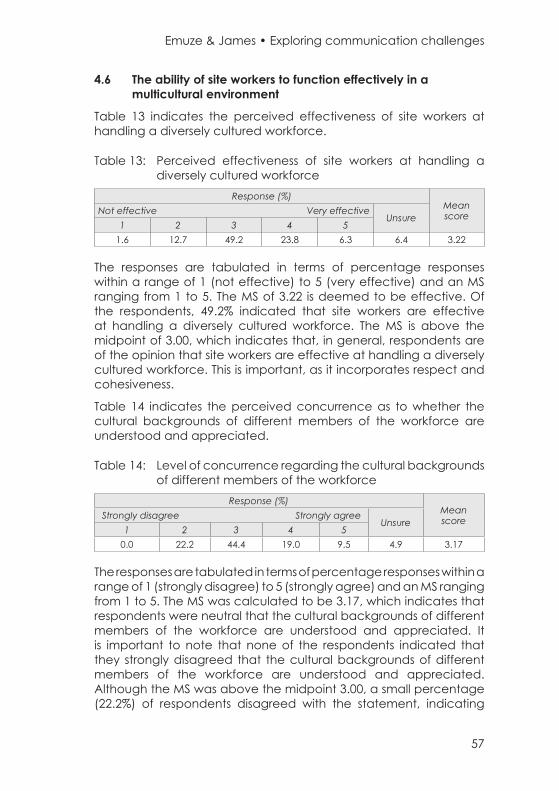
Emuze & James • Exploring communication challenges
57
4.6 The ability of site workers to function effectively in a multicultural environment
Table 13 indicates the perceived effectiveness of site workers at handling a diversely cultured workforce.
Table 13: Perceived effectiveness of site workers at handling a diversely cultured workforce
Response (%)Mean scoreNot effective Very effective
Unsure1 2 3 4 5
1.6 12.7 49.2 23.8 6.3 6.4 3.22
The responses are tabulated in terms of percentage responses within a range of 1 (not effective) to 5 (very effective) and an MS ranging from 1 to 5. The MS of 3.22 is deemed to be effective. Of the respondents, 49.2% indicated that site workers are effective at handling a diversely cultured workforce. The MS is above the midpoint of 3.00, which indicates that, in general, respondents are of the opinion that site workers are effective at handling a diversely cultured workforce. This is important, as it incorporates respect and cohesiveness.
Table 14 indicates the perceived concurrence as to whether the cultural backgrounds of different members of the workforce are understood and appreciated.
Table 14: Level of concurrence regarding the cultural backgrounds of different members of the workforce
Response (%)Mean scoreStrongly disagree Strongly agree
Unsure1 2 3 4 5
0.0 22.2 44.4 19.0 9.5 4.9 3.17
The responses are tabulated in terms of percentage responses within a range of 1 (strongly disagree) to 5 (strongly agree) and an MS ranging from 1 to 5. The MS was calculated to be 3.17, which indicates that respondents were neutral that the cultural backgrounds of different members of the workforce are understood and appreciated. It is important to note that none of the respondents indicated that they strongly disagreed that the cultural backgrounds of different members of the workforce are understood and appreciated. Although the MS was above the midpoint 3.00, a small percentage (22.2%) of respondents disagreed with the statement, indicating

Acta Structilia 2013: 20(1)
58
that the cultural backgrounds of different members of the workforce are not always understood and appreciated.
Table 15 shows the importance of effective communication between site managers and site workers, in a common language.
Table 15: Importance of effective communication between site managers and site workers, in a common language
Response (%)Mean scoreNot important Very important
Unsure1 2 3 4 5
0.0 3.2 3.2 9.5 84.1 0.0 4.75
It is notable that 84.1% (MS = 4.75) of the respondents recorded that effective communication in a common language is very important in the construction industry with regard to site managers and site workers. Site operations would become less problematic when communication takes place in languages that are commonly spoken by the workers.
Table 16 indicates the perceived effectiveness of common language communication between site managers and workers on construction sites.
Table 16: Perceived effectiveness of common language communication between site managers and workers
Response (%)Mean scoreNot effective Very effective
Unsure1 2 3 4 5
1.6 14.3 31.7 36.5 14.3 1.6 3.48
With an MS of 3.48, it can be argued that the ability of site managers to communicate with site workers in a common language can be deemed to be only slightly effective. It is notable that 36.5% of the respondents perceive that site managers are effective at communicating with site workers in a common language. This may be perceived as not being a communication constraint on construction sites.
Table 17 shows the results on the question reviewing the frequency of incidences involving the use of translators by both site management and site workers.

Emuze & James • Exploring communication challenges
59
Table 17: Frequency of incidences involving the use of translators by both site management and site workers
Response (%)Mean scoreNever Always
Unsure1 2 3 4 5
7.9 27.0 33.3 12.7 17.5 1.6 3.05
Despite the need to improve the effectiveness of communication between site managers and their workers, the use of translators only occurs marginally, according to 33.3% of the respondents who show a need for the use of more translators on construction sites.
In terms of the open-ended question, the respondents were requested to provide general comments regarding the effectiveness of communication between managers and workers on construction sites based on their experiences. The question generated 26 comments that were recorded in English, Afrikaans and Xhosa. Some of the salient comments include:
• “Understanding each other’s culture and language leads to a more productive environment”;
• “Provided there is respect amongst all, i.e. workforce and management, productivity will be the order of the day”;
• “As a Coloured, I think it’s time for me to learn more languages with all the different cultures in our community. I think we must not look at the culture but just love one another as a nation. We are all human”;
• “It would be very good if different cultures can work together with each other and treat each other with respect”;
• “On site, it is good to have site managers that do understand quite a number of different languages and cultures. Messages are [more] easily conveyed in that way than [by] using a common language”;
• “Differences in negotiation and communication style can cause serious problems and have a significant impact on whether a multinational company, merger or joint venture succeeds across cultures. If culture differences are mismanaged, the consequences are potentially disastrous and previously effective managers and organisations can become ineffective and frustrated with overseas and multinational ventures. On the other hand, the successful management of cultural differences can create a competitive advantage, innovative business practices and organisational learning”;

Acta Structilia 2013: 20(1)
60
• “With regards to communication and culture, we find the workforce wanting to understand instructions and have an effectiveness because they want to be part of the building process and ultimately also want to show off the project to friends and family through being part of the specific project”;
• “The construction industry consists of 75% uneducated/illiterate people that learned on site and got additional training on site with experience. The cultural differences play a very big role when it comes to housekeeping, safety, and wastage, to be responsible and accountable. Communication is always a challenge, even among educated people. To talk and listen is one thing, to make it happen is another”;
• “Communication between site managers and site workers, in a common language, is not always possible, but first prize if a common language is used. External translators are not used, only someone on site is used. South Africa’s skills are currently lacking and a willingness to work is fading. Labour and skills from neighbouring countries are most definitely supplementing this loss/inefficiency and having a positive effect on productivity and quality. Site rules and regulations are only partly available in all languages of the workforce, mainly only English and Xhosa”;
• “It is probably the biggest cause of rework on any construction site (poor communication) due to language differences. I do not believe that different cultures play a big role in this. It is merely a language issue”;
• “It is extremely important to be able to communicate with your workforce at a level where miscommunications can be completely eliminated. It is also important to relay a message in the language of the receiver. This way he is interested more in what you have to say. I think when communicating a message, the cultural differences must be respected. Failing in doing this can cause the receiver to shut-down and blocking the transmission”;
• “Culture on its own isn’t a communication barrier; however, an understanding of some cultural elements can be a great facilitator of communication”;
• “One can never judge another man until you have walked 100 miles in his shoes. The more we know and understand each other’s culture and background, the better we’ll be able to communicate”;
• “When people feel like they are not being understood – it does not only affect the productivity negatively on site, but

Emuze & James • Exploring communication challenges
61
it also affects the morale of the team because of building up of emotions from their perception of the employer. And those perceptions become reality if not addressed through effective communication Therefore, it is critical for managers to understand that South Africa is a diverse country that requires more than a skill to be a leader in a construction environment – adaptability and relationships are highly important for breaking the barriers of communication”;
• “I think that diversity is not a problem in itself, but how it is handled that is important. There are many countries in the world with similar challenges and they are able to be very effective. Education and understanding of the cultures is important and having compassion for your team that is important”;
• “Effective feedback and organizational transparency through democratically elected forums is of great significance. The impact of this is magnified with representation of such bodies at executive and board meetings. This approach to a large degree breaks down distrust on a cultural/language level and also serves as platforms for different cultures to meaningfully engage on mutually beneficial issues. Effective daily communication on site pertaining to daily operational milestones adds huge value in eliminating barriers to mutual understanding of operational requirements and productivity levels. Coupling this with visual communication, i.e. using productivity charts linked to various measurable criteria further builds a common understanding”;
• “I think the level of literacy also plays a big role” [Translated from Afrikaans];
• “In my experience, respecting other cultures and learning them create a huge amount of respect, which in turn creates a better working environment not only socially but also productively. A ‘manager’ who has earned the labour’s respect is far more efficient in HR”;
• “You will always have people from different backgrounds and cultures. However, if you apply the same rules and conditions for everyone without exceptions, then you will not have problems on sites (employee disagreements). As soon as you start accommodating certain people, then others will take exception and the problem will be where you draw the line. You will spend more time trying to satisfy everyone instead of getting the work done. You have to adapt to the situation as best you can without excluding everyone”;

Acta Structilia 2013: 20(1)
62
• “Managers do not concern themselves with learning other languages spoken by their employees, and the employees don’t want to miss opportunities or work because of this, over and above the fact that employees don’t understand English, the managers aren’t able to make the instructions clear and understandable to the employees” [Translated from Xhosa];
• “Culture is not supposed to play a role or influence the construction industry. Language differences, understandably, can lead to misunderstandings at times. It is a professional industry and should be treated as such, because these days culture is a form of politics. I would say that all culture groups should be respected.” [Translated from Afrikaans]
5. ConclusionThe purpose of this article was to explore the effect of language and culture in the workplace and to emphasise the importance of clear and effective communication in the construction industry. A survey of opinions of employees from 5 construction firms in the Eastern Cape provided insightful perspectives on the subject area.
The results revealed a culturally diverse workforce on South African construction sites. Although misunderstandings between site managers and workers sometimes occur on site, due to language and culture differences, site workers were generally perceived to be competent at understanding instructions given to them. The observable perceptions further show that communication on site affects every aspect of construction works, and it is, therefore, regarded as crucial. Communication is also directly affected by the language and culture of those communicating. Incidences of miscommunication and misunderstandings that often occur on site may be due to differences in language and culture. Language differences were viewed as a major contributing factor to misunderstanding. These poor communication tendencies result in rework and other construction problems on site when they are not addressed adequately.
The argument is supported by the notion that the workforce in the South African construction industry is culturally diverse, including people from beyond the borders of South Africa. It was indicated that sharing a common culture between site managers and site workers is sometimes important for communication, morale and productivity. Despite the insightfulness of the views expressed by the respondents, it is important that these views be viewed in the context in which they were made. Although the site managers and workers

Emuze & James • Exploring communication challenges
63
may have worked on several projects, their views are limited by the extent of their experience. Hence, wholesome generalisation may not be possible with their perception. As a result, further research is needed in order to determine the most effective means of communicating across cultures in an environment that entails many cultures and languages on site. This research should endeavour to explore the use of research paradigms and methods that can give rise to significant contributions to knowledge in the subject area.
6. RecommendationsCommunication is a fundamental aspect of the construction industry, as it affects project implementation. As such, it is necessary to understand the importance of its role in the industry. Two key aspects of communication, language and culture, need to be fully understood and realised on site, in order to improve the communication process. Lack of effective communication leads to rework, loss in time, and a range of other construction performance problems. Hence, it is recommended that site managers and workers take cognisance of the importance of communication, especially the impact of language and culture on the process. Site managers and workers also need to strive to become effective at communicating, in order to minimise misunderstandings on site. Managers of sites should, even when necessary, make use of translators to ensure that their instructions are clearly and effectively understood. All site employees need to be aware of the cultural diversity of the workforce and make certain that they employ the best methods and techniques to ensure effective cross-cultural communication; site managers and site workers need to ensure that high levels of sensitivity and respect are shown to other members of the workforce who share a different culture, thus creating cohesiveness of the workforce and congruency in the direction of work.
References listAmis, J., Slack, T. & Hinings, C.R. 2004. The pace, sequence, and linearity of radical change. Academy of Management Journal, 47(1), pp. 15-39.
Brill, J.M., Bishop, M.J. & Walker, A.E. 2006. The competencies and characteristics required of an effective project manager: A web-based Delphi study. Educational Technology, Research and Development, 54(2), pp. 115-140.

Acta Structilia 2013: 20(1)
64
Cataldo, M., Herbsleb, J.D. & Carley, K.M. 2008. Socio-technical congruence: A framework for assessing the impact of technical and work dependencies on software development productivity. In: Proceedings of the 2nd ACM-IEEE International Symposium on Empirical Software Engineering and Measurement, 9-10 October. Kaiserslautern, Germany, pp. 2-11.
DiTomaso, N., Post, C. & Parks-Yancy, R. 2007. Workforce diversity and inequality: Power, status, and numbers. Annual Review of Sociology, 33(3), pp. 473-501.
Ely, R.J. & Thomas, D.A. 2001. Cultural diversity at work: The effects of diversity perspectives on work group processes and outcomes. Administrative Science Quarterly, 46(2), pp. 229-273.
Fredrickson, B.L. 2003. The value of positive emotions. American Scientist, 91(4), pp. 330-335.
Gibson, C.B. & Cohen, S.G. 2003. Virtual teams that work: Creating conditions for virtual team effectiveness. San Francisco, CA: Jossey-Bass.
Harrison, D.A. & Klein, K.J. 2007. What’s the difference? Diversity constructs as separation, variety, or disparity in organizations. Academy of Management Review, 32(4), pp. 1199-1228.
Harrison, D.A., Price, K.H., Gavin, J.H. & Florey, A.T. 2002. Time, teams, and task performance: Changing effects of surface- and deep-level diversity on group functioning. Academy of Management Journal, 45(2), pp. 1029-1045.
Henderson, L.S. 2004. Encoding and decoding communication competencies in project management: An exploratory study. International Journal of Project Management, 22(6), pp. 469-476.
Hopkins W.E. & Hopkins, S.A. 2002. Effects of cultural recomposition on group interaction processes. Academy of Management Review, 28(4), pp. 541-553.
Krahn, J. & Hartment, F. 2006. Effective project leadership: A combination of project manager skills and competencies in context. Paper presented at the biennial meeting of the Project Management Institute Research Conference, 16-18 July. Montreal, Canada.
Lau, D.C. & Murnighan, J.K. 2005. Interactions within groups and subgroups: The effects of demographic fault lines. Academy of Management Journal, 48(4), pp. 645-659.

Emuze & James • Exploring communication challenges
65
Leedy, P.D. & Ormrod, J.E. 2005. Practical research: Planning and design. 8th edition. Upper Saddle River, NJ: Pearson Prentice Hall.
Macleod, G. 2002. Cultural considerations: A guide to understanding culture, courtesy and etiquette in South African business. Claremont: Spearhead.
Sosa, M.E., Eppinger, S.D. & Rowles, C.M. 2004. The misalignment of product architecture and organizational structure in complex product development. Management Science, 50(12), pp. 1674-1689.
Stanton, N. 2009. Mastering communication. 5th edition. New York: Palgrave Macmillan.
Thiederman, S. 2003. Making diversity work: Seven steps for defeating bias in the workplace. Chicago, IL: Dearborn Trade Publishing.
Turner, J.R. & Müller, R. 2005. The project manager’s leadership style as a success factor on projects: A literature review. Project Management Journal, 36(2), pp. 49-61.
Varner, I. & Beamer, L. 2005. Intercultural communication in the global workplace. 3rd edition. New York: McGraw-Hill/Irwin. Verwey, S. & Du Plooy-Cilliers, F. 2003. Strategic organisational communication: Paradigms and paradoxes. Sandown: Heinemann Publishers.

66
Justus Agumba, Jan Harm Pretorius & Theo Haupt
Health and safety management practices in small and medium enterprises in the South African construction industry
Peer reviewed and revised
AbstractConsidering its share in, and impact on national economies, the construction industry receives additional attention in terms of its performance and productivity, especially among small and medium contractors. However, with the extensive workforce it employs, health and safety (H&S) issues have become important, since the industry still has the reputation of being one of those with the highest fatality and accident rates. It has been well established from literature and previous studies (Fernandez-Muniz, Montes-Peon & Vazquez-Ordas, 2007: 636; Rajendran & Gambatese, 2009: 1072) that managing H&S helps to ensure that construction organisations are achieving their H&S objectives. As such, H&S management practices constitute a vehicle to improve H&S performance. Given the dominance of small and medium contractors in the construction sector, the challenge is to determine what needs to be measured and practised by these Small and Medium Construction Enterprises (SMCEs) at project level. The objective of this article is to validate the H&S practices that small and medium construction enterprises practise in order to improve H&S performance at project level.A descriptive survey was done and data collected using a structured questionnaire consisting of 31 practices. These practices were categorised in terms of five elements developed from an extensive review of literature and the participation of 20 H&S experts, 16 of whom completed all four iterations of the Delphi survey. A convenience sample of 1.450 SMCEs was used to gather data. A total of 228 questionnaires were returned, of which 216 responses were usable for analysis. The Statistical Package for the Social Sciences (SPSS) version 20 was used to determine the convergent validity and the reliability of the proposed H&S practices. Furthermore, the respondents’ perception on H&S practices was also determined.The five elements, namely upper management commitment and involvement in H&S, employee involvement and empowerment in H&S, project supervision,
Mr Justus N. Agumba, Lecturer, Department of Construction Management and Quantity Surveying, University of Johannesburg, corner Siemert and Beit Streets, Doornfontein, 2028, Johannesburg, South Africa. Phone: +27 11 559 6488, email: <[email protected]>
Prof. Jan Harm Pretorius, Professor in the Faculty of Engineering and the Built Environment, University of Johannesburg, University Way, Auckland Park, 2028, Johannesburg, South Africa. Phone: +27 11 559 3377, email: <[email protected]>
Prof. Theo C. Haupt, visiting Professor, Department of Construction Management and Quantity Surveying, University of Johannesburg, corner Siemert and Beit Streets, Doornfontein, 2028, Johannesburg, South Africa. email: <[email protected]>

Agumba et al • Health and safety management practices
67
project H&S planning and communication in H&S, as well as H&S resources and training were considered key factors of H&S for SMCEs at project level. However, employee involvement and empowerment in H&S was the least rated H&S attribute within the SMCEs. It was, therefore, recommended that employees needed to be engaged in H&S at the project level of SMCEs.Keywords: Elements, small and medium construction enterprises, validation
AbstrakDie konstruksiebedryf ontvang op grond van sy aandeel in en impak op die nasionale ekonomie bykomende aandag ten opsigte van sy prestasie en produktiwiteit onder veral klein en medium kontrakteurs. Met ʼn uitgebreide werkersmag in hul diens het gesondheids- en veiligheidskwessies (G&V) belangrik geword, aangesien die bedryf steeds die reputasie het van een van die bedrywe met die hoogste sterfte- en ongevallesyfers. Die literatuur en vorige studies (Fernandez-Muniz, Montes-Peon & Vazquez-Ordas, 2007: 636; Rajendran & Gambatese, 2009: 1072) bevestig dat die bestuur van G&V help om te verseker dat die konstruksie-ondernemings hul G&V doelwitte bereik. As sodanig, bied G&V-bestuurspraktykte ʼn middel om G&V-prestasie te verbeter. Gegewe die oorheersing van klein en medium kontrakteurs in die konstruksiesektor, is die uitdaging daarin geleë om vas te stel wat op projekvlak deur hierdie klein en medium konstruksie-ondernemings (SMCEs) ondersoek moet word en watter maatreëls ingestel moet word. Die doel van hierdie artikel is om die G&V-maatreëls wat in die klein en medium konstruksie-ondernemings ingestel is geldig te verklaar vir die verbetering van G&V-prestasie op projekvlak.ʼn Beskrywende opname is gedoen en data is ingesamel deur die gebruik van ʼn gestruktureerde vraelys bestaande uit 31 praktyke. Hierdie bedrywe is geklassifiseer volgens vyf elemente wat uit die uitgebreide literatuurstudie ontwikkel is asook die deelname van 20 G&V-kundiges van wie 16 aan al vier iterasies van die Delphi opname deelgeneem het. ʼn Gerieflikheidsteekproef van 1.450 SMCEs is gebruik om die data te versamel. ʼn Totaal van 228 vraelyste is terug ontvang waarvan 216 response bruikbaar was vir ontleding. Die Statistiese Pakket vir die Sosiale Wetenskappe (SPSS) Weergawe 20 is gebruik om die konvergente geldigheid en betroubaarheid van die voorgestelde G&V-praktykte te bepaal. Voorts is die respondente se persepsies van die G&V-praktyke bepaal.Die vyf elemente, naamlik topbestuur se verbintenis tot en betrokkenheid in G&V, werknemerbetrokkenheid en -bemagtiging in G&V, projektoesig, G&V-projekbeplanning en kommunikasie in G&V en G&V-hulpbronne en -opleiding is beskou as die sleutelfaktore van G&V vir SMCEs op projekvlak. Werknemerbetrokkenheid en -bemagtiging in G&V was as die swakste attribuut binne die SMCEs beskou. Dit word dus aanbeveel dat werknemers op projekvlak binne SMCEs daadwerklik by G&V betrek moet word.Sleutelwoorde: Elemente, klein en medium konstruksie-organisasies, bekragtiging
1. IntroductionThe South African Occupational Health and Safety Act No 85 (South Africa, 1993: 8) highlights that every worker has a right to a healthy and safe working environment. However, poor health and safety performance within the construction industry in South Africa,

Acta Structilia 2013: 20(1)
68
especially among small and emerging construction enterprises, has been anecdotally experienced (Construction Industry Development Board [CIDB]), 2008: 22). This poor H&S performance has, therefore, driven H&S stakeholders, the South African government, in particular, to take H&S seriously. Arguably, the poor H&S performance could inevitably be helped by continuous monitoring and review of H&S management practices.
H&S management refers to the tangible practices, responsibility and performance related to H&S, including the association between H&S management, climate and culture. H&S climate is perceived to be the precise indicator of overall H&S culture, while H&S management practices reflect the H&S culture of upper management. Consequently, good H&S management practices are reflected in the enhanced H&S climate of all employees (Mearns, Whitaker & Flin, 2003: 644). According to Azimah, Abdullah, Spickett, Rumchev & Dhaliwal (2009: 55), H&S management will not only resolve H&S challenges, but also enhance overall legal compliance. However, legislation by itself is inadequate to address the problems of managing workplace H&S.
1.1 Challenges and constraints facing Small and Medium Construction Enterprises (SMCEs)
The South African SMCE sector is, to a large extent, underdeveloped and lacking the managerial and technical skills and sophistication enjoyed by larger well-established contractors. SMCEs are left on the periphery of the mainstream economy and do not participate fully in the economy (Department of Public Works [DPW], 1999). Martin (2010) opined that lack of knowledge, including knowledge of pricing procedures, contractual rights and obligations, law, management techniques and principles as well as technology are a challenge to SMCEs. Despite these general challenges faced by SMCEs, the CIDB 2008 report highlighted specific challenges faced by small contractors to manage H&S. Anecdotally, the report indicated that medium to large contractors and subcontractors working with large contractors tended to address H&S to greater degrees than small and emerging contractors, as well as the majority of housing contractors (CIDB, 2008: 22).
Further, small and emerging contractors faced challenges and constraints in H&S training and competence. The contractors registered in the lower grades of the CIDB Register of Contractors were more likely to have limited formal education, based on a construction craft or trade training such as carpentry, plumbing,

Agumba et al • Health and safety management practices
69
electrical installation and bricklaying. This training was probably in the form of the recently introduced learnerships (CIDB, 2008: 22).
Financial resources for H&S were more likely to be provided for by contractors in the upper grading of the CIDB Register of Contractors who were normally large contractors in grades 7, 8 and 9. SMCEs did not provide sufficient H&S financial resources in their projects (CIDB, 2008: 22). Past studies in South Africa had revealed constraints and challenges of capacity and financial resources among SMCEs (Agumba et al., 2005: 63). Given their limited resources and capacity, smaller contractors in grades 2 to 4 would demonstrate poorer H&S practices and H&S culture (CIDB, 2008: 23).
The effective implementation of H&S management systems, rules and procedures were challenges facing small contractors. They were less likely to possess any formal H&S management systems. Furthermore, management of H&S in SMCEs would, to a large extent, be less structured and based on the prior contract experience of the owners. It was also likely that these contractors would not be aware of the demands and requirements of the South African generic Occupational Health and Safety Act and construction H&S legislative framework (CIDB, 2008: 23).
Furthermore, small contractors were exposed to H&S risks when they used power tools and working where they could be struck by falling objects. These challenges reinforce the need to develop an H&S performance improvement model tailored for SMCEs in the South African construction industry (CIDB, 2008: 23). These challenges and constraints exacerbated the current state of poor H&S performance of SMCEs in South Africa.
2. Health and safety status of the South African construction industry
While recent South African government initiatives to improve safety and quality performance on construction sites have reduced accidents, construction sites continue to be among the most dangerous workplaces in the economy, and rework levels remain comparably high (CIDB, 2004). Approximately 160 deaths occurred on construction sites in 2007/2008 (CIDB, 2008: 3). The construction industry was ranked third after mining and transportation, with 74 deaths recorded on site in 2003 (CIDB, 2004: 33). Furthermore, the most recent report by the Department of Labour (2012) indicated that, in the period 2007 to 2010, the construction industry incurred 171 fatalities and 755 injuries. The industry further paid over R287

Acta Structilia 2013: 20(1)
70
million for occupational injuries in 2010/2011. These statistics are inclusive of SMCEs.
The continuing poor H&S performance of the construction industry in terms of fatalities, injuries, and diseases, the number of large-scale construction accidents, and the general non-participation by key project stakeholders such as clients and designers, provided the catalyst for a new approach to construction H&S in the form of consolidated construction H&S legislation such as the Construction Regulations of 2003. This framework required new multi-stakeholder interventions (Smallwood & Haupt, 2005). However, according to the CIDB, there was very limited commitment to complying with basic requirements, let alone promoting a culture of H&S. SMCEs could barely maintain their tools and equipment and regarded H&S interventions as luxury items. Even where protective clothing and equipment were provided, workers often avoided their use (CIDB, 2004: 33).
2.1 Measurement of construction health and safety performance
Health and safety performance measurement permits the com-parison of H&S performance between projects and can be used internally to maintain line accountability for H&S and to pinpoint problem areas where preventive action should be undertaken. It also provides feedback regarding H&S initiatives (Mitchell, 2000: 326).
Health and safety performance measurement can be broadly classified in terms of two types of indicators, namely lagging indicators and leading indicators or positive performance indicators (PPIs) (Toellner, 2001: 42). Leading indicators can either be subjective in the form of perception measures or objective indicators in the form of the number of occasions an activity has been administered (Grabowski, Ayyalasomayajula, Merrick, Harrald & Roberts, 2007: 1019). Unfortunately, the construction industry continues to rely heavily on traditional lagging indicators such as accident and workers compensation statistics (Mohamed, 2002: 375).
When using leading indicators, a more thorough and constant surveillance is required than when using lagging indicators. The real value of using leading H&S indicators on construction projects lies in the changes that can be made and interventions that can be introduced early to address weaknesses before an accident occurs. The use of leading indicators instead of lagging indicators is increasingly advocated (Hinze, 2005: 10-11). Unfortunately, there is no consensus of what elements and measuring indicators are considered to be critical for improvements to H&S culture

Agumba et al • Health and safety management practices
71
(Fernandez-Muniz et al., 2007: 628) which, according to Grabowski et al. (2010: 264) and Hinze, Thurman & Wehle (2013: 24), is a leading indicator of H&S.
2.2 Previous H&S performance improvement models
Many H&S performance improvement and measurement models have been developed in recent years. For example, Teo & Ling (2006: 1587) developed a model to measure the effectiveness of H&S management of construction sites. The model was based on 3P + I, namely policy, process, personnel and incentive factors. These core factors were measured by 590 attributes. The large number of attributes might not be practical in the context of SMCEs.
Fernandez-Muniz et al. (2007: 636) developed a positive H&S culture model that consisted of management commitment, employee involvement and H&S management system (SMS). The SMS included H&S policy, incentives, training, communication, planning and control. The model could be applied to more than one type of industry of different sizes.
Chinda & Mohamed (2008: 127) developed an H&S culture model adapted from the European Foundation Quality Model (EFQM). The enablers that were identified were leadership, policy and strategy, partnerships and resources, and processes and H&S outcome or goals. The model was validated using large contractors in Thailand. It might be possible to test this model or a modified model within SMCEs. This is because SMCEs and large organisations are different in terms of their characteristics. Large organisations are more properly resourced and organised than SMCEs.
Molenaar, Park & Washington (2009: 495) established that, for H&S performance to improve the corporate H&S culture, it should include H&S commitment, H&S incentives, subcontractor involvement, H&S accountability and disincentives.
It is, therefore, evident that there is no consensus on what the critical H&S elements on construction projects are and their impact on H&S performance at that level.
2.3 Elements of health and safety management
The literature review identified a number of potential H&S elements as important H&S attributes that could improve H&S performance. Many studies have indicated the importance of upper management commitment and involvement in H&S (Fernandez-Muniz et al., 2007: 636; Aksorn & Hadikusumo, 2008: 725; Agumba & Haupt, 2008: 197)

Acta Structilia 2013: 20(1)
72
as an element to improve H&S performance. It is important for upper management to be committed and involved in H&S matters at SMCE project level.
Employee involvement and empowerment has been identified as influential in enhancing H&S performance improvement (Fernandez-Muniz et al., 2007:636; Aksorn & Hadikusumo, 2008: 725). It is important for employees to be empowered and involved in H&S by, for example, being able to refuse to do dangerous and unsafe work (Teo, Theo & Feng, 2008: 494; Agumba & Haupt, 2008: 196). Workers should further be involved in developing H&S policy, providing written suggestions on H&S, being informed of the provisions of H&S plans, being involved in H&S inspections, being consulted when the H&S plan is compiled, and being involved in the development of H&S rules and safe work procedures (Teo et al., 2008: 494; Agumba & Haupt, 2008: 196).
For SMCEs to improve their H&S performance, upper management or owners and their workers need to adhere to the proper implementation of occupational H&S management systems (OHSMS). Eight elements or leading indicators were identified that constituted an OHSMS:
• Appointment of H&S staff (Sawacha, Naoum & Fong, 1999: 313; Findley, Smith, Tyler, Petty & Enoch, 2004: 20). The employment of staff members with H&S training on each project was advocated by Ng, Cheng & Skitmore (2005: 1352).
• Formal and informal written communication in the form of, for example, written circulars or brochures that inform workers about the risks associated with their work and the preventive measures to reduce risk (Sawacha et al., 1999: 314).
• Formal and informal verbal (oral) communication (Fernandez-Muniz et al., 2007: 636). Various forms of this type of communication include providing clear verbal instructions to both literate and illiterate employees about H&S; H&S information verbally communicated to workers before changes are made to the way their work activities are executed; organising regular meetings to verbally inform workers about the risks associated with their work, and organising regular meetings to verbally inform workers about the preventive H&S measures of risky work.
• H&S resources (Abudayyeh, Fredericks, Butt & Shaar, 2006: 173; Fernandez-Muniz et al., 2007: 636). The allocation
Agumba et al • Health and safety management practices
73
of resources will include human, financial and personal protective equipment.
• Project planning of H&S involves procedures to evaluate risks and establish necessary H&S measures to avoid accidents and includes organised planning in the case of emergencies (Sawacha et al., 1999: 313; Fernandez-Muniz et al., 2007: 636).
• Project supervision is an internal concept that verifies the extent to which goals have been fulfilled, as well as compliance with internal norms or work procedures (Fernandez-Muniz et al., 2007: 636; Aksorn & Hadikusumo 2008: 725).
• Training in H&S (Sawacha et al., 1999: 313; Ng et al., 2005: 1351; Fernandez-Muniz et al., 2007: 636; Aksorn & Hadikusumo, 2008: 725).
• H&S policy includes a proper implementation of H&S management system; written in-house H&S rules and regulations for all workers reflecting management’s concern for H&S; principles of actions to achieve H&S, and objectives to be achieved (Ng et al., 2005: 1351; Fernandez-Muniz et al., 2007: 636).
3. Research approachA survey instrument was developed after four iterations of a Delphi study, in which 16 international H&S experts participated. The panel of experts concurred on those H&S practices that were considered to be important and could have a major impact on improving the H&S performance of SMCEs at the project level. The Delphi questionnaire consisted of 64 H&S practices categorised in terms of 10 H&S elements. After the fourth iteration, 31 H&S practices emerged as being very important and having a major impact on improving H&S performance at the project level of SMCEs. A few of these H&S elements were combined in the final survey instrument completed by SMCEs. These elements were formal and informal verbal communication and project planning of H&S. They were renamed H&S planning and communication. Furthermore, H&S resources and training in H&S were combined and renamed H&S resources and training. The combination of these elements was based on the reduced number of H&S practices that achieved consensus. According to Kline (2013: 178), this situation would make it difficult to conduct factor analysis when an element contained fewer than three measurable attributes. Furthermore, three H&S elements were eliminated as their H&S practices did not attain

Acta Structilia 2013: 20(1)
74
consensus. These H&S elements were appointment of H&S staff, formal and informal written communication, and H&S policy.
Eight SMCEs piloted the survey instrument to establish whether they easily understood the questions and the expected rate of response for the final administration of the survey. The pilot survey satisfied the face validity of the 31 H&S practices presented to the construction SMCEs. These H&S practices addressed five H&S elements. They constituted the final questionnaire that was administered to the sample of SMCEs.
A part of the questionnaire was designed to profile the participants in terms of their position in the company, gender, race, their experience in the construction industry and qualification. The questionnaire also profiled the organisation in terms of its type of business and geographic location. After pre-testing via the pilot study, the final version was presented to 1.450 conveniently sampled SMCEs. The data was collected using email and drop-and-collect methods. Only 228 questionnaires were returned, representing a 15.72% response rate. This low response rate concurs with the findings of Kongtip, Yoosook & Chantanakul (2008: 1358). Furthermore, 216 questionnaires were deemed eligible for analysis. The Statistical Package for Social Science (SPSS) version 20 was used to conduct descriptive statistical analysis of the data computing the frequencies, mean scores and standard deviation. SPSS was further used to determine the factor analysability of the H&S practices. Similarly, exploratory factor analysis (EFA) was used to determine the unidimensionality of the H&S elements and their reliability. Reliability was tested using Cronbach’s alpha with a cut-off value of 0.70 as recommended by Hair, Black, Babin, Anderson & Tatham (2006: 102).
4. Research results and discussion
4.1 Respondents’profile
Table 1 shows the profile of respondents. It is evident that the majority of the respondents were either owners or managers of their SMCEs (67%), male (87%), Black African (62%), had either Matriculation (28.4%) or a Certificate (24.7%) or a Higher National Diploma (HND)/Diploma (24.7%), and had 10 years’ or less experience in construction (51.4%).

Agumba et al • Health and safety management practices
75
Table 1: Respondents’ profileFrequency Percentage
PositionOwner 63 30.00%Manager 24 11.00%Owner/manager 32 15.00%Project manager 25 12.00%Other 67 32.00%
211 100.00%GenderMale 186 87.00%Female 29 13.00%
215 100.00RaceAsian/Indian 7 3.00%African/Black 132 62.00%Coloured 7 3.00%White 65 31.00%Other 2 1.00%
213 100.00%Highest education qualificationDoctorate degree 2 0.90%Master’s degree 6 2.80%Honours/BTech/BSc 12 5.60%HND/Diploma 53 24.70%Certificate 53 24.70%Matriculation 61 28.40%Basic schooling 26 12.10%No qualification 2 0.90%
215 100.00%Years of experience in construction1-5 years 40 18.90%6-10 years 69 32.50%11-15 years 39 18.40%16-20 years 32 15.10%21-25 years 6 2.80%26-30 years 12 5.70%31-35 years 6 2.80%Over 36 years 8 3.80%
212 100.00%

Acta Structilia 2013: 20(1)
76
4.2 SMCEsprofile
It is evident from Table 2 that most SMCEs were either subcontractors (37.56%) or general contractors (36.15%), operating in Gauteng province (91.16%). However, the subcontractors either worked for a main contractor or were single trade contractors.
Table 2: SMCEs profileType of contractor Frequency Percentage
General contractor 77 36.15%Subcontractor 80 37.56%Civil contractor 9 4.23%Specialist contractor 21 9.86%Home building contractor 12 5.63%Other 14 6.57%
213 100.00%ProvinceEastern Cape 3 1.40%Free State 5 2.33%Gauteng 196 91.16%KwaZulu-Natal 1 0.50%Limpopo province 4 1.86%Mpumalanga 4 1.86%North-West province 0 0.00%North Cape 0 0.00%Western Cape 2 0.93%
215 100.00%
4.3 Factor analysis
The five H&S elements, namely upper management commitment and involvement in H&S, employee involvement and empowerment in H&S, project supervision, project H&S planning and communication in H&S, and H&S resources and training, were subjected to exploratory factor analysis (EFA) to assess their unidimensionality and reliability. Maximum Likelihood with Promax Rotation was selected as the extraction and rotation methods. The respondents’ perception on element was also measured.
4.3.1 EFA upper management involvement and commitment in H&S
It is evident from Table 3 that there were 11 practices measuring upper management commitment and involvement in H&S.

Agumba et al • Health and safety management practices
77
Table 3: Upper management commitment and involvement in H&SEigen value 5.107
% of variance 46.427Cronbach alpha 0.868
Item Action Mean Standard deviation
Cronbach level after deletion
Factor loading Rank
UMC 1 I/We encourage and support worker participation, commitment and involvement in H&S activities.
4.48 0.751 0.867 0.452 1
UMC 5 I/We take responsibility for H&S by, for example, stopping dangerous work on site, and so on.
4.48 0.678 0.854 0.667 1
UMC 10 I/We ensure that the H&S equipment is bought, for example hardhats, overall, and so on.
4.55 0.585 0.857 0.618 3
UMC 9 I/We regularly conduct toolbox talks with the workers.
4.44 0.776 0.857 0.604 4
UMC 8 I/We encourage discussions on H&S with employees.
4.43 0.661 0.849 0.728 5
UMC 6 I/We actively and visibly lead in H&S matters by, for example, walking through the site, and so on.
4.42 0.600 0.855 0.672 6
UMC 7 I/We regularly visit workplaces to check work conditions or communicate with workers about H&S.
4.42 0.650 0.850 0.717 6
UMC 3 I/We communicate regularly with workers about H&S.
4.40 0.663 0.847 0.786 8
UMC 4 I/We actively monitor the H&S performance of the projects and workers.
4.32 0.706 0.844 0.778 9
UMC 2 I/We accord workers H&S training when there is less work in the project.
3.95 0.882 0.865 0.491 10
UMC 11 I/We reward workers who make an extra effort to do work in a safe manner.
3.79 1.025 0.873 0.465 11
The Cronbach alpha was greater than 0.70 at 0.868, indicating acceptable internal reliability, as recommended by Hair et al. (2006: 102). The Kaiser-Meyer-Olkin (KMO) of 0.890 with Bartlett’s Test of Sphericity of p<0.000 were also obtained, indicating consistency

Acta Structilia 2013: 20(1)
78
with the recommended KMO cut-off value of 0.60 and Bartlett’s Test of Sphericity of p<0.05, as suggested by Pallant (2007: 190). These results suggest that factor analysis could be conducted with the data.
All 11 practices (UMC1, UMC2, UMC3, UMC4, UMC5, UMC6, UMC7, UMC8, UMC9, UMC10 and UMC11) expected to measure the upper management commitment and involvement in H&S loaded together on this factor. The factor loadings for all practices were greater than 0.452 which were greater than the recommended value of 0.40, as suggested by Field (2005: 647) and Hair et al. (2006: 128). An Eigen value greater than 5.107 was established in this factor which explains 46.427% of the variance in the data. Therefore, sufficient evidence of convergent validity was provided for this construct. This finding is in line with the study of Fernandez-Muniz et al. (2007: 634) and that of Findley et al. (2004: 19). They found that the practices were valid and reliable measures of upper management commitment and involvement.
The result in Table 3 indicates that nine of the 11 practices were considered to be practised by the SMCEs, as their mean was above 4.00. The two highest ranked H&S practices were: “encouraging and supporting worker participation”, “commitment and involvement in H&S activities” and “taking responsibility for H&S by, for example, stopping dangerous work on site, and so on”, with a mean value of 4.48. These were also reliable measures of upper management commitment and involvement in H&S. The reliability values were above the recommended value of 0.70, as recommended by Hair et al. (2006: 102). However, the least ranked H&S practice was “rewarding of workers who make an extra effort to do work in a safe manner”, with a mean value of 3.79.
4.3.2 EFA employee involvement and empowerment in H&S
It is evident from Table 4 that there were five practices measuring worker involvement and empowerment construct.
Table 4: Employee involvement and empowerment in H&SEigen value 3.079
% of variance 61.577Cronbach alpha 0.842
Item Action Mean Standard deviation
Cronbach level after deletion
Factor loading Rank
WIS 3 Our workers can refuse to work in potentially unsafe, unhealthy conditions.
4.26 0.788 0.857 0.458 1

Agumba et al • Health and safety management practices
79
Eigen value 3.079% of variance 61.577
Cronbach alpha 0.842
Item Action Mean Standard deviation
Cronbach level after deletion
Factor loading Rank
WIS 1 Our workers are involved in H&S inspections. 4.04 0.884 0.832 0.598 2
WIS 2 Our workers help in developing H&S rules and safe-work procedures.
3.87 0.931 0.776 0.839 3
WIS 5 Our workers are consulted when the H&S plan is compiled.
3.68 1.047 0.791 0.814 4
WIS 4 Our workers are involved in the production of H&S policy.
3.64 1.006 0.778 0.863 5
The findings indicate that the Cronbach alpha was greater than 0.70 at 0.842, indicating acceptable internal reliability, as recommended by Hair et al. (2006:102). The Kaiser-Meyer-Olkin (KMO) of 0.819 with Bartlett’s Test of Sphericity of p<0.000 were also obtained, indicating consistency with the recommended KMO cut-off value of 0.60 and Bartlett’s Test of Sphericity of p<0.05, as suggested by Pallant (2007: 190). These results suggest that factor analysis could be conducted with the data.
The factor loadings for all practices were greater than 0.458 reported in Table 4, which were greater than the recommended value of 0.40, as suggested by Field (2005: 647) and Hair et al. (2006: 128). An Eigen value greater than 3.079 was established in this factor which explains 61.557% of the variance in the data. Therefore, sufficient evidence of convergent validity was provided for this construct. This finding concurs with the study of Fernandez-Muniz et al. (2007: 634) and that of Agumba et al. (2008: 196). They found that the practices were reliable and valid for this element.
Furthermore, the findings in Table 4 indicate that two of the five practices were considered to be practised by the SMCEs as their mean was above 4.00. These highest ranked practices were: “workers can refuse to work in potentially unsafe, unhealthy conditions” and “workers are involved in H&S inspections”, with mean values of 4.26 and 4.04, respectively. They were also reliable measures of employee involvement and empowerment in H&S. The reliability values were above the recommended value of 0.70, as recommended by Hair et al. (2006: 102). However, the least ranked H&S practice within employee involvement and empowerment in H&S was “workers are involved in the production of H&S policy”, with a mean value of 3.64.

Acta Structilia 2013: 20(1)
80
4.4.3 EFA project supervision
It is evident from Table 5 that there were six practices measuring project supervision.
Table 5: Project supervisionEigen value 3.640
% of variance 60.662Cronbach alpha 0.868
Item Action Mean Standard deviation
Cronbach level after deletion
Loading factor Rank
PSP 1 I/We allow supervision of work by staff trained in H&S.
4.23 0.768 0.837 0.786 1
PSP 4 I/We allow local authorities and H&S enforcement agencies to visit sites for inspection.
4.22 0.759 0.850 0.693 2
PSP 5 I/We undertake informal H&S inspection of the workplace daily.
4.17 0.801 0.837 0.781 3
PSP 2 One of our employees trained in H&S identifies dangerous activities.
4.09 0.878 0.848 0.718 4
PSP 3 I/We undertake formal H&S inspection of the workplace daily.
4.08 0.870 0.850 0.714 5
PSP 6 I/We regularly undertake H&S audits of projects. 4.07 0.845 0.854 0.666 6
The result indicates that the Cronbach alpha was greater than 0.70 at 0.868, indicating acceptable internal reliability (Hair et al., 2006: 102). The Kaiser-Meyer-Olkin (KMO) of 0.868 with Bartlett’s Test of Sphericity of p<0.000 were also obtained, indicating consistency with the recommended KMO cut-off value of 0.60 and Bartlett’s Test of Sphericity of p<0.05, as suggested by Pallant (2007: 190). These results suggest that factor analysis could be conducted with the data.
All six practices (PSP1, PSP2, PSP3, PSP4, PSP5 and PSP6) expected to measure the factor project supervision loaded together on this factor. The factor loadings for all practices were greater than 0.666 reported in Table 6, which was greater than the recommended value of 0.40, as suggested by Field (2005: 647) and Hair et al. (2006: 128). An Eigen value greater than 3.640 was established in this factor which explains 60.662% of the variance in the data. Therefore, sufficient evidence of convergent validity was provided for this construct. This finding is in line with the study of Fernandez-Muniz et al. (2007: 634).

Agumba et al • Health and safety management practices
81
Furthermore, the result in Table 5 indicates that all six practices were considered to be practised by the SMCEs, as their mean was above 4.00. The two highest ranked practices were: “allow supervision of work by staff trained in H&S” and “allow local authorities and H&S enforcement agencies to visit sites for inspection”, with mean values of 4.23 and 4.22, respectively. They were also established to be reliable measures of project supervision. The reliability values were also above the recommended value of 0.70 considered by Hair et al. (2006: 102).
4.4.4 EFA project health and safety planning and communication
It is evident from Table 6 that there were four practices measuring project H&S planning and communication.
Table 6: Project health and safety planning and communicationEigen value 2.786
% of variance 69.644Cronbach alpha 0.852
Item Action Mean Standard deviation
Cronbach level after deletion
Factor loading Rank
PPC 4 I/We organise regular meetings to verbally inform workers about the risks and preventive measures of their work.
4.27 0.779 0.850 0.665 1
PPC 3 I/We include H&S in our projects programme. 4.23 0.753 0.784 0.822 2
PPC 2 Our firm uses procedures to identify possible H&S dangers on site.
4.16 0.790 0.788 0.833 3
PPC 1 I/We consider H&S when layout of site is done. 4.08 0.858 0.823 0.769 4
The result indicates that the Cronbach alpha was greater than 0.70 at 0.852, indicating acceptable internal reliability, as indicated by Hair et al. (2006: 102). The Kaiser-Meyer-Olkin (KMO) of 0.764 with Bartlett’s Test of Sphericity of p<0.000 were also obtained, indicating consistency with the recommended KMO cut-off value of 0.60 and Bartlett’s Test of Sphericity of p<0.05, as suggested by Pallant (2007:190). These results suggest that factor analysis could be conducted with the data.
The factor loadings for all practices were greater than 0.665, as reported in Table 5, which were greater than the recommended value of 0.40, as suggested by Field (2005: 647) and Hair et al. (2006: 128). An Eigen value greater than 2.786 was established

Acta Structilia 2013: 20(1)
82
in this factor which explains 69.644% of the variance in the data. Therefore, sufficient evidence of convergent validity was provided for this construct.
The findings in Table 6 indicate that all four practices were considered to be practised by the SMEs, as their mean was above 4.00. The two highest ranked practices were: “organising regular meetings to verbally inform workers about the risks and preventive measures of their work” and “include H&S in our projects programme”, with mean values of 4.27 and 4.23, respectively. These practices were also established to be reliable measures of project health and safety planning and communication. The reliability values were also above the recommended value of 0.70, as recommended by Hair et al. (2006: 102).
4.4.5 EFA health and safety resources and training
It is evident from Table 7 that there were five practices measuring H&S resources and training.
Table 7: Health and safety resources and trainingEigen value 3.281
% of variance 65.628Cronbach alpha 0.864
Item Action Mean Standard deviation
Cronbach level after deletion
Factor loading Rank
HSR 2 I/We provide correct tools and equipment to execute construction work.
4.61 0.561 0.832 0.782 1
HSR 1 I/We buy hardhats, gloves, overalls, and so on for workers.
4.59 0.678 0.847 0.708 2
HSR 5 I/We ensure that workers are trained to do the work safely.
4.49 0.692 0.830 0.771 3
HSR 3 I/We conduct induction of all workers on H&S before commencing work on a particular site.
4.46 0.793 0.835 0.751 4
HSR 4 I/We ensure that our workers are properly trained to take care of and use personal protective equipment.
4.41 0.726 0.834 0.763 5
The result indicates that the Cronbach alpha was greater than 0.70 at 0.864, indicating acceptable internal reliability, as suggested by Hair et al. (2006: 102). The Kaiser-Meyer-Olkin (KMO) of 0.801 with Bartlett’s Test of Sphericity of p<0.000 were also obtained, indicating

Agumba et al • Health and safety management practices
83
consistency with the recommended KMO cut-off value of 0.60 and Bartlett’s Test of Sphericity of p<0.05 recommended by Pallant (2007: 190). These results suggest that factor analysis could be conducted with the data.
All five practices (HSR1, HSR2, HSR3, HSR4 and HSR5) expected to measure H&S resources and training loaded together on this factor. The factor loadings for all practices were greater than 0.708, as reported in Table 7, which were greater than the recommended value of 0.40, as suggested by Field (2005: 647) and Hair et al. (2006: 128). An Eigen value greater than 3.281 was established in this factor which explains 65.628% of the variance in the data. Therefore, sufficient evidence of convergent validity was provided for this construct. This finding is supported by Choudhry, Fang, Lew & Jenkins (2007) and Agumba et al. (2008: 196-197).
Furthermore, the findings in Table 7 indicate that all five practices were considered to be practised by the SMCEs, as their mean was above 4.00. The two highest ranked practices were: “providing correct tools, equipment to execute construction work” and “buying hardhats, gloves, overalls, and so on for workers”, with mean values of 4.61 and 4.59, respectively. They were also established to be reliable measures of project supervision. The reliability values were also above the recommended value of 0.70 considered by Hair et al. (2006: 102).
4.4.6 ReliabilityofthefiveH&Selements
The result in Table 8 indicates the reliability of the five H&S elements.
Table 8: Summary of statistics and Cronbach’s alpha coefficient of the H&S elements
Construct Mean Standard deviation
Number of items
Cronbach alpha Rank
H&S resources and training. 4.51 0.56 5 0.864 1Upper management commitment and involvement. 4.33 0.48 11 0.868 2
Project H&S planning and communication. 4.19 0.66 4 0.852 3
Project supervision 4.14 0.64 6 0.868 4Employee involvement and empowerment. 3.90 0.73 5 0.842 5
The Cronbach alpha values for each element are satisfactory. They were all above the cut-off point of 0.70, which is the minimum recommended value by Hair et al. (2006: 102). The result further

Acta Structilia 2013: 20(1)
84
indicates that H&S resources and training was ranked higher than the other four H&S elements, with a mean value of 4.51. However, employee involvement and empowerment in H&S was the least ranked, with a mean value of 3.90.
5. ConclusionsThis research established that the H&S elements, namely upper management commitment and involvement in H&S, employee involvement and empowerment in H&S, project supervision, project H&S planning and communication in H&S, and H&S resources and training, that were identified through literature review and verified by H&S experts using the Delphi process and a pilot survey with eight construction SMCEs, were valid and reliable H&S practices performed/implemented by the SMCEs in the South African construction industry.
The respondents’ perception on the various H&S practices of the five H&S elements indicated that, of the 31 individual practices, 26 were rated above the mean value of 4.00, indicating strongly agree to agree. However, five individual H&S practices were rated below the mean rate of 4.00, namely accord workers H&S training when there is less work in the project, and reward workers who make an extra effort to do work in a safe manner. These two practices were measured under the element upper management commitment and involvement in H&S. Previous studies by Fernandez-Muniz et al. (2007: 636) and Aksorn & Hadisukumo (2008: 725) established that upper management commitment and involvement in H&S was an important element that influences H&S performance. The low rating of these two practices within the South African context could be driven by the financial constraints experienced within construction SMCEs, as indicated in the CIDB report (2008: 22). These H&S practices were financially driven and could, therefore, lead SMEs not to favour practices which would impact on their limited budgets.
The other practices were measuring employee involvement and empowerment in H&S, namely:
• Our workers help in developing H&S rules and safe work procedures;
• Our workers are consulted when the H&S plan is compiled, and
• Our workers are involved in the production of H&S policy.
This finding suggests that the low rating of these three practices could be the result of employees who are employed in projects

Agumba et al • Health and safety management practices
85
when such practices have already been carried out by upper management personnel; for example, the owner as indicated by Maloney, Cameron & Hare (2007: 303).
Furthermore, the respondents’overall perception was that employee involvement and empowerment in H&S was the least practised. This is an indication that SMCEs did not involve and empower their employees to a great degree in H&S. However, the SMCEs indicated that they provided resources and training of H&S at their project level. This H&S element might be implemented because of the current requirements of the South African government through occupational H&S legislation, regulations and trade unions that all stakeholders such as, for example, employers and contractors should observe health and safety in their projects. It can, therefore, be concluded that the findings of this study enhance H&S knowledge in the South African construction industry especially within SMCEs.
These H&S elements are proactive measures and could inform SMCEs of their H&S performance. As proactive measures, they could also be used to alleviate any accidents or incidents before they occurred. These H&S practices also reflected the H&S culture of SMCEs at project level in South Africa.
AcknowledgementThis project would not have been possible without the research funding support of the National Research Foundation (NRF).
References listAbudayyeh, O., Fredericks, K.T., Butt, E.S. & Shaar, A. 2006. An investigation of management’s commitment to construction safety. International Journal of Project Management, 24(2), pp. 167-174.
Agumba, J.N., Adegoke, I.O. & Otieno, F.A.O. 2005. Evaluating project management techniques in small and medium enterprises delivering infrastructure in South Africa’s construction industry. In: Proceedings of the 3rd Postgraduate Conference, Construction Industry Development, 9-11 October. Eskom Convention Centre, Midrand, Johannesburg, South Africa, pp. 52-65.
Agumba, J.N. & Haupt, T. 2008. Perceptions of construction health and safety performance improvement enablers. In: Proceedings of Association of Schools of Construction of Southern Africa (ASOCSA), 3rd Built Environment Conference, 6-8 July. Westin Grand, Cape Town, South Africa, pp. 184-200.

Acta Structilia 2013: 20(1)
86
Aksorn, T. & Hadisukumo, B.H.W. 2008. Critical success factors influencing safety performance program in Thai construction projects. Safety Science, 46(4), pp. 707-727.
Azimah, N., Abdullah C., Spickett T.J., Rumchev, B.K. & Dhaliwal, S.S. 2009. Assessing employees’ perception on health and safety management in public hospitals. International Review of Research Papers, 5(4), pp. 54-72.
Chinda, T. & Mohamed, S. 2008. Structural equation model of construction safety culture. Engineering, Construction and Architectural Management, 15(2), pp. 114-131.
Choudhry, M.R., Fang, D., Lew, J.J. & Jenkins, L.J. 2007. Assessing safety climate in construction. A case study in Hong Kong. In: Proceedings of Associated Schools of Construction (ASC), 43rd Annual Conference, 11-14 April. Northern Arizona University, Flagstaff, Arizona, USA, CD-ROM.
CIDB (Construction Industry Development Board). 2008. Construction health and safety in South Africa, status and recommendations. Pretoria: CIDB.
CIDB (Construction Industry Development Board). 2004. SA Construction Industry Status Report. Pretoria: CIDB.
Department of Labour. 2012. Department of Labour to sign a construction health and safety accord to help stem casualty list. [online]. Available from: <http://www.info.gov.za/speech/DynamicAction?pageid=461&sid=30075&tid=80991> [Accessed 7 May 2013].
Department of Public Works. 1999. White paper on creating an enabling environment for reconstruction growth and development in the construction industry. Pretoria: Government Printers. [online]. Available from: <http://www.info.gov.za/whitepaper/1999/en viron-ment.htm> [Accessed: 1 February 2013].
Fernandez-Muniz, B., Montes-Peon, M.J. & Vazquez-Ordas, J.C. 2007. Safety culture: Analysis of the causal relationships between its key dimensions. Journal of Safety Research, 38(6), pp. 627-641.
Field, A. 2005. Discovering statistics using SPSS (and sex, drugs and rock ’n roll). 2nd edition. London: Sage.
Findley, M., Smith, S., Tyler K., Petty, G. & Enoch, K. 2004. Injury and cost control safety program elements in construction. Which ones best prevent injuries and control-related workers’ compensation costs? Professional Safety, 49(2), pp. 14-21.

Agumba et al • Health and safety management practices
87
Grabowski, M., Ayyalasomayajula, P., Merrick, J., Harrald, R.J. & Roberts, K. 2007. Leading indicators of safety in virtual organizations. Safety Science, 45(10), pp. 1013-1043.
Grabowski, M., You, Z., Song, H., Wang, H. & Merrick, R.W.J. 2010. Sailing on Friday: Developing the link between safety culture and performance in safety critical systems. IEEE Transactions on Systems Management and Cybernetics - Part A: Systems and Humans, 40(2), pp. 263-284.
Hair, J.F., Black, W.C., Babin, J.B., Anderson, R.E. & Tatham, R.L. 2006. Multivariate data analysis. 6th edition. Upper Saddle River, New Jersey: Pearson/Prentice Hall.
Hinze, J. 2005. A paradigm shift: Leading to safety. In: Proceedings of the 4th Triennial International Conference Rethinking and Revitalizing Construction Safety, Health, Environment and Quality, 17-20 May. Port Elizabeth, South Africa, pp. 1-11.
Hinze, J., Thurman, S. & Wehle, A. 2013. Leading indicators of construction safety performance. Safety Science, 51(1), pp. 23-28.
Kline R.B. 2013. Exploratory and confirmatory factor analysis. In: Petscher, Y. & Schatsschneider, C (eds), Applied quantitative analysis in the social sciences. New York: Routledge, pp. 171-207.
Kongtip, P., Yoosook, P. & Chantanakul, S. 2008. Occupational health and safety management in small and medium-sized enterprises: An overview of the situation in Thailand. Safety Science, 46(9), pp. 1356-1368.
Maloney, F.W., Cameron, I. & Hare, B. 2007. Tradesmen involvement in health and safety. Journal of Construction Engineering and Management, 133(4), pp. 297-305.
Martin, l. 2010. Challenges faced by South African emerging contractors - review and update. In: Proceedings of the Construction, Building and Real Estate Research Conference of Royal Institute of Chartered Surveyors, 2-3 September. Dauphine Université, Paris, France, CD-ROM.
Mearns, K., Whitaker, M.S. & Flin, R. 2003. Safety climate, safety management practice and safety performance in offshore environments. Safety Science, 41(8), pp. 641-680.
Mitchell, R. 2000. Development of PPIs to monitor OHS performance in Australian construction industry. Journal Occupational Health and Safety Australia-NZ, 16(4), pp. 325-331.

Acta Structilia 2013: 20(1)
88
Mohamed, S. 2002. Safety climate in construction site environments. Journal of Construction Engineering and Management, 128(5), pp. 375-384.
Molenaar, R.K., Park, J-I. & Washington, S. 2009. Framework for measuring corporate safety culture and its impact on construction safety performance. Journal of Construction Engineering and Management, 135(6), pp. 488-496.
Ng, T.S., Cheng, P.K. & Skitmore, R.M. 2005. A framework for evaluating the safety performance of construction contractors. Built Environment, 40(10), pp. 1347-1355.
Pallant, J. 2007. SPSS, Survival Manual: A step-by-step guide to data analysis using SPSS Version 15. 3rd edition. Berkshire: McGraw Hill.
Rajendran, S. & Gambatese, A.J. 2009. Development and initial validation of sustainable construction safety and health rating system. Journal of Construction Engineering and Management, 135(10), pp. 1067-1075.
Sawacha, E., Naoum, S. & Fong, D. 1999. Factors affecting safety performance on construction sites. International Journal of Project Management, 17(5), pp. 309-315.
Smallwood, J. & Haupt, T. 2005. The need for construction health and safety (H&S) and the construction regulations: Engineers’ perceptions. Journal of the South African Institution of Civil Engineering, 47(2), pp. 2-8.
South Africa. 1993. Occupational Health and Safety Act, Act 85 of 1993. Pretoria: Government Printer.
Teo, A.L.E. & Ling, Y.Y.F. 2006. Developing a model to measure the effectiveness of safety management systems of construction sites. Built and Environment, 41(11), pp. 1584-1592.
Teo, A.L.E., Theo, H. & Feng, Y. 2008. Construction health and safety performance in developing and developed countries: A parallel study in South Africa and Singapore. In: Hinze, J., Bohmer, S. & Lew, L. (eds), Proceedings of the CIB W99 14th International Conference on Evolution of and Directions in Construction Health and Safety, 9-11 March. Gainesville, Florida, USA, pp. 485-499.
Toellner, J. 2001. Improving safety and health performance: Identifying and measuring leading indicators. Professional Safety, 46(9), pp. 42-47.Ciae etumquas nissi nem que in restiustem re, tem earum nulpa quiatis se etur, torum unt.

89
Fidelis Emuze, Humbulani Mashili & Brink Botha
Post-occupancyevaluationofofficebuildings in a Johannesburg country club estate
Peer reviewed and revised
AbstractThe purpose of this article is to present the findings of a research project aimed at determining the level of satisfaction of building occupants in terms of Indoor Environmental Quality (IEQ) and the effect of IEQ on both the morale and the productivity of the employees working in the complex. The main findings were derived from the perceptions of the employees working in a Country Club Estate (CCE) in Johannesburg, South Africa. The questions asked addressed how poor air quality, lack of access to daylight, unpleasant acoustic conditions, and control over lighting and thermal comfort caused dissatisfaction with the buildings’ IEQ. The data were collected during August and September 2012. Questionnaires were sent to ten office blocks within the CCE complex. A total number of 126 questionnaires were sent out and 102 replies were received. Observations from the data led to the view that the satisfactory level of IEQ awareness is low among the occupants and that the employees have limited control over issues such as air ventilation, artificial lighting and noise in their offices. Organisational structure needs to be formed that will enlighten occupants about factors that contribute to poor indoor air quality (IAQ). Organisational procedures also point to the fact that the level of IEQ is low. The inconsistent ratings that were recorded suggest that there appears to be a major scope for addressing post-occupancy evaluation (POE)-related matters in the complex.Keywords: Buildings, employee morale, employee productivity, facility management, Health and Safety (H&S), Indoor Environmental Quality (IEQ), Post-Occupancy Evaluation (POE)
Dr Fidelis Emuze, Senior Lecturer, Department of Built Environment, Central University of Technology, Free State (CUT), Private Bag X20539, Bloemfontein, 9300, South Africa. Phone: +27 51 507 3661, email: <[email protected]>
Humbulani Mashili, MSc (Built Environment), Graduate at the Department of Construction Management, Nelson Mandela Metropolitan University, PO Box 77000, Port Elizabeth, 6031, South Africa. Phone: +27 41 504 2790, email: <[email protected]>
Dr Brink Botha, Senior Lecturer, Department of Construction Management, Nelson Mandela Metropolitan University, PO Box 77000, Port Elizabeth, 6031, South Africa. Phone: +27 41 504 2085, e-mail: <[email protected]>

Acta Structilia 2013: 20(1)
90
AbstrakDie doel van hierdie artikel is om die bevindinge van ’n navorsingsprojek oor die vasstelling van die tevredenheidsvlak van inwoners oor die binnenshuise-omgewingskwaliteit (IEQ) en die effek daarvan op die moraal en produktiwiteit van die werknemers in hierdie gebou weer te gee. Die belangrikste bevindinge is afgelei uit die persepsies van werknemers in ’n buiteklubkompleks in Johnnesburg, Suid-Afrika. Die vrae wat gevra is, gaan oor hoe swak lugkwaliteit, gebrek aan toegang tot daglig, onaangename akoestiese toestande en die beheer oor die beligting en termiese gemak lei tot ontevredenheid met die IEQ in die geboue. Die data is ingesamel gedurende Augustus en September 2012. Vraelyste is gestuur na tien kantoorblokke in die buiteklubkompleks. ’n Totaal van 126 vraelyste is uitgestuur en 102 antwoorde is ontvang. Waarnemings van die data het gelei tot die siening dat die tevredenheidsvlak van IEQ-bewustheid laag is onder die inwoners en dat die werknemers beperkte beheer het oor kwessies soos lugventilasie, kunsmatige beligting en geraas in hul kantore. Organisatoriese strukture moet gevorm word wat inwoners oor die faktore wat bydra tot swak binnenshuise kwaliteit van die lug (IAQ) inlig. Organisasieprosedures verwys ook na die feit dat die vlak van IEQ laag is. Die teenstrydige graderings wat aangeteken is, dui daarop dat daar klaarblyklik ’n groot omvang is vir die aanspreek van na-besetting geëvalueer (POE)-verwante sake in hierdie kompleks.Sleutelwoorde: Geboue, werknemermoraal, werknemerproduktiwiteit, fasiliteits-bestuur, gesondheid en veiligheid (H&S), binnenshuise omgewingskwaliteit, na-besetting evaluasie
1. IntroductionBuilding occupants or employees wish to work in an environment that is conducive to their health and well-being. When these conditions are absent in a work environment, the morale, productivity and performance of employees can deteriorate. In order to address such issues, the idea of Post-Occupancy Evaluation (POE) came into being. POE is relatively new in the built environment in South Africa. A desktop study indicates limited literature in the subject area; even facility management texts failed to provide the needed South African-based knowledge. Thus, an explorative study was conducted in Johannesburg, South Africa to determine the level of satisfaction of the building occupants in terms of Indoor Environmental Quality (IEQ), and then to proffer solutions to identified problems so that the building performance and similar future buildings can be improved upon in terms of IEQ.
2. Post-occupancy evaluation (POE)POE was established due to problems arising from the building industry, more especially in the care facilities such as mental hospitals, nursing homes, and correctional services (Riley, Kokkarinen & Pitt, 2010: 203). POE is the process whereby a building has to be
Emuze, et al. • Post-occupancy evaluation
91
evaluated accurately once it has been built and occupied for some time (Carthey, 2006: 58). POE is a general term for a broad range of activities aimed at understanding how buildings perform once they are built, and the level of satisfaction of building users with the environment thus created (Hewitt, Higgins, Heatherly & Turner, 2005: 3). POE was derived from the ‘occupancy permit’, a document that is issued once the building has been inspected and is declared free from all defects and ready for occupation (Riley et al., 2010: 204).
POE is not a new model; it originated in the United Kingdom (UK) when the British Ministry of Education, in agreement with local governments, first undertook evaluations of buildings in the post-World War II period (Kooymans & Haylock, 2006: 2). The United States of America (USA) followed in the footsteps of the UK, in the early 1960s, with the School Construction System Development in California. Internationally, POE has been endorsed on a longer term basis as a useful addition to architectural practice – the USA serves as an example in this regard (Kooymans & Haylock, 2006: 2). Hence, POE gained momentum in the mid-1960s with an increase in the number of researchers focusing on building design. In time, environmental psychologists developed interests in POE with the aim of focusing on scientific knowledge proliferation (Riley et al., 2010: 204). For instance, Shepley, Zimmerman & Boggess (2009: 17) conducted a POE study at the new location of a 174-person Architectural firm in Boston, USA. The study revealed that occupants were more satisfied with a new building when compared with an older building, although concerns were raised about the impact on indoor air quality, thermal comfort, lighting, noise and office layout (Shepley et al., 2009: 18).
POE is vital, as it reminds corporate executives of the needs of employees that affect their productivity (Kooymans & Haylock, 2006: 3). Such needs are not limited to privacy, lighting, storage and thermal comfort. Providing feedback through POE can also assist the organisation when new ideas and knowledge are put forward for continuous improvement purposes (Lackney & Zajfen, 2005: 23). POE is, therefore, an evaluation tool that is perceived as a sub-process of building performance evaluation and can be defined as the act of evaluating buildings in a systematic manner after they have been built and occupied for some time (Preiser & Vischer, 2005: 8). Once the evaluation is done, it will yield evidence related to different perspectives, reflections and learning (Walker, 2011: 6).

Acta Structilia 2013: 20(1)
92
3. Indoor environmental quality (IEQ)The occupants’ well-being and performance are affected by various factors associated with a building. Such factors include indoor air quality (IAQ), temperature, daytime lighting, work space and noise. All these factors have an impact on human health, and could result in employees’ low morale and reduced productivity. Quality of work and productivity may be compromised if all these factors are not addressed appropriately. Air pollutants, ergonomics, lighting and temperature may cause a deterioration of health of the occupants of the building (Kamaruzzaman, Zawawi, Pirtt & Don, 2010: 193).
3.1 Indoor air quality (IAQ)
IAQ considers the indoor environment that includes air and comfort factors related to temperature and humidity. IAQ deals with how well the indoor air satisfies the occupants of the building. Inadequate ventilation increases indoor pollutants by not allowing sufficient outdoor air to dilute the emissions from indoor sources. An IAQ problem may originate from office machines, chemical cleaning materials and from occupants themselves. Outdoor chemicals or toxins may also affect the air quality of the office building (Burroughs & Hansen, 2011: 10-12).
These symptoms of poor IAQ may cause health problems such as irritations of the eyes, mental fatigue and headaches. Constant failure to regularly evaluate the building’s performance leads to poor IEQ, which may negatively affect the quality of life of the occupants, who will ultimately have to resort to medical treatment (Cho & Lee, 2010: 443). This indoor air problem may lead to the total dysfunction of the organisation if it is not taken seriously at the earliest stage, because it would reduce the productivity of the organisation (Antikainen, Lappalainen, Lonnqvist, Maksimainen, Reijula & Uusi-Rauva, 2008: 79).
Occupants’ concentration and work progress may be enhanced due to improvement of the air quality, which would ultimately increase the productivity of the organisation. If air quality is improved in the office, it will reduce absenteeism among employees who are vulnerable to poor IAQ. Joint responsibilities are essential between occupants/employees and stakeholders of the buildings to ensure that improvement of the IAQ is maintained at all times (Creative Department, 2009: 1).

Emuze, et al. • Post-occupancy evaluation
93
3.2 Lighting
Office work cannot be fulfilled fully without lighting in the building. However, lighting poses certain challenges to human health and will affect the overall service of the employee to the organisation. Most design professionals fail to include lighting requirements at the initial stage, forgetting the fact that this oversight will affect productivity in the workplace if lighting requirements are not met (De Carli & De Giuli, 2009: 1797). The recent technological development of lighting has forced designers to include lighting as a necessity in the office environment, as ineffective lighting may reduce the productivity in the workplace. Having computers in the workplace makes it easier for the occupants to deliver their work more promptly. Office light is supposed to support both paper-based and computer-based work, which makes it difficult for the occupants to adjust the lights to meet both requirements. Light emitted by the computer also contributes some setbacks to the occupants’ health if the screen light is not set correctly (AL-Anzi, 2009: 45).
Poor quality of lighting in the workplace will cause eyestrain, which leads to dizziness and stress. Occupants will become disgruntled because of their dissatisfaction with the lights in the building, which will result in reduced productivity. Occupants will start spending long periods away from work to consult a medical expert for treatment of their eyes and/or vision problems (Samani, 2011: 541). Light sends visual messages to the occupants of the building, which could decrease or increase the good mood and motivation levels of the individuals in the building. Quality of lighting in the office building is linked to productivity, because without high-quality lights in the building, the productivity drops (Samani, 2011: 540).
3.3 Thermal comfort
Thermal comfort is that condition of mind, which expresses satisfaction with the thermal environment (Saberi, 2009: 3). The lack of evaluation of buildings regarding the thermal comfort may lead to the occupants’ discomfort if the building is too hot or too cold. It is, as a rule, not possible to have the right thermal comfort as occupants of different cultures prefer different air temperatures and, without evaluating this, it would not be known whether everyone is satisfied with the thermal comfort provided to them. If the evaluation of the building is done at certain intervals, occupants are able to choose the type of clothing that is suitable to the temperature of the building (Hassasain, 2008: 214).

Acta Structilia 2013: 20(1)
94
AL-Anzi (2009: 48) identifies some effects of high and low temperatures on the occupants in the office. A high temperature causes occupants to become tired, whereas a low temperature makes occupants feel cold. This will have a serious impact on employee productivity if not addressed properly.
Some thermal comfort factors such as air temperature, humidity, radiant heat and air movement may contribute to the symptoms of sick-building syndrome (Saberi, 2009: 4-5). This syndrome produces symptoms such as eye and nose irritation as well as headaches that are associated with the occupancy of the building (McGrath & Horton, 2011: 247).
3.4 Workspace availability and noise
Based on their perceptions, occupants’ dissatisfaction may emanate from workspace designs that appear to be poor. The designs must comply with the highest standards of IEQ, which will stimulate the occupants’ morale and satisfaction. Employers are thus compelled to create workspace that is flexible and open for movement. Environmental aspects of the workspace must be taken seriously when employers choose workspace, as these may have a serious impact on H&S (Vischer, 2008: 97). Occupants must be given the opportunity to voice their opinion regarding the workspace which they intend to occupy. This will enable the employer to gauge the level of satisfaction regarding the workspace provided to the occupants. It is important that the employer creates a workspace that is suitable for occupants so that they will feel valued and inspired by their employer, and be proud of the work they do. Workspace psychology may play an important part, whereby motivation and commitment could influence occupants to be more productive. Working in an unhygienic workplace will reduce the morale and increase job dissatisfaction among employees (Davies, 2010: 4).
A proper office set-up stimulates interaction between the occupants, which will increase productivity in the workplace. Adequate workspace layout will increase the occupants’ concentration and interaction with one another when carrying out work tasks. Sharing of work-related information will also increase the organisational productivity, because experienced occupants will provide assistance to inexperienced occupants (Davies, 2010: 4). There is a correlation between the design of workspace and occupant performance. A well-designed workspace stimulates the occupants’ performance, because occupants will always feel

Emuze, et al. • Post-occupancy evaluation
95
motivated to report to work regularly, unlike having to work in an unplanned workspace (Vischer, 2008: 102).
Office noise, as an indoor environmental factor, disturbs all occupants and can be extremely irritating. Noise can deter occupants from concentrating on their work. Many researchers have acknowledged this, and have produced findings that noise may lead to stress, headaches and other disorders (AL-Anzi, 2009: 44). Designers are obliged to design buildings that include acoustic materials, in order to minimise noise in the office and/or other building environments. An employer should be in a position to select an acoustic office design that will cater for noise control and noise reduction within the workstation. Strategic thinking is required if the employer wants to reduce the noise level, by increasing the room’s capacity for absorption, increasing screen height, and increasing the masking of the sound level (Hongisto, 2008: 1). Office wall-panel height must be considered to ensure that at least minimum privacy is maintained, even though it is an open-space office. Work-related information can easily be disseminated among occupants; however, noise in the office building destroys the work flow between employees (Davies, 2010: 8). Office noise can be extremely dangerous as it may cause cardiovascular problems in occupants in the long term (Bluyssen, Aries & Dommelen, 2011: 280). Noise has a negative influence on the occupants’ performance, which will have an impact on individual job satisfaction. There is a correlation between the working environment and employees’ performance in terms of the physical environment that s/he is sharing in the office. Noise is regarded as one factor that negatively impacts on an employee’s performance satisfaction (Danielson, 2008: 532).
3.5 Officeproductivityandworkenvironment
Productivity in the organisation is also affected by the area in which the building is situated. A well-designed office layout improves productivity, because employees will be motivated to report to work every day if they work in environments conducive to work. Occupants spend most of their time in the office; therefore, well-designed office space must be provided, as this will also increase the organisation’s productivity (Goudarzvandchegini & Modaberei, 2011: 74).
Poor air quality may affect the company’s productivity when workers are affected by health hazards such as respiratory, skin, nerve, nasal and other related problems. Poor indoor air quality destroys

Acta Structilia 2013: 20(1)
96
the workers’ morale in terms of reporting to work, which ultimately reduces the organisation’s productivity (Antikainen et al., 2008: 80).
Management should, therefore, create a work environment that is profitable and productive, and avoid a situation where they work in isolation without interacting with employees. Guidelines for roles and responsibilities must be clearly defined so that morale and production will be higher than management’s expectations in firms (Chandrasekar, 2011: 4).
4. MethodsThe research design formulated included a questionnaire survey, and the principle of voluntary participation was upheld. This suggests that people were not coerced into participating in the research. Confidentiality was enhanced by keeping participants anonymous throughout the study to ensure confidentiality, and to encourage openness and honesty (Marlow, 2010: 301). The research location for the study was a Country Club Estate (CCE) in Johannesburg, South Africa. The population group consisted of employees of the CCE. The reason for this is that the employees were on the premises most of the time and can testify based on their experiences related to the problems they have experienced in terms of IEQ.
The questionnaires were physically distributed to the respondents who were requested to return the completed questionnaires via the internal mailing system in use. From the 126 questionnaires distributed, only 102 were returned. This resulted in an 81% response rate.
The structured questionnaire was distributed inside ten blocks in the CCE. The questionnaire included six sections (A-F). Section A elicited responses relative to occupants’ personal information in terms of age, gender, profession, and term of employment. Section B helped to evaluate the level of satisfaction with the buildings’ IEQ. This section addressed the IEQ in the buildings with respect to whether the air in the building is fresh or stale, rate of air circulation, control of ventilation, temperature, thermal comfort and noise, as well as artificial lighting in the buildings. Section C helped to determine whether the building is satisfactory to its occupants. The emphasis was on the interior of the buildings. Section C focused on the lighting in the buildings, access control to the building, and safety. Section D helped to reveal whether the IEQ affects the employees’ productivity and performance. Section E assisted in revealing whether office space influences employee performance and productivity. Section F gave an indication as to whether occupants are satisfied with the parking space and access to public transport.

Emuze, et al. • Post-occupancy evaluation
97
5. Results and discussion
5.1 Indoor air quality
Very stale
60
50
40
30
20
10
01%
13%
50%
24%
12%
Stale Normal Fresh Very fresh
Figure 1: Air freshness or staleness in the building
When asked about how they rate the air within the building, 50% of the respondents mentioned that they rate the air within the building as normal, while 24% stated that they feel the air as fresh, and 13% of the respondents rate the air as very stale, as shown in Figure 1.
80
60
40
20
0Too humid Humid Normal Dry Too dry
1% 3%
75%
21%
Figure 2: Humidity or dryness of the air within the building
Of the respondents, 75% stated that the air in the building is quite normal, while 21% mentioned that the air in the building is dry; 3% of the respondents stated that the air in the building is humid, whereas 1% of the respondents mentioned that the air in the building is too humid, as shown in Figure 2.

Acta Structilia 2013: 20(1)
98
6%
26%
51%
6%11%
60
50
40
30
20
10
0No
circulationSlight
circulationGood
circulationVery good circulation
Excellent circulation
Figure 3: Rate of circulation of air in the building
The findings indicated that 26% of the respondents indicated that there is slight circulation of air in the building, while 6% indicated that there is no air circulation within the building. The results for this question, as presented in Figure 3, revealed that 51% of the occupants perceive that there is good circulation of air within the building, while 11% of the respondents mentioned that there is a very good circulation of air in the building.
No control Fair control Full control
33%37%
30%
0 0
40
30
20
10
0
Figure 4: Control of circulation of air in the offices
The results in Figure 4 show that 33% of the respondents indicated that they have no control of air ventilation in their offices, while 37% of the respondents indicated that they have fair control of air ventilation in their offices, and 30% of the respondents mentioned that they have full control of air ventilation in their offices.

Emuze, et al. • Post-occupancy evaluation
99
Results from Figures 1-3 revealed that the building’s occupants can be deemed to be satisfied with the indoor air quality.
5.2 Lighting
6%
70%
21%
3%
70
60
50
40
30
20
10
0Too little
lightLittle light Moderate
lightToo much
light
Figure 5: Natural light in the building
Figure 5 shows that, of 102 respondents, 70% indicated that there is moderate natural light in the office building; 21% of the respondents also suggested that there is little natural light, while 6% of them contended that there is too little light in the office building.
Very low Low Moderate High Very high
1%
11%
51%
35%
2%
60
50
40
30
20
10
0
Figure 6: Artificial light in the building
The survey result showed that 51% of the respondents indicated that there is moderate artificial light in the building, while 35% indicated

Acta Structilia 2013: 20(1)
100
that there is high artificial light in the building; 11% of the occupants responded that there is low artificial light in the building, while 1% of the respondents mentioned that there is a very low artificial light in the building, as shown in Figure 6. This may imply that, while most occupants may not have experienced eyes-related health challenges, some may have challenges with eye diseases in the building due to artificial light.
No control Slight control
Control Full control
50
40
30
20
10
0
40%
23%2 3%
14%
0
Figure 7: Control over artificial lighting in the building
Of the respondents to whom the questionnaires were distributed, 40% indicated that they do not have control over artificial lighting in their offices in the complex; 23% of the respondents indicated that they do have control over artificial lighting in the office complex, while 14% mentioned that they do have full control over artificial lighting in the complex. The survey revealed that 23% of the respondents indicated that they do have slight control over artificial lighting in the office complex, as shown in Figure 7. The results related to the control over lighting supports the fact that lack of control over certain aspects of the building’s IEQ leads to dissatisfaction related to IEQ of buildings.

Emuze, et al. • Post-occupancy evaluation
101
60
50
40
30
20
10
0
11%
16%
57%
1%
15%
Not effective
Less effective Effective
More effective
Very effective
Figure 8: Effect that blinds/shutters may have on blocking out natural light in the building
Results in Figure 8 reveal that 57% of the respondents mentioned that there are effective blinds for blocking out natural light, while 15% of the respondents stated that blinds or shutters are more effective for blocking out natural light; 11% of the results show that blinds are very effective in blocking out natural light in the building.
5.3 Thermal comfort
16%6%7%
22%
50%52%
25%20%
0 2%
60
50
40
30
20
10
0 Very
coldFairly cold Warm Hot
Very hot
Temperature in summer
Temperature in winter
Figure 9: Perceived room temperatures in summer and winter
From the 102 respondents, 52% of them indicated that it is warm during summer in their offices, while 22% mentioned that it is hot during summer in their offices. However, 6% of the respondents indicated that it is very hot during summer in their offices. The findings in Figure 9 show that 50% of the respondents indicated that it is warm

Acta Structilia 2013: 20(1)
102
during winter in their offices, while 16% indicated that it is very cold during winter; 25% responded that is fairly cold during winter, while 7% of the respondents indicated that it is hot during winter. This suggests that there is no proper control of thermal comfort within the office building, which could lead to dissatisfaction with regard to the IEQ. This also gives an indication that the majority of the occupants would not be vulnerable to diseases such as influenza during the winter season; however, they would be exposed to health challenges during the summer season when the temperature is not supposed to be lukewarm.
5.4 Workspace availability and noise
Table 1: Satisfaction regarding space planningResponse (%)
Office space flexibility Parking spaceAccessibility of public
transport to office complex
Not satisfiedLess satisfiedSatisfiedFairly satisfiedVery satisfiedTotal
10.023.028.019.020.0
100.0
11.015.028.017.029.0
100.0
29.023.032.012.04.0
100.0
The survey results in Table 1 show that 10% of the respondents indicated that they are not satisfied with space flexibility at their workplace, while 23% of the respondents indicated that they are less satisfied with it; 28% of the respondents also mentioned that they are satisfied with the flexibility of space provided, while 19% of the respondents are fairly satisfied. Of the total respondents to whom questionnaires were distributed, 11% of them indicated that they are not satisfied with the parking space provided in the complex, while 15% of them indicated that they are less satisfied. The findings revealed that 28% of the respondents indicated that they are satisfied with the parking space in the office complex, while 29% are very satisfied with it. From the findings shown in Table 1, 29% of the respondents suggest that they are not satisfied with the accessibility of public transport from Country Club Estate, while 23% of the respondents indicated that they are less satisfied; 32% of the respondents are equally satisfied with the accessibility of public transport, while 4% are very satisfied with the public transport accessibility to the office complex.

Emuze, et al. • Post-occupancy evaluation
103
Table 2: Satisfaction with the condition of the buildingResponse (%)
Office Training room Canteen Boardroom Reception
PoorAverageGoodVery GoodExcellentTotal
3.017.045.022.013.0
100.0
5.027.035.024.09.0
100.0
15.021.033.021.09.0
100.0
3.022.033.025.015.0
100.0
4.023.031.026.016.0
100.0
Table 2 reveals that an average of 3% of the respondents indicated that the poor state of the office, boardroom and reception, while 21% of the respondents rated them average. An average of 36% of the respondents rated office, boardroom and reception as good, while 24% rated very well in office, boardroom and reception area.
2%9%
55%
21%13%
6050403020100
Very dissatisfied
Dissatisfied Satisfied More than satisfied
Very satisfied
Figure 10: Extent of occupants’ satisfaction concerning safety in the building
Figure 10 shows how occupants in the complex rate the level of satisfaction regarding the safety in the building. The survey result reveals that 55% of the respondents are satisfied, while 21% of the respondents are more than satisfied with the safety of the building; 9% of the respondents are dissatisfied with the safety of the complex, while 2% are totally dissatisfied with the safety of the building.Given the aforementioned, it can be concluded that occupants are not satisfied with space flexibility of the building, while the majority of the respondents are satisfied with the safety of the building.

Acta Structilia 2013: 20(1)
104
Lighting contribution to safety
Access control to building
4% 2%5%
10%
40%
57%
22%27%
9%
60
50
40
30
20
10
0
Non-signific
ant
Slightly
signific
ant
Signific
ant
More than ...
Very sig
nificant
Figure 11: Control of access to the building
Results in Figure 11 show that 40% of the respondents indicated that it is significant to have access control to the building, while 5% indicated that it is slightly significant to have access control to the building. The survey reveals that 22% of the respondents indicated that it is more than significant to have access control to the office building. In addition, 57% of the respondents indicated that it is significant to consider lighting when assessing the safety of the working environment, while 22% indicated that they consider light as more than significant.
Very difficult
Difficult Easy Very easy
80
70
60
50
40
30
20
10
0 04%
28%
68%
0
Figure 12: The ease of movement within the building
Of the respondents, 4% indicated that it is difficult to move within the building, while 28% of the respondents indicated that it is very easy

Emuze, et al. • Post-occupancy evaluation
105
to move within the building; 68% of the respondents indicated that movement within the building is very easy, as shown in Figure 12.
43%
Not significant
Fairly significant Significant
Very significant
50
40
30
20
10
0
25% 26%
6%
Figure 13: Noise pollution from outside the building
Of the respondents, 26% indicated that they hear external noise that leads to significant distractions, while 25% of them do not hear such external noise, as shown in Figure 13; 43% of the respondents mentioned that external noise is not significantly distracting them from work, while 6% opined that external noise does affect them very significantly when executing their work. These results support the postulation that unpleasant acoustic conditions lead to building occupants’ dissatisfaction with regard to building IEQ.
5.5 Officeproductivityandworkenvironment
Results in Table 3 show that 36% of the respondents indicated that distraction from noise affects their performance and productivity in their firms, while 23% of the occupants mentioned that noise distraction has some effect on their performance and productivity; 16% of the respondents stated that noise distraction affects their productivity and work performance, while 7% indicated that noise distraction has a major effect on them. The survey shows that 29% of the respondents stated that noise level has a minor effect on their work performance and productivity, while 32% of the respondents mentioned that noise level has some effect on their work performance and productivity.

Acta Structilia 2013: 20(1)
106
Table 3: IEQ effects on occupants’ productivity and performance
Quality of light
Distraction of noise
Noise level
Quality of air
Temperature in office
Quality of space provided
Minor effectNear minor effectSome effectNear major effectMajor effectTotal
37.016.027.013.07.0
100.0
36.018.023.016.07.0
100.0
29.09.0
36.013.013.0
100.0
31.017.028.012.012.0
100.0
27.013.030.016.014.0
100.0
36.08.0
27.015.014.0
100.0
When asked whether quality of air has an effect on employee performance and productivity, 31% of the respondents indicated that the quality of air has a minor effect on their performance and productivity, while 28% viewed the effect to be moderate. A small percentage (12%) of the respondents also indicated that the quality of air contributes significantly to their work performance and productivity. Furthermore, 27% of the respondents contended that the temperature in the office has a minor effect on their performance and productivity, while 30% maintained that the temperature in the office has some effect; 16% of the respondents indicated that the temperature in the office has a near major effect, while 14% mentioned that the temperature has a major effect on their performance and productivity.
6. ConclusionFrom the foregoing, it can be concluded that the satisfactory level of IEQ awareness is low among the participants. Organisational structure needs to be formed that will teach occupants the factors that contribute to poor IAQ. Organisational procedures also point out that the level of IEQ is low. Similarly, 22% of the respondents complained that the temperature in their offices is hot during summer, while 20% complained that the temperature in the office is fairly cold during summer. This inconsistency suggests that the temperature issue has not been addressed in a manner that suits the occupants of the office complex.
It can be concluded that inadequate IEQ can lead to poor work performance among occupants. This can be substantiated by the following findings indicating that 27% of the respondents opined that the quality of light has some effect on their work performance, while 13% indicated that it has a near major effect on work performance. However, only 23% indicated that noise distraction has some effect on work performance and productivity; 28% of the respondents also

Emuze, et al. • Post-occupancy evaluation
107
replied in the negative relative to quality of air by saying that it has some effect on occupant work performance, which leads to poor productivity. Although 30% of the respondents indicated that office temperature does have some effect on their work performance, the findings reveal that 14% of the occupants perceive that temperature could lead to decreased work performance and productivity.
There seems to be a lack of control of noise in the office building, as the majority of the occupants complained about the distraction from other office cubicles. This suggests that the management of the estate complex is not proactive in terms of combating noise, which leads to discomfort among the occupants, during working hours. The fact that there is moderate natural light in the building shows that there may be design-related inadequacies pertaining to the complex. The fact that occupants do not have control over artificial light in the building creates a major threat to human eyes in the long run.
Based on the findings of the research, it can be concluded that POE is new to the employees working at the CCE. This can be substantiated by the fact that the perceptions of occupants with regard to IAQ, which poses health challenges within the building, were not satisfactory.
7. RecommendationsThis exploratory study shows that office buildings should be constructed in a manner that is environment friendly; meets occupants’ IEQ requirements, and supports their activities. Evaluating IAQ in the office building is very important with the intended goal of ensuring that air pollutants, which are harmful to the human body, do not emerge in buildings.
With regard to the way forward, employers in the complex should endeavour to handle employee satisfaction as an aspect of their organisational culture, so that it can be addressed from time to time. The management of the complex should start applying POE and, in the process, emphasise the rewards that employees and employers would realise. The management of the complex could hire a task team that involves health practitioners, in order to investigate the cause of IAQ problems. This would reduce the rate of absenteeism among employees who have experienced discomfort by way of headaches, nausea, dizziness, and eye irritation.
Designers and other stakeholders should persuade one another to use building materials that have low emissions to minimise

Acta Structilia 2013: 20(1)
108
the potential development of air pollutants. Ventilation systems that are in need of maintenance must be serviced regularly to avoid occupants inhaling stale air which puts occupants in an uncomfortable situation.
Lighting systems that are used in the office building should comply with the indoor lighting requirements to avoid a decrease in performance when it is too dim or too bright. If lighting in the office building is used according to POE, this may save as much energy as possible, as results may improve organisational productivity. To improve privacy in workstations, designers should increase the wall height of partitions, which may also reduce the noise from adjacent workstations. For natural lighting to penetrate more successfully into the buildings, designers should evolve more options when designing or altering existing buildings.
However, given the limitations and challenges that were encountered in the course of this research project, the findings should be interpreted in this context only. In order to unearth far-reaching perspectives and contribute substantially to knowledge, a future multidisciplinary research is recommended. The future study could entail the use of more than one case study as its unit of analysis.
References listAL-Anzi, N.M. 2009. Workplace environment and its impact on employee performance. MBA Dissertation. Malaysia: Open University of Malaysia.
Antikainen, R., Lappalainen, S., Lonnqvist, A., Maksimainen, K., Reijula, K. & Uusi-Rauva, E. 2008. Exploring the relationship between indoor air and productivity. Scandinavian Journal of Work, Environment & Health, 4(1), pp. 79-82.
Bluyssen, P.M., Aries, M. & Dommelen, P. 2011. Comfort of workers in the office buildings: The European HOPE project. Building and Environment, 46(2), pp. 280-288.
Burroughs, H.E. & Hansen, S.J. 2011. Managing indoor air quality. 5th edition. Lilburn, GA: Fairmont Press, Inc.
Carthey, J. 2006. Post-occupancy evaluation: Development of a standardised methodology for the Australian health projects. The International Journal of Construction Management, 6(1), pp. 57-74.

Emuze, et al. • Post-occupancy evaluation
109
Chandrasekar, K. 2011. Workplace environment and its impact on organisational performance in the public sector organisations. International Journal of Enterprise Computing and Business Systems, 1(1), pp. 1-17.
Cho, S.H. & Lee, T.K. 2010. Indoor environmental quality related on residential satisfaction in old multi-family housing. In: 3rd International Symposium on Sustainable Healthy Buildings, 27 May 2010. Seoul, Korea, pp. 443-456.
Creative Department 2009. Indoor air quality: Healthy environments for child care and preschools program [Online]. Available from: <http:/ /www.cehnorg/files/indo> [Accessed: 16th May 2012].
Danielsson, C.B. 2008. The difference in perception of noise and privacy in different office types: In: Proceedings of Acoustic 08 Paris, 29 June – 4 July. Paris, France, pp. 531-536.
Davies, H. 2010. The psychological and physical needs of workers impacting office design. In: Proceedings of the RICS Foundation Construction and Building Research Conference, 2-3 September 2010. COBRA, London, England, pp. 1-15.
De Carli, M. & De Giuli, V. 2009. Optimization of daylight in buildings to save energy and to improve visual comfort: Analysis in different latitudes. In: Proceedings of the 11th International IBPSA Conference, 27-30 July 2009. Glasgow, Scotland, pp. 1797-1804.
Goudarzvandchegini, M. & Modaberei, M. 2011. The impact of office layout on productivity of selected organizations in Gilan-Iran. Journal for Trends in Advanced Science and Engineering, 2(1), pp. 73-80.
Hassanain, M.A. 2008. On the performance evaluation of sustainable student housing facilities. Journal of Facilities Management, 6(3), pp. 212-225.
Hewitt, D., Higgins, C., Heatherly, P. & Turner, C. 2005. Market-friendly Post-Occupancy Evaluation. New Building Institute, Portland, Building Performance Report Number: C. 10091.
Hongisto, V. 2008. Effects of sound masking on workers: A case study in a landscaped office. In: 9th International Congress on Noise as a Public Health Problem, 29 June-4 July 2007. Paris, France, pp. 537-542.
Kamaruzzaman, S.N., Zawawi, M.A.E., Pirtt, M. & Don, Z.M. 2010. Occupant feedback on indoor environmental quality in refurbished historic buildings. International Journal of Physical Sciences, 5(3), pp. 192-199.

Acta Structilia 2013: 20(1)
110
Kooymans, R. & Haylock, P. 2006. Post-occupancy evaluation and workplace productivity. In: Proceedings of the Pacific Rim Real Estate Society Conference, 22 January 2006. Auckland, New Zealand, pp. 1-15.
Lackney, J.A. & Zajfen, P. 2005. Post-occupancy evaluation of public libraries: Lessons learned from three case studies. Structural Survey, 19(1), pp. 16-25.
Marlow, C.R. 2010. Research methods for generalist social works. 5th edition. Belmont, CA: Cengage Learning.
McGrath, P.D. & Horton, F. 2011. A post-occupancy evaluation (POE) study of student accommodation in a MMC/modular building. Structural Survey, 29(3), pp. 244-252.
Preiser, W.F.E. & Vischer, J.C. 2005. Assessing building performance. Oxford: Elsevier-Butterworth Heinemann.
Riley, M., Kokkarinen, N. & Pitt, M. 2010. Assessing post-occupancy evaluation in higher education facilities. Journal of Facilities Management, 8(3), pp. 202-213.
Saberi, O. 2009. Thermal comfort and green buildings. In: Proceedings of the WSP Environment & Energy (Middle East) – Green Retrofit Conference, 15-16 December 2009.Dubai, United Arab Emirates (UAE), pp. 1-20.
Samani, S.A. 2011. The influence of light on student’s learning performance in learning environments: A knowledge internalized perspective. World Academy of Science, Engineering and Technology, 81(1), pp. 540-547.
Sheply, M.M., Zimmerman, K.N. & Boggess, M.M. 2009. Architectural office post-occupancy evaluation. Journal of Interior Design, 34(3), pp. 17-29.
Vischer, J.C. 2008. Towards an environmental psychology of workspace: How people are affected by environments for work. Architectural Science Review, 51(2), pp. 97-108.
Walker, K. 2011. Developing a site evaluation framework for ephemeral festivals and events: A study of Hillside Festival. MA Dissertation. Guelph, Canada, University of Guelph.

111
Frank Berry & Basie Verster
Die volwassenheid van die bourekenaar se kontraktuele kommunikasievermoë
Peer reviewed and revised
AbstrakDie doel van hierdie artikel is om die beginsels wat die bourekenaar ondersteun om kontraktueel effektief te kommunikeer, te identifiseer en te meet om die standaard van die volwassenheid van die bourekenaar se bourekenkundige kontraktuele kommunikasie te bepaal. Hierdie artikel vorm deel van ’n volledige studie oor bourekenkundige kommunikasie in die konstruksiebedryf en word aspekte soos mondelinge, skriftelike, elektroniese en leierskapkommunikasie elders aangespreek.Die ondersoek is gedoen onder praktiserende bourekenaars, argitekte, ingenieurs, kliënte en aannemers, gekies uit al 9 provinsies van die Republiek van Suid-Afrika. Die vraelys is in 2010 uitgestuur en is ook in dieselfde jaar terug ontvang. Die vraelys is per e-pos gesirkuleer met die doel om die beginsels wat die bourekenaar ondersteun om kontraktueel effektief te kommunikeer, te meet volgens die volwassenheidsnorm wat vir die bourekenaarstandaard teenoor die norm wat vir die wêreldklasstandaard geld.Die resultate van die respondente het die volgende aangewys as beginsels in kontraktuele kommunikasievolwassenheid gemeet aan die bou-rekenaarstandaard: kontraktueelbindend, billikheid, effektiwiteit/afdwing-baarheid en ondubbelsinnigheid waar kontraktueelbindend die mees positiewe en ondubbelsinnigheid die mins positiewe waarderingsuitslag gelewer het.Sleutelwoorde: Kommunikasievolwassenheid, kommunikasievermoë, konktraktuele kommunikasie, bourekenaar, Suid-Afrika
AbstractThe aim of this article is to identify principles that support the quantity surveyor to communicate effectively in contractual communication and measure these principles to determine the maturity standard of the quantity surveyor’s quantity surveying contractual communication. This article forms part of a more comprehensive study on quantity surveying communication in the construction industry, and aspects such as oral, written, electronic and leadership communication have been addressed elsewhere.
Dr Frank H. Berry, Senior Lektor, Departement Bourekenkunde en Konstruksiebestuur, Universiteit van die Vrystaat, Posbus 392, Bloemfontein, 9300, Suid-Afrika. (†Oorlede 14 Oktober 2012). Tel: 051 4012198, e-pos: <[email protected]
Prof. Jacobus Johannes Petrus (Basie) Verster, Departement Bourekenkunde en Konstruksiebestuur, Universiteit van die Vrystaat, Posbus 392, Bloemfontein, 9300, Suid-Afrika. Tel: 051 4012198, e-pos: <[email protected]
Oorsigartikels • Review articles

Acta Structilia 2013: 20(1)
112
The survey was conducted among practising quantity surveyors, architects, engineers, clients and contractors chosen from all 9 provinces of South Africa. The questionnaire was distributed to, and returned by respondents in 2010. The questionnaire was circulated by means of e-mail for the purpose of measuring the principles that support the quantity surveyor to communicate effectively in contractual communication according to the quantity surveying standard vs the worldclass standard.The results of the survey indicated that respondents identified the following principles as important in contractual communication maturity measured against quantity surveying standard: contractual binding, reasonableness, effectiveness/enforceability and unambiguousness, where contractual binding showed the most positive and unambiguousness the least positive valuation result.Keywords: Communication maturity, communication capabilities, contractual communication, quantity surveyor, South Africa
1. InleidingDie hoofprobleem is dat die volwassenheid van bourekenkundige kommunikasievaardighede in kontraktuele kommunikasie waar-skynlik nie voldoende aangespreek is nie, en derhalwe mag dit die effektiwiteit van besluite en die besluitnemingsproses negatief beïnvloed. Die probleem wat as gevolg van ’n gebrek aan kommunikasievaardighede in die konstruksiebedryf ontstaan, is dat die toepassing van kontraktuele kommunikasievermoë van dié professie in die algemeen nie na wense blyk te wees nie, en die rasionaal vir hierdie ondersoek was. Hierdie ondersoek kan moontlik die probleme aan die lig bring en oplossings daarvoor kan voorgestel word. Deur die kontraktuele kommunikasie volwassenheidsvermoë van die bourekenaar te meet kan die belangrike kontraktuele kommunikasiebeginsels geïdentifiseer en voorgestel word.
Hipotese: Deur die bepaling van die effektiwiteit en vlak van volwassenheid van bourekenkundige kontraktuele kommunikasie vas te stel en tendense te identifiseer, mag ’n bydrae tot die verbetering van kommunikasie in die konstruksiebedryf gelewer word.
2. Kontraktuele kommunikasieDie humoristiese opmerking deur wyle Sam Goldwyn, dat ’n mondelinge kontrak nie die papier werd is waarop dit geskryf is nie, is by wyse van spreke. ’n Mondelinge kontrak is wel in meeste gevalle geldig en het ’n bindende effek. Die probleem is egter om die bestaan van die kontrak te bewys (Finsen, 2005: 7-8).

Berry & Verster • Die volwassenheid van die bourekenaar
113
’n Boukontrak is ’n ooreenkoms tussen twee partye waar die aannemer onderneem om ’n gebou op te rig en die kliënt ooreenkom om daarvoor te betaal (Finsen, 2005: 1).
Volgens Finsen (2005: 40) het die verskyning van die aannemer en die behoefte aan ’n boukontrakooreenkoms dit genoodsaak om die kontraktuele verhouding met die kliënt te reguleer. Die belang en invloed van ’n boukontrakooreenkoms om die kontraktuele verhouding tussen die aannemer en kliënt te reguleer, word hiermee bevestig.
Volgens Chappell (2008: 20) kan ’n bindende kontrak nie slegs uitdrukking van welwillendheid as basis hê nie. ’n Ooreengekome prys of ’n metode om dit te bereken, asook eenstemmigheid ten opsigte van die werk en tyd van voltooiing mag nodig wees voordat ’n hof bereid sal wees om sekere terme in ’n kontrak toe te pas, maar nie om ’n kontrak te skep wat nie bestaan nie. Hierdie verwysing beklemtoon die feit dat meer as ’n blote gebaar van welwillendheid nodig is as basis vir ’n bindende kontrak in die konstruksiebedryf.
Volgens McKenzie, McKenzie & Ramsden (2009: 18-20) is die definiëring van woorde en begrippe belangrik. Die beginsels van kommunikasie en begrip van kommunikasie vind ook inslag in die Suid-Afrikaanse reg waar ‘duidelike taal’ beteken, ‘taal wat per definisie duidelik is’, en wat gevolglik voorrang bo ander moontlike interpretasies geniet. Regter Wessels het die argument in die Scottish Union & National Insurance Co Ltd v Native Recruiting Corporation Ltd-hofsaak soos volg gestel:
We must gather the intention of the parties from the language of the contract itself, and if that language is clear, we must give effect to what the parties themselves have said; and we must presume that they knew the meaning and the words they used.
Volgens Bowen, Cattell, Michell & Kabayanondo (2006: 26) het die afsender van inligting in die konstruksiebedryf die verantwoordelikheid, hetsy dit die kliënt of ’n lid van die ontwerpspan is, om inligting op so ’n wyse te struktureer dat dit gedetailleerd, duidelik en ondubbelsinnig is. Die inligting sluit waarskynlik ook kontrakdokumentasie in en beklemtoon hoe belangrik dit is dat kontrakdokumentasie ondubbelsinnig behoort te wees.
Kontrakdokumentasie bevat die bepalings en voorwaardes waaronder ’n projek bestuur word om die kontraktuele verhouding wat tussen die partye ontstaan het, te hanteer en die projek suksesvol te voltooi. Die spesifikasie vorm deel van die kontrakdokumentasie wat met die gehalte van materiaal en die vakmanskap wat vereis

Acta Structilia 2013: 20(1)
114
word te make het en het ten doel om enige onduidelikheid in hierdie verband aan te spreek (Berry, 2012: 149).
Die JBCC Principal Building Agreement Series 2000 definieer contract documents soos volg (JBCC, 2007: 1):
… means this document, the contract drawings, the bills of quantities/lump sum document and such other documents as are identified in the schedule.
Die uitvoering van konstruksiewerk op ’n terrein vereis dat ’n kontrak aan ’n aannemer toegeken word. Hierdie kontraktuele ooreenkoms vereis die gebruiklike praktyke en prosedures waar kontraktuele kommunikasie ’n groot rol speel (Ashworth, 1992: 22-23).
Volgens Miners (1969: 154; 1971: 65) is die hoofkommunikasiemedia wat deur die boubedryf gebruik word, die kontrakdokumentasie. Die kontrakdokumentasie in ’n formele ooreenkoms word as kontraktueel bindend beskou in terme van die lyne van die tekeninge deur die ontwerpers, die woorde in die tegniese spesifikasie vervat, en alle ander aspekte van die kontrakdokumentasie. Indien enige verandering aan hierdie kontrakdokumentasie gemaak is, word ’n verandering van die kontrak gekonstitueer (Haplin, 2005: 50).
Volgens Malherbe & Lipshitz (1978: 72) is dit belangrik om ten minste die volgende beginsels, wat essensieel en fundamenteel in die opstel van ’n kontrak is, te stipuleer:
There must be agreement between the contracting parties to create a legal and binding contractual relationship embracing rights, responsibilities, prerogatives and privileges.
The parties must be at one as to the consequences contem-plated by such agreement or in other words, as to their intention in the application of agreed contractual relations.
’n Kontrak het derhalwe ten doel om ’n kontraktueelbindende verhouding tussen partye tot stand te bring met die verpligtinge wat daarmee gepaard gaan. In die saamstel van kontrakdokumentasie behoort die beginsels wat essensieel en fundamenteel in die opstel van ’n kontrak is, in ag geneem te word.
Die volgende beginsels is in ’n vorige studie geïdentifiseer as belangrike elemente wat die bourekenaar in staat stel om effektief kontraktueel in die konstruksiebedryf te kommunikeer: ‘kontraktueel bindend’, ‘billikheid’, ‘afdwingbaarheid en effektiwiteit’ en ‘ondubbelsinnigheid’ (Berry, 2012: 116).

Berry & Verster • Die volwassenheid van die bourekenaar
115
3. TerminologieDie belang en invloed van die voorheengeïdentifiseerde beginsels op die kontraktuele kommunikasie van die bourekenaar impliseer noodwendig dat die definisies daarvan dit konstateer.
Volgens HAT (Odendal, Schoonees, Swanepoel, Du Toit & Booysen, 1994: 568) word ‘kontraktueel’ soos volg gedefinieer:
Volgens kontrak: Kontraktueel gebind wees.
Volgens HAT (Odendal et al., 1994: 87) word ‘bindend’ soos volg gedefinieer:
Verpligtend, wat van krag is: ’n Bindende ooreenkoms, bepaling.
Die definisies dui daarop dat die partye tot die kontrak deur die kontrak gebind is en dat die kontrak stiptelik uitgevoer behoort te word.
Die skep van ’n wetlike verhouding of ’n ooreenkoms, wat die oogmerk en gevolge van so ’n verhouding uitspel, is aan aanbod en aanname onderhewig, wat volgens ’n redelike interpretasie daarvan duidelik, ondubbelsinnig, omvattend en volledig moet wees om onbetwisbaar, saaklik en bindend te wees (Malherbe & Lipshitz, 1978: 72).
Volgens HAT (Odendal et al., 1994: 87) word ‘billikheid’ soos volg gedefinieer:
Regverdig: Iemand billik behandel. Billik teenoor iemand optree.
Indien daar geen teenstrydigheid in die woorde van ’n kontrak is nie, is daar geen gronde vir ’n billiker interpretasie as wat die woorde self vertolk nie (McKenzie, McKenzie & Ramsden, 2009: 19).
Die belang van die beginsel ‘billikheid’ kom in bogemelde verwysing na vore waar die interpretasie van woorde in die vertolking daarvan gesetel is. Die afleiding kan gemaak word dat die beginsel ‘billikheid’ in die opstel van ’n kontrak nodig is en kan derhalwe as ’n beginsel vir effektiewe kontraktuele kommunikasie beskou word.
Loots (1985: 33) stel dit dat ’n persoon wat ’n siening uitspreek of ’n voorspelling maak, alhoewel eerlik bedoel, en met geloof in die korrektheid daarvan, van nalatigheid aangespreek kan word indien die nodige stappe, soos van ’n redelike persoon verwag word, nie geneem word om homself te vergewis dat die siening geregverdig is nie:
Acta Structilia 2013: 20(1)
116
… if a man, who has or professes to have special knowledge or skill, makes a representation by virtue thereof to another – be it advice, information or opinion – with the intention of inducing him to enter into a contract with him, he is under a duty to use reasonable care to see that the representation is correct, and that the advice, information or opinion is reliable. If he incorrectly gives unsound advice or misleading information or expresses an erroneous opinion and thereby induces the other side to enter into a contract with him, he is liable in damages.
Volgens bogemelde aanhaling mag ’n persoon nalatig wees indien hy hom nie vergewis het deur die nodige stappe te neem om te bepaal of ’n spesifieke siening geregverdig is al dan nie. Dit kan eweneens ook van toepassing wees in die opstel van ’n kontrak. Die afleiding kan gemaak word dat die beginsel ‘billikheid’ in die opstel van ’n kontrak nodig is.
Volgens HAT (Odendal et al., 1994: 186) word ‘effektiwiteit’ soos volg gedefinieer:
Wat die gewenste effek, uitwerking het; doeltreffend.
Die afleiding kan gemaak word dat die kontrak effektief moet wees in terme van die gebruik daarvan deur die betrokke partye.
Alhoewel ’n kontrak bindend mag wees, is ’n kontrak nie noodwendig afdwingbaar nie, soos byvoorbeeld, deur die verloop van tyd in terme van die Verjaringswet (Wet 8 van 1943 soos aangepas) (McKenzie, McKenzie & Ramsden, 2009: 99).
Die hoofvereiste van ’n kontrak is die ooreenkoms tot toekomstige prestasie. Die afwesigheid in ’n ooreenkoms van fundamentele aspekte is fataal en dit kan die afdwingbaarheid en effektiewe prestasie onmoontlik maak (Finsen, 2005: 3-4).
Dit kan gemeld word dat, indien dit volgens die reg onmoontlik is om ’n kontrak uit te voer of dat die kontrak in wese nietig is, word beide partye van prestasie vrygestel (McKenzie, McKenzie & Ramsden, 2009: 60).
Volgens HAT (Odendal et al., 1994: 727) word ‘ondubbelsinnigheid’ soos volg gedefinieer:
Wat net op een manier uitgelê, verstaan kan word; nie vatbaar vir misverstand nie; helder.
Miners (1969: 154) beklemtoon dat die hooffunksie van alle kontrakdokumentasie die lewering van essensiële inligting in die mees duidelike en ondubbelsinnige wyse moontlik moet wees.

Berry & Verster • Die volwassenheid van die bourekenaar
117
Volgens Emmitt & Gorse (2003: 14) is dit duidelik dat daar komplikasies in kommunikasie kan voorkom indien kontraktuele kommunikasie nie in plek is nie. Die belangrikheid en effektiwiteit van kontraktuele kommunikasie, wat ook in die konstruksiebedryf van toepassing is, word beklemtoon.
Kontraktuele kommunikasie vorm ’n belangrike deel van die bourekenaar se werk. Die opstel van die kontrakdokument vir tenderdoeleindes, naamlik die hoeveelheidslyste, is ’n sprekende voorbeeld van sodanige werksaamhede. Die kennis van kontraktuele kommunikasie skep ’n basis om wanvertolking van kommunikasie in die konstruksiebedryf te beperk (Berry, 2007).
Volgens The Free Dictionary (Farlex, 2008: Internet) word ‘wêreldklas’ soos volg gedefinieer:
Ranking among the foremost in the world; of an international standard of excellence; of the highest order.
Die rede waarom ‘wêreldklas’ as maatstaf gebruik word, kom na vore in die definisie waar die standaard vir sigself spreek, naamlik:
• Gereken onder die bestes/voorstes in die wêreld;• ’n Internasionale standaard van uitnemendheid/uitmunt-
endheid/voortreflikheid; en• Die hoogste orde.
Volgens Gruber (2004) is ‘volwassenheid’ professionele ontwikkeling oor ’n tydperk, asook begrip waarom suksesvolle uitkomste behaal word.
Volgens HAT (Odendal et al., 1994: 568) word ‘kontrak’ soos volg gedefinieer:
Ooreenkoms waarby wedersyds verpligtinge aangegaan is.
Volgens HAT (Odendal et al., 1994: 560) word ‘kommunikasie’ soos volg gedefinieer:
Kennisgewing, mededeling.
Vir doeleindes van hierdie artikel word kontraktuele kommunikasie beskou as die effektiewe gebruik van kontraktuele beginsels wat nodig is vir ’n wedersydse ooreenkoms aangegaan tussen betrokke partye. Kontraktuele kommunikasie se belang is beperk tot die kontrakdokumentasie wat deur die bourekenaar self of bourekenaarsprofessie opgestel word, of waarby die bourekenaar spesifiek betrokke is, of deur beïnvloed word. Die behandeling van

Acta Structilia 2013: 20(1)
118
ander regs- en kontraktuele beginsels in detail val buite die bestek van hierdie artikel.
4. Navorsing’n Vraelys is aan geselekteerde praktiserende bourekenaars, argitekte, ingenieurs, kliënte en aannemers per e-pos gesirkuleer met die doel om sienings ten opsigte van die volwassenheid van bourekenkundige kommunikasie in die konstruksiebedryf in te win. Die geselekteerde groep is uit al 9 provinsies van Suid-Afrika gekies en het ’n redelike verspreiding verteenwoordig. Die werkservaring van 77.0% van die respondente is 10 jaar en meer in die konstruksiebedryf, terwyl 52.6% van hierdie persentasie ’n werkservaring van 20 jaar of meer het. Vir doeleindes van hierdie artikel word die respondente se werkservaring as bewese gereken en hul siening kan derhalwe as verteenwoordigend en geloofwaardig beskou word (sien Tabel 1).
Tabel 1: Werkservaring van respondenteRespondente
groepe 0-4 jaar 5-9 jaar 10-19 jaar 20 jaar en meer Onbekend Totaal
Ingenieurs 0 0 2 10 0 12
Aannemers 0 1 5 3 1 10Kliënte 1 1 1 6 0 9Argitekte 1 3 2 6 0 12Bou-rekenaars 5 5 9 16 0 35TOTAAL 7 (9.0%) 10 (12.8%) 19 (24.4%) 41 (52.6%) 1 (1.2%) 78 (100%)
Die respondente met ’n kliënte- en bourekenaarsagtergrond se terugvoer was positief in vergelyking met die ander respondente en onderskeidelik 40.91% en 43.21% van diegene wat vraelyste ontvang het, het voltooide vraelyste teruggestuur. Die argitekte, ingenieurs en kontrakteurs het minder positief gereageer en die respons op die vraelyste uitgestuur was onderskeidelik 18.18%, 18.46% en 30.30%. Die respons word in Tabel 2 getoon.
Tabel 2: Respons op vraelyste
Respondente groepe
Vraelyste uitgestuur
Vraelyste terug ontvang Persentasie
Ingenieurs 65 12 18.46%
Aannemers 33 10 30.30%
Kliënte 22 9 40.91%
Argitekte 66 12 18.18%

Berry & Verster • Die volwassenheid van die bourekenaar
119
Respondente groepe
Vraelyste uitgestuur
Vraelyste terug ontvang Persentasie
Bourekenaars 81 35 43.21%
TOTAAL 267 78 29.21%
Die totale reaksie was 29.21% gebaseer op die vraelyste wat terug ontvang is en word vir doeleindes van hierdie artikel as verteenwoordigend beskou.
Die opskrifte en afkortings, wat in die volgende tabelle gebruik is, het die volgende betekenis:
Beginsels van kontraktuele kommunikasie: Illustreer wat die respondente se siening is oor wat die belangrikheid van die vlak van volwassenheid is ten opsigte van elke element in kontraktuele kommunikasie.
GBS: Gemiddeld van bourekenaarstandaard (gebaseer op die opinies van respondente oor wat die vlak van bourekenaarstandaard in die bourekenaarsprofessie in Suid-Afrika behoort te wees, gemeet teen hul siening van wêreldklasstandaard [Soos reeds genoem beskik meer as die helfte van die respondente oor ’n werkservaring van meer as 20 jaar in die konstruksiebedryf en word hul siening as geloofwaardig beskou]).
GWS: Wêreldklasstandaard (gebaseer op die opinies van respondente oor hul siening van wêreldklasstandaard [Soos reeds genoem beskik meer as die helfte van die respondente oor ’n werkservaring van meer as 20 jaar in die konstruksiebedryf en word hul siening as geloofwaardig beskou]).
Die waarde-etikette word aangedui op ’n skaal van ‘laag’ = (1), ‘gemiddeld’ = (5), ‘hoog’ = (10).
Die siening van die respondente, word gebruik om die beginsels wat die bourekenaar ondersteun om kontraktueel effektief te kommunikeer, te meet volgens die volwassenheidsnorm wat vir bourekenaarstandaard teenoor die norm wat vir die wêreld-klasstandaard geld. Om die uitslag te kon bepaal, is die standaard van bourekenkundige volwassenheid volgens die siening van die respondente soos uit die artikel na vore gekom het, gemeet, en die resultate is met die norm, wat vir die ‘wêreldklasstandaard’ geld, vergelyk en behoort ’n beduidende aanduiding van kontraktuele kommunikasievolwassenheid van die bourekenaar te lewer.

Acta Structilia 2013: 20(1)
120
5. Resultate en besprekingDie resultaat van die respondente van die totale groep se siening betreffende die bourekenkundige standaard ten opsigte van die belangrike elemente wat nodig is om effektiewe kontraktuele kommunikasie in die opstel van byvoorbeeld die hoeveel-heidslystedokument te handhaaf, word in Tabel 3 hieronder verstrek.
Tabel 3: Kontraktuele kommunikasie
Beginsels van kontraktuele
kommunikasie
Bourekenaar-standaard
GBS
Wêreldklas-standaard
GWS
Verskil (%) (GWS-GBS)
Belangrikheid (%) in
terme van kontraktuele
kommunikasie
Kontraktueelbindend 8.49 8.92 4.30% 94%
Billikheid 8.19 8.54 3.50% 88%
Afdwingbaarheid en effektiwiteit
8.12 8.60 4.80% 90%
Ondubbelsinnigheid 7.85 8.62 7.70% 90%
Gemiddeld 8.16 8.67 5.10%
Die siening van die respondente betreffende die standaard van die bourekenaar in kontraktuele kommunikasie het in dalende volgorde die volgende waarderingsuitslag vir die beginsels aangedui: ‘kontraktueelbindend’ (8.49), ‘billikheid’ (8.19), ‘afdwingbaarheid en effektiwiteit’ (8.12) en ‘ondubbelsinnigheid’ (7.85). Die beginsel ‘kontraktueelbindend’ (8.49) het derhalwe die mees positiewe en ‘ondubbelsinnigheid’ (7.85) die mins positiewe waarderings uitslag gelewer.
Die siening van die respondente betreffende die norm wat vir die wêreldklasstandaard in kontraktuele kommunikasie geld, het in dalende volgorde die volgende waarderingsuitslag vir die beginsels gelewer: ‘kontraktueelbindend’ (8.92), ‘ondubbelsinnigheid’ (8.62), ‘afdwingbaarheid en effektiwiteit’ (8.60) en ‘billikheid’ (8.54). Die beginsel ‘kontraktueelbindend’ (8.92) het derhalwe die mees positiewe en ‘billikheid’ (8.54) die mins positiewe waar derings uitslag gelewer.
In die resultaat van die geïdentifiseerde beginsels ten opsigte van die bourekenaar- en wêreldklasstandaard varieer die verskil van 3.5% tot 7.7% meer, terwyl die beginsels ‘billikheid’ (3.5%) die kleinste en ‘ondubbelsinnigheid’ (7.7%) die grootste verskil getoon het.

Berry & Verster • Die volwassenheid van die bourekenaar
121
Die siening van die respondente het in dalende volgorde betreffende die belangrikheid van die beginsels in terme van kontraktuele kommunikasie die volgende waarderingsuitslag aangedui: ‘kontrak tueelbindend’ (94%), ‘afdwingbaarheid en effektiwiteit’ (90%), ‘ondubbelsinnigheid’ (90%) en ‘billikheid’ (88%). Die beginsel ‘kontraktueelbindend’ (94%) word derhalwe as die belangrikste beginsel en ‘billikheid’ (88%) as die mins belangrike beginsel beskou.
’n Verskil van (0,51) tussen die GBS (8.16) en die GWS (8.67) toon dat die vier kontraktuele beginsels vir sowel GBS en GWS bykans ewe belangrik gereken word wat daarop dui dat die bourekenaarsprofessie sterk vertoon in terme van kontraktuele kommunikasie.
Die siening van die respondente van al die deelnemende groepe in terme van die Bourekenaarstandaard (GBS) teenoor Wêreldklasstandaard (GWS) betreffende die standaard van die bourekenaar in kontraktuele kommunikasie word in Tabel 4 getoon.
Tabel 4: Kontraktuele kommunikasieRespondente: Groepe: Bourekenaarstandaard (GBS)/Wêreldklasstandaard (GWS)
Beginsels van kontraktuele
kommunikasie
IngenieursGBS GWS
AannemersGBS GWS
KliënteGBS GWS
ArgitekteGBS GWS
BourekenaarsGBS GWS
Kontraktueel-bindend
8.92+ 9.25 8.10- 8.88 8.78 9.44 8.17 9.09 8.50 8.59
Billikheid 8.25 8.92 8.10- 8.13 7.89 9.00 8.17 8.30 8.29+ 8.44Afdwing-baarheid en effektiwiteit
8.17 8.67 8.00- 8.63 8.22+ 8.67 7.92 8.55 8.17 8.58
Ondubbel-sinnigheid
8.33+ 9.25 7.30 8.25 7.11- 8.67 7.58 8.64 8.11 8.45
Gemiddeld 8.42 9.02 7.88 8.47 8.00 8.95 7.96 8.65 8.27 8.52
Die mees positiewe resultaat van die GBS deur enige groep word in Tabel 4 met ’n plusteken ‘+’ en die mees negatiewe resultaat met ’n minusteken ‘-’ aangetoon.
Indien die mees positiewe resultaat van die geïdentifiseerde beginsels van enige groep met die gemiddeld van die totale groep se siening vergelyk word, varieer die verskil as ’n persentasie uitgedruk van 1.0% (‘billikheid’ en ‘afdwingbaarheid en effektiwiteit’) tot 4.8% (‘ondubbelsinnigheid’) hoër.
Indien die mees positiewe resultaat van die geïdentifiseerde beginsels van ’n bepaalde groep met die gemiddeld van die totale groep vergelyk word, was die groep met ’n bourekenkundige

Acta Structilia 2013: 20(1)
122
agtergrond vir die mees positiewe resultaat in die element ‘billikheid’ verantwoordelik wat moontlik nie op objektiwiteit dui nie.
Indien die mees negatiewe resultaat van die onderskeie beginsels van enige groepe met die gemiddeld van die totale groep se siening vergelyk word, varieer die verskil as ’n persentasie uitgedruk van 0.9% (‘billikheid’) tot 7.4% (‘ondubbelsinnigheid’) laer.
Indien die gemiddeld van 4 (vier) beginsels van die onderskeie groepe beskou word, was die respondente met ’n ingenieursagtergrond verantwoordelik vir die mees positiewe resultaat (8.42) en die respondente met ’n aannemersagtergrond vir die mees negatiewe resultaat (7.88).
Daar kan derhalwe aanvaar word dat die groep met ’n bou-rekenkundige agtergrond nie bevooroordeeld was nie, maar ’n relatief objektiewe siening teenoor kontraktuele kommunikasie gehandhaaf het.
6. Afleidings’n Afleiding wat uit die resultaat van die respondente se siening gemaak kan word, is dat die standaard van die bourekenaar se kontraktuele kommunikasie positief ervaar word. Ruimte vir verbetering manifesteer egter indien dit met die norm, wat vir die wêreldklasstandaard geld, vergelyk word.
Die respondente se siening dui daarop dat ‘kontraktueelbindend’ (8.49) as die mees belangrike beginsel vir die bourekenaar is om effektiewe kontraktuele kommunikasie te handhaaf.
Die afleiding kan gemaak word dat die bourekenaar se vermoëns in die opstel van kontraktuele dokumentasie soos die hoeveelheidslystedokument, hoog aangeskrewe staan in die konstruksiebedryf en dat die bourekenaar se kontraktuele kommunikasie ’n sterk punt is.
Desnieteenstaande die positiewe reaksie van die respondente betreffende die element ‘ondubbelsinnigheid’ (7.85) wat die bourekenaar benodig om effektiewe kontraktuele kommunikasie te verseker, is die hoogste verskil (7.7%) tussen bourekenaar- en wêreld klasstandaard in dié beginsel aangeteken, wat op ’n ontwikkelingsgebied kan dui.
Die kleinste verskil tussen bourekenaar- en wêreldklasstandaard is in die beginsel ‘billikheid’ (3.5%) aangeteken, wat ook as een van

Berry & Verster • Die volwassenheid van die bourekenaar
123
die mins belangrike beginsels (88%) relatief tot die ander beginsels geïdentifiseer is.
Die bourekenaarstandaard word met die mins positiewe gemiddelde waarderingsuitslag (7.88) deur die respondente met ’n aannemersagtergrond en die mees positiewe gemiddelde waarderingsuitslag (8.42) deur die respondente met ’n ingenieurs-agtergrond in die beginsels, aangeteken.
Die respondente met ’n aannemersagtergrond wat die kontrak-dokumentasie van die bourekenaar gebruik, het die beginsel ‘ondubbelsinnigheid’ met die laagste waarderingsuitslae uitgesonder.
Die afleiding kan gemaak word dat die kontrakdokumente, wat die bourekenaar vir tenderdoeleindes opstel en wat met die tekeninge en spesifikasies van die argitek en ingenieurs moet ooreenstem, nie duidelik genoeg is nie.
Die afleiding kan waarskynlik gemaak word dat die bourekenaar by die opstel van kontrakdokumente, onder andere die ‘hoe-veel heidslyste’, moet toesien dat die belangrike beginsels ‘kontrak tueelbindend’, ‘afdwingbaarheid en effektiwiteit’ en ‘on dubbelsinnigheid’ teenwoordig is ten einde effektiewe kontrak-tuele kommunikasie te verseker.
Die volwassenheid van die bourekenaar se kontraktuele kom-munikasie het dus relatief goeie status binne die konstruksiebedryf, maar behoort versterk en uitgebrei te word.
7. AanbevelingsIn die skepping van ’n wetlike verhouding word vereis dat die betrokke partye, wat onder andere die bourekenaar impliseer, die kontrak redelik ooreenstemmend interpreteer. So ’n interpretasie moet duidelik, ondubbelsinnig, omvattend en volledig genoeg wees om onbetwisbaar, saaklik en bindend te wees.
Die beginsels ‘kontraktueelbindend’, ‘billikheid’, ‘afdwingbaarheid en effektiwiteit’ en ‘ondubbelsinnigheid’ wat in hierdie artikel as noodsaaklik vir die handhawing van die bourekenaar se effektiewe kontraktuele kommunikasie geïdentifiseer is, moet doel gerig ontwikkel en versterk word. Die onderriginstellings wat bourekenkunde of verwante programme aanbied, moet die ontwikkeling van die kontraktuele kommunikasie-vaardighede van studente beklemtoon om te verseker dat hul markgereedheid ’n professionele vlak bereik het.

Acta Structilia 2013: 20(1)
124
Die artikel het aangetoon dat die bourekenaarsprofessie sterk in effektiewe kontraktuele kommunikasie vertoon, maar dat daar ook in hierdie geval voortgesette beplanning en ontwikkeling moet wees om die professie op die voorpunt van die konstruksiebedryf ten opsigte van kontraktuele vermoëns te hou.
VerwysingslysAshworth, A. 1992. Cost studies of buildings. Harlow, England: Longman Scientific & Technical.
Berry, F.H. 2007. The influence of quantity surveying procedures on communication and communication instruments in the construction industry. In: Proceedings of the 11th Pacific Association of Quantity Surveyors (PAQS) Congress on Construction from a Different Perspective, 9-13 June. Auckland, New Zealand.
Berry, F.H. 2012. Volwassenheid van bourekenkundige kommunikasie in die konstruksiebedryf. Proefskrif (PhD. Q.S.). Bloemfontein: Universiteit van die Vrystaat.
Bowen, P., Cattell, K., Michell, K. & Kabayanondo, E. 2006. The effectiveness of construction project briefing as an interpersonal communication process. Acta Structilia, 13(2), pp. 19-38.
Chappell, D. 2008. Construction contracts, questions and answers. London: Taylor & Francis.
Emmitt, S. & Gorse, C. 2003. Construction communication. Oxford: Blackwell.
Farlex. The Free Dictionary. 2008. Definition of world-class. [Internet]. Beskikbaar by: <http://www.thefreedictionary.com/> [Besoek 14 Maart 2011].
Finsen, E. 2005. The building contract: A commentary on the JBCC agreements. Cape Town: Juta.
Gruber, C. 2004. Maturity model of the project-orientated organisation [Slideshow presentation]. 2004. Pm days ’04 – Education & research conference. Vienna: Wirtschafts Universität, 24-27 November.
Haplin, D.W. 2005. Construction management. Danvers: Clearance Center.
JBCC (Joint Building Contracts Committee). 2007. JBCC series 2000: Principal building agreement edition 5.0 R1 code 2101. Johannesburg: Joint Building Contracts Committee.
Loots, P.C. 1985. Engineering and construction Iaw. Cape Town: Juta.

Berry & Verster • Die volwassenheid van die bourekenaar
125
Malherbe, G. de C & Lipshitz, M. 1978. Malherbe & Lipshitz on building contracts. Pretoria: National Development Fund for the Building Industry.
McKenzie, H.S., McKenzie, S.D. & Ramsden, P.A. 2009. McKenzie’s law of building and engineering contracts and arbitration. 6th edition. Johannesburg: Juta.
Miners, T.W. 1969. Communications and cost control in the building industry with special reference to the role of the quantity surveyor. Unpublished Thesis (PhD). Pretoria: University of Pretoria.
Miners, T.W. 1971. Communications and cost control in the building industry. CSIR Special report BOU 24. Pretoria: CSIR.
Odendal, F.F., Schoonees, P.C., Swanepoel, C.J., Du Toit, S.J. & Booysen, C.M. 1994. HAT: Verklarende Handwoordeboek van die AfrikaanseTaal. 3de hersiene uitgebreide uitg. Midrand: Perskor.
Scottish Union & National Insurance Co Ltd v Native Recruiting Corporation Ltd. 1934. AD 458 at 465.

126
Fidelis Emuze & Ruan Adlam
Implementation of Broad-Based Black Economic Empowerment in construction: A South African metropolitan area study
Peer reviewed and revised
AbstractThe institution of Broad-Based Black Economic Empowerment (BBBEE) has had an impact on the economy in South Africa. Due to its extensive reliance on government procurement, BBBEE has had a substantial influence on the construction industry in terms of transformation imperatives. Although much has been achieved in the transformation of the sector, its empowerment initiatives are generally deemed to be less effective. This argument can be attributed to the impediments encountered by industry stakeholders, when implementing BBBEE. The central subject examined in this study pertains to the BBBEE implementation challenges in South African construction. In order to get to the depth of the identified issues in the reviewed literature, the qualitative method was employed for primary data collection. Eleven interviews were conducted with management representatives of major construction firms in the Nelson Mandela Bay Metropolis, through the use of a brief questionnaire and an interview protocol. The empirical findings that emanated from the study show that most of the respondents were aware of the challenges associated with BBBEE implementation in the construction sector. However, very few are presently addressing the difficulties. This lack of action frequently promotes the exploitation of BBBEE by concerned parties. This exploitation leads to unethical procurement practices in the form of ‘fronting’. Based on the literature reviewed and the data that were collected, it appears that deterrents must be addressed before the implementation of the BBBEE initiative can begin to yield the desired benefits for all concerned parties in South African construction.Keywords: Construction, empowerment, ethics, transformation, South Africa
AbstrakDie instelling van Breë Basis Swart Ekonomiese Bemagtiging (BBSEB) het ’n impak op die Suid-Afrikaanse ekonomie. As gevolg van sy uitgebreide afhanklikheid van die regering het BBSEB ’n wesentlike invloed op die konstruksiebedryf veral in terme van transformasievereistes. Alhoewel daar al baie bereik is in die transformasie van die sektor, is die bemagtigingsinisiatiewe minder effektief.
Dr Fidelis Emuze, Senior Lecturer, Department of Built Environment, Central University of Technology, Free State (CUT), Private Bag X20539, Bloemfontein, 9300, South Africa. Phone: +27 51 507 3661, Fax: +27 51 507 3254, email: <[email protected]>
Ruan Adlam, BSc (Hon.), Graduate at the Department of Construction Management, Nelson Mandela Metropolitan University, PO Box 77000, Port Elizabeth, 6031, South Africa. Phone: +27 41 504 2790, Fax: +27 41 504 2345, email: <[email protected]>

Emuze & Adlam • Implementation of BBBEE in construction
127
Hierdie argument kan toegeskryf word aan die struikelblokke wat ondervind word deur belanghebbendes in die bedryf met die implementering van BBSEB. Die sentrale onderwerp wat in hierdie studie ondersoek is, handel oor implementeringsuitdagings van BBSEB in die Suid-Afrikaanse konstruksiebedryf. Om die diepte van die geïdentifiseerde sake in die literatuurstudie te kon verkry, is van die kwalitatiewe metode gebruik gemaak om primêre data te versamel. Elf onderhoude is gevoer met bestuursverteenwoordigers van groot maatskappye in die Nelson Mandela Baai-Metropool deur die gebruik van ‘n kort vraelys en onderhoudvoeringprotokol. Die empiriese bevindinge uit die studie toon dat die meeste van die respondente bewus was van die uitdagings wat verband hou met die implementering van BBSEB in die konstruksiesektor. Daar is egter min aanduiding van die aanspreek van probleme. Hierdie gebrek aan optrede bevorder dikwels die uitbuiting van BBSEB deur die betrokke partye. Hierdie uitbuiting lei tot onetiese verkrygingspraktykte in die vorm van ‘verenigde fronte’. Gebasseer op die literatuur wat geraadpleeg is en die data wat ingesamel is, blyk dit dat afskrikmiddels aangespreek moet word vóór die implementering van die SEB-inisiatief kan begin om die verlangde voordele vir alle die betrokke partye in Suid-Afrikaanse konstruksie te lewer.Sleutelwoorde: Konstruksie, bemagtiging, etiese, transformasie, Suid-Afrika
1. IntroductionBroad-Based Black Economic Empowerment (BBBEE), previously known as Black Economic Empowerment (BEE), is a critical variable that influences the macro business environment in which construction organisations operate in South Africa (Bosch, Tait & Venter, 2006: 62-66). The impact of BBBEE on White-owned and/or controlled firms and Non-White firms in the construction sector is notable. According to Jack (2007: 1-4), White and Non-White individuals go through different experiences when confronted with BBBEE initially. White business executives generally undergo phases of denial, anger, bargaining, depression and acceptance, whereas their Non-White counterparts go through stages of innocence, pain, knowledge, action and wisdom (Jack, 2007: 1-4). The journey still does not stop there, but continues with both races entering a chapter of improving their understanding of BBBEE and enhancing their comprehension of an array of prescribed non-sector- and sector-oriented empowerment legislation and regulations. The most challenging moment of the entire process, however, materialises once the formulation of agreements and the implementation of BBBEE commences (Jack, 2007: 1-2). This is when parties are primarily confronted with a multitude of corporate difficulties that foster the exploitation of BBBEE, and then escalate the propensity to engage in unethical procurement practices. Hence, BBBEE can be likened to the “defining business issue of our time” in the South Africa (Woolley, 2005: 11).

Acta Structilia 2013: 20(1)
128
A brief overview of the origin of the BBBEE initiative will put the discourse in context. In 1994, the first democratically elected government in South Africa inherited an economy in distress. The country was ranked as one of the most unequal in the world with respect to income and wealth distribution. Between 1990 and 1994, the country achieved one of the highest overall population Gini coefficients of 0.67 in the world (Hofmeyer, 2008: 73). These problems predominantly stemmed from the former racially segmented economy in South Africa. Black (Non-White) participation in economic activities was limited, and their inferior skill sets restricted access to technological and professional jobs (Department of Trade and Industry [DTI]), 2003: 7). The majority, therefore, had little and/or no access to participation in the economy, until the beginning of democracy. It can thus be argued that the need for economic transformation was crucial for South Africa. The imbalances of the past had to be rectified, a more equal and prosperous society for the citizenry had to be created, and economic growth had to be ensured for poverty alleviation purposes.
For these reasons, the government embarked on the enactment of a string of empowerment-aligned legislation such as the Restitution of Land Rights Act of 1994; the National Empowerment Fund Act of 1998; the Employment Equity Act of 1998; the Competition Act of 1998; the Skills Development Act of 1998; the Skills Development Levies Act of 1999; the Preferential Procurement Policy Framework Act of 2000, and the Promotion of Equality and Prevention of Unfair Discrimination Act of 2000, along with numerous other acts, policies, strategies and programmes, all of which had a direct impact on the economy (DTI, 2003: 9-11). Even though the government was in the process of transforming South Africa’s economic landscape, Black business became frustrated with the state’s approach to, and pace of economic reform over time. They were dissatisfied with the manner in which the White-owned and/or controlled firms (which were in the majority) in the private sector were implementing economic empowerment. This ultimately resulted in the formation of the Black Economic Empowerment Commission (BEECom) in 1998.
With the release of the BEECom report in 2001, an all-encompassing national strategy with regard to transformation was suggested. It went further and called on government’s increased proactive stance in the process and for empowerment to become more redistributive (Patel & Graham, 2012: 195). According to Jack (2007: 13), this may further have occurred since a perception existed that only a few Black, politically connected elitists benefited from BEE, whilst the majority of Blacks were no better off than before. This dissatisfaction

Emuze & Adlam • Implementation of BBBEE in construction
129
resulted in a call for a shift away from narrow BEE towards BBBEE to include everyone in the mainstream economy. The government thus continued to illustrate its commitment to transformation with the proclamation of the BBBEE Act of 2003, along with the DTI’s BBBEE Codes of Good Practice published in 2007. In 2011, both the new Preferential Procurement Regulations (PPR) and the proposed BBBEE Amendment Bill were released by the National Treasury (NT) and DTI, respectively. This was followed, in 2012, by the publication of the DTI’s proposed revised BBBEE Codes of Good Practice to ensure that the economy becomes more inclusive (SAPA, 2012: online). In the context of this discourse, all Non-White entities and/or individuals shall be referred to as Black entities and/or individuals.
1.1 The research objective
The purpose of the phenomenological study was to analyse perceptions of the B-BBEE framework in the construction sector. In particular, the obstacles associated with the implementation of BBBEE by construction firms formed the focal point of the study. The objectives of the study were to:
• Explore the composition of the BBBEE framework for the construction sector;
• Identify the dominant institutional impediments facing contractors when correctly implementing BBBEE;
• Determine how construction firms and related entities exploit the Generic Construction Scorecard, and
• Discover and assess the most prevalent unethical practices encountered in the course of business relative to BBBEE in the construction sector.
However, because of logistics and the level at which the study was conducted (BSc honours level), the scope of the study was confined to active contractors; of any class; whose annual turnover is greater than R35 million; who have a Construction Industry Development Board (CIDB) grading designation of between six and nine inclusive, and who have premises and operate in the Nelson Mandela Bay Metropolis. The participants were further required to be in possession of a valid Generic Construction BBBEE Status Level Certificate for the 2012/2013 financial year as issued by a South African National Accreditation System (SANAS)-accredited verification agent in accordance with the provisions of the BBBEE Codes of Good Practice.

Acta Structilia 2013: 20(1)
130
1.2 The research problem and questions
The current literature with regard to the problem is considered deficient, as the closest research with any relation to the study addresses corporate social responsibility and public sector procurement in the construction sector (Bowen, Edwards & Root, 2009). Most of the published research related to BBBEE that could be traced was of a more generic nature and not sector specific. The studies, to mention a few, generally focused on how government utilised procurement as a tool to promote BBBEE (Bolton, 2006), the integration of employment equity and BBBEE (Horwitz & Jain, 2011, and the status of BBBEE beneficiaries (Patel & Graham, 2012).
This research is considered meaningful as it will attempt to increase awareness, create dialogue and provide a greater understanding of how the problem is anticipated in practice (Barritt, 1986 in Creswell, 2012: 133). As a current research gap relative to the problem exists, further research, specifically with a qualitative methodological approach, will essentially contribute to an already limited body of sector-specific knowledge concerning BBBEE.
To be succinct, although all sectors across corporate South Africa are affected by BBBEE, this study specifically focussed on its effect in the construction sector. The problem statement, therefore, is that: positive exploitation of BBBEE by contracting entities suffers implementation problems. To further examine the postulated problem in a rigorous manner, four research questions were formulated. According to Creswell (2012: 138), the aim in the development of qualitative research questions is to narrow the purpose of a study to various inquiries that will be addressed in the research. The research questions formulated for this study include:
• How did the generic framework for BBBEE affect the construction industry?
• What commercial impediments affect the implementation of BBBEE in the construction sector?
• How do construction organisations and stakeholders misrepresent BBBEE?
• What forms of improper conduct are associated with BBBEE implementation in the construction industry?

Emuze & Adlam • Implementation of BBBEE in construction
131
2. Literature review
2.1 Empowerment in the construction sector
The majority of firms participating in the construction industry embraced and adhered to the transformation-oriented legislation applicable to the sector. The industry went a step further with the formation of the Construction Education and Training Authority (CETA), in terms of the Skills Development Act, and more importantly, the enactment of the CIDB Act of 2000. Both interventions served as the construction sectors’ first formal approach to specific industry empowerment-aligned measures. CETA’s core focus is to provide unskilled human resources, most of which are Black (Non-White), with quality skills development and training. The CIDB, on the other hand, concentrates on the total transformation of the construction industry and emphasises the importance of developing Black-owned and -controlled enterprises in the sector. The CIDB Act clearly indicates that the purpose of the body with regard to empowerment is to enhance economic development; advance sustainable sector growth; grow and support the emerging sector; promote industry labour absorption; improve labour relations, and encourage human resource development (South Africa, 2000: 6-10).
Between 2007 and 2009, many construction firms engaged with the BBBEE Codes of Good Practice and had their commitment to transformation measured in terms of the non-sector-oriented Generic Scorecard. During the same period, construction-industry stakeholders showed initiative. They began the development of a transformation charter and a code of good practice for the construction sector, in compliance with sections 9.1 and 12 of the BBBEE Act (South Africa, 2003: 8-10). The industry soon became one of the first sectors to comply with the provisions of this legislation, through the ratification of the Construction Sector Charter and Code in 2007 and 2009, respectively.
The Construction Sector Code objectives are to drastically modify the racial and gender configuration of the industry in terms of ownership and management control; encourage the expansion of employment equity; stop fronting via the use of a sector-specific scorecard; promote the development of Black people, Black women and designated groups’ skills; enhance affirmative procurement, as well as develop and support the growth of micro to medium Black enterprises (DTI, 2009: 7). The Code provides a framework for the construction sector to address transformation, enhance capacity

Acta Structilia 2013: 20(1)
132
and increase the productivity of the sector to meet world best practice using elements that aim to (DTI, 2009: 5):
• Achieve a substantial change in the racial and gender composition of ownership, control, and management in the sector;
• Promote the effective advancement of employment equity in the sector and adherence to principles of non-racialism and non-sexism;
• Provide to the construction sector the first quantitative method for monitoring and evaluating the progress of an enterprise towards BBBEE and thereby contribute to ending the malpractice of fronting;
• Address skills development in a manner that accelerates the advancement of Black people, Black women and designated groups with a particular emphasis on learnerships, technical and management training;
• Increase the procurement of goods and services from BBBEE enterprises and standardise preferential procurement methodology, and
• Enhance entrepreneurial development and promote the sustainable growth of micro, medium and small BBBEE enterprises.
The Code shall apply to a measured entity that conducts any construction-related activities that form a major percentage of its annual turnover. In the event that a measured entity derives an equal percentage of its turnover from construction-related activities as well as other industry-related activities, such measured entity will have the choice as to which sector code will apply. After the policies were gazetted, both became legally binding on all organisations in the construction sector that desired to conduct business with the state (DTI, 2009: 3; Jack, 2007: 9). In addition, the Construction Sector Code called for the embodiment of the Construction Sector Charter Council as custodian of the implementation of transformation in the industry and to oversee and monitor its progress (DTI, 2009: 7). For instance, the Generic Construction Scorecard for contractors consists of three core elements and seven elements, as indicated in Table 1. A weighting is allocated to each of the elements and totals 100. The general principles for assigning the weighting for ownership allocate six points for voting rights for Black people, twelve for economic interest for Black people, and seven points for realisation concerning ownership fulfilment and net value. The general

Emuze & Adlam • Implementation of BBBEE in construction
133
principles for measuring management control assign five points each for board participation and senior top management for Black people. With respect to employment equity, the general measuring principles entail the employment of Black people in senior, middle and junior management levels in contracting and consulting firms (9.5 points) and people with disability that are employed gives a contractor .5 points. Skills development expenditure, learnership, bursaries and mentorship constitute the 15 points allotted to the skills development element. The twenty points allotted to preferential procurement is distributed among percentage of BBBEE spent among all suppliers to an entity (12 points), BBBEE spent on Qualifying Small Enterprises (QSE) (3 points), suppliers that are 50% Black owned and suppliers that are 30% Black women owned. Out of the fifteen points allotted to enterprise development, five is awarded for enterprise development programme and ten for enterprise development contributions. Five points is awarded for the socio-economic development element when the average annual value contributed by the entity is measured.
After the release of the Construction Sector Code, the majority of industry organisations participated in the transformation of the sector by acquiring their BBBEE Status Level Certificates as the evidence of their commitments to empowerment. In terms of the Construction Sector Code, contractors with an annual turnover in excess of R5 million and less than or equal to R35 million are considered as QSE and have to select four of the seven elements for fulfilment purposes. Firms with a turnover of greater than R35 million per annum are required to comply with all seven elements (DTI, 2009: 9). Contractors with an annual turnover of less or equal to R5 million are regarded as Exempted Micro-Enterprises (EME) and are required to obtain a letter from an auditor, accounting officer or verification agent as proof of their standing (DTI, 2007: 9).
Table 1: Generic Construction Scorecard for contractorsCore element Elements Weightings
Direct empowermentOwnership 25Management control 10
Human resource developmentEmployment equity 10Skills development 15
Indirect empowermentPreferential procurement 20Enterprise development 15Socio-economic development 5
Adapted from DTI, 2003: 14; DTI, 2009: 9

Acta Structilia 2013: 20(1)
134
Since 2007, construction industry enterprises have utilised their BBBEE Status Level Certificates when tendering for contracts from certain public and private sector organisations, which apply affirmative procurement measurements. The majority of public-sector tenders between 2001 and 2011, however, applied the historically disadvantaged individual (HDI) and other specific goal requirements with regard to transformation.
This practice ended in 2011, when BBBEE Status Level Certificates replaced the former arrangement through the alignment of the PPR and BBBEE (Naidoo, 2011: online). Preferential procurement points are, therefore, now awarded according to the BBBEE Status Level of contributors (Table 2). Preferential procurement points earned by contractors who practise affirmative procurement in terms of the Generic Construction Scorecard, however, are dependent on the BBBEE Status Levels of the suppliers and service providers their organisations utilise (Table 3). In terms of applications of the statistics on Tables 2 and 3, bidders scored a maximum of 80 or 90 points for price, and 20 or 10 points for Black ownership and for promoting specified RDP goals. The points for price have remained unchanged, while bidders can score up to 20 or 10 points for their B-BBEE status level of contribution. All bidders are required to submit BEE rating certificates, issued by either verification agencies accredited by SANAS or by registered auditors approved by the Independent Regulatory Board for Auditors (IRBA). It is notable that, previously, the threshold value for the distinction between the 80/20 and 90/10 preference point system was R500.000. This has now been increased to R1 million to stimulate the development of small enterprises.
Table 2: BBBEE status versus preference points
B-BBEE status level of contributor
Number of points in terms of preference point systems80/20 90/10
1 20 102 18 93 16 84 12 55 8 46 6 37 4 28 2 1
Non-compliant contributor 0 0
Adapted from NT, 2011: 9-10

Emuze & Adlam • Implementation of BBBEE in construction
135
Table 3: BBBEE Status versus procurement tendering points
B-BBEE status level of suppliers/service providers
Generic Construction Scorecard points
requirement for suppliers/service providers
B-BBEE preferential procurement recognition level of suppliers/service
providers1 ≥ 100 points 135%2 ≥ 85 < 100 points 125%3 ≥ 75 < 85 points 110%4 ≥ 65 < 75 points 100%5 ≥ 55 < 65 points 80%6 ≥ 45 < 55 points 60%7 ≥ 40 < 45 points 50%8 ≥ 30 < 40 points 10%
Non-compliant supplier/service provider < 30 points 0%
Source: Adapted from DTI, 2007: 5
2.2 BBBEE-related challenges in the construction sector
The execution of BBBEE by a firm in terms of the Construction Sector Code is extremely complex. The process is highly technical. Numerous factors, with regard to the growth and sustainability of a firm, need to be taken into account before empowerment commences (Jack, 2007: 115). This is generally accomplished through the development and approval of a comprehensive transformation strategy by the board and top management of a firm (Woolley, 2005: 31). These strategies should address the business impediments that generally affect the seven (7) elements of the Generic Construction Scorecard for contractors in order to establish how these barriers can be mitigated. Issues to be considered are, among others, related to ownership, management control, employment equity, skills development, preferential procurement, and enterprise development.
2.3 Ownership-related barriers
Ownership, as an element of the Generic Construction Scorecard, aims attention at the realised level of economic interest and voting rights assumed by Blacks (including women and groups), relative to the organisations in which they participate (DTI, 2009: 11). The transformation of ownership is generally regarded as the most technical and strenuous of all elements to implement. When contractors initiate addressing their shareholding, they more than often struggle to locate suitable Black participants, in order to add
Acta Structilia 2013: 20(1)
136
value to and complement the character of their organisations. Corporations generally opt to enter into shareholding agreements with experienced, Black entrepreneurs, with some form of political clout and influence (Masondo, 2010: online). Several firms, however, decide rather to form partnerships with B-BBBE ownership structures or to establish their own employee ownership schemes, both of which are difficult to administer. When construction firms and Black participants enter into shareholding contracts, large amounts of transactional costs are incurred (Cargill, 2010: 39). Blacks generally do not have access to great sums of capital and have to obtain finance for these dealings (Foxcroft, Wood, Kew, Herrington & Segal, 2002: 32). Organisations are also typically required to sell their shares to Black parties at discounted rates, thereby foregoing value to ensure feasible transactions (Ward & Muller, 2010: 29). Whilst assisting their Black participants to source credit, contractors are mainly required to enter into high-risk agreements with financial institutions, in order to provide security and guarantees for such loans (Cargill, 2010: 38). The most frequent criticism of ownership transformation is the realisation of ownership fulfilment. Organisations have to ensure that the debt incurred by their Black shareholders is settled aggressively via measures such as the declaration of dividends. When such firms fail to adhere to the Construction Sector Code’s regulations with regard to realisation, their ownership score would deteriorate. This practice is considered by many as contrary to the spirit of transformation, as contractors have very little control over economic cycles, and are penalised during periods when they are most reliant on government tenders to remain in operation (Cargill, 2010: 40-42).
2.4 Management control obstacles
The management control element of the Generic Construction Scorecard focuses on board participation and voting rights held by Black people, along with their representation at top-management level within a firm (DTI, 2009: 12). Organisations that commence with the transformation of their boards and executive management structures generally struggle to find adequately skilled and experienced Black candidates, not to mention suitable Black females (Independent Online, 2012). Those contenders that can be found, are limited in number and generally come at great expense, placing additional pressure on the management of firms’ remuneration bills. Due to the high demand for these candidates, retaining them for a relatively long period of time is extremely unwieldy (Jack, 2007: 114-119). Recruiting compatible applicants, who add the required value

Emuze & Adlam • Implementation of BBBEE in construction
137
to an organisation, is also very challenging. Skilled Black entrants struggle to gain the relevant experience and expertise required to serve as executives. Business Unity South Africa (BUSA) has, therefore, proposed a strategy whereby directors, who are planning to retire, integrate the mentorship of suitable Black hopefuls 18 months prior to their retirement. BUSA believes that their strategy will address the under-representation of Blacks, as Black candidates will serve as ‘shadow directors’ to their mentors (SAPA, 2010: online).
2.5 Employment equity problems
Employment equity, as an element of the Generic Construction Scorecard, concentrates on the representation of Blacks (including black woman and Black disabled persons) along the junior-, middle- and senior-management levels of the human resources component of a firm (DTI, 2009: 13). Management control and employment equity share many of the same problems, such as attaining and retaining the right Black suitors and absorbing the high cost associated with their employment. With the introduction of employment equity in 1998, most construction organisations experienced great challenges in ensuring the transformation of their workforce. Due to the nature of the construction industry, one of the main problems was, and still is, the recruitment of females, especially Black female employees (Jack, 2007: 122). Although it is undeniable that women’s involvement in the sector has increased, many of them have opted to initiate their own enterprises as entrepreneurs, instead of becoming employees of other firms. Various firms also struggle to find qualified and experienced Blacks to fill management positions. Black employees have similarly experienced countless problems when engaging with employment equity. Blacks often struggle to adapt to the culture and working environment of the firms for which they work (Jack, 2007: 128). In many instances, they also struggle to handle the pressure and stress associated with their promotion as well as the extra hours needed to fulfil the responsibilities such positions demand. Blacks have also voiced their unhappiness of being exposed to manipulation, victimisation, tokenism and marginalisation in the organisations in which they work (Atkinson, Coffey & Delamont, 2003 in Nzukuma & Bussin, 2011: 6). They were of the opinion that their contributions to organisations are seldom seen, appreciated and/or rewarded (Cruz, 2006: 24). Many of them find their positions unsatisfying, as they are not allocated interesting assignments that require higher levels of responsibility (Nzukuma & Bussin, 2011: 5).

Acta Structilia 2013: 20(1)
138
2.6 Skills development predicaments
This Generic Construction Scorecard element focuses on the skills development of Black employees, with specific reference to females, disabled persons, learners and students through programmes, bursaries and mentorships (DTI, 2009: 15). The process of recovering money from CETA is, however, extremely technical in nature. Corporations generally opt to appoint service providers to administer these claims. In addition, few firms obtain an immediate return on the training of their employees and often struggle against great setbacks, such as losing highly trained and skilled Black employees to competitors or by having their ex-employees becoming their new competitors (Nzukuma & Bussin, 2011: 5). It is important for firms to liaise with their employees, in order to establish whether they are truly interested in attending certain training courses. This will avoid poor skills development investment (Jack, 2007: 147). Contractors should avoid expecting and pressuring Black employees to conduct miracles overnight with their new skills.
2.7 Preferential procurement complications
The preferential procurement element of the Generic Construction Scorecard concentrates on the growth of empowered and Black enterprises by motivating contractors to buy from, or make use of QSE, EME and, to a large extent, Black-owned and Black female-owned suppliers and service providers (DTI, 2009: 19). Locating Black businesses in certain monopolistic markets and convincing existing non-empowered suppliers and/or service providers to transform adds to the frustration experienced by the procurement departments in contracting firms (Jack, 2007: 165-166). In certain instances, Black enterprises struggle to stay afloat due to cash-flow problems and declining business. This generally occurs when these businesses, due to capacity problems and/or ignorance, provide firms with inferior goods and do not deliver on time and/or with excessive pricing.
2.8 Enterprise development impediments
Enterprise development, as an element of the Generic Construction Scorecard, focuses on the advancement of Black and Black female-owned businesses, using enterprise development programmes managed by established organisations (DTI, 2009: 20). Cargill (2010: 63) explains that many organisations do not have the necessary skills and/or capacity to develop emerging Black enterprises. She also states that most small to medium corporations struggle to run their own businesses and it is, therefore, impossible to expect them to

Emuze & Adlam • Implementation of BBBEE in construction
139
assist start-up firms. In addition, organisations are indirectly forced to outsource their obligations with regard to enterprise development, in order to continue with their own business operations. Blacks often struggle to find partners who are prepared to admit them as their developing enterprise.
2.9 BBBEE-related ethical issues in the construction sector
The 2012 Transparency International (TI) report noted the question-able practices on the rise in South Africa. The study measures the perceived levels of public sector corruption worldwide. In the report, South Africa ranked 69th out of 176 countries, with a score of 43 out of 100. This rating indicates a 14-place drop since 2009, when South Africa ranked 55th out of 180 countries, with a score of 4.7 out of 10 (TI, 2009). It was evident from the research that unethical practices in South Africa have increased substantially.
According to Stansbury (2005: 37-39), the features that make construction contracts mostly prone to corruption include the size of projects, uniqueness of projects, involvement of government, high number of contractual links, great number of phases, complexity of projects, lack of frequency of projects, concealment of work, and culture of secrecy. For example, the CIDB (2011: iii) noted that corruption is increasing rapidly in South Africa. The CIDB (2011: iii) report goes further to claim that “South Africa is reaching a tipping point beyond which it may be very difficult to reverse corruption in the public sector”. The study further mentioned that barriers relative to contractor procurement in the public sector include “matching a contractor’s capabilities to the requirements of the project”, political interference, and cronyism (CIDB, 2011: iii).
Furthermore, the BBBEE Amendment Bill (DTI, 2012: 3) defines fronting as “a transaction, arrangement or other act or conduct that directly or indirectly undermines or frustrates the achievement of the objectives of ... or the implementation of any of the provisions of’ the BBBEE Act”. This proposed piece of legislation aims to have fronting regarded as an offence, whereas it is currently considered to be fraud (Paton, 2012: online). The employment of fronting is not bound to any particular race. The notion that fronting can purely be effected by White organisations and/or persons is incorrect (Motau, 2012: online). According to Jack (2007: 203-205), fronting comes in different forms such as opportunistic intermediaries, benefit deviation (transfer pricing), window dressing and thin capitalisation. Other types of fronting include fronts on paper, company fronts, fictitious companies, and fronts in joint ventures (Moloi, 2006: 32).

Acta Structilia 2013: 20(1)
140
In brief, the reviewed literature shows that the implementation of the BBBEE in the construction sector is subject to a number of irregularities. The misuse of BBBEE is not limited to any race, gender, ability, culture, sector, organisation or place. The exploitation of BBBEE occurs along all elements of the Construction Sector Code. Some forms of abuse are more visible than others. As an illustration, the construction industry has, for over a decade, been subjected to numerous media exposés relating to the manipulation of transformation by contractors and empowerment entrants. Problems pertain, among others, to the exploitation of ownership structures, manipulation of employment equity, incorrect use of skills development, incorrect application of preferential procurement, and improper application of enterprise development.
3. Research methodologyThe selected research method for this study was qualitative. The qualitative inquiry approach employed in this research was phenomenology. This technique was specifically chosen, as it was considered the most appropriate and reliable, especially considering the inherent sensitivity surrounding the research problem. Leedy & Ormrod (2010: 141) define phenomenology as a study that endeavours to understand several individuals’ perceptions and comprehension of a phenomenon. Creswell (2012: 78) noted that groups partaking in phenomenological research can vary between 3 to 4 and 10 to 15 individuals.
The research sample was made up of interviewees who represented participating construction firms. Initially, 15 qualifying construction firms were identified by utilising the CIDB online Register of Contractors. All 15 potential participants had a CIDB grading designation of between 6 and 9, were in possession of a valid Generic Construction BBBBEE Status Level Certificate, and operated from premises situated in the Nelson Mandela Bay Metropolis. However, only nine of the 15 qualifying construction firms agreed to take part in the study, with a total of 11 participants as representatives. Confidentiality agreements were signed with all the interviewees due to the sensitive nature of the enquiry.
Data that were relative to demographics in the form of management levels and job titles of the interviewees were derived from section 1 of the short questionnaire. Information with regard to the CIDB grading designation and BBBEE Status Contribution Levels was deduced from Section 2 of the same questionnaire. The interviewees were three women and eight men aged between 32 and 58. None of

Emuze & Adlam • Implementation of BBBEE in construction
141
the participants suffered from a disability. Ten of the interviewees were White and one was Coloured in terms of race. Education levels ranged from a senior certificate to a postgraduate diploma, and construction industry experience ranged from two to thirty-seven years. The management levels of interviewees varied from junior management to board and senior top management, with job titles ranging from administrative assistant to managing director.
The information, gathered during the interviews, was scrutinised based on Moustakas’ (1994 cited in Creswell, 2012: 193-194) approach to phenomenological analysis. Transcripts were examined to select major statements. These statements, all of which were treated as being of equal value, were then listed accordingly. Following this step, all repetitive and overlapping statements were removed. The remaining notable statements were then grouped into the same six themes, as in the interview protocol. Textural and structural descriptions, relative to the significant statements, were then drafted, explaining what and how participants/interviewees experienced the phenomenon. The process was finalised with the development of a composite description, incorporating the textual and structural descriptions, in order to exhibit the crux of the experience of the phenomenon. The interview protocol was dominated by themes related to the research questions of the study. The layout of the interview protocol is shown in Table 4.
Table 4: The layout of the interview protocolNumber Theme Question
1 Reasons for BEE 1-22 Statutory regulation of construction sector transformation 3-53 Transformation of the construction industry 6-74 Impediments affecting BBBEE in the construction sector 8-105 Exploitation of BBBEE in the construction industry 11-136 Improprieties related to BBBEE in the construction sector 14-17
3. Results and discussion
3.1 Reasons for BEE
A contract director indicated that BEE was a direct result of the “plight of the previously disadvantaged”. A few suggested that the “history of the country”, the “inequalities that existed” and the “exploitation of Blacks” contributed to its birth. Another stated that a “change in political power”, after the end of apartheid, gave rise to a “government that saw things differently”. The majority of the

Acta Structilia 2013: 20(1)
142
participants agreed on the importance of the implementation of BEE by the state. Participant 4 attributed the need for BEE to the “inequalities” and “unequal economy” that existed prior to 1994. An additional perception was that to “correct the imbalances of the past” and to empower people, the redistribution of wealth was imperative to “create a sustainable society” and to “level the economic playing field”. Most of the interviewees were of the opinion that BEE was necessary to provide Blacks with new opportunities, to create access to the corporate world, and to ensure their development, by involving them in the mainstream economy.
3.2 Statutory regulation of construction sector transformation
In this theme, respondents focused on the core characteristics of the industry and the empowerment-oriented legislation that affected it. Participant 6 stated, “I feel that government saw our industry as an easy point of entry as they are our largest client”. Other respondents attributed the state’s extensive emphasis on the transformation of the construction industry to the facts that the sector is the second largest employer in the economy that it is highly labour intensive and employs people with the least amount of skills. A managing director, with an honours degree, believed that the industry’s relative stability and capability to “provide employment to a large number of job seekers in a short period of time” also justified the government’s stance on the matter.
The introduction of empowerment-oriented legislation had an undeniable impact on the construction sector. A woman, with 25 years’ experience in the sector, mentioned that, when transformation commenced, contractors had to either “sink or swim”. She continued by explaining that companies had to adhere to the said laws promptly, in order to avoid being closed down. This resulted in organisations shifting their focus from production to complying with government’s red tape. Three board members viewed the acts as an added “tax and cost” to the construction industry. Participant 7 claimed that employment equity has resulted in the non-deliberate employment of highly skilled, yet inexperienced, Blacks in top positions. Some were also of the opinion that employment equity brought about the correction of equity profiles at lower management level and led to the high engagement of Black women within the industry.
A respondent made it clear that his impression of the Skills Development Act was that it inherently produced meagre training programmes. The interviewee continued to argue that, prior to the promulgation

Emuze & Adlam • Implementation of BBBEE in construction
143
of the aforementioned Act, it generally took artisans approximately four years to qualify as tradesmen, in comparison with the current period of six months. The average age of a qualified tradesman, according to the respondent, currently stands at approximately 60 years. Both financial managers concurred and added that, although it pays for firms to train their Black employees, the majority of training available is “irrelevant”, “non-value adding” and a “waste of time and/or money”. Respondents noted that the PPR has increased the cost of tendering, as tenderers are required to “submit boxes full of documents” at the close of tenders. Participant 2 indicated that, previous to the PPR, a tender usually comprised three pages, which is “a covering letter, one stipulating the price and maybe a third with a condition or two”. The interviewee further pointed out that, under the PPR, tender documents are up to “two to three inches thick”. Two participants expressed the view that the former regulations were “easier” to work with whereas others described the previous system as “ineffective” and “ridiculous”. Another interviewee contended that the regulations ultimately made it obligatory for White construction firms to hand over large portions of their shareholding, along with its control, in order to procure contracts from government. Certain interviewees supported this outlook by revealing that the former PPR purely focused on the “enrichment of a few”, at the cost of the Black majority. A financial director implied that the said regulations brought about a situation where it “came down to choosing between Johnny and Peter to participate in the ownership and control of one’s company”. The new PPR adopted BBBEE as its new approach to preferential procurement. Nine out of the eleven respondents lauded the release of the latest regulations, as they “ensure great accountability”, resulted in “fewer companies closing up shop” and by being more “beneficial” towards Blacks.
3.3 Transformation of the construction industry
Participant 3 reported that a scorecard, more specific to the construction industry, was developed to ensure the removal of constraints experienced by contractors during the application of the Generic Scorecard. Several respondents agreed that the Generic Scorecard did the construction sector “no justice” as it is “unique” in many instances. A postgraduate diploma holder disclosed that the Generic Construction Scorecard places a greater focus on “internships and mentorships” and brought about the review of “sex representation” within the industry.
Interviewees consider the Generic Construction Scorecard as a tool to ensure the “sustainable”, “effective” and “rapid” transformation

Acta Structilia 2013: 20(1)
144
of the sector. It was further communicated that the Generic Construction Scorecard promotes the training of employees at management level, the greater use of Black suppliers, and the involvement of a vast number of previously disadvantaged individuals. Participant 8 specified that the development of the CIDB was a “great and sensible idea”, as it ensured that contracts were and are awarded to construction firms with the “ability and resources to do the work”. This observation was also supported by other respondents. However, two interviewees were highly critical of CIDB officials and referred to them as “uncooperative”. Apparently, no single application, relating to a specific construction firm, is ever finalised by one representative. This has resulted in delays and, at times, contractors being “forced to trade” without the necessary CIDB certification.
Criticism of construction industry-related bodies did not stop with the CIDB. An office manager indicated that dealing with CETA is “an absolute nightmare”. Their company, therefore, opted to outsource the function of claiming reimbursement from CETA to an external service provider. A managing director, with 27 years’ experience in the construction sector, agreed that CETA is “not functioning effectively” and is, therefore, “not fulfilling its purpose”. However, three participants revealed that they were aware of the existence of the Construction Sector Charter Council. Participant 8 categorically stated that “they do not have their act together and therefore have not played a role yet”.
3.4 Impediments affecting BBBEE in the construction sector
All 11 respondents concurred, with certainty, that the implementation of BBBEE in the construction industry is hindered by commercial impediments. An interviewee summed it up quite thoroughly by proclaiming that there are “major problems”. In general, a small number of interviewees noted that the implementation of BBBEE is “highly expensive” and involves a “large amount of paperwork”. It was further suggested that many contractors felt excluded, as they had no say in the development of BBBEE.
Participants addressed challenges associated with White-owned construction firms. They focused on six of the seven elements of the Generic Construction Scorecard, except for socio-economic development. In general, respondents perceive that White-owned construction firms find it extremely difficult to locate suitable potential Black shareholders. This was attributed to the facts that very few candidates can adequately contribute to firms, or are in possession
Emuze & Adlam • Implementation of BBBEE in construction
145
of the required capital for the purchase of shares. Contractors’ biggest predicament, relative to ownership, is the tremendous pressure endured while attempting to ensure sustainable growth, which is essential to enable Black shareholders to repay their loans. This sentiment was supported by participant 3, who contended that Black shareholders often default on the repayment of shareholding loans granted by fellow White shareholders in the firms in which they have invested.
There is a lack of highly skilled and experienced top Black managers, especially females, who can function “correctly, properly and appropriately” at board level. An administrative assistant blamed this tendency on the fact that many Black candidates are still in the process of “working their way up” to board level. It was generally agreed that the majority of Black top management candidates come at the cost of a “fortune” and that only a few can “justify” their positions. Only a handful of these candidates were considered as adding the “necessary value” and contributing to the enhancement of company profits, in order not to be regarded as “dead weight”. The demand for skilled and professional Black managers exceeds the supply. This was evident in the following responses: “We feel that it is very difficult to find and retain qualified Black talent”, and “It is hard to get Blacks with the right qualifications, skills and practical experience to fulfil management positions”. Participant 5 claimed that it is extremely difficult to locate “confident” Black female managers who “believe in themselves” and who “take initiative”.
A man, with two years’ experience in the sector, worriedly implied that the level of South Africa’s education has decreased to such an extent that even university students “struggle to read and write even though they have passed grade 12”. In addition, an accountant was of the opinion that the current standard of tertiary education does not adequately prepare university graduates for the workplace and that students studying construction-related courses often have very little or no “interest” in their field of study. Companies battle to find suitable Black candidates to train and develop. Respondents also regarded the major costs incurred to up-skill beginners and the scarcity of relevant training programmes as challenges. Various small Black enterprises were identified as incompetent and, due to a “lack of training”, their quality standards were referred to as often being “horrendous”. They were further accused of frequently charging “inflated prices” and were personified as “fly-by-nighters”. A woman expressed her frustration with having to find female Black-owned suppliers. She also complained that White-owned suppliers

Acta Structilia 2013: 20(1)
146
were often “uninformed and uneducated”, when it came to BBBEE and, in many instances, they “refused” to transform.
Participant 10 conveyed that it is extremely expensive and nearly impossible to concurrently run a construction firm and develop another small enterprise. Another interviewee added that companies find it troublesome to acquire and maintain a relationship with developing Black businesses, when partnering. The majority of the top managers agreed and stipulated that the owners and top managers of small Black enterprises generally did not have the “required capacity” and could only be assisted to a certain point, as their “mindset” and level of education served as determinants. Many small Black enterprises do not have administrative systems in place, even though they were formerly trained by their development partner. This resulted in construction firms often having to take over the “responsibilities and obligations” of small Black enterprises. Contractors were frequently compelled to “finalise financial statements” of, and to obtain the BBBEE Status Level Certificates for their partners.
Respondents addressed the challenges experienced by Black stakeholders and concentrated on five of the seven elements of the Generic Construction Scorecard, except for skills development and socio-economic development. Participants were unanimous on the notion that the predominant predicament experienced by Black shareholders, when purchasing shares in companies, is access to finance. Participant 5 stated that Blacks frequently experience great resistance when proposing to enter into partnerships with White-owned contractors, as certain firms “would rather close down before selling their shares to Blacks”. A man remarked that potential Black shareholders are repeatedly met with an attitude that White-owned firms will “rather enjoy 90% of a cupcake than 30% of a big cake”.
Participant 6 mentioned that Black directors are usually highly intimidated when appointed to the board of a company, as they feel that they must “prove themselves more than Whites”. Black candidates are often discouraged by not having the opportunity to attend university and by small White-owned organisations “refusing to employ Black people”. They are also regularly subjected to “cultural misrepresentations” and often experience “ill treatment” from their White superiors. Black employees occasionally do not receive adequate training from their White managers, as these persons are fearful of losing their positions in the future. Multiple small Black enterprises struggle to find contractors to assist them in

Emuze & Adlam • Implementation of BBBEE in construction
147
their development. A single participant inferred that Black suppliers ordinarily “struggle in presenting themselves as professionals”.
3.5 Exploitation of BBBEE in the construction industry
All respondents agreed that BBBEE in the construction sector is being abused. Participant 8 firmly concurred and described the mistreatment of transformation as a “two-way street as both Whites and Blacks” are exploiting it. The misuse of BBBEE by White-owned firms can be attributed to their desperate attempt to enhance their BBBEE status levels. Interviewees responded to the exploitation of BBBEE by White-owned organisations and concentrated on four of the seven elements of the Generic Construction Scorecard, excluding preferential procurement, enterprise development and socio-economic development.
A man, with 13 years’ experience in the industry, opined that many contractors enter into highly “technical shareholding agreements” with Black participants which ultimately result in the latter having “no control” over the firms in which they have invested. Two participants claimed that the aforementioned occurrence did not bring about the transference of wealth and profits to Black shareholders. Vast numbers of contractors manipulate the complement of their boards by “appointing junior managers” who add no actual value as directors. Participant 3 professed that firms regularly, as part of their practice of “window shopping”, “pay Black directors R25.000.00 per month” for attending a board meeting.
A woman, with 9 years’ experience in the construction industry, acknowledged that White-owned companies frequently promote black employees to higher positions, irrespective of whether they are the best candidate for the position. Participant 6 added that the said employees are often not appropriately remunerated and that their performance is not always recognised. A woman, with a national diploma, reported that some contractors engage in “falsifying training certificates” and “proof of payments” made to training companies. A male respondent further accused organisations of purposely sending Black candidates on “irrelevant” training programmes.
The wrongful use of BBBEE by Black-owned firms and stakeholders can be ascribed to their desperate effort to improve their position and participation within the economy. Respondents commented on the exploitation of BBBEE by Black-owned organisations, by focusing on six of the seven elements of the Generic Construction Scorecard, except for preferential procurement. Participant 7

Acta Structilia 2013: 20(1)
148
hinted that potential Black shareholders occasionally enter the boardrooms of companies with an attitude of “I know people in high places and can sway contracts in your favour”. Others condemned Black shareholders’ refusal to pay for shares and not wanting to be involved in the day-to-day management of companies, but still expecting to reap benefits. A man, with 37 years’ experience in the industry, noted that, in many instances, Black shareholders would only visit their companies’ offices “at the end of the year to collect their R30.000.00 cheque”. Another agreed by stating that the alleged shareholders “are just too happy to receive a cheque in the mail without lifting a finger”.
Some participants complained of skilled and Black employees who participate in job hopping with job lengths of between “12 to 24 months” on average. They come at a “premium and demand ridiculous” remuneration packages and, when offered “more money”, they move from their current employment. Participant 7 admitted that certain Black managers intimidated employers by threatening that they would leave if not provided with a salary increase. A man, with six years’ experience in the construction industry, explained that numerous unskilled and inexperienced Black graduates enter the workplace with the “wrong attitude”. They were accused of not wanting to “prove” themselves, expecting that, because they are Black, starting at the bottom is not applicable to them. They anticipated immediate placement in management positions. It was pointed out that Blacks, time and again, insisted on taking part in continuous training programmes, thereby failing to fulfil their official duties. Others expressed their dissatisfaction with small Black enterprises that expect their partners to take full responsibility for their businesses in terms of management and administration. Participant 10 stated that non-profit organisations (NPOs), in many instances, abused the contributions given to them by contractors. It was claimed that NPOs were “bled dry by their trustees”, as funders generally do not have the time or resources to ensure that the contributions ultimately reach the intended beneficiaries.
3.6 Improprieties related to BBBEE in the construction sector
The majority of the participants agreed that unethical business practices in the industry have increased since the introduction of BBBEE, with one interviewee instantly responding, “Absolutely, there is no doubt about that!” In general, respondents regarded BBBEE as a facade behind which contractors and other stakeholders could hide their questionable conduct. It was explained that it was behind this veil that companies engaged in dubious methods, as they were

Emuze & Adlam • Implementation of BBBEE in construction
149
being “forced” to improve their Generic Construction Scorecards in order to obtain government tenders. Not engaging in these practices was considered, by some, as giving rise to the possible “closure” of organisations and the further repercussion of having to “retrench” employees. One male participant argued that BBBEE has turned the construction industry into a “political playing field”, where knowing someone in government signified the attainment of possible wealth.
Even though no denial existed that these practices occurred in the private sector, all of the interviewees were of the opinion that the public sector was by far subject to the highest levels of suspicious activities. Two respondents furthered this opinion by claiming that it was evident in the “daily news” and that the public sector was “more concerned” with BBBEE than corporate South Africa. Participants predominantly directed their attention to corruption, maladministration and fronting. Corruption was described as “rife” and as a “cancer” that is “deeply rooted” in the sector. Another interviewee claimed that it was by “far most visible” in the construction industry, in comparison with other sectors of the economy. Participant 3 made a profound statement by claiming that corruption was a “prerequisite for doing business with government”. A woman respondent agreed and stipulated that many contractors were of the opinion that it was nearly “impossible to survive” if they did not engage in corruption. Participant 1 went on and confidently elucidated that corruption in the sector “is not good for the industry, it is not good for contractors and it is not good for BBBEE”.
Public sector officials were accused of utilising their easy “access” to, and “control” over state tenders to ensure “jobs for pals” and of frequently appointing contractors, on condition that they utilise “people who are family or acquaintances” of theirs. One respondent alleged that certain newly elected government officials, with contracts ranging from three to five years, enter the public sector with the “attitude that it is now their turn” and that, during their stay in office, they will acquire “enough money for them to retire”. It was pointed out that many construction firms obtain contracts via their “corrupt relationships” with government officials. Some interviewees mentioned that certain construction firms suddenly became the “most experienced” contractors “in the world” by “knowing the right people in government”. The results of corruption were detailed as “unemployment”, the closure of “many companies”, keeping the sector from “going forward”, the rebuilding of RDP houses “two to three times”, increasing the “cost of construction”, and increasing “red tape”.

Acta Structilia 2013: 20(1)
150
A general perception among respondents existed that several public-sector officials were “thrown into positions without having the necessary training and knowledge”, as employment in government is considered mainly as the outcome of “who you know”. This resulted in persons, “not capable of doing their job”, being hired, and exacerbated the view that most government officials were “unknowledgeable”, “inefficient” and “incompetent”. Many believed that vast numbers of public officials lacked “financial management skills” and regularly made “budgetary errors”. A procurement and chief estimating director was highly critical of the public sector when it came to tendering and complained about “tender validity periods” in excess of “90 days”, the constant “delay of tender results” and tender adjudication processes employed by “procurement committees” not being “transparent”. Another interviewee asserted that officials do not always evaluate tenders in terms of the PPR and often appoint contractors whom they seek to implement projects. Several participants were of the opinion that the “security of payment” by government was “never guaranteed” and exposed contractors to “business risk”, “credit rating” downgrades, potential legal battles and liquidation applications, as construction companies often struggled “to pay their subcontractors” when they were paid late or, in certain instances, not paid at all. A 42-year-old woman noted that officials often went “on holiday” before ensuring payments and that the embezzlement of funds was a reality.
Maladministration was regarded as “worse” than prior to 1994 and BBBEE’s “biggest enemy”. Participant 1 passionately stated that “government is killing” BBBEE, specifically emerging black contractors, by failing them through maladministration. Another respondent indicated that contractors would rarely “blow the whistle” when engaging with unethical public officials, as this would jeopardise their chances of obtaining government contracts in the future. A few respondents were of the opinion that numerous White-owned construction firms regarded fronting as “a cost of doing business” in order to “retain control” of their organisations. One interviewee suggested that “smaller companies” opted to engage in fronting as “doing things the right way was very expensive”. Another mentioned how many companies became BBBEE “compliant overnight”. Some participants blamed fronting for the increase in the cost of construction and concurred that it will “not disappear if it is not better policed”. Participant 4, however, was of the opinion that the Construction Sector Code has made it more cumbersome for contractors to implement fronts, as their contributions to transformation have to be audited by established

Emuze & Adlam • Implementation of BBBEE in construction
151
and accredited verification agents. The applicant concluded by stating that “in 10 to 20 years, most front companies will close shop as fronting is not sustainable”.
4. Conclusions and recommendationsThe implementation of BBBEE has had an incontrovertible effect on the construction industry. It affects every fragment of the sector, from the shareholding profiles of construction firms right down to the commitment of these firms to the communities in which they operate. BBBEE’s all-encompassing nature has presented the construction industry with numerous challenges that it has to resolve, in order to ensure its successful transformation. The challenges, in terms of the research questions of the study, were investigated by the review of related literature and semi-structured interviews. The literature, in general, most importantly focused on the main dilemmas experienced in the sector during the implementation of BBBEE. Such predicaments are not limited to corporate difficulties in terms of exploitation, fronting, misrepresentation and other unethical practices.
The empirical findings show that the generic framework for BBBEE affects the construction industry; that contractors often encounter commercial impediments when implementing BBBEE; that BBBEE is subject to various manipulations, and that fronting by construction firms, as a direct result of BBBEE, is becoming an issue in the industry. Thus, the 11 interviewees that are active in the industry contend that there are impediments related to the BBBEE implementation in the construction sector. They also gave instances of exploitations and unethical practices in the industry, in order to buttress their points. It is, however, important to view these findings in context, based on the limitations mentioned in earlier sections.
Nevertheless, the study has provided stakeholders with a broader understanding of how contractors perceive the development and implementation of BBBEE in the construction industry. The study is important, as it sheds light on how BBBEE in the construction sector has evolved, but most significantly, it focuses on some of the most predominant BBBEE-related challenges that many firms have encountered. The results of the inquiry might likely serve as a catalyst for change through intensified stakeholder interest, increased awareness and enhanced informal engagements in the construction industry. This, in turn, can bring about a plethora of ideas on how to solve existing and possible future problems associated with BBBEE. Such issues include fruitful policy amendments,

Acta Structilia 2013: 20(1)
152
improved research initiatives, and the formation of construction sector-oriented transformation associations. The study should be of value to policymakers, researchers, practitioners and students in the construction sector.
References listBlack Economic Empowerment Commission (BEECom). 2001. Black Economic Empowerment Commission Report. Johannesburg: Skotaville Press.
Bolton, P. 2006. Government procurement as a policy tool in South Africa. Journal of Public Procurement, 6(3), pp. 193-217.
Bosch, J., Tait, M. & Venter, E. 2006. Business management: An entrepreneurial perspective. Port Elizabeth: Lectern.
Bowen, P., Edwards, P. & Root, D. 2009. Corporate social responsibility and public sector procurement in the South African construction industry. In: Murray, M. & Dainty, A., (eds), Corporate social responsibility in the construction industry. Oxford: Taylor & Francis, pp. 304-326.
Business Unity South Africa (BUSA). 2008. A practitioner’s guide to the codes of good practice on Broad-Based Black Economic Empowerment. Available from: <http://www.busa.org.za/docs/Practioners%20Guide%20text.pdf> [Accessed: 28 December 2012].
Cargill, J. 2010. Trick or treat: Rethinking Black Economic Empower-ment. Auckland Park: Jacana Media.
Construction Industry Development Board (CIDB). 2011. Construction quality in South Africa: A client perspective. Pretoria: CIDB.
Creswell, J.W. 2012. Qualitative inquiry and research design: Choosing among five approaches. 3rd ed. Los Angeles: Sage Publications.
Cruz, C. 2006. What drives Black talent in South Africa? Management Today, 22(6), pp. 24-25.
Department of Trade and Industry (DTI). 2003. South Africa’s economic transformation: A strategy for Broad-Based Black Economic Empowerment. Pretoria: DTI.
Department of Trade and Industry (DTI). 2007. Broad-Based Black Economic Empowerment Codes of Good Practice. (Government Gazette, No. 29617). Pretoria: DTI.

Emuze & Adlam • Implementation of BBBEE in construction
153
Department of Trade and Industry (DTI). 2009. Construction Sector Code. (Government Gazette, No. 32305). Pretoria: DTI.
Department of Trade and Industry (DTI). 2012. Broad-Based Black Economic Empowerment Amendment Bill. (Government Gazette, No. 35907). Pretoria: DTI.
Foxcroft, M., Wood, E., Kew, J., Herrington, M. & Segal, N. 2002. Global Entrepreneurship Monitor: South African Executive Report 2002. Cape Town: The Graduate School of Business, University of Cape Town.
Hofmeyer, J. (ed). 1998. 2008 Transformation audit: Risk and opportunity. Cape Town: Institute for Justice and Reconciliation (IJR).
Horwitz, F.M. & Jain, H. 2011. An assessment of employment equity and Broad-Based Black Economic Empowerment development in South Africa. Equality Diversity and Inclusion: An International Journal, 30(4), pp. 297-317.
Jack, V. 2007. Make BEE work for you. Northcliff: Frontrunner Publishing.
Leedy, P.D. & Ormrod, J.E. 2010. Practical research: Planning and design. 9th ed. Boston: Pearson Education.
Masondo, D. 2010. BEE has involved into a family affair: ZEE. City Press. [online] 5 September. Available from: <http://www.citypress.co.za/Columnists/GuestColumnist/BEE-has-evolved-into-a-family-affair-ZEE-20100904> [Accessed: 8 December 2012].
Moloi, M. 2006. Combating corruption and fronting. Building Women, December/January (Launch edition), pp.32-33.
Motau, D. 2012. Reworked BEE law aims to combat fronting, elevate non-ownership scorecard elements. Engineering News [online] 27 January. Available from: <http://www.engineeringnews.co.za/article/reworked-empowerment-law-aims-to-combat-fronting-elevate-nonownership-scorecard-elements-2012-01-27> [Accessed: 16 December 2012].
Naidoo, B. 2011. Government names local products for designated procurement. Engineering News. [online] 7 December. Available from: http://www.engineeringnews.co.za/article/govt-names-de-sig nated-products-for-local-procurement-2011-12-07 [Accessed: 7 December 2012].
National Treasury (NT). 2011. Preferential Procurement Regulations. (Government Gazette, No. 34350). Pretoria: National Treasury.

Acta Structilia 2013: 20(1)
154
Nzukuma, K.C.C. & Bussin, M. 2011. Job-hopping amongst African Black senior management in South Africa. SA Journal of Human Resource Management, 9(1), pp. 1-12.
Patel, L. & Graham, L. 2012. How broad-based is Broad-Based Black Economic Empowerment? Development Southern Africa, 29(2), pp. 193-207.
Paton, C. 2012. Jail terms to punish BEE ‘fronting’ in planned law. Business Day BD live. [online] 1 February. Available from: <http://www.bdlive.co.za/articles/2012/02/01/jail-terms-to-punish-bee-fronting-in-planned-law> [Accessed: 16 December 2012].
South Africa. 2000. Construction and Industry Development Board Act, Act No. 38 of 2000. Pretoria: Government Printer.
South Africa. 2003. Broad-Based Black Economic Empowerment Act, Act No. 53 of 2003. Pretoria: Government Printer.
SAPA. 2010. Not enough Black, female directors, study shows. Mail and Guardian. [online] 2 March. Available from: <http://mg.co.za/article/2010-03-02-not-enough-black-female-directors-study-shows> [Accessed: 8 December 2012].
SAPA. 2012. BBBEE Act amendments needed – Davies. Business Report. [online] 29 October. Available from: <http://www.iol.co.za/business/business-news/bbbee-act-amendments-needed-davies-1.1412978#.UMHWmFLzo08> [Accessed: 29 October 2012].
Stansbury, N. 2005. Exposing the foundations of corruption in construction. In: Rodiriquez, D., Waite, G. & Wolfe, T. (eds), Global Corruption Report 2005: Corruption in construction and post-conflict reconstruction. London: Pluto Press, pp. 36-50.
Transparency International (TI). 2009. Corruption Perceptions Index 2009. Berlin: TI.
Transparency International (TI). 2012. Corruption Perceptions Index 2012. Berlin: TI.
Ward, M. & Muller, C. 2010. The long-term share price reaction to Black economic empowerment announcements on the Johannesburg Securities Exchange. Investment Analysts Journal, 71, pp. 27-36, May.
Woolley, R. 2005. Everyone’s guide to Black economic empowerment and how to implement it. Cape Town: Zebra Press.

1. An article may be submitted in Afrikaans or English. The desired length for an article is between 4 000 en 12 000 words.
2. A copy of the typed article must be submitted (authors keep the original) in electronic format (MS Word) forwarded via email (see point 24.). The format must be kept as plain as possible for extracting and printing purposes.
3. An edited (proofread) article on any relevant topic, well presented and written in easy understandable style, will be considered for publishing. Diagrams, sketches and photos (jpeg or tif format at 300 dpi) may be included.
4. The editor reserves the right to alter the article(s) where necessary with regard to the style and presentation of the publication. If extensive alterations are advised by adjudicators the article(s) will be returned to the author.
5. Copyright is transferred to Acta Structilia Journal when an article is accepted for publication.
6. Article content must be written in Microsoft Word, Arial, font size 12, single spacing.
7. Titles must be short and concise, but informative. Supply suitable headings and sub-headings where necessary. The title must be in both Afrikaans and English.
8. A short summary, in both Afrikaans and English, must be provided at the beginning of the text.
9. Applicable keywords in Afrikaans and English must be given after the summary.
10. Use Arabic numbers with full stops in between for headings and subheadings, i.e. 1. followed by 1.1 and 1.1.1 up to a maximum of three levels. After that use a) etc.
11. Source references in the text must be in the Harvard style of referencing (Author, date: pages). i. e. (Schleien, 1996: 20-40)
12. Foot- and endnotes are likewise done in the Harvard style of referencing.
13. The references list (Harvard style of referencing) should contain all the relevant information, and be listed alphabetically according to the names of the authors. i. e. Sun, M. & Howard, R. 2004. Understanding I.T. in construction. London: Spon Press.
14. A copy of internet documents cited in the text and listed in the references must accompany the article.
15. Quotations are not in italics and must be written in double inverted commas. Inserts in quotations are placed in block brackets. Quotations longer than three lines are indented and are placed without quotation marks.
16. Avoid uncommon abbreviations and acronyms. Abbreviations should be limited to those in general use. Names of corporations, etc are at first written out in full with the abbreviation in brackets after which the abbreviated form may be used.
17. Italics are preferred for stereotyped Latin terms such as per se and for words in other languages.
18. Use single inverted commas to emphasise words or phrases.
19. Details concerning the origin of the article should be indicated, i.e if it was presented at a congress. An article will only be referred to the panel of referees if the author clearly stated that it has not been submitted to other journals.
20. Authors may submit the names and addresses of three scholars (experts) in his field (not members at own place of work) as possible adjudicators.
21. The author(s) will receive two complimentary copies of the relevant issue of Acta Structilia.
22. The article must contain the title, qualifications and affiliations of the author(s), the address, telephone and facsimile numbers and if possible, the e-mail address.
23. Note that a publication fee of R30-00 per page is payable for every article published. An invoice will be sent to the main author.
24. Editorial address: The Editor: Acta Structilia Internal Post Box 47 University of the Free State PO Box 339 Bloemfontein, 9300 South Africa
E-mail address: [email protected]
ACTA STRUCTILIA
INFORMATION FOR AUTHORS
155

1. Acta Structilia publiseer artikels in Afrikaans en Engels. Die verlangde lengte vir ‘n artikel is tussen 4 000 en 12 000 woorde.
2. Voornemende outeurs moet ’n elektroniese kopie van ’n artikel in MS Word formaat (oorspronklike word deur die outeur bewaar) voorlê deur dit per epos aan te stuur (sien epos adres by punt 24.).
3. Enige toepaslike artikel, in ’n verstaanbare skryfstyl, duidelik uit eengesit en reeds taalversorg, word verwelkom. Diagramme, sketse en foto’s (jpeg of tifformaat teen 300dpi) mag ingesluit word.
4. Die redakteur behou hom die reg voor om veranderinge, indien nodig, wat betref styl en aanbieding aan te bring. Sou aansienlike wysigings deur referente voorgestel word, sal ’n artikel na die outeur terugverwys word.
5. Kopiereg word aan Acta Structilia by aanvaarding van die artikel oorgedra.
6. Teksgedeeltes van artikels moet in Microsoft Word, Ariel skrif, font grootte 12, enkel spasiëring gedoen word.
7. Die titel van die artikel moet kort en bondig wees en in beide Afrikaans en Engels aangebied word.
8. ’n Kort opsomming in Afrikaans en Engels moet aan die begin van die artikel aangebring word.
9. Toepaslike sleutelwoorde in Afrikaans en Engels moet onder die opsomming aangebring word.
10. Opskrifte en onderskrifte word in Arabiese syfers genommer, geskei deur ’n punt en hoogstens tot drie vlakke, waarna ’n letter in hakies gebruik word, bv. 1. en 1.1 gevolg deur 1.1.1 en daarna a) ens.
11. Bronverwysings in die teks geskied volgens die Harvardstyl van verwysing: (Outeur, datum: bladsynommer[s]): bv. (Schleien, 2004: 2023).
12. Net egte voet en eindnote met die tersaaklike inligting moet gebruik word. Die Harvardstyl van verwysing is hier van toepassing.
13. Die verwysingslys volgens die Harvardstyl van verwysing moet volledig in alfabetiese volgorde aangebied word. Bv. Sun, M. & Howard, R. 2004. Understanding I.T. in construction. London: Spon Press.
14. ’n Kopie van alle internet dokumente wat in die teks verwys en gelys is in die bibliografie, moet die artikel vergesel.
15. Aanhalings word nie kursief gedruk nie, en word in dubbelaanhalingstekens aan gedui. Invoegings binne aanhalings word in blokhakies aangedui. Aanhalings wat langer as drie reëls is, word ge ïndenteer en het nie aanhalings tekens nie.
16. Slegs standaardafkortings word aanbeveel. Afkortings vir instellings kan gebruik word nadat dit vir die eerste keer volledig uitgeskryf is, met die afkorting daarna in hakies, vir terugverwysing.
17. Kursief moet nie oormatig gebruik word nie, indien wel, slegs vir konvensionele Latynse uitdrukkings bv. per se en vir woorde in ander tale.
18. Beklemtonings kry en kel aanhalings tekens.
19. Besonderhede van die oorsprong van ’n artikel moet aangedui word, soos in die geval van ’n kongresreferaat. Artikels word net vir keuring oorweeg indien vergesel van ’n verklaring dat dit nie elders vir publikasie voorgelê is, of reeds gepubliseer is nie.
20. Artikels word anoniem gerefereer. Die outeur(s) kan die name en adresse van tot drie vakkundiges (nie aan outeur[s] se eie instansie van werk verbonde nie) voorstel wat as referente sou kon optree.
21. Die outeur(s) van artikels wat geplaas word, sal elk twee komplimentêre kopieë van die betrokke uitgawe van Acta Structilia ontvang.
22. ’n Artikel moet vergesel word van die volledige titel, kwalifikasie en affiliasie, adres, telefoon en faksimilieenommers en indien moontlik ’n eposadres van die betrokke outeur(s).
23. Neem kennis dat ’n publikasieheffing van R30 per bladsy op die artikels wat gepubliseer word, betaalbaar is. ’n Faktuur sal aan die hoofouteur gestuur word.
24. Rig u bydrae(s) aan: Die Redakteur: Acta Structilia
Interne Posbus 47 Universiteit van die Vrystaat Posbus 339 Bloemfontein, 9300 SuidAfrika
Epos adres: [email protected]
ACTA STRUCTILIA
INLIGTING AAN OUTEURS
156