Embed Size (px)
Citation preview
Advanced Measurement and Modeling Tools for Improved SOFC Cathodes
Yunxiang Lu, Jamie R. Wilson, Lilya Dunyushkina, Stuart B. AdlerUniversity of Washington
SECA Core Technology ProgramOctober, 2003
Acknowledgements• University of Washington Department of Chemical Engineering
– Yunxiang Lu (PhD student)– Jamie Wilson (PhD student)– Lilya Dunyushkina (IHTE)
• Collaborators– Dan Schwartz (UW Chemical Engineering)– Olga Marina, Peter Rieke (PNNL)– Allan Jacobson (University of Houston)
• Support– DOE/NETL SECA Core Technology Program– NSF, UW Provost Fund
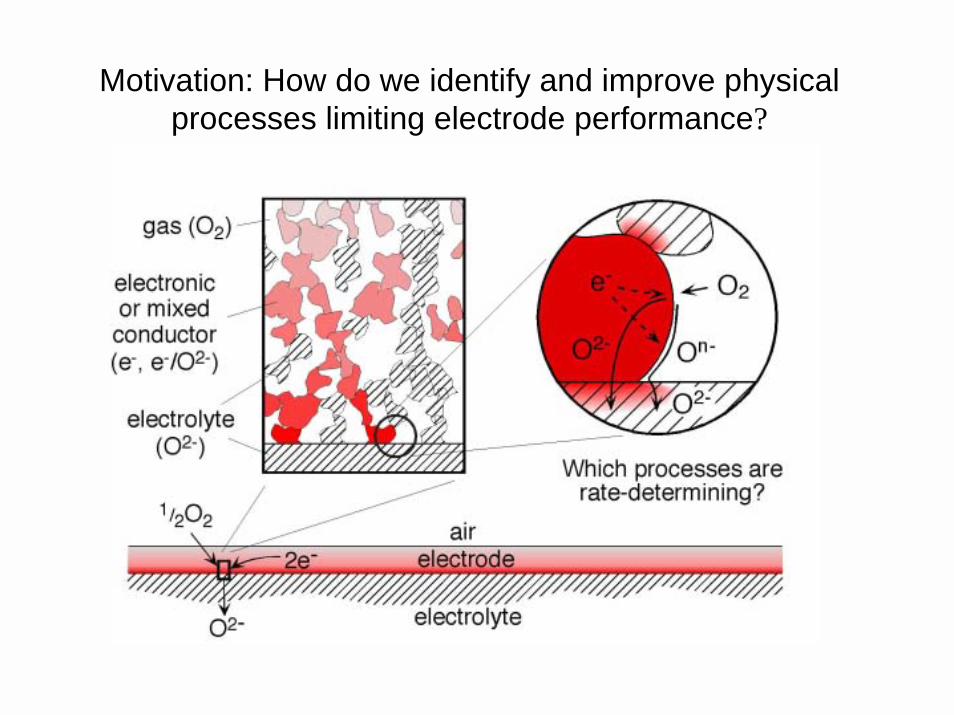
Motivation: How do we identify and improve physical processes limiting electrode performance?
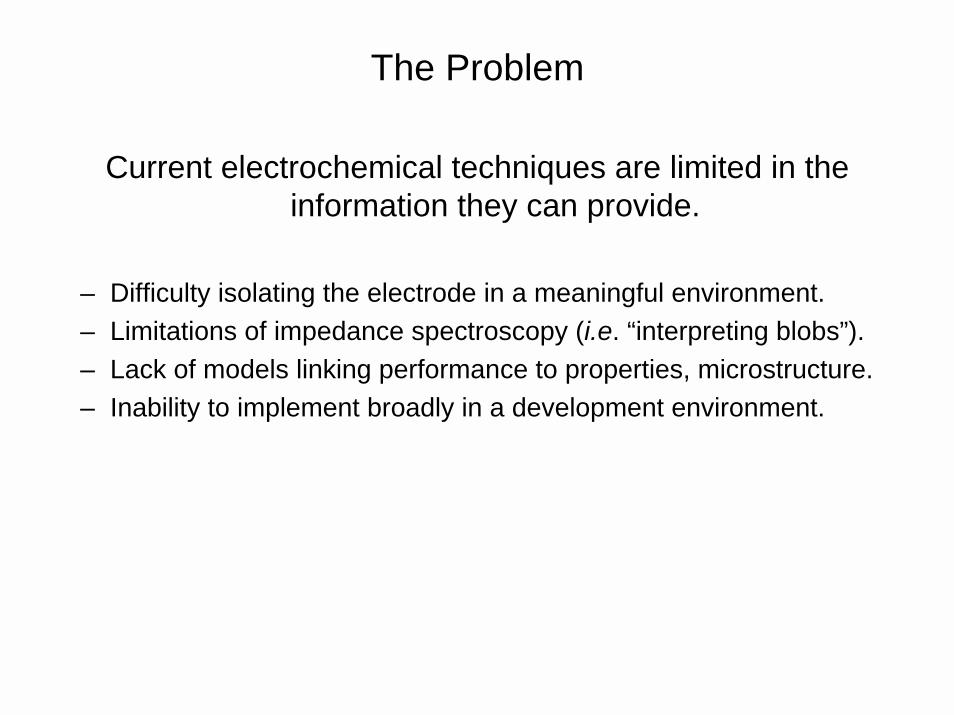
The Problem
Current electrochemical techniques are limited in the information they can provide.
– Difficulty isolating the electrode in a meaningful environment.– Limitations of impedance spectroscopy (i.e. “interpreting blobs”).– Lack of models linking performance to properties, microstructure.– Inability to implement broadly in a development environment.
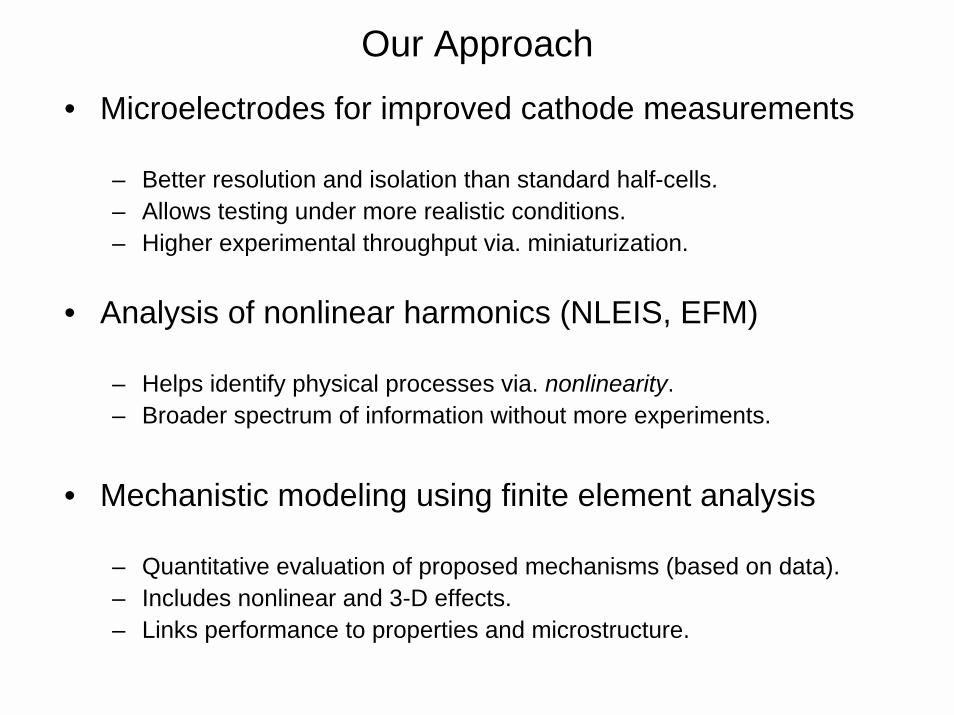
Our Approach
• Microelectrodes for improved cathode measurements
– Better resolution and isolation than standard half-cells.– Allows testing under more realistic conditions.– Higher experimental throughput via. miniaturization.
• Analysis of nonlinear harmonics (NLEIS, EFM)
– Helps identify physical processes via. nonlinearity.– Broader spectrum of information without more experiments.
• Mechanistic modeling using finite element analysis
– Quantitative evaluation of proposed mechanisms (based on data). – Includes nonlinear and 3-D effects. – Links performance to properties and microstructure.

Materials of Interest
Porous Perovskite Electrodes:
electrolyteCe0.8Sm0.2O2-x
electrodeLa1-xSrx(Co,Fe)O3-δ
1µm
Thin-Film and patterned electrodes:
La0.5Sr0.5CoO3-don single-crystal YSZ
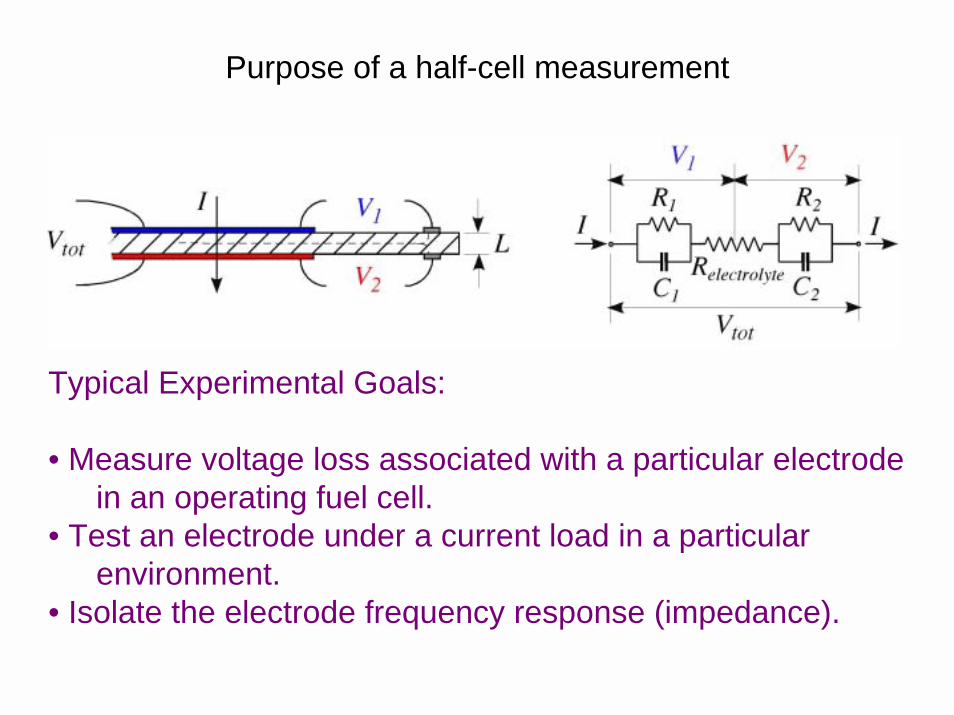
Purpose of a half-cell measurement
Typical Experimental Goals:
• Measure voltage loss associated with a particular electrode in an operating fuel cell.
• Test an electrode under a current load in a particular environment.
• Isolate the electrode frequency response (impedance).
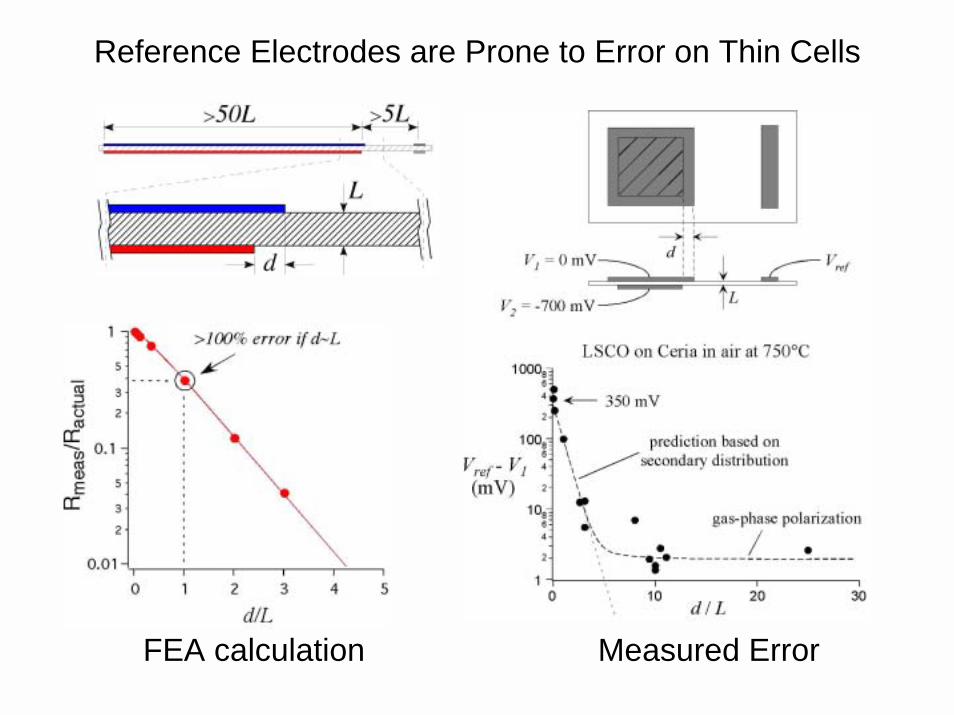
Reference Electrodes are Prone to Error on Thin Cells
FEA calculation Measured Error
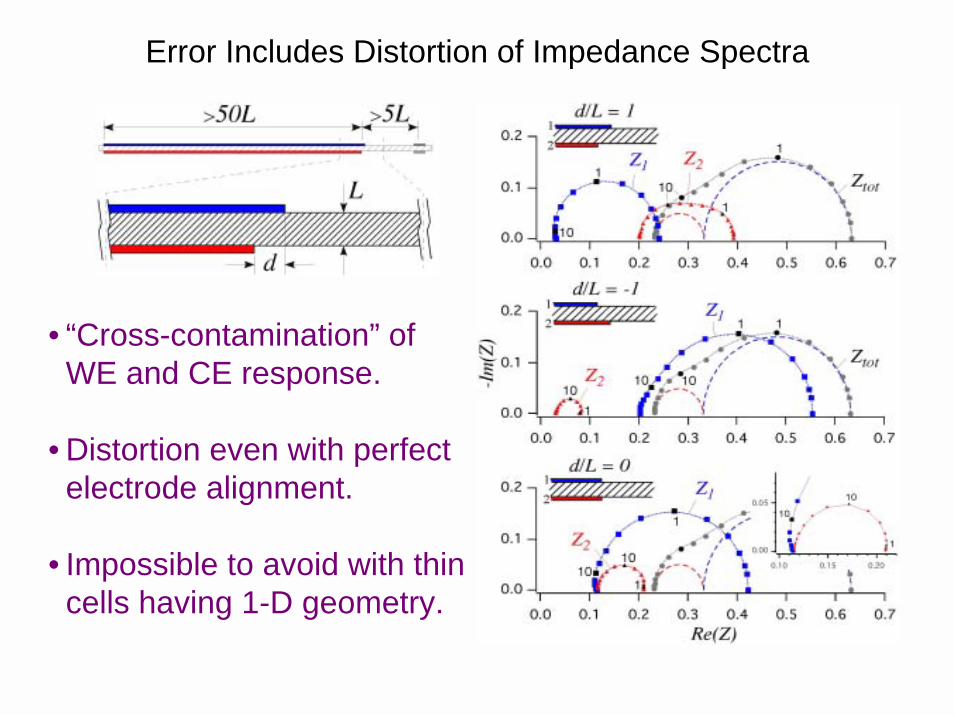
Error Includes Distortion of Impedance Spectra
• “Cross-contamination” of WE and CE response.
• Distortion even with perfect electrode alignment.
• Impossible to avoid with thin cells having 1-D geometry.
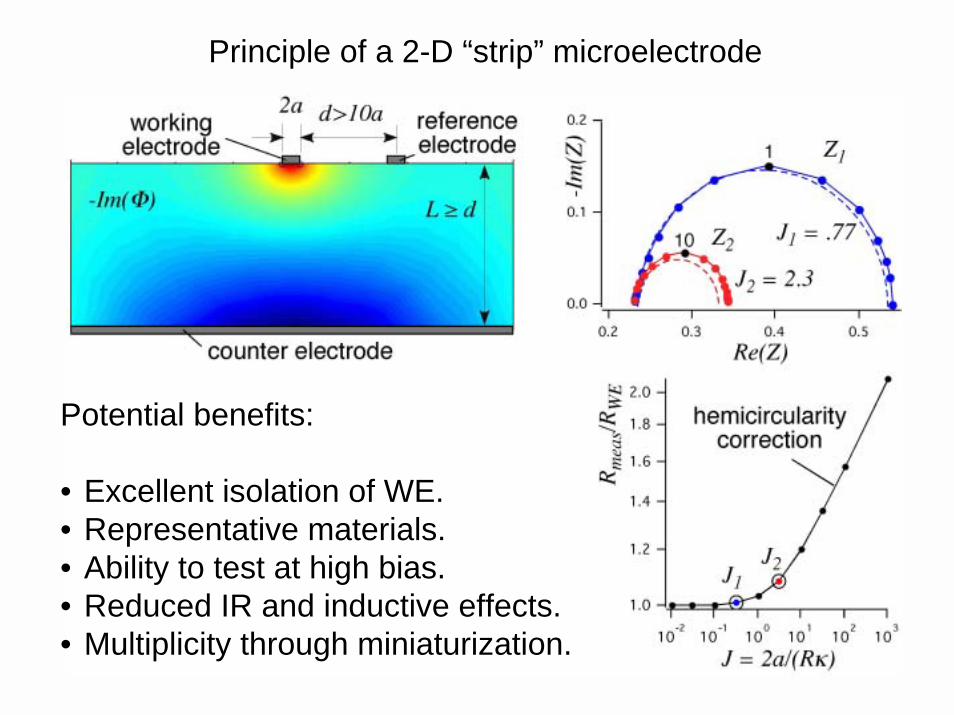
Principle of a 2-D “strip” microelectrode
Potential benefits:
• Excellent isolation of WE.• Representative materials.• Ability to test at high bias.• Reduced IR and inductive effects.• Multiplicity through miniaturization.
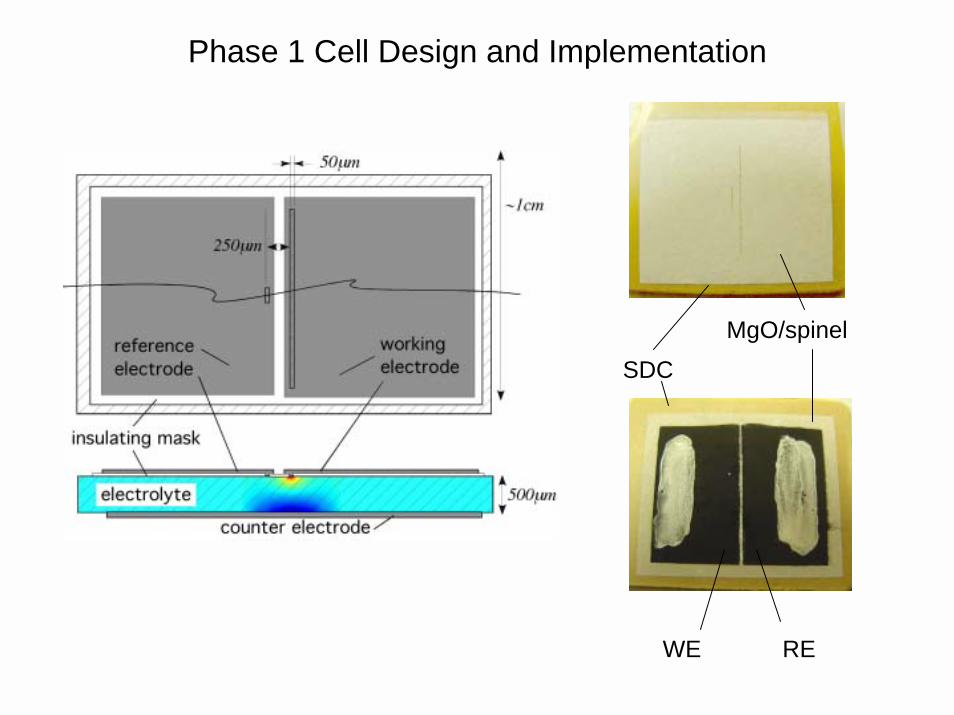
Phase 1 Cell Design and Implementation
SDC
MgO/spinel
WE RE
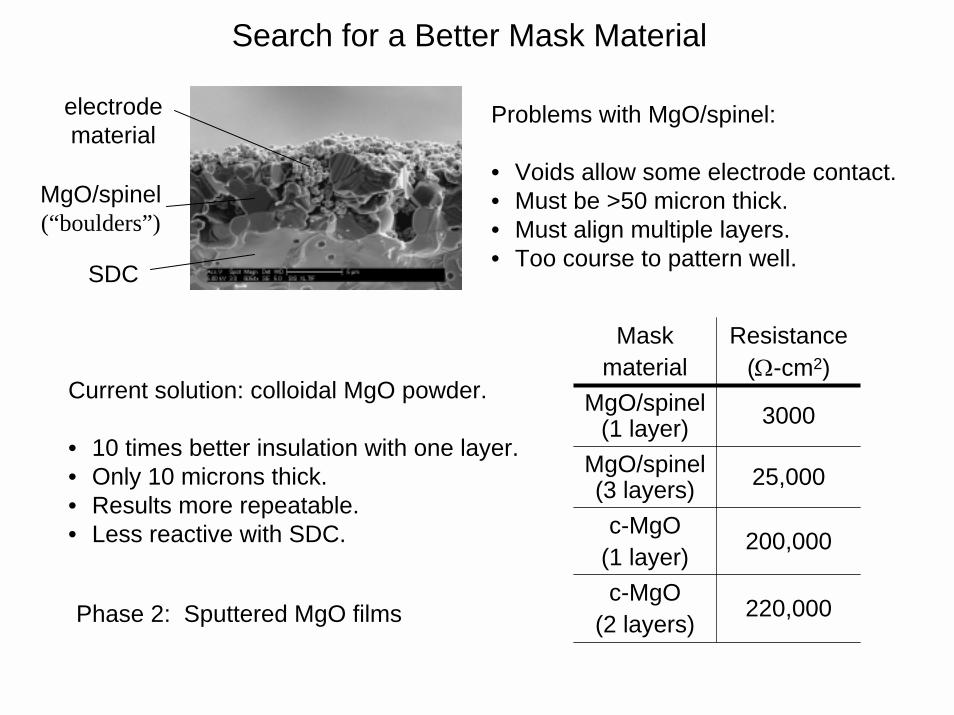
Search for a Better Mask Material
Problems with MgO/spinel:
• Voids allow some electrode contact.• Must be >50 micron thick.• Must align multiple layers.• Too course to pattern well.
electrodematerial
MgO/spinel(“boulders”)
SDC
220,000c-MgO(2 layers)
200,000c-MgO(1 layer)
25,000MgO/spinel(3 layers)
3000MgO/spinel(1 layer)
Resistance(Ω-cm2)
Maskmaterial
Current solution: colloidal MgO powder.
• 10 times better insulation with one layer.• Only 10 microns thick.• Results more repeatable. • Less reactive with SDC.
Phase 2: Sputtered MgO films
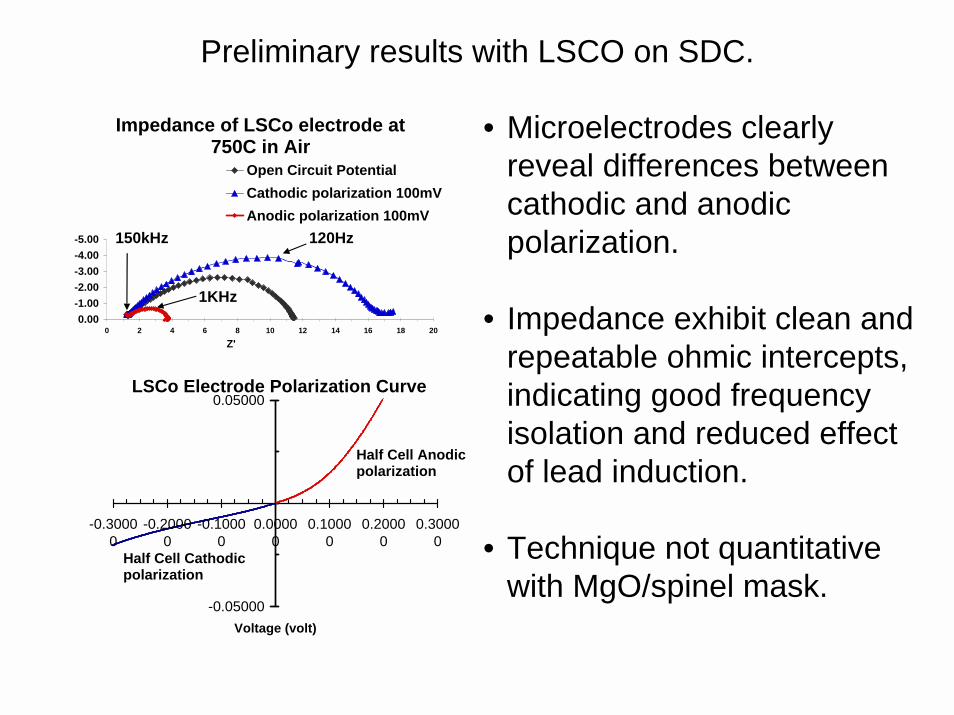
Preliminary results with LSCO on SDC.
• Microelectrodes clearly reveal differences between cathodic and anodic polarization.
• Impedance exhibit clean and repeatable ohmic intercepts, indicating good frequency isolation and reduced effect of lead induction.
• Technique not quantitative with MgO/spinel mask.
Impedance of LSCo electrode at 750C in Air
-5.00-4.00-3.00-2.00-1.000.00
0 2 4 6 8 10 12 14 16 18 20
Z'
Open Circuit PotentialCathodic polarization 100mVAnodic polarization 100mV
120Hz
1KHz
150kHz
LSCo Electrode Polarization Curve
-0.05000
0.05000
-0.30000
-0.20000
-0.10000
0.00000
0.10000
0.20000
0.30000
Voltage (volt)
Half Cell Cathodic polarization
Half Cell Anodic polarization
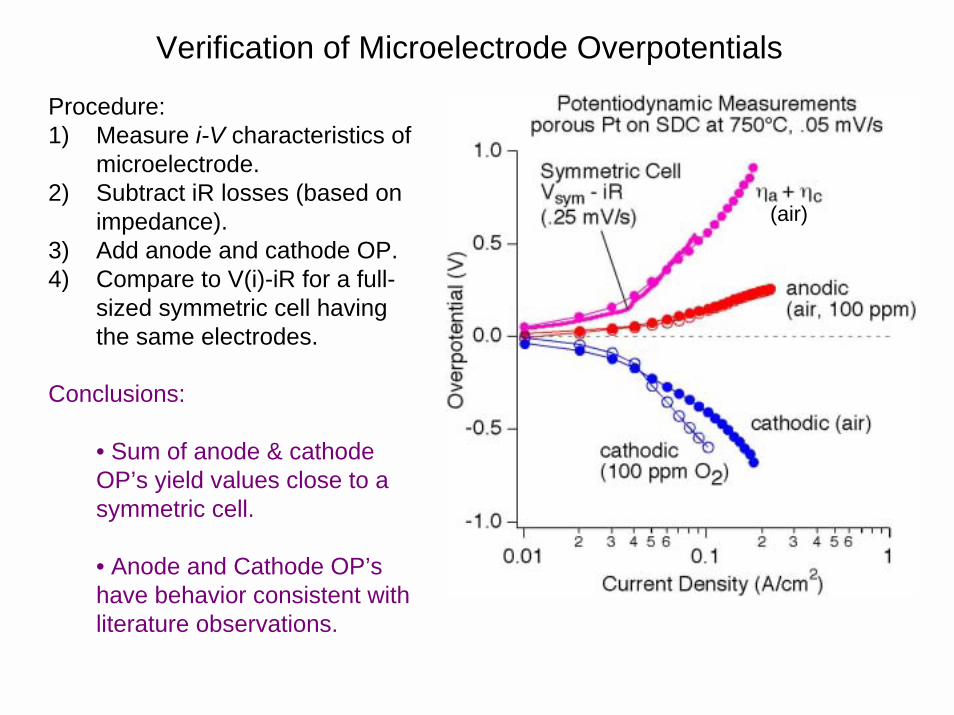
Verification of Microelectrode Overpotentials
Procedure:1) Measure i-V characteristics of
microelectrode.2) Subtract iR losses (based on
impedance).3) Add anode and cathode OP.4) Compare to V(i)-iR for a full-
sized symmetric cell having the same electrodes.
(air)
Conclusions:
• Sum of anode & cathode OP’s yield values close to a symmetric cell.
• Anode and Cathode OP’s have behavior consistent with literature observations.

Applications and Future Work
• Incorporate Microelectrodes into our perovskite electrode studies.
- Mechanistic studies employing controlled microstructure. - Development of tailored microstructures for improved cathode performance.- Co-development of NLEIS and EFM.
• Sputtered thin-film mask
- Thin mask = smaller dimensions.- Reduced risk of geometric effects.- Thinner electrolytes
• Develop methods to test multiple cells on a single substrate.
- Materials Screening- Massively Parallel Testing- Design of Experiments- Long-term Degradation
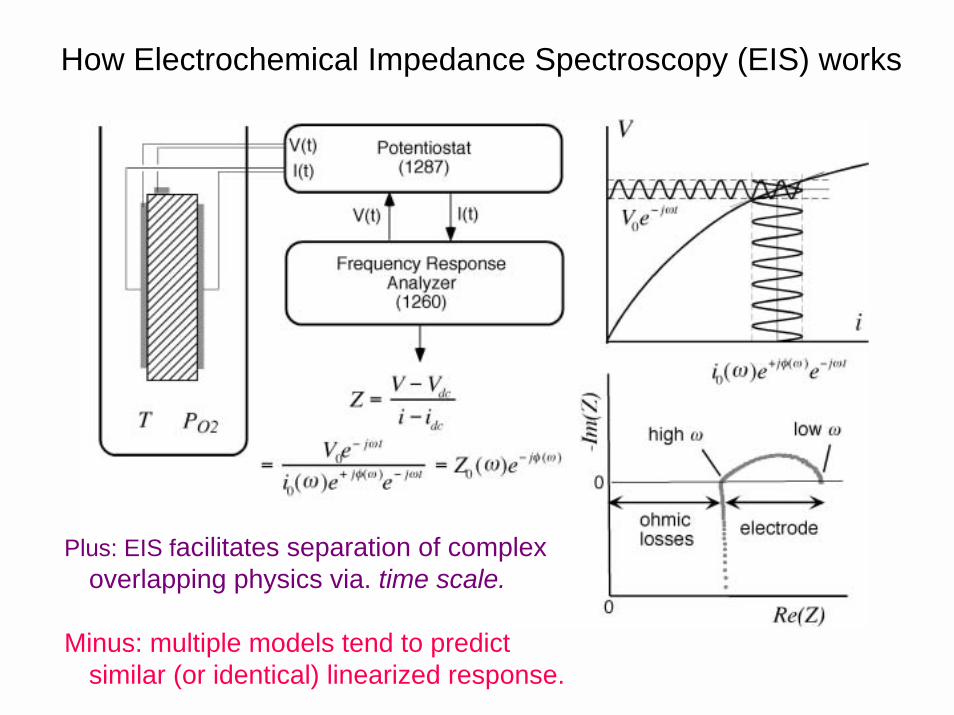
How Electrochemical Impedance Spectroscopy (EIS) works
Plus: EIS facilitates separation of complex overlapping physics via. time scale.
Minus: multiple models tend to predict similar (or identical) linearized response.
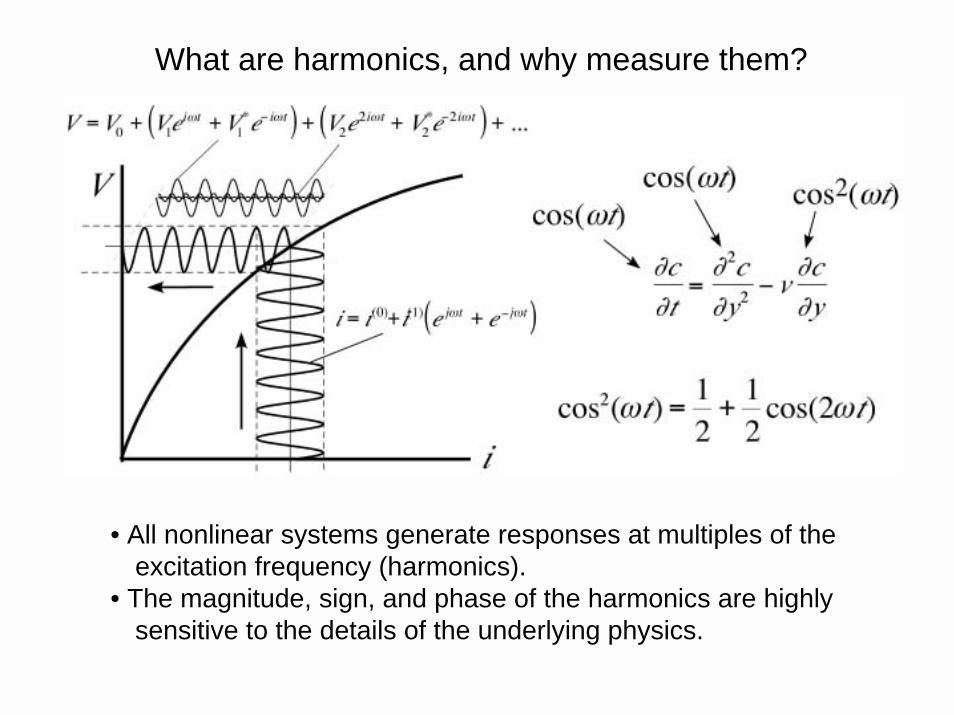
What are harmonics, and why measure them?
• All nonlinear systems generate responses at multiples of the excitation frequency (harmonics).
• The magnitude, sign, and phase of the harmonics are highly sensitive to the details of the underlying physics.
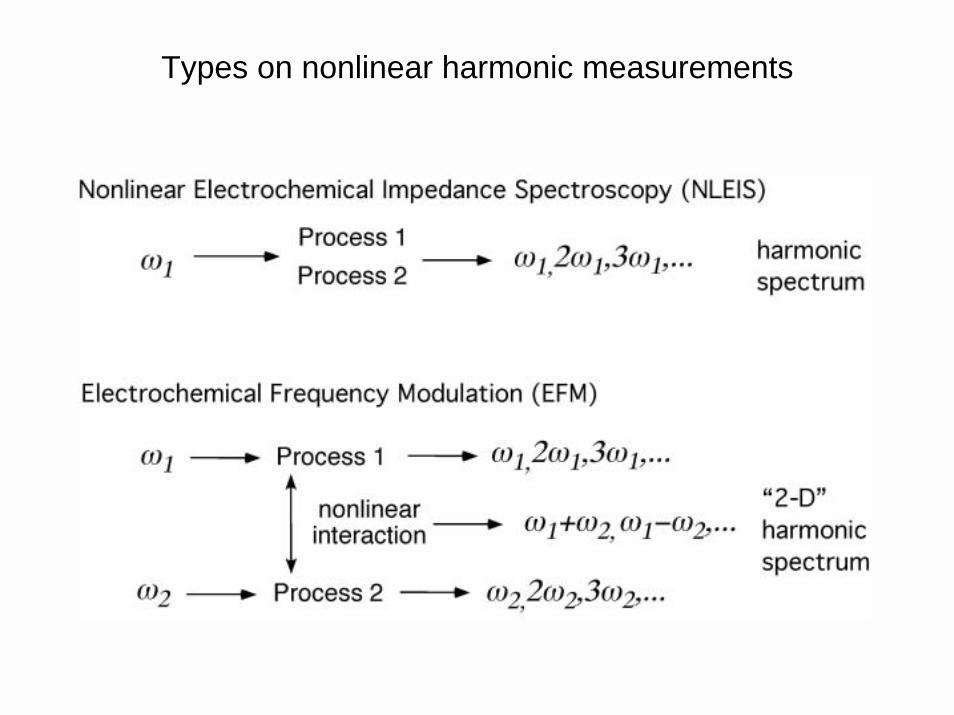
Types on nonlinear harmonic measurements
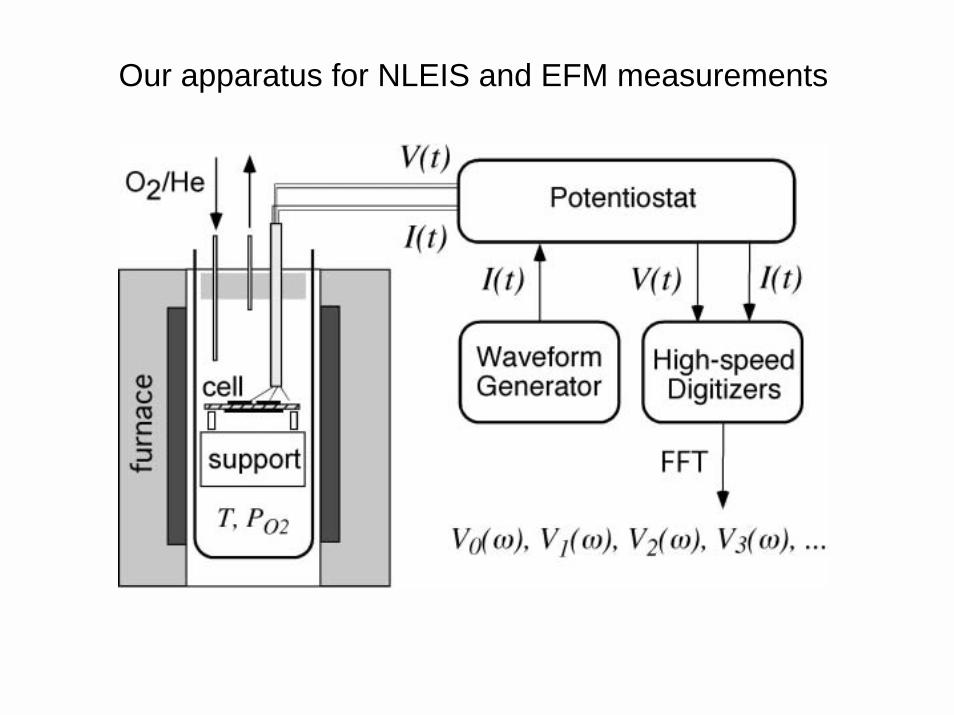
Our apparatus for NLEIS and EFM measurements
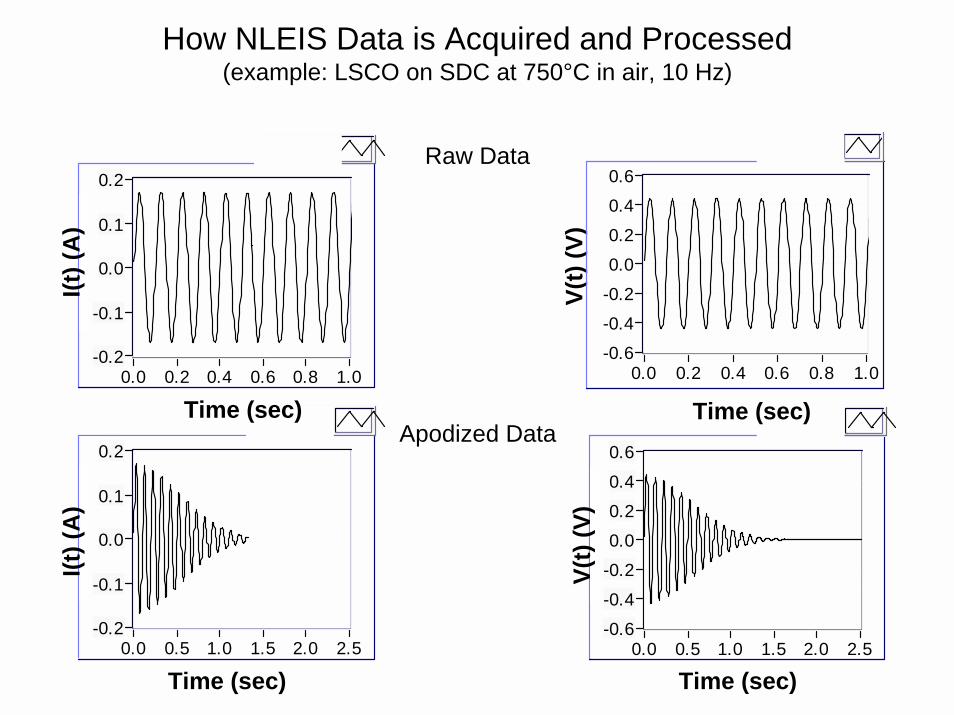
How NLEIS Data is Acquired and Processed(example: LSCO on SDC at 750°C in air, 10 Hz)
V(t)
(V)
0.6
-0.6
-0.4
-0.2
0.0
0.2
0.4
1.00.0 0.2 0.4 0.6 0.8
Plot 0
0.6
-0.6
-0.4
-0.2
0.0
0.2
0.4
2.50.0 0.5 1.0 1.5 2.0
Plot 0
V(t)
(V)
Time (sec)
0.2
-0.2
-0.1
0.0
0.1
1.00.0 0.2 0.4 0.6 0.8
Plot 0
Plot 0
I(t) (
A)
Time (sec)
Raw Data
Apodized Data0.2
-0.2
-0.1
0.0
0.1
2.50.0 0.5 1.0 1.5 2.0
I(t) (
A)
Time (sec)Time (sec)
9E-4
-9E-4
-5E-4
-3E-4
0E+0
3E-4
5E-4
1000 20 40 60 80
observed d
fitted data
9E-4
-9E-4
-5E-4
0E+0
5E-4
1000 20 40 60 80
observed d
fitted data
9E-4
-9E-4
-5E-4
-3E-4
0E+0
3E-4
5E-4
1000 20 40 60 80
observed data
fitted data
9E-4
-9E-4
-5E-4
-3E-4
0E+0
3E-4
5E-4
1000 20 40 60 80
observed data
fitted data
Imag
inar
y V
olta
geR
eal V
olta
ge
Rea
l Cur
rent
Imag
inar
y C
urre
nt
Frequency (Hz) Frequency (Hz)
Frequency (Hz)
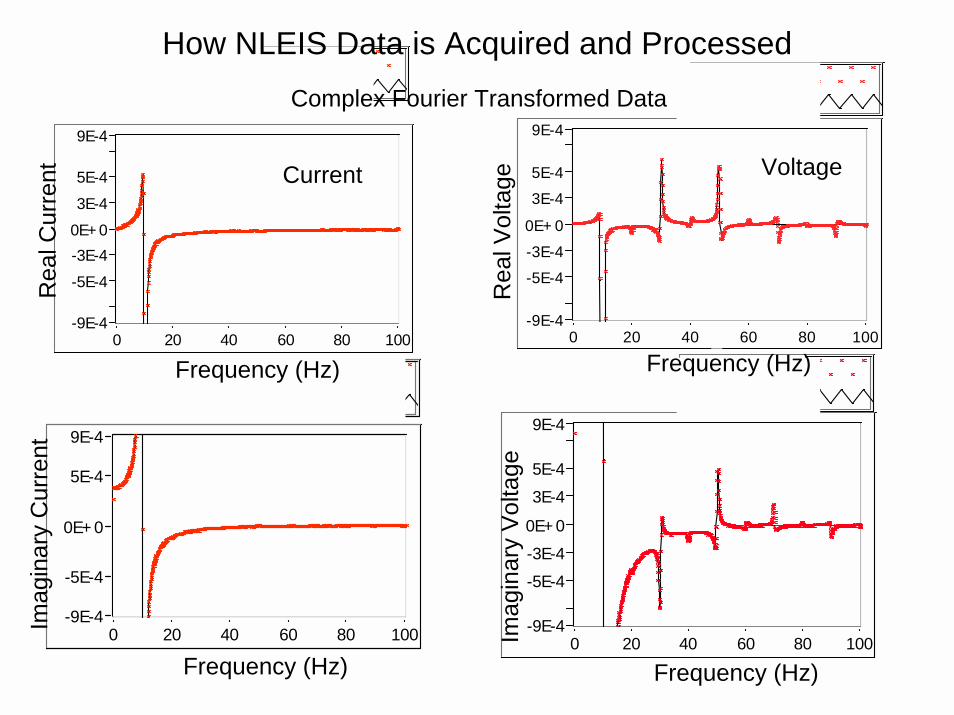
How NLEIS Data is Acquired and ProcessedComplex Fourier Transformed Data
Current Voltage
Frequency (Hz)
1E-4
-2E-4
-2E-4
-1E-4
-5E-5
-1E-20
5E-5
6035 40 45 50 55
observed data
fitted data
2E-2
-2E-2
-1E-2
0E+0
1E-2
600 10 20 30 40 50
observed data
fitted data
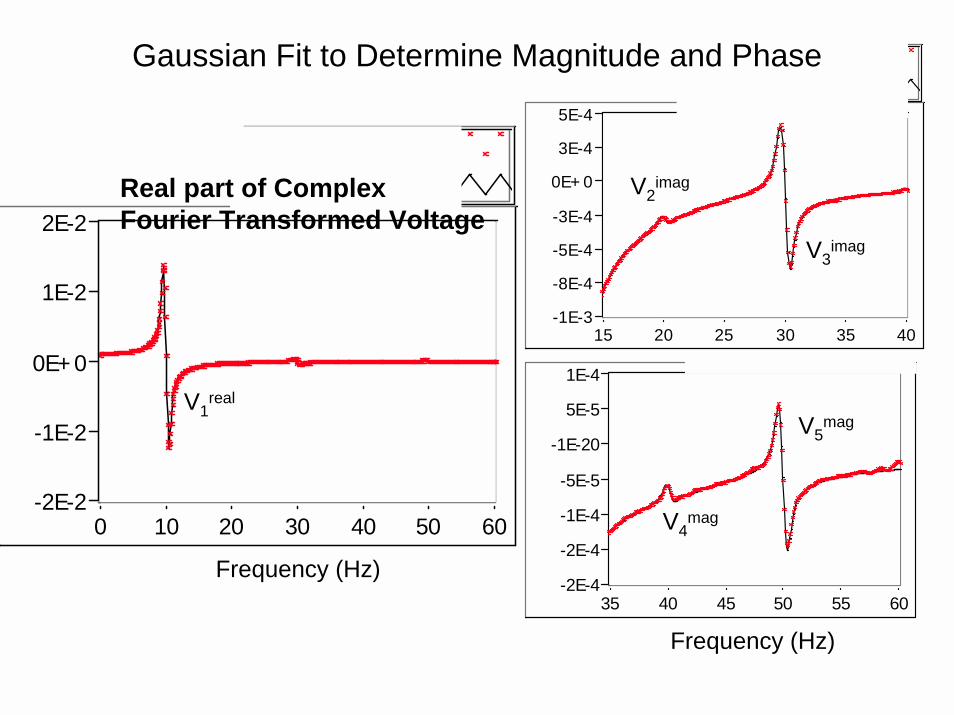
V1real
V4mag
V5mag
Real part of ComplexFourier Transformed Voltage
5E-4
-1E-3
-8E-4
-5E-4
-3E-4
0E+0
3E-4
4015 20 25 30 35
observed data
fitted data
V2imag
V3imag
Gaussian Fit to Determine Magnitude and Phase
Frequency (Hz)
Frequency (Hz)
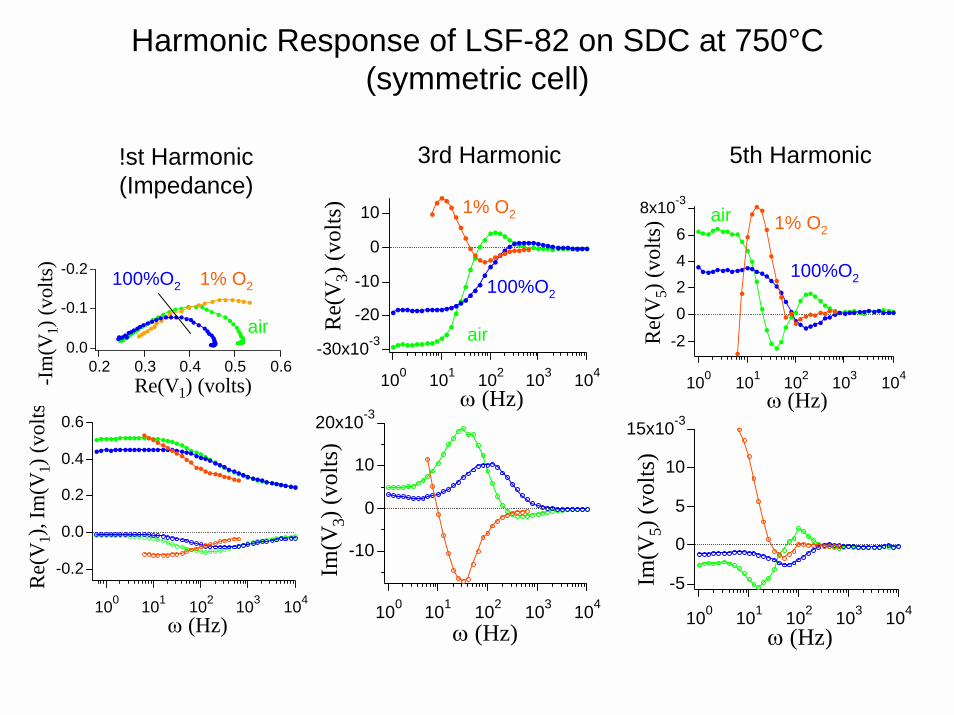
Harmonic Response of LSF-82 on SDC at 750°C(symmetric cell)
3rd Harmonic 5th Harmonic
0.6
0.4
0.2
0.0
-0.2
Re(
V1)
, Im
(V1)
(vol
ts
100 101 102 103 104
ω (Hz)
-0.2
-0.1
0.0
-Im
(V1)
(vol
ts)
0.60.50.40.30.2Re(V1) (volts)
-30x10-3
-20
-10
0
10
Re(
V3)
(vol
ts)
100 101 102 103 104
ω (Hz)20x10-3
10
0
-10
Im(V
3) (v
olts
)
100 101 102 103 104
ω (Hz)
8x10⁻³
6420
-2Re(
V5)
(vol
ts)
100 101 102 103 104
ω (Hz)15x10-3
10
5
0
-5Im(V
5) (v
olts
)100 101 102 103 104
ω (Hz)
100%O2
air air
100%O2
1% O2
1% O2
1% O2
100%O2
air
!st Harmonic(Impedance)
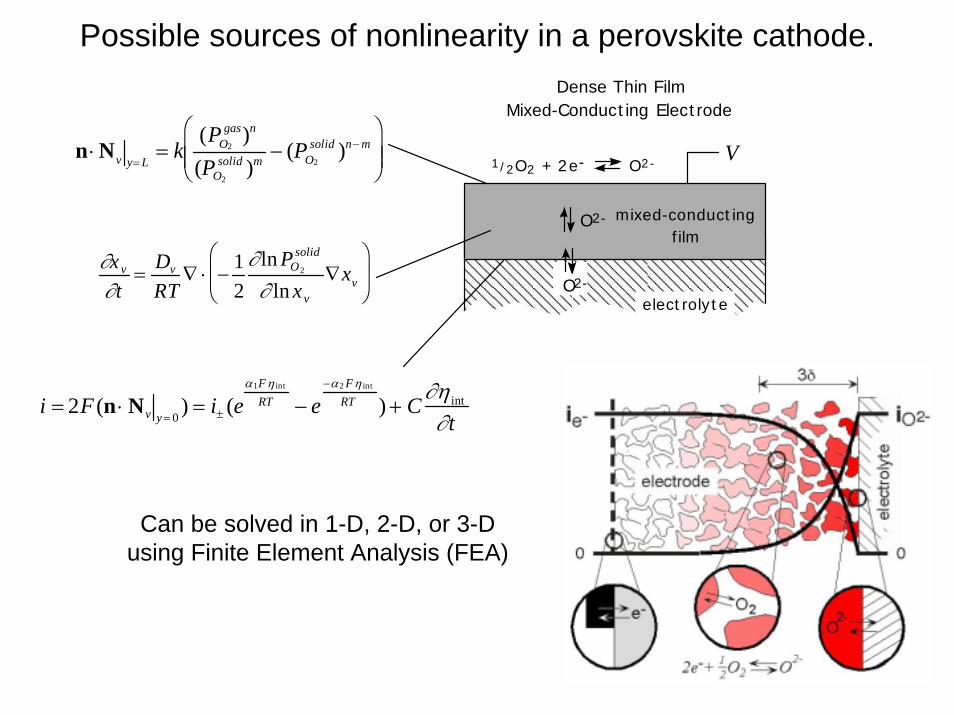
Possible sources of nonlinearity in a perovskite cathode.
elect roly t e
1 / 2O2 + 2e- O2 -
O2-
O2-
V
mixed-conduct ing f ilm
Dense Thin FilmMixed-Conduct ing Elect rode
∂xv
∂t= Dv
RT ∇ ⋅ − 1
2∂ ln PO2
solid
∂ ln xv
∇xv
n ⋅Nv y=L= k
(PO2
gas)n
(PO2
solid )m − (PO2
solid )n−m
i = 2F (n ⋅Nv y= 0) = i± (e
α1Fη int
RT − e−α2 Fη int
RT ) + C∂η int
∂t
Can be solved in 1-D, 2-D, or 3-Dusing Finite Element Analysis (FEA)
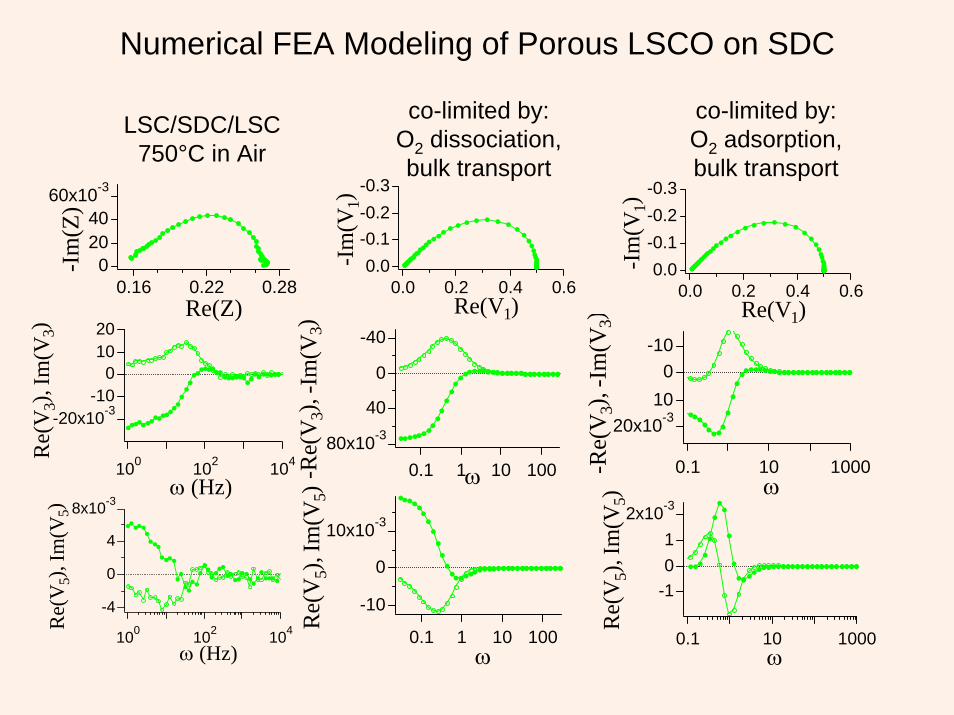
Numerical FEA Modeling of Porous LSCO on SDC
60x10-3
40200-I
m(Z
)
0.280.220.16Re(Z)
-20x10-3-10
01020
Re(
V3)
, Im
(V3)
100 102 104
ω (Hz)8x10⁻³
4
0
-4
Re(
V5)
, Im
(V5)
100 102 104
ω (Hz)
-0.3-0.2-0.10.0-I
m(V
1)
0.60.40.20.0Re(V1)
80x10-3
40
0
-40-R
e(V
3), -
Im(V
3)
0.1 1 10 100ω
10x10-3
0
-10
Re(
V5)
, Im
(V5)
0.1 1 10 100ω
-0.3-0.2-0.10.0-I
m(V
1)
0.60.40.20.0Re(V1)
20x10-3100
-10
-Re(
V3)
, -Im
(V3)
0.1 10 1000ω
2x10⁻³
10
-1R
e(V
5), I
m(V
5)0.1 10 1000
ω
LSC/SDC/LSC750°C in Air
co-limited by:O2 dissociation, bulk transport
co-limited by:O2 adsorption, bulk transport
Applications and Future Work
• NLEIS measurements on half-cell LSF/SDC microcathodes.– 2nd and 4th harmonics.– Higher S/N and reduced inductive effects at high frequency.
• Measurements and modeling of patterned electrodes (collaborativewith PNNL and U Houston).
• Application to developing new materials and microstructures for cathodes (joint with MSE at UW).
• NLEIS as an alternative method for characterization and diagnosis of cells/stacks, with no additional experimental effort/time.– Look at materials in industrial development.– Build a database of characteristic behavior.
Summary
• Microelectrodes potentially offer a more reliable vehicle for both measurement and development testing.
• It may be possible to use microelectrodes for for design-of-experiments or other combinatorial applications.
• NLEIS appears to be a promising method for both electrode analysis and characterization/diagnosis of cells/stacks, with no additional experimental effort/time.
• These tools will be used in subsequent work to develop a deeper understanding of electrode mechanisms, and new materials and microstructures for cathodes.