Embed Size (px)
Citation preview
1
Agenda Item: 5.1
REPORT TO THE TRUST BOARD
31 March 2016
Title Integrated Performance Report
Lead Director
Paul Scott - Director of Finance & Performance Lisa Nobes –Director of Nursing & Quality Clare Edmondson –Director of HR Neill Moloney - Chief Operating Officer
Author(s)
Chief Information Officer – Mike Meers Acting Deputy Director of Nursing – Karen Kemp Simon Rudkins – Deputy Director of Finance Jennifer Canham – Deputy Director of Human Resources
Purpose To receive for information
Previously considered by Finance and Performance Committee
Executive Summary
Related Trust Objectives Sub-objectives
Consistently deliver great healthcare to every patient every day
Maintain our focus on safe care
Improve the effectiveness of our care
Ensure we always have caring staff for our patients
Improve the way our services are responsive to the needs of patients.
Ensure care is well-led by # team Ipswich
Improve the healthcare we provide to patients where and when you need it.
Improve our efficiency to ensure our patients receive better care
Ensure all our clinical staff undertake thoughtful practice
Develop our infrastructure to improve patient access to care and information
Flexible and responsive to future demands
Demonstrate leadership in addressing the needs of Suffolk
Understand future needs
Supporting our workforce to meet future demands
A hospital without walls
Risk and Assurance N/A
Related Board Assurance Framework Entries
Risk to financial sustainability of the Trust (935)
Financial Implications N/A
Legal Implications/Regulatory Requirements
None
2
Action Required by the Trust Board The Trust Board is asked to receive for Information.
QUALITY
Harm free care
Falls
The total number of inpatient falls in February was 104 which equates to 6.1 falls per 1000
bed days. 47% of the total falls occurred between the hours of 2100 and 0700.
Of the 104 falls, 26 can be attributed to 11 patients who fell more than once. This represents
25% of the total.
There were no falls resulting in serious harm in February. There have been 12 patients YTD who have experienced a fractured neck of femur and 2 who experienced a serious head injury.
Grundisburgh have met their stretch target for 7 months running and demonstrates an upward trend. Brantham has only met their target twice YTD. Pressure ulcers
There were no avoidable pressure ulcers reported in February.
Woodbridge Ward have actively undertaken some intensive work with staff to improve the
documentation and use of the rounding tool following January’s RCA’s which has shown a
significant improvement in their documentation of care this month and is an example of
excellent learning and good practice.
There have been 4 incidents in last 4 months with inaccurate pressure ulcer risk
assessments which were completed initially on Brantham and not on transfer to ward areas.
There is a trend emerging from root cause analyses in the last 6 months that identify staff on
Brantham completing the risk assessment inaccurately. A plan to address this with
Brantham staff is being developed.
Infection Prevention and Control
C Difficile
There were 5 cases of C. Diff reported in February, one occurring on Somersham,
Debenham, Stradbroke and 2 cases on Washbrook. The ribotyping on the Washbrook cases
were different which demonstrates no transmission between patients.
Patient Experience
Complaints and PALS
42 complaints were raised in February, this compares with 48 in January, 37 in December,
45 in November and 54 in October.
3
Of the 42 complaints, one was graded as high level. This case relates to a patient
exacerbating an ankle fracture having fallen in the toilet. 28 cases were graded as medium
level and 13 were graded as low.
Occasionally the Trust receives a complaint that covers a number of health care providers, in
which case a coordinated response is required. There were no ‘co-ordinated’ complaints
received in February.
Issues raised in February include:-
3 complaints relating to the standard of care provided on Sproughton ward.
Problems with cardiology referrals to Papworth hospital.
Failure to recognise a deteriorating patient on Haughley ward.
Delay in having a biopsy and diagnosis of cancer in an oral surgery patient.
Delay in a dermatology patient receiving treatment due to lost samples.
Poor communication and a delay in receiving a colorectal outpatient appointment.
Medication issues on Lavenham and Stowupland wards.
A patient’s poor care following 2 ectopic pregnancies.
2 complaints relating to poor obstetric care on Deben ward.
Overdue Complaints:
There were no overdue complaints in February.
Nine requests for an extension were made in February; five were Division 1 cases, three
were Division 2 cases and one was a Division 3 case. This compares with nine extension
requests being made in January, ten in December, five in November and eight in October.
Re-opened Complaints:
Three complaints were re-opened in February; this compares with 6 cases being re-opened
in January and four being re-opened in December. November and October also saw four
complaints being re-opened.
Of the three complaints that were re-opened, two relate to Division 2 and one relates to
Division 1. One Division 2 case was easily resolved by offering the patient a Trauma and
Orthopaedic clinic appointment, the other re-opened Division 2 complaint is currently being
re-investigated by the Rheumatology team. The Division 1 case relates to a stroke patient
and is currently being re-investigated within the Division.
24 Hour Courtesy Calls:
There were 3 failures to make the 24 hour courtesy calls in February; this is a higher level of
failure than recorded in previous months. One failure was in relation to a Renal Unit
complaint, one was in relation to a Trauma and Orthopaedic complaint and the other related
to an Estates and Facilities complaint.
Parliamentary and Health Service Ombudsman (PHSO):
One new case was referred to the PHSO in February; this complaint relates to a Division 2
Oral Surgery complaint.
4
In February the Trust received the Ombudsman’s final report for a complaint regarding the
Emergency department. The complaint also refers to the patient’s GP and Mental Health
service provider. The final report indicates that the Ombudsman is upholding the complaint
and making recommendations including that each organisation involved should pay financial
recompense to the patient and her mother for the injustice they have suffered as a result of
the failings identified. The Trust has now written a letter of apology to the complainant and
paid recompense in line with the PHSO recommendations. The Trust must also provide the
complainant and the PHSO with a copy of the action plan in relation to this case by May
2016.
The number of Ipswich Hospital complaints that the Ombudsman upholds or partially
upholds is low when compared with the national average. To date, in 2015/16 25% of
complaints referred to the PHSO have been upheld or partially upheld, compared with the
national average of 45%.
There are currently seven Ipswich Hospital cases under investigation by the PHSO.
94% of the Division 2 courtesy calls were made in February, the one failure relates to a
Trauma and Orthopaedic case.
Patient Advice and Liaison Service:
PALS handled 210 contacts in February, following a higher than average number of contacts
being made in January (241). The usual range of contacts for PALS each month is between
180 and 220. Approximately 50% of the calls to PALS are graded as PALS 1 contacts as
they relate to straightforward matters such as signposting other service providers, lost
property, Access to Health Record requests, car park enquires and families trying to contact
inpatients.
Other matters, requiring some element of liaising or investigation, are graded as PALS 2.
Issues raised include:-
Cardiology patients being unable to contact the Cardiology department.
Urology patients chasing surgery or procedures dates.
Neurology patients chasing appointments
Colorectal patients chasing appointments and results.
Patients chasing Dermatology appointments.
Patients chasing Eye Clinic appointments
Patients chasing Trauma and Orthopaedic appointments.
Care and communication issues occurring on wards.
The PALS team handled 17 ward related concerns in February. This compares with 13 in
January, 20 in December and 24 in November. No particular ward stands out as having
more concerns raised through PALS but in general the matters raised by inpatients and their
families relate to discharge arrangements and families not knowing who to speak to on the
wards.
In each case where PALS have liaised with families and ward staff the issues raised have
been resolved without the need to raise a formal complaint.
5
Family Carers of People with Dementia CQUIN
Dementia family carer CQUIN – to provide family carers of patients with dementia the
opportunity to provide feedback on support given to them by the hospital:
58 dementia carer packs were distributed – this was 100% of the carers identified who met
the CQUIN criteria.
10 follow up feedback calls were undertaken with all agreeing to take part. 90% felt confident
to leave their relative in our care; 100% felt supported some or all of the time. 90% reported
receiving a carers’ pack.
FINANCE
EXECUTIVE SUMMARY
Forecast outturn in 2015/16 of £22.1m
YTD at Month 11, Trust is £5.9m adrift of plan, deficit of £22.8m; actions in M12 will
adjust to FOT projection (including TPP)
Agreement with Lead Commissioner re 15/16 contract position – reduces financial
risk and improved cash flow in-year
Focus on Workforce initiatives to reduce Agency spend
Received loan to support working capital £18.5m deficit plan
FINANCIAL POSITION
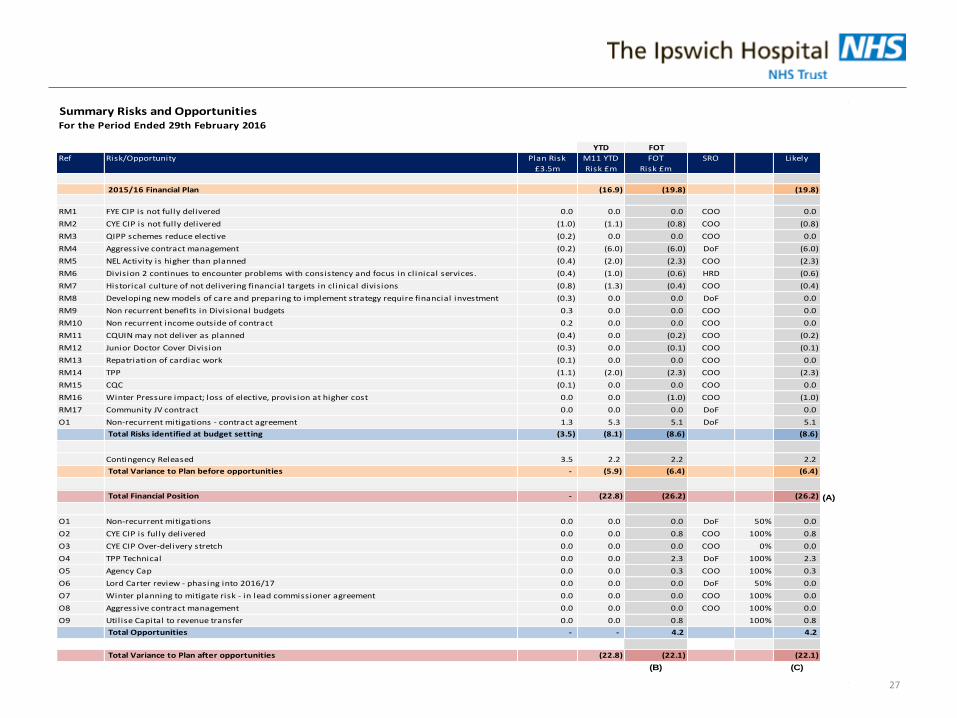
The schedule of risks presented shows how the deficit of £22.8m at Month 11 (an adverse
variance to plan of £5.9m) reflects the increased risks facing the organisation against the
initial assessment at budget approval. The Risk & Opportunities schedule builds on the
Board-approved financial plan for 2015/16 of a deficit of £19.8m.
Community budgets are included within the Trust’s financial reporting; to date, there is
minimal variance to plan YTD and forecast, although a risk remains regarding continence
expenditure.
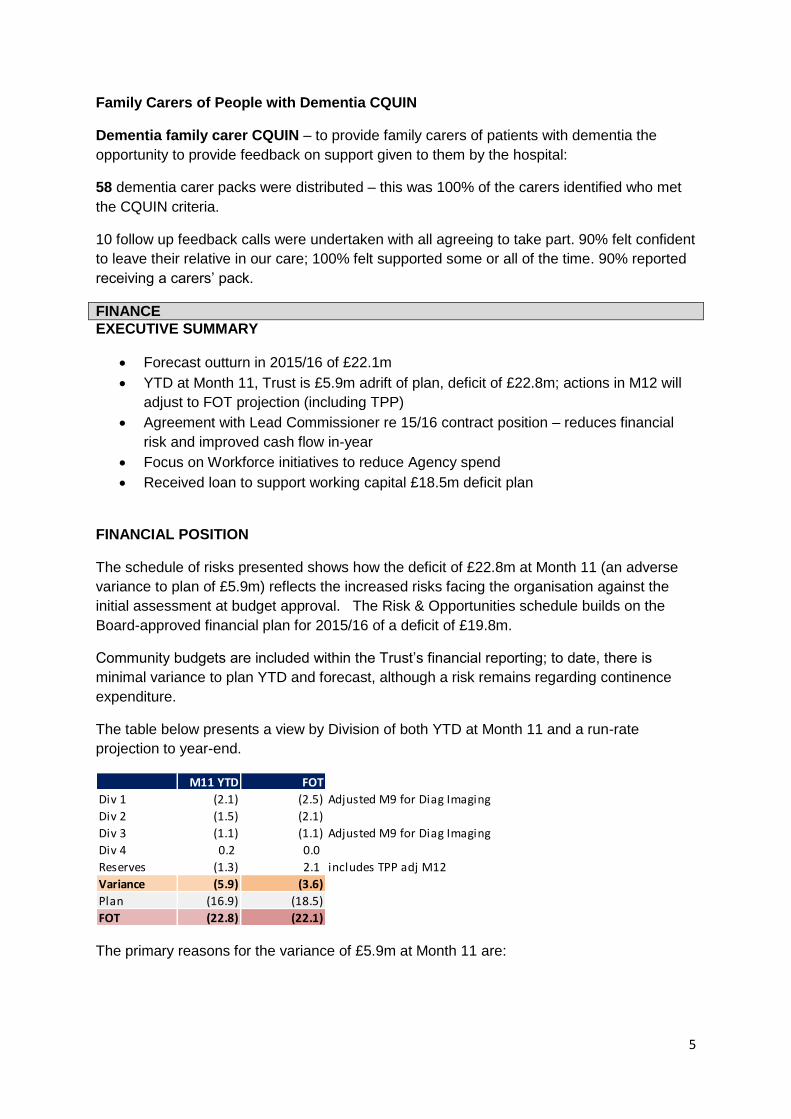
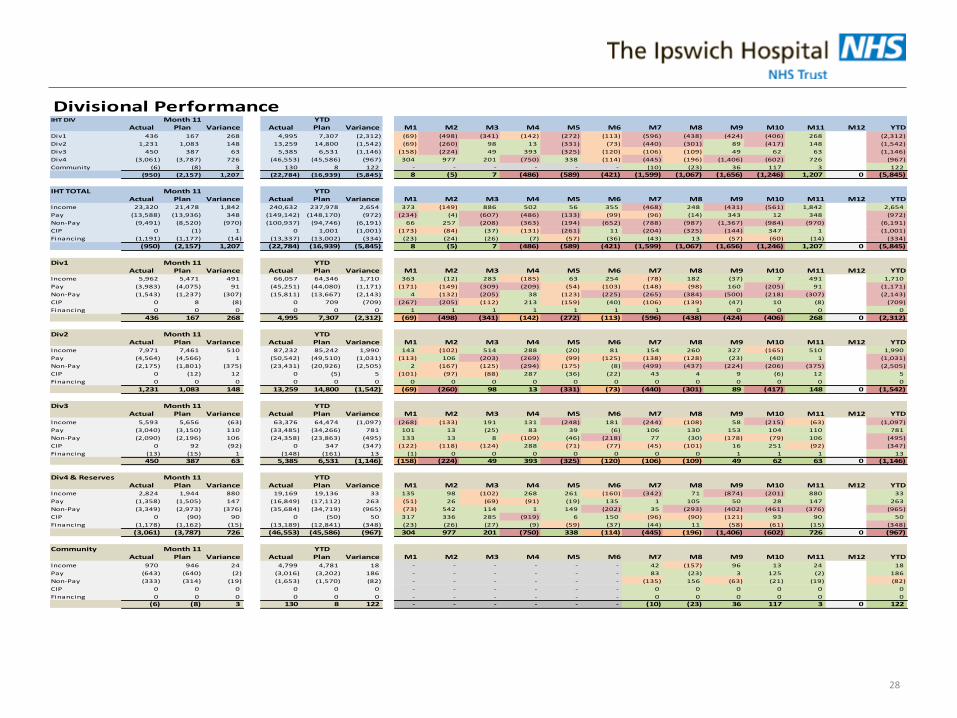
The table below presents a view by Division of both YTD at Month 11 and a run-rate
projection to year-end.
The primary reasons for the variance of £5.9m at Month 11 are:
M11 YTD FOT
Div 1 (2.1) (2.5) Adjusted M9 for Diag Imaging
Div 2 (1.5) (2.1)
Div 3 (1.1) (1.1) Adjusted M9 for Diag Imaging
Div 4 0.2 0.0
Reserves (1.3) 2.1 includes TPP adj M12
Variance (5.9) (3.6)
Plan (16.9) (18.5)
FOT (22.8) (22.1)
6
Delayed Transfers of Care; these impact on the ability of the trust to discharge
patients into community care once the appropriate level of hospital-based care has
been concluded; this is a significant part of the Division 1 CIP plan
Higher than plan Non-elective activity; this impacts on capacity within the hospital
and also is a primary contributor to the level of agency staffing deployed within the
organisation
The Trust is undertaking a number of initiatives aimed at reducing the level of agency
expenditure across the organisation in line with the targets for agency reduction
issued centrally. Agency expenditure has reduced in recent months, and the Trust
achieved the 6% target in Month 11; Pay was higher than the previous month and is
anticipated to stabilise for the remainder of Quarter 4 and achieve the 6% target even
with increased activity.
The extrapolated run-rate from the M11 position to year end remains £26m, after release of
contingency and including estimate of financial pressures arising from additional activity over
the winter period. However, recognition of the investment in TPP during 2015/16 and
transfer of £0.75m from Capital to Revenue resource will result in the FOT £22.1m deficit
being achieved.
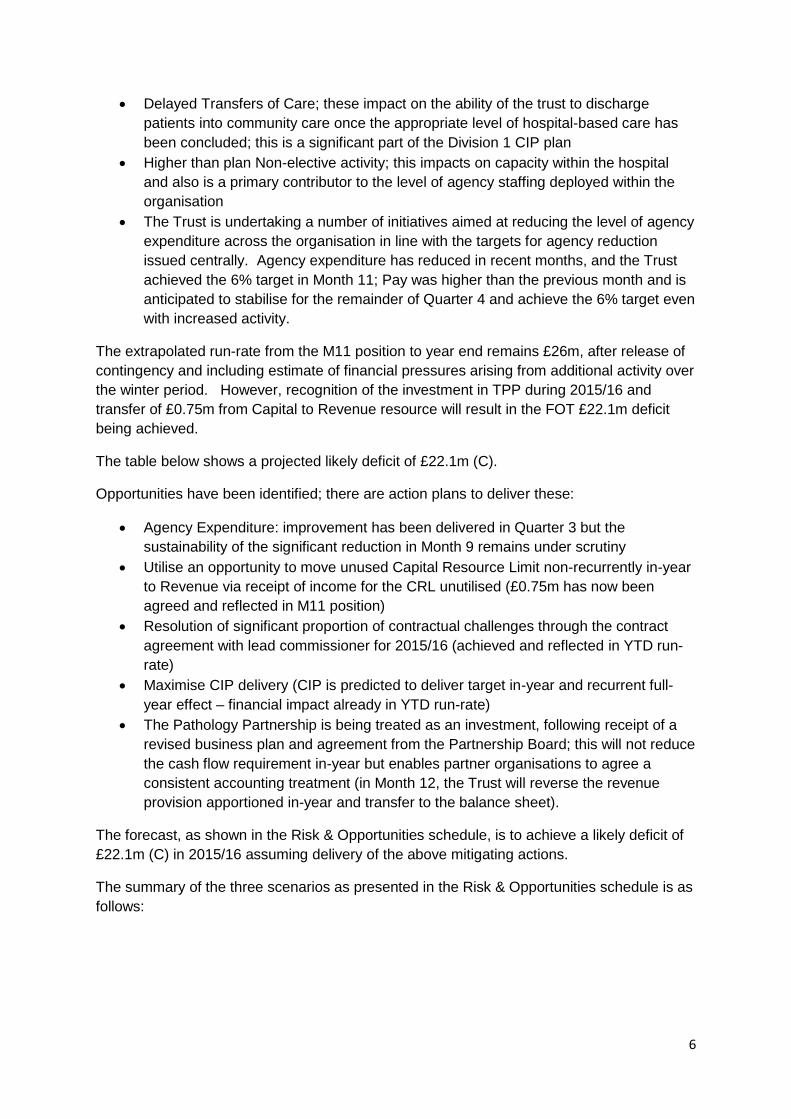
The table below shows a projected likely deficit of £22.1m (C).
Opportunities have been identified; there are action plans to deliver these:
Agency Expenditure: improvement has been delivered in Quarter 3 but the
sustainability of the significant reduction in Month 9 remains under scrutiny
Utilise an opportunity to move unused Capital Resource Limit non-recurrently in-year
to Revenue via receipt of income for the CRL unutilised (£0.75m has now been
agreed and reflected in M11 position)
Resolution of significant proportion of contractual challenges through the contract
agreement with lead commissioner for 2015/16 (achieved and reflected in YTD run-
rate)
Maximise CIP delivery (CIP is predicted to deliver target in-year and recurrent full-
year effect – financial impact already in YTD run-rate)
The Pathology Partnership is being treated as an investment, following receipt of a
revised business plan and agreement from the Partnership Board; this will not reduce
the cash flow requirement in-year but enables partner organisations to agree a
consistent accounting treatment (in Month 12, the Trust will reverse the revenue
provision apportioned in-year and transfer to the balance sheet).
The forecast, as shown in the Risk & Opportunities schedule, is to achieve a likely deficit of
£22.1m (C) in 2015/16 assuming delivery of the above mitigating actions.
The summary of the three scenarios as presented in the Risk & Opportunities schedule is as
follows:
7
The Trust submitted an application for cash support to replace the interim working capital
facility in October; this was approved by the Department of Health in December and has now
been received by the Trust and has been used to repay the working capital facility; the sum
in both counts was £17.3m. The Trust has received a further £1.3m cash support in Month
11, reflecting the additional cash resource required against the £18.5m revised plan. There
is a set of criteria to which the Trust must adhere as part of the loan agreement conditions;
this is being reported to the executive via the Finance & Performance Committee.
NEXT STEPS
Monitoring of the performance of Divisions against Financial Recovery Plans agreed at the
Divisional Board-to-Board meetings continues, with Executive reviews with Divisions as
required where performance is more than £50k adrift from plans. At Month 11, Divisions are
delivering (individually and collectively) the revised projections within their Financial
Recovery Plans.
OPERATIONAL PERFORMANCE
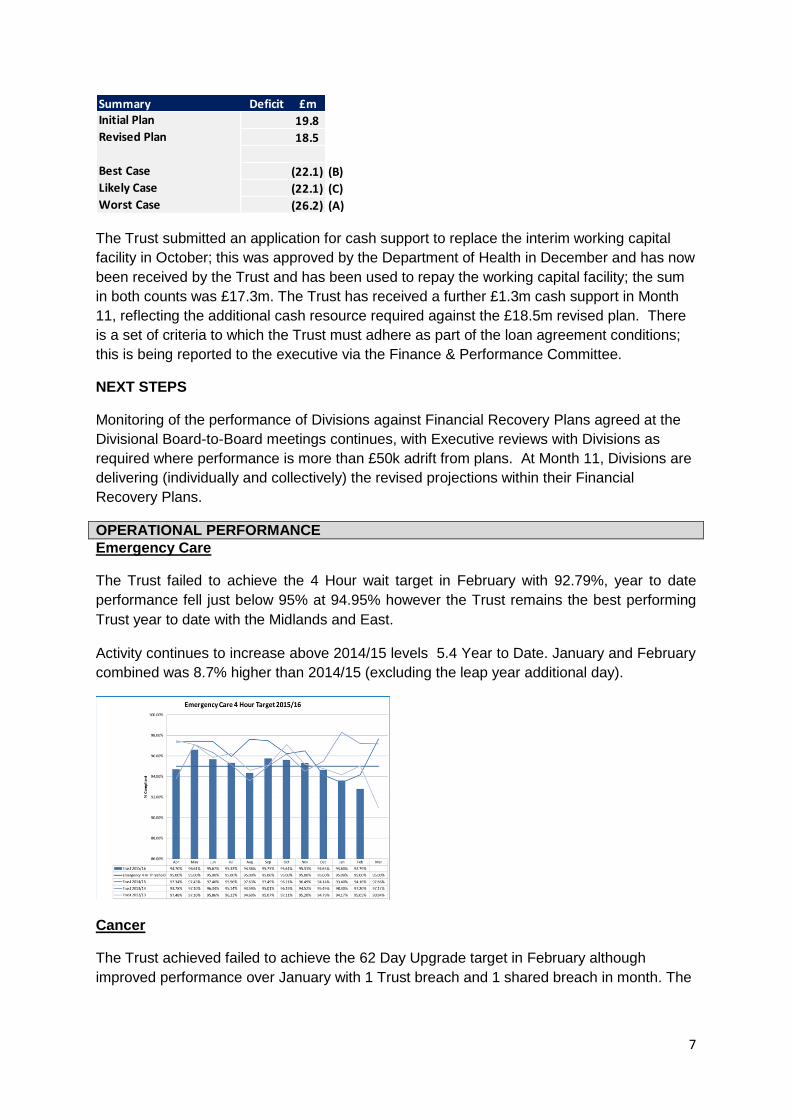
Emergency Care
The Trust failed to achieve the 4 Hour wait target in February with 92.79%, year to date
performance fell just below 95% at 94.95% however the Trust remains the best performing
Trust year to date with the Midlands and East.
Activity continues to increase above 2014/15 levels 5.4 Year to Date. January and February
combined was 8.7% higher than 2014/15 (excluding the leap year additional day).
Cancer
The Trust achieved failed to achieve the 62 Day Upgrade target in February although
improved performance over January with 1 Trust breach and 1 shared breach in month. The
Summary Deficit £m
19.8
18.5
(22.1) (B)
(22.1) (C)
(26.2) (A)
Initial Plan
Best Case
Likely Case
Worst Case
Revised Plan
8
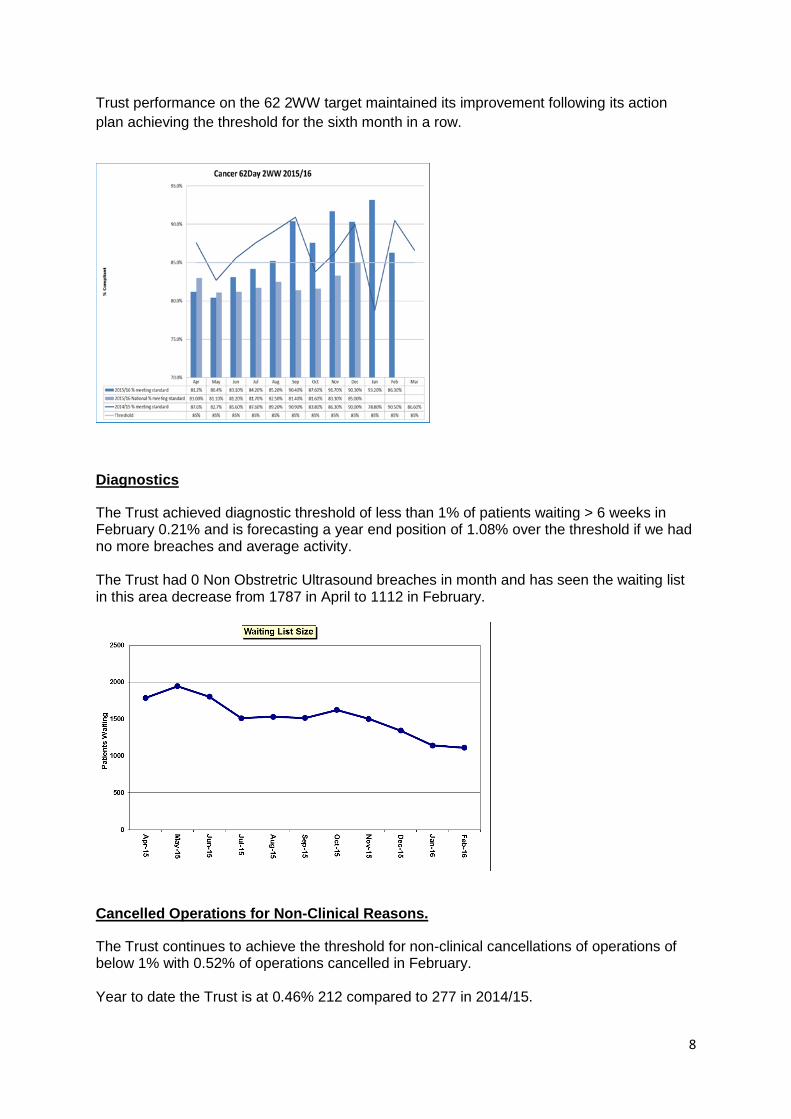
Trust performance on the 62 2WW target maintained its improvement following its action
plan achieving the threshold for the sixth month in a row.
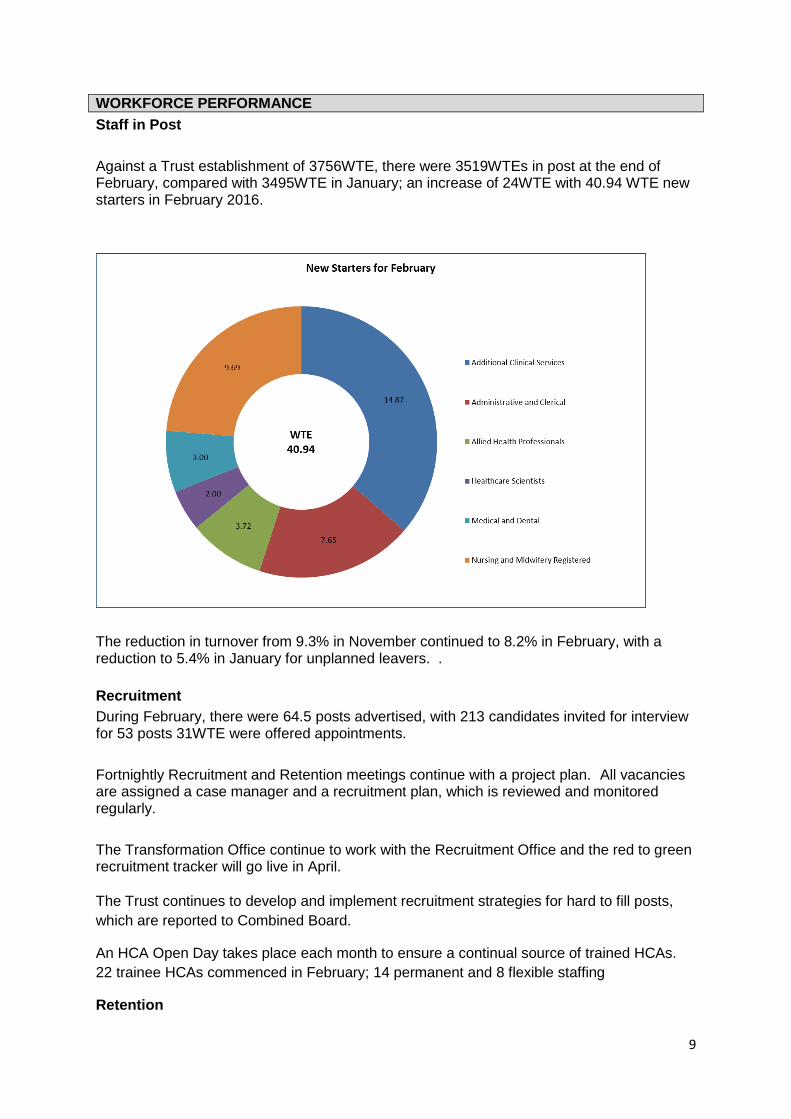
Diagnostics
The Trust achieved diagnostic threshold of less than 1% of patients waiting > 6 weeks in February 0.21% and is forecasting a year end position of 1.08% over the threshold if we had no more breaches and average activity. The Trust had 0 Non Obstretric Ultrasound breaches in month and has seen the waiting list in this area decrease from 1787 in April to 1112 in February.
Cancelled Operations for Non-Clinical Reasons.
The Trust continues to achieve the threshold for non-clinical cancellations of operations of below 1% with 0.52% of operations cancelled in February. Year to date the Trust is at 0.46% 212 compared to 277 in 2014/15.
9
WORKFORCE PERFORMANCE
Staff in Post
Against a Trust establishment of 3756WTE, there were 3519WTEs in post at the end of February, compared with 3495WTE in January; an increase of 24WTE with 40.94 WTE new starters in February 2016.
The reduction in turnover from 9.3% in November continued to 8.2% in February, with a reduction to 5.4% in January for unplanned leavers. .
Recruitment
During February, there were 64.5 posts advertised, with 213 candidates invited for interview for 53 posts 31WTE were offered appointments.
Fortnightly Recruitment and Retention meetings continue with a project plan. All vacancies are assigned a case manager and a recruitment plan, which is reviewed and monitored regularly.
The Transformation Office continue to work with the Recruitment Office and the red to green recruitment tracker will go live in April.
The Trust continues to develop and implement recruitment strategies for hard to fill posts,
which are reported to Combined Board.
An HCA Open Day takes place each month to ensure a continual source of trained HCAs.
22 trainee HCAs commenced in February; 14 permanent and 8 flexible staffing
Retention
10
Whilst there is a continuing focus on recruitment into the Trust, a programme has been
developed and is being implemented to gain a better understanding of why staff leave the
Trust and to mitigate the reasons.
National and regional data is being accessed to allow comparison of the Trust against other NHS employers. A staff workshop approach is being used to gain a more detailed immediate understanding of why staff remain with the Trust and what actions would support improved retention A Trust wide programme to exit data from those leaving is being developed and rolled out, enabling trends and hotspots to be identified. A revised exit interview process and paperwork has been launched across the Trust. Agency Workers
There are daily staffing reviews taking place to ensure that there are appropriate staffing levels across the hospital. A number of agencies provide workers to the hospital on a flexible arrangement via the framework agreements, when these are authorised by a member of the Trust Executive.
The daily staffing reviews and agency workstream programme continues. An internal audit on the agency utilisation and booking arrangements is scheduled to commence in March. Staff Volunteering Programme
In February 2016 there was a reduction in the usage of Staff Volunteers. Fewer day to day
usage of staff volunteers and a reduction in the number of multiple requests in one day ; this
has helped to increase the fill rate as shown below.
The number of staff volunteers in each team has remained static during February.
Number of requests vs fulfilled requests up to and including 28th February 2016.
Requests Fulfilled %
Bed making 33 13 39
Portering 12 11 92
Mealtime Support 92 34 37
Admin Support 6 6 100
Pharmacy Courier 0 0 0
Total 143 64 45%
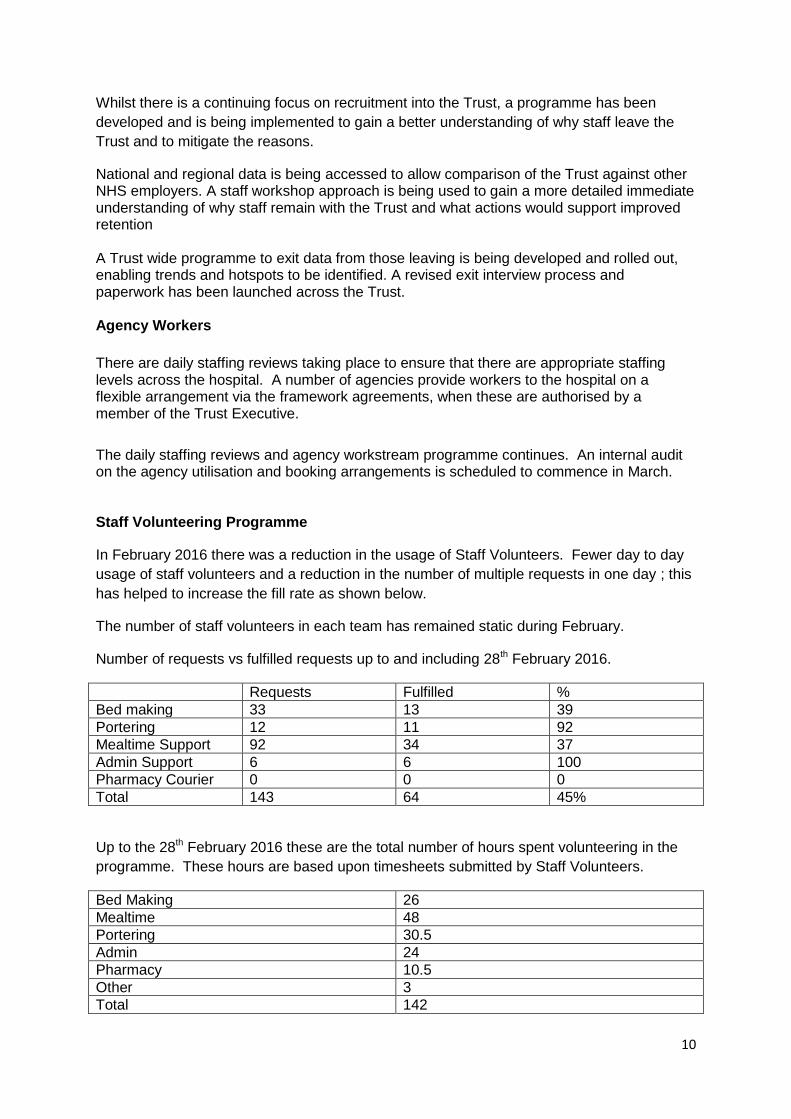
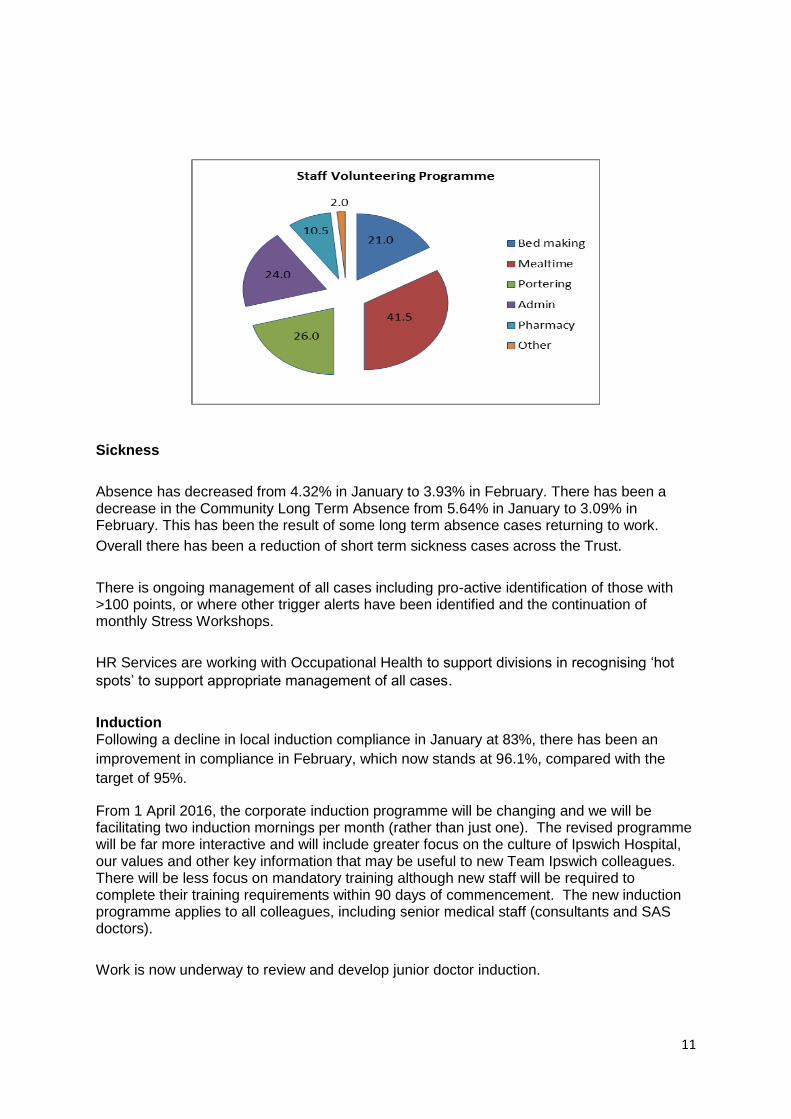
Up to the 28th February 2016 these are the total number of hours spent volunteering in the
programme. These hours are based upon timesheets submitted by Staff Volunteers.
Bed Making 26
Mealtime 48
Portering 30.5
Admin 24
Pharmacy 10.5
Other 3
Total 142
11
Sickness
Absence has decreased from 4.32% in January to 3.93% in February. There has been a decrease in the Community Long Term Absence from 5.64% in January to 3.09% in February. This has been the result of some long term absence cases returning to work.
Overall there has been a reduction of short term sickness cases across the Trust.
There is ongoing management of all cases including pro-active identification of those with >100 points, or where other trigger alerts have been identified and the continuation of monthly Stress Workshops.
HR Services are working with Occupational Health to support divisions in recognising ‘hot
spots’ to support appropriate management of all cases.
Induction Following a decline in local induction compliance in January at 83%, there has been an
improvement in compliance in February, which now stands at 96.1%, compared with the
target of 95%.
From 1 April 2016, the corporate induction programme will be changing and we will be facilitating two induction mornings per month (rather than just one). The revised programme will be far more interactive and will include greater focus on the culture of Ipswich Hospital, our values and other key information that may be useful to new Team Ipswich colleagues. There will be less focus on mandatory training although new staff will be required to complete their training requirements within 90 days of commencement. The new induction programme applies to all colleagues, including senior medical staff (consultants and SAS doctors).
Work is now underway to review and develop junior doctor induction.
12
Mandatory Training
Mandatory Training compliance saw a minor reduction from to 88% in January to 87.7% in February against the target of 95%.
From 1 April 2016, the mandatory training programme will be changing. A mandatory training handbook with associated e-Assessment will be issued on an annual basis to all staff (including consultant and SAS grade doctors, volunteers and bank staff) and this will be valid from 1 April to 31 March of each year. The mandatory training handbook and e-Assessment should be completed by all staff between 1 April and 30 June of the year of issue. All staff will be required to read the handbook and complete the correct E-Assessment applicable to their role. Some subjects cannot be covered by the E-Assessment and necessitate a face to face course and therefore colleagues will be required to book and undertake these face to face mandatory courses, relevant to their role, as and when compliance expires. The handbooks are due to be delivered to departments from the 24th March onwards and a communication/information campaign is currently underway to advise staff of this change. Work will shortly be undertaken to update the divisional mandatory training compliance workbooks to be in line with the new mandatory training system.
Performance Development Review
Compliance has seen an increase in February to 85.1% against the Trust target of 85%.
The launch of the new appraisal documentation is underway and the new documentation will come into effect from 1 April 2016.
Training in the application of values based appraisal is being developed, with a pilot session to take place on 13th April 2016 – following this, regular training sessions for managers will occur, a train the trainer programme is also being looked into. Trust wide communications will shortly be taking place, along with guidance documentation for staff.
Job Planning As at 29 February 2016 20.6% job plans Trustwide had been signed and completed on the
e-job plan system with 83.%% engagement with e-job planning at different stages of
completion. Work progresses to agree the allocation of educational supervision time within
job plans. A meeting with LNC and Divisional representatives was held to agree the
allocation and the proposal is for agreement by the LNC on 4 April 2016. Following this, the
draft job plans will be submitted for approval.
13
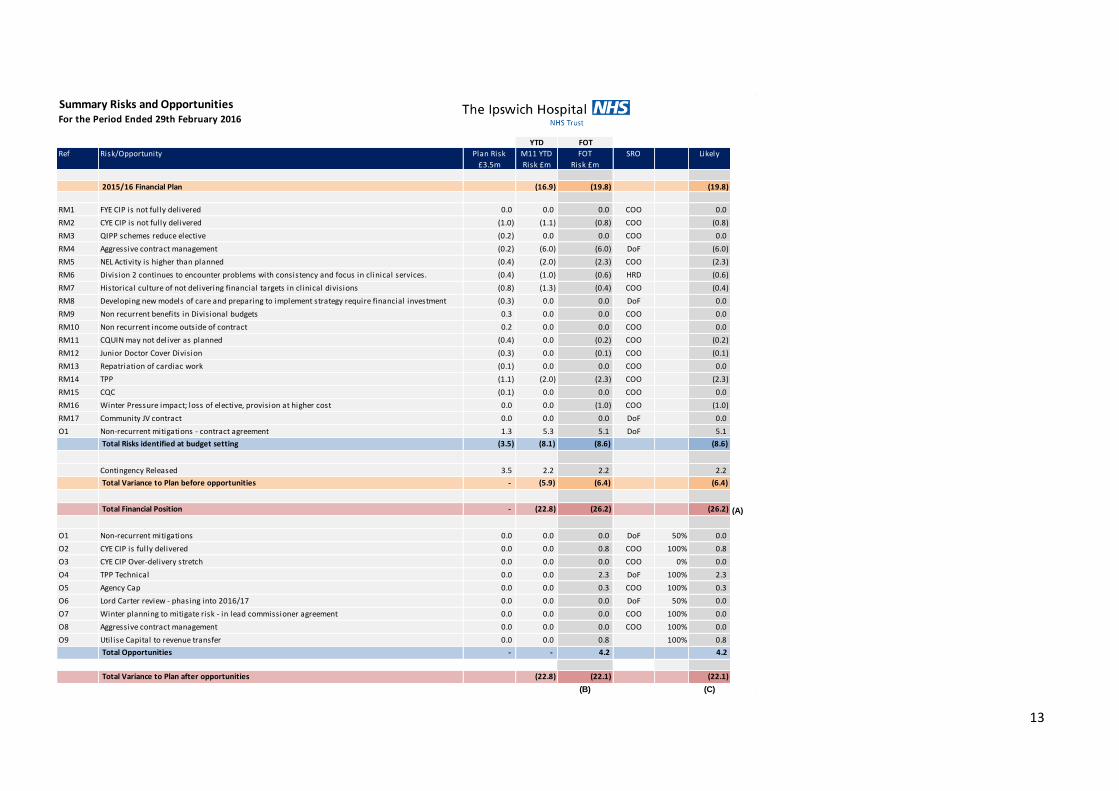
Summary Risks and OpportunitiesFor the Period Ended 29th February 2016
YTD FOT
Ref Risk/Opportunity Plan Risk
£3.5m
M11 YTD
Risk £m
FOT
Risk £m
SRO Likely
2015/16 Financial Plan (16.9) (19.8) (19.8)
RM1 FYE CIP is not fully delivered 0.0 0.0 0.0 COO 0.0
RM2 CYE CIP is not fully delivered (1.0) (1.1) (0.8) COO (0.8)
RM3 QIPP schemes reduce elective (0.2) 0.0 0.0 COO 0.0
RM4 Aggressive contract management (0.2) (6.0) (6.0) DoF (6.0)
RM5 NEL Activity is higher than planned (0.4) (2.0) (2.3) COO (2.3)
RM6 Division 2 continues to encounter problems with consistency and focus in clinical services. (0.4) (1.0) (0.6) HRD (0.6)
RM7 Historical culture of not delivering financial targets in clinical divisions (0.8) (1.3) (0.4) COO (0.4)
RM8 Developing new models of care and preparing to implement strategy require financial investment (0.3) 0.0 0.0 DoF 0.0
RM9 Non recurrent benefits in Divisional budgets 0.3 0.0 0.0 COO 0.0
RM10 Non recurrent income outside of contract 0.2 0.0 0.0 COO 0.0
RM11 CQUIN may not deliver as planned (0.4) 0.0 (0.2) COO (0.2)
RM12 Junior Doctor Cover Division (0.3) 0.0 (0.1) COO (0.1)
RM13 Repatriation of cardiac work (0.1) 0.0 0.0 COO 0.0
RM14 TPP (1.1) (2.0) (2.3) COO (2.3)
RM15 CQC (0.1) 0.0 0.0 COO 0.0
RM16 Winter Pressure impact; loss of elective, provision at higher cost 0.0 0.0 (1.0) COO (1.0)
RM17 Community JV contract 0.0 0.0 0.0 DoF 0.0
O1 Non-recurrent mitigations - contract agreement 1.3 5.3 5.1 DoF 5.1
Total Risks identified at budget setting (3.5) (8.1) (8.6) (8.6)
Contingency Released 3.5 2.2 2.2 2.2
Total Variance to Plan before opportunities - (5.9) (6.4) (6.4)
Total Financial Position - (22.8) (26.2) (26.2) (A)
O1 Non-recurrent mitigations 0.0 0.0 0.0 DoF 50% 0.0
O2 CYE CIP is fully delivered 0.0 0.0 0.8 COO 100% 0.8
O3 CYE CIP Over-delivery stretch 0.0 0.0 0.0 COO 0% 0.0
O4 TPP Technical 0.0 0.0 2.3 DoF 100% 2.3
O5 Agency Cap 0.0 0.0 0.3 COO 100% 0.3
O6 Lord Carter review - phasing into 2016/17 0.0 0.0 0.0 DoF 50% 0.0
O7 Winter planning to mitigate risk - in lead commissioner agreement 0.0 0.0 0.0 COO 100% 0.0
O8 Aggressive contract management 0.0 0.0 0.0 COO 100% 0.0
O9 Utilise Capital to revenue transfer 0.0 0.0 0.8 100% 0.8
Total Opportunities - - 4.2 4.2
Total Variance to Plan after opportunities (22.8) (22.1) (22.1)
(B) (C)
Trust Quality & Performance Report
March2016
1
Contents
2
Description Page
Quality 3
Finance 24
Operations 39
Workforce 51
Quality
3
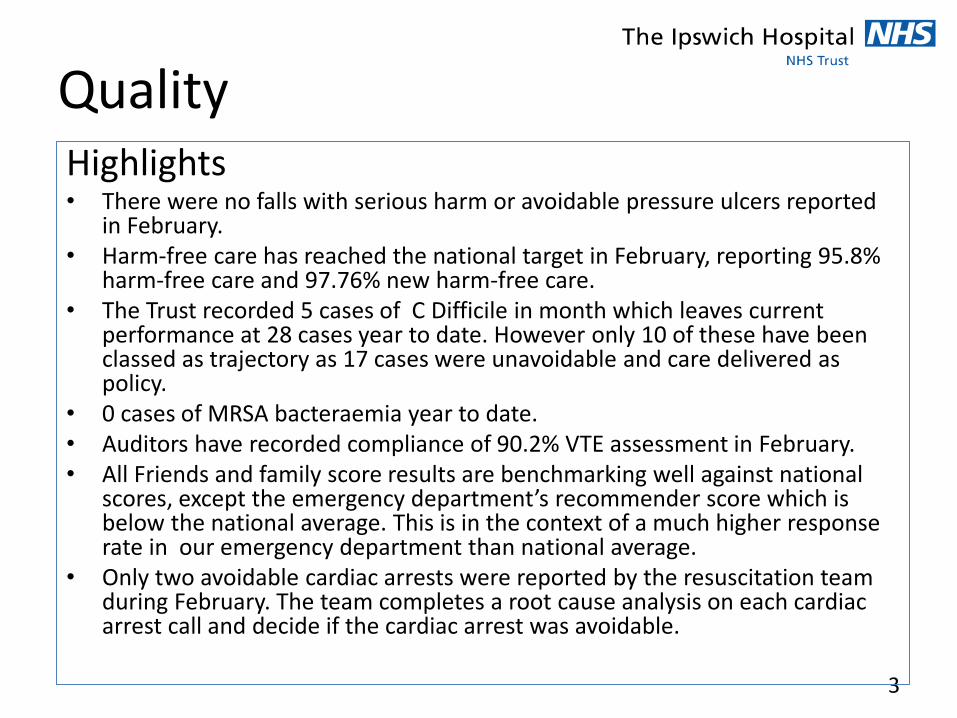
Highlights • There were no falls with serious harm or avoidable pressure ulcers reported
in February. • Harm-free care has reached the national target in February, reporting 95.8%
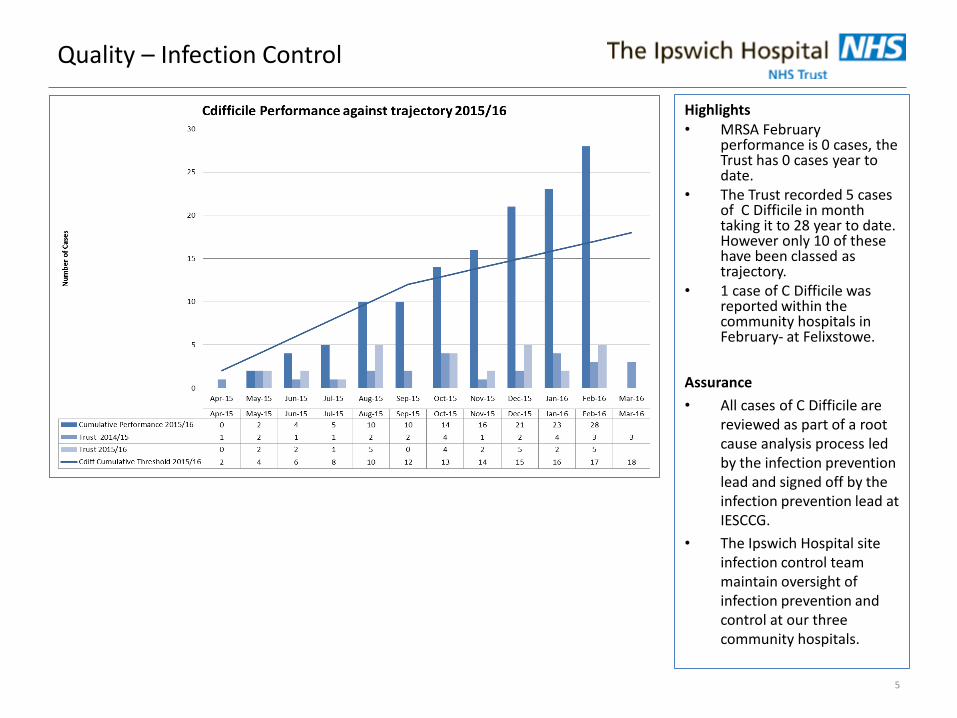
harm-free care and 97.76% new harm-free care. • The Trust recorded 5 cases of C Difficile in month which leaves current
performance at 28 cases year to date. However only 10 of these have been classed as trajectory as 17 cases were unavoidable and care delivered as policy.
• 0 cases of MRSA bacteraemia year to date. • Auditors have recorded compliance of 90.2% VTE assessment in February. • All Friends and family score results are benchmarking well against national
scores, except the emergency department’s recommender score which is below the national average. This is in the context of a much higher response rate in our emergency department than national average.
• Only two avoidable cardiac arrests were reported by the resuscitation team during February. The team completes a root cause analysis on each cardiac arrest call and decide if the cardiac arrest was avoidable.
Quality – Harm Free Care
4
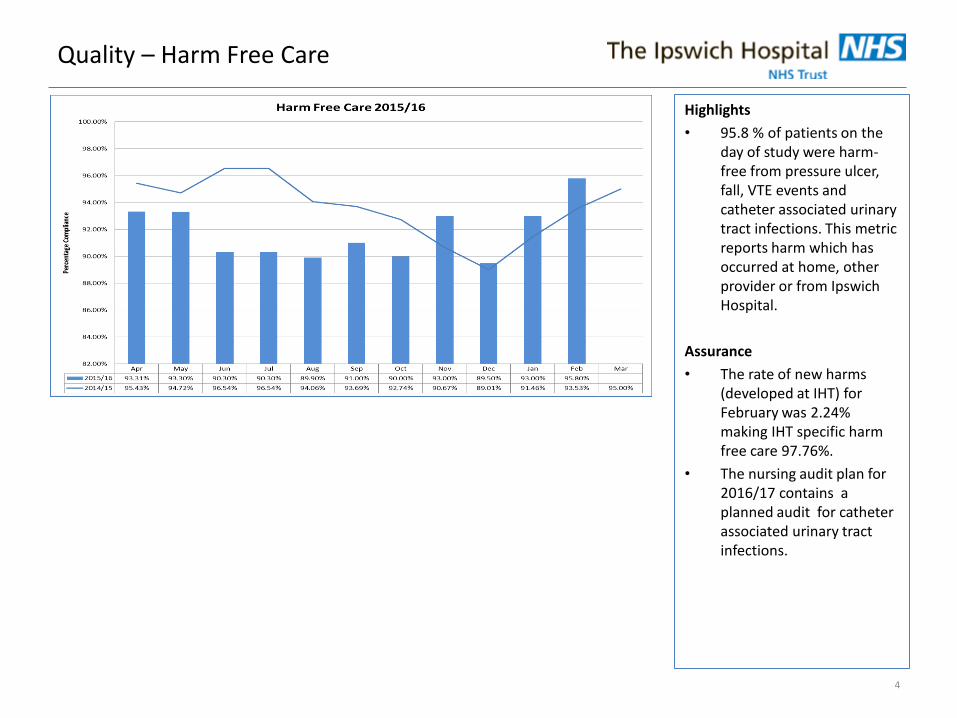
Highlights
• 95.8 % of patients on the day of study were harm-free from pressure ulcer, fall, VTE events and catheter associated urinary tract infections. This metric reports harm which has occurred at home, other provider or from Ipswich Hospital.
Assurance
• The rate of new harms (developed at IHT) for February was 2.24% making IHT specific harm free care 97.76%.
• The nursing audit plan for 2016/17 contains a planned audit for catheter associated urinary tract infections.
Quality – Infection Control
5
Highlights • MRSA February
performance is 0 cases, the Trust has 0 cases year to date.
• The Trust recorded 5 cases of C Difficile in month taking it to 28 year to date. However only 10 of these have been classed as trajectory.
• 1 case of C Difficile was reported within the community hospitals in February- at Felixstowe.
Assurance
• All cases of C Difficile are reviewed as part of a root cause analysis process led by the infection prevention lead and signed off by the infection prevention lead at IESCCG.
• The Ipswich Hospital site infection control team maintain oversight of infection prevention and control at our three community hospitals.
Quality – Patient Falls at Ward level
6
Highlights
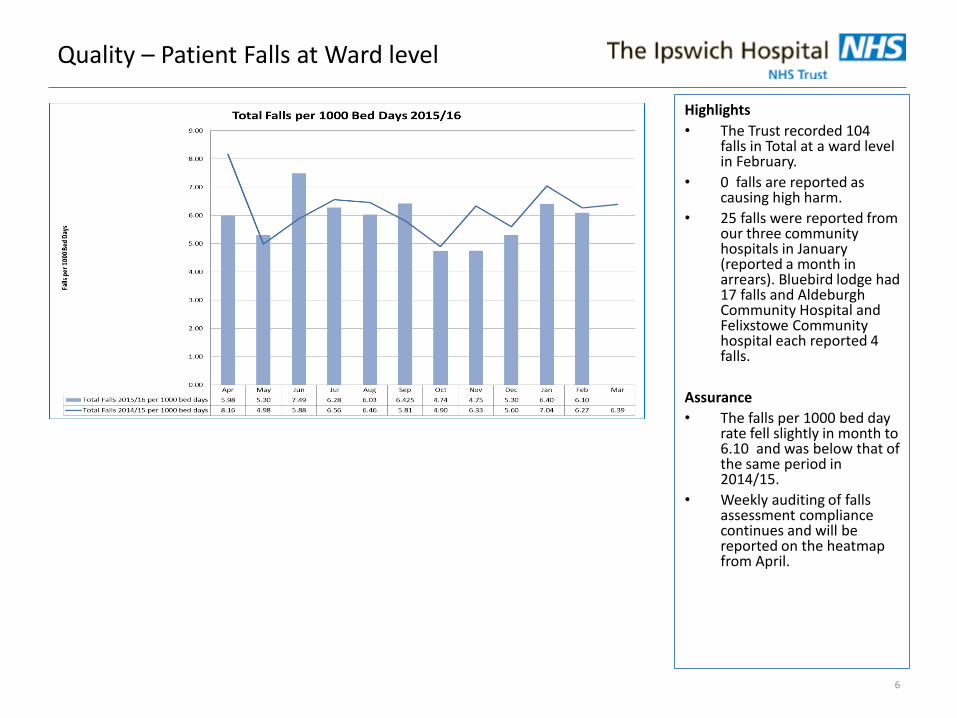
• The Trust recorded 104 falls in Total at a ward level in February.
• 0 falls are reported as causing high harm.
• 25 falls were reported from our three community hospitals in January (reported a month in arrears). Bluebird lodge had 17 falls and Aldeburgh Community Hospital and Felixstowe Community hospital each reported 4 falls.
Assurance
• The falls per 1000 bed day rate fell slightly in month to 6.10 and was below that of the same period in 2014/15.
• Weekly auditing of falls assessment compliance continues and will be reported on the heatmap from April.
Quality – Pressure Ulcers
7
Highlights
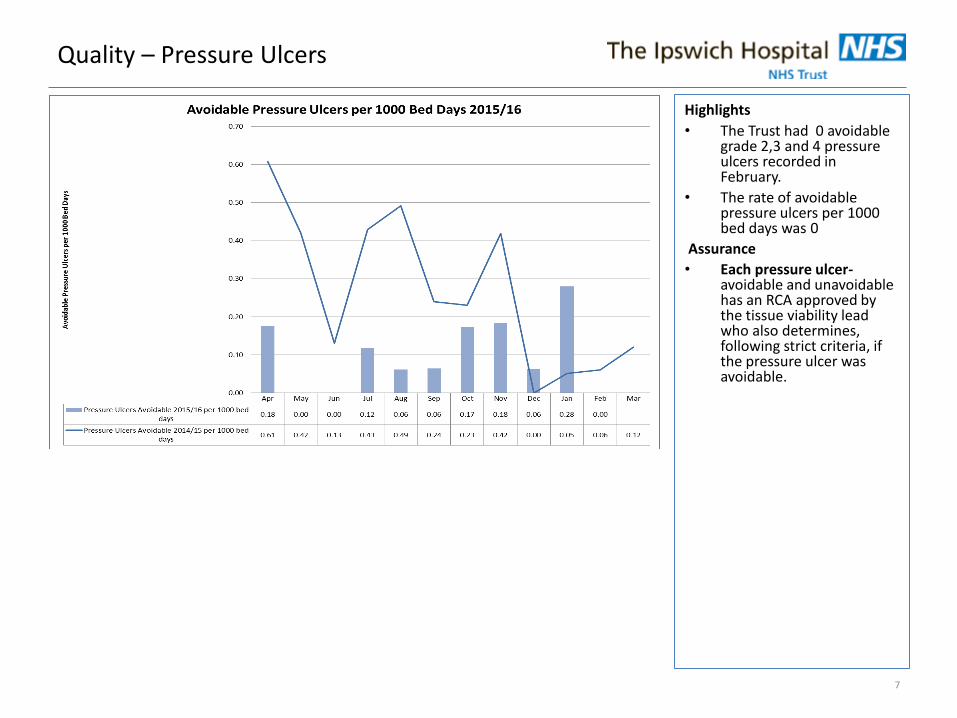
• The Trust had 0 avoidable grade 2,3 and 4 pressure ulcers recorded in February.
• The rate of avoidable pressure ulcers per 1000 bed days was 0
Assurance
• Each pressure ulcer- avoidable and unavoidable has an RCA approved by the tissue viability lead who also determines, following strict criteria, if the pressure ulcer was avoidable.
Quality – Patient Safety VTE
8
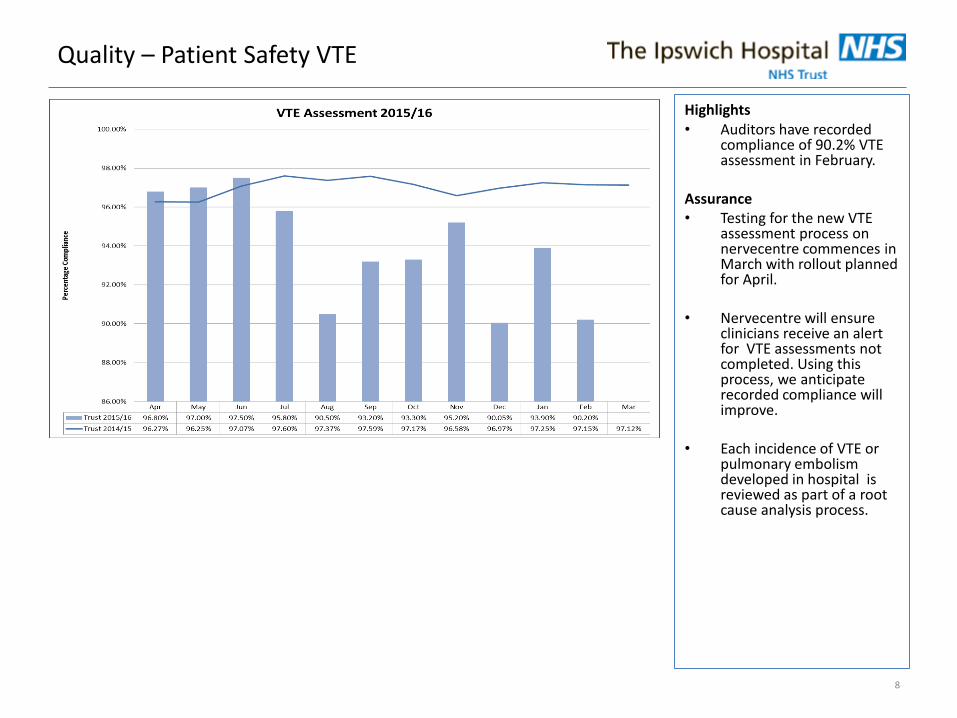
Highlights • Auditors have recorded
compliance of 90.2% VTE assessment in February.
Assurance • Testing for the new VTE
assessment process on nervecentre commences in March with rollout planned for April.
• Nervecentre will ensure
clinicians receive an alert for VTE assessments not completed. Using this process, we anticipate recorded compliance will improve.
• Each incidence of VTE or pulmonary embolism developed in hospital is reviewed as part of a root cause analysis process.
Quality – Patient Safety SIRI
9
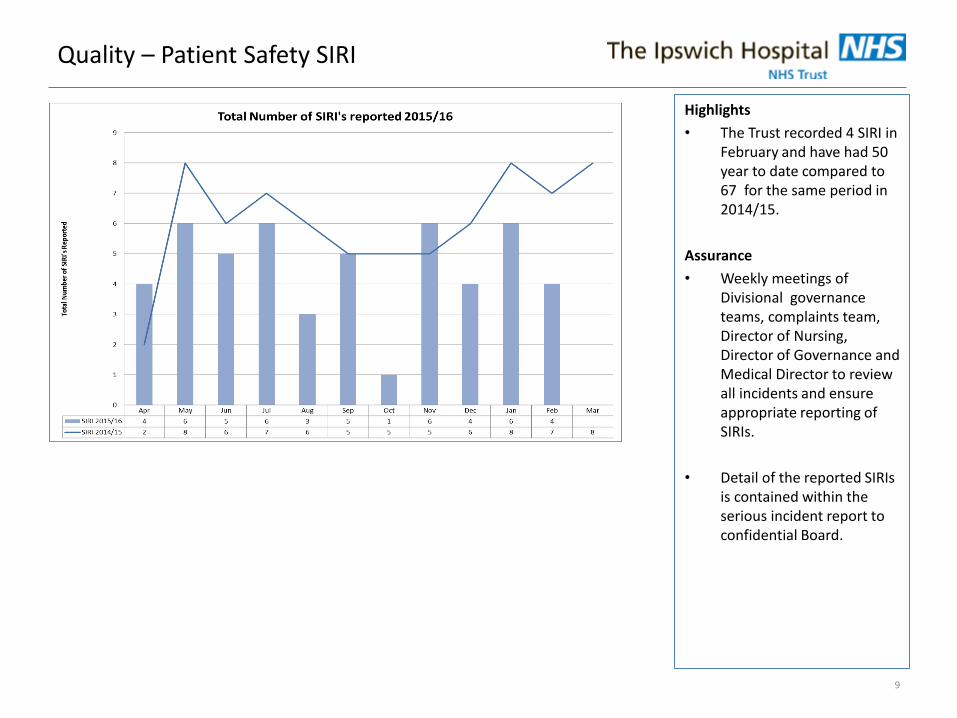
Highlights
• The Trust recorded 4 SIRI in February and have had 50 year to date compared to 67 for the same period in 2014/15.
Assurance
• Weekly meetings of Divisional governance teams, complaints team, Director of Nursing, Director of Governance and Medical Director to review all incidents and ensure appropriate reporting of SIRIs.
• Detail of the reported SIRIs is contained within the serious incident report to confidential Board.
Quality – Patient Experience Inpatients
10
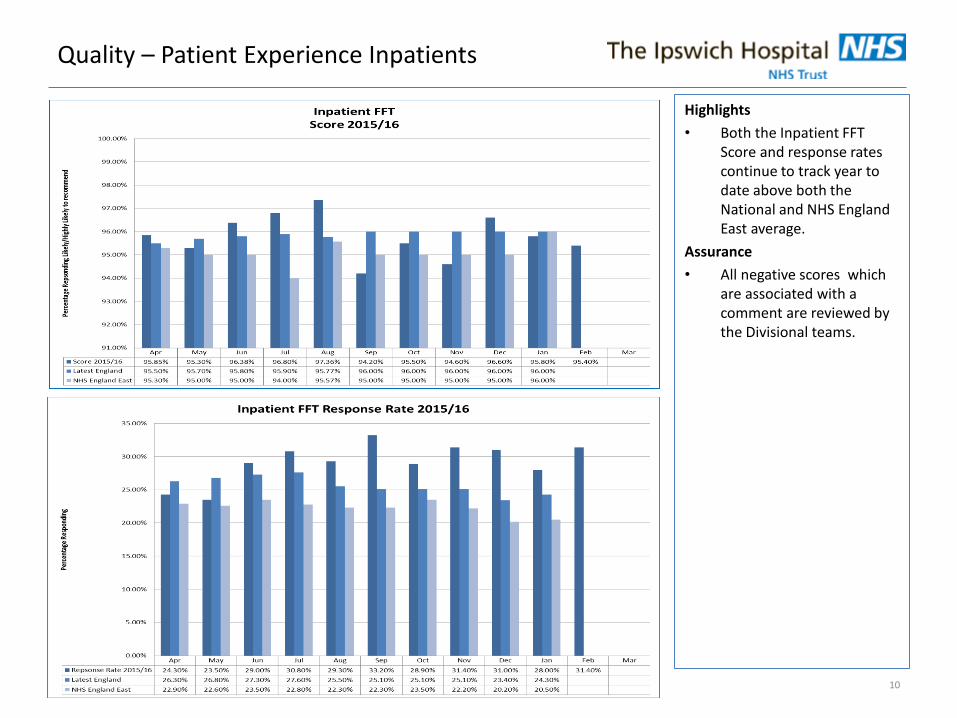
Highlights
• Both the Inpatient FFT Score and response rates continue to track year to date above both the National and NHS England East average.
Assurance
• All negative scores which are associated with a comment are reviewed by the Divisional teams.
Quality – Patient Experience Outpatients
11
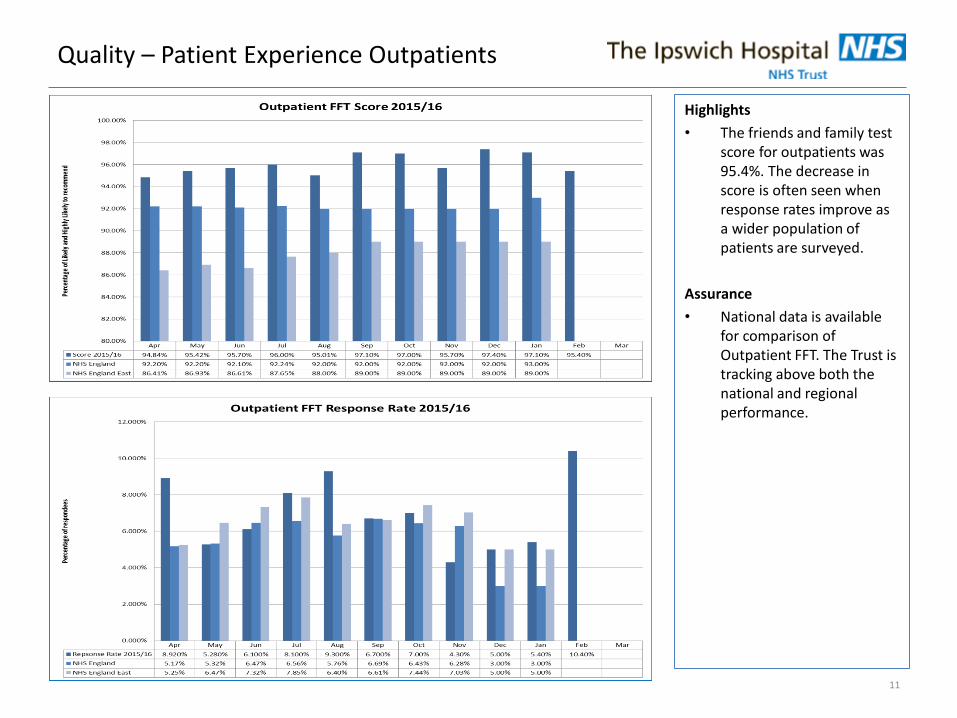
Highlights
• The friends and family test score for outpatients was 95.4%. The decrease in score is often seen when response rates improve as a wider population of patients are surveyed.
Assurance
• National data is available for comparison of Outpatient FFT. The Trust is tracking above both the national and regional performance.
Quality – Patient Experience Emergency Care
12
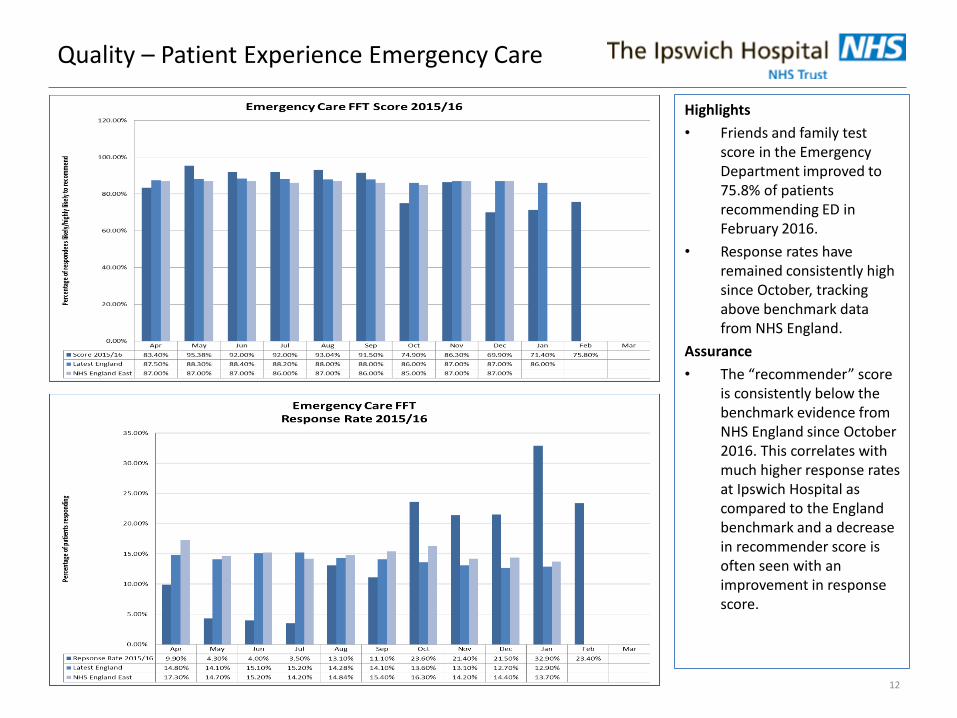
Highlights
• Friends and family test score in the Emergency Department improved to 75.8% of patients recommending ED in February 2016.
• Response rates have remained consistently high since October, tracking above benchmark data from NHS England.
Assurance
• The “recommender” score is consistently below the benchmark evidence from NHS England since October 2016. This correlates with much higher response rates at Ipswich Hospital as compared to the England benchmark and a decrease in recommender score is often seen with an improvement in response score.
Quality – Patient Experience Maternity
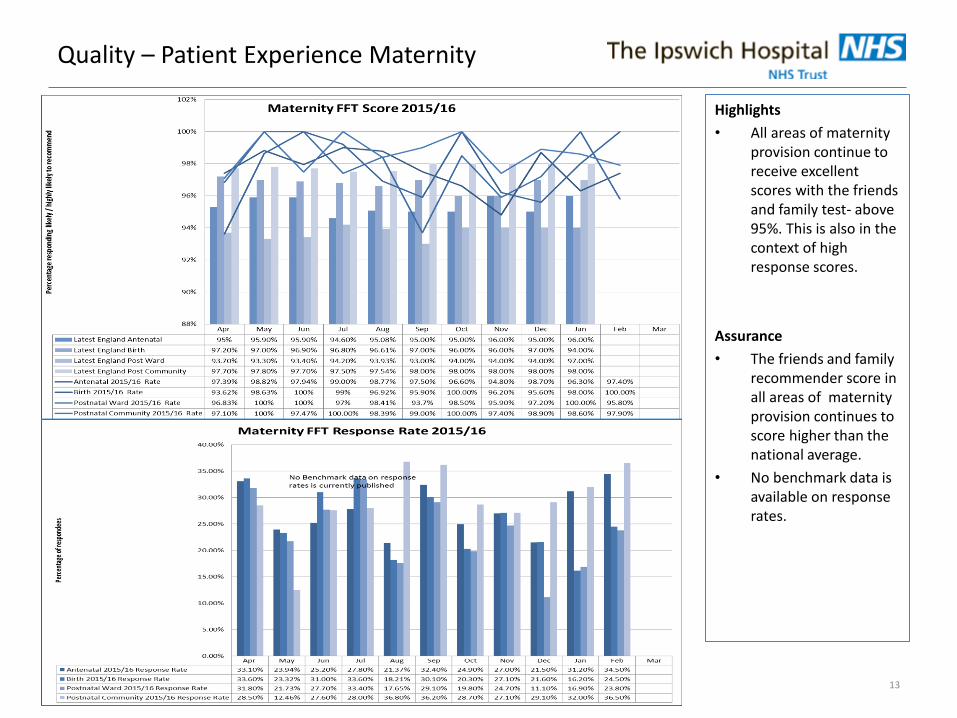
Highlights
• All areas of maternity provision continue to receive excellent scores with the friends and family test- above 95%. This is also in the context of high response scores.
Assurance
• The friends and family recommender score in all areas of maternity provision continues to score higher than the national average.
• No benchmark data is available on response rates.
13
Quality – Maternity
14
Mar Apr May June July August SeptemberOctober NovemberDecember January February Trend
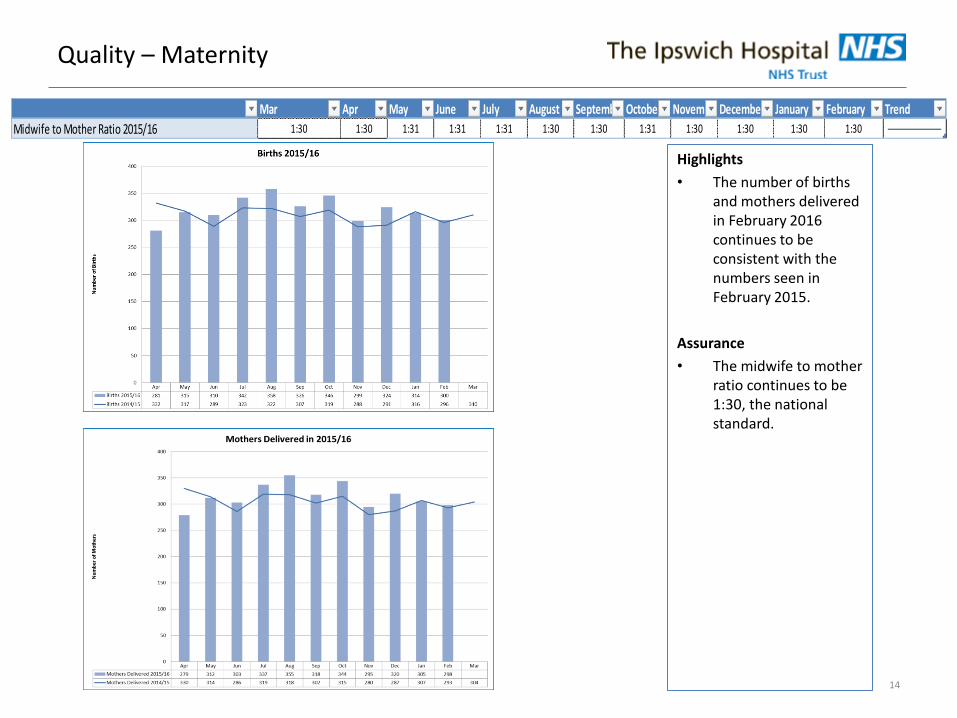
Midwife to Mother Ratio 2015/16 1:30 1:30 1:31 1:31 1:31 1:30 1:30 1:31 1:30 1:30 1:30 1:30
Highlights
• The number of births and mothers delivered in February 2016 continues to be consistent with the numbers seen in February 2015.
Assurance
• The midwife to mother ratio continues to be 1:30, the national standard.
15
Quality – Maternity
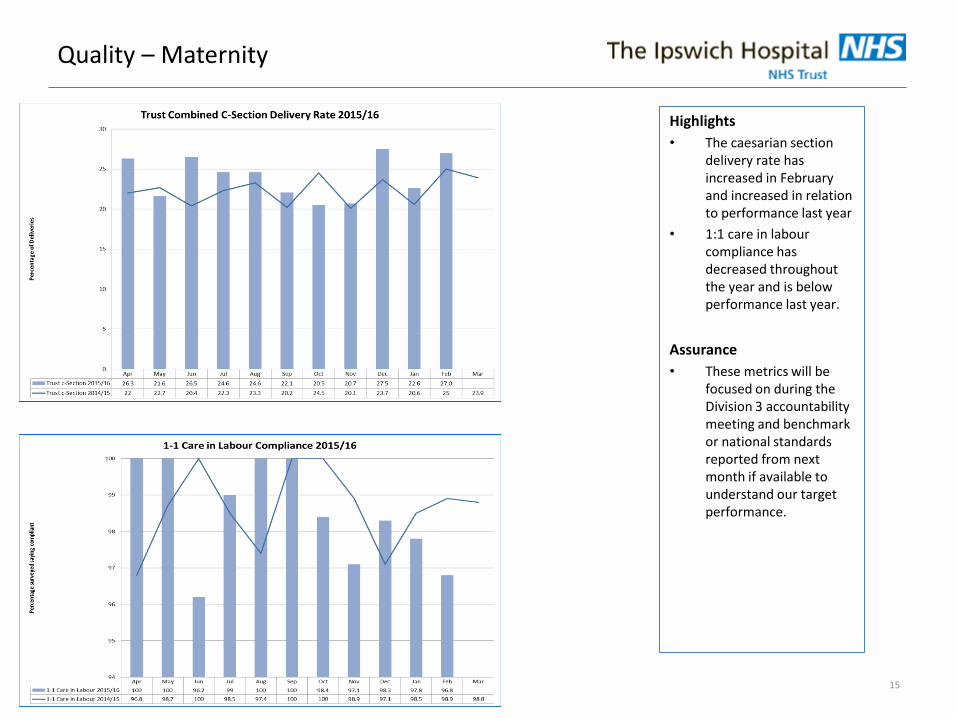
Highlights
• The caesarian section delivery rate has increased in February and increased in relation to performance last year
• 1:1 care in labour compliance has decreased throughout the year and is below performance last year.
Assurance
• These metrics will be focused on during the Division 3 accountability meeting and benchmark or national standards reported from next month if available to understand our target performance.
Quality – Heatmap Division One
16
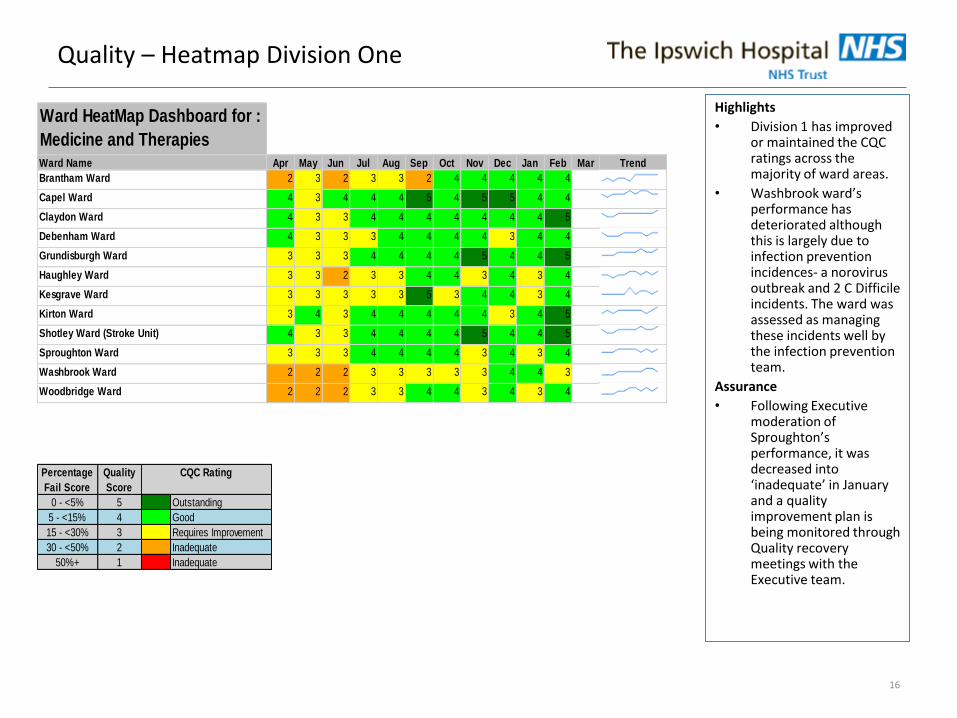
Highlights
• Division 1 has improved or maintained the CQC ratings across the majority of ward areas.
• Washbrook ward’s performance has deteriorated although this is largely due to infection prevention incidences- a norovirus outbreak and 2 C Difficile incidents. The ward was assessed as managing these incidents well by the infection prevention team.
Assurance
• Following Executive moderation of Sproughton’s performance, it was decreased into ‘inadequate’ in January and a quality improvement plan is being monitored through Quality recovery meetings with the Executive team.
May Jun Jul Aug Sep Oct Nov Dec Jan Feb Mar Trend
3 2 3 3 2 4 4 4 4 4
3 4 4 4 5 4 5 5 4 4
3 3 4 4 4 4 4 4 4 5
3 3 3 4 4 4 4 3 4 4
3 3 4 4 4 4 5 4 4 5
3 2 3 3 4 4 3 4 3 4
3 3 3 3 5 3 4 4 3 4
4 3 4 4 4 4 4 3 4 5
3 3 4 4 4 4 5 4 4 5
3 3 4 4 4 4 3 4 3 4
2 2 3 3 3 3 3 4 4 3
2 2 3 3 4 4 3 4 3 4
Percentage
Fail Score
Quality
Score
0 - <5% 5
5 - <15% 4
15 - <30% 3
30 - <50% 2
50%+ 1
Inadequate
Inadequate
Woodbridge Ward 2
CQC Rating
Outstanding
Good
Requires Improvement
Shotley Ward (Stroke Unit) 4
Sproughton Ward 3
Washbrook Ward 2
Haughley Ward 3
Kesgrave Ward 3
Kirton Ward 3
Claydon Ward 4
Debenham Ward 4
Grundisburgh Ward 3
Ward HeatMap Dashboard for :
Medicine and TherapiesWard Name Apr
Brantham Ward 2
Capel Ward 4
Quality – Heatmap Division One
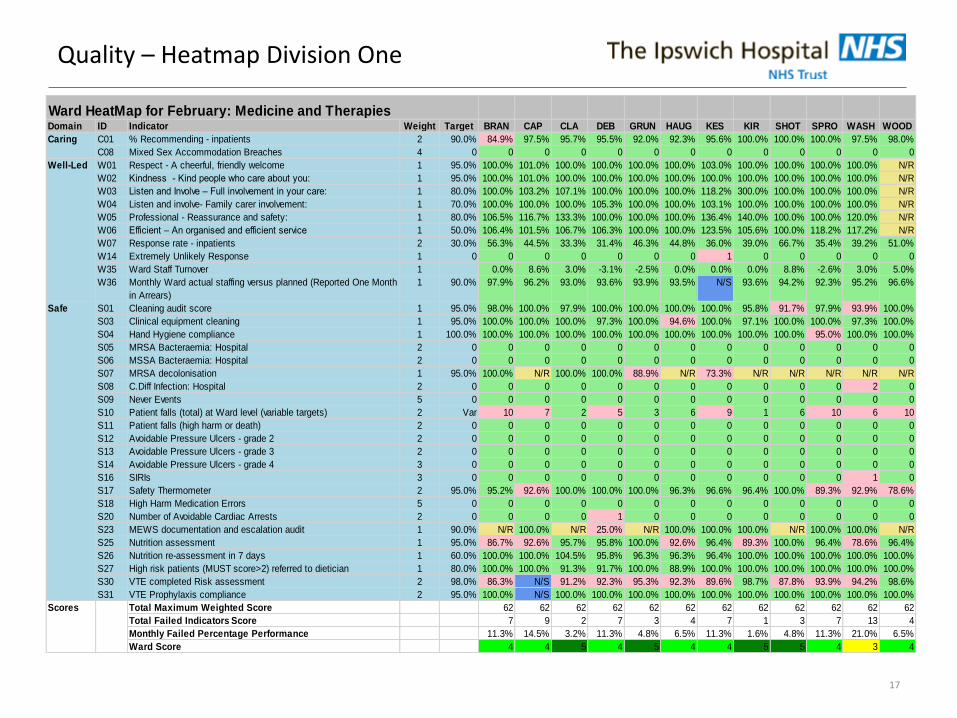
17
Domain ID Indicator Weight Target BRAN CAP CLA DEB GRUN HAUG KES KIR SHOT SPRO WASH WOOD
C01 % Recommending - inpatients 2 90.0% 84.9% 97.5% 95.7% 95.5% 92.0% 92.3% 95.6% 100.0% 100.0% 100.0% 97.5% 98.0%
C08 Mixed Sex Accommodation Breaches 4 0 0 0 0 0 0 0 0 0 0 0 0 0
W01 Respect - A cheerful, friendly welcome 1 95.0% 100.0% 101.0% 100.0% 100.0% 100.0% 100.0% 103.0% 100.0% 100.0% 100.0% 100.0% N/R
W02 Kindness - Kind people who care about you: 1 95.0% 100.0% 101.0% 100.0% 100.0% 100.0% 100.0% 100.0% 100.0% 100.0% 100.0% 100.0% N/R
W03 Listen and Involve – Full involvement in your care: 1 80.0% 100.0% 103.2% 107.1% 100.0% 100.0% 100.0% 118.2% 300.0% 100.0% 100.0% 100.0% N/R
W04 Listen and involve- Family carer involvement: 1 70.0% 100.0% 100.0% 100.0% 105.3% 100.0% 100.0% 103.1% 100.0% 100.0% 100.0% 100.0% N/R
W05 Professional - Reassurance and safety: 1 80.0% 106.5% 116.7% 133.3% 100.0% 100.0% 100.0% 136.4% 140.0% 100.0% 100.0% 120.0% N/R
W06 Efficient – An organised and efficient service 1 50.0% 106.4% 101.5% 106.7% 106.3% 100.0% 100.0% 123.5% 105.6% 100.0% 118.2% 117.2% N/R
W07 Response rate - inpatients 2 30.0% 56.3% 44.5% 33.3% 31.4% 46.3% 44.8% 36.0% 39.0% 66.7% 35.4% 39.2% 51.0%
W14 Extremely Unlikely Response 1 0 0 0 0 0 0 0 1 0 0 0 0 0
W35 Ward Staff Turnover 1 0.0% 8.6% 3.0% -3.1% -2.5% 0.0% 0.0% 0.0% 8.8% -2.6% 3.0% 5.0%
W36 Monthly Ward actual staffing versus planned (Reported One Month
in Arrears)
1 90.0% 97.9% 96.2% 93.0% 93.6% 93.9% 93.5% N/S 93.6% 94.2% 92.3% 95.2% 96.6%
S01 Cleaning audit score 1 95.0% 98.0% 100.0% 97.9% 100.0% 100.0% 100.0% 100.0% 95.8% 91.7% 97.9% 93.9% 100.0%
S03 Clinical equipment cleaning 1 95.0% 100.0% 100.0% 100.0% 97.3% 100.0% 94.6% 100.0% 97.1% 100.0% 100.0% 97.3% 100.0%
S04 Hand Hygiene compliance 1 100.0% 100.0% 100.0% 100.0% 100.0% 100.0% 100.0% 100.0% 100.0% 100.0% 95.0% 100.0% 100.0%
S05 MRSA Bacteraemia: Hospital 2 0 0 0 0 0 0 0 0 0 0 0 0 0
S06 MSSA Bacteraemia: Hospital 2 0 0 0 0 0 0 0 0 0 0 0 0 0
S07 MRSA decolonisation 1 95.0% 100.0% N/R 100.0% 100.0% 88.9% N/R 73.3% N/R N/R N/R N/R N/R
S08 C.Diff Infection: Hospital 2 0 0 0 0 0 0 0 0 0 0 0 2 0
S09 Never Events 5 0 0 0 0 0 0 0 0 0 0 0 0 0
S10 Patient falls (total) at Ward level (variable targets) 2 Var 10 7 2 5 3 6 9 1 6 10 6 10
S11 Patient falls (high harm or death) 2 0 0 0 0 0 0 0 0 0 0 0 0 0
S12 Avoidable Pressure Ulcers - grade 2 2 0 0 0 0 0 0 0 0 0 0 0 0 0
S13 Avoidable Pressure Ulcers - grade 3 2 0 0 0 0 0 0 0 0 0 0 0 0 0
S14 Avoidable Pressure Ulcers - grade 4 3 0 0 0 0 0 0 0 0 0 0 0 0 0
S16 SIRIs 3 0 0 0 0 0 0 0 0 0 0 0 1 0
S17 Safety Thermometer 2 95.0% 95.2% 92.6% 100.0% 100.0% 100.0% 96.3% 96.6% 96.4% 100.0% 89.3% 92.9% 78.6%
S18 High Harm Medication Errors 5 0 0 0 0 0 0 0 0 0 0 0 0 0
S20 Number of Avoidable Cardiac Arrests 2 0 0 0 0 1 0 0 0 0 0 0 0 0
S23 MEWS documentation and escalation audit 1 90.0% N/R 100.0% N/R 25.0% N/R 100.0% 100.0% 100.0% N/R 100.0% 100.0% N/R
S25 Nutrition assessment 1 95.0% 86.7% 92.6% 95.7% 95.8% 100.0% 92.6% 96.4% 89.3% 100.0% 96.4% 78.6% 96.4%
S26 Nutrition re-assessment in 7 days 1 60.0% 100.0% 100.0% 104.5% 95.8% 96.3% 96.3% 96.4% 100.0% 100.0% 100.0% 100.0% 100.0%
S27 High risk patients (MUST score>2) referred to dietician 1 80.0% 100.0% 100.0% 91.3% 91.7% 100.0% 88.9% 100.0% 100.0% 100.0% 100.0% 100.0% 100.0%
S30 VTE completed Risk assessment 2 98.0% 86.3% N/S 91.2% 92.3% 95.3% 92.3% 89.6% 98.7% 87.8% 93.9% 94.2% 98.6%
S31 VTE Prophylaxis compliance 2 95.0% 100.0% N/S 100.0% 100.0% 100.0% 100.0% 100.0% 100.0% 100.0% 100.0% 100.0% 100.0%
Total Maximum Weighted Score 62 62 62 62 62 62 62 62 62 62 62 62
Total Failed Indicators Score 7 9 2 7 3 4 7 1 3 7 13 4
Monthly Failed Percentage Performance 11.3% 14.5% 3.2% 11.3% 4.8% 6.5% 11.3% 1.6% 4.8% 11.3% 21.0% 6.5%
Ward Score 4 4 5 4 5 4 4 5 5 4 3 4
Ward HeatMap for February: Medicine and Therapies
Caring
Well-Led
Safe
Scores
Quality – Heatmap Division Two
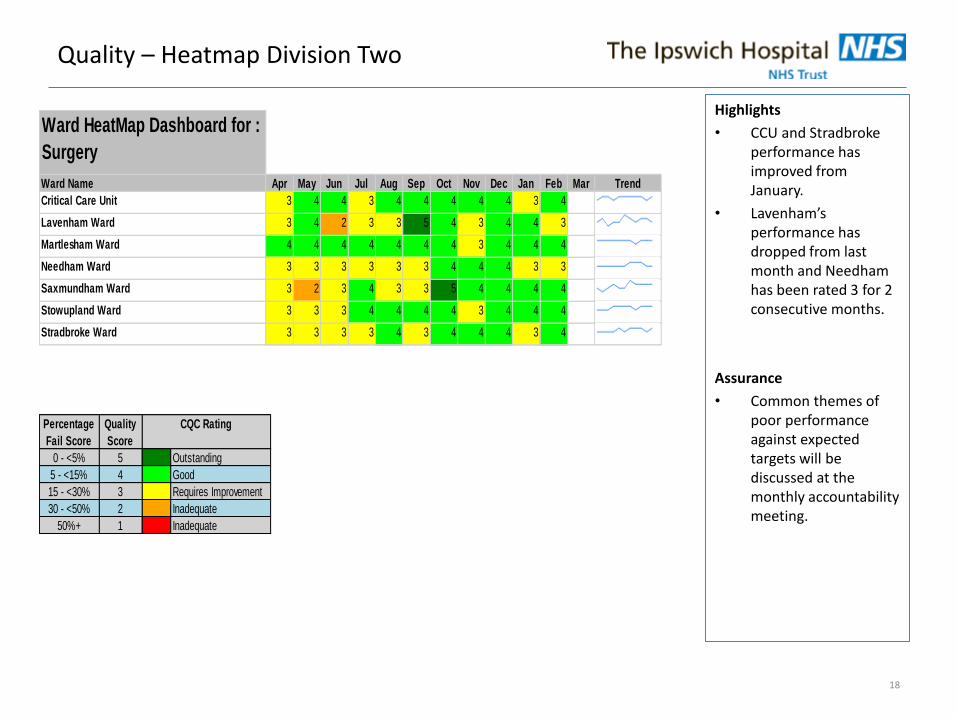
18
Highlights
• CCU and Stradbroke performance has improved from January.
• Lavenham’s performance has dropped from last month and Needham has been rated 3 for 2 consecutive months.
Assurance
• Common themes of poor performance against expected targets will be discussed at the monthly accountability meeting.
May Jun Jul Aug Sep Oct Nov Dec Jan Feb Mar Trend
4 4 3 4 4 4 4 4 3 4
4 2 3 3 5 4 3 4 4 3
4 4 4 4 4 4 3 4 4 4
3 3 3 3 3 4 4 4 3 3
2 3 4 3 3 5 4 4 4 4
3 3 4 4 4 4 3 4 4 4
3 3 3 4 3 4 4 4 3 4
Percentage
Fail Score
Quality
Score
0 - <5% 5
5 - <15% 4
15 - <30% 3
30 - <50% 2
50%+ 1
Good
Requires Improvement
Inadequate
Inadequate
Stowupland Ward 3
Stradbroke Ward 3
CQC Rating
Outstanding
Martlesham Ward 4
Needham Ward 3
Saxmundham Ward 3
Ward HeatMap Dashboard for :
Surgery
Ward Name Apr
Critical Care Unit 3
Lavenham Ward 3
Quality – Heatmap Division Two
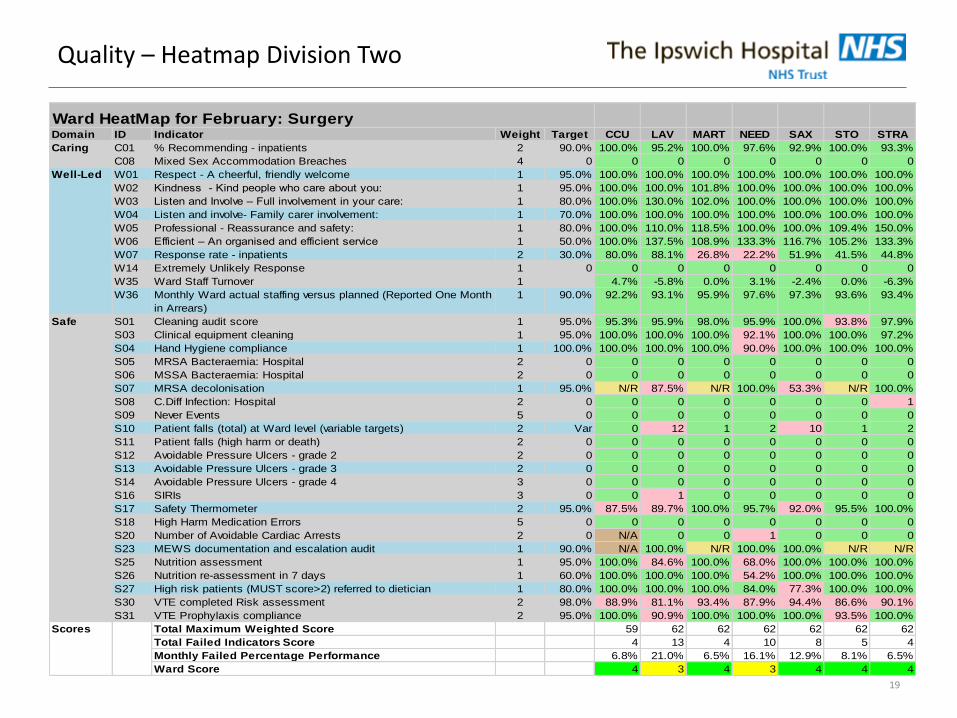
19
Domain ID Indicator Weight Target CCU LAV MART NEED SAX STO STRA
C01 % Recommending - inpatients 2 90.0% 100.0% 95.2% 100.0% 97.6% 92.9% 100.0% 93.3%
C08 Mixed Sex Accommodation Breaches 4 0 0 0 0 0 0 0 0
W01 Respect - A cheerful, friendly welcome 1 95.0% 100.0% 100.0% 100.0% 100.0% 100.0% 100.0% 100.0%
W02 Kindness - Kind people who care about you: 1 95.0% 100.0% 100.0% 101.8% 100.0% 100.0% 100.0% 100.0%
W03 Listen and Involve – Full involvement in your care: 1 80.0% 100.0% 130.0% 102.0% 100.0% 100.0% 100.0% 100.0%
W04 Listen and involve- Family carer involvement: 1 70.0% 100.0% 100.0% 100.0% 100.0% 100.0% 100.0% 100.0%
W05 Professional - Reassurance and safety: 1 80.0% 100.0% 110.0% 118.5% 100.0% 100.0% 109.4% 150.0%
W06 Efficient – An organised and efficient service 1 50.0% 100.0% 137.5% 108.9% 133.3% 116.7% 105.2% 133.3%
W07 Response rate - inpatients 2 30.0% 80.0% 88.1% 26.8% 22.2% 51.9% 41.5% 44.8%
W14 Extremely Unlikely Response 1 0 0 0 0 0 0 0 0
W35 Ward Staff Turnover 1 4.7% -5.8% 0.0% 3.1% -2.4% 0.0% -6.3%
W36 Monthly Ward actual staffing versus planned (Reported One Month
in Arrears)
1 90.0% 92.2% 93.1% 95.9% 97.6% 97.3% 93.6% 93.4%
S01 Cleaning audit score 1 95.0% 95.3% 95.9% 98.0% 95.9% 100.0% 93.8% 97.9%
S03 Clinical equipment cleaning 1 95.0% 100.0% 100.0% 100.0% 92.1% 100.0% 100.0% 97.2%
S04 Hand Hygiene compliance 1 100.0% 100.0% 100.0% 100.0% 90.0% 100.0% 100.0% 100.0%
S05 MRSA Bacteraemia: Hospital 2 0 0 0 0 0 0 0 0
S06 MSSA Bacteraemia: Hospital 2 0 0 0 0 0 0 0 0
S07 MRSA decolonisation 1 95.0% N/R 87.5% N/R 100.0% 53.3% N/R 100.0%
S08 C.Diff Infection: Hospital 2 0 0 0 0 0 0 0 1
S09 Never Events 5 0 0 0 0 0 0 0 0
S10 Patient falls (total) at Ward level (variable targets) 2 Var 0 12 1 2 10 1 2
S11 Patient falls (high harm or death) 2 0 0 0 0 0 0 0 0
S12 Avoidable Pressure Ulcers - grade 2 2 0 0 0 0 0 0 0 0
S13 Avoidable Pressure Ulcers - grade 3 2 0 0 0 0 0 0 0 0
S14 Avoidable Pressure Ulcers - grade 4 3 0 0 0 0 0 0 0 0
S16 SIRIs 3 0 0 1 0 0 0 0 0
S17 Safety Thermometer 2 95.0% 87.5% 89.7% 100.0% 95.7% 92.0% 95.5% 100.0%
S18 High Harm Medication Errors 5 0 0 0 0 0 0 0 0
S20 Number of Avoidable Cardiac Arrests 2 0 N/A 0 0 1 0 0 0
S23 MEWS documentation and escalation audit 1 90.0% N/A 100.0% N/R 100.0% 100.0% N/R N/R
S25 Nutrition assessment 1 95.0% 100.0% 84.6% 100.0% 68.0% 100.0% 100.0% 100.0%
S26 Nutrition re-assessment in 7 days 1 60.0% 100.0% 100.0% 100.0% 54.2% 100.0% 100.0% 100.0%
S27 High risk patients (MUST score>2) referred to dietician 1 80.0% 100.0% 100.0% 100.0% 84.0% 77.3% 100.0% 100.0%
S30 VTE completed Risk assessment 2 98.0% 88.9% 81.1% 93.4% 87.9% 94.4% 86.6% 90.1%
S31 VTE Prophylaxis compliance 2 95.0% 100.0% 90.9% 100.0% 100.0% 100.0% 93.5% 100.0%
Total Maximum Weighted Score 59 62 62 62 62 62 62
Total Failed Indicators Score 4 13 4 10 8 5 4
Monthly Failed Percentage Performance 6.8% 21.0% 6.5% 16.1% 12.9% 8.1% 6.5%
Ward Score 4 3 4 3 4 4 4
Ward HeatMap for February: Surgery
Caring
Well-Led
Safe
Scores
Quality – Heatmap Division Three
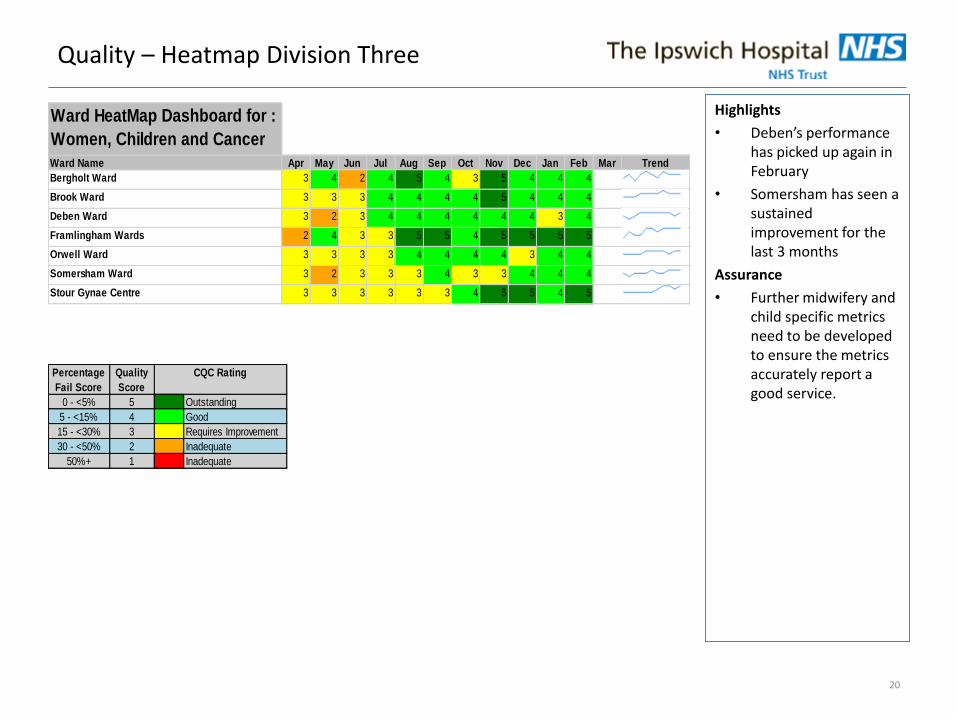
20
Highlights
• Deben’s performance has picked up again in February
• Somersham has seen a sustained improvement for the last 3 months
Assurance
• Further midwifery and child specific metrics need to be developed to ensure the metrics accurately report a good service.
May Jun Jul Aug Sep Oct Nov Dec Jan Feb Mar Trend
4 2 4 5 4 3 5 4 4 4
3 3 4 4 4 4 5 4 4 4
2 3 4 4 4 4 4 4 3 4
4 3 3 5 5 4 5 5 5 5
3 3 3 4 4 4 4 3 4 4
2 3 3 3 4 3 3 4 4 4
3 3 3 3 3 4 5 5 4 5
Percentage
Fail Score
Quality
Score
0 - <5% 5
5 - <15% 4
15 - <30% 3
30 - <50% 2
50%+ 1
Good
Requires Improvement
Inadequate
Inadequate
Somersham Ward 3
Stour Gynae Centre 3
CQC Rating
Outstanding
Deben Ward 3
Framlingham Wards 2
Orwell Ward 3
Ward HeatMap Dashboard for :
Women, Children and Cancer
Ward Name Apr
Bergholt Ward 3
Brook Ward 3
Quality – Heatmap Division Three
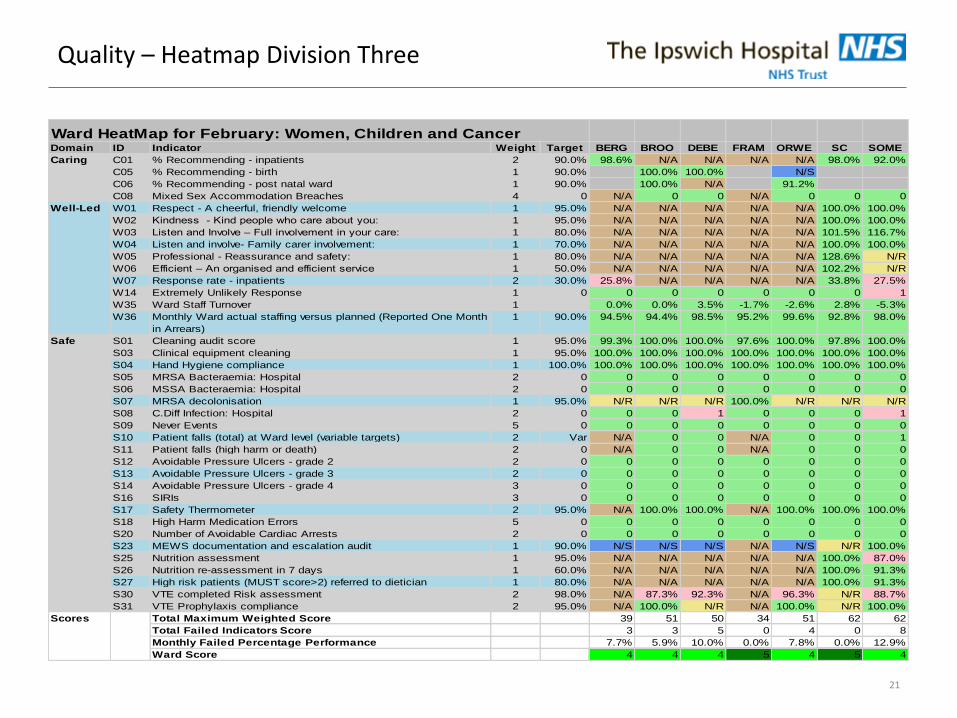
21
Domain ID Indicator Weight Target BERG BROO DEBE FRAM ORWE SC SOME
C01 % Recommending - inpatients 2 90.0% 98.6% N/A N/A N/A N/A 98.0% 92.0%
C05 % Recommending - birth 1 90.0% 100.0% 100.0% N/S
C06 % Recommending - post natal ward 1 90.0% 100.0% N/A 91.2%
C08 Mixed Sex Accommodation Breaches 4 0 N/A 0 0 N/A 0 0 0
W01 Respect - A cheerful, friendly welcome 1 95.0% N/A N/A N/A N/A N/A 100.0% 100.0%
W02 Kindness - Kind people who care about you: 1 95.0% N/A N/A N/A N/A N/A 100.0% 100.0%
W03 Listen and Involve – Full involvement in your care: 1 80.0% N/A N/A N/A N/A N/A 101.5% 116.7%
W04 Listen and involve- Family carer involvement: 1 70.0% N/A N/A N/A N/A N/A 100.0% 100.0%
W05 Professional - Reassurance and safety: 1 80.0% N/A N/A N/A N/A N/A 128.6% N/R
W06 Efficient – An organised and efficient service 1 50.0% N/A N/A N/A N/A N/A 102.2% N/R
W07 Response rate - inpatients 2 30.0% 25.8% N/A N/A N/A N/A 33.8% 27.5%
W14 Extremely Unlikely Response 1 0 0 0 0 0 0 0 1
W35 Ward Staff Turnover 1 0.0% 0.0% 3.5% -1.7% -2.6% 2.8% -5.3%
W36 Monthly Ward actual staffing versus planned (Reported One Month
in Arrears)
1 90.0% 94.5% 94.4% 98.5% 95.2% 99.6% 92.8% 98.0%
S01 Cleaning audit score 1 95.0% 99.3% 100.0% 100.0% 97.6% 100.0% 97.8% 100.0%
S03 Clinical equipment cleaning 1 95.0% 100.0% 100.0% 100.0% 100.0% 100.0% 100.0% 100.0%
S04 Hand Hygiene compliance 1 100.0% 100.0% 100.0% 100.0% 100.0% 100.0% 100.0% 100.0%
S05 MRSA Bacteraemia: Hospital 2 0 0 0 0 0 0 0 0
S06 MSSA Bacteraemia: Hospital 2 0 0 0 0 0 0 0 0
S07 MRSA decolonisation 1 95.0% N/R N/R N/R 100.0% N/R N/R N/R
S08 C.Diff Infection: Hospital 2 0 0 0 1 0 0 0 1
S09 Never Events 5 0 0 0 0 0 0 0 0
S10 Patient falls (total) at Ward level (variable targets) 2 Var N/A 0 0 N/A 0 0 1
S11 Patient falls (high harm or death) 2 0 N/A 0 0 N/A 0 0 0
S12 Avoidable Pressure Ulcers - grade 2 2 0 0 0 0 0 0 0 0
S13 Avoidable Pressure Ulcers - grade 3 2 0 0 0 0 0 0 0 0
S14 Avoidable Pressure Ulcers - grade 4 3 0 0 0 0 0 0 0 0
S16 SIRIs 3 0 0 0 0 0 0 0 0
S17 Safety Thermometer 2 95.0% N/A 100.0% 100.0% N/A 100.0% 100.0% 100.0%
S18 High Harm Medication Errors 5 0 0 0 0 0 0 0 0
S20 Number of Avoidable Cardiac Arrests 2 0 0 0 0 0 0 0 0
S23 MEWS documentation and escalation audit 1 90.0% N/S N/S N/S N/A N/S N/R 100.0%
S25 Nutrition assessment 1 95.0% N/A N/A N/A N/A N/A 100.0% 87.0%
S26 Nutrition re-assessment in 7 days 1 60.0% N/A N/A N/A N/A N/A 100.0% 91.3%
S27 High risk patients (MUST score>2) referred to dietician 1 80.0% N/A N/A N/A N/A N/A 100.0% 91.3%
S30 VTE completed Risk assessment 2 98.0% N/A 87.3% 92.3% N/A 96.3% N/R 88.7%
S31 VTE Prophylaxis compliance 2 95.0% N/A 100.0% N/R N/A 100.0% N/R 100.0%
Total Maximum Weighted Score 39 51 50 34 51 62 62
Total Failed Indicators Score 3 3 5 0 4 0 8
Monthly Failed Percentage Performance 7.7% 5.9% 10.0% 0.0% 7.8% 0.0% 12.9%
Ward Score 4 4 4 5 4 5 4
Ward HeatMap for February: Women, Children and Cancer
Caring
Well-Led
Safe
Scores
Quality – Heatmap Division Three
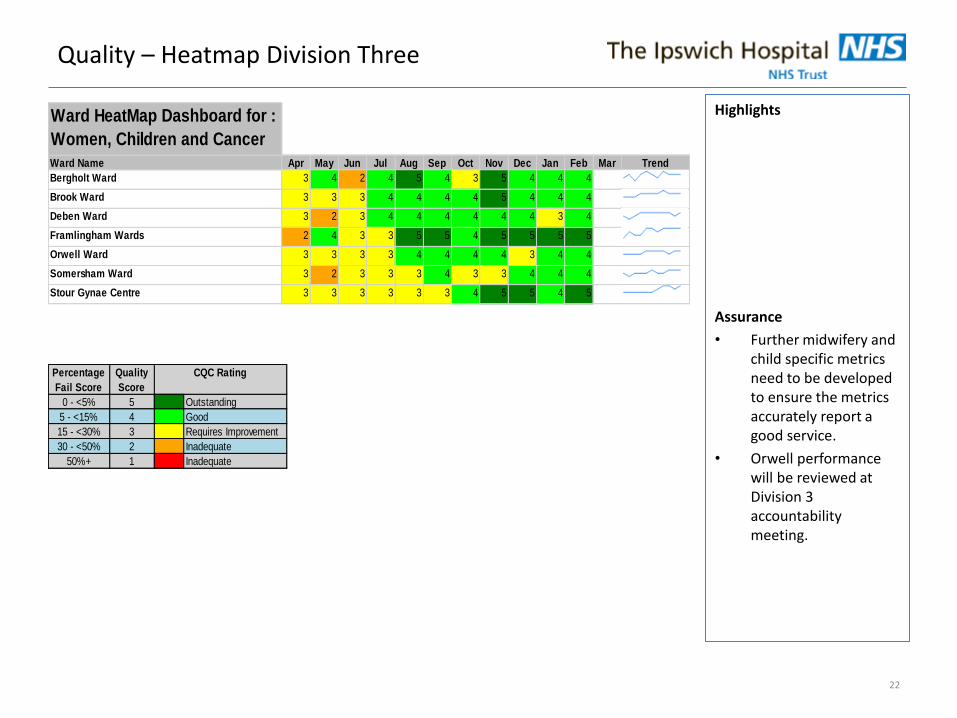
22
Highlights
Assurance
• Further midwifery and child specific metrics need to be developed to ensure the metrics accurately report a good service.
• Orwell performance will be reviewed at Division 3 accountability meeting.
May Jun Jul Aug Sep Oct Nov Dec Jan Feb Mar Trend
4 2 4 5 4 3 5 4 4 4
3 3 4 4 4 4 5 4 4 4
2 3 4 4 4 4 4 4 3 4
4 3 3 5 5 4 5 5 5 5
3 3 3 4 4 4 4 3 4 4
2 3 3 3 4 3 3 4 4 4
3 3 3 3 3 4 5 5 4 5
Percentage
Fail Score
Quality
Score
0 - <5% 5
5 - <15% 4
15 - <30% 3
30 - <50% 2
50%+ 1
Good
Requires Improvement
Inadequate
Inadequate
Somersham Ward 3
Stour Gynae Centre 3
CQC Rating
Outstanding
Deben Ward 3
Framlingham Wards 2
Orwell Ward 3
Ward HeatMap Dashboard for :
Women, Children and Cancer
Ward Name Apr
Bergholt Ward 3
Brook Ward 3

Quality – Heatmap Division Three
23
Domain ID Indicator Weight Target BERG BROO DEBE FRAM ORWE SC SOME
C01 % Recommending - inpatients 2 90.0% 98.6% N/A N/A N/A N/A 98.0% 92.0%
C05 % Recommending - birth 1 90.0% 100.0% 100.0% N/S
C06 % Recommending - post natal ward 1 90.0% 100.0% N/A 91.2%
C08 Mixed Sex Accommodation Breaches 4 0 N/A 0 0 N/A 0 0 0
W01 Respect - A cheerful, friendly welcome 1 95.0% N/A N/A N/A N/A N/A 100.0% 100.0%
W02 Kindness - Kind people who care about you: 1 95.0% N/A N/A N/A N/A N/A 100.0% 100.0%
W03 Listen and Involve – Full involvement in your care: 1 80.0% N/A N/A N/A N/A N/A 101.5% 116.7%
W04 Listen and involve- Family carer involvement: 1 70.0% N/A N/A N/A N/A N/A 100.0% 100.0%
W05 Professional - Reassurance and safety: 1 80.0% N/A N/A N/A N/A N/A 128.6% N/R
W06 Efficient – An organised and efficient service 1 50.0% N/A N/A N/A N/A N/A 102.2% N/R
W07 Response rate - inpatients 2 30.0% 25.8% N/A N/A N/A N/A 33.8% 27.5%
W14 Extremely Unlikely Response 1 0 0 0 0 0 0 0 1
W35 Ward Staff Turnover 1 0.0% 0.0% 3.5% -1.7% -2.6% 2.8% -5.3%
W36 Monthly Ward actual staffing versus planned (Reported One Month
in Arrears)
1 90.0% 94.5% 94.4% 98.5% 95.2% 99.6% 92.8% 98.0%
S01 Cleaning audit score 1 95.0% 99.3% 100.0% 100.0% 97.6% 100.0% 97.8% 100.0%
S03 Clinical equipment cleaning 1 95.0% 100.0% 100.0% 100.0% 100.0% 100.0% 100.0% 100.0%
S04 Hand Hygiene compliance 1 100.0% 100.0% 100.0% 100.0% 100.0% 100.0% 100.0% 100.0%
S05 MRSA Bacteraemia: Hospital 2 0 0 0 0 0 0 0 0
S06 MSSA Bacteraemia: Hospital 2 0 0 0 0 0 0 0 0
S07 MRSA decolonisation 1 95.0% N/R N/R N/R 100.0% N/R N/R N/R
S08 C.Diff Infection: Hospital 2 0 0 0 1 0 0 0 1
S09 Never Events 5 0 0 0 0 0 0 0 0
S10 Patient falls (total) at Ward level (variable targets) 2 Var N/A 0 0 N/A 0 0 1
S11 Patient falls (high harm or death) 2 0 N/A 0 0 N/A 0 0 0
S12 Avoidable Pressure Ulcers - grade 2 2 0 0 0 0 0 0 0 0
S13 Avoidable Pressure Ulcers - grade 3 2 0 0 0 0 0 0 0 0
S14 Avoidable Pressure Ulcers - grade 4 3 0 0 0 0 0 0 0 0
S16 SIRIs 3 0 0 0 0 0 0 0 0
S17 Safety Thermometer 2 95.0% N/A 100.0% 100.0% N/A 100.0% 100.0% 100.0%
S18 High Harm Medication Errors 5 0 0 0 0 0 0 0 0
S20 Number of Avoidable Cardiac Arrests 2 0 0 0 0 0 0 0 0
S23 MEWS documentation and escalation audit 1 90.0% N/S N/S N/S N/A N/S N/R 100.0%
S25 Nutrition assessment 1 95.0% N/A N/A N/A N/A N/A 100.0% 87.0%
S26 Nutrition re-assessment in 7 days 1 60.0% N/A N/A N/A N/A N/A 100.0% 91.3%
S27 High risk patients (MUST score>2) referred to dietician 1 80.0% N/A N/A N/A N/A N/A 100.0% 91.3%
S30 VTE completed Risk assessment 2 98.0% N/A 87.3% 92.3% N/A 96.3% N/R 88.7%
S31 VTE Prophylaxis compliance 2 95.0% N/A 100.0% N/R N/A 100.0% N/R 100.0%
Total Maximum Weighted Score 39 51 50 34 51 62 62
Total Failed Indicators Score 3 3 5 0 4 0 8
Monthly Failed Percentage Performance 7.7% 5.9% 10.0% 0.0% 7.8% 0.0% 12.9%
Ward Score 4 4 4 5 4 5 4
Ward HeatMap for February: Women, Children and Cancer
Caring
Well-Led
Safe
Scores
Finance
24
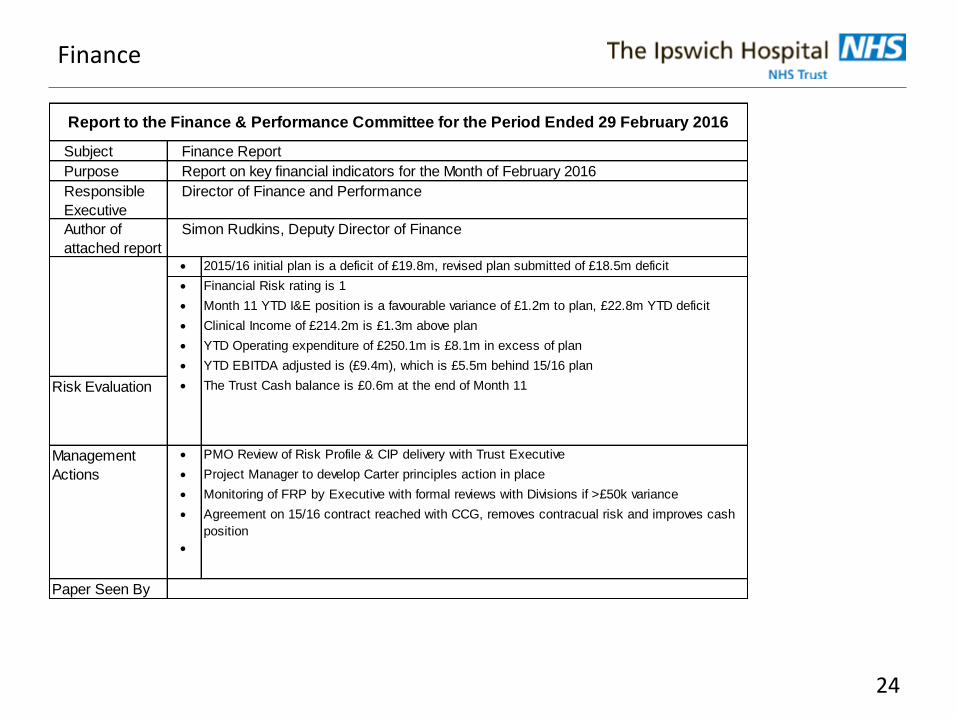
Subject
Purpose
Responsible
Executive
Author of
attached report 2015/16 initial plan is a deficit of £19.8m, revised plan submitted of £18.5m deficit
Financial Risk rating is 1
Month 11 YTD I&E position is a favourable variance of £1.2m to plan, £22.8m YTD deficit
Clinical Income of £214.2m is £1.3m above plan
YTD Operating expenditure of £250.1m is £8.1m in excess of plan
YTD EBITDA adjusted is (£9.4m), which is £5.5m behind 15/16 plan
Risk Evaluation The Trust Cash balance is £0.6m at the end of Month 11
PMO Review of Risk Profile & CIP delivery with Trust Executive
Project Manager to develop Carter principles action in place
Monitoring of FRP by Executive with formal reviews with Divisions if >£50k variance
Agreement on 15/16 contract reached with CCG, removes contracual risk and improves cash
position
Paper Seen By
Report to the Finance & Performance Committee for the Period Ended 29 February 2016
Management
Actions
Finance Report
Report on key financial indicators for the Month of February 2016
Director of Finance and Performance
Simon Rudkins, Deputy Director of Finance
25
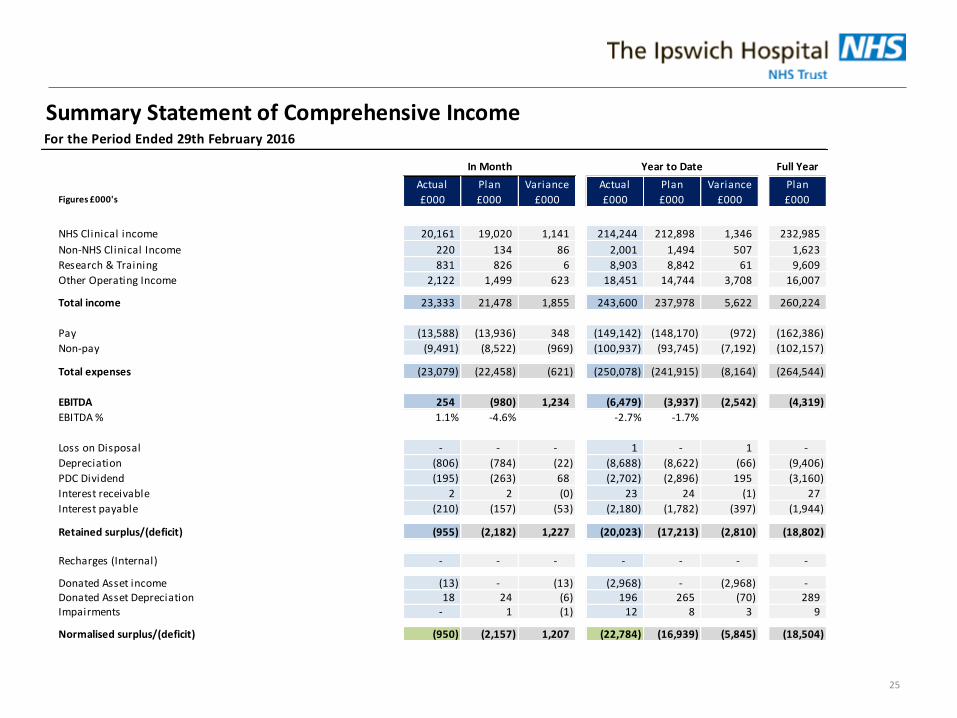
Summary Statement of Comprehensive IncomeFor the Period Ended 29th February 2016
Figures £000's
Actual
£000
Plan
£000
Variance
£000
Actual
£000
Plan
£000
Variance
£000
Plan
£000
NHS Clinical income 20,161 19,020 1,141 214,244 212,898 1,346 232,985
Non-NHS Clinical Income 220 134 86 2,001 1,494 507 1,623
Research & Training 831 826 6 8,903 8,842 61 9,609
Other Operating Income 2,122 1,499 623 18,451 14,744 3,708 16,007
Total income 23,333 21,478 1,855 243,600 237,978 5,622 260,224
Pay (13,588) (13,936) 348 (149,142) (148,170) (972) (162,386)
Non-pay (9,491) (8,522) (969) (100,937) (93,745) (7,192) (102,157)
Total expenses (23,079) (22,458) (621) (250,078) (241,915) (8,164) (264,544)
EBITDA 254 (980) 1,234 (6,479) (3,937) (2,542) (4,319)
EBITDA % 1.1% -4.6% -2.7% -1.7%
Loss on Disposal - - - 1 - 1 -
Depreciation (806) (784) (22) (8,688) (8,622) (66) (9,406)
PDC Dividend (195) (263) 68 (2,702) (2,896) 195 (3,160)
Interest receivable 2 2 (0) 23 24 (1) 27
Interest payable (210) (157) (53) (2,180) (1,782) (397) (1,944)
Retained surplus/(deficit) (955) (2,182) 1,227 (20,023) (17,213) (2,810) (18,802)
Recharges (Internal) - - - - - - -
Donated Asset income (13) - (13) (2,968) - (2,968) - Donated Asset Depreciation 18 24 (6) 196 265 (70) 289 Impairments - 1 (1) 12 8 3 9
Normalised surplus/(deficit) (950) (2,157) 1,207 (22,784) (16,939) (5,845) (18,504)
In Month Year to Date Full Year
26
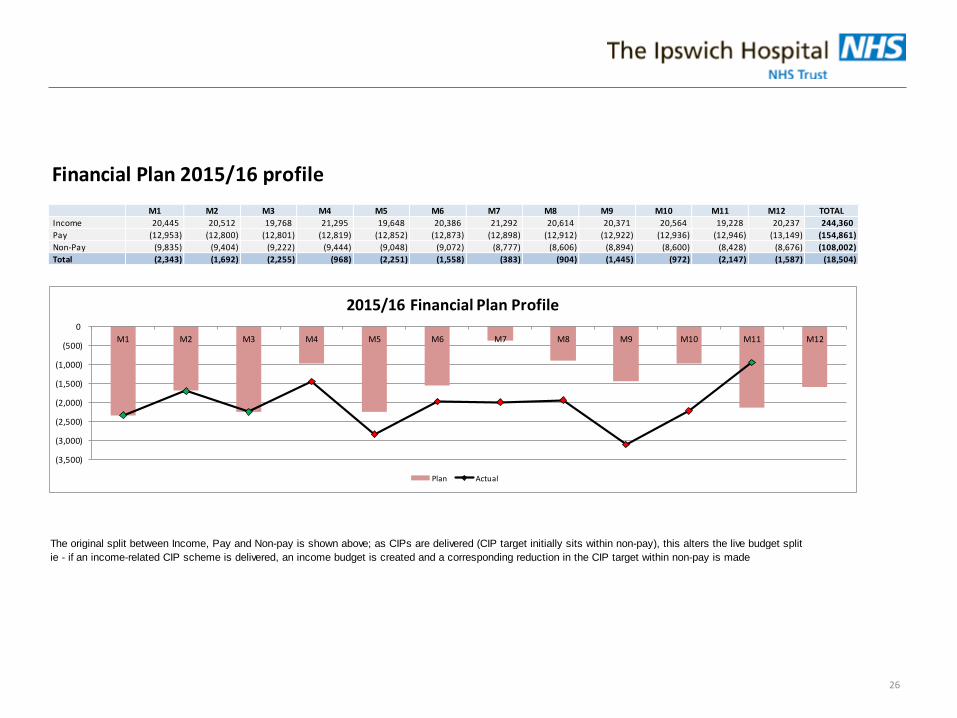
Financial Plan 2015/16 profile
The original split between Income, Pay and Non-pay is shown above; as CIPs are delivered (CIP target initially sits within non-pay), this alters the live budget split
ie - if an income-related CIP scheme is delivered, an income budget is created and a corresponding reduction in the CIP target within non-pay is made
M1 M2 M3 M4 M5 M6 M7 M8 M9 M10 M11 M12 TOTAL
Income 20,445 20,512 19,768 21,295 19,648 20,386 21,292 20,614 20,371 20,564 19,228 20,237 244,360
Pay (12,953) (12,800) (12,801) (12,819) (12,852) (12,873) (12,898) (12,912) (12,922) (12,936) (12,946) (13,149) (154,861)
Non-Pay (9,835) (9,404) (9,222) (9,444) (9,048) (9,072) (8,777) (8,606) (8,894) (8,600) (8,428) (8,676) (108,002)
Total (2,343) (1,692) (2,255) (968) (2,251) (1,558) (383) (904) (1,445) (972) (2,147) (1,587) (18,504)
(3,500)
(3,000)
(2,500)
(2,000)
(1,500)
(1,000)
(500)
0
M1 M2 M3 M4 M5 M6 M7 M8 M9 M10 M11 M12
2015/16 Financial Plan Profile
Plan Actual
27
Summary Risks and OpportunitiesFor the Period Ended 29th February 2016
YTD FOT
Ref Risk/Opportunity Plan Risk
£3.5m
M11 YTD
Risk £m
FOT
Risk £m
SRO Likely
2015/16 Financial Plan (16.9) (19.8) (19.8)
RM1 FYE CIP is not fully delivered 0.0 0.0 0.0 COO 0.0
RM2 CYE CIP is not fully delivered (1.0) (1.1) (0.8) COO (0.8)
RM3 QIPP schemes reduce elective (0.2) 0.0 0.0 COO 0.0
RM4 Aggressive contract management (0.2) (6.0) (6.0) DoF (6.0)
RM5 NEL Activity is higher than planned (0.4) (2.0) (2.3) COO (2.3)
RM6 Division 2 continues to encounter problems with consistency and focus in clinical services. (0.4) (1.0) (0.6) HRD (0.6)
RM7 Historical culture of not delivering financial targets in clinical divisions (0.8) (1.3) (0.4) COO (0.4)
RM8 Developing new models of care and preparing to implement strategy require financial investment (0.3) 0.0 0.0 DoF 0.0
RM9 Non recurrent benefits in Divisional budgets 0.3 0.0 0.0 COO 0.0
RM10 Non recurrent income outside of contract 0.2 0.0 0.0 COO 0.0
RM11 CQUIN may not deliver as planned (0.4) 0.0 (0.2) COO (0.2)
RM12 Junior Doctor Cover Division (0.3) 0.0 (0.1) COO (0.1)
RM13 Repatriation of cardiac work (0.1) 0.0 0.0 COO 0.0
RM14 TPP (1.1) (2.0) (2.3) COO (2.3)
RM15 CQC (0.1) 0.0 0.0 COO 0.0
RM16 Winter Pressure impact; loss of elective, provision at higher cost 0.0 0.0 (1.0) COO (1.0)
RM17 Community JV contract 0.0 0.0 0.0 DoF 0.0
O1 Non-recurrent mitigations - contract agreement 1.3 5.3 5.1 DoF 5.1
Total Risks identified at budget setting (3.5) (8.1) (8.6) (8.6)
Contingency Released 3.5 2.2 2.2 2.2
Total Variance to Plan before opportunities - (5.9) (6.4) (6.4)
Total Financial Position - (22.8) (26.2) (26.2) (A)
O1 Non-recurrent mitigations 0.0 0.0 0.0 DoF 50% 0.0
O2 CYE CIP is fully delivered 0.0 0.0 0.8 COO 100% 0.8
O3 CYE CIP Over-delivery stretch 0.0 0.0 0.0 COO 0% 0.0
O4 TPP Technical 0.0 0.0 2.3 DoF 100% 2.3
O5 Agency Cap 0.0 0.0 0.3 COO 100% 0.3
O6 Lord Carter review - phasing into 2016/17 0.0 0.0 0.0 DoF 50% 0.0
O7 Winter planning to mitigate risk - in lead commissioner agreement 0.0 0.0 0.0 COO 100% 0.0
O8 Aggressive contract management 0.0 0.0 0.0 COO 100% 0.0
O9 Utilise Capital to revenue transfer 0.0 0.0 0.8 100% 0.8
Total Opportunities - - 4.2 4.2
Total Variance to Plan after opportunities (22.8) (22.1) (22.1)
(B) (C)
28
Divisional PerformanceIHT DIV Month 11 YTD
Actual Plan Variance Actual Plan Variance M1 M2 M3 M4 M5 M6 M7 M8 M9 M10 M11 M12 YTD
Div1 436 167 268 4,995 7,307 (2,312) (69) (498) (341) (142) (272) (113) (596) (438) (424) (406) 268 (2,312)
Div2 1,231 1,083 148 13,259 14,800 (1,542) (69) (260) 98 13 (331) (73) (440) (301) 89 (417) 148 (1,542)
Div3 450 387 63 5,385 6,531 (1,146) (158) (224) 49 393 (325) (120) (106) (109) 49 62 63 (1,146)
Div4 (3,061) (3,787) 726 (46,553) (45,586) (967) 304 977 201 (750) 338 (114) (445) (196) (1,406) (602) 726 (967)
Community (6) (8) 3 130 8 122 - - - - - - (10) (23) 36 117 3 122
(950) (2,157) 1,207 (22,784) (16,939) (5,845) 8 (5) 7 (486) (589) (421) (1,599) (1,067) (1,656) (1,246) 1,207 0 (5,845)
IHT TOTAL Month 11 YTDActual Plan Variance Actual Plan Variance M1 M2 M3 M4 M5 M6 M7 M8 M9 M10 M11 M12 YTD
Income 23,320 21,478 1,842 240,632 237,978 2,654 373 (149) 886 502 56 355 (468) 248 (431) (561) 1,842 2,654
Pay (13,588) (13,936) 348 (149,142) (148,170) (972) (234) (4) (607) (486) (133) (99) (96) (14) 343 12 348 (972)
Non-Pay (9,491) (8,520) (970) (100,937) (94,746) (6,191) 66 257 (208) (363) (194) (652) (788) (987) (1,367) (984) (970) (6,191)
CIP 0 (1) 1 0 1,001 (1,001) (173) (84) (37) (131) (261) 11 (204) (325) (144) 347 1 (1,001)
Financing (1,191) (1,177) (14) (13,337) (13,002) (334) (23) (24) (26) (7) (57) (36) (43) 13 (57) (60) (14) (334)
(950) (2,157) 1,207 (22,784) (16,939) (5,845) 8 (5) 7 (486) (589) (421) (1,599) (1,067) (1,656) (1,246) 1,207 0 (5,845)
Div1 Month 11 YTDActual Plan Variance Actual Plan Variance M1 M2 M3 M4 M5 M6 M7 M8 M9 M10 M11 M12 YTD
Income 5,962 5,471 491 66,057 64,346 1,710 363 (12) 283 (185) 63 254 (78) 182 (37) 7 491 1,710
Pay (3,983) (4,075) 91 (45,251) (44,080) (1,171) (171) (149) (309) (209) (54) (103) (148) (98) 160 (205) 91 (1,171)
Non-Pay (1,543) (1,237) (307) (15,811) (13,667) (2,143) 4 (132) (205) 38 (123) (225) (265) (384) (500) (218) (307) (2,143)
CIP 0 8 (8) 0 709 (709) (267) (205) (112) 213 (159) (40) (106) (139) (47) 10 (8) (709)
Financing 0 0 0 0 0 0 1 1 1 1 1 1 1 1 0 0 0 0
436 167 268 4,995 7,307 (2,312) (69) (498) (341) (142) (272) (113) (596) (438) (424) (406) 268 0 (2,312)
Div2 Month 11 YTDActual Plan Variance Actual Plan Variance M1 M2 M3 M4 M5 M6 M7 M8 M9 M10 M11 M12 YTD
Income 7,971 7,461 510 87,232 85,242 1,990 143 (102) 514 288 (20) 81 154 260 327 (165) 510 1,990
Pay (4,564) (4,566) 1 (50,542) (49,510) (1,031) (113) 106 (203) (269) (99) (125) (138) (128) (23) (40) 1 (1,031)
Non-Pay (2,175) (1,801) (375) (23,431) (20,926) (2,505) 2 (167) (125) (294) (175) (8) (499) (437) (224) (206) (375) (2,505)
CIP 0 (12) 12 0 (5) 5 (101) (97) (88) 287 (36) (22) 43 4 9 (6) 12 5
Financing 0 0 0 0 0 0 0 0 0 0 0 0 0 0 0 0 0 0
1,231 1,083 148 13,259 14,800 (1,542) (69) (260) 98 13 (331) (73) (440) (301) 89 (417) 148 0 (1,542)
Div3 Month 11 YTDActual Plan Variance Actual Plan Variance M1 M2 M3 M4 M5 M6 M7 M8 M9 M10 M11 M12 YTD
Income 5,593 5,656 (63) 63,376 64,474 (1,097) (268) (133) 191 131 (248) 181 (244) (108) 58 (215) (63) (1,097)
Pay (3,040) (3,150) 110 (33,485) (34,266) 781 101 13 (25) 83 39 (6) 106 130 153 104 110 781
Non-Pay (2,090) (2,196) 106 (24,358) (23,863) (495) 133 13 8 (109) (46) (218) 77 (30) (178) (79) 106 (495)
CIP 0 92 (92) 0 347 (347) (122) (118) (124) 288 (71) (77) (45) (101) 16 251 (92) (347)
Financing (13) (15) 1 (148) (161) 13 (1) 0 0 0 0 0 0 0 1 1 1 13
450 387 63 5,385 6,531 (1,146) (158) (224) 49 393 (325) (120) (106) (109) 49 62 63 0 (1,146)
Div4 & Reserves Month 11 YTDActual Plan Variance Actual Plan Variance M1 M2 M3 M4 M5 M6 M7 M8 M9 M10 M11 M12 YTD
Income 2,824 1,944 880 19,169 19,136 33 135 98 (102) 268 261 (160) (342) 71 (874) (201) 880 33
Pay (1,358) (1,505) 147 (16,849) (17,112) 263 (51) 26 (69) (91) (19) 135 1 105 50 28 147 263
Non-Pay (3,349) (2,973) (376) (35,684) (34,719) (965) (73) 542 114 1 149 (202) 35 (293) (402) (461) (376) (965)
CIP 0 (90) 90 0 (50) 50 317 336 285 (919) 6 150 (96) (90) (121) 93 90 50
Financing (1,178) (1,162) (15) (13,189) (12,841) (348) (23) (26) (27) (9) (59) (37) (44) 11 (58) (61) (15) (348)
(3,061) (3,787) 726 (46,553) (45,586) (967) 304 977 201 (750) 338 (114) (445) (196) (1,406) (602) 726 0 (967)
Community Month 11 YTDActual Plan Variance Actual Plan Variance M1 M2 M3 M4 M5 M6 M7 M8 M9 M10 M11 M12 YTD
Income 970 946 24 4,799 4,781 18 - - - - - - 42 (157) 96 13 24 18
Pay (643) (640) (2) (3,016) (3,202) 186 - - - - - - 83 (23) 3 125 (2) 186
Non-Pay (333) (314) (19) (1,653) (1,570) (82) - - - - - - (135) 156 (63) (21) (19) (82)
CIP 0 0 0 0 0 0 - - - - - - 0 0 0 0 0 0
Financing 0 0 0 0 0 0 - - - - - - 0 0 0 0 0 0
(6) (8) 3 130 8 122 - - - - - - (10) (23) 36 117 3 0 122
29
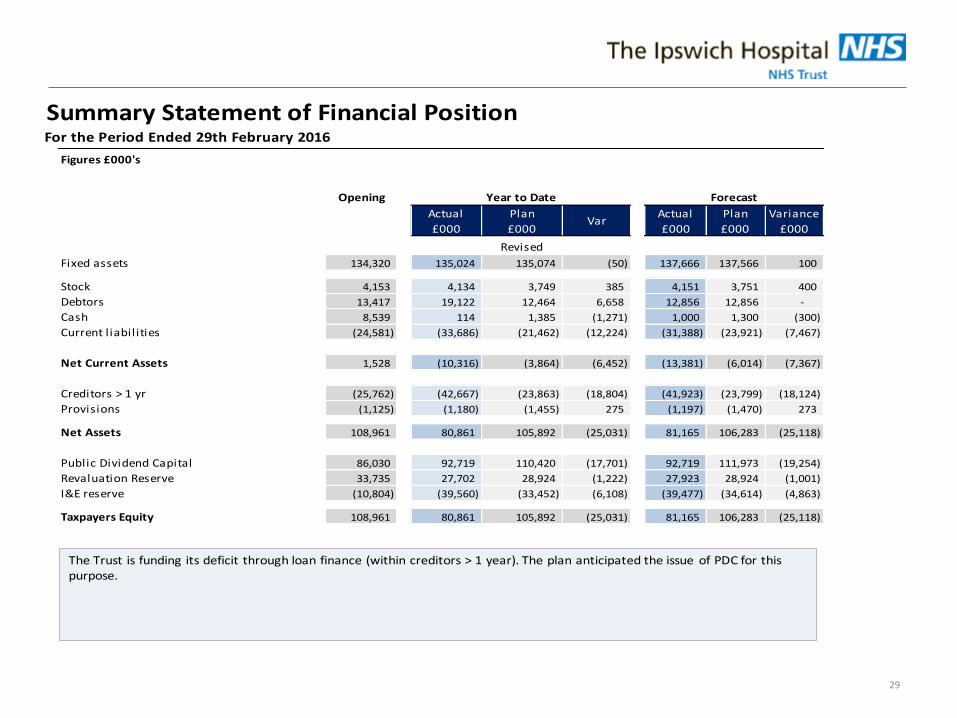
Summary Statement of Financial PositionFor the Period Ended 29th February 2016
Figures £000's
Opening
Actual
£000
Plan
£000Var
Actual
£000
Plan
£000
Variance
£000
Revised
Fixed assets 134,320 135,024 135,074 (50) 137,666 137,566 100
Stock 4,153 4,134 3,749 385 4,151 3,751 400
Debtors 13,417 19,122 12,464 6,658 12,856 12,856 -
Cash 8,539 114 1,385 (1,271) 1,000 1,300 (300)
Current l iabilities (24,581) (33,686) (21,462) (12,224) (31,388) (23,921) (7,467)
Net Current Assets 1,528 (10,316) (3,864) (6,452) (13,381) (6,014) (7,367)
Creditors > 1 yr (25,762) (42,667) (23,863) (18,804) (41,923) (23,799) (18,124)
Provisions (1,125) (1,180) (1,455) 275 (1,197) (1,470) 273
Net Assets 108,961 80,861 105,892 (25,031) 81,165 106,283 (25,118)
Public Dividend Capital 86,030 92,719 110,420 (17,701) 92,719 111,973 (19,254)
Revaluation Reserve 33,735 27,702 28,924 (1,222) 27,923 28,924 (1,001)
I&E reserve (10,804) (39,560) (33,452) (6,108) (39,477) (34,614) (4,863)
Taxpayers Equity 108,961 80,861 105,892 (25,031) 81,165 106,283 (25,118)
Year to Date Forecast
The Trust is funding its deficit through loan finance (within creditors > 1 year). The plan anticipated the issue of PDC for thispurpose.
30
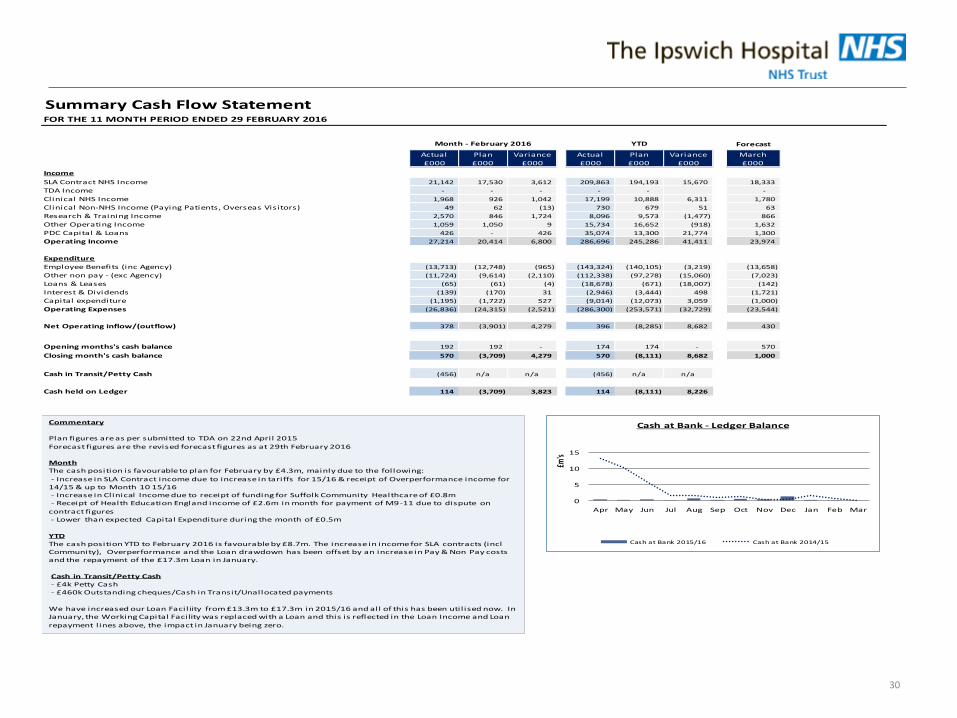
Summary Cash Flow StatementFOR THE 11 MONTH PERIOD ENDED 29 FEBRUARY 2016
Forecast
Actual
£000
Plan
£000
Variance
£000
Actual
£000
Plan
£000
Variance
£000
March
£000
Income
SLA Contract NHS Income 21,142 17,530 3,612 209,863 194,193 15,670 18,333
TDA Income - - - - - -
Clinical NHS Income 1,968 926 1,042 17,199 10,888 6,311 1,780
Clinical Non-NHS Income (Paying Patients, Overseas Visitors) 49 62 (13) 730 679 51 63
Research & Training Income 2,570 846 1,724 8,096 9,573 (1,477) 866
Other Operating Income 1,059 1,050 9 15,734 16,652 (918) 1,632
PDC Capital & Loans 426 - 426 35,074 13,300 21,774 1,300
Operating Income 27,214 20,414 6,800 286,696 245,286 41,411 23,974
Expenditure
Employee Benefits (inc Agency) (13,713) (12,748) (965) (143,324) (140,105) (3,219) (13,658)
Other non pay - (exc Agency) (11,724) (9,614) (2,110) (112,338) (97,278) (15,060) (7,023)
Loans & Leases (65) (61) (4) (18,678) (671) (18,007) (142)
Interest & Dividends (139) (170) 31 (2,946) (3,444) 498 (1,721)
Capital expenditure (1,195) (1,722) 527 (9,014) (12,073) 3,059 (1,000)
Operating Expenses (26,836) (24,315) (2,521) (286,300) (253,571) (32,729) (23,544)
Net Operating inflow/(outflow) 378 (3,901) 4,279 396 (8,285) 8,682 430
Opening months's cash balance 192 192 - 174 174 - 570
Closing month's cash balance 570 (3,709) 4,279 570 (8,111) 8,682 1,000
Cash in Transit/Petty Cash (456) n/a n/a (456) n/a n/a
Cash held on Ledger 114 (3,709) 3,823 114 (8,111) 8,226
Month - February 2016 YTD
0
5
10
15
Apr May Jun Jul Aug Sep Oct Nov Dec Jan Feb Mar
£m's
Cash at Bank - Ledger Balance
Cash at Bank 2015/16 Cash at Bank 2014/15
Commentary
Plan figures are as per submitted to TDA on 22nd April 2015
Forecast figures are the revised forecast figures as at 29th February 2016
MonthThe cash position is favourable to plan for February by £4.3m, mainly due to the following:
- Increase in SLA Contract income due to increase in tariffs for 15/16 & receipt of Overperformance income for 14/15 & up to Month 10 15/16- Increase in Clinical Income due to receipt of funding for Suffolk Community Healthcare of £0.8m - Receipt of Health Education England income of £2.6m in month for payment of M9-11 due to dispute on
contract figures- Lower than expected Capital Expenditure during the month of £0.5m
YTDThe cash position YTD to February 2016 is favourable by £8.7m. The increase in income for SLA contracts (incl Community), Overperformance and the Loan drawdown has been offset by an increase in Pay & Non Pay costs and the repayment of the £17.3m Loan in January.
Cash in Transit/Petty Cash- £4k Petty Cash- £460k Outstanding cheques/Cash in Transit/Unallocated payments
We have increased our Loan Facil iity from £13.3m to £17.3m in 2015/16 and all of this has been util ised now. In January, the Working Capital Facility was replaced with a Loan and this is reflected in the Loan Income and Loan
repayment l ines above, the impact in January being zero.
31
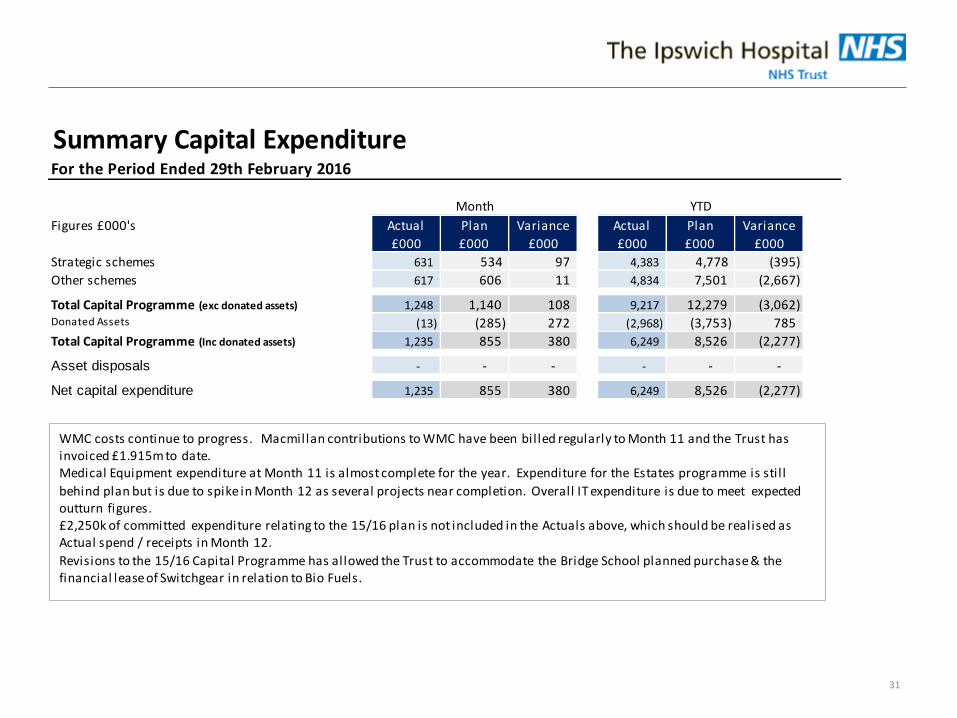
Summary Capital ExpenditureFor the Period Ended 29th February 2016
Figures £000's Actual
£000
Plan
£000
Variance
£000
Actual
£000
Plan
£000
Variance
£000
Strategic schemes 631 534 97 4,383 4,778 (395)
Other schemes 617 606 11 4,834 7,501 (2,667)
Total Capital Programme (exc donated assets) 1,248 1,140 108 9,217 12,279 (3,062) Donated Assets (13) (285) 272 (2,968) (3,753) 785
Total Capital Programme (Inc donated assets) 1,235 855 380 6,249 8,526 (2,277)
Asset disposals - - - - - -
Net capital expenditure 1,235 855 380 6,249 8,526 (2,277)
Month YTD
WMC costs continue to progress. Macmillan contributions to WMC have been bil led regularly to Month 11 and the Trust has invoiced £1.915m to date. Medical Equipment expenditure at Month 11 is almost complete for the year. Expenditure for the Estates programme is sti l l
behind plan but is due to spike in Month 12 as several projects near completion. Overall IT expenditure is due to meet expectedoutturn figures.£2,250k of committed expenditure relating to the 15/16 plan is not included in the Actuals above, which should be realised asActual spend / receipts in Month 12.
Revisions to the 15/16 Capital Programme has allowed the Trust to accommodate the Bridge School planned purchase & the financial lease of Switchgear in relation to Bio Fuels.
32
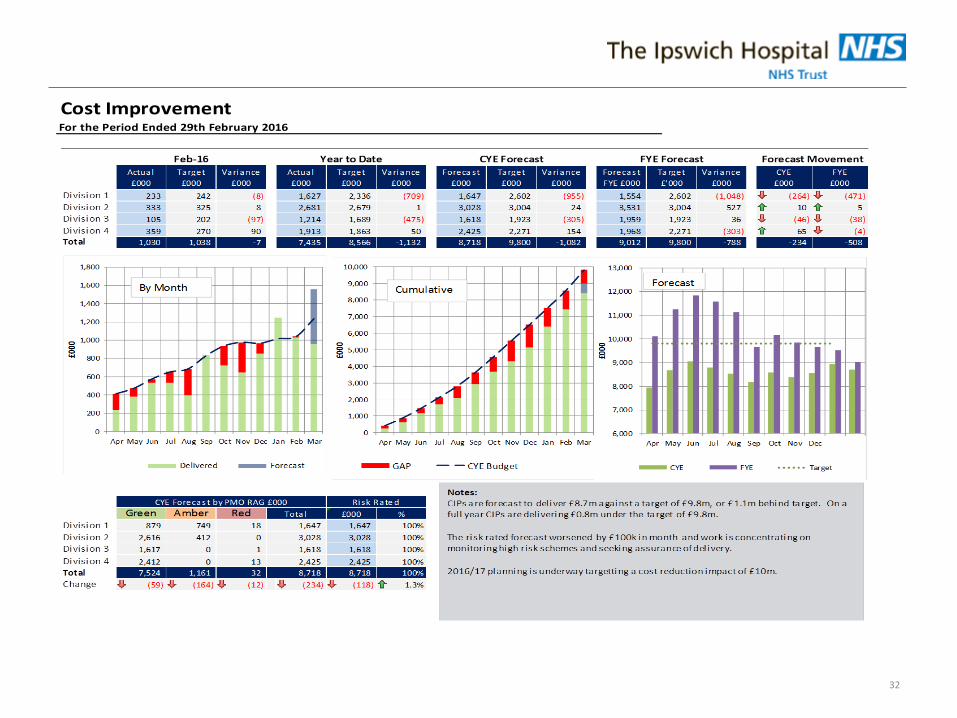
Cost ImprovementFor the Period Ended 29th February 2016
33
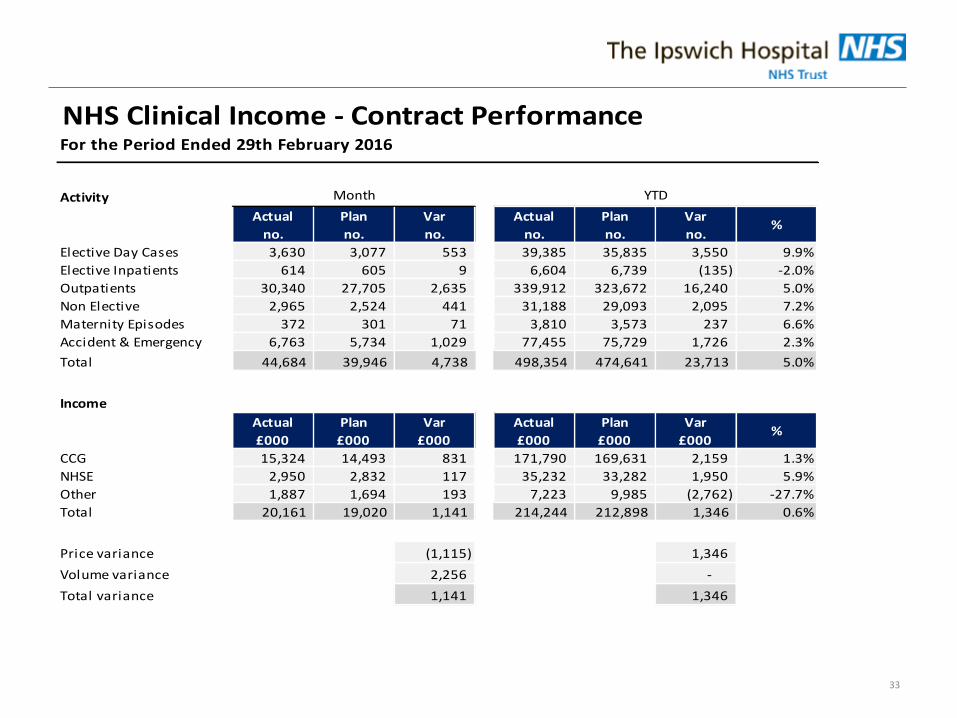
NHS Clinical Income - Contract PerformanceFor the Period Ended 29th February 2016
Activity
Actual
no.
Plan
no.
Var
no.
Actual
no.
Plan
no.
Var
no.%
Elective Day Cases 3,630 3,077 553 39,385 35,835 3,550 9.9%
Elective Inpatients 614 605 9 6,604 6,739 (135) -2.0%
Outpatients 30,340 27,705 2,635 339,912 323,672 16,240 5.0%
Non Elective 2,965 2,524 441 31,188 29,093 2,095 7.2%
Maternity Episodes 372 301 71 3,810 3,573 237 6.6%
Accident & Emergency 6,763 5,734 1,029 77,455 75,729 1,726 2.3%
Total 44,684 39,946 4,738 498,354 474,641 23,713 5.0%
Income
Actual
£000
Plan
£000
Var
£000
Actual
£000
Plan
£000
Var
£000%
CCG 15,324 14,493 831 171,790 169,631 2,159 1.3%
NHSE 2,950 2,832 117 35,232 33,282 1,950 5.9%
Other 1,887 1,694 193 7,223 9,985 (2,762) -27.7%
Total 20,161 19,020 1,141 214,244 212,898 1,346 0.6%
Price variance 451 476 (1,115) 430 1,346
Volume variance 2,256 -
Total variance 1,141 1,346
Month YTD
34
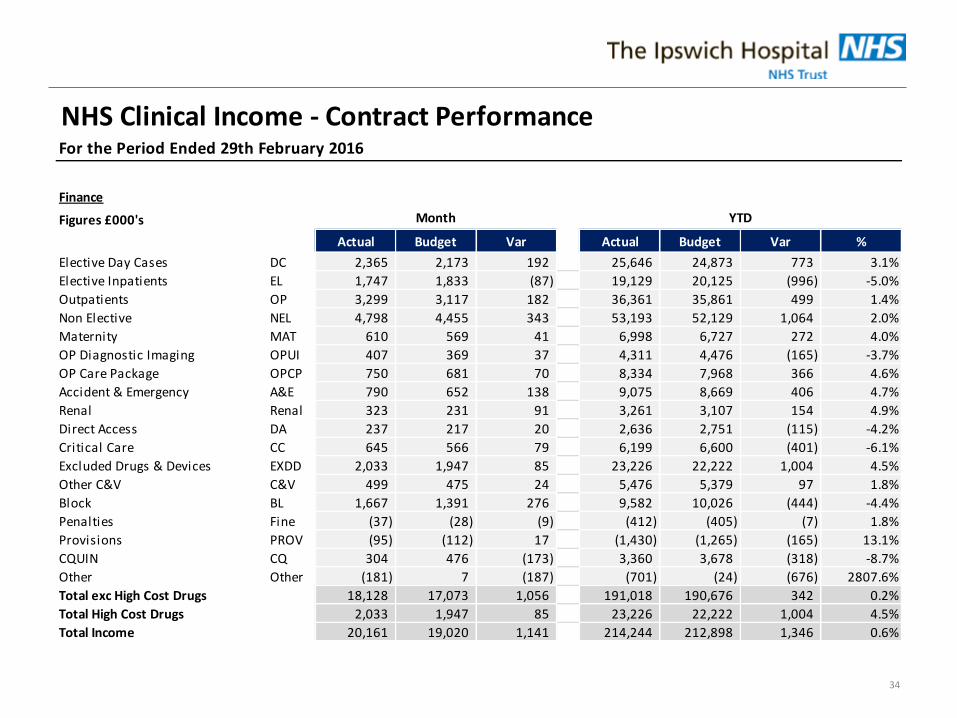
NHS Clinical Income - Contract PerformanceFor the Period Ended 29th February 2016
Finance
Figures £000's
Actual Budget Var Actual Budget Var %
Elective Day Cases DC 2,365 2,173 192 25,646 24,873 773 3.1%
Elective Inpatients EL 1,747 1,833 (87) 19,129 20,125 (996) -5.0%
Outpatients OP 3,299 3,117 182 36,361 35,861 499 1.4%
Non Elective NEL 4,798 4,455 343 53,193 52,129 1,064 2.0%
Maternity MAT 610 569 41 6,998 6,727 272 4.0%
OP Diagnostic Imaging OPUI 407 369 37 4,311 4,476 (165) -3.7%
OP Care Package OPCP 750 681 70 8,334 7,968 366 4.6%
Accident & Emergency A&E 790 652 138 9,075 8,669 406 4.7%
Renal Renal 323 231 91 3,261 3,107 154 4.9%
Direct Access DA 237 217 20 2,636 2,751 (115) -4.2%
Critical Care CC 645 566 79 6,199 6,600 (401) -6.1%
Excluded Drugs & Devices EXDD 2,033 1,947 85 23,226 22,222 1,004 4.5%
Other C&V C&V 499 475 24 5,476 5,379 97 1.8%
Block BL 1,667 1,391 276 9,582 10,026 (444) -4.4%
Penalties Fine (37) (28) (9) (412) (405) (7) 1.8%
Provisions PROV (95) (112) 17 (1,430) (1,265) (165) 13.1%
CQUIN CQ 304 476 (173) 3,360 3,678 (318) -8.7%
Other Other (181) 7 (187) (701) (24) (676) 2807.6%
Total exc High Cost Drugs 18,128 17,073 1,056 191,018 190,676 342 0.2%
Total High Cost Drugs 2,033 1,947 85 23,226 22,222 1,004 4.5%
Total Income 20,161 19,020 1,141 214,244 212,898 1,346 0.6%
Month YTD
35
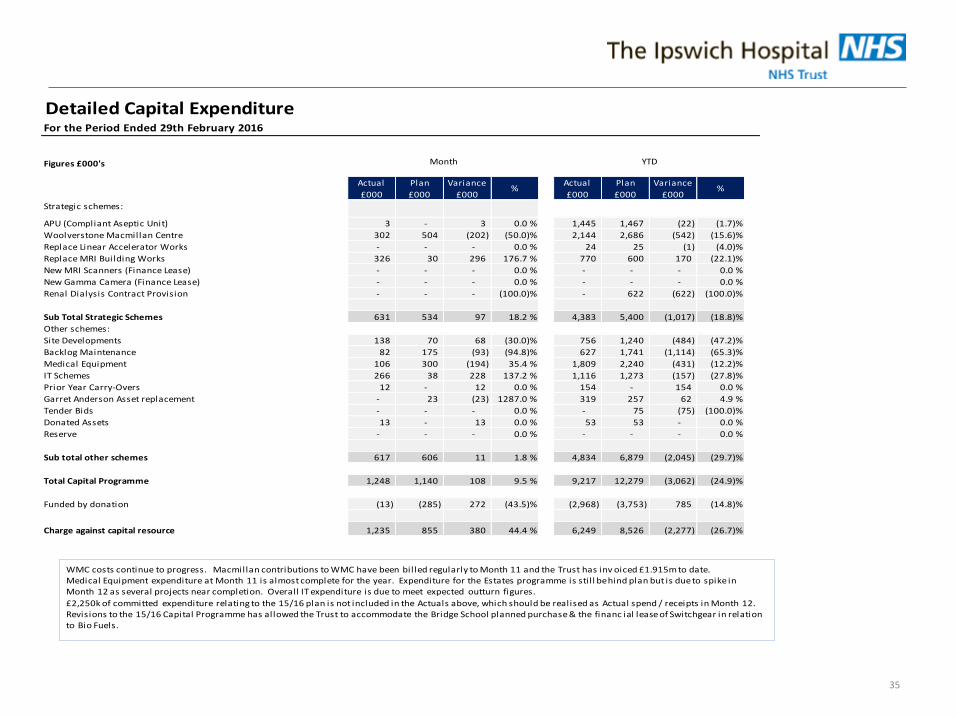
Detailed Capital ExpenditureFor the Period Ended 29th February 2016
Figures £000's
Actual
£000
Plan
£000
Variance
£000%
Actual
£000
Plan
£000
Variance
£000%
Strategic schemes:
APU (Compliant Aseptic Unit) 3 - 3 0.0 % 1,445 1,467 (22) (1.7)%
Woolverstone Macmillan Centre 302 504 (202) (50.0)% 2,144 2,686 (542) (15.6)%
Replace Linear Accelerator Works - - - 0.0 % 24 25 (1) (4.0)%
Replace MRI Building Works 326 30 296 176.7 % 770 600 170 (22.1)%
New MRI Scanners (Finance Lease) - - - 0.0 % - - - 0.0 %
New Gamma Camera (Finance Lease) - - - 0.0 % - - - 0.0 %
Renal Dialysis Contract Provision - - - (100.0)% - 622 (622) (100.0)%
Sub Total Strategic Schemes 631 534 97 18.2 % 4,383 5,400 (1,017) (18.8)%
Other schemes:
Site Developments 138 70 68 (30.0)% 756 1,240 (484) (47.2)%
Backlog Maintenance 82 175 (93) (94.8)% 627 1,741 (1,114) (65.3)%
Medical Equipment 106 300 (194) 35.4 % 1,809 2,240 (431) (12.2)%
IT Schemes 266 38 228 137.2 % 1,116 1,273 (157) (27.8)%
Prior Year Carry-Overs 12 - 12 0.0 % 154 - 154 0.0 %
Garret Anderson Asset replacement - 23 (23) 1287.0 % 319 257 62 4.9 %
Tender Bids - - - 0.0 % - 75 (75) (100.0)%
Donated Assets 13 - 13 0.0 % 53 53 - 0.0 %
Reserve - - - 0.0 % - - - 0.0 %
Sub total other schemes 617 606 11 1.8 % 4,834 6,879 (2,045) (29.7)%
Total Capital Programme 1,248 1,140 108 9.5 % 9,217 12,279 (3,062) (24.9)%
Funded by donation (13) (285) 272 (43.5)% (2,968) (3,753) 785 (14.8)%
Charge against capital resource 1,235 855 380 44.4 % 6,249 8,526 (2,277) (26.7)%
Month YTD
WMC costs continue to progress. Macmillan contributions to WMC have been billed regularly to Month 11 and the Trust has inv oiced £1.915m to date. Medical Equipment expenditure at Month 11 is almost complete for the year. Expenditure for the Estates programme is stil l behind plan but is due to spike in Month 12 as several projects near completion. Overall IT expenditure is due to meet expected outturn figures.
£2,250k of committed expenditure relating to the 15/16 plan is not included in the Actuals above, which should be realised as Actual spend / receipts in Month 12.Revisions to the 15/16 Capital Programme has allowed the Trust to accommodate the Bridge School planned purchase & the financ ial lease of Switchgear in relation to Bio Fuels.
36
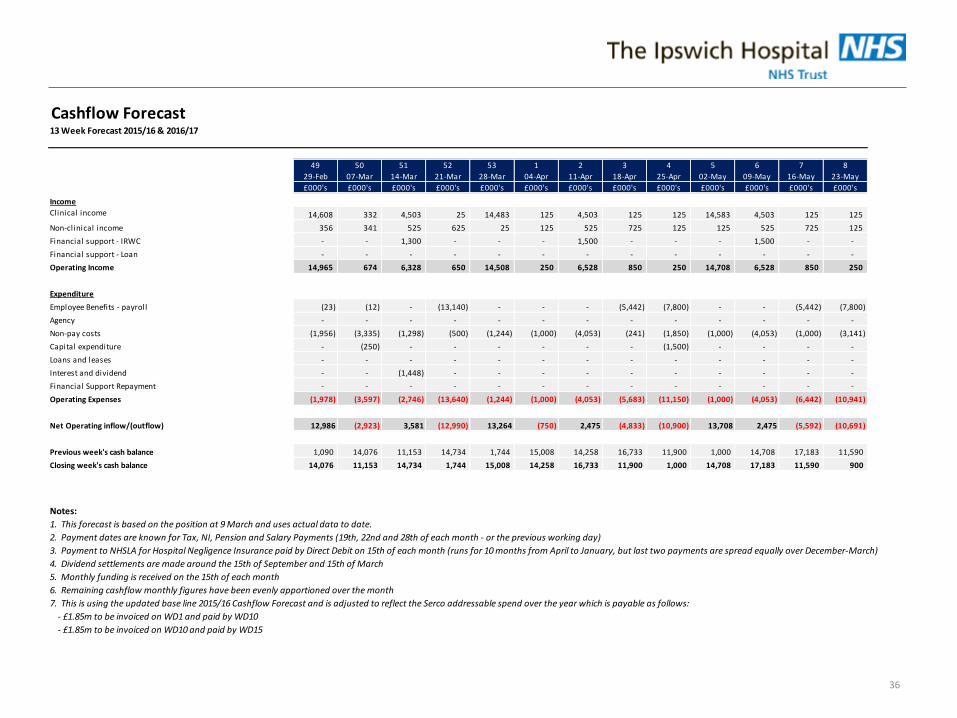
Cashflow Forecast13 Week Forecast 2015/16 & 2016/17
49 50 51 52 53 1 2 3 4 5 6 7 8
29-Feb 07-Mar 14-Mar 21-Mar 28-Mar 04-Apr 11-Apr 18-Apr 25-Apr 02-May 09-May 16-May 23-May
£000's £000's £000's £000's £000's £000's £000's £000's £000's £000's £000's £000's £000's
Income
Clinical income 14,608 332 4,503 25 14,483 125 4,503 125 125 14,583 4,503 125 125
Non-clinical income 356 341 525 625 25 125 525 725 125 125 525 725 125
Financial support - IRWC - - 1,300 - - - 1,500 - - - 1,500 - -
Financial support - Loan - - - - - - - - - - - - -
Operating Income 14,965 674 6,328 650 14,508 250 6,528 850 250 14,708 6,528 850 250
Expenditure
Employee Benefits - payroll (23) (12) - (13,140) - - - (5,442) (7,800) - - (5,442) (7,800)
Agency - - - - - - - - - - - - -
Non-pay costs (1,956) (3,335) (1,298) (500) (1,244) (1,000) (4,053) (241) (1,850) (1,000) (4,053) (1,000) (3,141)
Capital expenditure - (250) - - - - - - (1,500) - - - -
Loans and leases - - - - - - - - - - - - -
Interest and dividend - - (1,448) - - - - - - - - - -
Financial Support Repayment - - - - - - - - - - - - -
Operating Expenses (1,978) (3,597) (2,746) (13,640) (1,244) (1,000) (4,053) (5,683) (11,150) (1,000) (4,053) (6,442) (10,941)
Net Operating inflow/(outflow) 12,986 (2,923) 3,581 (12,990) 13,264 (750) 2,475 (4,833) (10,900) 13,708 2,475 (5,592) (10,691)
Previous week's cash balance 1,090 14,076 11,153 14,734 1,744 15,008 14,258 16,733 11,900 1,000 14,708 17,183 11,590
Closing week's cash balance 14,076 11,153 14,734 1,744 15,008 14,258 16,733 11,900 1,000 14,708 17,183 11,590 900
Notes:
1. This forecast is based on the position at 9 March and uses actual data to date.
2. Payment dates are known for Tax, NI, Pension and Salary Payments (19th, 22nd and 28th of each month - or the previous working day)
3. Payment to NHSLA for Hospital Negligence Insurance paid by Direct Debit on 15th of each month (runs for 10 months from April to January, but last two payments are spread equally over December-March)
4. Dividend settlements are made around the 15th of September and 15th of March
5. Monthly funding is received on the 15th of each month
6. Remaining cashflow monthly figures have been evenly apportioned over the month
7. This is using the updated base line 2015/16 Cashflow Forecast and is adjusted to reflect the Serco addressable spend over the year which is payable as follows:
- £1.85m to be invoiced on WD1 and paid by WD10
- £1.85m to be invoiced on WD10 and paid by WD15
37
Working Capital - Debtors29th February 2016
Figures £000's
Trade Debtors by Age
Aged Analysis of Trade DebtorsFigures £000's <30 days 31-60 days 61-90 days >90 days Total
Current Month 1,212 1,046 920 2,491 5,668
Previous month 3,244 1,286 2,753 1,378 8,660
Movement in Month (2,032) (240) (1,833) 1,113 (2,992)
NHS £000s <30 days 31-60 days 61-90 days >90 days Total January Movement Movement %
NHS Commissioning Board 197 68 - 24 289 275 14 4.8%
NHS Suffolk/Ipswich & East 234 97 277 514 1,122 987 135 12.0%
NHS Norfolk & Suffolk FT 101 - 115 82 298 486 (188) -63.1%
Health Education England 3 - - - 3 1,933 (1,930) -64333.3%
Colchester Hospital 7 1 224 3 235 233 2 0.9%
Other NHS 279 244 139 638 1,300 2,462 (1,162) -89.4%
Total NHS 821 410 755 1,261 3,247 6,376 (3,129) -49.1%
Non NHS £000s
<30 days 31-60 days 61-90 days >90 days Total January Movement Movement %
Pharmacy - - - - - 1 (1) #DIV/0!
Miscellaneous 307 600 154 996 2,057 1,976 81 3.9%
Payroll 4 1 8 112 125 124 1 0.8%
Occupational health - - - - - - - #DIV/0!
Private patients 56 33 2 23 114 82 32 28.1%
Overseas patients 24 2 1 99 125 101 24 19.2%
Total Non NHS 391 636 165 1,230 2,421 2,284 137 6.0%
Total Debtors 1,212 1,046 920 2,491 5,668 8,660 (2,992) -34.5%
< 30 days 31-60 days 61-90 days > 90 days
NHS trade debtors 25% 13% 23% 39%
Non-NHS trade debtors 16% 26% 7% 51%
Total Trade Debtors 2014-15 v 2015-16
0
0.5
1
1.5
2
2.5
3
<30 days 31-60 days 61-90 days >90 days
Total NHS Total Non NHS
0
5
10
15
20
25
30
Apr May Jun Jul Aug Sep Oct Nov Dec Jan Feb Mar
£m
2015-16 2014-15
0
0.5
1
1.5
2
2.5
3
3.5
4
<30 days 31-60 days 61-90 days >90 days
Total NHS Total Non NHS
0
5
10
15
20
25
30
Apr May Jun Jul Aug Sep Oct Nov Dec Jan Feb Mar
£m
2015-16 2014-15
0
0.5
1
1.5
2
2.5
3
3.5
4
4.5
5
<30 days 31-60 days 61-90 days >90 days
Total NHS Total Non NHS
0
5
10
15
20
25
30
Apr May Jun Jul Aug Sep Oct Nov Dec Jan Feb Mar
£m
2015-16 2014-15
0
0.5
1
1.5
2
2.5
3
3.5
<30 days 31-60 days 61-90 days >90 days
Total NHS Total Non NHS
0
5
10
15
20
25
30
Apr May Jun Jul Aug Sep Oct Nov Dec Jan Feb Mar
£m
2015-16 2014-15
Key Notes:
NHS
Overall NHS debtors have decresed by £3.1m from last month, mainly due to settlement of overdue invoices by Health Education England. The debtors processing and chasing is undertaken by Serco and the Trust will l iaise with them to ensure every effort is stil l being made to chase and recover debts in a more timely fashion.
Other non-NHS
Non NHS debtors have increased in the month by £137k. Finance and Payroll are l iaising to review the processes around Payrol l overpayments and to ensure the policy and processes are updated regarding this to ensure any overpayments are recovered in a more timely manner.
Total Debtors
The overall debtors decreased by 34.5% due to the above factors.
There has been an increased effort in chasing debt and this is to be backed up by the issue of a new Credit Control procedure which is now in place, to ensure that the appropriate steps are taken to improve the cash position of the Trust, in close liaison with Serco
0
0.5
1
1.5
2
2.5
3
<30 days 31-60 days 61-90 days >90 days
Total NHS Total Non NHS
Notes
31-60 days
Other NHS contains invoices amounting to £143k for Mid Essex CCG, £32k for Public Health England & £17k for Cambridge & Peterborough CCG
Non NHS Misc includes invoices for The Pathology Partnership (£287k) , MacMillan Cancer Research (£161k) & Suffolk Social Services (£46k)
61-90 days
Other NHS includes outstanding invoices amounting to £32k for
Great Ormond Street Hospital, & £21k for Sunderland CCG.Non NHS Misc includes invoices for Abbotts Diabetes Care (£136k)
>90 days
Other NHS contains invoices amounting to £344k for North East Essex CCG, £111k for Papworth Hospital, £106k for Public Health England & £32k for GOSH, together with a Credit Balance for NHS
W London (£36k).Non NHS Misc includes outstanding invoices for The Pathology Partnership (£824k), Suffolk Social Services (£77k) & HM Coroners
Office (£39k)Payroll debts account for £112k, an increase of £23k from last monthOverseas patients account for £99k with one patient owing £46K,
which is being repaid.
0
5
10
15
20
25
30
Apr May Jun Jul Aug Sep Oct Nov Dec Jan Feb Mar
£m
2015-16 2014-15
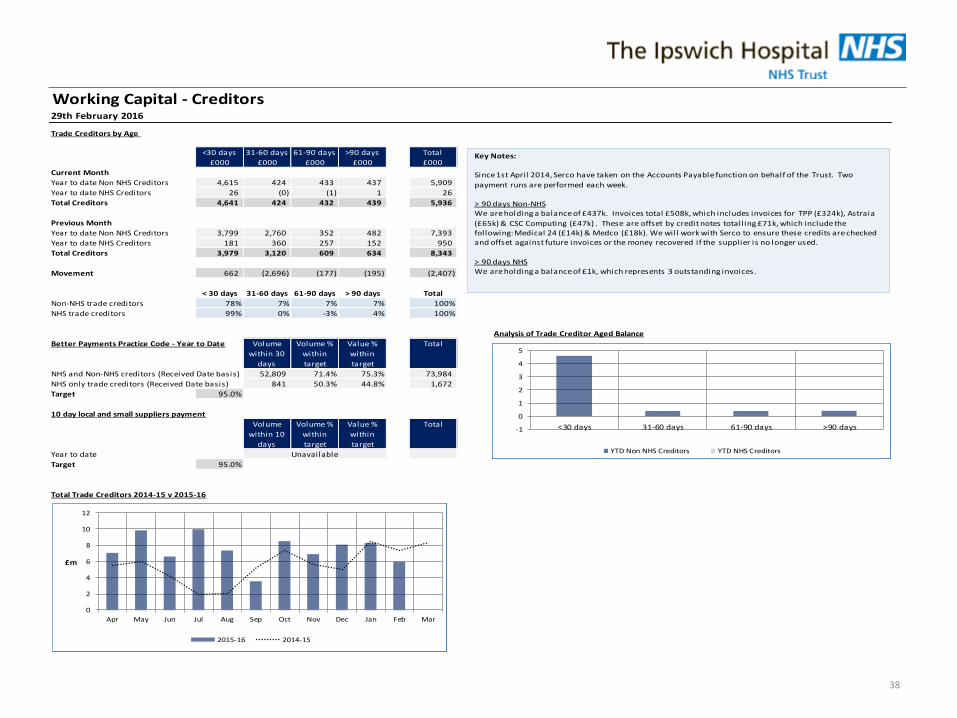
38
Working Capital - Creditors29th February 2016
Trade Creditors by Age
<30 days
£000
31-60 days
£000
61-90 days
£000
>90 days
£000
Total
£000
Current Month
Year to date Non NHS Creditors 4,615 424 433 437 5,909
Year to date NHS Creditors 26 (0) (1) 1 26
Total Creditors 4,641 424 432 439 5,936
Previous Month
Year to date Non NHS Creditors 3,799 2,760 352 482 7,393
Year to date NHS Creditors 181 360 257 152 950
Total Creditors 3,979 3,120 609 634 8,343
Movement 662 (2,696) (177) (195) (2,407)
< 30 days 31-60 days 61-90 days > 90 days Total
Non-NHS trade creditors 78% 7% 7% 7% 100%
NHS trade creditors 99% 0% -3% 4% 100%
Analysis of Trade Creditor Aged Balance
Better Payments Practice Code - Year to Date Volume
within 30
days
Volume %
within
target
Value %
within
target
Total
NHS and Non-NHS creditors (Received Date basis) 52,809 71.4% 75.3% 73,984
NHS only trade creditors (Received Date basis) 841 50.3% 44.8% 1,672
Target 95.0%
10 day local and small suppliers payment
Volume
within 10
days
Volume %
within
target
Value %
within
target
Total
Year to date
Target 95.0%
Total Trade Creditors 2014-15 v 2015-16
Unavailable
0
2
4
6
8
10
12
Apr May Jun Jul Aug Sep Oct Nov Dec Jan Feb Mar
£m
2015-16 2014-15
0
1
2
3
4
5
<30 days 31-60 days 61-90 days >90 days
YTD Non NHS Creditors YTD NHS Creditors
0
2
4
6
8
10
12
Apr May Jun Jul Aug Sep Oct Nov Dec Jan Feb Mar
£m
2015-16 2014-15
-1
0
1
2
3
4
5
<30 days 31-60 days 61-90 days >90 days
YTD Non NHS Creditors YTD NHS Creditors
0
2
4
6
8
10
12
Apr May Jun Jul Aug Sep Oct Nov Dec Jan Feb Mar
£m
2015-16 2014-15
0
1
2
3
4
5
<30 days 31-60 days 61-90 days >90 days
YTD Non NHS Creditors YTD NHS Creditors
0
2
4
6
8
10
12
Apr May Jun Jul Aug Sep Oct Nov Dec Jan Feb Mar
£m
2015-16 2014-15
0
1
2
3
4
5
<30 days 31-60 days 61-90 days >90 days
YTD Non NHS Creditors YTD NHS Creditors
0
2
4
6
8
10
12
Apr May Jun Jul Aug Sep Oct Nov Dec Jan Feb Mar
£m
2015-16 2014-15
Key Notes:
Since 1st April 2014, Serco have taken on the Accounts Payable function on behalf of the Trust. Two
payment runs are performed each week.
> 90 days Non-NHSWe are holding a balance of £437k. Invoices total £508k, which includes invoices for TPP (£324k), Astraia
(£65k) & CSC Computing (£47k) . These are offset by credit notes totall ing £71k, which include the following: Medical 24 (£14k) & Medco (£18k). We will work with Serco to ensure these credits are checked and offset against future invoices or the money recovered if the supplier is no longer used.
> 90 days NHSWe are holding a balance of £1k, which represents 3 outstanding invoices.
-1
0
1
2
3
4
5
<30 days 31-60 days 61-90 days >90 days
YTD Non NHS Creditors YTD NHS Creditors
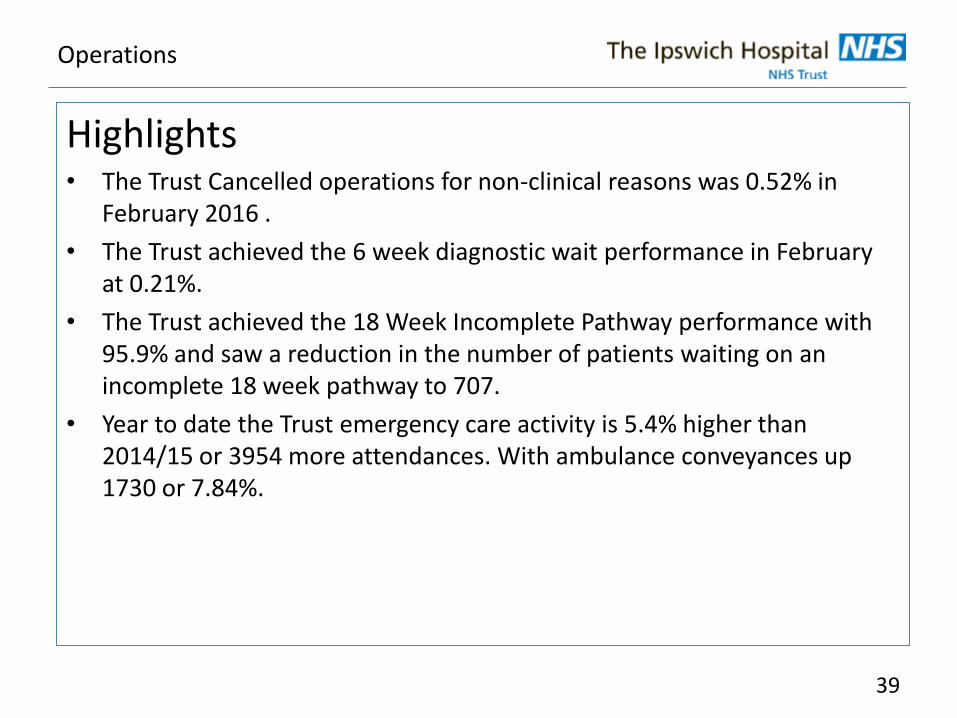
Operations
39
Highlights • The Trust Cancelled operations for non-clinical reasons was 0.52% in
February 2016 .
• The Trust achieved the 6 week diagnostic wait performance in February at 0.21%.
• The Trust achieved the 18 Week Incomplete Pathway performance with 95.9% and saw a reduction in the number of patients waiting on an incomplete 18 week pathway to 707.
• Year to date the Trust emergency care activity is 5.4% higher than 2014/15 or 3954 more attendances. With ambulance conveyances up 1730 or 7.84%.
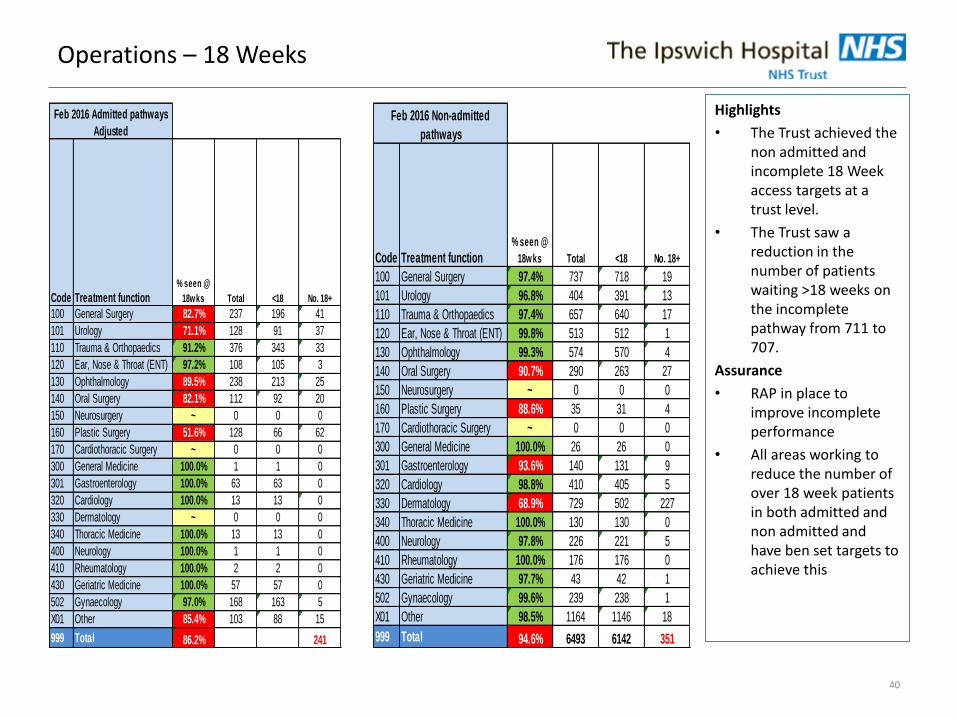
Operations – 18 Weeks
Highlights
• The Trust achieved the non admitted and incomplete 18 Week access targets at a trust level.
• The Trust saw a reduction in the number of patients waiting >18 weeks on the incomplete pathway from 711 to 707.
Assurance
• RAP in place to improve incomplete performance
• All areas working to reduce the number of over 18 week patients in both admitted and non admitted and have ben set targets to achieve this
40
Code Treatment function% seen @
18wks Total <18 No. 18+
100 General Surgery 82.7% 237 196 41
101 Urology 71.1% 128 91 37
110 Trauma & Orthopaedics 91.2% 376 343 33
120 Ear, Nose & Throat (ENT) 97.2% 108 105 3
130 Ophthalmology 89.5% 238 213 25
140 Oral Surgery 82.1% 112 92 20
150 Neurosurgery ~ 0 0 0
160 Plastic Surgery 51.6% 128 66 62
170 Cardiothoracic Surgery ~ 0 0 0
300 General Medicine 100.0% 1 1 0
301 Gastroenterology 100.0% 63 63 0
320 Cardiology 100.0% 13 13 0
330 Dermatology ~ 0 0 0
340 Thoracic Medicine 100.0% 13 13 0
400 Neurology 100.0% 1 1 0
410 Rheumatology 100.0% 2 2 0
430 Geriatric Medicine 100.0% 57 57 0
502 Gynaecology 97.0% 168 163 5
X01 Other 85.4% 103 88 15
999 Total 86.2% 1748 1507 241
Feb 2016 Admitted pathways
Adjusted
Code Treatment function% seen @
18wks Total <18 No. 18+
100 General Surgery 97.4% 737 718 19
101 Urology 96.8% 404 391 13
110 Trauma & Orthopaedics 97.4% 657 640 17
120 Ear, Nose & Throat (ENT) 99.8% 513 512 1
130 Ophthalmology 99.3% 574 570 4
140 Oral Surgery 90.7% 290 263 27
150 Neurosurgery ~ 0 0 0
160 Plastic Surgery 88.6% 35 31 4
170 Cardiothoracic Surgery ~ 0 0 0
300 General Medicine 100.0% 26 26 0
301 Gastroenterology 93.6% 140 131 9
320 Cardiology 98.8% 410 405 5
330 Dermatology 68.9% 729 502 227
340 Thoracic Medicine 100.0% 130 130 0
400 Neurology 97.8% 226 221 5
410 Rheumatology 100.0% 176 176 0
430 Geriatric Medicine 97.7% 43 42 1
502 Gynaecology 99.6% 239 238 1
X01 Other 98.5% 1164 1146 18
999 Total 94.6% 6493 6142 351
Feb 2016 Non-admitted
pathways
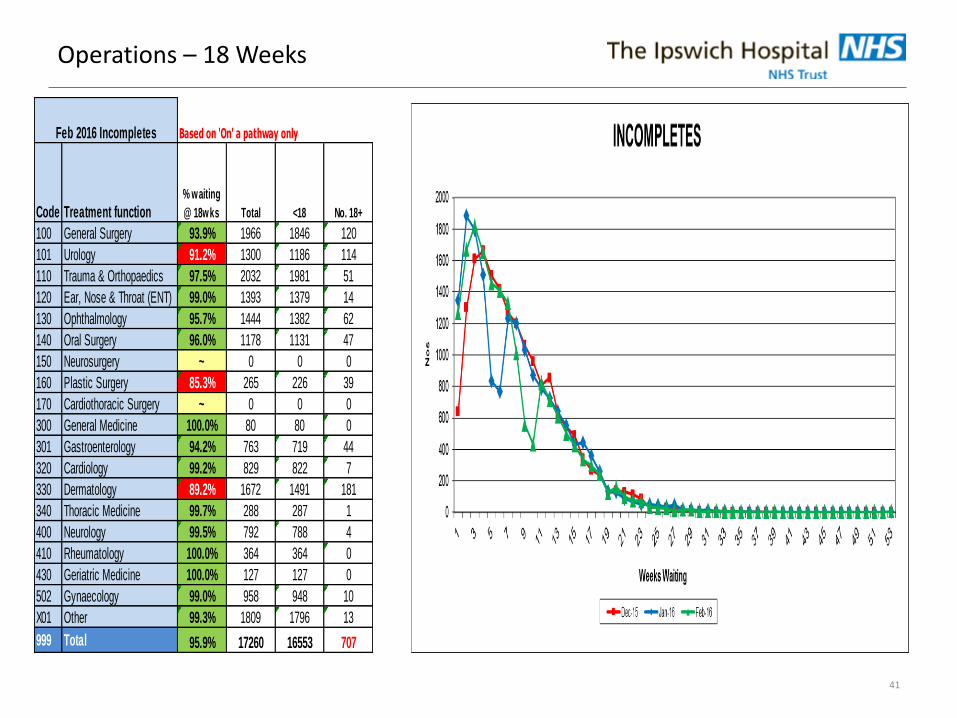
Operations – 18 Weeks
41
Based on 'On' a pathway only
Code Treatment function% waiting
@ 18wks Total <18 No. 18+
100 General Surgery 93.9% 1966 1846 120
101 Urology 91.2% 1300 1186 114
110 Trauma & Orthopaedics 97.5% 2032 1981 51
120 Ear, Nose & Throat (ENT) 99.0% 1393 1379 14
130 Ophthalmology 95.7% 1444 1382 62
140 Oral Surgery 96.0% 1178 1131 47
150 Neurosurgery ~ 0 0 0
160 Plastic Surgery 85.3% 265 226 39
170 Cardiothoracic Surgery ~ 0 0 0
300 General Medicine 100.0% 80 80 0
301 Gastroenterology 94.2% 763 719 44
320 Cardiology 99.2% 829 822 7
330 Dermatology 89.2% 1672 1491 181
340 Thoracic Medicine 99.7% 288 287 1
400 Neurology 99.5% 792 788 4
410 Rheumatology 100.0% 364 364 0
430 Geriatric Medicine 100.0% 127 127 0
502 Gynaecology 99.0% 958 948 10
X01 Other 99.3% 1809 1796 13
999 Total 95.9% 17260 16553 707
Feb 2016 Incompletes
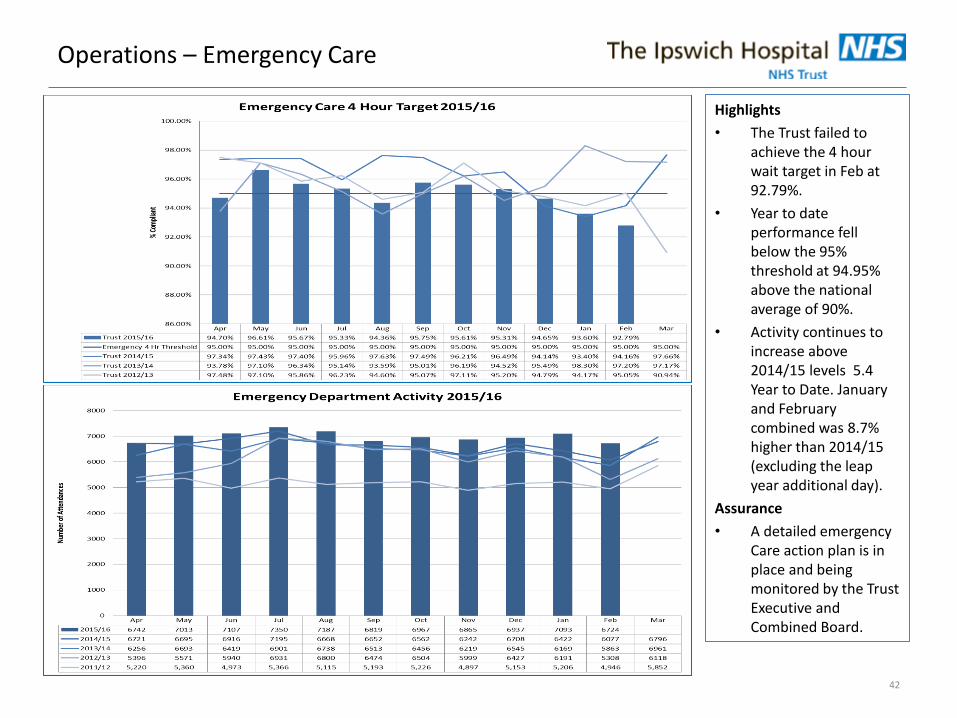
Operations – Emergency Care
Highlights
• The Trust failed to achieve the 4 hour wait target in Feb at 92.79%.
• Year to date performance fell below the 95% threshold at 94.95% above the national average of 90%.
• Activity continues to increase above 2014/15 levels 5.4 Year to Date. January and February combined was 8.7% higher than 2014/15 (excluding the leap year additional day).
Assurance
• A detailed emergency Care action plan is in place and being monitored by the Trust Executive and Combined Board.
42
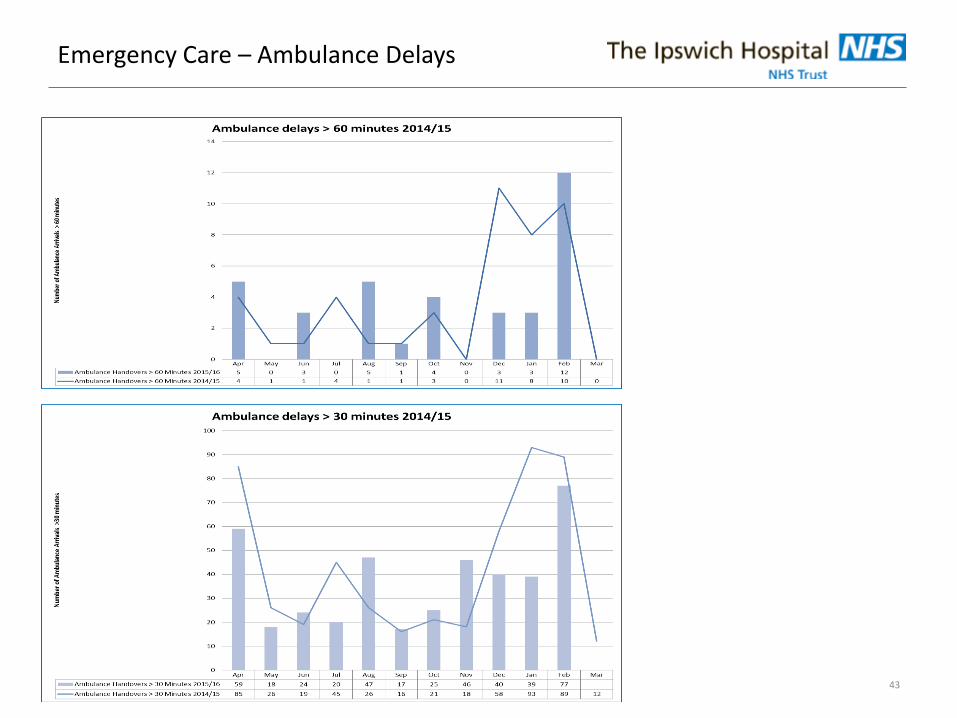
Emergency Care – Ambulance Delays
43
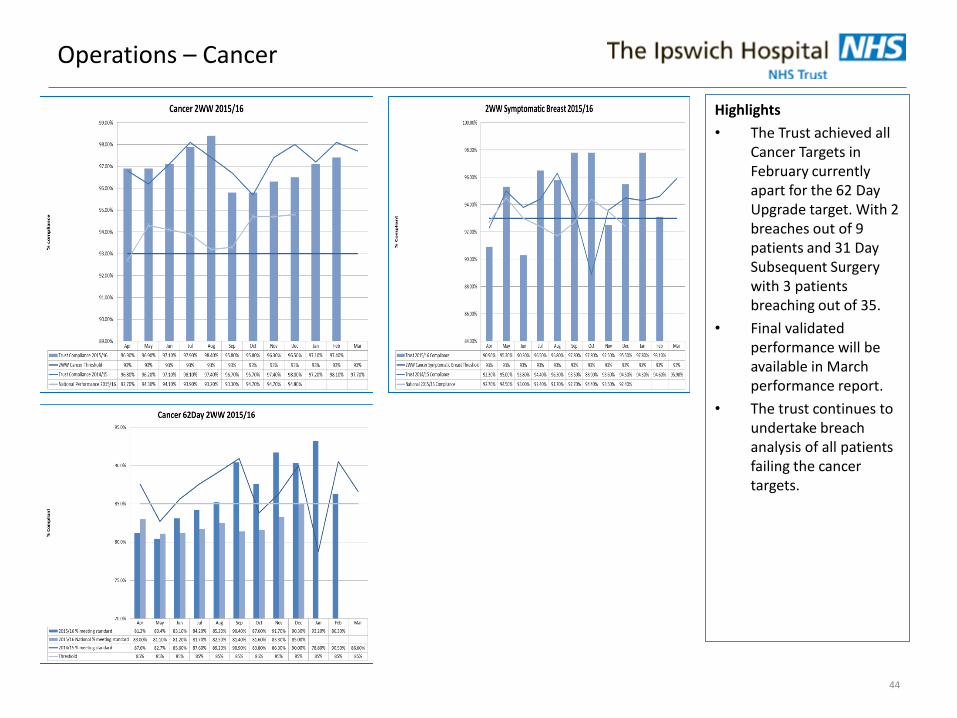
Operations – Cancer
Highlights
• The Trust achieved all Cancer Targets in February currently apart for the 62 Day Upgrade target. With 2 breaches out of 9 patients and 31 Day Subsequent Surgery with 3 patients breaching out of 35.
• Final validated performance will be available in March performance report.
• The trust continues to undertake breach analysis of all patients failing the cancer targets.
44
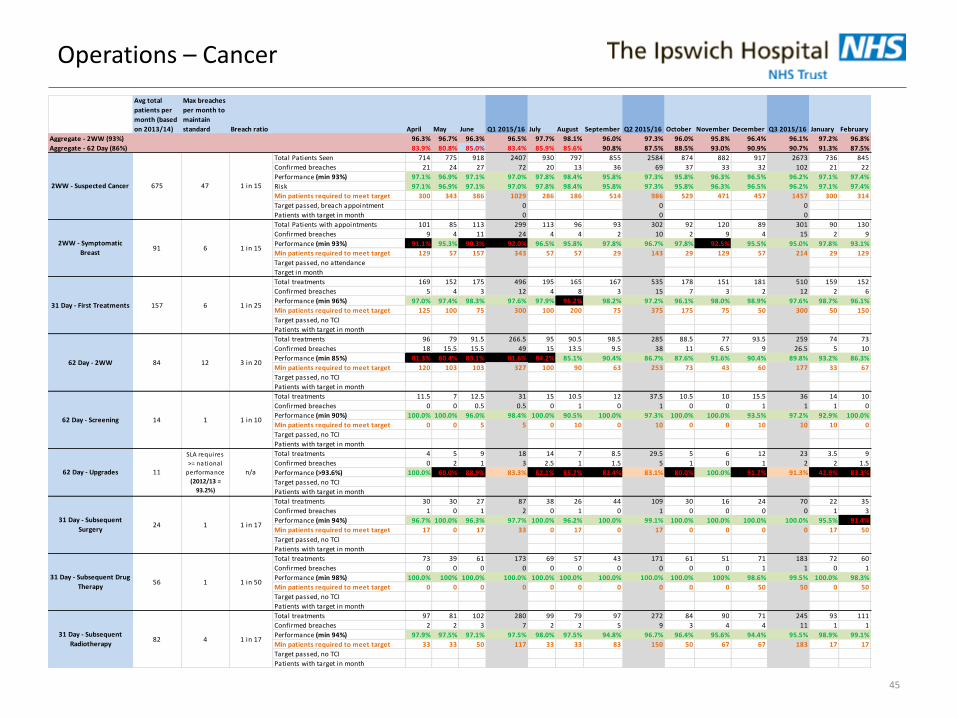
Operations – Cancer
45
Avg total
patients per
month (based
on 2013/14)
Max breaches
per month to
maintain
standard Breach ratio April May June Q1 2015/16 July August September Q2 2015/16 October November December Q3 2015/16 January February
Aggregate - 2WW (93%) 96.3% 96.7% 96.3% 96.5% 97.7% 98.1% 96.0% 97.3% 96.0% 95.8% 96.4% 96.1% 97.2% 96.8%
Aggregate - 62 Day (86%) 83.9% 80.8% 85.0% 83.4% 85.9% 85.6% 90.8% 87.5% 88.5% 93.0% 90.9% 90.7% 91.3% 87.5%
Total Patients Seen 714 775 918 2407 930 797 855 2584 874 882 917 2673 736 845
Confirmed breaches 21 24 27 72 20 13 36 69 37 33 32 102 21 22
Performance (min 93%) 97.1% 96.9% 97.1% 97.0% 97.8% 98.4% 95.8% 97.3% 95.8% 96.3% 96.5% 96.2% 97.1% 97.4%
Risk 97.1% 96.9% 97.1% 97.0% 97.8% 98.4% 95.8% 97.3% 95.8% 96.3% 96.5% 96.2% 97.1% 97.4%
Min patients required to meet target 300 343 386 1029 286 186 514 986 529 471 457 1457 300 314
Target passed, breach appointment 0 0 0
Patients with target in month 0 0 0
Total Patients with appointments 101 85 113 299 113 96 93 302 92 120 89 301 90 130
Confirmed breaches 9 4 11 24 4 4 2 10 2 9 4 15 2 9
Performance (min 93%) 91.1% 95.3% 90.3% 92.0% 96.5% 95.8% 97.8% 96.7% 97.8% 92.5% 95.5% 95.0% 97.8% 93.1%
Min patients required to meet target 129 57 157 343 57 57 29 143 29 129 57 214 29 129
Target passed, no attendance
Target in month
Total treatments 169 152 175 496 195 165 167 535 178 151 181 510 159 152
Confirmed breaches 5 4 3 12 4 8 3 15 7 3 2 12 2 6
Performance (min 96%) 97.0% 97.4% 98.3% 97.6% 97.9% 95.2% 98.2% 97.2% 96.1% 98.0% 98.9% 97.6% 98.7% 96.1%
Min patients required to meet target 125 100 75 300 100 200 75 375 175 75 50 300 50 150
Target passed, no TCI
Patients with target in month
Total treatments 96 79 91.5 266.5 95 90.5 98.5 285 88.5 77 93.5 259 74 73
Confirmed breaches 18 15.5 15.5 49 15 13.5 9.5 38 11 6.5 9 26.5 5 10
Performance (min 85%) 81.3% 80.4% 83.1% 81.6% 84.2% 85.1% 90.4% 86.7% 87.6% 91.6% 90.4% 89.8% 93.2% 86.3%
Min patients required to meet target 120 103 103 327 100 90 63 253 73 43 60 177 33 67
Target passed, no TCI
Patients with target in month
Total treatments 11.5 7 12.5 31 15 10.5 12 37.5 10.5 10 15.5 36 14 10
Confirmed breaches 0 0 0.5 0.5 0 1 0 1 0 0 1 1 1 0
Performance (min 90%) 100.0% 100.0% 96.0% 98.4% 100.0% 90.5% 100.0% 97.3% 100.0% 100.0% 93.5% 97.2% 92.9% 100.0%
Min patients required to meet target 0 0 5 5 0 10 0 10 0 0 10 10 10 0
Target passed, no TCI
Patients with target in month
Total treatments 4 5 9 18 14 7 8.5 29.5 5 6 12 23 3.5 9
Confirmed breaches 0 2 1 3 2.5 1 1.5 5 1 0 1 2 2 1.5
Performance (>93.6%) 100.0% 60.0% 88.9% 83.3% 82.1% 85.7% 82.4% 83.1% 80.0% 100.0% 91.7% 91.3% 42.9% 83.3%
Target passed, no TCI
Patients with target in month
Total treatments 30 30 27 87 38 26 44 109 30 16 24 70 22 35
Confirmed breaches 1 0 1 2 0 1 0 1 0 0 0 0 1 3
Performance (min 94%) 96.7% 100.0% 96.3% 97.7% 100.0% 96.2% 100.0% 99.1% 100.0% 100.0% 100.0% 100.0% 95.5% 91.4%
Min patients required to meet target 17 0 17 33 0 17 0 17 0 0 0 0 17 50
Target passed, no TCI
Patients with target in month
Total treatments 73 39 61 173 69 57 43 171 61 51 71 183 72 60
Confirmed breaches 0 0 0 0 0 0 0 0 0 0 1 1 0 1
Performance (min 98%) 100.0% 100% 100.0% 100.0% 100.0% 100.0% 100.0% 100.0% 100.0% 100% 98.6% 99.5% 100.0% 98.3%
Min patients required to meet target 0 0 0 0 0 0 0 0 0 0 50 50 0 50
Target passed, no TCI
Patients with target in month
Total treatments 97 81 102 280 99 79 97 272 84 90 71 245 93 111
Confirmed breaches 2 2 3 7 2 2 5 9 3 4 4 11 1 1
Performance (min 94%) 97.9% 97.5% 97.1% 97.5% 98.0% 97.5% 94.8% 96.7% 96.4% 95.6% 94.4% 95.5% 98.9% 99.1%
Min patients required to meet target 33 33 50 117 33 33 83 150 50 67 67 183 17 17
Target passed, no TCI
Patients with target in month
2WW - Suspected Cancer 675 47 1 in 15
31 Day - First Treatments 157 6 1 in 25
62 Day - Upgrades 11
SLA requires
>= national
performance
(2012/13 =
93.2%)
n/a
1 in 156912WW - Symptomatic
Breast
62 Day - 2WW 84 12 3 in 20
62 Day - Screening 14 1 1 in 10
31 Day - Subsequent
Radiotherapy82 4 1 in 17
31 Day - Subsequent
Surgery24 1 1 in 17
31 Day - Subsequent Drug
Therapy56 1 1 in 50
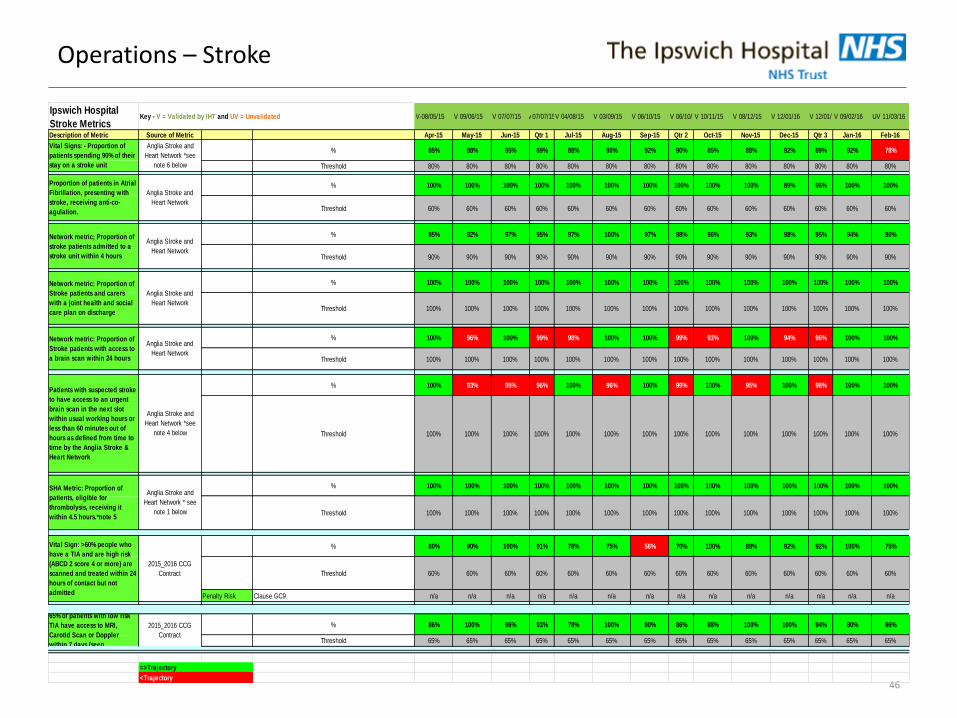
Operations – Stroke
46
Ipswich Hospital
Stroke MetricsV-08/05/15 V 09/06/15 V 07/07/15 v 07/07/15V 04/08/15 V 03/09/15 V 06/10/15 V 06/10/15V 10/11/15 V 08/12/15 V 12/01/16 V 12/01/16V 09/02/16 UV 11/03/16
Description of Metric Source of Metric Apr-15 May-15 Jun-15 Qtr 1 Jul-15 Aug-15 Sep-15 Qtr 2 Oct-15 Nov-15 Dec-15 Qtr 3 Jan-16 Feb-16
% 85% 88% 95% 89% 88% 90% 92% 90% 85% 88% 92% 89% 92% 78%
Threshold 80% 80% 80% 80% 80% 80% 80% 80% 80% 80% 80% 80% 80% 80%
% 100% 100% 100% 100% 100% 100% 100% 100% 100% 100% 89% 96% 100% 100%
Threshold 60% 60% 60% 60% 60% 60% 60% 60% 60% 60% 60% 60% 60% 60%
% 95% 92% 97% 95% 97% 100% 97% 98% 96% 93% 98% 95% 94% 90%
Threshold 90% 90% 90% 90% 90% 90% 90% 90% 90% 90% 90% 90% 90% 90%
% 100% 100% 100% 100% 100% 100% 100% 100% 100% 100% 100% 100% 100% 100%
Threshold 100% 100% 100% 100% 100% 100% 100% 100% 100% 100% 100% 100% 100% 100%
% 100% 96% 100% 99% 98% 100% 100% 99% 93% 100% 94% 96% 100% 100%
Threshold 100% 100% 100% 100% 100% 100% 100% 100% 100% 100% 100% 100% 100% 100%
% 100% 93% 95% 96% 100% 96% 100% 99% 100% 95% 100% 98% 100% 100%
Threshold 100% 100% 100% 100% 100% 100% 100% 100% 100% 100% 100% 100% 100% 100%
% 100% 100% 100% 100% 100% 100% 100% 100% 100% 100% 100% 100% 100% 100%
Threshold 100% 100% 100% 100% 100% 100% 100% 100% 100% 100% 100% 100% 100% 100%
% 80% 90% 100% 91% 78% 75% 56% 70% 100% 88% 92% 92% 100% 75%
Threshold 60% 60% 60% 60% 60% 60% 60% 60% 60% 60% 60% 60% 60% 60%
Penalty Risk Clause GC9 n/a n/a n/a n/a n/a n/a n/a n/a n/a n/a n/a n/a n/a n/a
% 86% 100% 86% 93% 78% 100% 90% 86% 88% 100% 100% 94% 80% 86%
Threshold 65% 65% 65% 65% 65% 65% 65% 65% 65% 65% 65% 65% 65% 65%
=>Trajectory
<Trajectory
65% of patients with low risk
TIA have access to MRI,
Carotid Scan or Doppler
within 7 days (seen,
2015_2016 CCG
Contract
SHA Metric: Proportion of
patients, eligible for
thrombolysis, receiving it
within 4.5 hours.*note 5
Anglia Stroke and
Heart Network * see
note 1 below
Vital Sign: >60% people who
have a TIA and are high risk
(ABCD 2 score 4 or more) are
scanned and treated within 24
hours of contact but not
admitted
2015_2016 CCG
Contract
Network metric: Proportion of
Stroke patients with access to
a brain scan within 24 hours
Anglia Stroke and
Heart Network
Patients with suspected stroke
to have access to an urgent
brain scan in the next slot
within usual working hours or
less than 60 minutes out of
hours as defined from time to
time by the Anglia Stroke &
Heart Network
Anglia Stroke and
Heart Network *see
note 4 below
Network metric; Proportion of
stroke patients admitted to a
stroke unit within 4 hours
Anglia Stroke and
Heart Network
Network metric: Proportion of
Stroke patients and carers
with a joint health and social
care plan on discharge
Anglia Stroke and
Heart Network
Key - V = Validated by IHT and UV = Unvalidated
Vital Signs: - Proportion of
patients spending 90% of their
stay on a stroke unit
Anglia Stroke and
Heart Network *see
note 6 below
Proportion of patients in Atrial
Fibrillation, presenting with
stroke, receiving anti-co-
agulation.
Anglia Stroke and
Heart Network
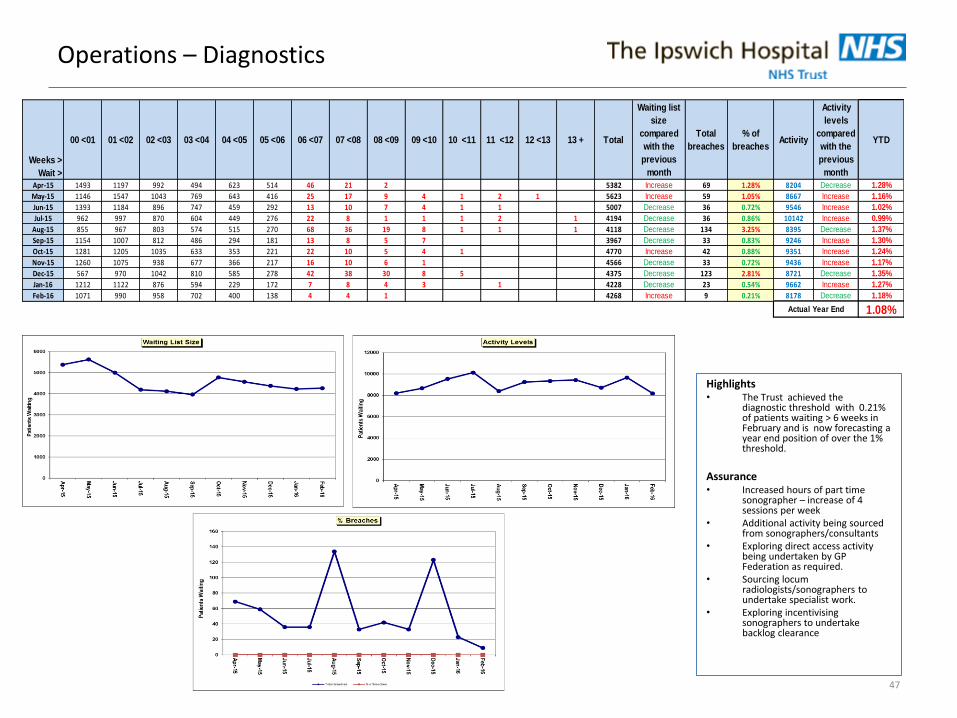
Operations – Diagnostics
Highlights • The Trust achieved the
diagnostic threshold with 0.21% of patients waiting > 6 weeks in February and is now forecasting a year end position of over the 1% threshold.
Assurance • Increased hours of part time
sonographer – increase of 4 sessions per week
• Additional activity being sourced from sonographers/consultants
• Exploring direct access activity being undertaken by GP Federation as required.
• Sourcing locum radiologists/sonographers to undertake specialist work.
• Exploring incentivising sonographers to undertake backlog clearance
47
Weeks >
Wait >
00 <01 01 <02 02 <03 03 <04 04 <05 05 <06 06 <07 07 <08 08 <09 09 <10 10 <11 11 <12 12 <13 13 + Total
Waiting list
size
compared
with the
previous
month
Total
breaches
% of
breachesActivity
Activity
levels
compared
with the
previous
month
YTD
Apr-15 1493 1197 992 494 623 514 46 21 2 5382 Increase 69 1.28% 8204 Decrease 1.28%
May-15 1146 1547 1043 769 643 416 25 17 9 4 1 2 1 5623 Increase 59 1.05% 8667 Increase 1.16%
Jun-15 1393 1184 896 747 459 292 13 10 7 4 1 1 5007 Decrease 36 0.72% 9546 Increase 1.02%
Jul-15 962 997 870 604 449 276 22 8 1 1 1 2 1 4194 Decrease 36 0.86% 10142 Increase 0.99%
Aug-15 855 967 803 574 515 270 68 36 19 8 1 1 1 4118 Decrease 134 3.25% 8395 Decrease 1.37%
Sep-15 1154 1007 812 486 294 181 13 8 5 7 3967 Decrease 33 0.83% 9246 Increase 1.30%
Oct-15 1281 1205 1035 633 353 221 22 10 5 4 1 4770 Increase 42 0.88% 9351 Increase 1.24%
Nov-15 1260 1075 938 677 366 217 16 10 6 1 4566 Decrease 33 0.72% 9436 Increase 1.17%
Dec-15 567 970 1042 810 585 278 42 38 30 8 5 4375 Decrease 123 2.81% 8721 Decrease 1.35%
Jan-16 1212 1122 876 594 229 172 7 8 4 3 1 4228 Decrease 23 0.54% 9662 Increase 1.27%
Feb-16 1071 990 958 702 400 138 4 4 1 4268 Increase 9 0.21% 8178 Decrease 1.18%
1.08%Actual Year End
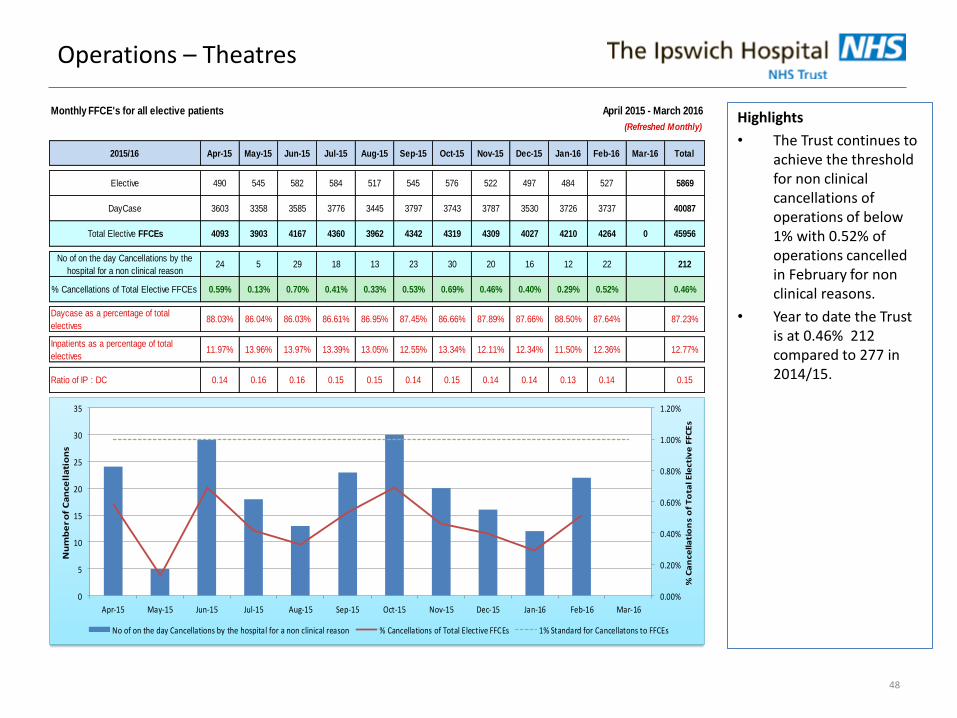
Highlights
• The Trust continues to achieve the threshold for non clinical cancellations of operations of below 1% with 0.52% of operations cancelled in February for non clinical reasons.
• Year to date the Trust is at 0.46% 212 compared to 277 in 2014/15.
48
Operations – Theatres
Monthly FFCE's for all elective patients April 2015 - March 2016
(Refreshed Monthly)
2015/16 Apr-15 May-15 Jun-15 Jul-15 Aug-15 Sep-15 Oct-15 Nov-15 Dec-15 Jan-16 Feb-16 Mar-16 Total
Elective 490 545 582 584 517 545 576 522 497 484 527 5869
DayCase 3603 3358 3585 3776 3445 3797 3743 3787 3530 3726 3737 40087
Total Elective FFCEs 4093 3903 4167 4360 3962 4342 4319 4309 4027 4210 4264 0 45956
No of on the day Cancellations by the
hospital for a non clinical reason24 5 29 18 13 23 30 20 16 12 22 212
% Cancellations of Total Elective FFCEs 0.59% 0.13% 0.70% 0.41% 0.33% 0.53% 0.69% 0.46% 0.40% 0.29% 0.52% 0.46%
1% Standard for Cancellatons to FFCEs 1.00% 1.00% 1.00% 1.00% 1.00% 1.00% 1.00% 1.00% 1.00% 1.00% 1.00% 1.00% 1.00%Daycase as a percentage of total
electives88.03% 86.04% 86.03% 86.61% 86.95% 87.45% 86.66% 87.89% 87.66% 88.50% 87.64% 87.23%
Inpatients as a percentage of total
electives11.97% 13.96% 13.97% 13.39% 13.05% 12.55% 13.34% 12.11% 12.34% 11.50% 12.36% 12.77%
Ratio of IP : DC 0.14 0.16 0.16 0.15 0.15 0.14 0.15 0.14 0.14 0.13 0.14 0.15
0.00%
0.20%
0.40%
0.60%
0.80%
1.00%
1.20%
0
5
10
15
20
25
30
35
Apr-15 May-15 Jun-15 Jul-15 Aug-15 Sep-15 Oct-15 Nov-15 Dec-15 Jan-16 Feb-16 Mar-16
% C
an
ce
lla
tio
ns o
f T
ota
l E
lecti
ve
FFC
Es
Nu
mb
er
of
Ca
nce
lla
tio
ns
No of on the day Cancellations by the hospital for a non clinical reason % Cancellations of Total Elective FFCEs 1% Standard for Cancellatons to FFCEs
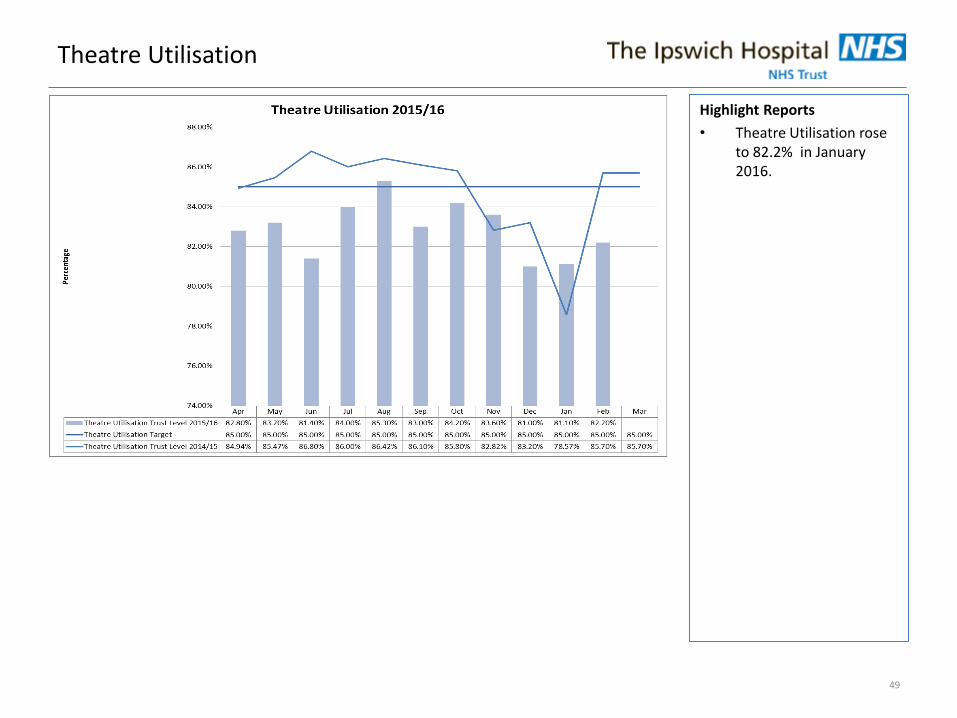
Theatre Utilisation
Highlight Reports
• Theatre Utilisation rose to 82.2% in January 2016.
49
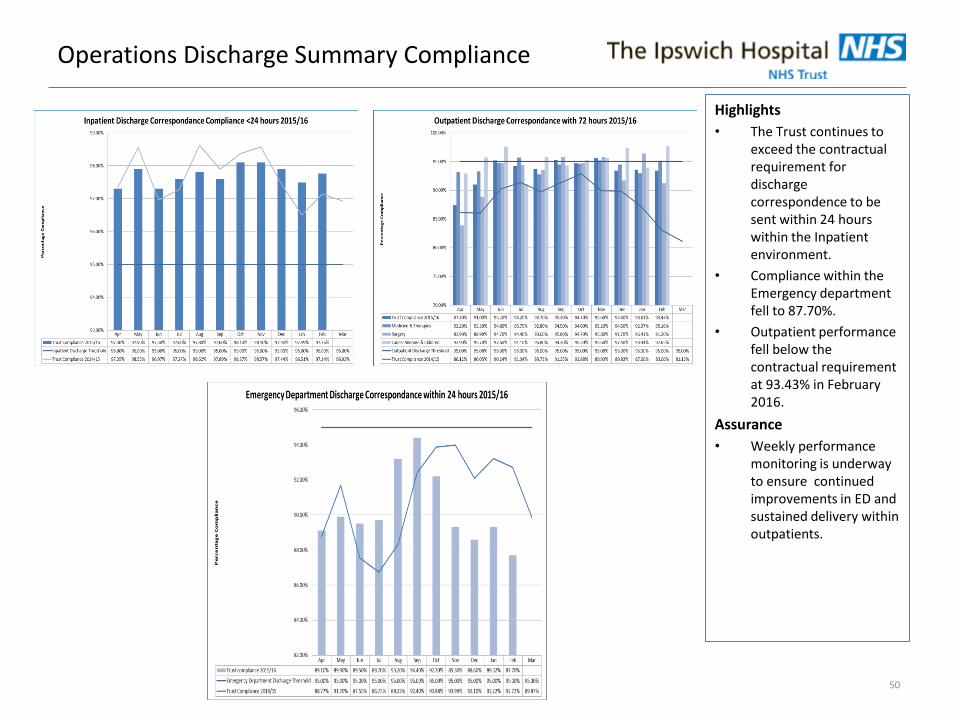
Operations Discharge Summary Compliance
Highlights
• The Trust continues to exceed the contractual requirement for discharge correspondence to be sent within 24 hours within the Inpatient environment.
• Compliance within the Emergency department fell to 87.70%.
• Outpatient performance fell below the contractual requirement at 93.43% in February 2016.
Assurance
• Weekly performance monitoring is underway to ensure continued improvements in ED and sustained delivery within outpatients.
50
Workforce
51
Highlights • Absence has decreased from 4.32% in January to 3.93% in February. There has been a
decrease in the Community Long Term Absence from 5.64% in January to 3.09% in February. This has been the result of some long term absence cases returning to work. Overall there has been a reduction of short term sickness cases across the Trust.
• Following a decline in local induction compliance in January at 83%, there has been an improvement in compliance in February, which now stands at 96.1%, compared with the target of 95%.
• From 1 April 2016, the corporate induction programme will be changing and we will be facilitating two induction mornings per month (rather than just one). The revised programme will be far more interactive and will include greater focus on the culture of Ipswich Hospital, our values and other key information that may be useful to new Team Ipswich colleagues. There will be less focus on mandatory training although new staff will be required to complete their training requirements within 90 days of commencement. The new induction programme applies to all colleagues, including senior medical staff (consultants and SAS doctors).
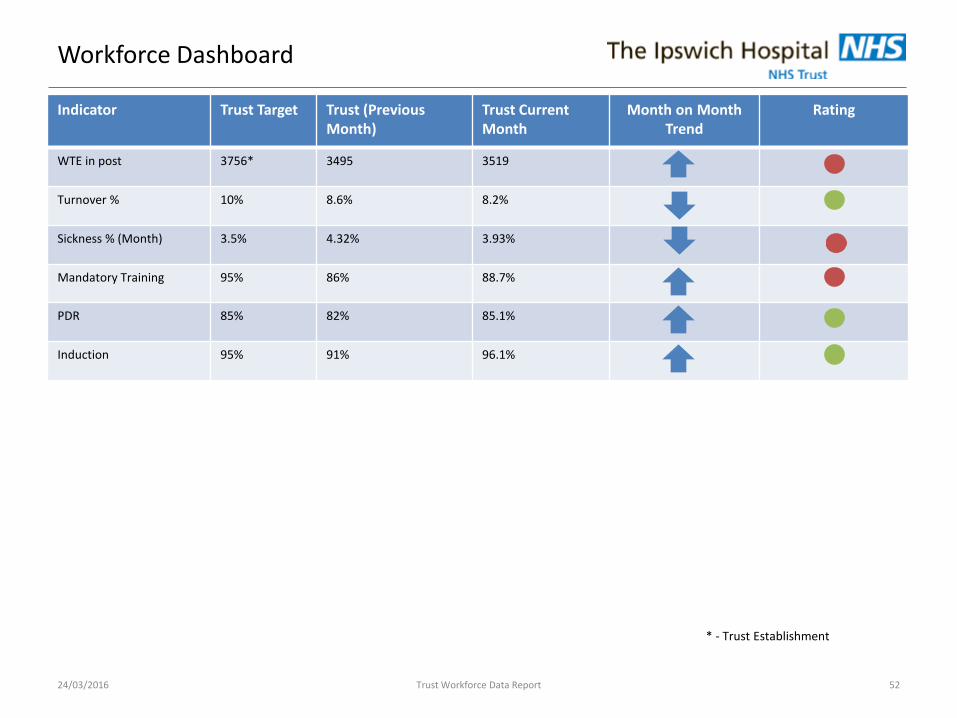
Workforce Dashboard
Indicator Trust Target Trust (Previous Month)
Trust Current Month
Month on Month Trend
Rating
WTE in post 3756* 3495 3519
Turnover % 10% 8.6% 8.2%
Sickness % (Month) 3.5% 4.32% 3.93%
Mandatory Training 95% 86% 88.7%
PDR 85% 82% 85.1%
Induction 95% 91% 96.1%
24/03/2016 Trust Workforce Data Report 52
* - Trust Establishment
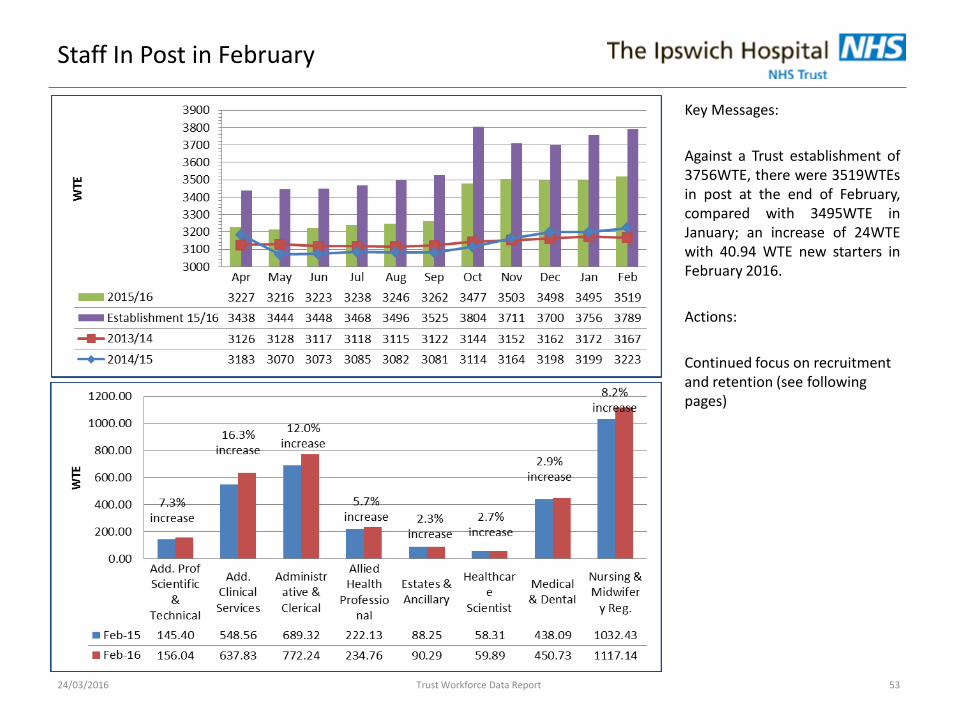
Staff In Post in February
Key Messages:
Against a Trust establishment of 3756WTE, there were 3519WTEs in post at the end of February, compared with 3495WTE in January; an increase of 24WTE with 40.94 WTE new starters in February 2016.
Actions:
Continued focus on recruitment and retention (see following pages)
24/03/2016 Trust Workforce Data Report 53
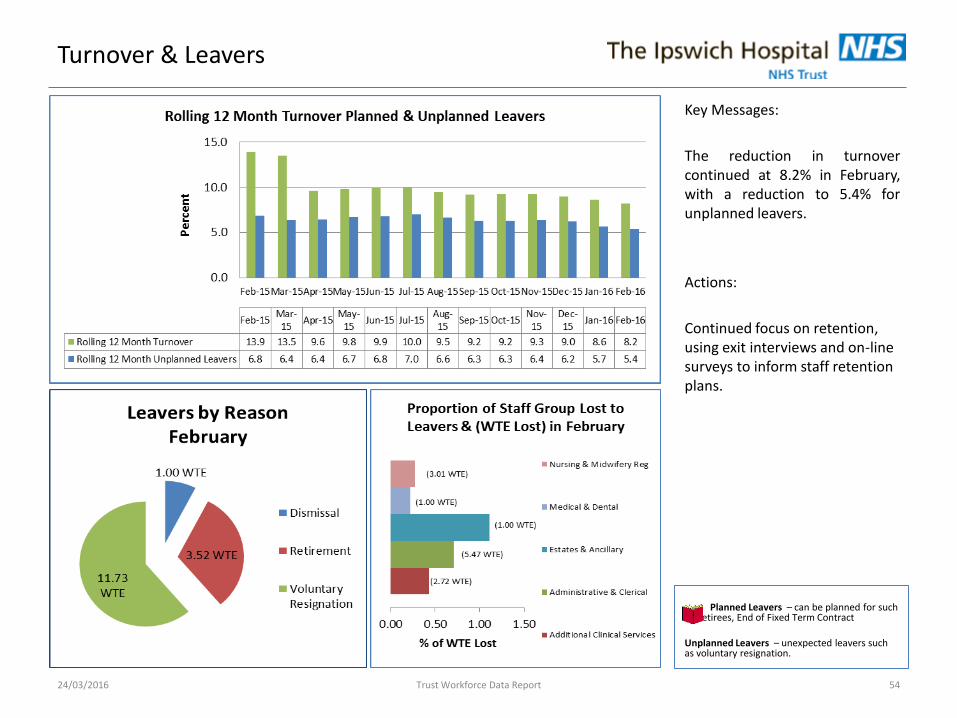
Turnover & Leavers
Key Messages:
The reduction in turnover continued at 8.2% in February, with a reduction to 5.4% for unplanned leavers.
Actions:
Continued focus on retention, using exit interviews and on-line surveys to inform staff retention plans.
Planned Leavers – can be planned for such as Retirees, End of Fixed Term Contract Unplanned Leavers – unexpected leavers such as voluntary resignation.
24/03/2016 Trust Workforce Data Report 54
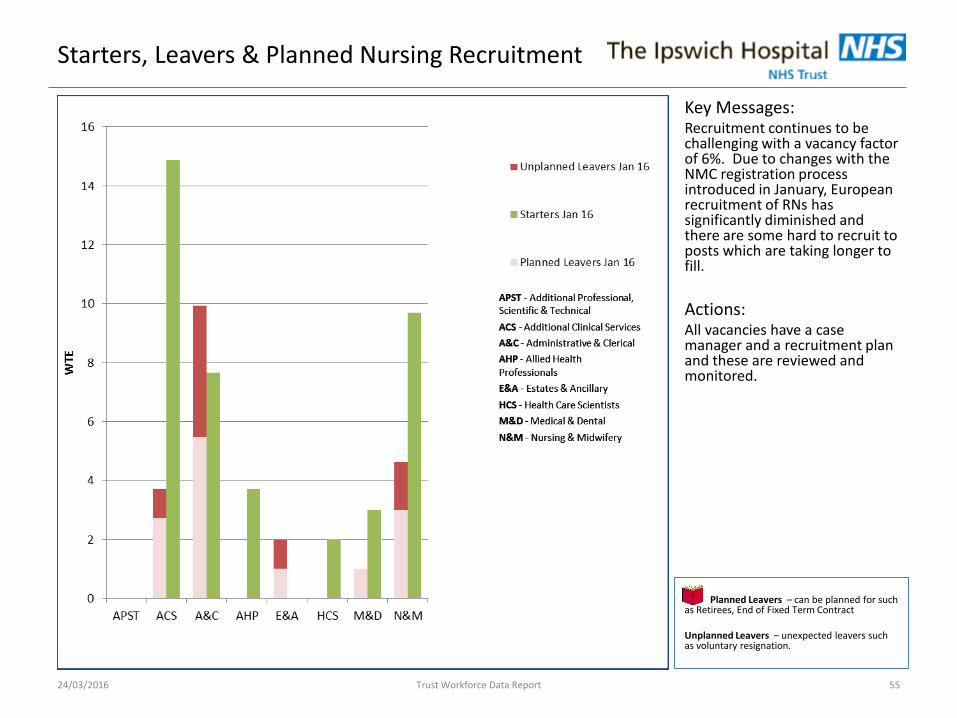
Starters, Leavers & Planned Nursing Recruitment
Key Messages: Recruitment continues to be challenging with a vacancy factor of 6%. Due to changes with the NMC registration process introduced in January, European recruitment of RNs has significantly diminished and there are some hard to recruit to posts which are taking longer to fill.
Actions: All vacancies have a case manager and a recruitment plan and these are reviewed and monitored.
Planned Leavers – can be planned for such as Retirees, End of Fixed Term Contract Unplanned Leavers – unexpected leavers such as voluntary resignation.
24/03/2016 Trust Workforce Data Report 55
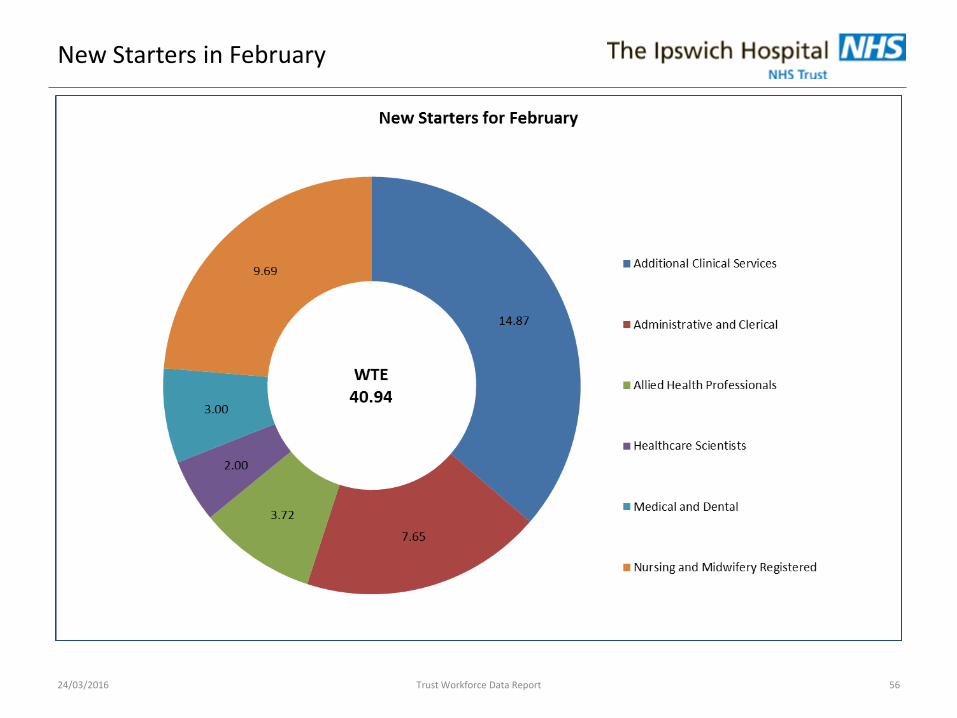
New Starters in February
24/03/2016 Trust Workforce Data Report 56
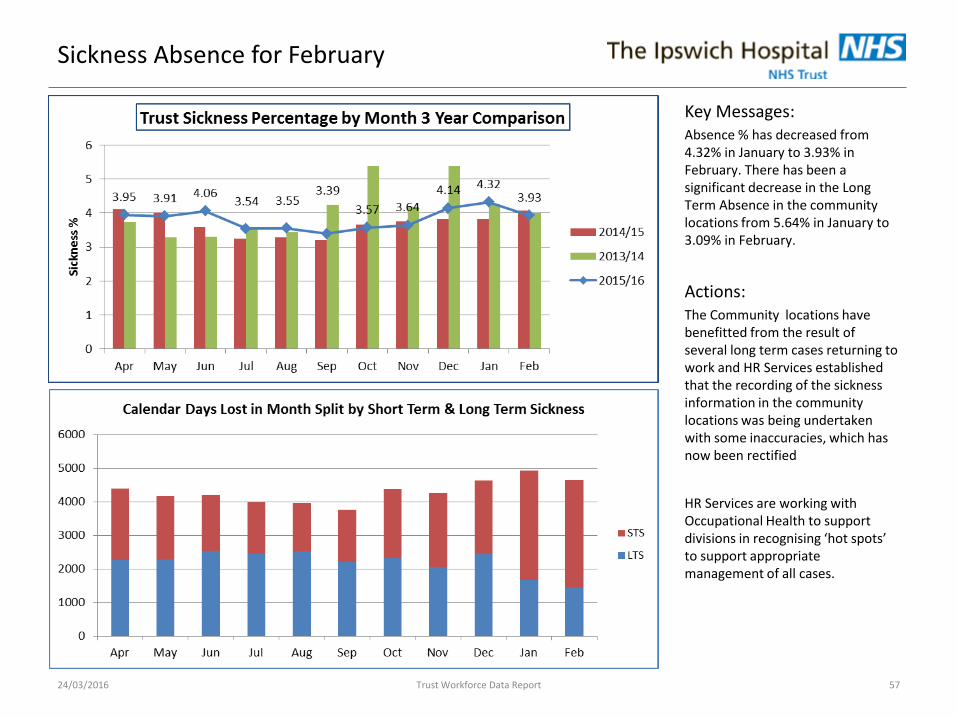
Sickness Absence for February
Key Messages: Absence % has decreased from 4.32% in January to 3.93% in February. There has been a significant decrease in the Long Term Absence in the community locations from 5.64% in January to 3.09% in February.
Actions: The Community locations have benefitted from the result of several long term cases returning to work and HR Services established that the recording of the sickness information in the community locations was being undertaken with some inaccuracies, which has now been rectified
HR Services are working with Occupational Health to support divisions in recognising ‘hot spots’ to support appropriate management of all cases.
24/03/2016 Trust Workforce Data Report 57
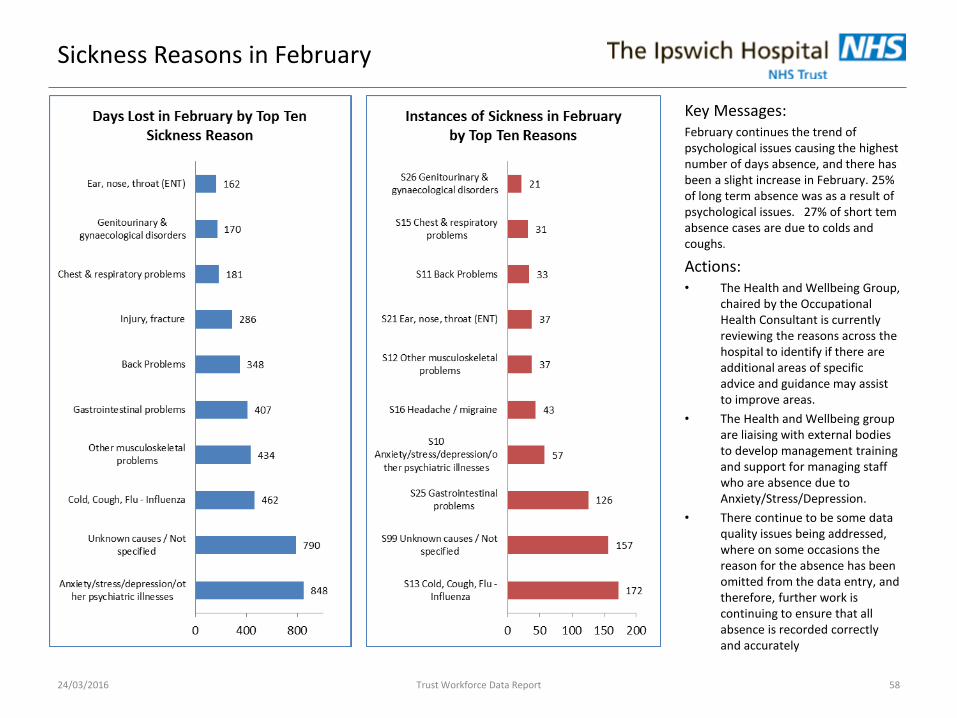
Sickness Reasons in February
Key Messages: February continues the trend of psychological issues causing the highest number of days absence, and there has been a slight increase in February. 25% of long term absence was as a result of psychological issues. 27% of short tem absence cases are due to colds and coughs.
Actions: • The Health and Wellbeing Group,
chaired by the Occupational Health Consultant is currently reviewing the reasons across the hospital to identify if there are additional areas of specific advice and guidance may assist to improve areas.
• The Health and Wellbeing group are liaising with external bodies to develop management training and support for managing staff who are absence due to Anxiety/Stress/Depression.
• There continue to be some data quality issues being addressed, where on some occasions the reason for the absence has been omitted from the data entry, and therefore, further work is continuing to ensure that all absence is recorded correctly and accurately
24/03/2016 Trust Workforce Data Report 58
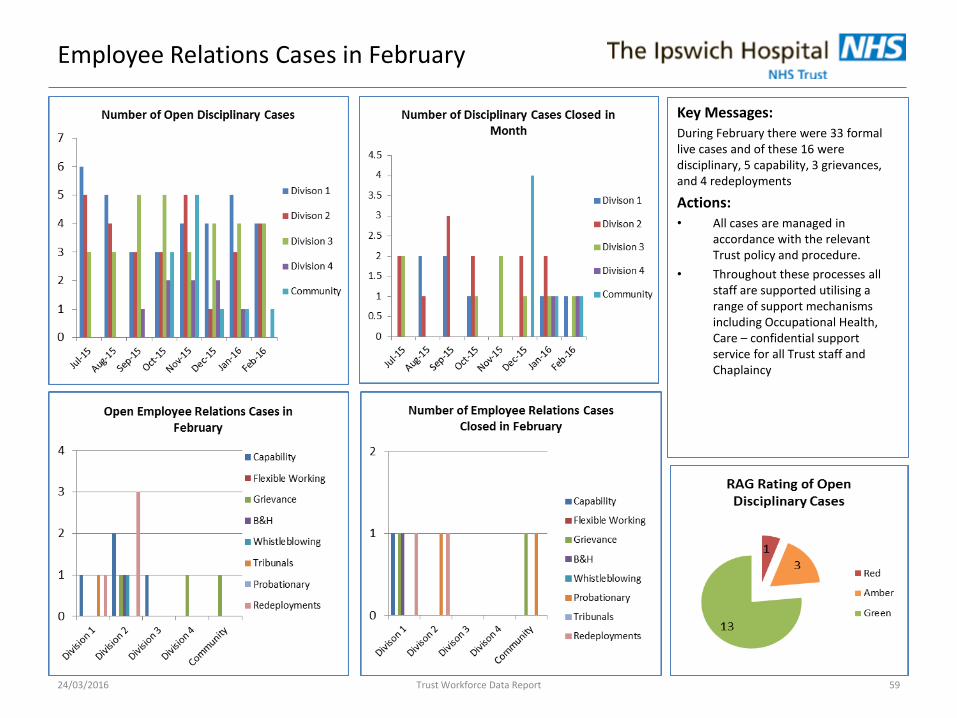
Employee Relations Cases in February
24/03/2016 Trust Workforce Data Report 59
Key Messages: During February there were 33 formal live cases and of these 16 were disciplinary, 5 capability, 3 grievances, and 4 redeployments
Actions: • All cases are managed in
accordance with the relevant Trust policy and procedure.
• Throughout these processes all staff are supported utilising a range of support mechanisms including Occupational Health, Care – confidential support service for all Trust staff and Chaplaincy
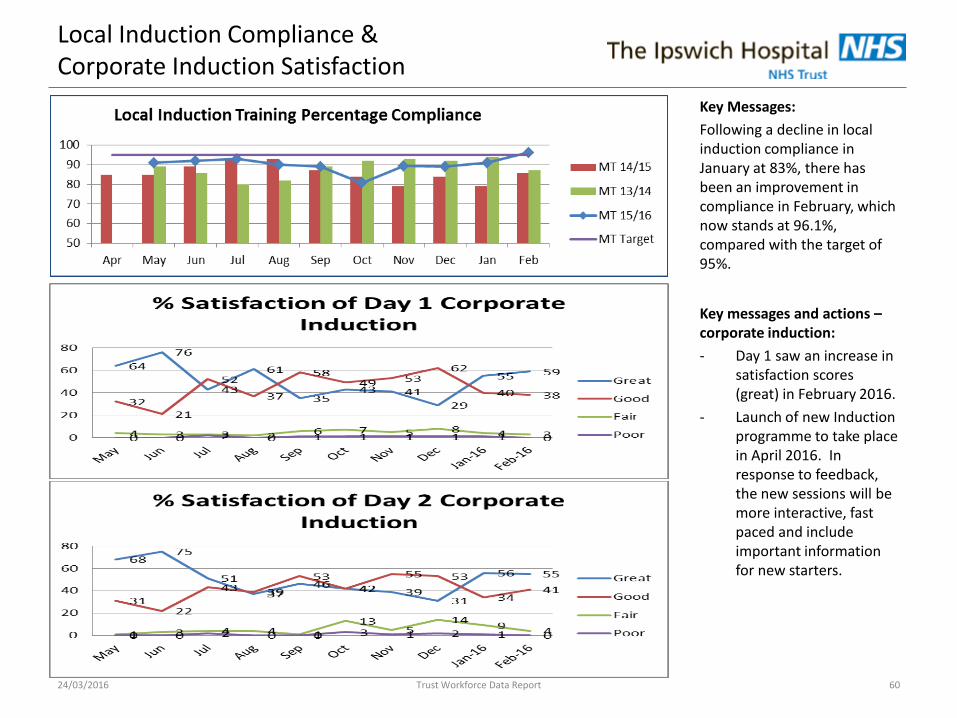
Local Induction Compliance & Corporate Induction Satisfaction
Key Messages:
Following a decline in local induction compliance in January at 83%, there has been an improvement in compliance in February, which now stands at 96.1%, compared with the target of 95%.
Key messages and actions – corporate induction:
- Day 1 saw an increase in satisfaction scores (great) in February 2016.
- Launch of new Induction programme to take place in April 2016. In response to feedback, the new sessions will be more interactive, fast paced and include important information for new starters.
24/03/2016 Trust Workforce Data Report 60
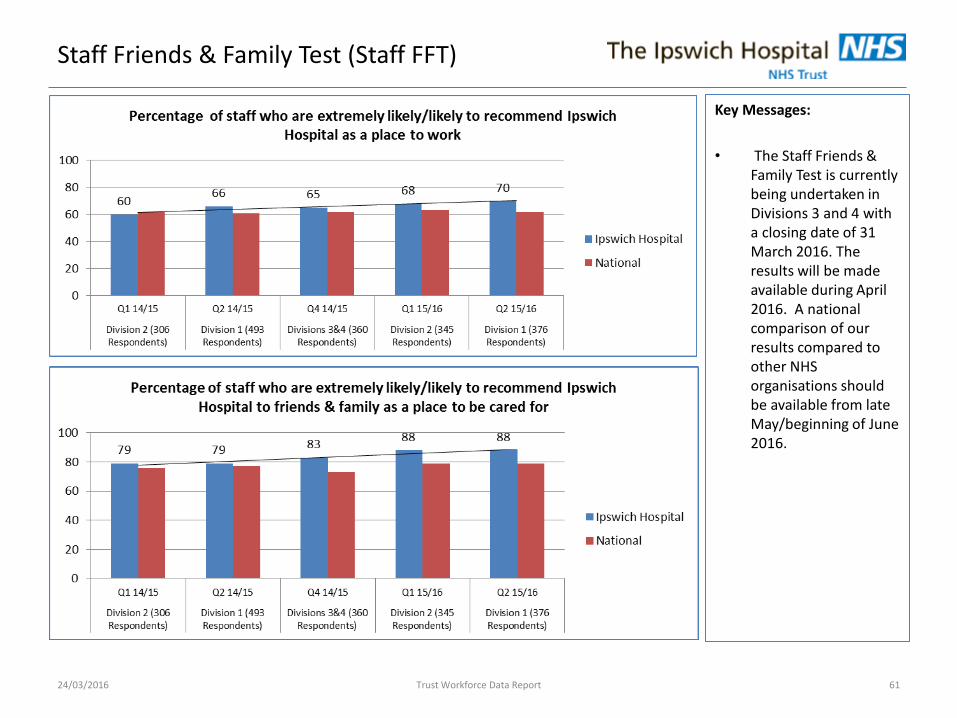
Staff Friends & Family Test (Staff FFT)
Key Messages:
• The Staff Friends & Family Test is currently being undertaken in Divisions 3 and 4 with a closing date of 31 March 2016. The results will be made available during April 2016. A national comparison of our results compared to other NHS organisations should be available from late May/beginning of June 2016.
24/03/2016 Trust Workforce Data Report 61
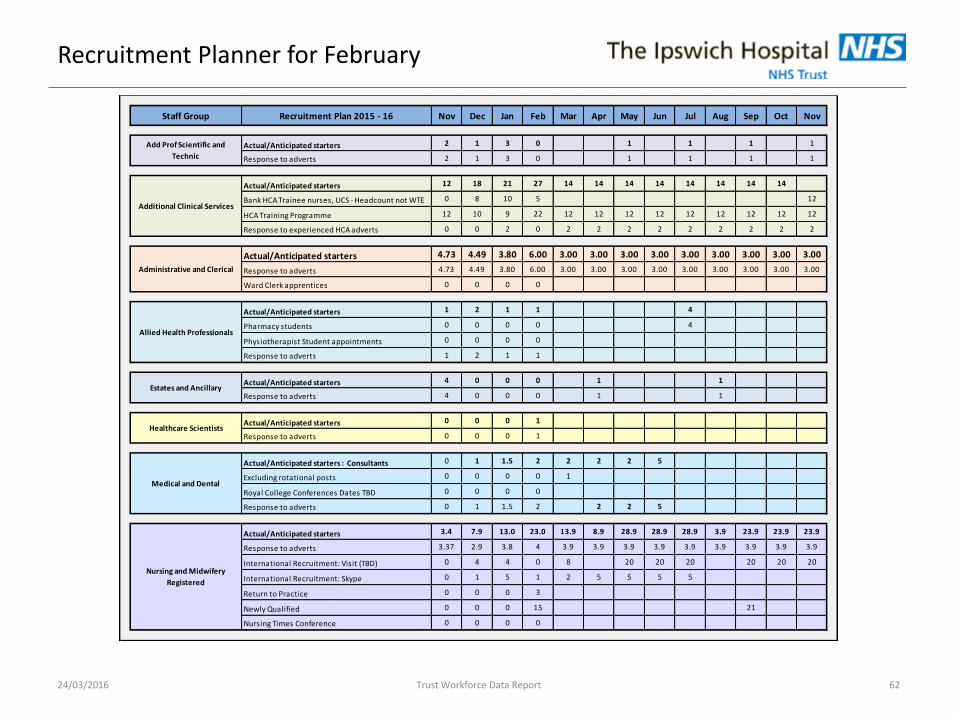
Recruitment Planner for February
24/03/2016 Trust Workforce Data Report 62
Staff Group Recruitment Plan 2015 - 16 Nov Dec Jan Feb Mar Apr May Jun Jul Aug Sep Oct Nov
Actual/Anticipated starters 2 1 3 0 1 1 1 1
Response to adverts 2 1 3 0 1 1 1 1
Actual/Anticipated starters 12 18 21 27 14 14 14 14 14 14 14 14
Bank HCA Trainee nurses, UCS - Headcount not WTE 0 8 10 5 12
HCA Training Programme 12 10 9 22 12 12 12 12 12 12 12 12 12
Response to experienced HCA adverts 0 0 2 0 2 2 2 2 2 2 2 2 2
Actual/Anticipated starters 4.73 4.49 3.80 6.00 3.00 3.00 3.00 3.00 3.00 3.00 3.00 3.00 3.00
Response to adverts 4.73 4.49 3.80 6.00 3.00 3.00 3.00 3.00 3.00 3.00 3.00 3.00 3.00
Ward Clerk apprentices 0 0 0 0
Actual/Anticipated starters 1 2 1 1 4
Pharmacy students 0 0 0 0 4
Physiotherapist Student appointments 0 0 0 0
Response to adverts 1 2 1 1
Actual/Anticipated starters 4 0 0 0 1 1
Response to adverts 4 0 0 0 1 1
Actual/Anticipated starters 0 0 0 1
Response to adverts 0 0 0 1
Actual/Anticipated starters : Consultants 0 1 1.5 2 2 2 2 5
Excluding rotational posts 0 0 0 0 1
Royal College Conferences Dates TBD 0 0 0 0
Response to adverts 0 1 1.5 2 2 2 5
Actual/Anticipated starters 3.4 7.9 13.0 23.0 13.9 8.9 28.9 28.9 28.9 3.9 23.9 23.9 23.9
Response to adverts 3.37 2.9 3.8 4 3.9 3.9 3.9 3.9 3.9 3.9 3.9 3.9 3.9
International Recruitment: Visit (TBD) 0 4 4 0 8 20 20 20 20 20 20
International Recruitment: Skype 0 1 5 1 2 5 5 5 5
Return to Practice 0 0 0 3
Newly Qualified 0 0 0 15 21
Nursing Times Conference 0 0 0 0
Medical and Dental
Nursing and Midwifery
Registered
Add Prof Scientific and
Technic
Additional Clinical Services
Administrative and Clerical
Allied Health Professionals
Estates and Ancillary
Healthcare Scientists
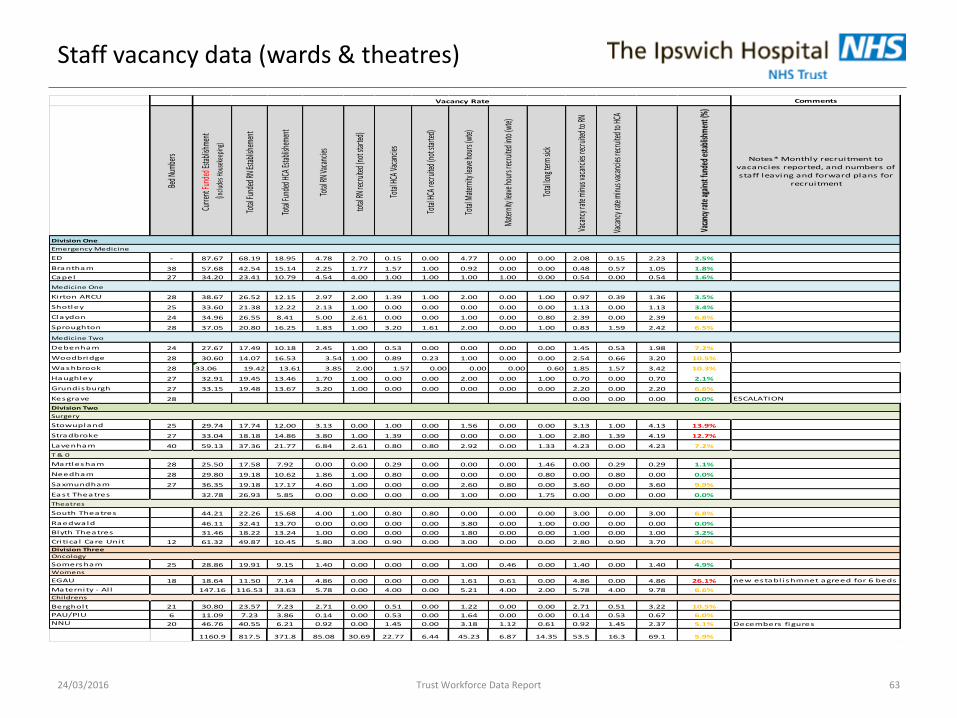
Staff vacancy data (wards & theatres)
24/03/2016 Trust Workforce Data Report 63
Comments
Bed N
umbe
rs
Curre
nt Fu
nded
Estab
lishm
ent
(inclu
des H
ouse
keep
ing)
Total
Fund
ed RN
Estab
lishe
ment
Total
Fund
ed H
CA Es
tablis
heme
nt
Total
RN Va
canc
ies
total
RN re
cruit
ed (n
ot st
arted
)
Total
HCA
Vaca
ncies
Total
HCA
recr
uited
(not
star
ted)
Total
Mate
rnity
leav
e hou
rs (w
te)
Mate
rnity
leav
e hou
rs re
cruit
ed in
to (w
te)
Total
long
term
sick
Vaca
ncy r
ate m
inus v
acan
cies r
ecru
ited t
o RN
Vaca
ncy r
ate m
inus v
acan
cies r
ecru
ited t
o HCA
Vaca
ncy r
ate a
gains
t fun
ded e
stabli
shm
ent (
%)
Notes* Monthly recruitment to
vacancies reported, and numbers of
staff leaving and forward plans for
recruitment
Division One
Emergency Medicine
ED - 87.67 68.19 18.95 4.78 2.70 0.15 0.00 4.77 0.00 0.00 2.08 0.15 2.23 2.5%
Brantham 38 57.68 42.54 15.14 2.25 1.77 1.57 1.00 0.92 0.00 0.00 0.48 0.57 1.05 1.8%
Capel 27 34.20 23.41 10.79 4.54 4.00 1.00 1.00 1.00 1.00 0.00 0.54 0.00 0.54 1.6%
Medicine One
Kirton ARCU 28 38.67 26.52 12.15 2.97 2.00 1.39 1.00 2.00 0.00 1.00 0.97 0.39 1.36 3.5%
Shotley 25 33.60 21.38 12.22 2.13 1.00 0.00 0.00 0.00 0.00 0.00 1.13 0.00 1.13 3.4%
Claydon 24 34.96 26.55 8.41 5.00 2.61 0.00 0.00 1.00 0.00 0.80 2.39 0.00 2.39 6.8%
Sproughton 28 37.05 20.80 16.25 1.83 1.00 3.20 1.61 2.00 0.00 1.00 0.83 1.59 2.42 6.5%
Medicine Two
Debenham 24 27.67 17.49 10.18 2.45 1.00 0.53 0.00 0.00 0.00 0.00 1.45 0.53 1.98 7.2%
Woodbridge 28 30.60 14.07 16.53 3.54 1.00 0.89 0.23 1.00 0.00 0.00 2.54 0.66 3.20 10.5%
Washbrook 28 33.06 19.42 13.61 3.85 2.00 1.57 0.00 0.00 0.00 0.60 1.85 1.57 3.42 10.3%
Haughley 27 32.91 19.45 13.46 1.70 1.00 0.00 0.00 2.00 0.00 1.00 0.70 0.00 0.70 2.1%
Grundisburgh 27 33.15 19.48 13.67 3.20 1.00 0.00 0.00 0.00 0.00 0.00 2.20 0.00 2.20 6.6%
Kesgrave 28 0.00 0.00 0.00 0.0% ESCALATION
Division Two
Surgery
Stowupland 25 29.74 17.74 12.00 3.13 0.00 1.00 0.00 1.56 0.00 0.00 3.13 1.00 4.13 13.9%
Stradbroke 27 33.04 18.18 14.86 3.80 1.00 1.39 0.00 0.00 0.00 1.00 2.80 1.39 4.19 12.7%
Lavenham 40 59.13 37.36 21.77 6.84 2.61 0.80 0.80 2.92 0.00 1.33 4.23 0.00 4.23 7.2%
T & 0
Martlesham 28 25.50 17.58 7.92 0.00 0.00 0.29 0.00 0.00 0.00 1.46 0.00 0.29 0.29 1.1%
Needham 28 29.80 19.18 10.62 1.86 1.00 0.80 0.00 0.00 0.00 0.80 0.00 0.80 0.00 0.0%
Saxmundham 27 36.35 19.18 17.17 4.60 1.00 0.00 0.00 2.60 0.80 0.00 3.60 0.00 3.60 9.9%
East Theatres 32.78 26.93 5.85 0.00 0.00 0.00 0.00 1.00 0.00 1.75 0.00 0.00 0.00 0.0%
Theatres
South Theatres 44.21 22.26 15.68 4.00 1.00 0.80 0.80 0.00 0.00 0.00 3.00 0.00 3.00 6.8%
Raedwald 46.11 32.41 13.70 0.00 0.00 0.00 0.00 3.80 0.00 1.00 0.00 0.00 0.00 0.0%
Blyth Theatres 31.46 18.22 13.24 1.00 0.00 0.00 0.00 1.80 0.00 0.00 1.00 0.00 1.00 3.2%
Cri tica l Care Unit 12 61.32 49.87 10.45 5.80 3.00 0.90 0.00 3.00 0.00 0.00 2.80 0.90 3.70 6.0%Division Three
Oncology
Somersham 25 28.86 19.91 9.15 1.40 0.00 0.00 0.00 1.00 0.46 0.00 1.40 0.00 1.40 4.9%WomensStour + Gipping +
EGAU 18 18.64 11.50 7.14 4.86 0.00 0.00 0.00 1.61 0.61 0.00 4.86 0.00 4.86 26.1% new establ ishmnet agreed for 6 beds
Maternity - Al l 147.16 116.53 33.63 5.78 0.00 4.00 0.00 5.21 4.00 2.00 5.78 4.00 9.78 6.6%
Childrens
Bergholt 21 30.80 23.57 7.23 2.71 0.00 0.51 0.00 1.22 0.00 0.00 2.71 0.51 3.22 10.5%
PAU/PIU 6 11.09 7.23 3.86 0.14 0.00 0.53 0.00 1.64 0.00 0.00 0.14 0.53 0.67 6.0%
NNU 20 46.76 40.55 6.21 0.92 0.00 1.45 0.00 3.18 1.12 0.61 0.92 1.45 2.37 5.1% Decembers figures
1160.9 817.5 371.8 85.08 30.69 22.77 6.44 45.23 6.87 14.35 53.5 16.3 69.1 5.9%
Vacancy Rate
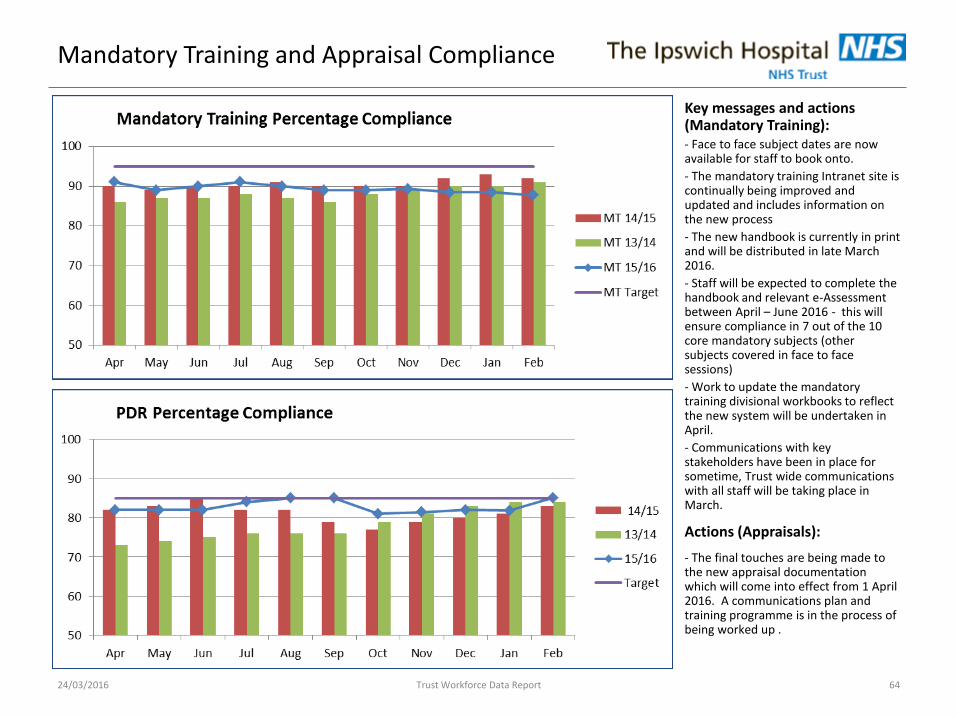
Mandatory Training and Appraisal Compliance
Key messages and actions (Mandatory Training): - Face to face subject dates are now available for staff to book onto.
- The mandatory training Intranet site is continually being improved and updated and includes information on the new process
- The new handbook is currently in print and will be distributed in late March 2016.
- Staff will be expected to complete the handbook and relevant e-Assessment between April – June 2016 - this will ensure compliance in 7 out of the 10 core mandatory subjects (other subjects covered in face to face sessions)
- Work to update the mandatory training divisional workbooks to reflect the new system will be undertaken in April.
- Communications with key stakeholders have been in place for sometime, Trust wide communications with all staff will be taking place in March.
Actions (Appraisals):
- The final touches are being made to the new appraisal documentation which will come into effect from 1 April 2016. A communications plan and training programme is in the process of being worked up .
24/03/2016 Trust Workforce Data Report 64
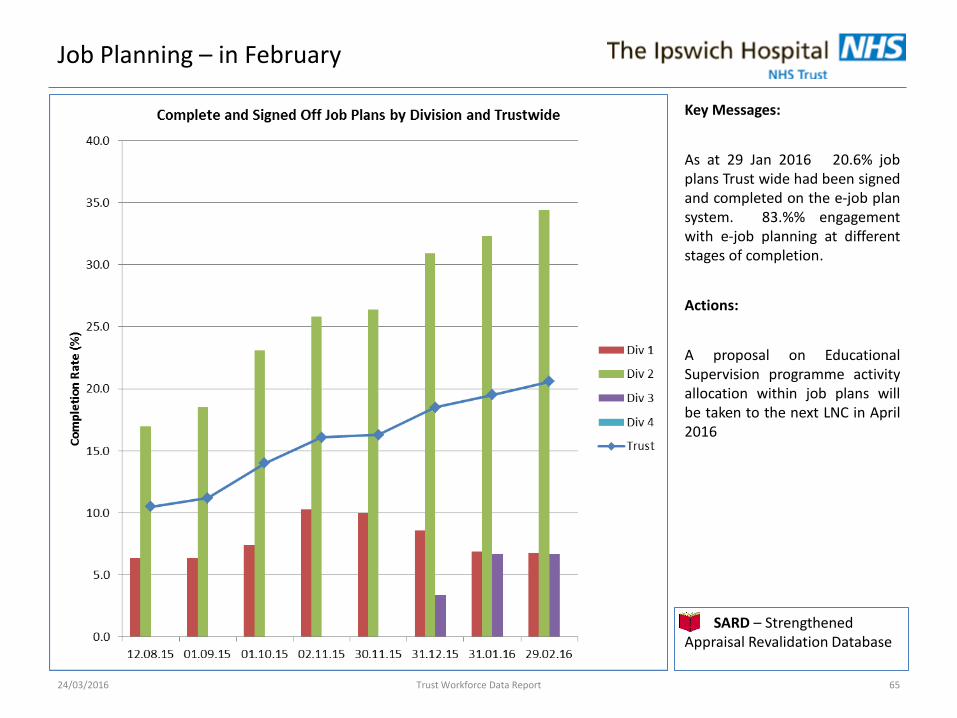
Job Planning – in February
Key Messages:
As at 29 Jan 2016 20.6% job plans Trust wide had been signed and completed on the e-job plan system. 83.%% engagement with e-job planning at different stages of completion.
Actions:
A proposal on Educational Supervision programme activity allocation within job plans will be taken to the next LNC in April 2016
24/03/2016 Trust Workforce Data Report 65
SARD – Strengthened Appraisal Revalidation Database
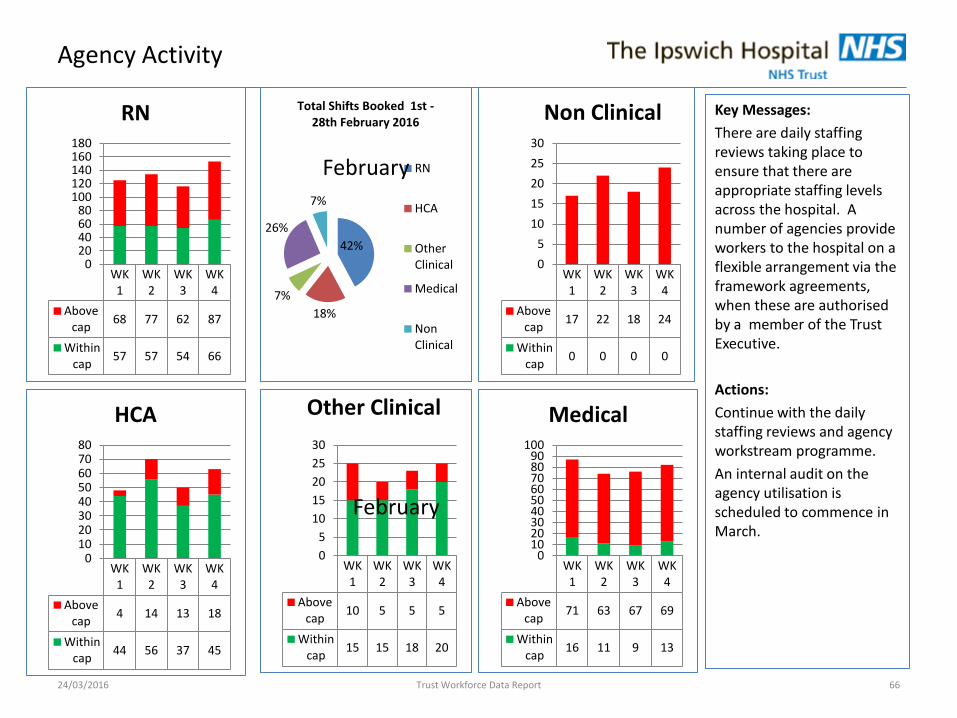
Agency Activity
Key Messages:
There are daily staffing reviews taking place to ensure that there are appropriate staffing levels across the hospital. A number of agencies provide workers to the hospital on a flexible arrangement via the framework agreements, when these are authorised by a member of the Trust Executive.
Actions:
Continue with the daily staffing reviews and agency workstream programme.
An internal audit on the agency utilisation is scheduled to commence in March.
24/03/2016 Trust Workforce Data Report 66
WK1
WK2
WK3
WK4
Abovecap
68 77 62 87
Withincap
57 57 54 66
020406080
100120140160180
RN
WK1
WK2
WK3
WK4
Abovecap
4 14 13 18
Withincap
44 56 37 45
01020304050607080
HCA
WK1
WK2
WK3
WK4
Abovecap
10 5 5 5
Withincap
15 15 18 20
0
5
10
15
20
25
30
Other Clinical
February
WK1
WK2
WK3
WK4
Abovecap
71 63 67 69
Withincap
16 11 9 13
0102030405060708090
100
Medical
WK1
WK2
WK3
WK4
Abovecap
17 22 18 24
Withincap
0 0 0 0
0
5
10
15
20
25
30
Non Clinical
42%
18%
7%
26%
7%
Total Shifts Booked 1st - 28th February 2016
RN
HCA
OtherClinical
Medical
NonClinical
February
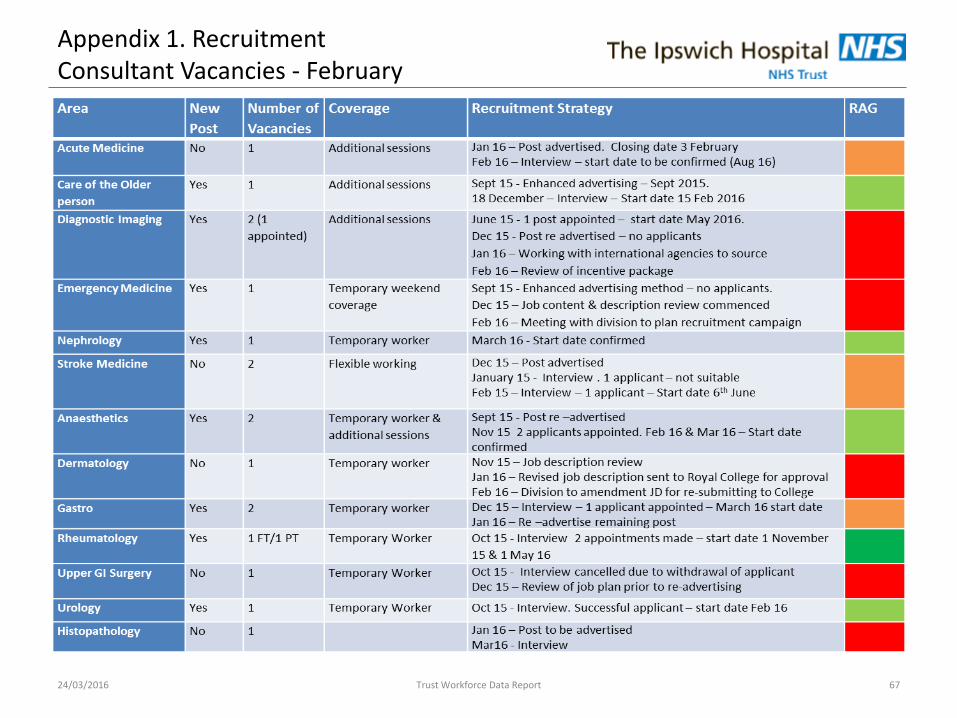
Appendix 1. Recruitment Consultant Vacancies - February
24/03/2016 Trust Workforce Data Report 67
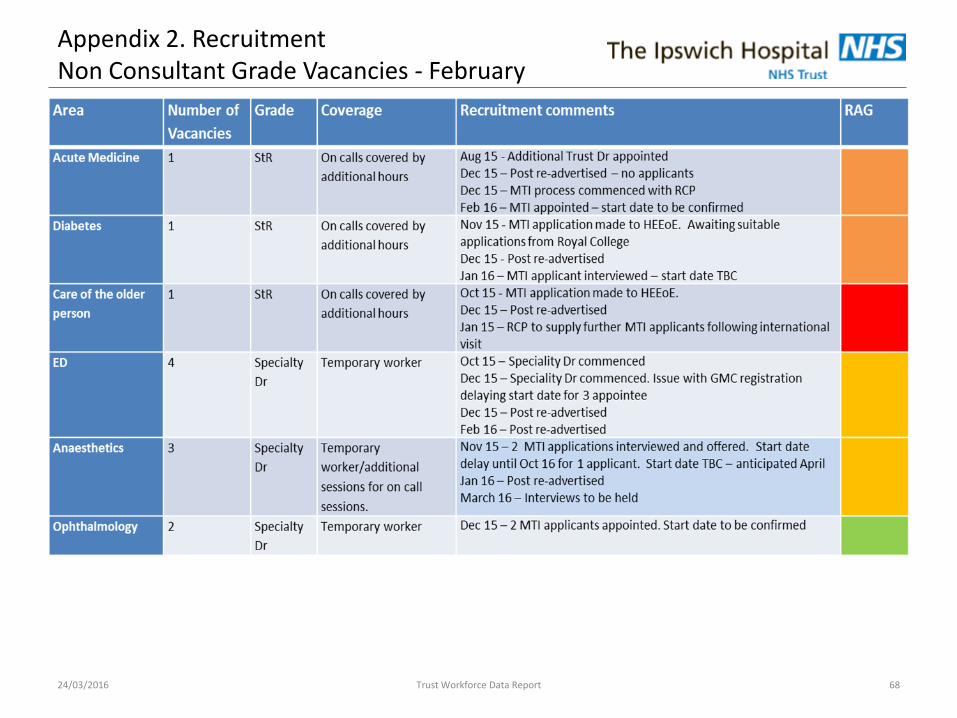
Appendix 2. Recruitment Non Consultant Grade Vacancies - February
24/03/2016 Trust Workforce Data Report 68
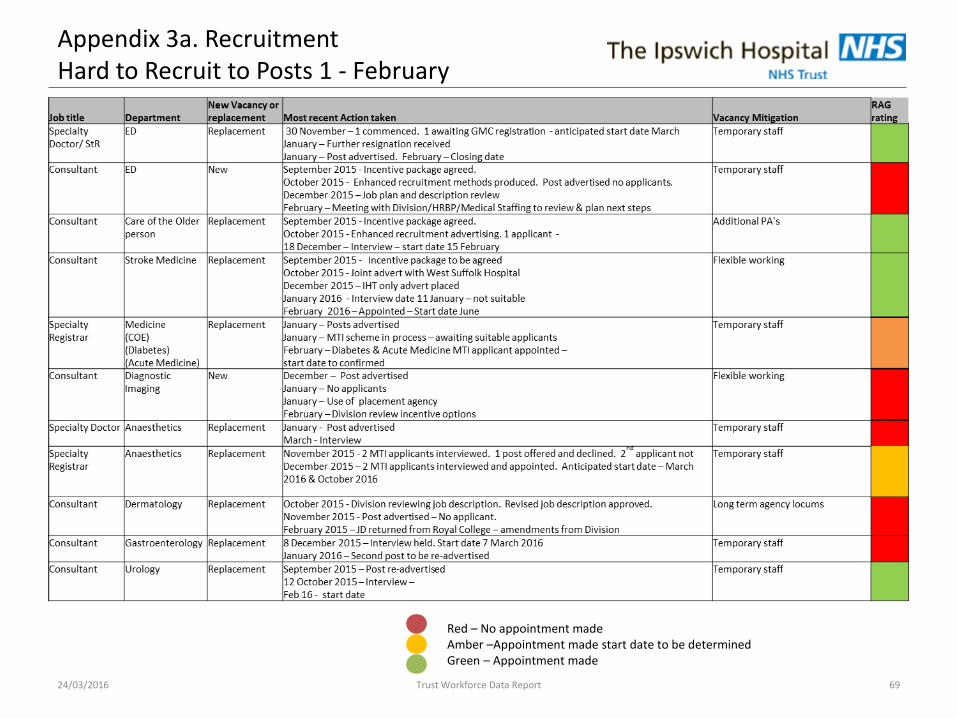
Appendix 3a. Recruitment Hard to Recruit to Posts 1 - February
24/03/2016 Trust Workforce Data Report 69
Red – No appointment made Amber –Appointment made start date to be determined Green – Appointment made
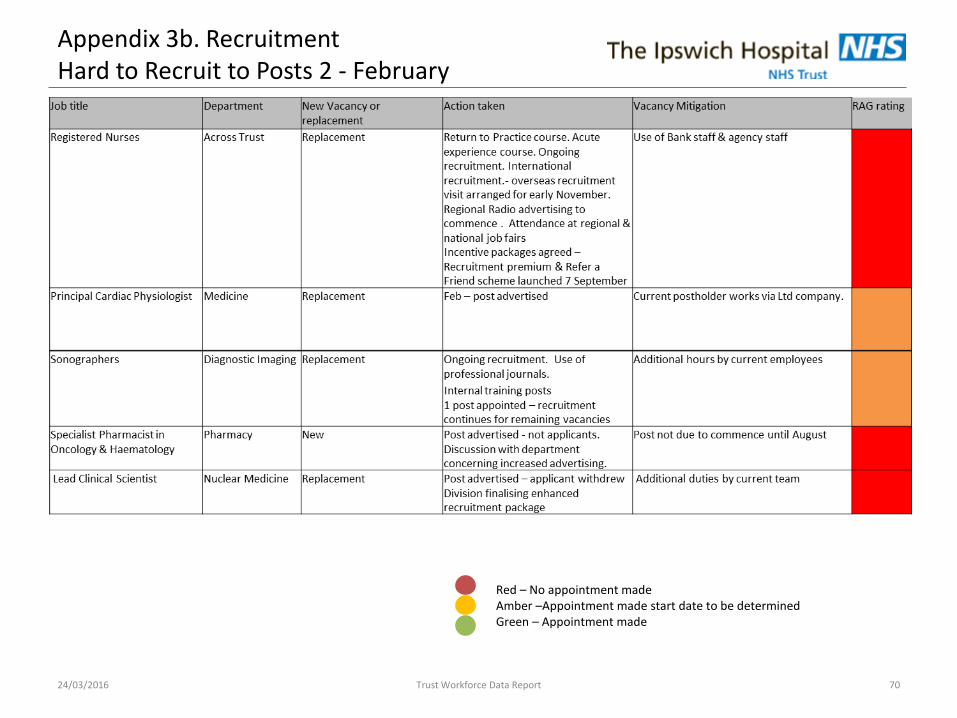
Appendix 3b. Recruitment Hard to Recruit to Posts 2 - February
24/03/2016 Trust Workforce Data Report 70
Red – No appointment made Amber –Appointment made start date to be determined Green – Appointment made