Embed Size (px)
Citation preview

Aipotu I-1
Aipotu I: Genetics & Biochemistry Objectives:
• To reinforce your understanding of Genetics, Biochemistry, and Molecular Biology • To show the connections between these three disciplines • To show how these three approaches can be combined to give a complete picture of a
biological phenomenon • To figure out a complete explanation of a biological phenomenon • To experience how scientists develop and test hypotheses
Introduction: Aipotu (pronounced “ā pō too“ – the word is “utopia” spelled backwards) is a simulated world where users can explore a biological phenomenon in terms of genetics, biochemistry, molecular biology, and evolution. The Biological Phenomenon Under Study In this lab, you will explore the biological mechanisms behind the expression of flower color in a hypothetical plant. These flowers can be white, red, orange, yellow, green, blue, purple, or black. Scenario: You are the chief biologist for a breeder of fine flowers. Your company sells seeds that customers plant in their gardens. Since most of your customers expect that the flowers will grow each year from seeds produced the previous year, you try to produce true-breeding plants whenever you can. You’ve found a new species of flower with an attractive shape. You’ve collected four plants from the wild: two green, one red, and one white. Your customers would really like to have purple flowers from this plant. You set out to create a true-breeding purple flower. Hypothesis Testing In the three Aipotu labs, you will use a process much like that used by practicing scientists as they conduct research. Although this process almost never follows a formula, it often proceeds as follows:
1. Observe Patterns. Observe the natural world and look for patterns, exceptional events, etc. For example, you might observe that red flowers sometimes have white offspring.
2. Develop hypotheses. From the observations, you define testable hypotheses – statements or questions that can be addressed experimentally. Continuing the example, you might reasonably hypothesize that red is dominant to white.
3. Test hypotheses. You then set up experiments or observations that will collect data that bear on your hypothesis. In the example, you might cross pure-breeding white with pure-breeding red. If your hypothesis is correct, all the offspring will be red. If you get another result, your hypothesis is incorrect.
4. Revise hypotheses as necessary. If your results do not match your prediction, you need to revise your hypothesis and go to Step (3) again until they do match.

Aipotu I-2
You have already been doing this informally in the VGL labs. You should note that this process never really ends – typically there is more to investigate once you’ve reached a satisfactory conclusion. The “answer” vs the “point” Although there is an answer – the complete model of color formation in these plants – and you can find it with the tools in Aipotu, having the answer is not as important as finding the answer. We could just tell you the answer, but that would leave out the major learning goals of this lab:
• Experiencing how scientific hypothesis testing works. • Experiencing how you can use the tools of modern biology to completely understand a
phenomenon. So, while we will work together to find ‘the answer’, the real point of the lab is the journey. Unifying Three Parts of Modern Biology The three major parts of this course are:
• Genetics = explaining biological phenomena in terms of genes. How is flower color inherited?
• Biochemistry = explaining biological phenomena in terms of proteins and other molecules. How does protein sequence determine protein structure and color?
• Molecular Biology = explaining the connection between genes (DNA) and protein. How does the DNA sequence of the color gene lead to a particular color?
The connections between these three fields of biology are shown below in a diagram credited to David Botstein (each of the arrows corresponds to “can be explained in terms of”, the words in this font are the different disciplines of biology): genes individual life functions Molecular of living things Biology proteins Understanding any biological phenomenon requires information from all three of these disciplines. Throughout this course, you will re-visit this lab to create an increasingly complete picture of the phenomenon under study. Each time, you will add to the model of color production in these flowers. Getting Aipotu Because Aipotu is under constant development, you should always use the latest version. As a result, it is not installed on the computers. You should download it from http://intro.bio.umb.edu/aipotu/ or the link on the On-Line Lab Manual for this lab. It will then be installed on the desktop.
Genetics
Biochemistry
Aipotu I-3
Tools Available in Aipotu For each of the three disciplines, there is a different tool in Aipotu that will allow you to explore the same set of creatures using a different set of techniques:
• Genetics. The flowers in this simulation are diploids. As with most flowers, they are all hermaphrodites (both male and female). With this tool, you can perform the following experiments:
o Cross any two organisms. A new window will appear with the offspring of this cross.
o Self-cross any organism. In this case, the single selected organism is both mother and father to the resulting offspring.
o Mutate any organism. A new window will appear with a set of flowers that are mutant versions of the selected organism.
• Biochemistry. The color in these flowers results from the form(s) of pigment proteins
present in an individual plant. With this tool, you can perform the following experiments:
o Examine the pigment proteins present in a plant. The tool shows you the amino acid sequence and two-dimensional structure of the pigment proteins present in a given plant.
o Design your own proteins. You can edit an existing protein sequence or type in an entirely new sequence. The program will then predict the two-dimensional structure of the resulting protein as well as its color. It will also predict the color resulting from the combination of any two proteins.
• Molecular Biology. The pigment proteins in these plants are produced by pigment
protein genes. With this tool, you can perform the following experiments: o Examine the pigment protein genes present in a plant. The tool shows the DNA, pre-
mRNA, mature mRNA, and protein sequences present in a given plant. You can explore the introns, exons, etc. of these genes.
o Design your own genes. You can edit an existing DNA sequence or type in an entirely new sequence. The program will then predict the mRNA, protein sequence, two-dimensional structure of the resulting protein as well as its color. It will also predict the color resulting from the combination of any two proteins.
o Design your own plants. You can save edited DNA sequences as new organisms for further study.
Aipotu I-4
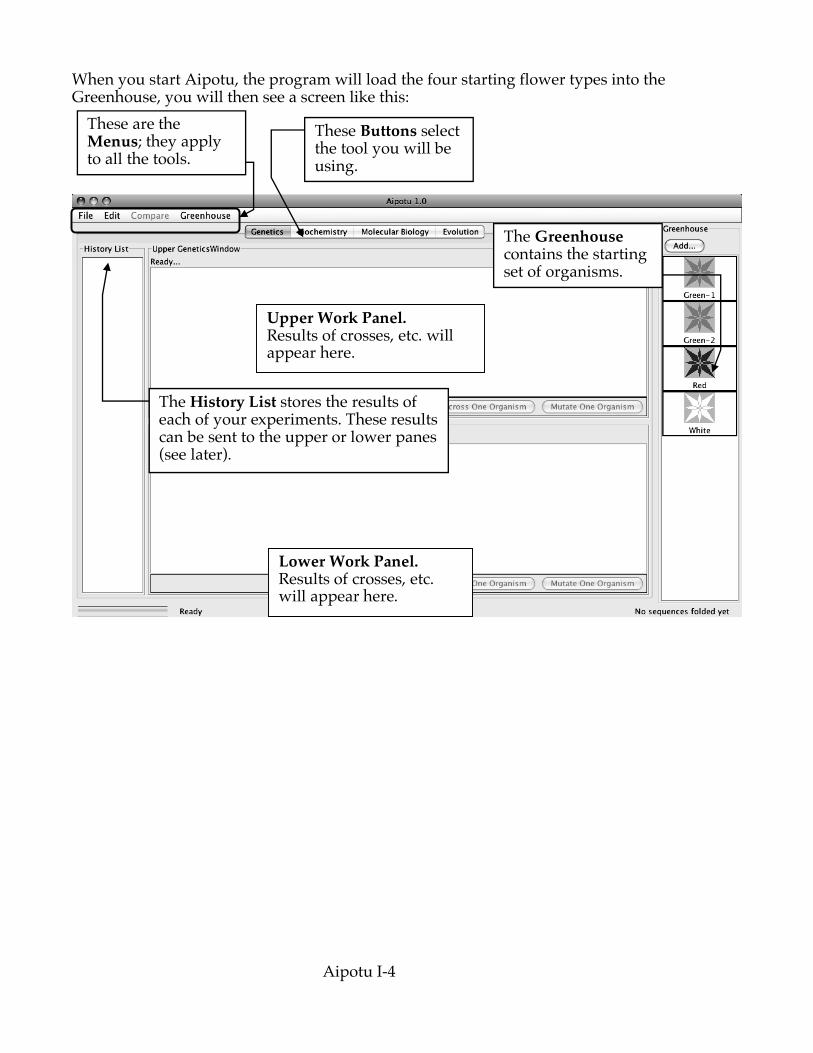
When you start Aipotu, the program will load the four starting flower types into the Greenhouse, you will then see a screen like this:
These are the Menus; they apply to all the tools.
These Buttons select the tool you will be using.
The Greenhouse contains the starting set of organisms.
Upper Work Panel. Results of crosses, etc. will appear here.
Lower Work Panel. Results of crosses, etc. will appear here.
The History List stores the results of each of your experiments. These results can be sent to the upper or lower panes (see later).
Aipotu I-5
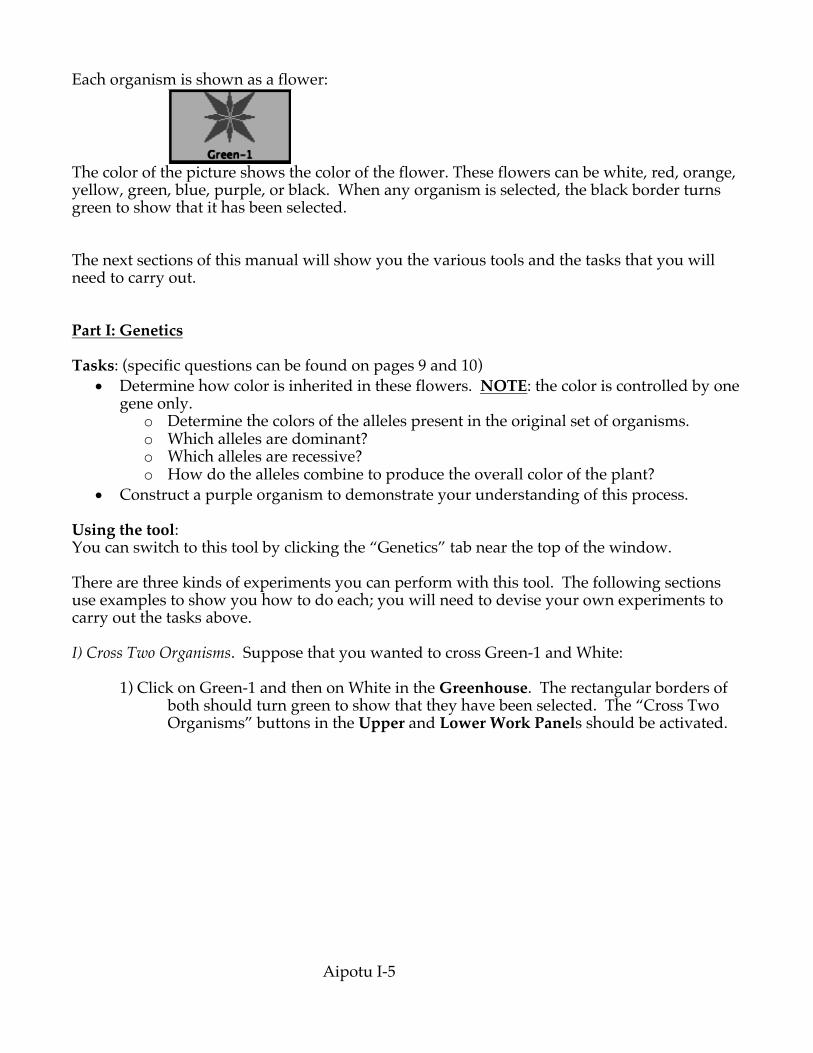
Each organism is shown as a flower:
The color of the picture shows the color of the flower. These flowers can be white, red, orange, yellow, green, blue, purple, or black. When any organism is selected, the black border turns green to show that it has been selected. The next sections of this manual will show you the various tools and the tasks that you will need to carry out. Part I: Genetics Tasks: (specific questions can be found on pages 9 and 10)
• Determine how color is inherited in these flowers. NOTE: the color is controlled by one gene only.
o Determine the colors of the alleles present in the original set of organisms. o Which alleles are dominant? o Which alleles are recessive? o How do the alleles combine to produce the overall color of the plant?
• Construct a purple organism to demonstrate your understanding of this process. Using the tool: You can switch to this tool by clicking the “Genetics” tab near the top of the window. There are three kinds of experiments you can perform with this tool. The following sections use examples to show you how to do each; you will need to devise your own experiments to carry out the tasks above. I) Cross Two Organisms. Suppose that you wanted to cross Green-1 and White: 1) Click on Green-1 and then on White in the Greenhouse. The rectangular borders of both should turn green to show that they have been selected. The “Cross Two Organisms” buttons in the Upper and Lower Work Panels should be activated.
Aipotu I-6
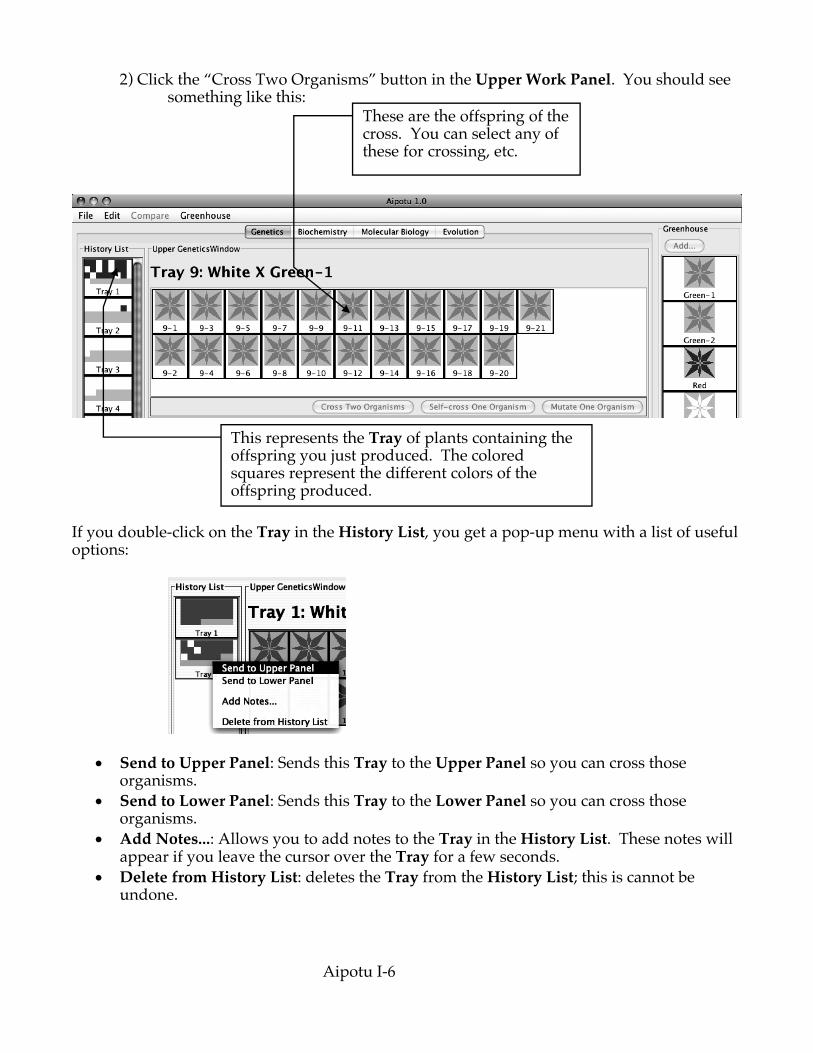
2) Click the “Cross Two Organisms” button in the Upper Work Panel. You should see something like this:
If you double-click on the Tray in the History List, you get a pop-up menu with a list of useful options:
• Send to Upper Panel: Sends this Tray to the Upper Panel so you can cross those organisms.
• Send to Lower Panel: Sends this Tray to the Lower Panel so you can cross those organisms.
• Add Notes...: Allows you to add notes to the Tray in the History List. These notes will appear if you leave the cursor over the Tray for a few seconds.
• Delete from History List: deletes the Tray from the History List; this is cannot be undone.
These are the offspring of the cross. You can select any of these for crossing, etc.
This represents the Tray of plants containing the offspring you just produced. The colored squares represent the different colors of the offspring produced.

Aipotu I-7
II) Self-cross a single Organism. Suppose that you wanted to self-cross one of the offspring in Tray 1: 1) Select any one organism from Tray 1 in the Upper Work Panel. You can de-select an organism by clicking on it. When you have only one organism selected, the “Cross Two Organisms” buttons will be grayed out and the “Self-Cross One Organism” and “Mutate One Organism” buttons will be activated. 2) Click the “Self-Cross One Organism” button in the Lower Work Panel. You should see something like this (since offspring are generated by random choice of parental alleles, you will likely see slightly different numbers of red and white offspring): You should see something like this:
The offspring of this self-cross are in the Lower Work Panel. Note the addition of Tray 2 to the History List.

Aipotu I-8
At this point, there are several other things you can do: A) If you find an interesting organism, you can save it to the Greenhouse: 1) Click the “Add…” button at the top of the Greenhouse. 2) You will be prompted to give the organism a name. Give it a descriptive name and click “OK”. You will see your new organism appear in the Greenhouse. You can now access it using the other tools in this program. 3) At this point, the organism is saved in the program, but not on the disk. To save the contents of the Greenhouse to disk, click on the Greenhouse Menu and select “Save Greenhouse”. B) You can cross or mutate any of the organisms visible in the Greenhouse, Upper Work Panel, or Lower Work Panel. C) You can bring any Tray from the History List to a Work Panel by double-clicking the Tray and selecting the appropriate item in the pop-up menu. D) You can add notes to any Tray in the History List by double-clicking the Tray and choosing the “Add Notes...” item from the resulting pop-up menu. These notes will appear if you leave the cursor over the Tray for a few seconds. IMPORTANT NOTE: This software is under development. Please treat it gently and be patient. Please report any bugs to your TA. You should save your Greenhouse regularly, especially if you save a large number of organisms. Specific Tasks to do with this tool:
a) How many different alleles are there? Which colors do they produce? It will be useful to use multiple-allele notation like this: CR = red; CG = green, etc.
b) Which are dominant and which are recessive? c) How do the colors combine to produce an overall color? For this, it may help to make a
genotype-phenotype table and then try to abstract rules from that. You should be sure that you have tried all the possible combinations of the alleles you found in part (a).
d) Using the symbols you have developed, give the genotypes of the four starting organisms.
e) Using this knowledge, construct a purple flower. f) Can you construct a pure-breeding purple flower with the starting set of organisms? g) Post your findings to your section’s Lab Data Blog.
How to go about accomplishing these tasks Follow the procedure from page (1) – look for patterns, make hypotheses, test hypotheses, revise hypotheses. Today, we will not write them out formally, but you should be thinking in these terms for the Aipotu II lab later in the semester.

Aipotu I-9
Put your data in the tables below: (a) and (b) allele color (c) Genotype Phenotype What rules can you find to explain the data above?

Aipotu I-10
(d) Using the allele symbols above, what are the genotypes of the starting strains? Green-1: Green-2: Red: White: (e) Have your TA check off that you have constructed a purple flower. For full credit, you must be able to explain to your TA why the flower is purple. (f) Can you construct a pure-breeding purple flower using only the four starting strains? Why or why not? (g) Have one group post your results to your section’s Lab Data Blog.

Aipotu I-11
Part II: Biochemistry I Tasks: Work together as a class to:
• Explain, in terms of the proteins present, the interactions between the alleles you found in Part I.
o Why is the color phenotype of some pigment proteins dominant while others are recessive?
o How do the pigment proteins combine to produce the overall color of the plant? • Determine the differences in amino acid sequence between the proteins produced by
the alleles you found in Part I. • Begin to determine how the amino acid sequence of a pigment protein determines its
color – you will complete this task in the Aipotu II lab later in the semester. As in real science, these tasks are too big to be solved by one group alone. If you think of real research as solving an enormous jigsaw puzzle, each researcher works on only one little corner of the puzzle. Scientists publish papers and present findings at conferences in order to connect the corners of the puzzle that each is working on. Important Note: It is always important to keep in mind, the ‘scientist’s mantra’: always be asking yourself “How could I be being fooled by this?” To continue the example from the previous page, consider the following: Suppose that the long thin protein were red, you might congratulate yourself that you had found the connection between shape and color. However, what if the real mechanism is that proteins containing arginine are red and your long thin protein just happened to be made with arginine. The red color would be fooling you into thinking you had it right. How do you avoid this trap? Even the best scientists sometimes fall into traps like this. The answer is to always be thinking of alternative explanations for your results. In the case above, one long thin red protein does not mean that “long & thin = red”. You have to collect more data: proteins that aren’t long and thin; long and thin proteins with different amino acids; etc. In this part of the lab, more than in the first part, it is the process of science rather than the answer that is most important. You will use a blog to collaborate as a class to solve this scientific problem. In this lab, you will use a weblog or ‘blog’ to share hypotheses, data, and conclusions among your lab-mates so that you can solve this problem in the three hours of the lab period. Individual contributions can be small, or even negative (“I know that it can’t be…”), but you will be able to accomplish the tasks above if you work together. In research, no one ‘owns’ data – the point is to figure out how the world works, not who got the result. This blog will also be available on the web for when you write your lab reports.

Aipotu I-12
Using the tool: Once you start Aipotu, you can switch to the tool for this section by clicking the “Biochemistry” tab near the top of the window. You will see something like this:
This part of the program uses the one-letter code for the 20 amino acids:
Amino Acid 3-letter code 1-letter code Mnemonic Alanine Ala A Alanine Arginine Arg R aRginine Asparagine Asn N asparagiNe Aspartic acid Asp D asparDic acid Cystine Cys C Cystine Glutamine Gln Q Q-tamine Glutamic Acid Glu E glu-tE-amic acid Glycine Gly G Glycine Histidine His H Histidine Isoleucine Ile I Isoleucine Leucine Leu L Leucine Lysine Lys K lysinK Methionine Met M Methionine Phenylalanine Phe F Fenylalanine Proline Pro P Proline Serine Ser S Serine Threonine Thr T Threonine Tryptophan Trp W tWptophan Tyrosine Tyr Y tYrosine Valine Val V Valine
This is a reference for the names and properties of the amino acids. • The single-letter code is shown below the three-letter code. • White circles are hydrophilic; gray are intermediate; and black
are hydrophobic. • A red (-) indicates a negatively-charged side chain • A blue (+) indicates a positively-charged side chain • A green (*) indicates a side chain that can make a hydrogen
bond.

Aipotu I-13
• Click in the Amino Acid Sequence Box at the top of the Upper Folding Window. Type a short sequence of letters and you will see a short amino acid sequence appear in the window. This tool converts the single-letter code to the three-letter code automatically.
• Click the “FOLD” button and a two-dimensional version of your amino acid sequence will appear in the Folded Protein window.
There are several important things to note about this folding process: It is the same as you used in the Protein Investigator. This is a highly-simplified model of protein folding. It is not intended to predict the correct structures of any proteins; it is designed to illustrate the major principles involved in that process. The important features of proteins that this software retains are as follows:
• Amino acids have side-chains of varying hydrophobicity, charge, and hydrogen bonding capacity.
• The amino acids are connected in an un-branched chain that can bend. • Hydrophobic amino acids will tend to avoid the water that surrounds the protein;
hydrophilic amino acids will bind to the water. • Amino acids that can form hydrogen bonds will tend to form hydrogen bonds if they
can. • Positively-charged amino acids will tend to form ionic bonds with negatively-charged
amino acids if they can. • Like-charged amino acids will repel each other if they can. • Ionic interactions are stronger than hydrogen bonds, which are stronger than
hydrophobic interactions. Even though this software provides some important insights into protein folding, you should always keep in mind that this is an approximation. The most important "gotcha's" to be aware of are:
• This program folds proteins in 2-dimensions only. • This program treats all amino acids as equal-sized circles. • This program models an environment where disulfide bonds do not form. • This program folds the protein based on the interactions between the side chains only. • This program does not model secondary or quaternary structure. • This program assumes that all side chains with hydrogen bonding capability can bond
with each other. These simplifications are necessary for two reasons. The first is technical: it turns out to be extremely difficult to predict the full 3-d folded structure of a protein given only its amino acid sequence. As of the writing of this lab manual, it takes a super-computer several days to predict the fully-folded shape of even a small protein like lysozyme. Even then, the predictions don’t always match known structures. Given the computers we have in the Bio 111 labs, it might take years…. The second reason is educational. Proteins are complex 3-dimensional molecules; thus, it can be hard to find your way around when inside one. Likewise, it would be very difficult to visually compare two protein molecules to observe the effects of changes to their amino acid sequence. It would be easy to miss the forest (the forces that control protein structure) for the trees (the tiny details of the structures).
Aipotu I-14
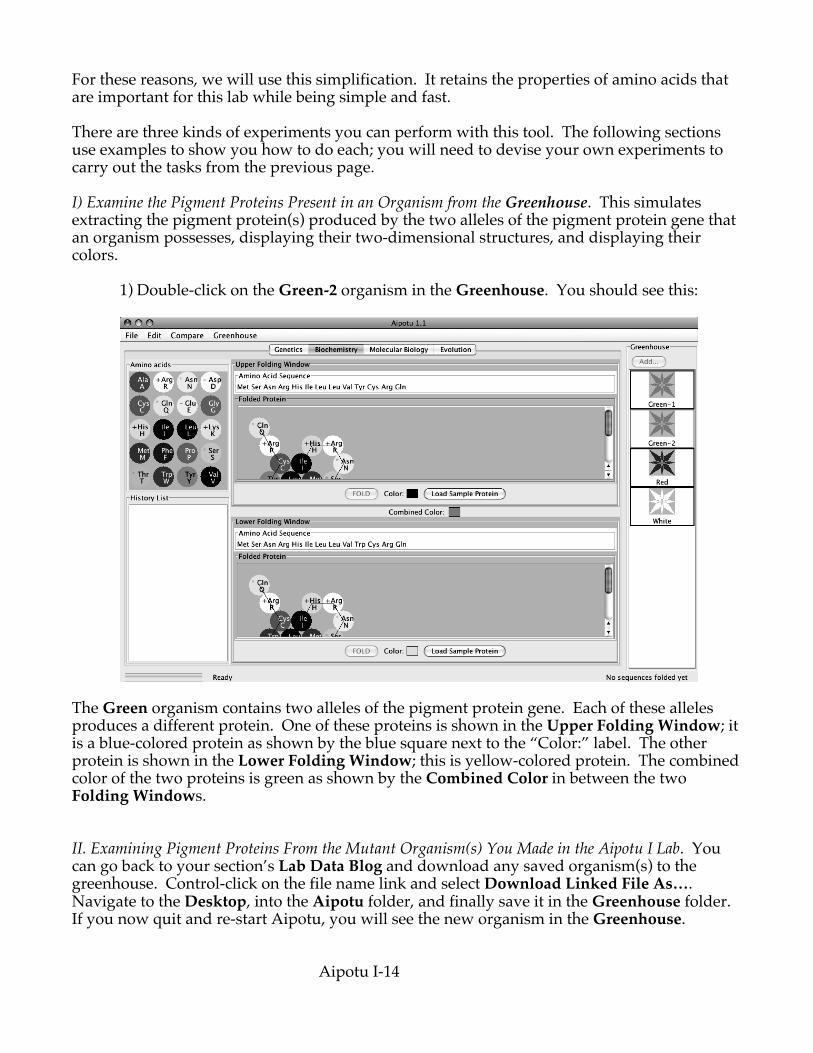
For these reasons, we will use this simplification. It retains the properties of amino acids that are important for this lab while being simple and fast. There are three kinds of experiments you can perform with this tool. The following sections use examples to show you how to do each; you will need to devise your own experiments to carry out the tasks from the previous page. I) Examine the Pigment Proteins Present in an Organism from the Greenhouse. This simulates extracting the pigment protein(s) produced by the two alleles of the pigment protein gene that an organism possesses, displaying their two-dimensional structures, and displaying their colors. 1) Double-click on the Green-2 organism in the Greenhouse. You should see this:
The Green organism contains two alleles of the pigment protein gene. Each of these alleles produces a different protein. One of these proteins is shown in the Upper Folding Window; it is a blue-colored protein as shown by the blue square next to the “Color:” label. The other protein is shown in the Lower Folding Window; this is yellow-colored protein. The combined color of the two proteins is green as shown by the Combined Color in between the two Folding Windows. II. Examining Pigment Proteins From the Mutant Organism(s) You Made in the Aipotu I Lab. You can go back to your section’s Lab Data Blog and download any saved organism(s) to the greenhouse. Control-click on the file name link and select Download Linked File As…. Navigate to the Desktop, into the Aipotu folder, and finally save it in the Greenhouse folder. If you now quit and re-start Aipotu, you will see the new organism in the Greenhouse.

Aipotu I-15
III) Compare the amino acid sequences of two pigment proteins. This aligns the two amino acid sequences so that the highest number of matching amino acids is obtained and then finds the remaining differences. 1) Double-click on the Green-2 organism in the Greenhouse. You should see that the Upper Folding Window shows a blue protein and the Lower Folding Window shows a yellow protein. 2) You can compare the amino acid sequence of these two proteins by clicking on the “Compare” menu and choosing “Upper vs. Lower”. A window will appear showing the differences between the two sequences. This is shown below:
This shows that the only difference is that, in the upper (blue) protein, amino acid 10 is tyrosine, while in the lower (yellow) protein, amino acid 10 is tryptophan. ÞYou can also copy the sequence of a particular protein to the clipboard using the options in the Edit menu. You can then Compare a sequence to the one in the clipboard. IV) Edit a Protein Sequence or Create a New Protein Sequence and Determine its Two-Dimensional Structure and Color. You can edit the sequence in either of the Amino Acid Sequence boxes and click the “Fold” button to predict the two-dimensional structure and color of the protein. The tool will also give the color that results from the combination of the colors in the Upper and Lower windows. For example, click anywhere in the “Tyr” corresponding to amino acid 10 in the Upper Amino Acid Sequence box. Click the “delete” key and that amino acid will disappear. Type an “L” (the one letter code for leucine) and the amino acid sequence should be: Met Ser Asn Arg His Ile Leu Leu Val Val Cys Arg Gln Click the “FOLD” button in the Upper Folding Window (or click the return key). You will see that the color of the new protein is white as shown by the “Color:” in the Upper Folding Window. You should also notice that:
• the “Combined Color” at the center of the window is now yellow. • there is now an entry in the History List with your new protein. The background of
History List entry is white to show the color of this protein. You can also click the “Load Sample Protein” button. This will load a sample amino acid sequence that folds to a white-colored protein with a shape that is similar to many colored proteins.

Aipotu I-16
If you double-click an entry in the History List, you will you get a pop-up menu with a list of useful options:
• Send to Upper Panel: Sends this Tray to the Upper Panel so you can cross those organisms.
• Send to Lower Panel: Sends this Tray to the Lower Panel so you can cross those organisms.
• Add Notes...: Allows you to add notes to the Tray in the History List. These notes will appear if you leave the cursor over the Tray for a few seconds.
• Delete from History List: deletes the Tray from the History List; this is cannot be undone.
Þ You can also take a Snapshot of either Work Panel In order to make entries in the data blog, you will need to take snapshots of particular proteins. A typical snapshot looks something like this; it shows the protein’s shape, amino acid sequence, and color:
You can take a snapshot in either of two ways:
• Save a snapshot as a picture. In the File menu, choose either Save Image of Upper Panel… or Save Image of Lower Panel… . You will then be asked to give the file a name and it will be (typically) saved to the desktop as name.png; you can then import that file into the data blog.
• Take a snapshot to the clipboard. In the Edit menu, choose either Copy Image of Upper Panel to Clipboard or Copy Image of Lower Panel to Clipboard. You can then paste the resulting image into another program, like Microsoft Word.

Aipotu I-17
Using the Blog to collaborate during class The data blog will allow all the members of the class to share hypotheses, data, and conclusions in a scaled-down scientific community. As you work, you should post to the blog. You should not post all your data; just the interesting bits. It is probably better to err on the side of including something rather than not; you never know if it will turn out to be interesting. You should also consult the blog frequently to see if there is data there that will help you figure out what’s going on. Periodically, your TA will ask you to take a break to have a brief research symposium where you will review the blog as a class and discuss what you’ve found so far and where you should be going. Using the blog will be tricky at first, but it will soon become easier. I) Logging In – login through your Blackboard account and go to the Bio 111 page. II) Posting – you should do this when you have an interesting result to share with the class. Again, it is better to err on the side of posting than not posting. Use the following procedure: 1) Click the “Lab Blogs” link in the navigation list: 2) In the list of Lab Blogs, click on the link for your lab section. 3) Click “Create Blog Entry”. 4) You will see something like this:
Title bar
Insert picture button (USE THIS ONE)
Danger danger! (Do not use this button)
Type text here

Aipotu I-18
A post should contain the following elements:
• Title. Enter this in the Title bar. It should contain your group name and a short phrase indicating the subject of your post. For example, “Brian, Tina, & Ling: This long protein is red!”
• An Image of the protein.
o First, save the image to the desktop. Using Aipotu’s “Save Image of … Panel…” from the File menu, save an image of the interesting protein to the Desktop. Give it a distinctive name so you can find it easily. Aipotu will add “.png” to the end of the file name to correctly identify it as an image.
o Next, insert it into the post. Use the “Insert/Edit Image” button. DO NOT USE the “Attach File” buttons.
• A Hypothesis. Using the format buttons, select bold type and type “Hypothesis:”. Go
to the next line and, using regular type, write the hypothesis you were exploring. For example, “Long thin proteins will be red”.
• The Experiment. “Experiment:” should be bold and on it’s own line. Follow with a
brief description of the experiment; for example, “We designed a long thin protein”.
• The Result. “Result:” should be bold and on it’s own line. Follow with a brief statement describing the result; for example, “The protein was colorless”.
• The Conclusion. “Conclusion:” should be bold and on it’s own line. Follow with a brief
conclusion; in this case, “The hypothesis is incorrect; long thin proteins are not necessarily red.”
A Sample post:

Aipotu I-19
IMPORTANT NOTES: (1) This software is under development. Please treat it gently and be patient. Please report any bugs to your TA. You should save your Greenhouse regularly, especially if you save a large number of organisms. You should also post pictures to the blog as soon as you can. (2) Don’t shut down or restart the computer or you will lose all the pictures you’ve saved on the Desktop and all the organisms you’ve saved in the Greenhouse. Specific Tasks for this section Work as a class, using the data blog to:
a) What are the differences in the amino acid sequences of the proteins produced by the alleles you define in Part I? Hint: use the Compare menu to find the difference(s) between the amino acid sequences.
b) How do the colors combine to produce an overall color? How does this explain the genotype-phenotype rules you found in Part I?
c) Start to work on these; post preliminary findings and questions to lab blog. You will finish this later in the semester:
o What features of the amino acid sequence make a protein pigmented? o What features of the amino acid sequence make a protein a particular color? o Which proteins are found in each of the four starting organisms? o Using this knowledge, construct a purple protein.

Aipotu I-20
Hints: A) It may be useful, before formulating any hypotheses, to look for patterns in the data.
Which features do colored proteins have in common that uncolored proteins lack? • Try comparing the amino acid sequences of proteins with different colors. • Here are some additional interesting sequences to try:
• FFFFFFFRRRRRR • RRRFFFFFFFRRR • KKKKKKLLLLLLF • KKKKKKLLLLLLL • SLQLNITMEVDFW • EEEWWWWWWWEEE
B) Scientists, including yourselves, often find it useful to use mutation to study
phenomena like this. Go to Genetics and make some mutants. Save any ones with interesting colors to the Greenhouse. Switch back to Biochemistry and look at the proteins they have.
Procedure:
1. Compare the proteins found in the starting strains to answer questions (a) and (b) on the following pages.
2. Your TA will assign your group one particular colored protein to study. Compare its sequence and shape to the “sample protein” that you get by clicking the Load Sample Protein button on one of the Folding Windows and then choosing from the Compare menu.
3. A representative from each group will come to the board to describe the sequence
and shape difference(s) between their protein and the sample. Note that each subsequent group should relate their findings to the previously-presented data.
4. Based on these data, as a class, make several specific hypotheses that can be tested.
5. Each group should work on one or more of their hypotheses and post them to the blog.
6. Your TA may stop for a mini-symposium to share data and design new hypotheses.
7. You will then be able to complete parts (d) through (f).

Aipotu I-21
Put your data in the tables below: (a) Which proteins are found in each of the four starting organisms? Green-1 Green-2 Red White (b) allele color amino acid sequence (highlight differences) We will start to work on these questions today. We will revisit and finish them in the Aipotu II lab later in the semester. Be sure to take good notes and post to the lab blog to keep a record of your thoughts, conclusions, and questions. (c) What features of a protein make it colored?

Aipotu I-22
(d) What features of the amino acid sequence make a protein a particular color? (e) How do the colors combine to produce an overall color? How does this explain the genotype-phenotype rules you found in part (I)? (f) Show your TA that you have made a purple protein. For full credit, you need to explain to your TA why it is purple.

Aipotu I-23
Lab report • Must be typed; handwritten reports will not be accepted. • Due during the week listed in the syllabus at the start of the lab session you are currently
in. This is a firm deadline. • Although you will perform these experiments as a group, each member of the group must
turn in an individual lab report and this report must be in your own words. Your lab report must include: A description of one place where one hypothesis (about the relationship between sequence, structure, and color) and some data interacted to lead to a firm conclusion. Note that the hypothesis must be from the Biochemistry section of this lab. You should not describe all the experiments you did; just one place where you were able to draw a firm conclusion. The conclusion can be positive (“My hypothesis was supported because…”) or negative (“My hypothesis was not supported because…”). This need not be an experiment you did, but it must have happened during your lab session. 1) Hypothesis – the hypothesis being tested. You must pick a clear and specific hypothesis that can be clearly and decisively tested by the experiment(s) you describe below. Your hypothesis need not be correct. 2) Experiments – a description of the experiment(s) you tried that addressed the hypothesis. Do not include all your experiments; only those relevant to the hypothesis from part (1). These must clearly and decisively test your hypothesis. 3) Results – pictures of the results of the experiments. You can get these from your section’s blog page. Just drag the picture from the web page to the word processor. You may need to note the color(s) in text since most printers print in black and white. 4) Conclusions – do the data support the hypothesis or not. Explain your reasoning. You will be graded on the quality of your argument: how clearly you described your hypothesis, experiment(s), and result(s) as well as how clearly and completely your conclusions are explained.