Embed Size (px)
Citation preview

Analysis Model of the Value of Information Flow forDecision Making and Performance Improvement inShop Floor of Developing Countries Using MachineLearning AlgorithmsAndré Marie MBAKOP ( [email protected] )
Ecole Nationale Superieure Polytechnique de Yaounde https://orcid.org/0000-0001-6606-6908Joseph Voufo
Ecole Nationale Superieure Polytechnique de YaoundeFlorent Biyeme
Ecole Nationale Superieure Polytechnique de YaoundeRolland Djomi
Ecole Nationale Superieure Polytechnique de YaoundePélagie Flore Temgoua Nanfack
Ministry of Scienti�c Research and Innovation , National Committee for Development of Technologies,Cameroon.Lucien Meva'a
Ecole Nationale Superieure Polytechnique de Yaounde
Research Article
Keywords: Decision making, Developing countries, Information �ow Characteristics, Machine Learning,Management of information �ow, Shop �oor
Posted Date: April 19th, 2021
DOI: https://doi.org/10.21203/rs.3.rs-356342/v1
License: This work is licensed under a Creative Commons Attribution 4.0 International License. Read Full License
ANALYSIS MODEL OF THE VALUE OF INFORMATION FLOW FOR DECISION
MAKING AND PERFORMANCE IMPROVEMENT IN SHOP FLOOR OF DEVELOPING
COUNTRIES USING MACHINE LEARNING ALGORITHMS
Abstract
Performance improvement is a daily activity for Small and Medium Size companies in the
manufacturing sector, which always depends on the good management of information flow for a better
decision making to facilitate shop floor operations that will have a major impact on quality and timely
product delivery to customers. The management of information flow is also conditioned by the
characterization of the information flow. In this paper we used the characteristics of information flow
to determine and predict an analysis model of the value of information flow that will facilitate decision
making in shop floor operations by operators (machine , humans and computers ) through the means of
machine learning. The outcome of our work proposes the Decision Trees Model as the better one to
predict the value of information flow as long as the characteristics are binary data or scale data , it shows
that a digital information can always has a good value of information flow if there is no disruptions and
finally we can still have a good value of information flow if using papers , visual , electronic real-time
information which are accessible , timely , none volatile, and that has a major concern which the shop
floor operations.
Keywords: Decision making. Developing countries. Information flow Characteristics. Machine
Learning. Management of information flow. Shop floor.
Introduction
Customers satisfaction in terms of product quality and timeliness delivery has always facilitate the
improvement of the development of Small and Medium Size Enterprises (SMEs), which also has
always been at the center of scientific research, this development is function of the relationship existing
between workers of companies explicitly known as information sharing and decision making. The
management of information flow (MIF) moves towards digitalize information known as information of
things and it is a key for performance improvement (Kim et al . 2017) , but in some developing countries
the concept of internet of things applied to the MIF is still not yet a mare event due to the lack of
technology transfer and the random economic situation (Agu and Mbah 2013; Saymeh and Sabha
2014; Unido 2021) . It is then an opportunity to work over a progressive transition from the traditional
MIF in shop floor operations to the digital MIF. A proper MIF renders manufacturing companies
continuously efficient when stochastics and none stochastics event related to machines and operators
behaviors occur (Sushil 2017; Dey et al. 2019; Shukla et al. 2019; Singh et al. 2019; Contador et al.
2020; Evans and Bahrami 2020; Ojstersek et al. 2020). This paper focus on shop floor of
manufacturing companies in developing countries where we have a poor management of information
flow that result to a wrong decision making from the tactic to the operational level and later cause a

decrease performance of the company. The MIF refers to have an upper hand on the shared information
by characterizing the information flow (Mbakop et.al 2021) , the MIF also consist of giving to
information flow a value in order to facilitate decision making in shop floor operations for performance
improvement of companies (Tomanek and Schroder 2020). Many research works were done in the
determination of the value of information flow (VIF) by integrating one of the characteristics of
information flow (CIF) namely quality and later dimension. But they haven’t considered the influence of at list two CIF in their analysis of the VIF to facilitate decision making in manufacturing companies.
Some tried to determine the VIF with the quality of information flow by using methods of technical
audit , process information integration and recently, dimension of information by using the Value Added
Heat Map (VAHM) method which leads to the degree of digitalization of processes in shop floor.
Nevertheless, all these methods become limited when facing a poor MIF in an environment where all
the CIF has an influence on the shop floor operation which is a particular case of some SMEs of
developing countries. This paper aims to integrate the CIF in the determination of the VIF to facilitate
decision making by operators or machines in the shop floor process using the approach of machine
learning and the hypothesis that all the CIF can be binary data firstly and secondly that only dimension
of information flow can be scale according to Tomanek and Schroder (2016). The accomplishment of
this gold will lead us to bring out a general presentation of decision making and the CIF, then illustrate
the previous works on the VIF and finally propose an analysis model to determine or predict the VIF,
followed by a results comparison.
1. Overview on Decision making and Information flow
Information flow can have several definitions depending on the context in which it is used, we will
present three contexts depending on the definition of information flow related to our research.
1.1 Collaborative and decision-making context
We can define information flow as the different types of flows that require a synergy between modern
organizations and computer systems (Mentzas et al. 2001). Information flow can be considered as
production order, customers’ demands in a supply chain (Mbhele, 2014). According to Mbakop et al.
(2021) information flow is a set of dynamic and static data in shop floor that can be characterized.
From these previous definitions it makes sense to introduce collaboration in the enterprise, this
collaboration in the enterprise leads to decision making which is a major aspect in performance
improvement Susilawati 2021 . A decision is the result of a personal or multi-personal brainstorm in
the face of a given concern or problem containing multiple possibilities, an interval of which seems to
optimally satisfy the company. Decision-making is therefore a permanent activity of managers and
workers. information sharing in the company takes place in the levels of decision-making, and according
to Joseph and Gaba (2019) , Partanen, et al. (2019), Hall et al.(2021) decision-making is influenced
by information flow. There are therefore 3 levels of decision making in companies that are influenced
by the flow of information to facilitate better collaboration, we can therefore present them as follows:
1.1.1 The strategic level
Conditioned by strategic management, strategic decisions are generally taken by a company's board of
directors. These decisions focus on the company's vision, on improving its performance and on perpetual
customer satisfaction in the long term (Julie Stal-Le Cardinal.2009). A strategic decision can be
illustrated by modifying a product's packaging to attract more customers, multiply the company's
performance, and renew the equipment available for manufacturing according to our local resources.
Existential information at this level will converge to the tactical level.
1.1.2 The tactical level

The tactical level is an intermediate level between the strategic and operational levels. The decisions
taken at this level are a direct consequence of those taken at the strategic level and sometimes they can
result from an influence of the operational level, this type of decision generally applies in the medium
term (Biard et al. 2017; Dumetz, 2018). This type of decision is taken by both management and
planning staff in all types of departments. The tactical level, according to the previous decision of the
strategic level, will be responsible for, for example, designing the packaging model, gathering the
finances for the realization of the new packaging, ordering the new machines for the production of the
packaging, gathering the resources for the realization of the new packaging.
1.1.3 The operational level
The operational level is a level of execution of the resolutions, it is the level of materialization of the
ideas of the strategic management, the operational management therefore manages the implementation
of the related operations with their resources (Biard 2017). Decision-making at this level is directly
linked to the tactical level. Information flows most often in both directions, meaning from the tactical
level to the operational level and from the operational level to the tactical level. In comparison to the
example of changing the packaging of the company's product, the operational level will for example
take care of the production of the packaging, assigning the tasks to the qualified human resource for the
production of the packaging, the reception and installation of the machines, the marketing policy for the
promotion of marketing.
Fig1. Presentation of the information flow in the decision-making levels.
According to the figure presented, we note some cases of circulation of information flow, namely IOS
and ISO which is a particularity of the companies in developing countries, the circulation of information
flow in these countries does not respect the hierarchy of decision-making levels.
1.2 Information flow characteristics
IST: Information from the Strategic level to the Tactical
level.
ITS: Information from the Tactical level to the Strategic
level.
ITO: Information from the Tactical level to the
Operational level.
IOT: Information from the Operational to the Tactical
level
ISO: Information from the Strategic level to the
Operational level.
IOS: Information from the Operational level to the
Strategic level.

The characterization of information flow in a shop floor can contribute to the amelioration of
information sharing among operators or workers of the shop floor supply chain. Information flow that
arrives in a shop floor or in the operational level can be characterized according to Berente and
Vandenbosch (2004) , Mbakop et al. (2021) by :
1.2.1 Dimension of information flow: it defines the means by which information flow can be
transferred, namely
• Written information on paper, (Thomas 1993 ; Durugbo et al . 2013)
• Vocal information, (Durugbo et al . 2013)
• Visual information, (Baudet et al . 2011 ; Müller et al. 2017)
• Electronic non-real time information (ENRT) , (Tomanek and Schröder 2016;Tomanek and
Schroder 2017).
• Electronic real time information (ERT) , (Tomanek and Schröder 2016 ; Tomanek and
Schroder 2017; Schmidtke et al. 2018 ; Skender et al. 2020)
• Digital information, (Demiris et al. 2008 ; Durugbo et al . 2013 ; Tomanek and Schroder
2017).
1.2.2 Direction of information flow: related to the hierarchy of every company an information flow
can take several directions according to where the message is being sent, it can be from the tactical level
to the operational level, according to Forza and Salvador (2001) , Global (2019) we have the following
directions of information flow :
• The upward information, it can be easily described by IOS, ITS, IOT.
• The downward information refers to IST, ITO, ISO.
• The horizontal information concerns the information flow that can be shared in the same level
of decision-marking.
• The diagonal information concerns the information flow than can be shared with different
organization.
1.2.3 Parameters of information flow: it defines the static and the dynamism of information when it
is shared (krovi et al.2003), it can be shown as:
• Velocity of information, which describe the speed at which an information flow.
• Viscosity of information, which describe the level of contradiction or resistance to the flowing
of information.
• Volatitlity of informaion flow, it can describe the loss of information while it is sent.
• Complexity of information flow, with describe the inability of a personnel to decode multiples
informations that were sent.
1.2.4 Quality of information flow: Information flow as to be of a good quality and quality of
information is vital for information sharing and decision-making. According to (Berente et al . 2009),
Berente and Vandenbosch (2004) information flow qualities can be described as:
• Transparency denotes the ability of workers to understand the information delivered to them
(Barki and Pinsonneault 2005; Carlile 2004).
• Accessibility defines the level of which an information is accessible, ( Berente et al . 2009).
• Timeliness refers to the availability of information when it is needed it is neither too late, nor
too early (Berente et al. 2009; Durugbo et al. 2010 ; Tomanek et Schroder 2017).

• Granularity can be seen as the level of details that an information flow can have (Volkoff et al.,
2005).
• Cost of information can be considered as added or the reduced cost on an output product and
also on product delivery to costumers (Ballou et al.1998).
1.2.5 Type of information flow: Information flow can be of two types according to Chibba and
Rundquist (2004).
• Direct information, when the information flow is directly related to the manufacturing of a
product and if it is not available the production process cannot start or if it has started it can be
stopped, that information can be qualified as direct.
• Indirect information, an information flow is said to be indirect when its absence doesn’t stop the manufacturing of a product.
2. The value of information
In industrial and job processes, materials and information flow are always on motion except that their
motions can be described by contrary direction. An information can then stop the flow of materials in
process, cause the materials not to be in process , from this we can then be focused on the value of
information that are in the process or that may trigger the process. According to the literature, there are
many ways to define or to consider the value of information:
• In the job operations sequences, the value of information can be linked with the benefit that
and information adds to a process or service , (Porter and Millar 1985).
• The value of information flow can be considered as a measure for the avoidance or
minimization of the bullwhip effect (Lee et al. 1997).
• Considering the integration of information flow in a process be it shop floor or not, to Berente
and Vandenbosch (2004) , Berente et al . (2009), the value of information is based on the
quality of information that is characterized by accessibility , transparency , timeliness and
granularity.
• The value of information can be created by information, which are transmitted correctly.
complete and in a timely manner (Reese 2016 , wang et al. 2012) , by avoiding disturbances
and media disruptions .
• Considering the works of (Tomanek and Schröder 2016) , the value of information flow is
function of scale of the dimension of information flow as presented in Table 1.

Table 1 : Value added heat map—evaluation scale for information flow (Tomanek and Schröder
2016)
Categorization
Value
Added
Level
Dimension of
Information Flow Scale
No Added
Value 0 Insufficient, incorrect or unnecessary
exchange of information
Limited
Added
Value
1 Written exchange of information (e.g.
paper document, fax, e-mail, etc.)
2 Verbal or visual exchange of information
3 Electronical exchange of information not
real-time (e.g. by spreadsheet application)
4 Electronical exchange of information
realtime (e.g. by system-application)
Maximum
Added Value 5 Digital exchange of information real-time
(e.g. by Internet of Things and Services)
• Considering the presence of materials on a production line in shop floor , the value of
information can be deducted from the impact that materials undergo on shop floor , and also
the value of information flow can be determined by knowing the digitalization degree in a
context of industry 4.0 using the method of Value Added Heat Map (VAHM) (Tomanek et
al .2020).
3. Method used for to determine the value of information
The information flow is set of data that can be static or dynamics (mbakop et al. 2021), and according
to the context of developing countries the information flow has different value due to the non-complete
digitalization of processes, the value of information (VI) can decrease because of the information
medium, the disruptions and redundancy. It is then very important to identify media disruptions and any
others every bottleneck that can occurs (Tomanek et Schroder 2017). The determination of the VI
according to the literature depends on the used methods. The determination of the value of information
in a process or a service has been a long target for researchers.
3.1 The Value of the information process integration
The effiency of a process depend on the quality of how a process is made, that process quality depends
also of the information flow , that is why Aubert et al .(2003) have integrate the value of information
in the Value of the process , they have consider the quality of information namely accessibility ,
transparency , timeliness, and granularity. Their value of information was considered as the sum of the

cost of accessibility, transparency , timeliness, and granularity. More the information quality cost is low,
more the value of information is high and more the information process integration is high also according
to the following equation:
𝑃𝐼 = (𝑉𝐴−∑ 𝐶(𝑎𝑗)+𝐶(𝑡𝑟𝑗)+𝐶(𝑡𝑖𝑗)+𝐶(𝑔𝑗)𝑛𝑗=1 )𝑉𝐴 (1)
We can then extract from equation (1) the equation of the value of information based on cost. 𝑄𝐼 = ∑ 𝐶(𝑎𝑗) + 𝐶(𝑡𝑟𝑗) + 𝐶(𝑡𝑖𝑗) + 𝐶(𝑔𝑗)𝑛𝑗=1 (2) 𝑄𝐼: Value of the quality of information flow
Berente and Vandenbosch (2004) , have proposed a another form of computation of the value of the
process integration depending of the quality of information , instead of considering the cost of
information quality , they have tried to attribute to every quality of information the factor of time. They
carried out an audit and they determine the different time referring to information quality characteristics.
The obtained formula of the process integration value is given by equation (3) and the value of
information that can be considered from it is given by equation (4) .
𝑃𝐼𝑡 = 1 − (∑ 𝑇(𝑎𝑗)+𝑇(𝑡𝑟𝑗)+𝑇(𝑡𝑖𝑗)+𝑇(𝑔𝑗)𝑛𝑗=1 )𝑇𝑇 (3)
We can then extract from equation (3) the equation of the value of information based on time .
𝑄𝐼 = ∑ 𝐶(𝑎𝑗)+𝐶(𝑡𝑟𝑗)+𝐶(𝑡𝑖𝑗)+𝐶(𝑔𝑗)𝑛𝑗=1 𝑇𝑇 (4)
𝑄𝐼: Value of the quality of information flow
The works of Aubert et al . (2003) , Berente and Vandenbosch (2004) , were only based on the quality
of information flow to influence the value of information in the process integration , it is not easy neither
to quantify a cost nor the time related to accessibility , timeliness , transperency and granularity
according to the authors , to quantify the time where and information may be accessible for each
operations in a shop floor process is a difficult task and doing that will take much more time. That is
why it is very important to look for an other way round.
3.2 The Value Added Heat Map
Where VA : Value added by the process, 𝐶(𝑥𝑗): Cost of providing property 𝑥 for activity j 𝑎𝑗 : Accessibility for activity j , 𝑡𝑟 : transparency for activity j 𝑡𝑖 : timeliness for activity j , 𝑔𝑖 : granularity for activity j
Where TT : Total time taken by the process, 𝑇(𝑥𝑗): Time of providing property 𝑥 for activity j 𝑎𝑗 : Accessibility for activity j 𝑡𝑟 : transparency for activity j 𝑡𝑖 : timeliness for activity j 𝑔𝑖 : granularity for activity j

Proposed by Tomanek et Schroder( 2017), the value Added Heat Map (VAHM) is an innovative
visualization tool that indicates the level value creation concerning production relevant factors. It is
following the methodically of a thermal heat map camera. The VAHM enables to have a view on the
added value level of production relevant factors by using colors scaling and it by developing key
performance indicators it finds also its application in determine relevant factors like the internal
circulation of information flow. To analyze the VIF, they have done an audit in the company in with
they have mapped the flow of information and the results of the audit lead them to scale the information
that were given a more added value to the process. Table 1 and Table 2 illustrate the information flow
in circulation in the shop floor and the VAHM respectively.
Table 2 : Value Stream Analysis - symbols for the visualization of an information flow (Tomanek et
Schroder 2016),
Symbols for the information flow Meaning
Manual information flow
Electronic information flow
Electronic information flow
Levelled production planning
Route of a kanban card
The value of information was then the estimate function of the digitalization degree , The layout-
specific digitalization degree indicates, which percentage the degree of information flow promotes
added value and it is computed from the ration of the sum of each information transfer multiplied
with the corresponding value added level and the amount of transferred information per time unit
multiplied with the highest possible value added level according to Equation (5) developed by
Tomanek and Schroder 2017.
𝐷𝐼𝐺𝐼𝑇𝐴𝐿𝐼𝑆𝐴𝑇𝐼𝑂𝑁 𝐷𝐸𝐺𝑅𝐸𝐸 = ∑ (𝐼𝑛𝑓𝑜𝑟𝑚𝑎𝑡𝑖𝑜𝑛 𝑇𝑟𝑎𝑛𝑠𝑓𝑒𝑟𝑡 ×𝑉𝑎𝑙𝑢𝑒 𝐴𝑑𝑑𝑒𝑑 𝐿𝑒𝑣𝑒𝑙)𝑁𝑖=1 𝑖𝑁×𝑀𝑎𝑥(𝑉𝑎𝑙𝑢𝑒 𝐴𝑑𝑑𝑒𝑑 𝐿𝑒𝑣𝑒𝑙) × 100 (5)
Though the Value Added Heat Map analyses the information flow, it shows a possibility on how
deficient information or defective information can be cause to the losses of time , in their work they
have only considered that the medium of information with is the dimension of information can be scale,
they haven’t integrated the scaling of direction of information flow, of the parameters , of the types and
of the quality of information flow. The considerations of all these characteristics of the information will
give a real knowledge on information flow management in the context of developing countries because
it is not all the SMEs manufacturing company with are high industrialized. It is important to consider
Information Transfer I = 1,….N;
N = Amount of transferred information per time unit
Value Added Level = 0……5;

that a digital information (dimension) of information can face disruption according to the network of the
environment such digital information will cause losses and will no more have “5” has added value.
It is therefore important to bring out a new method to determine or to analyze the value of information
flow in shop floor of developing countries considering the decision making and the characteristics of
information. Having many characteristics of information flow, the method of Value-Added Heat Map
will not be helpful unless we consider a reduction of variables, we have then focused our analysis on
machine learning methods.
4. Machine Learning Methods review
The analysis of the VIF in shop floor of developing using a machine learning algorithm approach has
not yet been a studies focus according to article that we have read in the literature , because the
development of information characteristics has been updated by Mbakop et .al ( 2021) . Machine
Learning Methods have been used in many applications in industries, we will the present a briefly view
of machine learning techniques and their different roles. Researchers have characterized machine
learning in trees groups, namely: Supervised Learning, Unsupervised Learning , Reinforcement
Learning . in this paper we will be concerned by supervised learning, among supervised learning
algorithms we can list :
Fig 2. classification of algorithms of supervised learning
Machine Learning ClassificationSupervised Learning
Classification
Decision trees (DT)
Random Forest (RF)
Support Vectors Machine (SVM)
Logistic Regression (LR)
General Bayesian Network(GBN)
KNearest-
Neighbour (K-NN)
Regression
Decision Tree(DT)
Linear Regression
Suppor Vector Machine(SVM)
Gaussian Process Regression (GPR)
Artificial Neural Network (ANN)

There are many algorithms of supervised learning but we have just listed some as noted in fig 2.
Support Vector Machine (SVM) is an algorithm of ML technique use for classification and prediction
analysis due to it high accuracy which is based on statistical analysis, it has been developed for pattern
recognition , classification , it uses a great number of data (Parikh et al.2010 ; Kankar et al.2011 ;
Ahmad et al.2019, Dataflair 2020 ) , it objective relies on is the individualization of hyperplanes
parallel to error minimization.
Decision Tree (DT) is an algorithm of ML with is also used for classification and prediction analysis.
The main purpose are to expose the structural information contained in data, his network is formed of
nodes which represents features (inputs) and the leaf nodes which represent the output (Lingitz et al
2018 ; Cinar et al. 2020 ).
Logistic regression (LR) : this is a classification function that uses class for building and uses a single
multinomial logistic regression model with a single estimator , it is also used for prediction and it is
usually states where boundary are between 0 and 1 (Bhavsar and Ganatra 2012; Osisanwo et al.
2017 ).
Bayesian Networks (BN): it is a statistical classifiers that predict the class of probability, Bayesian
networks are graphical models, showing the relationship between the subset of attributes and BN have
exhibited high accuracy and speed when applied to large databases ( Jensen 1996 ; Friedman et al.
1997 ; Bhavsar and Ganatra 2012; Osisanwo et al. 2017).
Random Forest (RF): this classification algorithm contains of a set of trees , in which similar
independent vector vectors are distributed, and every tree issues a voting unit for the most common
category in input, ( Breiman 2001 ; Jhonnerie et al . 2017 ; Goel et al . 2017 ) .
KNearest-Neighbour (K-NN): k-NN is an algorithm mostly used for classification problems and
pattern recognition, This method classifies cases based on the relationship between variables and can be
used for both classification and regression ( Mishra and Sahu 2011; Alam 2019 ; Abdulqader et.
al.2020).
Neural Network (NN) : NN are machine learning tools that can perform classification or /and
regression task at once .Artificial Neural Network (ANN) depends upon three fundamental aspects, input
and activation functions of the unit, network architecture and the weight of each input connection(
Kankar et al.2011 ; Osisanwo et al. 2017 ; Lingitz et al 2018 ; Cinar et al.2020)
A comparative studies has been done and presented by (Bhavsar and Ganatra 2012; Osisanwo et al.
2017) in Table 3 , we present an extract of that comparative study.
Table 3: Comparative study of commonly used Classification Techniques
Decision
Trees(DT)
Neural Network(NN) Bayesian
Network(BN)
K-Nearest
Neigbor (K-NN)
Support Vector
Machine (SVM)
Accuracy in general Good Very Good Average Good Excellent
Speed of learning Very Good Average Excellent Excellent Average
Speed of
classification
Excellent Excellent Excellent Average Excellent
Tolerance to missing
values
Very Good Average Excellent Average Good

Tolerance to
redundant attributes
Good Very Good Average Good Very Good
Dealing with
discrete/
binary/continuous
attributes
All Not discrete Not
continuous
All Not discrete
Support
Multiclassification
Excellent Naturaly extended Naturaly
extended
Excellent Binary classifier
5. Methodology
To bring out a new approach that will be lightly based on the previous one techniques (VAHM) and for
the characteristics of information flow to be integrated in the analysis, we will be using the different
steps to predict the VIF using the classification algorithms of ML. In shop floor of developing countries,
IFC can have an impact on the production or manufacturing based on decision making by operators. In
this analysis we will consider the following hypotheses(H1,H2).
H1: The IF is a row matrix 𝑀𝐼𝐹 of 5 rows Matrix (𝑋𝑘 , 1 ≤ 𝑘 ≤ 5 ) representing all the 5 matrix of
the IFC and all the IFC are not dependent each other. Each of 𝑋𝑘 row matrix has a 𝑥𝑖 component that
is totally binary for one case and for an order one only the dimension information value will not be
binary data but they will derive from the scale of information dimension as presented in Table 2 .
For each 𝑋𝑘 = (𝑥𝑖) , 𝑥𝑖 = { 𝑓𝑜𝑟 𝑇𝑦𝑝𝑒 , 1 ≤ 𝑖 ≤ 2𝑓𝑜𝑟 𝐷𝑖𝑚𝑒𝑛𝑠𝑖𝑜𝑛 , 1 ≤ 𝑖 ≤ 6𝑓𝑜𝑟 𝐷𝑖𝑟𝑒𝑐𝑡𝑖𝑜𝑛 , 1 ≤ 𝑖 ≤ 4𝑓𝑜𝑟 𝑃𝑎𝑟𝑎𝑚𝑒𝑡𝑒𝑟𝑠 1 ≤ 𝑖 ≤ 4𝑓𝑜𝑟 𝑄𝑢𝑎𝑙𝑖𝑡𝑦, 1 ≤ 𝑖 ≤ 4 (6)
For quality, we will not consider the fifth sub characteristics which is the cost of information flow in
this paper , that is why quality contain 4 components .
H2, First case : In this case the characteristics of information flow will be taken as binary data and each
characteristic we will present some considerations.
• Types of information flow : An information flow arriving in the shop flow can directly
influence the process of manufacturing of a product then the “direct value” will be consider as 1, if we don’t have any indirect information flow ( that doesn’t influence the process) it will be consider as 0, we can also have a direct information flow and then an indirect information flow
at the same time in the process.
• Dimension of information flow: We consider here that an information flow can only be sent in
the shop floor on one dimension, then if it is documented it takes the value of 1 and the rest of
information dimension is 0 .
• Direction of information flow : if one direction like the upward is at 1 the rest will be at 0.
• Parameters of information flow : here all the parameters can exist at the same time and can have
the same or different binary values.
• Quality of information flow , it carries the same assumption like the parameters of IF.
H2,Second case : In this case only the dimension characteristics of information flow won’t be a binary data , but the rest will be consider as binary data and the previous considerations of the first case will
be the same.
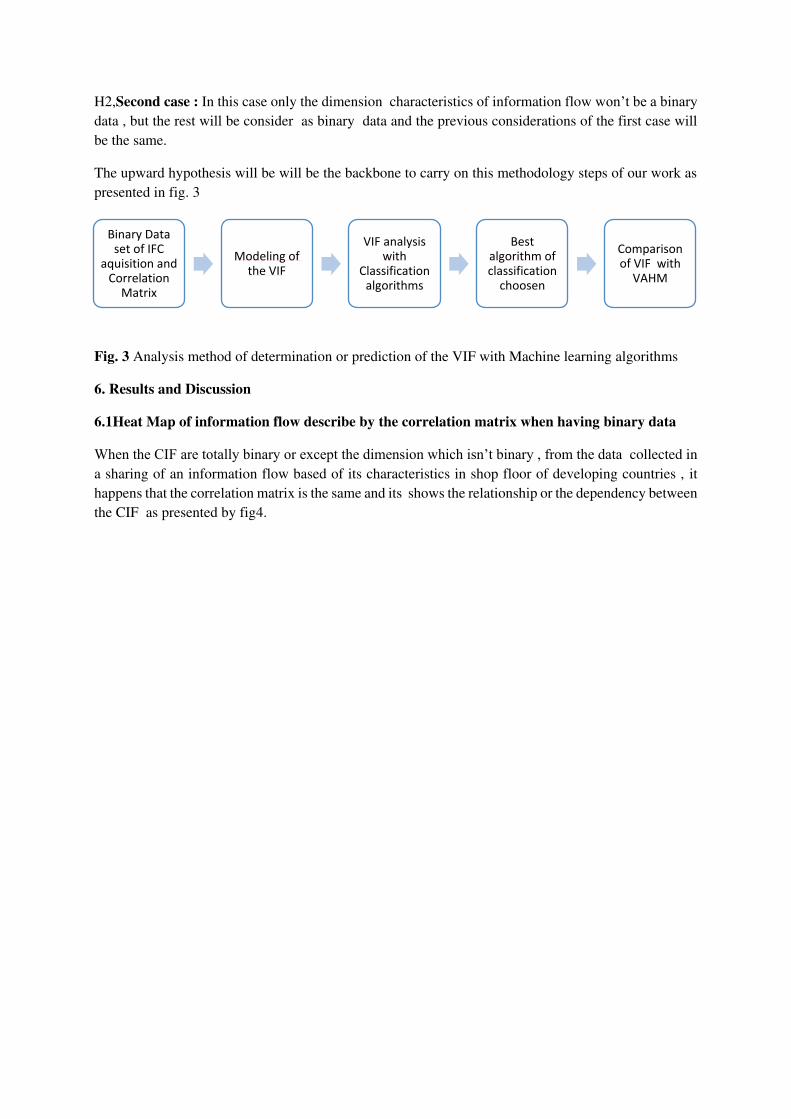
The upward hypothesis will be will be the backbone to carry on this methodology steps of our work as
presented in fig. 3
Fig. 3 Analysis method of determination or prediction of the VIF with Machine learning algorithms
6. Results and Discussion
6.1Heat Map of information flow describe by the correlation matrix when having binary data
When the CIF are totally binary or except the dimension which isn’t binary , from the data collected in
a sharing of an information flow based of its characteristics in shop floor of developing countries , it
happens that the correlation matrix is the same and its shows the relationship or the dependency between
the CIF as presented by fig4.
Binary Data set of IFC
aquisition and Correlation
Matrix
Modeling of the VIF
VIF analysiswith
Classification algorithms
Best algorithm of classification
choosen
Comparison of VIF with
VAHM

Fig 4. Correlation Matrix of the CIF
The correlation Matrix indicates the following observations
Observation 1
A perfect dependency (1.0) of every characteristics of information flow with each other, which mean
technically that, the information flow sharing depends on the CIF and that none of the characteristics
should be left out for they have the same weight.
Observation 2
A negative dependency (-0.5) between each of the sub characteristic of the type of information flow ,
namely direct and indirect ,on shop floor process it can be seen as to have a look on the type of
information that are sent or shared in the shop floor depending on their influence on the process , more
the direct information is in the process, the indirect information has to be left out, more the indirect
information are in the process the direct one has to be left out, there shouldn’t be both of them at the
same time to avoid confusion.

Fig.5 Correlation between the type of information flow
Observation 3
A negative dependency (-0.2) between each of the sub characteristic of the dimension of information
flow , which means that in the shop floor operations processes , the arrival of information flow in a
shop floor for a process has to be only and only on one information dimension in order to avoid loss of
time for in operations processes and facilitate decision making , the operator should not see two same
information in two different dimension at the same time, this correlation matrix is the same even when
the dimension of information flow changes. that is why the correlation matrix of the dimension of
information is given by fig.6 .
Fig.6 Correlation between the dimension of information flow
Observation 4
A negative dependency (-0.3) between each of the sub characteristic of the direction of information flow
, which signify to avoid confusion in decision making by operators in shop floor an information flow
should come only from one level and not two level at the same time.
Fig.7 Correlation between the direction of information flow
Observation 5

From observation 2, 3, and 4 , the influence of levels of decision making is more than the one of the
dimension of information flow looking at the negative dependency, the types of information flow (direct
or indirect ) has a great negative influence more than an information that comes from the decision level
and also the transmission support (dimension) of information. From all the above observation the
dependency between the features or information characteristics does not exist, therefore we can’t use this dataset for regression only for classification.
2) Modeling of the Value of information flow (VIF)
The VIF that we want to obtain or predict for every information flow arriving in the system is described
by equation, (7) , is presented by fig. 8. 𝑉𝐼𝐹 = 𝑓(𝑋𝑘) (7) 𝑀𝐼𝐹 = (𝐷𝑖𝑟𝑒𝑐𝑡, 𝐼𝑛𝑑𝑖𝑟𝑒𝑐𝑡 , 𝐷𝑜𝑐𝑢𝑚𝑒𝑛𝑡, 𝐴𝑢𝑑𝑖𝑜, 𝑉𝑖𝑠𝑢𝑎𝑙, 𝐸_𝑁_𝑅_𝑇, 𝐸_𝑅_𝑇, 𝐷𝑖𝑔𝑖𝑡𝑎𝑙, 𝑈𝑝𝑤𝑎𝑟𝑑, 𝐷𝑜𝑤𝑛𝑤𝑎𝑟𝑑,𝐻𝑜𝑟𝑖𝑧𝑜𝑛𝑡𝑎𝑙, 𝐷𝑖𝑎𝑔𝑜𝑛𝑎𝑙, 𝑉𝑒𝑙𝑜𝑐𝑖𝑡𝑦, 𝑉𝑖𝑠𝑐𝑜𝑠𝑖𝑡𝑦, 𝐶𝑜𝑚𝑝𝑙𝑒𝑥𝑖𝑡𝑦, 𝑉𝑜𝑙𝑎𝑡𝑖𝑙𝑖𝑡𝑦, 𝑇𝑟𝑎𝑛𝑠𝑝𝑒𝑟𝑒𝑛𝑐𝑦 , 𝐴𝑐𝑒𝑠𝑠𝑖𝑏𝑖𝑙𝑖𝑡𝑦, 𝑇𝑖𝑚𝑒𝑙𝑖𝑛𝑒𝑠𝑠, 𝐺𝑟𝑎𝑛𝑢𝑙𝑎𝑟𝑖𝑡𝑦) (8)
Focusing on the specificity of developing countries which has not yet improve in the development of
new technologies , Base on the information disruptions and the work of (Aubert et al .2003 ; Berente
and Vandenbosch 2004 ;Tomanek and Schroder 2017) which considered that a VIF will be good or
add a value to a process in terms of quality or time, if its respects the for both cases equation (9) :
, 𝑉𝐼𝐹 = 1 𝑖𝑓 { 𝑉𝑒𝑙𝑜𝑐𝑖𝑡𝑦 = 1𝑉𝑜𝑙𝑎𝑡𝑖𝑙𝑖𝑡𝑦 = 0𝐴𝑐𝑒𝑠𝑠𝑖𝑏𝑖𝑙𝑖𝑡𝑦 = 1𝑇𝑖𝑚𝑒𝑙𝑖𝑛𝑒𝑠𝑠 = 1 (9)

The determination of VIF in the shop floor process will be of a difficult task if we base ourselves just
on the upward equations (7) , (8) and (9). Therefore we will use classification algorithm to determine
the correct model to be chosen to facilitate the determination or the prediction of the VIF as indicate by
fig.8.
Fig.8 Analysis of VIF with machine learning model.
3) Analysis of the VIF with Classification algorithms
In this paper we will be focus on these various classifications algorithms: DT , KNN, RF, SVC, LR ,
GNB,GB. After splitting and train the dataset, the results obtained from our computation with python
using the complete binary data and when it is only the dimension which is not binary (Tomanek and
Schroder 2016 ) are presented in fig. 9 and fig.10 respectively.
3.1 ) Models evaluation
From the results obtained from fig.9 and fig.10 respectively , we can observe that :
• The accuracy of all the chosen algorithms except from KNN is equal to one, it means that
for this total binary dataset all the chosen algorithm can predict the value of an information
flow arriving in the process.
• The accuracy of DT is higher among all when data are totally binary.

The chosen model for both type of data is DT because it has the highest accuracy and it has a good
speed of classification and it is mostly fit for all type of data
3.2) Prediction analysis
An information flow sharing between shop floor operators (humans and or machines) during a
operations processes can have a VIF that is to considered or not according to the characteristics of the
information flow. Depending on the kind of operators some information characteristics differs it can be
illustrated by this example: An information flow can be complex for man operator but not for an
automated machine , a paper information is more for a human operator and not of the machine . It has
to be noted that , operators will do their tasks or not according to VIF , as presented in fig.11.
Fig.11 Illustration of the analysis of VIF with the DT model.
Fig 9. Accuracy of selected classification
models with binary data
Fig 10. Accuracy of selected classification models
with binary data except dimension of information
flow

The predicted value of the VIF will be shown for some cases of the information flow chosen randomly
when it arrives in the shop floor.
3.2.1 Prediction analysis based on the dimension of information flow
• For an information flow having the following inputs:
𝑀𝐼𝐹 = [1,0,0,0,0,0,1,0,0,0,1,0,1,1,0,0,1,1,1,0] , meaning that the information circulating in
the shop floor has a direct impact to the operation process , the information has been sent through
an electronic application ( computer aided manufacturing program ), the process has been
ordained in by an operator uniquely (horizontal) and that the information in the system is
supposed to be communicated is speedily , but on there is a low signal of connection , the
information is well transparence for the operator , the information is accessible , though it is not
details , a such information flow will have a good added value to the process meaning the
process will be realized without any delay as predicted by the model. So VIF=1. 𝑀𝐼𝐹 = [1,0,0,0,0,0,0,1,0,0,1,0,1,0,0,1,1,0,1,0] , this information flow is digital but it volatility
is at 1 , and the timeliness is 0 , so the information doesn’t arrived on time though it is digital , this is because of the poor availability of a continuous network in some developing countries ,
such information will not have an added value to the process , so it VIF=0.
The result obtained is proportional to the real one happening in the shop floor of developing countries,
a documented information having all the manufacturing information will have the same added value as
the digital information that is sent in a machine without any disruption as shown in fig.12. Do the world
are moving towards paperless operations to digital one, the none digital information in this context has
also their application in the added value of information.

Fig.12 VIF function of the dimension of information flow with binary data.
• For an information that the dimension of information is scale the results Tomanek and
Schroder 2016 the prediction examination where medium is the paper and the accessibility is
good , the volatility do not exist , the timeliness of the information flow is good , the velocity
is good , all this describe by : 𝑀𝐼𝐹 = [1,0,0.2,0,0,0,0,0,0,0,1,0,1,1,0,0,1,1,1,0] , the predicted
VIF = 1 and facilitate a good decision making , stating that such information is good and can
add a value to the system. So an information paper with is accessible, which has a velocity and
if it arrive on time to the operator and if the operator is able to decode it, it will have the same
added value with the digital information according to our prediction and hypothesis. The
predicted VIF function of the dimension of information flow with is not binary, justifies our
results according to fig.13.
Fig.13 VIF function of the dimension of information flow with scale data of the dimension of
information flow.

3.2.2 Prediction analysis based on the direction of information flow
The result obtained in the decision making in shop floor , based to whom to send the information
according to the decision level is described here by the direction of information , the VIF (with binary
data and scale data) is also function of the direction of the information as show in fig. 14 , It present a
real life situation of SMEs for decision making where has to come from a decision level for an action to
be taken .
Fig.13 VIF function of the direction of information flow
Conclusion
Information management in shop floor operations is at the center of decision making, a well-organized
MIF based on the CIF will increases the efficiency of the SMEs. This article aimed at analyzing a
machine learning model to determinate and also predict the VIF in shop floor of SMSs in developing
countries in order to improvement decision making by operators or machine on operations tasks. It
emerges from this research works that previous methods as VAHM and Information process integration
for the determination of VIF, but without integrating all the CIF. According to the specificity of
developing countries where information flow disorderly , we went on the hypothesis of having binary
data for the CIF firstly and secondly scale data for the dimension of information flow based on the
results of Tomanek and Schroder( 2016), DT classifier was the best model that has been chosen for
both cases and it results out that even a paper information in motion in the shop floor for production
operation can have also an acceptable added value as digital information and finally we observe that that
direction of information doesn’t has a mare difference influence on VIF when changing data.

References
Abdulqader, M.D ., Abdulazeez, A.M., Zeebaree,D.Q. (2020) . Machine Learning Supervised
Algorithms of Gene Selection: A Review, Technology Reports of Kansai University, 62(3), 1-12.
Aubert B.A., Vandenbosch B. and Mignerat M., (2003). Towards the measurement ofproeess
integration. Scientific series ofCIRANO (Centrc Interuniversitairc de Recherche en Analyse des
Organisations).
Ahmad, W.M.T.W.; Ghani, N.L.A.; & Drus, S.M. (2019). Data mining techniques for disease risk
prediction model:A systematic literature review, Adv. Intell. Syst. Comput, 843, 40–46.
Alam, M. W. U. (2019). “Improved Binary Bat Algorithm for Feature Selection,”.
Agu, O. C., & Mbah, S. A. (2013). African firms manufacturing and economic development: Is Africa
effectively competing in manufacturing in the world market. IOSR Journal of Humanities and Social
Science, 12(3), 34–46.
Ballou, D. P., Wang, R., Pazer, H., & Tayi, G. K. (1998). Modeling information manufacturing systems
to determine information product quality. Management Science, 44(4), 462–484.
Barki, H., & Pinsonneault, A. (2005). A Model of Organizational Integration, Implementation Effort,
and Performance. Organization Science, 16(2), 165–179. doi:10.1287/orsc.1050.0118.
Baudet, N., Pillet, M., & Maire, J. L. (2011). Visual inspection of products: a comparison of the methods
used to evaluate surface anomalies. International Journal of Metrology and Quality Engineering, 2(1),
31–38. doi:10.1051/ijmqe/2011006.
Berente, N., &Vandenbosch, B. (2004). Factors Inhibiting Information Process Integration, Case
Western Reserve University, USA . Sprouts: Working Papers on Information Systems, 4(3).
http://sprouts.aisnet.org/4-3
Berente, N., & Vandenbosch, B. (2009).Information flows and business process integration, Business
Process Management Journal,15(1), 119–141. http://dx.doi.org/10.1108/14637150910931505
Bhavsar, H., & Ganatra, A. (2012). A Comparative Study of Training Algorithms for Supervised
Machine Learning. International Journal of Soft Computing and Engineering (IJSCE) , 2(4), 2231-2307.
Biard,T., Bourey,J-P.,Bigand,M.,Bocquet,J-C.( 2017). Modélisation des prises de décisions dans les
processus métier grâce à DMN (Decision Model and Notation). 12ème Congrès International de Génie
Industriel , Compiègne, France.
Breiman,L.(2001). “Random forests,” Mach. Learn. 45 (1), 5–32.
Carlile, P. R. (2004). Transferring, Translating, and Transforming: An Integrative Framework for
Managing Knowledge Across Boundaries. Organization Science, 15(5), 555–568.
doi:10.1287/orsc.1040.0094.

Çınar, Z.M.; Abdussalam Nuhu, A.; Zeeshan, Q.; Korhan, O.; Asmael, M.; , & Safaei, B. (2020).
Machine Learning in Predictive Maintenance towards Sustainable Smart Manufacturing in Industry
4.0. Sustainability, 12, 8211. https://doi.org/10.3390/su12198211
Chibba, A., & Rundquist, J. (2004). Mapping flows—An analysis of the information flows within the
integrated supply chain. In Proceedings of the 16th annual conference for Nordic researchers in logistics.
Retrieved October 9, 2020 from https://www.diva-portal.org/smash/getdiva2:237919/fulltext01.
Contador, J. C., Satyro, W. C., Contador, J. L., & Spinola, M. M. (2020). Flexibility in the Brazilian
industry 4.0: challenges and opportunities. Global Journal of Flexible Systems Management, 21, 15–31.
https://doi.org/10.1007/s40171-020-00240-y.
DataFlair (2019) .Team Support Vector Machines Tutorial—Learn to implement SVM in Python. Data
Flair2019. Available online: https://data-flair.training/blogs/svm-support-vector-machine-tutorial/
(accessed on19 September 2020).
Demiris, G., Washington, K., Oliver, D. P., & Wittenberg-Lyles, E. (2008). A study of information flow
in hospice interdisciplinary team meetings. Journal of Interprofessional Care, 22(6), 621–629.
Dey, S., Sharma, R. R. K., & Pandey, B. K. (2019). Relationship of manufacturing flexibility with
organizational strategy. Global Journal of Flexible Systems Management, 20(3), 237–256. https://doi.org/10.1007/s40171-019-00212-x.
Dumetz,L.(2018). Simulation combinée des processus de production et des processus de pilotage :
analyse comparative de stratégies de pilotage pour la production de bois d'oeuvre. Dissertation thesis of
phd , Université Laval.
Durugbo, C., Tiwari, A., & Alcock, J. R. (2010). Managing information flows for product-service
systems delivery. In Proceedings of the 2nd CIRP IPS2 conference, Linkoping, 14–15 April 2010 (pp.
365–370).
Durugbo, C., Tiwari, A., & Alcock, J. R. (2013). Modelling information flow for organisations: A
review of approaches and future challenges. International Journal of Information Management, 33, 597–610.
Evans, S., & Bahrami, H. (2020). Super-flexibility in practice: Insights from a crisis. Global Journal of
Flexible Systems Management, 21(3), 207–214.
Friedman, N., Geiger, D., & Goldazmidt. ( 1997) .Bayesian Network Classifiers,‖ Machine Learning, 29, 131-163.
Forza, C., & Salvador, F. (2001). Information flows for high-performance manufacturing. International
Journal of Production Economics, 70(1), 21–36.
Global Assignment. (2019). Information flow: Analysis and types of information flow. Retrieved June
5, 2020, from https://www.allassignmenthelp.co.uk/blog/information-flow-analysis-and-types-of-
information-flow/.
Goel,E., Abhilasha,E., Goel, E., Abhilasha,E. (2017). “Random forest: A review,” Int. J. Adv. Res. Comput. Sci. Softw. Eng., vol. 7( 1), 2017.
Hall, D.C., Johnson-Hall, T.D. The value of downstream traceability in food safety management
systems: an empirical examination of product recalls. Oper Manag Res (2021).
https://doi.org/10.1007/s12063-021-00184-1.
Jensen. (1996). An Introduction to Bayesian Networks,‖ Springer, 1996.
Jhonnerie,R, Siregar,V.P , & Nababan, B. (2017). “Comparison of random forest algorithm which implemented on object and pixel based classification for mangrove land cover mapping,” ICST ,1, 292–302.
Joseph, J., & Gaba, V. (2019). Organizational structure, information processing, and decision making:
a retrospective and roadmap for research.Academy of Management Annals.
doi:10.5465/annals.2017.0103.
Julie Stal-Le Cardinal.( 2009). Approche systémique de la prise de décision en entreprise. Mécanique
[physics.med-ph]. Université de Nantes.
Kankar, P.K., Satish ,C., & Sharma, S.P. (2011) , Harsha Fault diagnosis of ball bearings using machine
learning methods. Expert Systems with Applications , 38 , 1876–1886.
Kim, H.J. Information technology and firm performance: the role of supply chain integration. Oper
Manag Res 10, 1–9 (2017). https://doi.org/10.1007/s12063-016-0122-z.
Krovi, R., Chandra, A., & Rajagopalan, B. (2003). Information flow parameters for managing
organizational processes. Communications of the ACM, 46(2), 77–82.
Lee , H., Padmanabhan ,V., & Whang, S. (1997) The bullwhip effect in supply chains. In: Sloan
management review. Spring, 93.
Lingitz,L; Gallina,V; Ansari,F; Gyulai,D; Pfeiffer,A; et al. (2018). Lead time prediction using machine
learning algorithms: A case study by a semiconductor manufacturer, Procedia CIRP, 72, 1051-1056,
https://doi.org/10.1016/j.procir.2018.03.148.
Mbakop, A.M., Voufo, J., Biyeme, F. et al. (2021). Analysis of Information Flow Characteristics in
Shop Floor: State-of-the-Art and Future Research Directions for Developing Countries. Glob J Flex Syst
Manag 22, 43–53. https://doi.org/10.1007/s40171-020-00257-3
Mbhele, T. P. (2014). Antecedents of Quality Information Sharing in the FMCG Industry. Journal of
Economics and Behavioral Studies, 6(12), 986-1003. https://doi.org/10.22610/jebs.v6i12.555
Mentzas, G., Halaris, C., & Kavadias, S. (2001). Modelling business process with workflow systems:
An evaluation of alternative approaches. International Journal of Information Management, 21(2), 123–135.
Mishra,D , & Sahu, B. (2011). “Feature selection for cancer classification: a signal-to-noise ratio
approach,” Int. J. Sci. Eng. Res, 2(4), 1–7.

Müller, R., Vette, M., Hörauf, L., Speicher, C., & Burkhard, D. (2017). Lean information and
communication tool to connect shop and top floor in small and medium-sized enterprises. Procedia
Manufacturing, 11, 1043–1052.
Ojstersek, R., Acko, B., & Buchmeister, B. (2020). Simulation study of a flexible manufacturing system
regarding sustainability. International Journal of Simulation Modelling, 19(1), 65–76.
Osisanwo F.Y., Akinsola J.E.T., Awodele O. , Hinmikaiye J. O., Olakanmi O., & Akinjobi J. (2017).
Supervised Machine Learning Algorithms: Classification and Comparison, International Journal of
Computer Trends and Technology (IJCTT) , 48 ( 3), 1-12.
Parikh, U.B.; Das, B.; & Maheshwari, R. (2010) Fault classification technique for series compensated
transmission line using support vector machine. Int. J. Electr. Power Energy Syst, 32, 629–636.
Partanen, J., Kohtamäki, M., Patel, P. C., & Parida, V. (2019). Supply chain ambidexterity and
manufacturing SME performance: The moderating roles of network capability and strategic information
flow. International Journal of Production Economics. doi:10.1016/j.ijpe.2019.08.005
Porter, M.E., & Millar, V.E. (1985) How information gives you competitive advantage. Harvard Bus
Rev 63(4):149. Retrieved from https://search.proquest.com/docview/1296463701?accountid=135362
Reese, J. (2016) Management von Wertschöpfungsketten. Unternehmenskooperation ohne Märkte.
Verlag Franz Vahlen, München, , 80.
Saymeh, A. A. F., & Sabha, S. A. (2014). Assessment of small enterprise financing, case of Jordan.
Global Journal of Management and Business Research, 14(1), 6–17.
Schmidtke, N., Behrendt, F., Thater, L., & Meixner, S. (2018). Technical potentials and challenges
within internal logistics 4.0., 4th International Conference on Logistics Operations Management
(GOL). doi:10.1109/gol.2018.8378072.
Singh, R. K., Modgil, S., & Acharya, P. (2019). Assessment of supply chain flexibility using system
dynamics modeling. Global Journal of Flexible Systems Management, 20(Suppl 1), S39–S63.
Sushil, (2017). Small steps for a giant leap: Flexible organization. Global Journal of Flexible Systems
Management, 18(4), 273–274. https://doi.org/10.1007/s40171-017-0163-7.
Skender H.P., Ribarić E., Jović M. (2020). An Overview of Modern Technologies in Leading Global
Seaports, Pomorski zbornik 59 , 35-49.
Shukla, S. K., Sushil, & Sharma, M. K. (2019). Managerial paradox toward flexibility: Emergent views
using thematic analysis of literature. Global Journal of Flexible Systems Management, 20(4), 349–370.
Susilawati, A. Productivity enhancement: lean manufacturing performance measurement based multiple
indicators of decision making. Prod. Eng. Res. Devel. (2021). https://doi.org/10.1007/s11740-021-
01025-7.
Thomas, A. (1993). La connaissance du vécu en atelier de production. Dissertation, Institut National
Polytechnique de Lorraine.
Tomanek D. P., Hufnagl, C., & Schröder, J. (2020). Determining the digitalization degree of information
flow in the context of industry 4.0 using the value added heat map. In A. Kolinski, D. Dujak, P.

GolinskaDawson (Eds.), Integration of information flow for greening supply chain management.
EcoProduction (Environmental Issues in Logistics and Manufacturing). Cham:
Springer. https://doi.org/10.1007/978-3-030-24355-5_10.
Tomanek, D. P., & Schroder, J. (2017). Analyzing the value of information flow by using the value
added heat map. In D. Dujak (Hrsg) Proceedings of the 17th international scientific conference business
logistics in modern management. Faculty of Economics in Osijek, 86.
Tomanek, D.P., Schröder , J., & Wirz, M .(2016). Value added heat map—a new method for the
optimization of production space. In: 13th international conference on industrial logistics (ICIL
2016),SawiczT (ed) Alnus Sp. z o.o, Krakow, 315–323.
UNIDO .(2021). Challenges to Industry 4.0 | UNIDO Knowledge Hub , accessed the 17/03/2021 AT 12:
08 am.
Wang N, Liang H, Zhong W, Xue Y, Xiao J (2012) Resource structuring or capability building? an
empirical study of the business value of information technology. J Manag Inf Syst 29(2):325–367.

Figures
Figure 1
Presentation of the information �ow in the decision-making levels.

Figure 2
classi�cation of algorithms of supervised learning
Figure 3
Analysis method of determination or prediction of the VIF with Machine learning algorithms

Figure 4
Correlation Matrix of the CIF
Figure 5

Correlation between the type of information �ow
Figure 6
Correlation between the dimension of information �ow
Figure 7
Correlation between the direction of information �ow
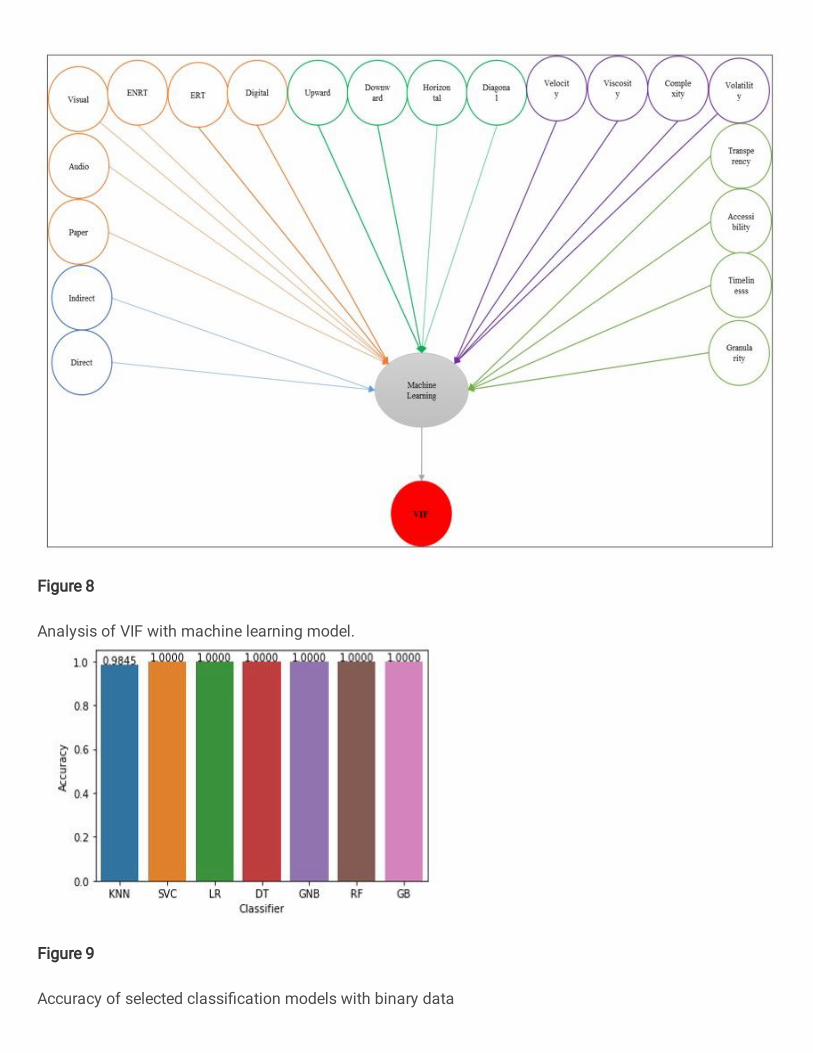
Figure 8
Analysis of VIF with machine learning model.
Figure 9
Accuracy of selected classi�cation models with binary data

Figure 10
Accuracy of selected classi�cation models with binary data except dimension of information
Figure 11
Illustration of the analysis of VIF with the DT model.

Figure 12
VIF function of the dimension of information �ow with binary data.

Figure 13
VIF function of the dimension of information �ow with scale data of the dimension of information �ow.

Figure 14
VIF function of the direction of information �ow


![ANALISIS 2D AIRFOIL NACA 4412 MENGGUNAKAN1].pdfthe airfoil NACA 4412. At the stall angle subsonic flow has a higher lift coefficient value of 1,17290 compared with supersonic flow](https://img.pdfslide.tips/doc/110x75/61329c48dfd10f4dd73a8fdb/analisis-2d-airfoil-naca-4412-menggunakan-1pdf-the-airfoil-naca-4412-at-the-stall.jpg)