Embed Size (px)
Citation preview

Analysis of climatic variability along with snow cover area and forecasting snow cover area in higher Himalayas
in Nepal using ANN
byBhogendra Mishra
A study for the partial fulfillment of the requirements for the degree of Master of Science in
Remote Sensing and Geographic Information SystemsCommittee: Dr. Nitin K. Tripathi (Chairperson)
Dr. Mukand S. Babel (Co-chairperson)Dr. Taravudh Tipdecho
By: Mr. Bhogendra Mishra 109716
Committee: Dr. Nitin K. Tripathi (Chairperson) Dr. Mukand S. Babel (Co-chairperson)
Dr. Taravudh Tipdecho
Analysis and Forecasting of Snow Cover using ANN in Kaligandaki Basin, Nepal
RS & GIS SET, AIT
May , 2011

Climate change and Glaciers..
0.74oc in last 100 years
0.44oc in last 25 years
Every year after 2000 are the warmest
Year in the history since 1850
Mountain regions are more vulnerable because the warming
trend is higher
Heavy rainfall and severe storms appears to have
increasedCumulative mass balance of selected glacier
systems (Dyurgerov and Meier, 2005)

Villagers have begun farming vegetable and fruits in higher Himalayas
Untimely and unpredictably heavy rainfall
GLOF and avalanche frequency increased
Experiencing longer winter drought, post winter snowfall and hailstorm Moraine dam lake formations.
Migration from flat mud roof to slope metal sheet
Impact of CC
Climbing the vegetation lie and appearances of new species in
higher altitude
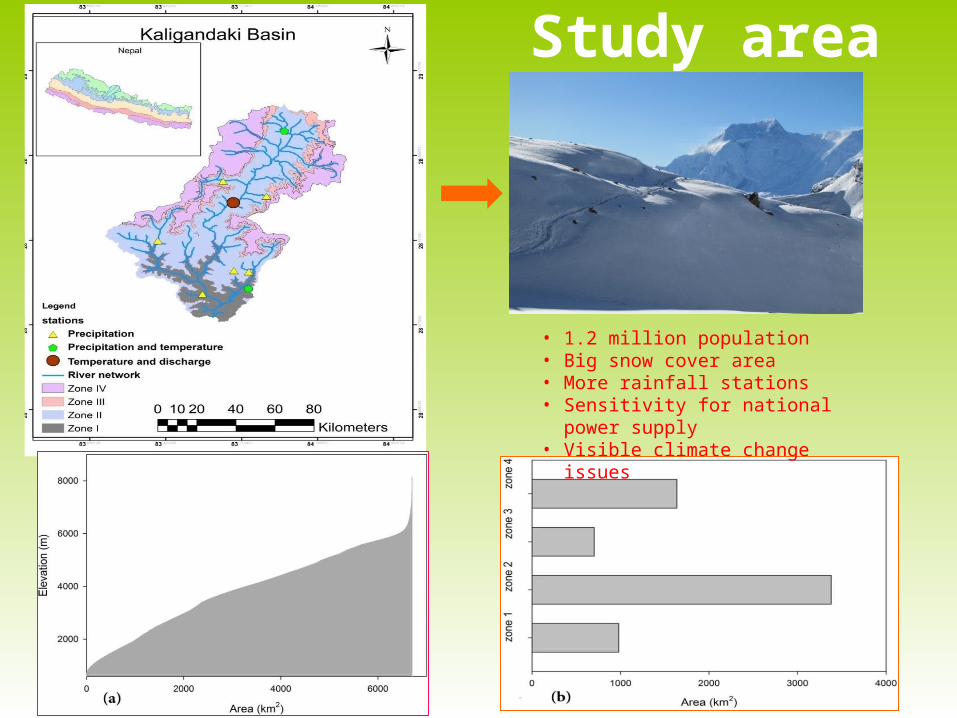
Study area
• 1.2 million population• Big snow cover area • More rainfall stations• Sensitivity for national power
supply• Visible climate change issues

• Can we use the remote sensing data in higher Himalayas or monitoring Glaciers?
• What is the relationship between climate variability and snow cover in higher Himalayas?
• Can we forecast the snow cover area ?
Research Question

To develop and test simple, robust methodologies to quantify the impact of climate change in the hydrologic regime of higher Himalayas, Nepal.
Objectives
Reduce the uncertainty on the remote sensing (CRU and TRMM temperature and precipitation) data in the Kaligandaki basin.
Relate the MODIS snow product to ASTER data.
Analyze the trend of temperature, precipitation and snow cover area.
Test the usability of ANN to predict the snow cover area and forecasting the snow cover area using climate parameters from selected GCM scenario.

7
Data UsedTemperature
– Observed data • Three stations 1980 to 2008
– Remote sensing– CRU 3.0 (1901- 2006), (max and min)
• Spatial resolution: 0.25o x 0.25o • Temporal resolution: one month
– MOD11A2 (2006 -2010, night and day)• Spatial resolution: 1 x 1 km • Temporal resolution: 8 day
Precipitation– Observed data
• Two stations 1980 to 2008• Temporal resolution: one month
– Remote sensing– CRU 3.0 (1901- 2006), (max and min)
• Spatial resolution: 0.25o x 0.25o • Temporal resolution: one month
Snow cover (maximum snow extent 2000-2010)– MOD10A2 (2000-2010)
• Spatial resolution: 500 x 500 m• Temporal resolution: 8 day
– MOD10A1 (2000-2010)• Spatial resolution: 500 x 500 m• Temporal resolution: daily (retrieve corresponding to
ASTLB1)– ASTLB1
• Spatial resolution: 15 x 15 m• Random scene
• HadCM3 – A1 scenario
26 N
28 N
30 N
81 E 85 E 89 E
26 N
28 N
30 N
81 E 85 E 89 E81 E 85 E 89 E

Downscaling, Validation and Trend Analysis
Climate variable selection
Downscaling
Non-parametric test
Trend quantification
Trend detection
Avg. temperature, min. temperature, max
temperature, precipitation, cloud cover days, frost days,
humidity, etc
Literature, data availability, dependency to each other
Low spatial resolution data, heterogeneous terrain
Literature, Can consider land topography, observed parameters, result is very
good, validate with RMSE, easier to work
To check the normality distribution
Shapiro wilk test (W)m- from literature
Mann Kendall test, from literature
Sen’s slope, from literature
Min/max temp, precipitation, snow cover
Min/max temp, precipitation, snow cover
Work flow block diagram

Season R2 RMSE
Before correction
After correction
Winter 0.948 6.65 3.54
Spring 0.982 5.489 0.875
Summer 0.993 8.043 0.858
Autumn 0.987 5.956 1.209
Where, Gt is the ground temperature, Ct is the CRU temperature, and E is the weighted average elevation of the zone in km. whose value is 1.47, 3.48, 4.95, 5.71 fore zone1, zone2, zone3 and zone4 respectively, Winter-: December- February; Spring :– March- May; Summer:- June- August; Autumn-September-November
CRU (Maximum) Temperature Analysis
Maximum trend – Winter (0.027 oC/yr)
Summer and spring has random trend in most of the zones
0.6oC increased in last 30 years

Season R2 RMSE
Before correction
After Correction
Winter 0.871 7.65 3.14
Spring 0.918 4.948 1.274
Summer 0.953 8.743 0.938
Autumn 0.978 5.956 1.902
Where, Gt is the ground temperature, Ct is the CRU temperature, and E is the weighted average elevation of the zone in km. whose value is 1.47, 3.48, 4.95, 5.71 fore zone1, zone2, zone3 and zone4 respectively, Winter-: December- February; Spring :– March- May; Summer:- June- August; Autumn-September-November
CRU (Minimum) Temperature Downscaling
Maximum trend – Autumn (0.054 oC/yr)
Spring has random trend
0.9oC increased in last 30 years

While trying to relate the ground based and CRU/TRMM precipitation, following result has been obtained for annual precipitation
The reason is that the lower part of the study area is the region where the maximum rainfall in Nepal i.e. approximately 5000mm/y and upper part has the lowest rainfall i.e. approximately 150mm/y therefore this region can be considered as an anomaly for the CRU/TRMM precipitation.
The standard error before correction = 650.7The root mean square error =748.964
Precipitation Pattern Analysis

Seasonal Precipitation Trend (1980-2008)
The up arrow represents increasing trend, down arrow represents decreasing and cross represents no trend
-1.08
-2.52
-1.41
1.4
14.26 4.85
4.74 6.55
5.88
1.41
14.36
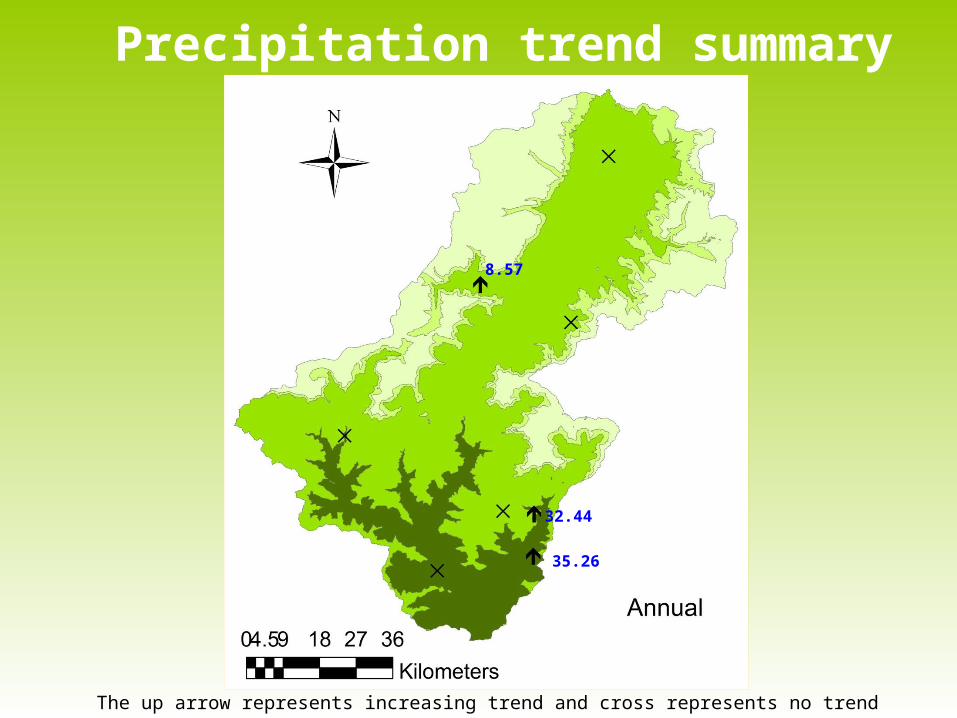
Precipitation trend summary
The up arrow represents increasing trend and cross represents no trend
8.57
32.44
35.26
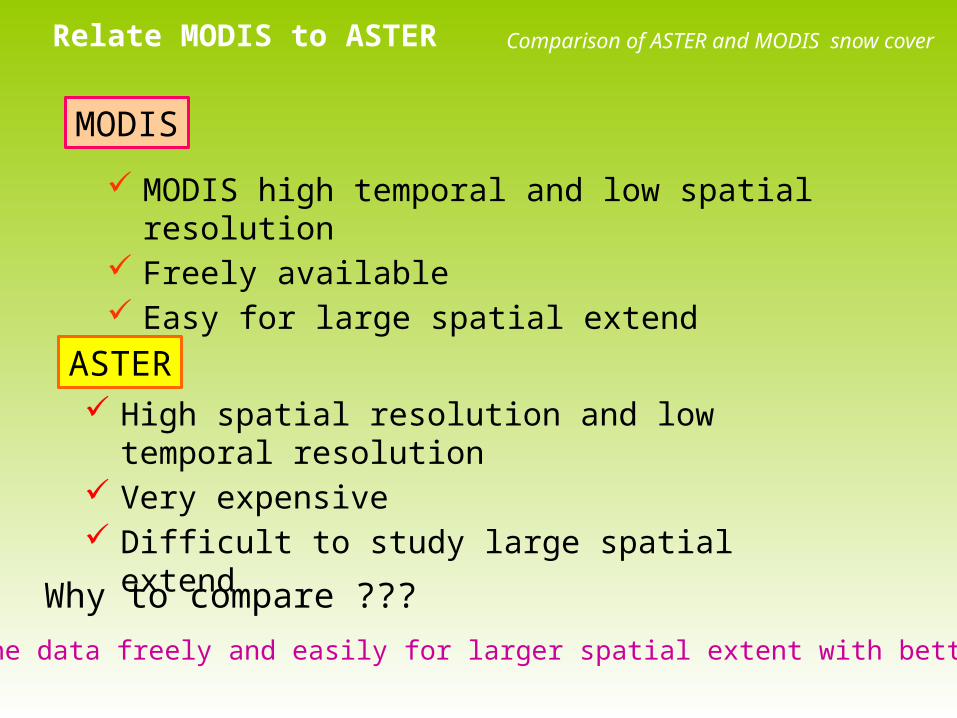
MODIS high temporal and low spatial resolution Freely available Easy for large spatial extend
Comparison of ASTER and MODIS snow coverRelate MODIS to ASTER
High spatial resolution and low temporal resolution Very expensive Difficult to study large spatial extend
MODIS
ASTER
Why to compare ???
Achieve the data freely and easily for larger spatial extent with better quality

Comparison of ASTER and MODIS snow coverRelate MODIS to ASTER
Obtained snow cover area
Obtained the snow map
Resample to 25 m false color image
Mask study area for snow cover map
Aster Level 1BGranule (*.hdf)
MOD10A1Granule (*.hdf)
Mask Study Area
Obtained snow cover area
TERRA (Over Kaligandaki)

Accuracy assessment for fractional and absolute snow cover area
Mean absolute error (%)
Root mean square error (%)
Kappa index
15.17
19.16
0.676
Correlation coefficient 0.796
80.84% accuracy in MOD10A1 with comparison to ASTER for snow cover area
Relate MODIS to ASTER
It is substantially in agreement with the ASTER but not the perfect.
With 32 sample points
ASTarea = −1.59 + 0.91 ×MODarea
ASTarea- Aster snow cover area, MODarea- MODIS snow cover area

Zone I Zone II
Zone III Zone IV
Seasonal Maximum Snow Cover Extent

Seasonal maximum snow cover based on MOD10A2 in elevation more than 2000m
Seasonal Maximum Snow Cover Extent
2000 2001 2002 2003 2004 2005 2006 2007 2008 2009 20100
10
20
30
40
50
60
70
80
90
100
Winter
Spring
Summer
Autumn
Year
Se
as
on
al s
no
w c
ov
er(
%)
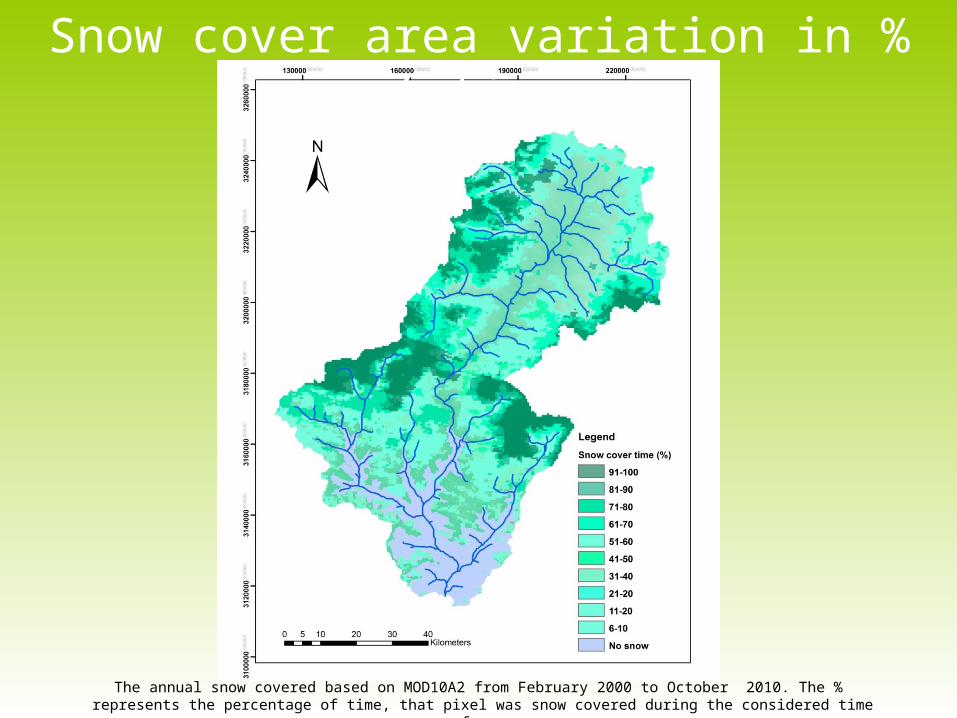
The annual snow covered based on MOD10A2 from February 2000 to October 2010. The % represents the percentage of time, that pixel was snow covered during the considered time frame
Snow cover area variation in % of time

Artificial Neural Network
Has already proved to be very useful for Rainfall forecastingFlood forecastingWater demand forecastingTyphoon forecasting etc.
It has not yet tested for snow cover forecasting
Aims to test the usability of ANN in for snow cover forecasting
No other snow cover forecasting methodology available for long lead time
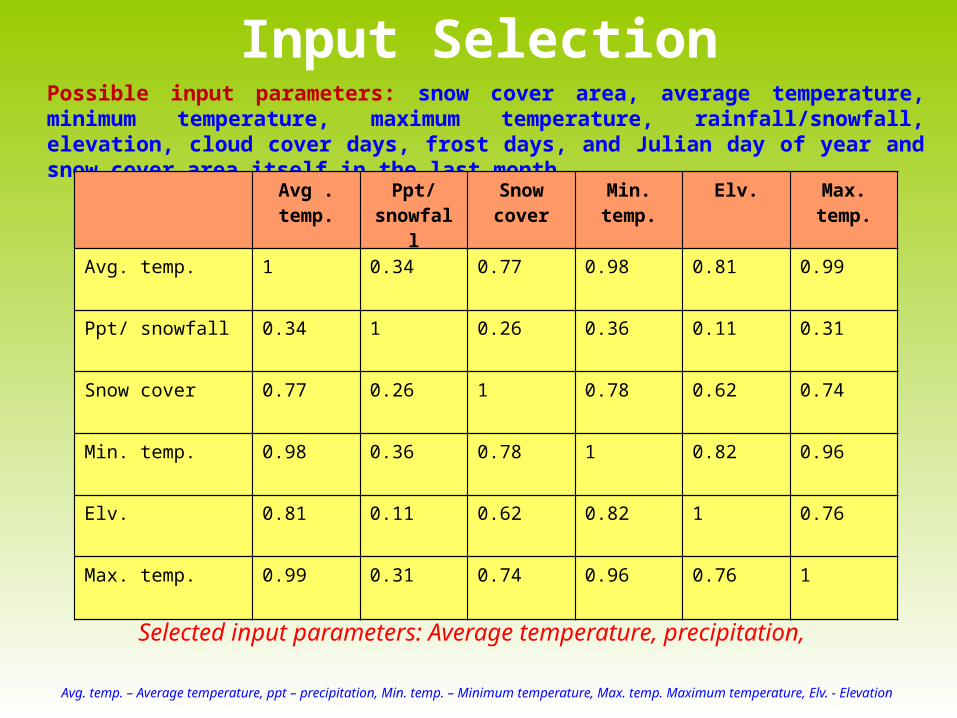
Possible input parameters: snow cover area, average temperature, minimum temperature, maximum temperature, rainfall/snowfall, elevation, cloud cover days, frost days, and Julian day of year and snow cover area itself in the last month.
Input Selection
Avg . temp.
Ppt/snowfall
Snow cover
Min. temp.
Elv. Max. temp.
Avg. temp. 1 0.34 0.77 0.98 0.81 0.99
Ppt/ snowfall 0.34 1 0.26 0.36 0.11 0.31
Snow cover 0.77 0.26 1 0.78 0.62 0.74
Min. temp. 0.98 0.36 0.78 1 0.82 0.96
Elv. 0.81 0.11 0.62 0.82 1 0.76
Max. temp. 0.99 0.31 0.74 0.96 0.76 1
Selected input parameters: Average temperature, precipitation,
Avg. temp. – Average temperature, ppt – precipitation, Min. temp. – Minimum temperature, Max. temp. Maximum temperature, Elv. - Elevation

Selected ModelsModel development
where n is the total number of hidden layers, m is the total number of input variables and p is lag time, a ij is corresponding weight, yk is the lag value and bk is the corresponding weigtht, and ε is the biased., D is Gaussian function, m number of element of an input vector, x i and xik, i is the weight for connection between ith neuron in the pattern layer and the summation neuron.
85 % training testing and validation (70%+15%+15%) 15% cross validation
Average temperature, precipitation Average temperature, precipitation, snow cover (previous month)
NARX GRNN
Lead time 1 month Lead time 6 months
Lead time 12 months
R2 RMSE EI R2 RMSE EI R2 RMSE EI
0.56 10.5 0.95 0.45 14.9 0.84 0.28 15.6 0.93
R2 RMSE EI
0.65 12.7 0.92
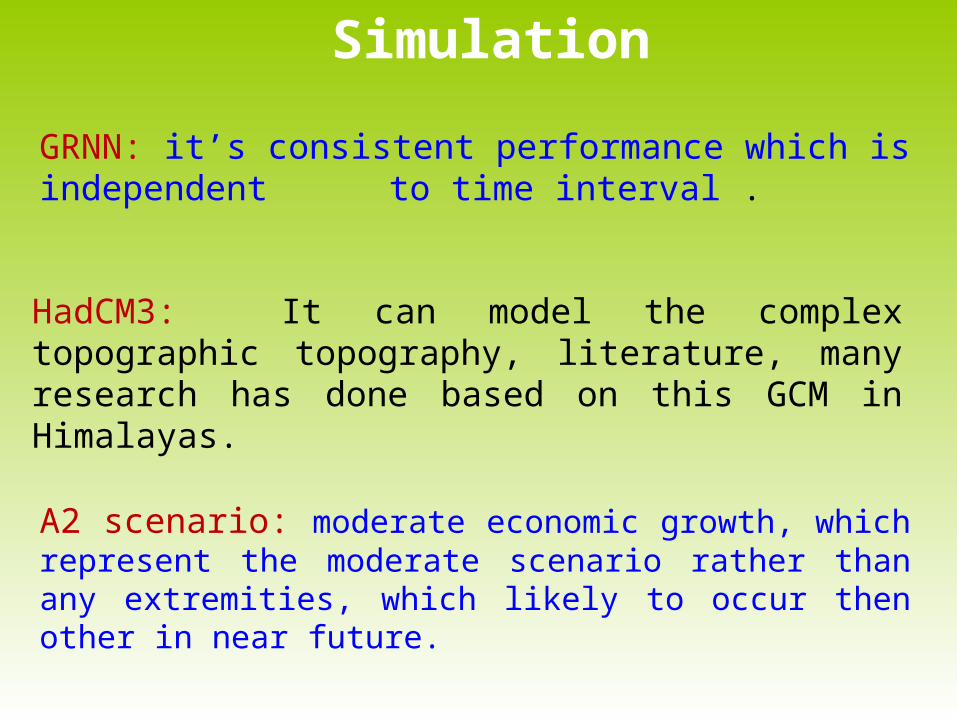
Simulation
GRNN: it’s consistent performance which is independent to time interval .
HadCM3: It can model the complex topographic topography, literature, many research has done based on this GCM in Himalayas.
A2 scenario: moderate economic growth, which represent the moderate scenario rather than any extremities, which likely to occur then other in near future.

Snow Cover Area Prediction
Snow cover area forecasted using GRNN

CRU temperature can be used in the study of higher Himalayas.
CRU precipitation cannot be used for higher Himalayas.
MOD10A1 has approximately 81% accuracy as compared to ASTER data. Temperature is in increasing trend, trend is higher in higher altitude and
highest in autumn and no trend is found in spring.
Precipitation exhibits increasing trend in summer and spring whereas decreasing in winter in some places.
Snow cover shows decreasing trend in spring.
Snow line is at 5400m altitude which were previously reported to 5200m.
ANN can be used to forecast snow cover area. NARX is recommended for short lead time and GRNN for long lead time.
The glacier area will not be completely disappear in by 2035 in Kaligandaki basin (Himalayas) as come in several reports in last decade
Conclusions

Recommendations Would like to recommend to study for whole Himalayas range which will have greater insight on impact
If we can increase the number of sample as well as spatial distribution for all over the Himalayas for the MODIS and ASTER snow cover the results would be more reliable and accurate.
High spatial as well as temporal resolution data is required for trend analysis, similarly recommend to consider more climate parameters also.
The most important recommendation is that, this study can bring further to use other forecasting methods for the snow cover forecasting and compare the result with ANN. Similarly, we can forecast the snow melt runoff using ANN, which can be validated with SRM.

Thank you
धन्यबा�द