Embed Size (px)
Citation preview
Research Paper
農 業 土 木 学 会 論 文 集
Trans. of JSIDRE
No.246, pp.33 ~ 40 (2006.12)
Analysis of Zero Flux Plane Behavior under Periodical Water Supply
KHALIL Magch , SEKI Katsutoshi , MIYAZAKI Ts.ityoshi, MIZOGUCHI Masaru** and SAKAI Masaru*
* Conservation Science Department, National Research Institute of Cultural Properties, Tokyo, 13-43 Ueno-Park, Taito-ku, Tokyo 110-8713, Japan.
** Graduate School of Agricultural and Life Sciences, The University of Tokyo, Yayoi 1-1-1, Bunkyo-ku, Tokyo 113-8657, Japan.
*** Graduate School of Bioresources, Mie University, 1577 Kurima-machiya, Tsu, Mie Pref. 514-8507, Japan.
Abstract Zero Flux plane (ZFP) is defined as a plane, which separates two zones of upward and downward movement of
water in soil with upward and downward flow occurring simultaneously. In this study, the analysis of the ZFP
movements was carried out by two sets of laboratory experiments and numerical simulations, especially paying
attention to the effect of the periodical water supply. In the first set of experiment and simulation, surface Andisol soil was used and water was supplied only one time. Evaporation rate was set to 0.15 cm/day, and water was drained from
the bottom of the column. The total potential profile and the ZFP movement of experiment and simulation agreed
reasonably well. In the second set of experiment and simulation, subsurface Andisol was used and water was supplied
periodically. In both experiment and simulation, ZFP appeared at soil surface every time water was supplied, and it
gradually moved downward until it reached to the depth of 30 cm, when the ZFP disappeared. We discussed that such disappearance of the ZFP is observed when the initial soil water content at the deep zone is relatively high. In contrast, when the initial soil water content at the deep zone is relatively low, as reported in previous studies, ZFP continues to
move downward for a relatively long period. Simulation of ZFP movement was also conducted for different types of
soils. Based on the results of this study, a strategy for the periodical water supply in arid and semiarid regions using this ZFP concept was proposed.
Keywords: periodical water supply, zero flux plane, unsaturated soil, Hydrus-2D, vadose zone
1. INTRODUCTION
1.1 Background
The old term used for Zero Flux Plane (ZFP) was static
zone. It was first mentioned by Richards (1954), where he
used a new instrument, multiple unit tensiometer, to measure the hydraulic head and the hydraulic gradient of
water in unsaturated field. In the dry periods, when
evapotranspiration exceeds rainfall, the soil water in the
upper part of the soil profile moves upwards towards the soil surface. At the lower depth, soil water moves
downwards towards the water table due to gravity. Above
the ZFP, any reduction in the soil moisture content must be
due to the moisture loss caused by an excess of evaporation and evapotranspiration, whereas below the
ZFP, and assuming no uptake of moisture content by roots
at these depths, reduction in moisture content must be due
to drainage out of the soil, i.e. recharge to the ground water
table.
As Khalil et al. (2003) reviewed, most of authors have
used the ZFP method either to estimate the evaporation
(Van Bavel et al., 1968), to calculate the drainage (Stone et al., 1973), or to differentiate between the drainage and the evaporation (Roman et al., 1999). Payne et al. (1990); Kanamori (1995); Diez et al. (2000) and others, all suggested the usefulness of the ZFP method to estimate the short term evaporation. On the other hand, Kirsch
(1993); Roman et al. (1999) and others, all obtained reasonable estimations of long-term evaporation by using the ZFP method. For many dry climates, ground water is a major source of water supply for irrigation, industrial, and domestic demands. Ground water recharge can be estimated by the ZFP method. The reason for that is, below the maximum depth reached by the ZFP, soil water flow is always downward; hence, the water draining through any depth below this will appear eventually as recharge at the water table (e.g. Cooper, 1979; Sharma, 1985; Simmers, 1987; Bouwer, 1989). The ZFP method is considered as one of the most direct method for determining the recharge rate of ground water. Therefore, several authors have used it to estimate the ground water recharge (Hosty and Mulqueen, 1996; Abdallah et al., 2001; Tsujimura et al.,
農土論集246 (74-6) 841

34 農業土木学会論文集第246号 (第74巻 第6号)
2001 and others).
1.2 ZFP Definition The ZFP is defined as a plane, which separates two
zones of upward and downward movement of water in soil with evaporation and drainage occurring simultaneously. Water flows upward above this plane, and downward below it, i.e., the point where water is neither flowing up nor down is called the ZFP as exemplified in Fig.1 (Khalil et al 2003). With negligible lateral soil heterogeneity, the "zero flux" boundary may be assumed to be a planar. As
the soil dries the plane of "zero flux" moves downward
(Arya et al., 1975). Stammers el al. (1973) described the approximation of a mathematical derivation of the correct expression of ZFP depth. According to them, both evaporation and drainage can be calculated above and below ZFP as follows;
(1)
(2)
where:
E is evaporation over the period t1 to t2
R is rainfall over the same period
t is time
z is depth measured positiVely downwards
Z is the depth at which drainage is calculated
D is drainage over the period t1 to t2 through depth Z
θ is volUmetric water content
z0 (t) is the ZFP depth at time t.
1.3 Objective of the Study The purpose of this paper is to study and analyze the
effect of periodical water supply on ZFP movements. To
achieve that, the ZFP movement experiment with only one
time water supply was done for 2 days to detect and
monitor ZFP movement and the experiment was compared with numerical simulation. Then periodical water supply
experiment was conducted for 18 days to detect and study
the effect of periodical water supply on ZFP movement,
and the results were also compared with numerical
simulations.
2. MATERIALS AND METHODS
Two sets of laboratory experiments and numerical
simulations were performed to detect and analyze ZFP
movement under different conditions of water supply. The
first experiment was performed for 2 days to detect and
monitor ZFP movement under only one time water supply.
The second experiment was carried out to study and analyze the effect of periodical water supply on the
movement of ZFP. The position of zero flux plane
Fig.1 Zero Flux Plane Concept (Khalil et al., 2003)
Fig. 2 The layout of ZFP movement with one water supply experiment
depth is determined at dh/dz equals to zero.
2.1 ZFP Movement with One Time Water Supply
2.1.1 Experimental set up
Fig. 2 shows the layout of the ZFP movement with one
time water supply experiment. A column of 30 cm height
and 7.5 cm diameter was made with acrylic rings of 2 cm
height (11 sets) and 1 cm height (8 sets). The surface
Andisol soil was packed in this column from bottom to top
on layers by hand with a constant bulk density of 0.63 Mg m-3. Electric light, 150 watts placed 20 cm above the soil
surface, was supplied as a thermal source, to accelerate
evaporation. Acrylic filter was provided to the bottom of
the soil column. Drainage tube was supplied to the bottom
as well to drain soil water. Before connecting to the
842Trans. JSIDRE Dec. 2006

Analysis of Zero Flux Plane Behavior under Periodical Water Supply 35
columns, transducers were calibrated. Total potential and temperature were measured by transducers and thermo couples every 5 minutes, respectively. The transducers were connected to a data logger device, CR10X that was linked to computer software. A container with a plastic sheet cover above sensitive balance was placed under the column to measure the drainage water weight periodically. 2.1.2 Boundary and initial conditions
The bottom of the column was exposed to the drainage whereas the top end was exposed to the atmospheric
pressure. The column weight was measured at the beginning of the experiment. The drained water weight and column weight were measured on regular intervals through the experiment. The evaporation rate was determined from the difference between the two weights. The potential evaporation rate measured was about 0.15 cm/day which corresponds to evaporation rate in some semi arid areas. The bulk density was 0.63 Mg m-3. The volumetric water content was 0.8. The column was initially wetted by providing one pore volume of water to the top of the soil just before starting the experiment. 2.1.3 Simulations
A finite element analysis software for water flow in
porous media, HYDRUS-2D, was used to measure and detect ZFP numerically. Soil water retention function of van Genuchten (1980) was used in the HYDRUS-2D;
(3)
(4)
in which m = 1-1/n and Or and O denote the residual and saturated soil water contents, respectively, and n, a and m are parameters in soil water retention function. The ZFP detection experiment with one time water supply was simulated by one-dimensional flow in a column of 30 cm height. The column was provided with a seepage face at the bottom and an atmospheric face at the top. In the HYDRUS program, the seepage face boundary condition means that the pressure head is always uniformly equal to zero along the saturated part of the boundary, and that the outflow flux is equal to zero on the unsaturated part of the boundary. The atmospheric boundary condition is equal to the specified flux (Neumann type) boundary condition where the maximum potential rate of infiltration or evaporation is specified. In addition, maximum and minimum allowed pressures are specified and when the
pressure head reaches those values, the specified pressured head (Dirichlet type) boundary condition is used so that the pressure head does not go out of the range.
(5)where h is the pressure head at the soil surface, and hA and
hs are, respectively, minimum and maximum pressure
head allowed under the prevailing soil conditions. The
value of hA is determined from the equilibrium condition
Table 1 The values of soil water parameters of surface and subsurface
Andisol.
between soil water and atmosphere water vapor, whereas hs is usually set to zero.
The values of the soil water parameters of the surface Andisol soil used in simulation are shown in Table 1. The saturated hydraulic conductivity, Ks, was determined by a falling head method and other parameters were determined by soil water retention function measured by the hanging water column method for up to 150 cm suction. The water retention curve of the drying process was used in the calculation of Table 1. In Table 1, the residual water content appears to be too high, as 0.45 for Surface Andisol and 0.62 for Subsurface Andisol. This is because the values were obtained by fitting to soil water retention function for a rather small range of suction, up to 150 cm. We treat the parameters in Table 1 as just fitting
parameters. In this simulation, we used the hydraulic parameters of drying process and did not examine hysteresis because our experiments were under drying
process most of the time whereas the wetting process lasted for only a short time. In addition, the effect of hysteresis for Andisol is much smaller than for typical sandy soils (Hasegawa et al., 1994). The mathematical description of Richards' equation could be written as follows:
(6)
(7)
where Cw(h) is called the water capacity function. As
boundary condition, the potential evaporation rate was set
to 0.15 cm/day at the top and seepage face at the bottom. The initial conditions were set similar to those in
experiments.
2.2 ZFP Movement with Periodical Water Supply
2.2.1 Experimental set up
After detecting ZFP movement by experiments and
simulation, the study of the periodical water supply
experiment was done to investigate and analyze the effect of the periodical water supply on the movement of ZFP. A
column with 20 acrylic rings of 4 cm height and 7.5 cm in
the inner diameter for each was erected. The total height of
the soil column was 80 cm. The subsurface Andisol was
used for this experiment. The packing of soil was done
農土論集246 (74-6) 843

36 農業土木学会論文集第246号 (第74巻 第6号)
Fig. 3 Experimental and numerical ZFP movement where gravity
potential is zero at soil surface
uniformly on layers. The bulk density measured before
packing was 0.43 Mg m-3. A container with a plastic sheet cover above sensitive balance was placed under each
column to measure the drainage water weight periodically.
2.2.2 Boundary and initial conditions
The bottom of the column was exposed to the drainage
whereas the atmospheric pressure was provided to the top
end of the column. The bulk density of the subsurface
Andisol was 0.43 Mg m-3. The volumetric water content
was 1.25. Periodical water supply experiment was done for 18 days. 10 mm of water was provided 5 times
periodically (1st,5 th , 8 th 12 th, 15th day) to the top of the column.
2.2.3 Simulations
Hydrus-2D was used to identify and measure the effect
of periodical water supply on ZFP movement. The ZFP
experiment was simulated by one-dimensional flow in a column of 80cm height. The column was provided with
seepage face to the bottom and atmospheric face to the top.
The values of soil water parameters of the subsurface
Andisol used in this simulation were shown in Table 1.
3. RESULTS AND DISCUSSION
3.1 ZFP Movement with One Time Water Supply
Total potential profiles obtained by the numerical
analysis were compared with those obtained by the ZFP
detection experiment. Fig. 3 shows the experimental and
numerical potential profiles at 80, 100, and 120 minutes
obtained form the ZFP detection experiment. Except for
the surface layer, the experimental and simulated results
give a reasonable agreement. We could not show the agreement between experiment and simulation in the top 9 cm layer because the surface 9 cm layer was not measured
due to high temperature created by the light source. This
high temperature deteriorated the surface transducer.
Therefore we postulate that the difference in temperature
between simulation and experiment led to different ZFP
movement rate where experimental ZFP movement rate is
Fig.4 ZFP Movement of the first cycle of periodical supply
experiment.
Fig. 5 Simulated ZFP movement of the first cycle of periodical water supply
slower than simulated one, but this idea has not been verified yet. For the first time ZFP movement was detected and monitored experimentally and numerically.
3.2 ZFP Movement with Periodical Water Supply In this section, the experimental and the simulated
results of the periodical water supply case are compared. Fig. 4 is the experimental total potential profiles during the first cycle, 3 days, where we can observe downward movement of the ZFP easily. There were two ZFP at each time (upper and lower) as a result of different water content between upper and lower soil, and we focus on the upper ZFP. Two main sections could be seen, first section is from the surface level up to about 40 cm depth where we observe rapid movement of the total potential profiles due to evaporation and the second section where the total
potential profiles have slight movement due to near saturation phase. Fig. 5 demonstrates the simulated results of the same cycle. In this figure also, the ZFP moved downward. The total potential profiles and the ZFP movement in both Fig. 4 and Fig. 5 agreed reasonably well. However the rate of the downward movement of the ZFP in Fig. 4 and Fig. 5 was somewhat different.
In order to determine the ZFP from the measured discrete values of the total potential, it is convenient to
844 Trans. JSIDRE Dec. 2006
Analysis of Zero Flux Plane Behavior under Periodical Water Supply 37
have a uniform expression of fitting curve for the total
potential profile. From our experimental data, we made an empirical equation for the total potential profile as a
function of depth as:
(8)where H is the total potential, a, b, c, d and e are fitting
parameters. The derivative of the total potential dH/dz can be calculated as:
(9)
At the depth of ZFP, z=z0, dH/dz=0, and therefore
(10)
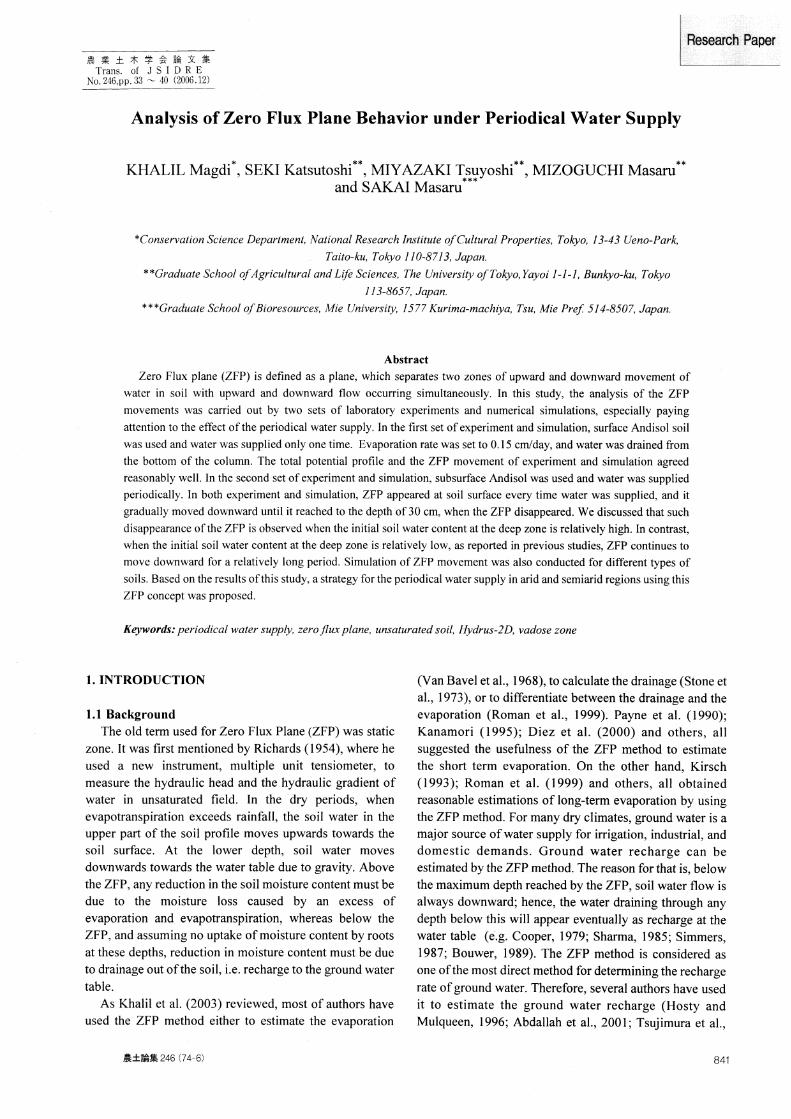
Fig. 6 illustrates the ZFP movement determined by this method during the whole experiment period (18 days). We can observe that the experimental ZFP movement rate is slower than the simulated ZFP movement rate. The experimental ZFP reached 30 cm depth after almost 3 days while the simulated ZFP reached same depth after almost I day. The maximum ZFP depth, obtained from the simulated and the experimental results, is 30 cm. ZFP disappeared at 30 cm depth. The disappearance of ZFP will be discussed in the next section.
Fig. 7 represents the effect of the third cycle water supply on the ZFP movement. This cycle lasted for 5 days. We can observe easily that the ZFP, represented by the arrows, is getting deeper until 2 days. After 2.5 days, all soil water moved upward as ZFP disappeared.
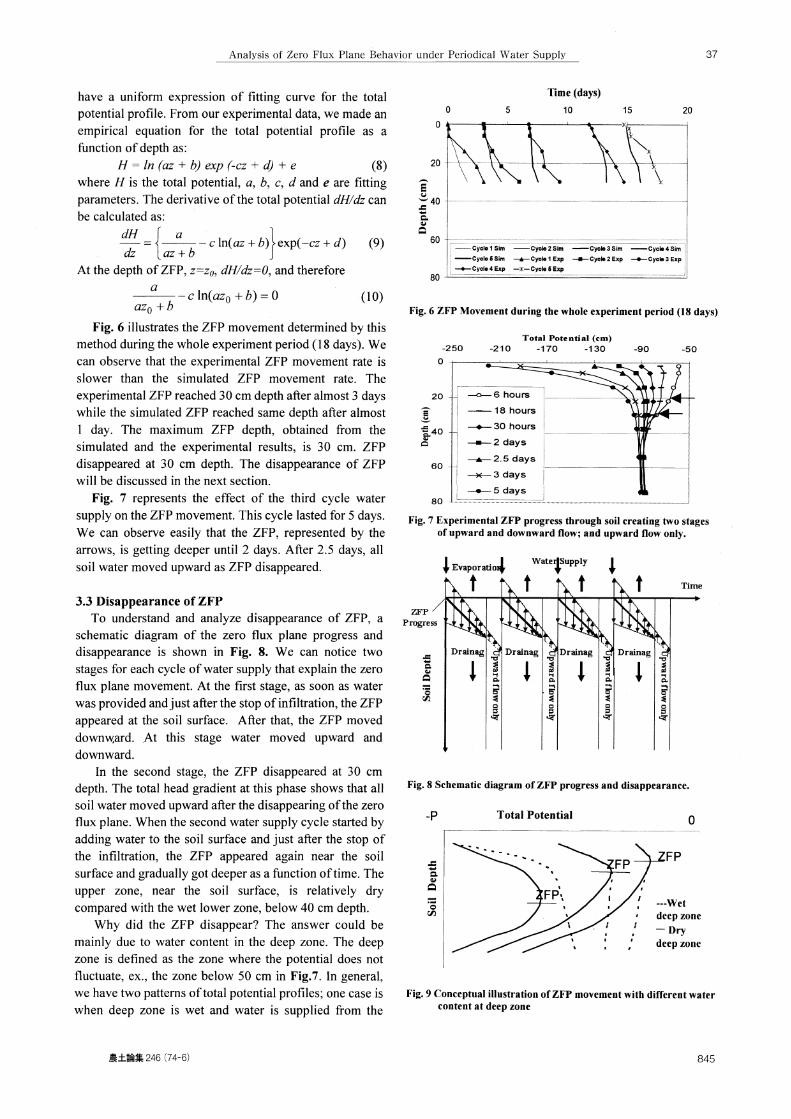
3.3 Disappearance of ZFP To understand and analyze disappearance of ZFP, a
schematic diagram of the zero flux plane progress and disappearance is shown in Fig. 8. We can notice two stages for each cycle of water supply that explain the zero flux plane movement. At the first stage, as soon as water was provided and just after the stop of infiltration, the ZFP appeared at the soil surface. After that, the ZFP moved downward. At this stage water moved upward and downward.
In the second stage, the ZFP disappeared at 30 cm depth. The total head gradient at this phase shows that all soil water moved upward after the disappearing of the zero flux plane. When the second water supply cycle started by adding water to the soil surface and just after the stop of the infiltration, the ZFP appeared again near the soil surface and gradually got deeper as a function of time. The upper zone, near the soil surface, is relatively dry compared with the wet lower zone, below 40 cm depth.
Why did the ZFP disappear? The answer could be mainly due to water content in the deep zone. The deep zone is defined as the zone where the potential does not fluctuate, ex., the zone below 50 cm in Fig.7. In general, we have two patterns of total potential profiles; one case is when deep zone is wet and water is supplied from the
Fig. 6 ZFP Movement during the whole experiment period (18 days)
Fig. 7 Experimental ZFP progress through soil creating two stages
of upward and downward flow; and upward flow only.
Fig. 8 Schematic diagram of ZFP progress and disappearance.
Fig. 9 Conceptual illustration of ZFP movement with different water
content at deep zone
農土論集246 (74-6) 845

38 農業土木学会論文集第246号 (第74巻 第6号)
Table2 The values of soil water parameters used in simulation
surface as shown in Fig.7. Deep zone is varying from about half meter to few meters below the soil surface. In that case the wet deep zone led to the disappearance of ZFP. The other case is when the deep zone is dry and water is also supplied from the surface. In that case, the ZFP continues to move downward for a relatively long period
(Wellings, 1984; Cooper et al., 1990; Sharma et al., 1991; Hosty and Mulqueen, 1996; Abdallah et al., 2001). Fig.9 illustrates the effect of the deep zone water content on the ZFP. The figure represents a relation between the total
potential and the soil depth. The dashed lines exemplify a case when the deep zone is wet, and the solid lines exemplify a case when the deep zone is dry. In the former case, the ZFP moves downward and disappears, while in the latter case, the ZFP continues to move downward.
3.4 Application of Hydrus-2D to Detected ZFP Progress in Different Soils
Although the zero flux plane gradually moves downward, universal relationship for the ZFP movement with time applicable to all type of soil has not been obtained yet. To see how soil type affect the ZFP movement, the ZFP movement for four types of soils, loamy sand soil, sandy soil, sandy clay soil and sandy loam soil was simulated by Hydrus-2D. Water flow in a column of 80 cm height was modeled. The column was
provided with the seepage face to the bottom and the atmospheric face to the top. 10 mm of water was provided one time only to the top of the columns for each soil at the beginning of each simulation. A simulation was carried out for a period of 30 days for all soils. The values of soil water parameters of loamy sand soil, sandy soil, sandy clay soil and sandy loam soil used in these simulations were shown in Table 2. Evaporation rate was set from 0.5 to 0.12 cm/day for both simulations.
The locations of ZFP as a function of time for loamy sand soil, sandy soil, sandy clay soil and sandy loam soil are given in Figs. 10, 11, 12 and 13. The ZFP progress was different from one soil to another. The maximum zero flux
plane depth was 50 cm in 30 days for sandy clay soil (Fig.12) whereas the minimum zero flux plane position was 11 cm in 30 days for sandy soil (Fig.11). For the same
period sandy loam soil and loamy sand soil reached 38cm and 19cm respectively.
Fig. 10 Simulated total potential profiles and ZFP movement
prediction through loamy sand soil.
Fig. 11 Simulated total potential profiles and ZFP movement
prediction through sandy soil.
Fig. 12 Simulated total potential profiles and ZFP movement
prediction through sandy clay soil.
Fig. 13 Simulated total potential profiles and ZFP movement
prediction through sandy loam soil.
846 Trans. JSIDRE Dec. 2006
Analysis of Zero Flux Plane Behavior under Periodical Water Supply 39
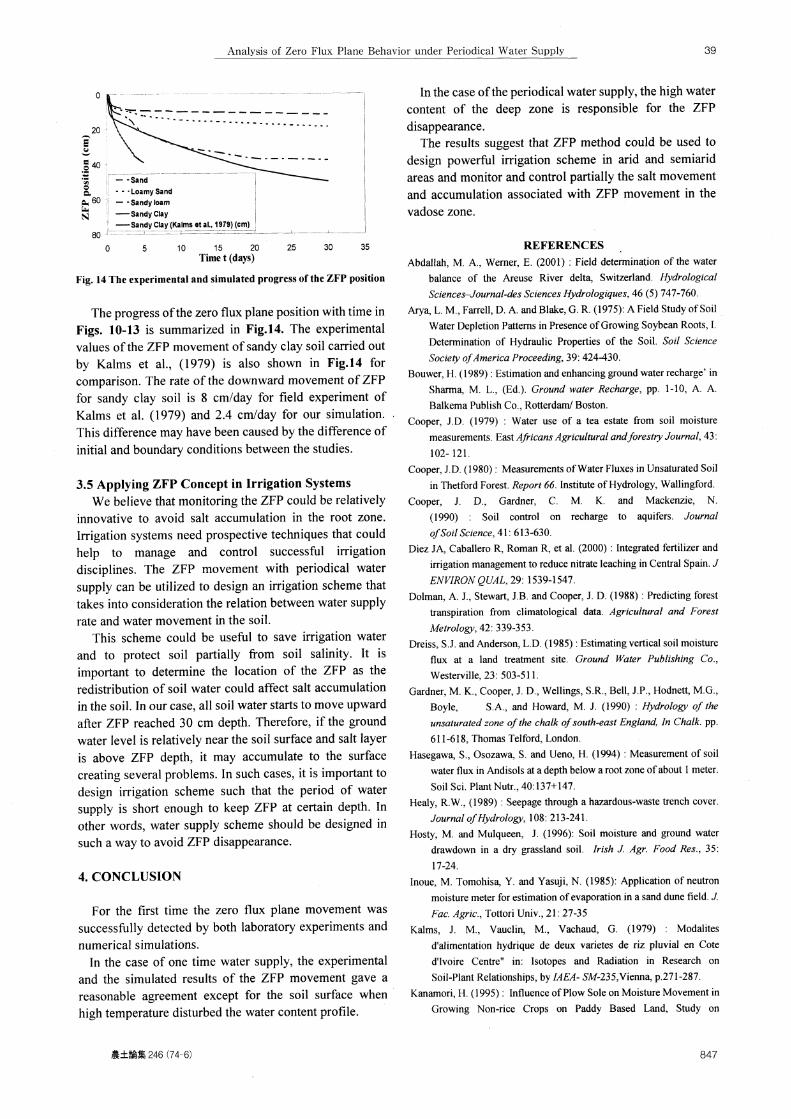
Fig. 14 The experimental and simulated progress of the ZFP position
The progress of the zero flux plane position with time in Figs. 10-13 is summarized in Fig.14. The experimental values of the ZFP movement of sandy clay soil carried out by Kalms et al., (1979) is also shown in Fig.14 for comparison. The rate of the downward movement of ZFP for sandy clay soil is 8 cm/day for field experiment of Kalms et al. (1979) and 2.4 cm/day for our simulation. This difference may have been caused by the difference of initial and boundary conditions between the studies.
3.5 Applying ZFP Concept in Irrigation Systems We believe that monitoring the ZFP could be relatively
innovative to avoid salt accumulation in the root zone. Irrigation systems need prospective techniques that could help to manage and control successful irrigation disciplines. The ZFP movement with periodical water supply can be utilized to design an irrigation scheme that takes into consideration the relation between water supply rate and water movement in the soil.
This scheme could be useful to save irrigation water and to protect soil partially from soil salinity. It is important to determine the location of the ZFP as the redistribution of soil water could affect salt accumulation in the soil. In our case, all soil water starts to move upward after ZFP reached 30 cm depth. Therefore, if the ground water level is relatively near the soil surface and salt layer is above ZFP depth, it may accumulate to the surface creating several problems. In such cases, it is important to design irrigation scheme such that the period of water supply is short enough to keep ZFP at certain depth. In other words, water supply scheme should be designed in such a way to avoid ZFP disappearance.
4. CONCLUSION
For the first time the zero flux plane movement was successfully detected by both laboratory experiments and numerical simulations.
In the case of one time water supply, the experimental and the simulated results of the ZFP movement gave a reasonable agreement except for the soil surface when high temperature disturbed the water content profile.
In the case of the periodical water supply, the high water
content of the deep zone is responsible for the ZFP
disappearance.
The results suggest that ZFP method could be used to
design powerful irrigation scheme in arid and semiarid
areas and monitor and control partially the salt movement
and accumulation associated with ZFP movement in the
vadose zone.
REFERENCES
Abdallah, M. A., Werner, E. (2001) : Field determination of the water
balance of the Areuse River delta, Switzerland. Hydrological Sciences—Journal-des Sciences Hydrologiques, 46 (5) 747-760.
Arya, L. M., Farrell, D. A. and Blake, G. R. (1975): A Field Study of Soil
Water Depletion Patterns in Presence of Growing Soybean Roots, I.
Determination of Hydraulic Properties of the Soil. Soil Science
Society of America Proceeding, 39: 424-430.
Bouwer, H. (1989) : Estimation and enhancing ground water recharge' in
Sharma, M. L., (Ed.). Ground water Recharge, pp. 1-10, A. A.
Balkema Publish Co., Rotterdam/ Boston.
Cooper, J.D. (1979) : Water use of a tea estate from soil moisture
measurements. East Africans Agricultural and forestry Journal, 43:
102- 121.
Cooper, J.D. (1980) : Measurements of Water Fluxes in Unsaturated Soil
in Thetford Forest. Report 66. Institute of Hydrology, Wallingford.
Cooper, J. D., Gardner, C. M. K. and Mackenzie, N.
(1990) : Soil control on recharge to aquifers. Journal of Soil Science, 41: 613-630.
Diez JA, Caballero R, Roman R, et al. (2000) : Integrated fertilizer and
irrigation management to reduce nitrate leaching in Central Spain. J
ENVIRON QUAL, 29: 1539-1547.
Dolman, A. J., Stewart, J.B. and Cooper, J. D. (1988) : Predicting forest
transpiration from climatological data. Agricultural and Forest
Metrology, 42: 339-353.
Dreiss, S.J. and Anderson, L.D. (1985) : Estimating vertical soil moisture flux at a land treatment site. Ground Water Publishing Co.,
Westerville, 23: 503-511.
Gardner, M. K., Cooper, J. D., Wellings, S.R., Bell, J.P., Hodnett, M.G.,
Boyle, S.A., and Howard, M. J. (1990) : Hydrology of the
unsaturated zone of the chalk of south-east England, In Chalk. pp.
611-618, Thomas Telford, London.
Hasegawa, S., Osozawa, S. and Ueno, H. (1994) : Measurement of soil
water flux in Andisols at a depth below a root zone of about 1 meter.
Soil Sci. Plant Nutr., 40:137+147.
Healy, R.W., (1989) : Seepage through a hazardous-waste trench cover.
Journal of Hydrology, 108: 213-241.
Hosty, M. and Mulqueen, J. (1996): Soil moisture and ground water
drawdown in a dry grassland soil. Irish J. Agr. Food Res., 35:
17-24.
Inoue, M. Tomohisa, Y. and Yasuji, N. (1985): Application of neutron
moisture meter for estimation of evaporation in a sand dune field. J.
Fac. Agric., Tottori Univ., 21: 27-35
Kalms, J. M., Vauclin, M., Vachaud, G. (1979) : Modalites
d'alimentation hydrique de deux varietes de riz pluvial en Cote
d'Ivoire Centre" in: Isotopes and Radiation in Research on
Soil-Plant Relationships, by IAEA-SM-235,Vienna, p.271-287.
Kanamori, H. (1995) Influence of Plow Sole on Moisture Movement in Growing Non-rice Crops on Paddy Based Land, Study on
農土論集246 (74-6) 847

40 農業土木学会論文集第246号 (第74巻 第6号)
diversified crop water requirements in Philippines. Trans. of
JSIDRE, 175: 95-108.
Khalil, M., Sakai, M., Mizuguchi, M., Miyazaki, T. (2003) : Current and
prospective applications of Zero Flux Plane (ZFP) Method. Jouranl of Japanese Society of Soil Physics, 95: 75-90.
Kirsch, S. W. (1993): A field Test of a soil-based measure of
evaporatranspiration. Soil Science, 156: 396-404.
McGowan, M. and Williams, J. B. (1980) : The water balance of an
agricultural catchment, I. Estimation of evaporation from soil water
records. Journal of soil Science, 31: 217-230.
Payne, W.A., Wendt, C.W. and Lascano, R.J. (1990): Bare fallowing on
sandy fields of Niger, West Africa. Soil Sci. Soc. Am. J., 54:
p.1079-1084. Ragab, R., Finch, J. and Harding, R. (1997) : Estimation of Ground water
recharge to Chalk and Sandstone aquifers using Simple soil models. Journal of Hydrology, 190: 19-41.
Richards, L. A. (1954) : Multiple tensiometer for determining vertical
component of the hydraulic gradient in soil. Soil Science Society of
America Proceeding, 18: 7-10.
Roman, R., Caballero R, and Bustos, A. (1999) : Field water drainage
under traditional and improved irrigation schedules for corn in
central Spain. Soil Sci. Soc. Am. J. 63: 1811-1817.
Royer, J.M. and Vachaud, G. (1974) : Determination direct de
l'evapotranspiration et de 1' Infiltration par measures des teneurs en
eau et des succions. Hydrological Sciences bulletin, 19: 319-336.
Sharma M. L. (1985) : Estimating Evapotranspiration. IN advances in
Irrigation, vol. 3. D. Hillel (ed). Academic Press, New York.
Sharma, M. L., Bari, M. and Byrne, J. (1991) : Dynamics of seasonal
recharge beneath a semiarid vegetation on the Gnangara mound,
western-Australia. Hydrol process, 5: 383-398.
Simmers, I. (1987) : (Ed). Estimation of natural ground water Recharge.
P. 510, D. Reidel Publish. Co., Dordrecht.
Stammers, W. N., Igwe, O.C. and Whiteley, H. R. (1973) : Calculation of
evaporation from measurements of soil water and the soil water
characteristics. Canadian Agricultural Engineering , 15: 2-5.
Stone, L. M., Horton, M. L. and Olsen, T. C. (1973) : Water loss from an
irrigated sorghum field. I. Water flux within and below the root zone.
Agronomy Journal 65, 492-495.
Tang, CY (1996) : Interception and recharge processes beneath a Pinus
elliotii forest, Hydrol process, 10: 1427-1434. Thony, J. L., Hamburger, J., Vauclin, M. and Vachaud, G. (1979) : Etude
detaillee de I evaporation sur sol nu. in: Isotopes and Radiation in
Research on Soil-Plant Relationships, IAEA-SM-235, Vienna,
p.247-258. Tsujimura, M., Numaguti A, Tian, L. et al. (2001) : Behavior of
subsurface water revealed by stable isotope and tensiometric
observation in the Tibetan Plateau, J. Meteorol Soc. Jpn., 79: 599-605.
Van Bavel, C. H. M., Burst, K. J. and Strik, G. B. (1968) : Hydraulic
properties of a clay loam soil and the field measurements of water uptake by roots, II, The water balance of the root zone. Soil Science
Society of America Proceeding, 32: 317-321.
Van Genuchten, M.Th, (1980) : A closed-form equation for predicting
the hydraulic conductivity of unsaturated soil. Soil Sci. Soc. Am. J.,
44, 892-898.
Villegas and Morris. (1990) : ZFP recession under monocropped and
intercropped cowpea and sorghum. Agron j, 82: 845-851.
Wellings, S. R. (1984) : Recharge of the upper chalk aquifer at a site in
Hampshire, England, Water Balance and Unsaturated Flow. Journal
of Hydrology, 69: 259-273.
Yamamura, Y., Cho, T. and Kuroda, M. (1988) : Evaluation on
Consumptive Use of Water in Actual Fields affected by Soil
Moisture Movement —In case of the Kuroboku soil in the Southern
Kyusyu-. Trans. JSIDRE, 134: 35-44.
(Received 2006. 2. 21, Accepted 2006. 11. 13) (Questions and/or discussions on this paper for public debate will be accepted before 2007. 6. 24)
周 期 的 水 分 供 給 に 伴 うゼ ロ フ ラ ッ ク ス 面 の 挙 動
KHALIL Magdi*関 勝寿**宮 崎 毅**溝 口 勝**坂 井 勝***
*東 京 文 化 財 研 究 所 保 存 科 学 部,〒110-8713東 京 都 台東 区 上野 公 園13-43.
**東京 大 学 大 学 院 農 学 生 命 科 学研 究 科,〒113-8657東 京 都 文 京 区1-1-1
***三重 大 学 大 学 院 生 物 資源 学研 究科,〒514-8507三 重 県 津 市 栗 真 町 屋 町1577
要 旨
ゼ ロフラックス面(ZFP)と は,浅 い領 域では蒸発 に伴 う水分 の上方移動 が,深 い領域では水分の下方移 動が,同 時に起き
ている土壌において,水 分 の上方移動 と下方移動 を分ける,理 論的にはフラ ックスがゼ ロとなる深 さの平面で ある,本 研
究では,ZFPの 挙動 を調べ るた めに,カ ラム実験 と数値実験 によるシ ミュ レー シ ョンを行 った.黒 ボク土に一度 だけ水 を
供 給 し,0.15cm/dayの 蒸発速 度 と自由排水 を与えた ところ,全 水頭分布 とZFPに ついて,カ ラム実験 とシ ミュ レーシ ョン
の結 果がほ どよく適合 した.立 川 ロー ム土に周期的水分供給 を与えた ところ,カ ラム実験 とシ ミュ レー シ ョンともに,水
分供 給時に地表にZFPが 現れ,ZFPは 時間 とともに下方へ移動 し,30cmの 深 さに到達 したときにZFPが 消失 した.ZFPの
消失は,土壌 深層部の初期水分量が高かったために起きた ものである と考察 され た.
キー ワー ド: 周期 的水分供給,ゼ ロフ ラックス面,不飽 和土,Hydrus-2D,深 層 土壌
848 Trans. JSIDRE Dec. 2006


![Cài Đặt Nhanh SAKAI 2.9.1 -Sucess 100% ( Quick Build SAKAi 2.9.1 ]](https://img.pdfslide.tips/doc/110x75/55cf9cdb550346d033ab4be6/cai-dat-nhanh-sakai-291-sucess-100-quick-build-sakai-291-.jpg)