Embed Size (px)
Citation preview

ANNUAL DRINKING WATER QUALITY REPORT
2014/15
lmw.vic.g v.au

1 • Foreword
2 • Our Profile
4 • Our Strategy 2015 – 2018
5 • Our Mission, Vision and Values 2015 – 2018
6 • Our Commitment to Our Environment and Our Region
7 • Our Projects
8 • Our Performance
9 • Water Treatment
12 • Drinking Water Quality Standards and Quality Management
15 • Water Quality Complaints
16 • Regulated Water
18 • Emergency Management
18 • Risk Management Plan Audit Findings
18 • Further Information
19 • Appendix A – Water Quality Tables
C NTENTS
1
I am pleased to present Lower Murray Water’s 2014/15 Annual Drinking Water Quality Report, which contains bacteriological, chemical and physical characteristics of our drinking water supplied to LMW’s customers spread over 14 localities.
The report has been prepared in accordance with the Safe Drinking Water Act 2003, which sets the drinking water quality standards, public disclosure and reporting requirements.
The information contained in this report provides a snapshot of LMW’s performance against the water quality standards, and highlights water quality challenges, achievements, and the water quality projects completed in 2014/15, and those planned for 2015/16.
LMW adopted a multiple barrier, catchment-to-tap approach to ensure high quality, safe drinking water. Under the Safe Drinking Water Act 2003, LMW is required to prepare and implement a Drinking Water Quality Management Plan (DWQMP) to ensure the safety of the drinking water supply system.
LMW’s DWQMP is based on Hazard Analysis and Critical Control Point (HACCP) principles and the Australian Drinking Water Guidelines.
For the 2014/15 year, I’m pleased to advise that LMW continued to produce high quality drinking water to our customers, and complied with the prescribed standards of the Regulations for Escherichia coli (E. coli), chlorine disinfection by-products, aluminium and turbidity.
Managing DirectorPhillip Endley
FOREW RD
2
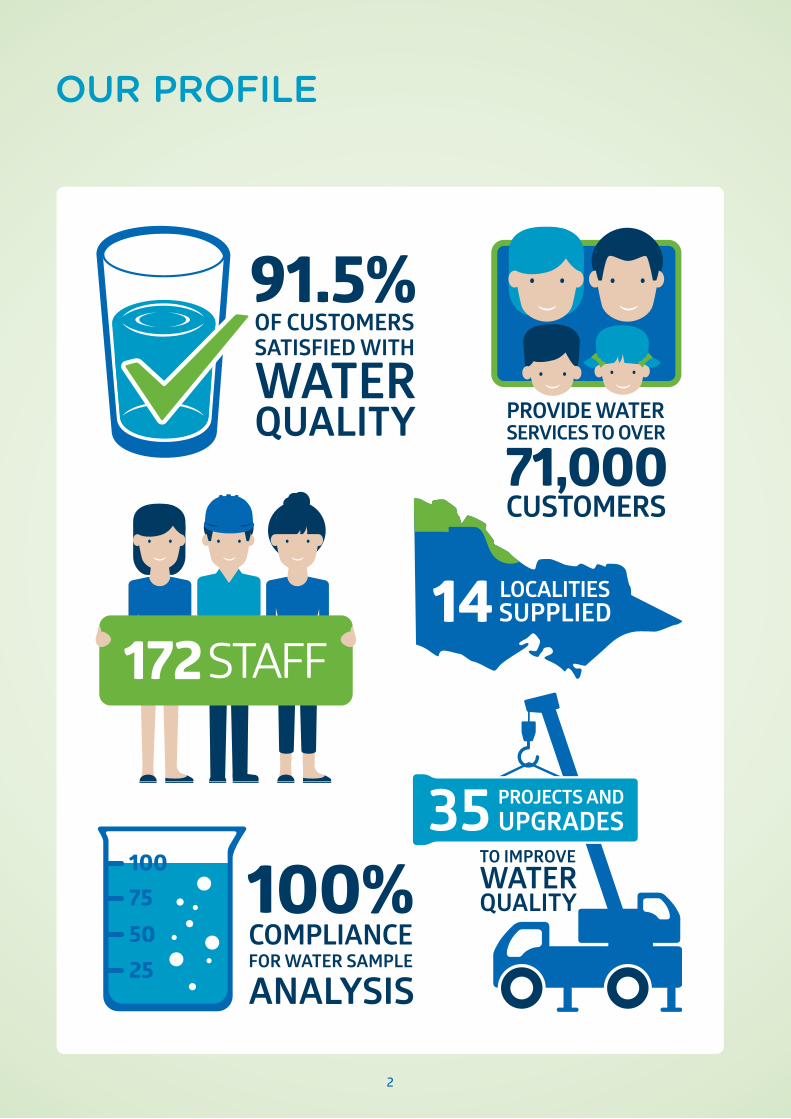
OUR PROFILE
OF CUSTOMERSSATISFIED WITH
WATERQUALITY
COMPLIANCEFOR WATER SAMPLE
ANALYSIS
100%
91.5%
TO IMPROVEWATERQUALITY
PROJECTS ANDUPGRADES
100755025
14 SUPPLIED
3
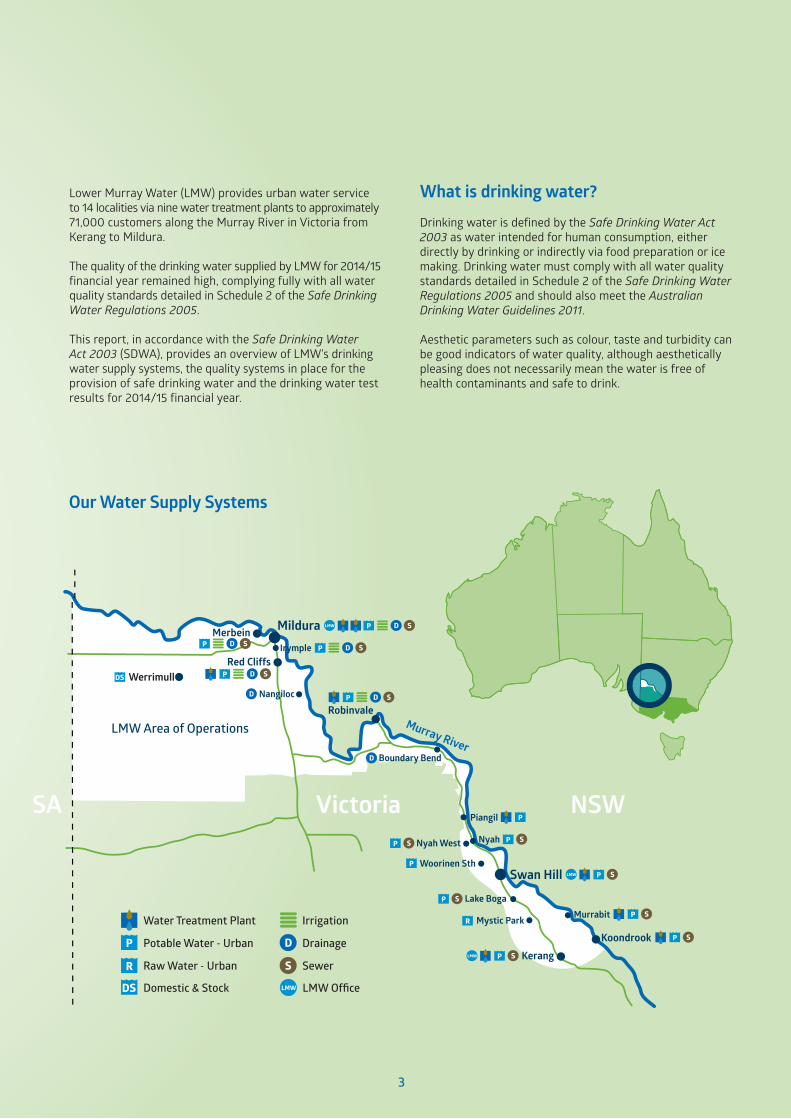
Lower Murray Water (LMW) provides urban water service to 14 localities via nine water treatment plants to approximately 71,000 customers along the Murray River in Victoria from Kerang to Mildura.
The quality of the drinking water supplied by LMW for 2014/15 financial year remained high, complying fully with all water quality standards detailed in Schedule 2 of the Safe Drinking Water Regulations 2005.
This report, in accordance with the Safe Drinking Water Act 2003 (SDWA), provides an overview of LMW’s drinking water supply systems, the quality systems in place for the provision of safe drinking water and the drinking water test results for 2014/15 financial year.
What is drinking water? Drinking water is defined by the Safe Drinking Water Act 2003 as water intended for human consumption, either directly by drinking or indirectly via food preparation or ice making. Drinking water must comply with all water quality standards detailed in Schedule 2 of the Safe Drinking Water Regulations 2005 and should also meet the Australian Drinking Water Guidelines 2011.
Aesthetic parameters such as colour, taste and turbidity can be good indicators of water quality, although aesthetically pleasing does not necessarily mean the water is free of health contaminants and safe to drink.
Victoria
Merbein
WerrimullRed Cliffs
Robinvale
Kerang
Mildura
Swan Hill
Irymple
Piangil
Boundary Bend
Nangiloc
NyahNyah West
Woorinen Sth
Mystic Park Murrabit
Murray River
SA NSW
Koondrook
Lake Boga
SURFACE WATER (PRIVATE) DIVERTERS
Victoria
Merbein
WerrimulRed Cliffs
Robinvale
Kerang
Mildura
Swan Hill
Irymple
Piangil
NyahNyah West
Woorinen Sth
Mystic ParkMurrabit
Murray River
Murray River
Murray River
SA NSW
Kilometres
50 75 1002512.50
Koondrook
Lake Boga
LMW Area of Operations
Domestic & Stock
Drainage
Irrigation
SewerRaw Water - Urban
Potable Water - Urban
Water Treatment Plant
LMW Office
LMW Area of Operations
Major Roads/Highways
Domestic & Stock
Drainage
Irrigation
Sewer
Raw Water - Urban
Potable Water - Urban
Water Treatment Plant
Murray River
Township
Features
LMW Office
Lakes
Services
Our Water Supply Systems

4
Strategy Governance
Be customer focused‘Right Service, Right Time’
Maintain compliant performance while improving cost-effectiveness
of operations and assets
Increase use of the modernised irrigation infrastructure in the
four districts
Increase the resilience of services to changing and extreme weather
Manage the Corporation in accordance with expected standards
of corporate behaviour
Manage our assets and fi nances responsibly and sustainably
Provide an engaged and skilled workforce to deliver our vision
and mission
Provide our services equitably and with consideration
OUR STRATEGY 2015 – 2018Our priorities and actions derive from our mission, strategies and governance statements.

5
Our mission is to:
• Provide water services in a sustainable, reliable and timely manner
• To maintain positive and transparent relationships with our customers and other stakeholders
• To contribute to the economic, social and cultural development of our region
Our vision is to support our region with water for life, irrigation, growth and the environment.
We value honesty, integrity, teamwork and commitment. We are passionate about our business and the services we provide for our customers. We are committed to making decisions based on sound judgements and intelligent use of knowledge.
We value:
• Our urban customers, who receive reliable and affordable potable water and treated wastewater services.
• Our rural customers, who need to receive reliable commercial services at the minimum sustainable cost.
• Investment and development of our people to enable us to be a thinking, effi cient organisation.
Our Mission Values
Our Vision
OUR MISSION, VISI N AND VALUES 2015 – 2018

6
Environmental Sustainability Sustainable Water Strategies
Blue Green Algae
We are a Victorian convening agency within the region for Blue Green Algae (BGA) monitoring and reporting. The monitoring of the Murray River is undertaken by our staff and the New South Wales Department of Environment and Water and is reported back through the Sunraysia Regional Algal Coordination Committee (SRACC). Our General Manager Customer Services is currently the Chairman of the SRACC. There were only minor levels of BGA reported in the sampling done throughout the 2014/15 year.
Sustainable and Resilient Water Service SystemsCommunity Education and Water Awareness Campaigns
Giveaway and Exchange Programs
Through community water efficient product exchanges, we aim to raise awareness of water issues and promote the wise use of potable water. We have ongoing exchange programs which operate throughout the year, including trigger nozzles and showerheads.
School Education Programs
Interactive Environmental Primary School Activity
In conjunction with Mildura Rural City Council, Riverwatch, Waterwatch, Landcare, EnviroEdu, Mildura Regional Waste Management Group, Mallee Catchment Management Authority, Murray-Darling Freshwater Research Centre and Local Land Services Western (formerly Lower Murray Darling CMA), we held an interactive event on the student free entry day of the Mildura Show (Friday 17th October 2014). During the event, which ran from 10am to 2.30pm, 450 students ranging from Prep to Grade 6 participated in in an hour
long session of either three x 20 minute activities or one 40 minute activity and one 20 minute activity. At the conclusion of their hour, each child collected a show bag of items relating to the activities and agencies involved in the day. We were the Coordinating agency for the event and in addition we ran our interactive ‘oversized’ board game “Water Wisdom with Dripster”.
National Water Week Poster Competition
As part of the celebrations of National Water Week 2014, we encouraged all primary schools in our service region to take part in the national poster competition. As an added incentive, 12 local artworks were chosen to make up a calendar which was then distributed to schools early in the 2015 school year. In the 2014 competition we received over 450 entries from six schools in our service area.
Water Recycling
We continue to encourage sustainable reuse schemes to reduce raw water extracted from the Murray River. Water is reclaimed from our Wastewater Treatment Plants in accordance with Environment Protection Authority (EPA) Guidelines. Highlights include:• KoorlongWastewaterTreatmentPlanttreatswastewater
from Mildura, Irymple and Red Cliffs and produces Class C reuse water for use by a third party on high value horticulture
• MilduraWastewaterTreatmentPlant:ClassCreclaimedwater used for onsite irrigation of tree lots, permanent pastures and fodder
• RobinvaleWastewaterTreatmentPlant:ClassCwaterusedfor onsite fodder (Lucerne) production
We also facilitate reuse of water from our Water Treatment Plants:• ReclaimedwaterfromtheMilduraWestWaterTreatment
Plant is used at Mildura Golf Club• ReclaimedwaterfromtheMilduraWaterTreatmentPlant
is used by Mildura Rural City Council for the irrigation of recreation reserves, and by a private individual.
A number of individuals also reuse irrigation drainage water, although volumes have declined in recent years due to improved irrigation practices.
OUR COMMITMENT TO OUR ENVIRONMENT AND OUR REGION

OUR PROJECTS
7
Water Quality Improvement Projects 2015/16
TREATMENT PLANT PROJECT
AllMilduraMilduraMilduraMilduraMilduraMilduraMilduraMildura WestMildura WestRobinvalePiangilPiangilSwan HillSwan HillSwan HillSwan HillSwan HillSwan HillSwan HillKoondrookMurrabitMurrabitKerangKerangKerangKerang
Raw Water On-Line Turbidity MonitoringInlet Pipe Work & Flow Splitting UpgradeSwitchboard Replacement & AutomationClarifier No 3 Replace LaundersClarifier No 3 Replace Drive MechanismClarifier No4 Replace Drive MechanismClarifier 3 Replace Tube SettlersTelemetry UpgradesReplace Cathodic Protection SystemPAC System UpgradeUnload Bund & stormwater drainageReplace Ground Storage / RelineWTP Refurbishment Works (Aqua Pac)Automation and Electrical UpgradeGround Storage Roof/Gutter RepairsHardstand for Temp Dosing incl. powerAlarms & Auto Shut Offs in PACTrim Chlorination on TWPsExtend/Create 3 drum Chlorination facilityChemical Dosing Rationalising (PAC Dosing)PLC AutomationNew Elevated Storage (Replacement Tank)WTP PLC AutomationClarifier Tube Settlers ReplacementPLC AutomationChemical Dos Install New PAC SystemMedia Filter Replacement
Water Quality Improvement Projects 2014/15
TREATMENT PLANT PROJECT
AllAllMilduraMilduraMilduraMilduraMilduraMilduraMilduraRobinvaleRobinvaleRobinvaleRobinvaleRobinvaleRobinvalePiangilPiangilPiangilSwan HillSwan HillSwan HillSwan HillSwan HillSwan HillKoondrookKoondrookKoondrookKoondrookMurrabitMurrabitMurrabitMurrabitKerang
Raw Water On-Line Turbidity MonitoringTelemetry UpgradesSwitchboard Replace & AutomationRWPS Pump No 4 VSD InstallationWTP Clarifier Desludge Turbidity MetersWTP Air Supply for Filter Isolation ValvesClarifier 3 & 4 Sludge Blanket WorksWTP Clarifier Flow Switches for Desludge PipelinesSecurity Fence ModificationsUnload Bund & stormwater drainage improvementsReplace Fluoride Online MeterRW Replace SuctionStandby for Soda Ash & Automate ControlRobinvale WTP Replacement of Filter Valve PositionersAlum Pump ReplacementRefurbishment Works (Aquapac)PLC Replace, Automation & OptimisationAquapac Installation Filter to WasteFilters RefurbishmentUpgrade Chlorine Building & StorageInstallation SCADA Phone to Replace EDAC diallerPAC Installation Alarms & Auto Shut OffsImprovements (HWA Optimisation Report)2 Bays GLS Install Cathodic ProtectionRefurbishment Works 2014-15Chlorine System UpgradeReplace Sludge Control ValvePAC Refurbishment & IntegrationInstallation of Settled Water Turbidity MeterReplace backwash logic control plus TankReplace Caustic TanksChlorine System UpgradeInstallation SCADA Phone to Replace EDAC dialler

8
How water is regulatedDrinking water in Victoria is regulated by the State Government through the application of the Safe Drinking Water Act 2003 and its regulations. The water program within the Department of Health and Human Services is responsible for monitoring and ensuring compliance with the Safe Drinking Water legislation.
Water quality standards To ensure that drinking water is safe for human consumption, the Safe Drinking Water Regulations set out the standards for the quality of drinking water as supplied to customers. This includes the mandatory testing of drinking water at customer taps for the following standards:• E. coli • Aluminium• Trihalomethanes • Dichloroaceticacid• Chloroaceticacid • Trichloroaceticacid• Turbidity
Risk management plansThe Safe Drinking Water Act 2003 requires water suppliers to prepare, implement and review risk management plans in relation to their supply of drinking and regulated water to the public.
Further provisions under the Safe Drinking Water Regulations state that water suppliers must address the risk to human health from the presence of the following hazards in water: • Pathogenicmicro-organisms• Inorganicchemicals,includinginorganicdisinfection by-products• Organicchemicals,includingpesticides,pesticideresidues and organic disinfection by-products• Radiologicalparameters• Algaltoxins
Further guidance
The Australian Drinking Water Guidelines (the ADWG) have been developed by the National Health and Medical Research Council in collaboration with the Natural Resource Management Ministerial Council. The ADWG are intended to provide a framework for good management of drinking water supplies that, if implemented, will assure safety at point of use.
OUR PERF RMANCE
LMW Drinking Water Localities
(Sensis - 2012)
WATER SUPPLY SYSTEM / LOCALITYIrympleKerangKoondrookLake BogaMerbeinMilduraMurrabitNyahNyah WestPiangilRed CliffsRobinvaleSwan HillWoorinen South
SOURCE WATERMurray RiverMurray River/Loddon RiverMurray RiverMurray RiverMurray RiverMurray RiverMurray River/Storage DamMurray RiverMurray RiverMurray RiverMurray RiverMurray RiverMurray RiverMurray River
POPULATION SUPPLIED7,6014,1228641,0973,52034,075996926122653,7452,10911,84549371,139
TREATMENT PLANTMildura 7th street & Mildura West WTP’sKerang WTPKoondrook WTPSwan Hill WTPMildura 7th street & Mildura West WTP’sMildura 7th street & Mildura West WTP’sMurrabit WTPSwan Hill WTPSwan Hill WTPPiangil WTPRed Cliffs WTPRobinvale WTPSwan Hill WTPSwan Hill WTP
Across LMW’s water supply systems, 14 localities are provided with drinking water from nine water treatment plants. The table below outlines additional details in regards to each water supply system.

9
Source water The 2014/15 year has seen little fluctuation in the source water quality in contrast with the previous two years. This has provided additional stability to the treatment processes across each water supply system. Most of the water treated by LMW is drawn directly from the Murray River. The only exceptions are in the township of Kerang and Murrabit.
At Kerang there are three water source options to choose from. These options are, water piped from the Murray River at Koondrook, an irrigation channel operated by Goulburn Murray Water (GMW), and the Loddon River at Kerang.
During the higher demand summer period, water is usually sourced as a blend of the Murray River and irrigation channel in equal portions. The Loddon River is only used as a backup source in abnormal events.
At Murrabit the water can be sourced directly from the Murray River or from a GMW irrigation channel which fills into an onsite 6ML earthen dam. The channel water originates from the Murray River. The choice of where the water is drawn from is made after consideration of raw water quality and the level of demand.
The quality of the river water varies, sometimes significantly. It can change at any time of the year, but in the Sunraysia area it mainly deteriorates in the summer months due to decreased flow and resultant increased algal growth.
Notification protocols are in place with GMW, our water storage manager, for incidences where issues in the rivers or channels supplying LMW may impact on source water quality.
Water treatment processDuring the 2014/15 financial year, LMW treated over 19,200 Megalitres of drinking water across nine water treatment plants.
LMW's nine water treatment plants use the following process steps: • Coagulation• Flocculation• Sedimentation/flotation• Filtration• Disinfection
To provide adequate disinfection to drinking water, LMW adds chlorine to the water. Chlorine is the most widely used water disinfectant in the water industry due to its effectiveness in killing bacteria. Chlorine dose rates are adjusted to provide adequate free chlorine residual throughout the distribution system. This helps provide protection against contamination and can limit biological regrowth problems.
Treatment processes may slightly differ at each water treatment plant due to plant capacity, technology type or raw water quality being sourced.
WATER TREATMENT

10
LMW Water Treatment Processes
SYSTEM
Kerang
Koondrook
Mildura
Murrabit
Piangil
Red Cliffs
Robinvale
Swan Hill
LOCALITIES
Kerang
Koondrook
MerbeinIrympleMildura
Murrabit
Piangil
Red Cliffs
Robinvale
Lake BogaNyahNyah WestSwan HillWoorinen SouthWakool*
TREATMENT PROCESS
Coagulation / flocculation / Sedimentation / Clarification / Granular media filtration / Chlorination
Coagulation / flocculationSedimentation / ClarificationGranular media filtration / Chlorination
Coagulation / flocculationSedimentation / Clarification / Slow sand filtration / ChlorinationGranular media filtration / Chlorination
Coagulation / flocculationSedimentation / ClarificationGranular media filtration / Chlorination
Coagulation / flocculationSedimentation / ClarificationGranular media filtration / Chlorination
Coagulation / flocculationDissolved air flotation Granular media filtration / Chlorination
Coagulation / flocculationSedimentation / ClarificationGranular media filtration / Chlorination
Coagulation / flocculationSedimentation / ClarificationSlow sand filtration / Chlorination
ADDED SUBSTANCES
Aluminium sulphate / Hydrated lime Chlorine gas / Powdered activated carbon Fluorosilicic Acid
Aluminium sulphate / Sodium hydroxide Polymer / Chlorine gas / Powdered activated carbon
Aluminium sulphate / Hydrated lime Polymer / Chlorine gasPowdered activated carbonFluorosilicic Acid
Aluminium sulphate Sodium hydroxide Chlorine gas / Powdered activated carbon
Aluminium sulphate Hydrated limeChlorine gas / Powdered activated carbon
Aluminium sulphate / Sodium hydroxide Chlorine gas / Powdered activated carbonFluorosilicic Acid / Potassium permanganate
Aluminium sulphate / Soda AshChlorine gas / Powdered activated carbonSodium hexafluorosilicate
Aluminium chlorohydrate Sodium hydroxide Chlorine gas Powdered activated carbonFluorosilicic Acid
Coagulation and flocculation
The first step of the conventional treatment process involves dosing a chemical coagulant to help gather suspended solids and organic material in the raw water. LMW uses the aluminium sulphate and aluminium chlorohydrate to bring about the coagulation process, which helps to form larger particles called ‘flocs’ and can be removed more readily by subsequent treatment steps. During flocculation the floc particles develop to a larger size. The larger size and weight of the floc then assists in the sedimentation process. Flocculent aids including polyelectrolytes are also commonly used to enhance the flocculation phase which further assists in the sedimentation process.
Sedimentation
Sedimentation involves slowing down the flow of water using sedimentation tanks, so particulates can more readily settle to the bottom. Sedimentation is used to enhance the filtration process by removing particulates which form a removable sludge layer on the bottom, while the clarified water flows over the top weirs. Sedimentation Tanks are typically circular or rectangle in shape; however other types
of sedimentation include Clarifiers where the clarification process is based on solids contact, and dissolved air flotation (DAF) which uses flotation to remove sediments.
Filtration
Filtration occurs as the water passes through filters that help remove particles that have not settled in the sedimentation process. Sand filters are commonly used in the water treatment process and may contain layers of gravels, sand and filter coal. The sand filtration process removes fine suspended solid matter as well as some other particles including larger micro-organisms, resulting in clear water passing through.
Disinfection
Water is disinfected to kill any pathogens (disease causing organisms) that remain in the treated water after filtration and provide protection within the distribution system. Without disinfection, the risk from waterborne disease is greatly increased. Disinfection is carried out by chlorination at all LMW’s water treatment plants in the form of chlorine gas.
*By third party agreement.
11
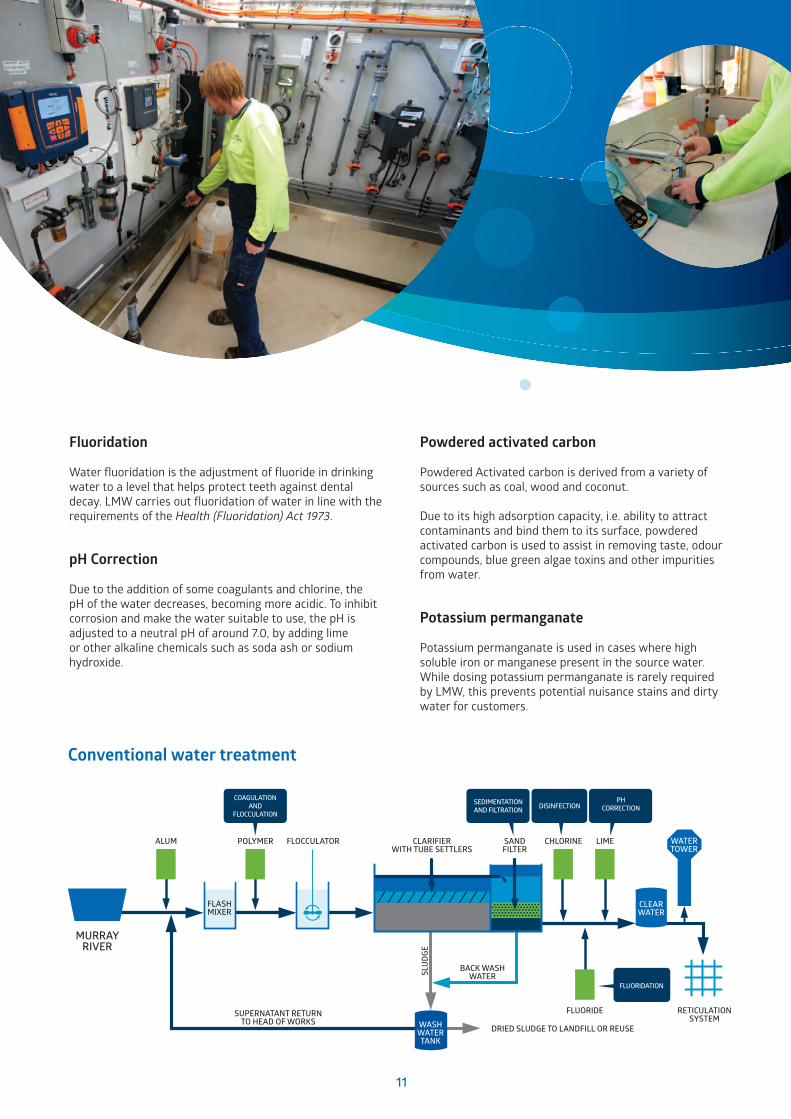
Fluoridation
Water fluoridation is the adjustment of fluoride in drinking water to a level that helps protect teeth against dental decay. LMW carries out fluoridation of water in line with the requirements of the Health (Fluoridation) Act 1973.
pH Correction
Due to the addition of some coagulants and chlorine, the pH of the water decreases, becoming more acidic. To inhibit corrosion and make the water suitable to use, the pH is adjusted to a neutral pH of around 7.0, by adding lime or other alkaline chemicals such as soda ash or sodium hydroxide.
Powdered activated carbon
Powdered Activated carbon is derived from a variety of sources such as coal, wood and coconut. Due to its high adsorption capacity, i.e. ability to attract contaminants and bind them to its surface, powdered activated carbon is used to assist in removing taste, odour compounds, blue green algae toxins and other impurities from water.
Potassium permanganate
Potassium permanganate is used in cases where high soluble iron or manganese present in the source water. While dosing potassium permanganate is rarely required by LMW, this prevents potential nuisance stains and dirty water for customers.
MURRAY RIVER
ALUM POLYMER FLOCCULATOR CLARIFIERWITH TUBE SETTLERS
SANDFILTER
BACK WASHWATER
SUPERNATANT RETURN TO HEAD OF WORKS
DRIED SLUDGE TO LANDFILL OR REUSE
FLASHMIXER
CHLORINE LIME WATERTOWER
FLUORIDE RETICULATIONSYSTEM
CLEARWATER
WASHWATERTANK
COAGULATIONAND
FLOCCULATION
SEDIMENTATIONAND FILTRATION
PHCORRECTION
FLUORIDATION
DISINFECTION
SLU
DGE
Conventional water treatment

12
Quality management systems LMW has a drinking water quality management plan based on the requirements set out in the Safe Drinking Water Act 2003 and the Safe Drinking Water Regulations 2005. The plan identifies key water quality risks using a catchment to tap approach. Each key risk is then managed to an acceptable risk, providing the delivery of safe drinking water to our customers.
Verification water quality monitoring
To comply with the water quality monitoring requirements set out in the Safe Drinking Water Act 2003 and Safe Drinking Water Regulations 2005, LMW use an external National Association of Testing Authorities (NATA) registered laboratory to perform all regulatory drinking water testing. Drinking water quality results are available in Appendix A (attached).
DRINKING WATER QUALITY STANDARDS AND QUALITY MANAGEMENT During 2014/15 financial year, LMW remained 100% compliant with water quality standards specified for drinking water in Schedule 2 of the Safe Drinking Water Regulations 2005. All drinking water quality results can be found in Appendix A of this report.
LMW does not use ozonation as part of water treatment processes and therefore does not test for its disinfection by-products.
* Subject to further testing based on locality population.
DRINKING WATER QUALITY STANDARDS
PARAMETERMICRO ORGANISM Escherichia coli
CHLORINE BASED CHEMICALSChloroacetic acidDichloroacetic acidTrichloroacetic acidTrihalomethanesTurbidity
Aluminium
QUALITY STANDARD At least 98% of all samples of drinking water collected in any 12 month period contain no Escherichia coli per 100 millilitres of drinking water
0.15 milligrams per litre of drinking water0.1 milligrams per litre of drinking water0.1 milligrams per litre of drinking water0.25 milligrams per litre of drinking water95 percent upper confidence limit of the mean of drinking water samples collected in the preceding 12 months must be ≤5.0 NTU0.2 milligrams per litre of drinking water
SAMPLING FREQUENCY
one sample per week*
one sample per monthone sample per monthone sample per monthone sample per monthone sample per week
one sample per month

13
The following issues have occurred during the 2014/15 financial year:• KerangdidnothavepHandturbiditytestedon22April2015
due to contractor error, the problem is now rectified.• FluoridetestingatNyahwaslimitedto11samplesoutof
the 12 scheduled. The missing test result in August was due to a contractor error, as the testing requirements were correctly provided in the monitoring program. The schedule was reviewed and corrected.
As part of the water quality monitoring program, samples are collected on weekly basis and sent to the lab via a courier service for analysis. Whilst the courier service is deemed reliable, it can’t guarantee 100% samples delivery on time. In June 2015, a delay in delivering two lots of water samples collected from the Mildura, Red Cliffs, Merbein and Irymple localities to the service provider laboratories in Melbourne has taken place. As a result, test results for E.coli, turbidity and pH were obtained for the last week of June and consequently, LMW failed to meet its regulatory obligation in relation to sampling frequency as required in schedule 2 of the regulations. The service provider failed to provide valid clarification to the samples delivery failure, however, LMW has since allocated the responsibility for water samples transportation to the service provider lab, which is using the overnight service to ensure on-time delivery of samples.
A comparison of test results of water samples and percentage of complying samples over the last three financial years, is shown in the below chart.
Water quality reportsReports available on LMW's website and are updated monthly.
10099989796959493929190
Percentage of Water Samples Complying with Water Quality Standards
2012/132013/142014/15
Turb
idity
Alum
iniu
m
Trih
alom
ethr
anes
Tric
hlor
oace
tic a
cid
Dich
loro
acet
ic a
cid
Chlo
roac
etic
aci
d
E. C
oli

14
Water treatment issues
LMW achieved 100% compliance for all samples analysed in 2014/15 in accordance with the Safe Drinking Water Regulations requirements. During the financial year, there were no issues that could’ve affected the treated water quality, in spite of the upgrade projects that were completed. It was noted that the raw water quality has significantly improved, hence achieving high quality standards. Water treatment issues however may occasionally still occur due to a variety of factors, such as a change in raw water quality or asset breakdown. When these treatment issues occur, it may result in a change to the treatment process or a corrective action to ensure safe drinking water is maintained.
Manganese treatment
During the past financial year, LMW experienced high soluble manganese in the raw water which required the dosing of potassium permanganate at the Red Cliffs water treatment plant during summer. This helps to oxidise manganese out of drinking water and maintain soluble manganese levels below limits set within the Australian Drinking Water Guidelines 2011.
Due to the reoccurring nature of this problem, LMW carried out specific monitoring to investigate the actual source of manganese in a bid to eliminate or control it. A number of options have been considered which will further be investigated during 2015/16.
Tank cleaning
During the 2014/15 financial year, LMW carried out scheduled maintenance programs to a number of its water storages. This included both structural and internal condition assessments and associated works where required.
Taste and odour treatment
Powdered activated carbon was dosed throughout the past financial year at the Mildura West water treatment plant. The main purpose of this treatment is to adsorb any taste and odour compounds which may result from high organics in the raw water.
Fluoride treatment For the financial year, LMW was below the average optimum fluoride level for dental decay prevention recommended within the Code of practice for fluoridation of drinking water supplies - Health (Fluoridation) Act 1973. The main reason for this was due to a number of fluoride systems being offline for both preventative and breakdown maintenance.

15
Water quality complaint management LMW is committed to providing high quality drinking water and to continuously improving our customer service and communications with all our customers. To ensure water quality complaints are resolved in appropriate timeframes, complaints are captured in the Corporation’s customer management system ‘Merit’ which provides a tracking and reporting facility.
Merit directs the complaint to the relevant action officer to follow up with the complainants. Complaints received after hours via our 1800 phone number are also directed to the relevant officer the next working day for follow up with the complainants if necessary. If the issue cannot be resolved over the phone, an officer attends the property of concern to discuss the complaint with the complainant and take samples of water for testing/tasting. If necessary, water mains in the area of concern will be flushed. Monthly complaint summary reports for Board meetings and quarterly reports for Essential Services Commission reporting are prepared from the Merit data base.
2014/15 water quality complaintsThe number of complaints has slightly increased over 2014/15 financial year when compared to the 2013/14 financial year (16 complaints).
Over the reporting period, the main water quality complaint was for discoloured water (12 complaints). Discoloured
water can be attributed to a number of factors which could include a burst water main within the area, oxidised manganese or iron sediment or potentially from a customer’s internal plumbing.
Taste and odour was the other major water quality complaint for LMW over the reporting period (8 complaints). Occasionally a high algae count in the river system may result in the presence of taste and odour compounds such as Geosmine and 2-methylisoborneol (MIB). Also, reduced water consumption and extended retention of water in the reticulation system “long age” and dead ends, may also contribute to imparting taste and odour to the water. However, LMW’s systematic mains cleaning program has assisted in improving the quality and reducing the number of complaints to a minimum.
During these periods, LMW undertakes additional treatment measures involving dosing of activated carbon to help absorb the taste and odour compounds. Whilst these compounds are not harmful at levels detected in drinking water, they do have a very low detection threshold.
WATER QUALITY C MPLAINTS
Water quality complaints
TYPE OF COMPLAINT
Discoloured waterTaste/odourBlue waterAir in waterAlleged IllnessOther
NO. OF COMPLAINTS
1280100
NO. OF COMPLAINTS PER 100 CUSTOMERS SUPPLIED
0.0360.02400.00300
Customer Satisfaction SurveyThis year a percentage of customers were again asked to complete the customer satisfaction survey. Questions related to customers satisfaction level water quality and service, sewerage service, ease of contact and overall satisfaction.
This year we saw an increase in satisfaction in several areas for the customer survey results across all sectors. We were very pleased to see ‘overall satisfaction’ levels had significantly increased in the rural sector, with 69.9% indicating we were meeting expectations.
We also saw an increase in overall customer satisfaction for our urban customers. Commercial customers indicated high levels of satisfaction for sewer services with 100% of customers surveyed stating they were satisfied, very satisfied or extremely satisfied and 91.7% indicating we were meeting expectations.
Overall we are very pleased with results this year with many areas showing improvements in satisfaction levels across the business.
Urban Customers
Urban Commercial Customers
TOPICOverall SatisfactionWater QualitySewerageEase of Contact
TOPICOverall SatisfactionWater QualitySewerage
201593.40%91.50%93.80%90.90%
201593.60%90.10%100.00%
201488.80%92.17%97.92%99.08%
201493.90%96.20%97.20%
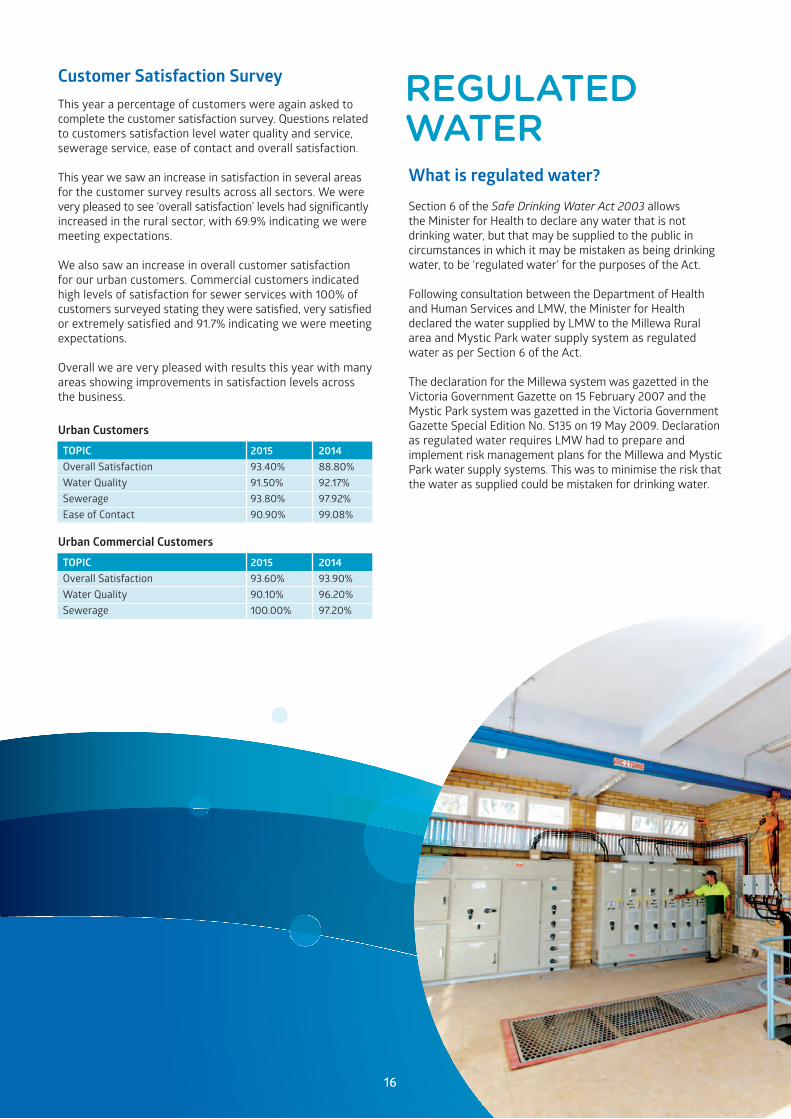
What is regulated water?
Section 6 of the Safe Drinking Water Act 2003 allows the Minister for Health to declare any water that is not drinking water, but that may be supplied to the public in circumstances in which it may be mistaken as being drinking water, to be ‘regulated water’ for the purposes of the Act.
Following consultation between the Department of Health and Human Services and LMW, the Minister for Health declared the water supplied by LMW to the Millewa Rural area and Mystic Park water supply system as regulated water as per Section 6 of the Act.
The declaration for the Millewa system was gazetted in the Victoria Government Gazette on 15 February 2007 and the Mystic Park system was gazetted in the Victoria Government Gazette Special Edition No. S135 on 19 May 2009. Declaration as regulated water requires LMW had to prepare and implement risk management plans for the Millewa and Mystic Park water supply systems. This was to minimise the risk that the water as supplied could be mistaken for drinking water.
REGULATED WATER
16

Lower Murray Water’s regulated water supplies Millewa water supply system
This is a non-potable water system that supplies an area which includes the towns of Meringur, Werrimull and Cullulleraine and also the surrounding rural properties in the Millewa district. The water is sourced from Lake Cullulleraine, which is filled directly from the Murray River via an earthen channel.
The water supply system is primarily a domestic and stock water supply to dry-land farmers in the Millewa area located to the west of Mildura. Previously, the water from Lake Cullulleraine (fed from the Murray River) had been chlorinated as it was pumped into the system to control the nuisance growth Plumatella, which if allowed to become established within a pipeline system can cause severe ongoing operational problems. However, in 2013, LMW commissioned a Water Quality Plant at Lake Cullulleraine. The plant has improved water quality; provides clearer water for domestic uses such as washing and farmers also benefit with a reduction in the impact on spraying equipment.
The treatment plant comprises two large lagoons that alternate as storages for removing turbidity. Aluminium sulphate is used to aid in the precipitation of the suspended matter.
Clarified water is chlorinated whilst gravitating into a clear water storage tank from which it is pumped into the Bambill water storage dam, or into the Cullulleraine reticulation system.
The storage dam at Bambill is 182ML earthen water storage within the Millewa system, located at Bambill South which supplies operating head for the system when the treated water pumps are not operating.
The dry-land area serviced by the Millewa supply covers an area of approximately 243,500 hectares.
Mystic Park water supply system
This is a non-potable water system supplying the small township of Mystic Park which is located to the south of Swan Hill. In May 2008, LMW assumed responsibility for the Mystic Park untreated water supply, previously the responsibility of the Gannawarra Shire Council.
The water is sourced from nearby Kangaroo Lake, before being screened and pumped to an earthen dam at the township. A small amount of coagulant is added as the water enters the dam. This dam provides some detention time assisting in the reduction of turbidity in the water, however no disinfection is provided.
17

18
Audit process During the reporting period LMW was not required to undertake an external audit of their risk management plan pursuant to the Safe Drinking Water Act 2003.
For further information regarding water quality information, please contact LMW directly on (03) 5051 3400 during business hours or via our website at lmw.vic.gov.au
Section 18 & 22 reporting Under the Safe Drinking Water Act 2003, the Department of Health and Human Services must be notified of circumstances where drinking water supplied to the public does not comply or is not likely to comply with any relevant water quality standard, or where drinking water is supplied such that it may pose a risk to human health or cause widespread public complaint.
Section 18 applies where a physical or chemical water quality standard has not been met such as turbidity. The report must occur within ten days of the non-compliance being identified. Section 22 applies where the belief is formed that drinking water may not be safe for drinking or pose a health risk to customers, in such case notification to the Department of Health and Human Services must be immediate, as an example of such risk would be E. coli. detection.
Reportable incidents 2014/15LMW is pleased to report that during the 2014/15 financial year, there were no incidents that required reporting under Section 18 or 22 of the Safe Drinking Water Act 2003.
Undertakings under Section 30
During the 2014/15 financial year LMW did not have any undertakings in place with the Department of Health and Human Services, pursuant to Section 30 of the Safe Drinking Water Act 2003.
Staff trainingAll water treatment plant operators at LMW have achieved Certificate III qualifications in water industry operations, apart from two newly appointed operators. These operators are currently undertaking this training. In addition, operational staff attend industry group meetings and industry seminars to stay aware of industry issues.
Emergency management training
During the 2014/15 financial year, LMW reviewed its emergency management procedures and undertook its annual emergency exercise in accordance with Part 6 of the Terrorism (Community Protection) Act 2003.
EMERGENCY MANAGEMENT
RISK MANAGEMENT PLAN AUDIT FINDINGS
FURTHER INFORMATION

19
APPENDIX A – Water Quality Tables All samples were taken in reticulations unless otherwise noted.
Tables 1 to 7 contain results reporting against the standards listed in Schedule 2 of the Safe Drinking Water Regulations 2005.
Table 1 Escherichia coli (E. coli)Standard: At least 98% of all samples of drinking water collected in any 12 month period to contain no E.coli per 100 mL
Table 2 Chloroacetic AcidStandard: 0.15 mg/L
Water SamplingLocalityIrympleKerangKoondrookLake BogaMerbeinMilduraMurrabitNyahNyah WestPiangilRed CliffsRobinvaleSwan HillWoorinen South
No. of Samples
5252525352117*52535353525367*53
Sampling FrequencyWeeklyWeeklyWeeklyWeeklyWeeklyWeeklyWeeklyWeeklyWeeklyWeeklyWeeklyWeeklyWeeklyWeekly
No. of samples containing E. coli00000000000000
% samples with no E. coli100100100100100100100100100100100100100100
Complying(Yes/No)YesYesYesYesYesYesYesYesYesYesYesYesYesYes
Maximum result(orgs/100mL)00000000000000
• *AdditionalnumberofsamplesweretakenforMildura&SwanHillduetothelargerpopulationsservicedbythesesupplies.• E.coli testing was not conducted on 23 June for Mildura, Red Cliffs, Merbein and Irymple due to a contractor error.
2014/15
Water SamplingLocalityIrympleKerangKoondrookLake BogaMerbeinMilduraMurrabitNyahNyah WestPiangilRed CliffsRobinvaleSwan HillWoorinen South
No. of Samples
1212121212121212121212121212
Sampling FrequencyMonthlyMonthlyMonthlyMonthlyMonthlyMonthlyMonthlyMonthlyMonthlyMonthlyMonthlyMonthlyMonthlyMonthly
No. Non-ComplyingSamples00000000000000
Minmg/L<0.005<0.005<0.005<0.005<0.005<0.005<0.005<0.005<0.005<0.005<0.005<0.005<0.005<0.005
Complying(Yes/No)YesYesYesYesYesYesYesYesYesYesYesYesYesYes
Maxmg/L<0.005<0.005<0.005<0.005<0.005<0.005<0.005<0.005<0.005<0.005<0.005<0.005<0.005<0.005
2014/15
Table 3 Dichloroacetic AcidStandard: 0.1 mg/L
Water SamplingLocalityIrympleKerangKoondrookLake BogaMerbeinMilduraMurrabitNyahNyah WestPiangilRed CliffsRobinvaleSwan HillWoorinen South
No. of Samples
1212121212121212121212121212
Sampling FrequencyMonthlyMonthlyMonthlyMonthlyMonthlyMonthlyMonthlyMonthlyMonthlyMonthlyMonthlyMonthlyMonthlyMonthly
No. Non-ComplyingSamples00000000000000
Minmg/L<0.0050.005<0.0050.008<0.005<0.0050.0060.0070.0050.006<0.0050.006<0.005<0.005
Complying(Yes/No)YesYesYesYesYesYesYesYesYesYesYesYesYesYes
Maxmg/L0.0140.0180.0220.0240.0250.0120.0130.0170.0150.0200.0180.0200.0180.018
2014/15

20
Table 4 Trichloroacetic AcidStandard: 0.1 mg/L
Water SamplingLocalityIrympleKerangKoondrookLake BogaMerbeinMilduraMurrabitNyahNyah WestPiangilRed CliffsRobinvaleSwan HillWoorinen South
1212121212121212121212121212
Sampling FrequencyMonthlyMonthlyMonthlyMonthlyMonthlyMonthlyMonthlyMonthlyMonthlyMonthlyMonthlyMonthlyMonthlyMonthly
No. Non-ComplyingSamples00000000000000
Minmg/L<0.005<0.0050.0060.007<0.005<0.0050.0050.010.0080.006<0.0050.005<0.0050.005
Complying(Yes/No)YesYesYesYesYesYesYesYesYesYesYesYesYesYes
Maxmg/L0.0140.0200.0290.0450.0200.0090.0140.0450.0370.0160.0160.0220.0210.030
2014/15
Table 5 TrihalomethanesStandard: 0.25 mg/L
Table 6 AluminiumStandard: 0.2 mg/L (acid soluble)
Water Sampling LocalityIrympleKerangKoondrookLake BogaMerbeinMilduraMurrabitNyahNyah WestPiangilRed CliffsRobinvaleSwan HillWoorinen South
No. of Samples
1212121212121212121212121212
Sampling FrequencyMonthlyMonthlyMonthlyMonthlyMonthlyMonthlyMonthlyMonthlyMonthlyMonthlyMonthlyMonthlyMonthlyMonthly
No. Non-ComplyingSamples00000000000000
Minmg/L0.0190.0170.0180.030.030.0160.0220.0380.0330.0240.0270.0190.0110.024
Complying(Yes/No)YesYesYesYesYesYesYesYesYesYesYesYesYesYes
Maxmg/L0.0550.0540.0520.0900.0590.0450.0400.0880.0750.0440.0530.0550.0670.073
2014/15
Water Sampling LocalityIrympleKerangKoondrookLake BogaMerbeinMilduraMurrabitNyahNyah WestPiangilRed CliffsRobinvaleSwan HillWoorinen South
No. of Samples
1212121212121212121212121212
Sampling FrequencyMonthlyMonthlyMonthlyMonthlyMonthlyMonthlyMonthlyMonthlyMonthlyMonthlyMonthlyMonthlyMonthlyMonthly
No. Non-ComplyingSamples00000000000000
Minmg/L0.010.01<0.01<0.01<0.01<0.01<0.01<0.01<0.01<0.01<0.01<0.01<0.01<0.01
Complying(Yes/No)YesYesYesYesYesYesYesYesYesYesYesYesYesYes
Maxmg/L0.080.070.060.020.060.160.030.010.020.060.050.010.020.02
2014/15
APPENDIX A – Water Quality Tables Cont'd...

21
Table 7 TurbidityStandard: 95 percent upper confidence limit of the mean of drinking water samples collected in the preceding 12 months must be ≤5.0 NTU
Water Sampling LocalityIrympleKerangKoondrookLake BogaMerbeinMilduraMurrabitNyahNyah WestPiangilRed CliffsRobinvaleSwan HillWoorinen South
No. of Samples
5251525352525253535352535353
Sampling FrequencyWeeklyWeeklyWeeklyWeeklyWeeklyWeeklyWeeklyWeeklyWeeklyWeeklyWeeklyWeeklyWeeklyWeekly
No. Non-ComplyingSamples00000000000000
95% upper confidence limit of the mean (NTU)0.30.20.20.20.20.40.30.20.20.20.50.30.20.2
Complying(Yes/No)YesYesYesYesYesYesYesYesYesYesYesYesYesYes
Max(NTU2.10.50.71.71.21.71.30.91.21.33.61.61.60.4
2014/15
Table 8 FluorideADWG guideline value: all individual sample results to be less than or equal to 1.5mg/L Meeting obligation means the annual average concentration of fluoride is greater than 0.6mg/L.
• Tables9to38inclusiveareresultsreportingagainsttheAustralian Drinking Water Guidelines 2011 (ADWG), health related & aesthetic guideline values. • Thefieldswithoutdataarelocalitiesthataresuppliedfromatreatmentplantremotefromthelocality,e.g.Irymple&MerbeinaresuppliedfromtheMilduraWTP.• Tables9to20&35to41,inclusive,areenteringreticulationsamplesatthetreatmentplants,theseareindicativeofthelevelswithintherespectivereticulations.• Tables9to16inclusivehave4samplesreportedforMildurasupplyasboththeMildura&MilduraWestWTP'swereoperatingsimultaneouslyforboththe6monthly sampling events. • Tables17to20&35to41have8samplesreportedfortheMildurasupplyasboththeMildura&MilduraWestWTP'swereoperatingsimultaneouslyforallofthe quarterly sampling events.• FlouridetestingwasnotconductedinAugust2014forNyahduetoacontractorerror.
• Turbiditytestingwasnotconductedon22AprilforKerangduetoacontractorerror.• Turbiditytestingwasnotconductedon23JuneforMildura,RedCliffs,MerbeinandIrympleduetoacontractorerror.
Water Sampling Locality
IrympleKerangKoondrookLake BogaMerbeinMilduraMurrabitNyahNyah WestPiangilRed CliffsRobinvaleSwan HillWoorinen South
No. of Samples
1212
121212
1112
12121212
Sampling Frequency
MonthlyMonthly
MonthlyMonthlyMonthly
MonthlyMonthly
MonthlyMonthlyMonthlyMonthly
Operation Targetmg/L
0.80.8
0.80.80.8
0.80.8
0.80.80.80.8
Averagemg/L
0.410.30
0.540.520.48
0.500.51
0.320.750.520.54
Meeting Obligation(Yes/No)NoNo
NoNoNo
NoNo
NoYesNoNo
Met ADWG guideline value(Yes/No)YesYes
YesYesYes
YesYes
YesYesYesYes
Maxmg/L
0.750.66
0.80.680.76
0.790.74
0.780.840.80.78
Minmg/L
0.06<0.05
0.070.150.08
0.080.06
<0.050.65<0.050.15
2014/15

22
APPENDIX A – Water Quality Tables Cont'd...
Table 9 2.4D (2,4 Diclorophenoxy acetic acid)Health Related Guideline Value: 0.03 mg/L
Table 10 BenzeneHealth Related Guideline Value: 0.001 mg/L
Water Sampling LocalityIrympleKerangKoondrookLake BogaMerbeinMilduraMurrabitNyahNyah WestPiangilRed CliffsRobinvaleSwan HillWoorinen South
No. of Samples
22
42
2222
Sampling Frequency
6 Monthly6 Monthly
6 Monthly6 Monthly
6 Monthly6 Monthly6 Monthly6 Monthly
Minmg/L
<0.01<0.01
<0.01<0.01
<0.01<0.01<0.01<0.01
Met ADWG guideline value(Yes/No)
YesYes
YesYes
YesYesYesYes
Maxmg/L
<0.01<0.01
<0.01<0.01
<0.01<0.01<0.01<0.01
2014/15
Water Sampling LocalityIrympleKerangKoondrookLake BogaMerbeinMilduraMurrabitNyahNyah WestPiangilRed CliffsRobinvaleSwan HillWoorinen South
No. of Samples
22
42
2222
Sampling Frequency
6 Monthly6 Monthly
6 Monthly6 Monthly
6 Monthly6 Monthly6 Monthly6 Monthly
Minmg/L
<0.001<0.001
<0.001<0.001
<0.001<0.001<0.001<0.001
Met ADWG guideline value(Yes/No)
YesYes
YesYes
YesYesYesYes
Maxmg/L
<0.001<0.001
<0.001<0.001
<0.001<0.001<0.001<0.001
2014/15
Table 11 Carbon tetrachlorideHealth Related Guideline Value: 0.003 mg/L
Water Sampling LocalityIrympleKerangKoondrookLake BogaMerbeinMilduraMurrabitNyahNyah WestPiangilRed CliffsRobinvaleSwan HillWoorinen South
No. of Samples
22
42
2222
Sampling Frequency
6 Monthly6 Monthly
6 Monthly6 Monthly
6 Monthly6 Monthly6 Monthly6 Monthly
Minmg/L
<0.001<0.001
<0.001<0.001
<0.001<0.001<0.001<0.001
Met ADWG guideline value(Yes/No)
YesYes
YesYes
YesYesYesYes
Maxmg/L
<0.001<0.001
<0.001<0.001
<0.001<0.001<0.001<0.001
2014/15

23
Table 12 1,2 DichloroethaneHealth Related Guideline Value: 0.003 mg/L
Water Sampling LocalityIrympleKerangKoondrookLake BogaMerbeinMilduraMurrabitNyahNyah WestPiangilRed CliffsRobinvaleSwan HillWoorinen South
No. of Samples
22
42
2222
Sampling Frequency
6 Monthly6 Monthly
6 Monthly6 Monthly
6 Monthly6 Monthly6 Monthly6 Monthly
Minmg/L
<0.0001<0.0001
<0.0001<0.0001
<0.0001<0.0001<0.0001<0.0001
Met ADWG guideline value(Yes/No)
YesYes
YesYes
YesYesYesYes
Maxmg/L
<0.0001<0.0001
<0.001<0.0001
<0.001<0.001<0.0001<0.001
2014/15
Water Sampling LocalityIrympleKerangKoondrookLake BogaMerbeinMilduraMurrabitNyahNyah WestPiangilRed CliffsRobinvaleSwan HillWoorinen South
No. of Samples
22
42
2222
Sampling Frequency
6 Monthly6 Monthly
6 Monthly6 Monthly
6 Monthly6 Monthly6 Monthly6 Monthly
Minmg/L
<0.001<0.001
<0.001<0.001
<0.001<0.001<0.001<0.001
Met ADWG guideline value(Yes/No)
YesYes
YesYes
YesYesYesYes
Maxmg/L
<0.001<0.001
<0.001<0.001
<0.001<0.001<0.001<0.001
2014/15
Table 13 1,1 DichloroetheneHealth Related Guideline Value: 0.03 mg/L
Table 14 PentachlorophenolHealth Related Guideline Value: 0.01 mg/L

24
APPENDIX A – Water Quality Tables Cont'd...
Table 15 TetrachloroetheneHealth Related Guideline Value: 0.05 mg/L
Water Sampling LocalityIrympleKerangKoondrookLake BogaMerbeinMilduraMurrabitNyahNyah WestPiangilRed CliffsRobinvaleSwan HillWoorinen South
No. of Samples
22
42
2222
Sampling Frequency
6 Monthly6 Monthly
6 Monthly6 Monthly
6 Monthly6 Monthly6 Monthly6 Monthly
Minmg/L
<0.001<0.001
<0.001<0.001
<0.001<0.001<0.001<0.001
Met ADWG guideline value(Yes/No)
YesYes
YesYes
YesYesYesYes
Maxmg/L
<0.001<0.001
<0.001<0.001
<0.001<0.001<0.001<0.001
2014/15
Table 16 2,4,6 TrichlorophenolHealth Related Guideline Value: 0.02 mg/L
Water Sampling LocalityIrympleKerangKoondrookLake BogaMerbeinMilduraMurrabitNyahNyah WestPiangilRed CliffsRobinvaleSwan HillWoorinen South
No. of Samples
22
42
2222
6 Monthly6 Monthly
6 Monthly6 Monthly
6 Monthly6 Monthly6 Monthly6 Monthly
Minmg/L
<0.001<0.001
<0.001<0.001
<0.001<0.001<0.001<0.001
Met ADWG guideline value(Yes/No)
YesYes
YesYes
YesYesYesYes
Maxmg/L
<0.001<0.001
<0.001<0.001
<0.001<0.001<0.001<0.001
2014/15
Table 17 SulphateHealth Related Guideline Value: 500mg/L
Water Sampling LocalityIrympleKerangKoondrookLake BogaMerbeinMilduraMurrabitNyahNyah WestPiangilRed CliffsRobinvaleSwan HillWoorinen South
No. of Samples
44
84
4444
Sampling Frequency
QuarterlyQuarterly
QuarterlyQuarterly
QuarterlyQuarterlyQuarterlyQuarterly
Minmg/L
229
172
1520172
Met ADWG guideline value(Yes/No)
YesYes
YesYes
YesYesYesYes
Maxmg/L
4017
2872
2927274
2014/15
25
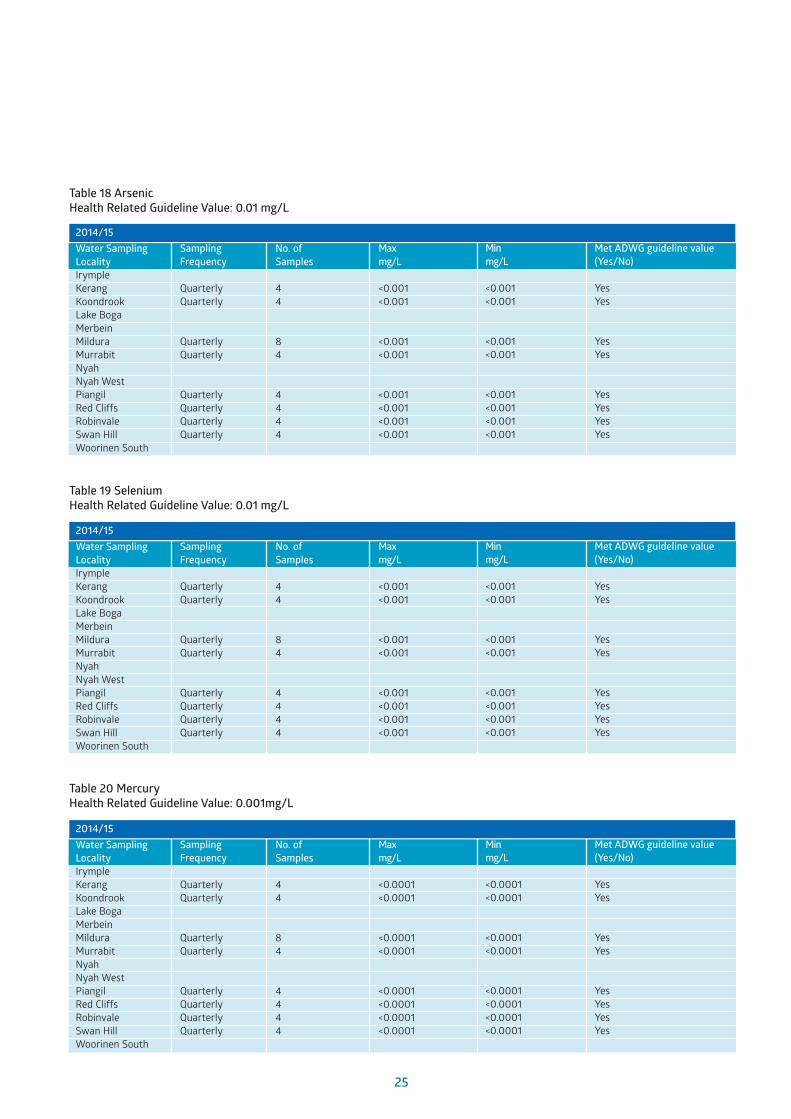
Table 18 ArsenicHealth Related Guideline Value: 0.01 mg/L
Water Sampling LocalityIrympleKerangKoondrookLake BogaMerbeinMilduraMurrabitNyahNyah WestPiangilRed CliffsRobinvaleSwan HillWoorinen South
No. of Samples
44
84
4444
Sampling Frequency
QuarterlyQuarterly
QuarterlyQuarterly
QuarterlyQuarterlyQuarterlyQuarterly
Minmg/L
<0.001<0.001
<0.001<0.001
<0.001<0.001<0.001<0.001
Met ADWG guideline value(Yes/No)
YesYes
YesYes
YesYesYesYes
Maxmg/L
<0.001<0.001
<0.001<0.001
<0.001<0.001<0.001<0.001
2014/15
Table 19 SeleniumHealth Related Guideline Value: 0.01 mg/L
Table 20 MercuryHealth Related Guideline Value: 0.001mg/L
Water Sampling LocalityIrympleKerangKoondrookLake BogaMerbeinMilduraMurrabitNyahNyah WestPiangilRed CliffsRobinvaleSwan HillWoorinen South
No. of Samples
44
84
4444
Sampling Frequency
QuarterlyQuarterly
QuarterlyQuarterly
QuarterlyQuarterlyQuarterlyQuarterly
Minmg/L
<0.0001<0.0001
<0.0001<0.0001
<0.0001<0.0001<0.0001<0.0001
Met ADWG guideline value(Yes/No)
YesYes
YesYes
YesYesYesYes
Maxmg/L
<0.0001<0.0001
<0.0001<0.0001
<0.0001<0.0001<0.0001<0.0001
2014/15
Water Sampling LocalityIrympleKerangKoondrookLake BogaMerbeinMilduraMurrabitNyahNyah WestPiangilRed CliffsRobinvaleSwan HillWoorinen South
No. of Samples
44
84
4444
Sampling Frequency
QuarterlyQuarterly
QuarterlyQuarterly
QuarterlyQuarterlyQuarterlyQuarterly
Minmg/L
<0.001<0.001
<0.001<0.001
<0.001<0.001<0.001<0.001
Met ADWG guideline value(Yes/No)
YesYes
YesYes
YesYesYesYes
Maxmg/L
<0.001<0.001
<0.001<0.001
<0.001<0.001<0.001<0.001
2014/15

26
APPENDIX A – Water Quality Tables Cont'd...
Table 21 Gross Alpha ActivityGuideline Value: 0.1 Bq/L
Table 22 Gross Beta ActivityGuideline Value: 0.5 Bq/L
Water Sampling LocalityIrympleKerangKoondrookLake BogaMerbeinMilduraMurrabitNyahNyah WestPiangilRed CliffsRobinvaleSwan HillWoorinen South
No. of Samples
11
11
1111
Sampling Frequency
5 yearly5 yearly
5 yearly5 yearly
5 yearly5 yearly5 yearly5 yearly
Minmg/L
<0.071<0.071
<0.065<0.065
<0.071<0.071<0.071<0.065
Met ADWG guideline value(Yes/No)
YesYes
YesYes
YesYesYesYes
Maxmg/L
<0.071<0.071
<0.065<0.065
<0.071<0.071<0.071<0.065
2010/2011 results, samples are taken every 5 years
Water Sampling LocalityIrympleKerangKoondrookLake BogaMerbeinMilduraMurrabitNyahNyah WestPiangilRed CliffsRobinvaleSwan HillWoorinen South
No. of Samples
11
11
1111
Sampling Frequency
5 yearly5 yearly
5 yearly5 yearly
5 yearly5 yearly5 yearly5 yearly
Minmg/L
<0.015<0.015
<0.018<0.018
0.018<0.015<0.015<0.018
Met ADWG guideline value(Yes/No)
YesYes
YesYes
YesYesYesYes
Maxmg/L
<0.015<0.015
<0.018<0.018
0.018<0.015<0.015<0.018
2010/2011 results, samples are taken every 5 years
Table 23 LeadHealth Related Guideline Value: 0.01mg/L
Water Sampling LocalityIrympleKerangKoondrookLake BogaMerbeinMilduraMurrabitNyahNyah WestPiangilRed CliffsRobinvaleSwan HillWoorinen South
No. of Samples44444444444444
Sampling FrequencyQuarterlyQuarterlyQuarterlyQuarterlyQuarterlyQuarterlyQuarterlyQuarterlyQuarterlyQuarterlyQuarterlyQuarterlyQuarterlyQuarterly
Minmg/L<0.001<0.001<0.001<0.001<0.001<0.001<0.001<0.001<0.001<0.001<0.001<0.001<0.001<0.001
Met ADWG guideline value(Yes/No)YesYesYesYesYesYesYesYesYesYesYesYesYesYes
Maxmg/L<0.001<0.001<0.001<0.001<0.001<0.001<0.001<0.0010.001<0.001<0.001<0.0010.002<0.001
2014/15
27
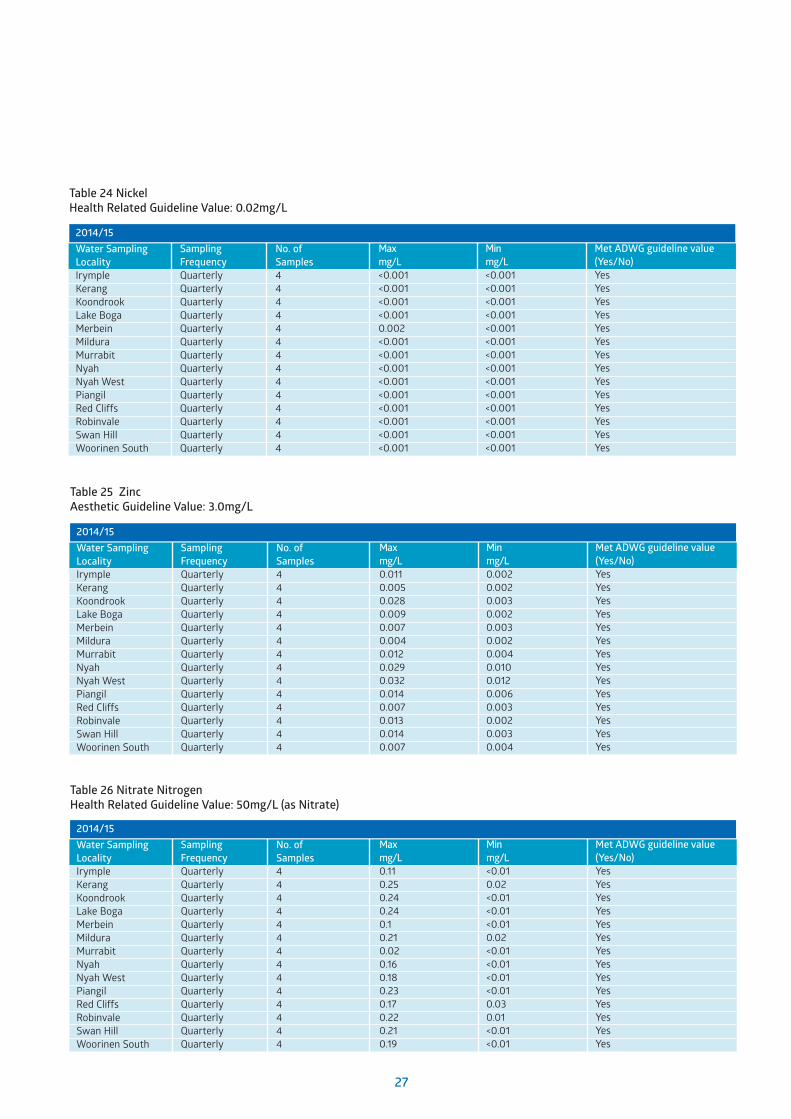
Table 24 NickelHealth Related Guideline Value: 0.02mg/L
Table 25 ZincAesthetic Guideline Value: 3.0mg/L
Table 26 Nitrate NitrogenHealth Related Guideline Value: 50mg/L (as Nitrate)
Water Sampling LocalityIrympleKerangKoondrookLake BogaMerbeinMilduraMurrabitNyahNyah WestPiangilRed CliffsRobinvaleSwan HillWoorinen South
No. of Samples44444444444444
Sampling FrequencyQuarterlyQuarterlyQuarterlyQuarterlyQuarterlyQuarterlyQuarterlyQuarterlyQuarterlyQuarterlyQuarterlyQuarterlyQuarterlyQuarterly
Minmg/L0.0020.0020.0030.0020.0030.0020.0040.0100.0120.0060.0030.0020.0030.004
Met ADWG guideline value(Yes/No)YesYesYesYesYesYesYesYesYesYesYesYesYesYes
Maxmg/L0.0110.0050.0280.0090.0070.0040.0120.0290.0320.0140.0070.0130.0140.007
2014/15
Water Sampling LocalityIrympleKerangKoondrookLake BogaMerbeinMilduraMurrabitNyahNyah WestPiangilRed CliffsRobinvaleSwan HillWoorinen South
No. of Samples44444444444444
Sampling FrequencyQuarterlyQuarterlyQuarterlyQuarterlyQuarterlyQuarterlyQuarterlyQuarterlyQuarterlyQuarterlyQuarterlyQuarterlyQuarterlyQuarterly
Minmg/L<0.001<0.001<0.001<0.001<0.001<0.001<0.001<0.001<0.001<0.001<0.001<0.001<0.001<0.001
Met ADWG guideline value(Yes/No)YesYesYesYesYesYesYesYesYesYesYesYesYesYes
Maxmg/L<0.001<0.001<0.001<0.0010.002<0.001<0.001<0.001<0.001<0.001<0.001<0.001<0.001<0.001
2014/15
Water Sampling LocalityIrympleKerangKoondrookLake BogaMerbeinMilduraMurrabitNyahNyah WestPiangilRed CliffsRobinvaleSwan HillWoorinen South
No. of Samples44444444444444
Sampling FrequencyQuarterlyQuarterlyQuarterlyQuarterlyQuarterlyQuarterlyQuarterlyQuarterlyQuarterlyQuarterlyQuarterlyQuarterlyQuarterlyQuarterly
Minmg/L<0.010.02<0.01<0.01<0.010.02<0.01<0.01<0.01<0.010.030.01<0.01<0.01
Met ADWG guideline value(Yes/No)YesYesYesYesYesYesYesYesYesYesYesYesYesYes
Maxmg/L0.110.250.240.240.10.210.020.160.180.230.170.220.210.19
2014/15

28
APPENDIX A – Water Quality Tables Cont'd...
Table 27 CyanideHealth Related Guideline Value: 0.08mg/L
Water Sampling LocalityIrympleKerangKoondrookLake BogaMerbeinMilduraMurrabitNyahNyah WestPiangilRed CliffsRobinvaleSwan HillWoorinen South
No. of Samples44444444444444
Sampling FrequencyQuarterlyQuarterlyQuarterlyQuarterlyQuarterlyQuarterlyQuarterlyQuarterlyQuarterlyQuarterlyQuarterlyQuarterlyQuarterlyQuarterly
Minmg/L<0.005<0.005<0.005<0.005<0.005<0.005<0.005<0.005<0.005<0.005<0.005<0.005<0.005<0.005
Met ADWG guideline value(Yes/No)YesYesYesYesYesYesYesYesYesYesYesYesYesYes
Maxmg/L<0.005<0.005<0.005<0.005<0.005<0.005<0.005<0.005<0.005<0.005<0.005<0.005<0.005<0.005
2014/15
Table 28 ChromiumHealth Related Guideline Value: 0.05mg/L
Water Sampling LocalityIrympleKerangKoondrookLake BogaMerbeinMilduraMurrabitNyahNyah WestPiangilRed CliffsRobinvaleSwan HillWoorinen South
No. of Samples44444444444444
Sampling FrequencyQuarterlyQuarterlyQuarterlyQuarterlyQuarterlyQuarterlyQuarterlyQuarterlyQuarterlyQuarterlyQuarterlyQuarterlyQuarterlyQuarterly
Minmg/L<0.001<0.001<0.001<0.001<0.001<0.001<0.001<0.001<0.001<0.001<0.001<0.001<0.001<0.001
Met ADWG guideline value(Yes/No)YesYesYesYesYesYesYesYesYesYesYesYesYesYes
Maxmg/L<0.001<0.001<0.001<0.001<0.001<0.001<0.001<0.001<0.001<0.001<0.001<0.001<0.001<0.001
2014/15
Table 29 CadmiumHealth Related Guideline Value: 0.002mg/L
Water Sampling LocalityIrympleKerangKoondrookLake BogaMerbeinMilduraMurrabitNyahNyah WestPiangilRed CliffsRobinvaleSwan HillWoorinen South
No. of Samples44444444444444
Sampling FrequencyQuarterlyQuarterlyQuarterlyQuarterlyQuarterlyQuarterlyQuarterlyQuarterlyQuarterlyQuarterlyQuarterlyQuarterlyQuarterlyQuarterly
Minmg/L<0.0002<0.0002<0.0002<0.0002<0.0002<0.0002<0.0002<0.0002<0.0002<0.0002<0.0002<0.0002<0.0002<0.0002
Met ADWG guideline value(Yes/No)YesYesYesYesYesYesYesYesYesYesYesYesYesYes
Maxmg/L<0.0002<0.0002<0.0002<0.0002<0.0002<0.0002<0.0002<0.0002<0.0002<0.0002<0.0002<0.0002<0.0002<0.0002
2014/15
29
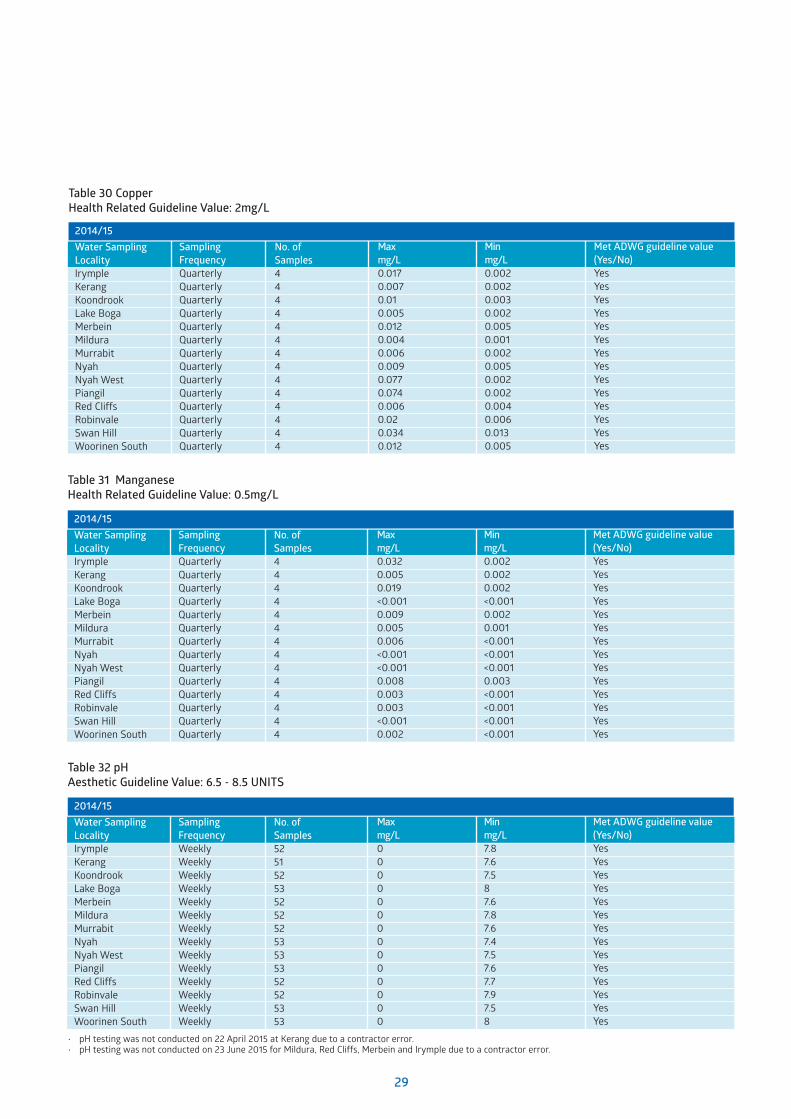
Table 30 CopperHealth Related Guideline Value: 2mg/L
Water Sampling LocalityIrympleKerangKoondrookLake BogaMerbeinMilduraMurrabitNyahNyah WestPiangilRed CliffsRobinvaleSwan HillWoorinen South
No. of Samples44444444444444
Sampling FrequencyQuarterlyQuarterlyQuarterlyQuarterlyQuarterlyQuarterlyQuarterlyQuarterlyQuarterlyQuarterlyQuarterlyQuarterlyQuarterlyQuarterly
Minmg/L0.0020.0020.0030.0020.0050.0010.0020.0050.0020.0020.0040.0060.0130.005
Met ADWG guideline value(Yes/No)YesYesYesYesYesYesYesYesYesYesYesYesYesYes
Maxmg/L0.0170.0070.010.0050.0120.0040.0060.0090.0770.0740.0060.020.0340.012
2014/15
Table 31 ManganeseHealth Related Guideline Value: 0.5mg/L
Table 32 pHAesthetic Guideline Value: 6.5 - 8.5 UNITS
Water Sampling LocalityIrympleKerangKoondrookLake BogaMerbeinMilduraMurrabitNyahNyah WestPiangilRed CliffsRobinvaleSwan HillWoorinen South
No. of Samples44444444444444
Sampling FrequencyQuarterlyQuarterlyQuarterlyQuarterlyQuarterlyQuarterlyQuarterlyQuarterlyQuarterlyQuarterlyQuarterlyQuarterlyQuarterlyQuarterly
Minmg/L0.0020.0020.002<0.0010.0020.001<0.001<0.001<0.0010.003<0.001<0.001<0.001<0.001
Met ADWG guideline value(Yes/No)YesYesYesYesYesYesYesYesYesYesYesYesYesYes
Maxmg/L0.0320.0050.019<0.0010.0090.0050.006<0.001<0.0010.0080.0030.003<0.0010.002
2014/15
Water Sampling LocalityIrympleKerangKoondrookLake BogaMerbeinMilduraMurrabitNyahNyah WestPiangilRed CliffsRobinvaleSwan HillWoorinen South
No. of Samples5251525352525253535352525353
Sampling FrequencyWeeklyWeeklyWeeklyWeeklyWeeklyWeeklyWeeklyWeeklyWeeklyWeeklyWeeklyWeeklyWeeklyWeekly
Minmg/L7.87.67.587.67.87.67.47.57.67.77.97.58
Met ADWG guideline value(Yes/No)YesYesYesYesYesYesYesYesYesYesYesYesYesYes
Maxmg/L00000000000000
2014/15
• pHtestingwasnotconductedon22April2015atKerangduetoacontractorerror.• pHtestingwasnotconductedon23June2015forMildura,RedCliffs,MerbeinandIrympleduetoacontractorerror.

30
APPENDIX A – Water Quality Tables Cont'd...
Table 33 ColourAesthetic Guideline Value: 15 HU
Table 34 IronAesthetic Guideline Value: 0.3mg/L
Water Sampling LocalityIrympleKerangKoondrookLake BogaMerbeinMilduraMurrabitNyahNyah WestPiangilRed CliffsRobinvaleSwan HillWoorinen South
No. of Samples1212121212121212121212121212
Sampling FrequencyMonthlyMonthlyMonthlyMonthlyMonthlyMonthlyMonthlyMonthlyMonthlyMonthlyMonthlyMonthlyMonthlyMonthly
Minmg/L<2<2<2<2<2<2<2<2<2<2<2<2<2<2
Met ADWG guideline value(Yes/No)YesYesYesYesYesYesYesYesYesYesYesYesYesYes
Maxmg/L42222222422222
2014/15
Water Sampling LocalityIrympleKerangKoondrookLake BogaMerbeinMilduraMurrabitNyahNyah WestPiangilRed CliffsRobinvaleSwan HillWoorinen South
No. of Samples44444444444444
Sampling FrequencyQuarterlyQuarterlyQuarterlyQuarterlyQuarterlyQuarterlyQuarterlyQuarterlyQuarterlyQuarterlyQuarterlyQuarterlyQuarterlyQuarterly
Minmg/L0.010.01<0.01<0.01<0.01<0.01<0.01<0.01<0.01<0.01<0.01<0.01<0.01<0.01
Met ADWG guideline value(Yes/No)YesYesYesYesYesYesYesYesYesYesYesYesYesYes
Maxmg/L0.190.020.01<0.010.050.030.02<0.010.03<0.010.02<0.01<0.010.02
2014/15
Table 35 HardnessAesthetic Guideline Value: 200mg/L
Water Sampling LocalityIrympleKerangKoondrookLake BogaMerbeinMilduraMurrabitNyahNyah WestPiangilRed CliffsRobinvaleSwan HillWoorinen South
No. of Samples
44
84
4444
Sampling Frequency
QuarterlyQuarterly
QuarterlyQuarterly
QuarterlyQuarterlyQuarterlyQuarterly
Minmg/L
4517
2620
19262317
Met ADWG guideline value(Yes/No)
YesYes
YesYes
YesYesYesYes
Maxmg/L
6620
5228
26313027
2014/15
31
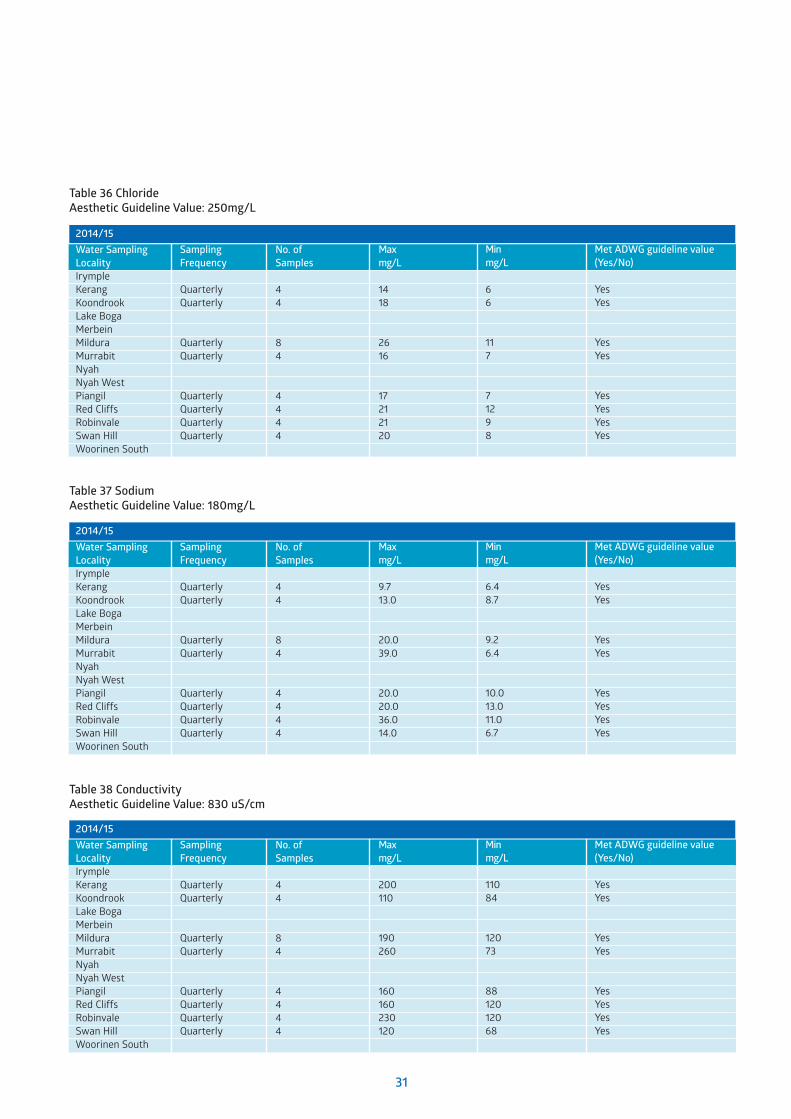
Table 36 ChlorideAesthetic Guideline Value: 250mg/L
Table 37 SodiumAesthetic Guideline Value: 180mg/L
Table 38 ConductivityAesthetic Guideline Value: 830 uS/cm
Water Sampling LocalityIrympleKerangKoondrookLake BogaMerbeinMilduraMurrabitNyahNyah WestPiangilRed CliffsRobinvaleSwan HillWoorinen South
No. of Samples
44
84
4444
Sampling Frequency
QuarterlyQuarterly
QuarterlyQuarterly
QuarterlyQuarterlyQuarterlyQuarterly
Minmg/L
66
117
71298
Met ADWG guideline value(Yes/No)
YesYes
YesYes
YesYesYesYes
Maxmg/L
1418
2616
17212120
2014/15
Water Sampling LocalityIrympleKerangKoondrookLake BogaMerbeinMilduraMurrabitNyahNyah WestPiangilRed CliffsRobinvaleSwan HillWoorinen South
No. of Samples
44
84
4444
Sampling Frequency
QuarterlyQuarterly
QuarterlyQuarterly
QuarterlyQuarterlyQuarterlyQuarterly
Minmg/L
11084
12073
8812012068
Met ADWG guideline value(Yes/No)
YesYes
YesYes
YesYesYesYes
Maxmg/L
200110
190260
160160230120
2014/15
Water Sampling LocalityIrympleKerangKoondrookLake BogaMerbeinMilduraMurrabitNyahNyah WestPiangilRed CliffsRobinvaleSwan HillWoorinen South
No. of Samples
44
84
4444
Sampling Frequency
QuarterlyQuarterly
QuarterlyQuarterly
QuarterlyQuarterlyQuarterlyQuarterly
Minmg/L
6.48.7
9.26.4
10.013.011.06.7
Met ADWG guideline value(Yes/No)
YesYes
YesYes
YesYesYesYes
Maxmg/L
9.713.0
20.039.0
20.020.036.014.0
2014/15
32
APPENDIX A – Water Quality Tables Cont'd...
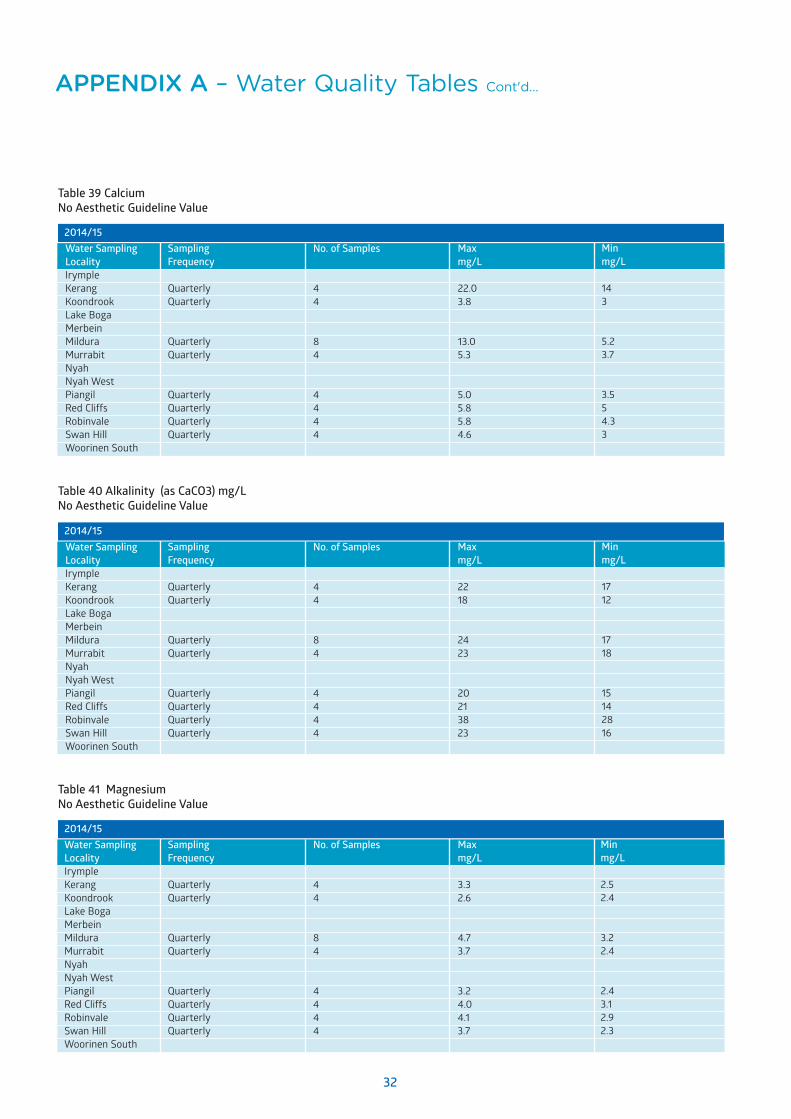
Table 39 CalciumNo Aesthetic Guideline Value
Table 40 Alkalinity (as CaCO3) mg/LNo Aesthetic Guideline Value
Water Sampling LocalityIrympleKerangKoondrookLake BogaMerbeinMilduraMurrabitNyahNyah WestPiangilRed CliffsRobinvaleSwan HillWoorinen South
No. of Samples
44
84
4444
Sampling Frequency
QuarterlyQuarterly
QuarterlyQuarterly
QuarterlyQuarterlyQuarterlyQuarterly
Minmg/L
143
5.23.7
3.554.33
Maxmg/L
22.03.8
13.05.3
5.05.85.84.6
2014/15
Water Sampling LocalityIrympleKerangKoondrookLake BogaMerbeinMilduraMurrabitNyahNyah WestPiangilRed CliffsRobinvaleSwan HillWoorinen South
No. of Samples
44
84
4444
Sampling Frequency
QuarterlyQuarterly
QuarterlyQuarterly
QuarterlyQuarterlyQuarterlyQuarterly
Minmg/L
1712
1718
15142816
Maxmg/L
2218
2423
20213823
2014/15
Table 41 MagnesiumNo Aesthetic Guideline Value
Water Sampling LocalityIrympleKerangKoondrookLake BogaMerbeinMilduraMurrabitNyahNyah WestPiangilRed CliffsRobinvaleSwan HillWoorinen South
No. of Samples
44
84
4444
Sampling Frequency
QuarterlyQuarterly
QuarterlyQuarterly
QuarterlyQuarterlyQuarterlyQuarterly
Minmg/L
2.52.4
3.22.4
2.43.12.92.3
Maxmg/L
3.32.6
4.73.7
3.24.04.13.7
2014/15


Visu
al S
trat
egy
Desig
n v
sdes
ign.
com
.au
LMW
018
Printed on 100% recycled paper.References to legal rights and responsibilities relate to the provisions of the Water Act 1989. The details in this brochure are current at 1 October 2015 but are subject to change without notice.
Swan Hill (Area Office)T 03 5036 215073 Beveridge Street
Swan Hill Victoria 3585PO Box 1447
Swan Hill Victoria 3585AUSDOC DX 30164
Kerang (Area Office)T 03 5450 396056 Wellington Street Kerang Victoria 3579
PO Box 547 Kerang Victoria 3579AUSDOC DX 57908
Mildura (Head Office)T 03 5051 3400
741-759 Fourteenth Street Mildura Victoria 3500
PO Box 1438 Mildura Victoria 3502
AUSDOC DX 50023
lmw.vic.g v.au
24 HOUR EMERGENCY SERVICE FOR URBAN AND IRRIGATION WATER, SEWERAGE, TRADE WASTE AND FARM DRAINAGE
1800 808 830
For further information please contact us at one of our offi ces.
03 5051 3400