Embed Size (px)
Citation preview

Annual Report for
AmBalanced31 July 2019

AmBalanced
TRUST DIRECTORY
Manager AmFunds Management Berhad
9th&10th Floor, Bangunan AmBank Group 55 Jalan Raja Chulan 50200 Kuala Lumpur
Board of Directors Jeyaratnam A/L Tamotharam Pillai
Dato’ Mustafa Bin Mohd Nor Tai Terk Lin
Sum Leng Kuang Seohan Soo
Goh Wee Peng
Investment Committee Sum Leng Kuang
Tai Terk Lin Dato’ Mustafa Bin Mohd Nor
Zainal Abidin Bin Mohd Kassim Goh Wee Peng
Trustee HSBC (Malaysia) Trustee Berhad
Auditors and Reporting Accountants Ernst & Young
Taxation Adviser Deloitte Tax Services Sdn Bhd

AmBalanced
CONTENTS
1 Manager’s Report
10 Independent Auditor’s Report to the Unitholders
14 Statement of Financial Position
15 Statement of Comprehensive Income
16 Statement of Changes in Equity
17 Statement of Cash Flows
18 Notes to the Financial Statements
48 Statement by the Manager
49 Trustee’s Report
50 Directory
1
MANAGER’S REPORT
Dear Unitholders,
We are pleased to present you the Manager’s report and the audited accounts of AmBalanced (“Fund”) for the financial year ended 31 July 2019.
Salient Information of the Fund
Name AmBalanced (“Fund”)
Category/ Type
Balanced / Growth
Objective AmBalanced aims to grow the value of investments in the long-term with lower volatility through asset diversification.
Note: Any material change to the investment objective of the Fund would require Unit Holder’s approval.
Duration The Fund was established on 16 September 2003 and shall exist for as long as it appears to the Manager and the Trustee that it is in the interests of the unitholders for it to continue. In some circumstances, the unitholders can resolve at a meeting to terminate the Fund.
Performance Benchmark
50% Medium MGS Index by Quantshop 50% FTSE Bursa Malaysia Top 100 Index (available at www.aminvest.com)
Source: FTSE International Limited ("FTSE") © FTSE 2019 . "FTSE®" is a trade mark of the London Stock Exchange Group companies and is used by FTSE International Limited under licence. "BURSA MALAYSIA" is a trade mark of Bursa Malaysia Berhad ("BURSA MALAYSIA"). All intellectual property rights in the index values and constituent list vests in FTSE and BURSA MALAYSIA. Neither FTSE nor its licensors accept any liability for any errors or omissions in the FTSE indices and / or FTSE ratings or underlying data. No further distribution of FTSE Data is permitted without FTSE’s express written consent.
Income Distribution Policy
Income distribution (if any) is incidental.
Breakdown of Unit Holdings by Size
For the financial year under review, the size of the Fund stood at 2,522,931 units.
Size of holding As at 31 July 2019 As at 31 July 2018
No of units held
Number of unitholders
No of units held
Number of unitholders
5,000 and below 79,414 39 83,856 41
5,001-10,000 106,912 16 164,623 24
10,001-50,000 482,860 24 572,109 28
50,001-500,000 195,259 3 208,081 3
500,001 and above 1,658,486 2 1,738,621 2
2
Fund Performance Data
Portfolio Composition
Details of portfolio composition of the Fund for the financial years as at 31 July are as follows:
FY 2019
%
FY 2018
%
FY 2017
%
Consumer discretionary 5.46 - -
Consumer staples 2.34 - -
Energy 6.03 - -
Financials 10.72 16.94 13.54
Health care 1.90 - -
Industrials 13.20 - -
Information technology 16.77 - -
Telecommunication services 1.67 - -
Utilities 2.99 - -
Local collective investment scheme 3.18 - -
Construction - 2.07 -
Consumer products - 4.50 2.73
Corporate bonds 9.52 27.31 21.82
Industrial products - 15.37 10.23
Properties - - 4.04
REITs - - 1.92
Technology - 11.72 13.09
Trading/Services - 15.15 15.90
Money market deposit 26.16 7.55 10.84
Cash and others 0.06 -0.61 5.89
Total 100.00 100.00 100.00
Note: The abovementioned percentages are calculated based on total net asset value.
Performance Details
Performance details of the Fund for the financial years ended 31 July are as follows:
FY 2019
FY 2018
FY 2017
Net asset value (RM)* 3,230,276 3,734,780 3,262,391
Units in circulation* 2,522,931 2,767,290 2,612,293
Net asset value per unit (RM)* 1.2804 1.3496 1.2489
Highest net asset value per unit (RM)* 1.3975 1.4152 1.2513
Lowest net asset value per unit (RM)* 1.2411 1.2281 1.0786
Benchmark performance (%) -1.42 2.98 5.03
Total return (%)(1) -5.13 8.06 14.40
- Capital growth (%) -5.13 8.06 14.40
- Income distribution (%) - - -
Gross distribution (sen per unit) - - -
Net distribution (sen per unit) - - -
Management expense ratio (%)(2) 1.65 2.12 2.27
Portfolio turnover ratio (times)(3) 0.70 1.57 2.57
* Above prices and net asset value per unit are not shown as ex-distribution.
3
Note: (1) Total return is the annualised return of the Fund for the respective financial
years computed based on the net asset value per unit and net of all fees.(2) Management expense ratio (“MER”) is calculated based on the total fees and
expenses incurred by the Fund divided by the average fund size calculated on adaily basis. The MER decreased by 0.47% as compared to 2.12% per annumfor the financial year ended 31 July 2018 mainly due to decrease in expenses.
(3) Portfolio turnover ratio (“PTR”) is calculated based on the average of the totalacquisitions and total disposals of investment securities of the Fund divided bythe average fund size calculated on a daily basis. The PTR decreased by 0.87times (55.4%) as compared to 1.57 times for the financial year ended 31 July2018 mainly due to decrease in investing activities.
Average Total Return (as at 31 July 2019)
AmBalanced(a) %
50% FBM Top100 & 50% MMGS(b)
%
One year -5.13 -1.42
Three years 5.46 2.16
Five years 2.15 1.18
Ten years 6.19 4.09
Annual Total Return
Financial Years Ended (31 July) AmBalanced(a)
%
50% FBM Top 100 & 50% MMGS(b)
%
2019 -5.13 -1.42
2018 8.06 2.98
2017 14.40 5.03
2016 -1.71 2.06
2015 -3.51 -2.28
(a) Source: Novagni Analytics and Advisory Sdn Bhd.(b) 50% FTSE Bursa Malaysia Top 100 Index (FBM Top 100) and 50% Medium
MMGS Index (available at www.aminvest.com)
The Fund performance is calculated based on the net asset value per unit of the Fund. Average total return of the Fund and its benchmark for a period is computed based on the absolute return for that period annualised over one year.
Note: Past performance is not necessarily indicative of future performance and that unit prices and investment returns may go down, as well as up.
Fund Performance
For the financial year under review, the Fund registered a negative return of 5.13% which was entirely capital in nature.
Thus, the Fund’s negative return of 5.13% has underperformed the benchmark’s negative return of 1.42% by 3.17%.
As compared with the financial year ended 31 July 2018, the net asset value (“NAV”) per unit of the Fund decreased by 5.13% from RM1.3496 to RM1.2804 while units in circulation have decreased by 8.83% from 2,767,290 units to 2,522,931 units.
4
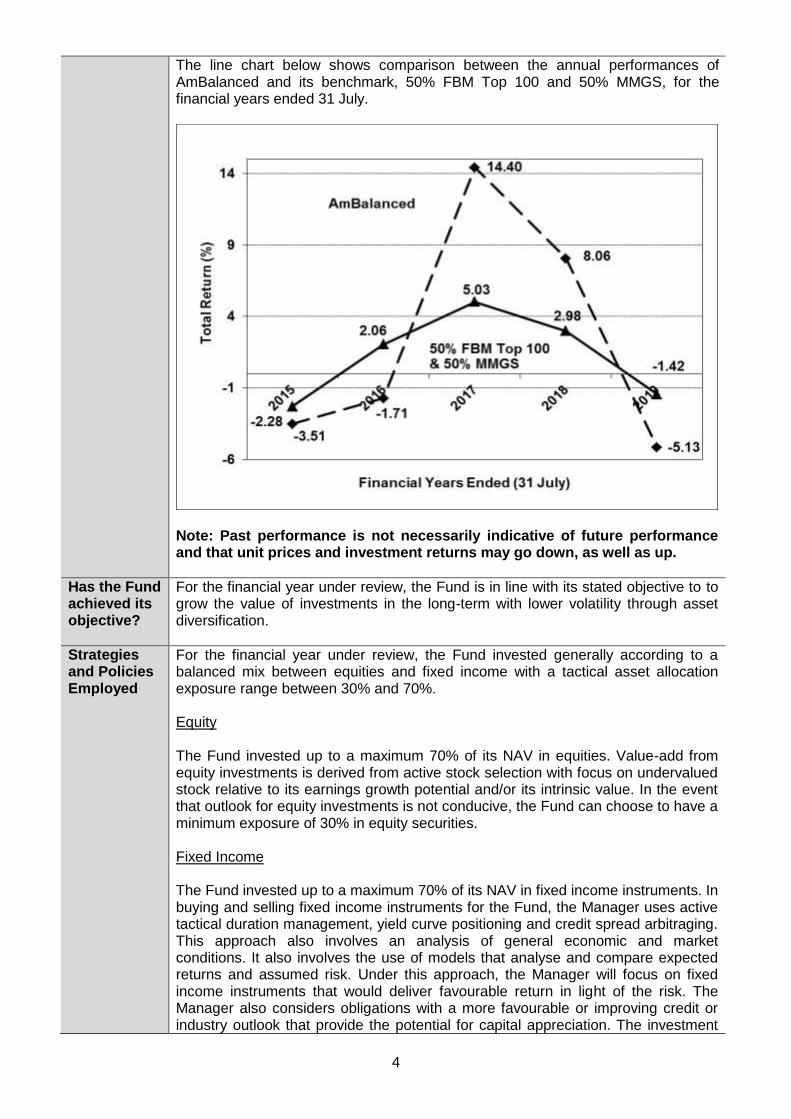
The line chart below shows comparison between the annual performances of AmBalanced and its benchmark, 50% FBM Top 100 and 50% MMGS, for the financial years ended 31 July.
Note: Past performance is not necessarily indicative of future performance and that unit prices and investment returns may go down, as well as up.
Has the Fund achieved its objective?
For the financial year under review, the Fund is in line with its stated objective to to grow the value of investments in the long-term with lower volatility through asset diversification.
Strategies and Policies Employed
For the financial year under review, the Fund invested generally according to a balanced mix between equities and fixed income with a tactical asset allocation exposure range between 30% and 70%.
Equity
The Fund invested up to a maximum 70% of its NAV in equities. Value-add from equity investments is derived from active stock selection with focus on undervalued stock relative to its earnings growth potential and/or its intrinsic value. In the event that outlook for equity investments is not conducive, the Fund can choose to have a minimum exposure of 30% in equity securities.
Fixed Income
The Fund invested up to a maximum 70% of its NAV in fixed income instruments. In buying and selling fixed income instruments for the Fund, the Manager uses active tactical duration management, yield curve positioning and credit spread arbitraging. This approach also involves an analysis of general economic and market conditions. It also involves the use of models that analyse and compare expected returns and assumed risk. Under this approach, the Manager will focus on fixed income instruments that would deliver favourable return in light of the risk. The Manager also considers obligations with a more favourable or improving credit or industry outlook that provide the potential for capital appreciation. The investment
5
management team may adopt an active trading stance, and will not consider portfolio turnover as a limiting factor in ensuring that the Fund meets its investment objective.
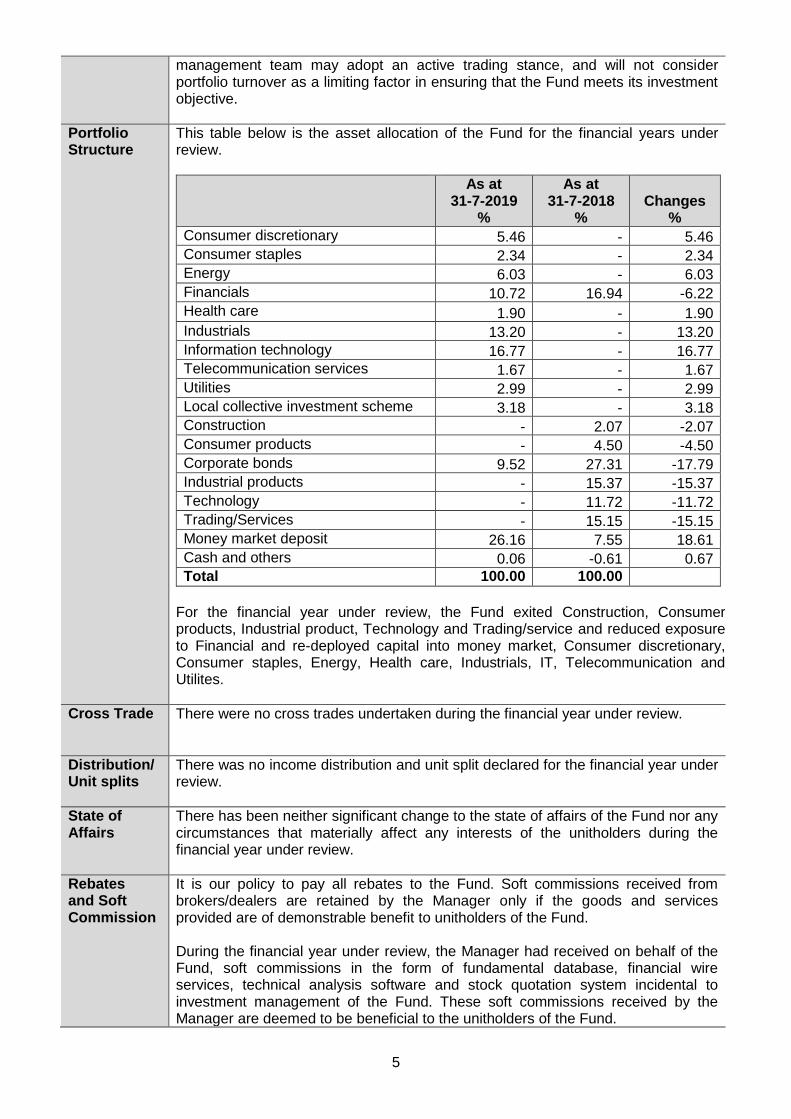
Portfolio Structure
This table below is the asset allocation of the Fund for the financial years under review.
As at 31-7-2019
%
As at 31-7-2018
%
Changes
%
Consumer discretionary 5.46 - 5.46
Consumer staples 2.34 - 2.34
Energy 6.03 - 6.03
Financials 10.72 16.94 -6.22
Health care 1.90 - 1.90
Industrials 13.20 - 13.20
Information technology 16.77 - 16.77
Telecommunication services 1.67 - 1.67
Utilities 2.99 - 2.99
Local collective investment scheme 3.18 - 3.18
Construction - 2.07 -2.07
Consumer products - 4.50 -4.50
Corporate bonds 9.52 27.31 -17.79
Industrial products - 15.37 -15.37
Technology - 11.72 -11.72
Trading/Services - 15.15 -15.15
Money market deposit 26.16 7.55 18.61
Cash and others 0.06 -0.61 0.67
Total 100.00 100.00
For the financial year under review, the Fund exited Construction, Consumer products, Industrial product, Technology and Trading/service and reduced exposure to Financial and re-deployed capital into money market, Consumer discretionary, Consumer staples, Energy, Health care, Industrials, IT, Telecommunication and Utilites.
Cross Trade
There were no cross trades undertaken during the financial year under review.
Distribution/ Unit splits
There was no income distribution and unit split declared for the financial year under review.
State of Affairs
There has been neither significant change to the state of affairs of the Fund nor any circumstances that materially affect any interests of the unitholders during the financial year under review.
Rebates and Soft Commission
It is our policy to pay all rebates to the Fund. Soft commissions received from brokers/dealers are retained by the Manager only if the goods and services provided are of demonstrable benefit to unitholders of the Fund. During the financial year under review, the Manager had received on behalf of the Fund, soft commissions in the form of fundamental database, financial wire services, technical analysis software and stock quotation system incidental to investment management of the Fund. These soft commissions received by the Manager are deemed to be beneficial to the unitholders of the Fund.
6
Market Review
The KLCI is up 2% m.o.m. Although KLCI seemed strong, it was not broad-based. FBM Mid 70 Index and FBM Small Cap Index actually declined 2.5% and 2.2% m.o.m respectively. KLCI’s outperformance was driven mainly by the Finance sector, up 3.1% m.o.m. Construction and Properties were the worst performing sector, declined 5.8% and 4.7% m.o.m respectively. Sentiment for Construction sector turned bearish after Prime Minister (PM) Mahathir announced the cancellation of the East Coast Rail Link project after his visit to Beijing. He further highlighted that fixing the country’s finances remains the key priority of the government. Government’s finance was weakened especially after Finance Minister Lim revealed that total tax refund (GST and income tax) owed by Government amounted to MYR35.4b. Foreigners net selling dropped to near zero in August 2018 (July: - MYR1.7b). Year To Date (YTD) foreign outflow was unchanged at MYR8.5b. For the month of September, KLCI was down 4.7% m.o.m, in tandem with the global equity market rout. This was mainly driven by US Treasury 10Y yields surging to 3.18% in early October. Bursa Malaysia Small Cap Index was worst hit down by 11.4%% m.o.m, followed by FBM70 that tumbled 9.3% m.o.m. Sector wise, construction and telecommunication were the worst performing sectors, declined by 15.9% and 14.2% m.o.m. respectively. In October, foreign outflows resumed with MYR1.5b outflow. The KLCI was down 1.6% m.o.m. Bursa Malaysia Small Cap Index was worst hit, down by 4.4% m.o.m. Sector wise, energy, plantation and technologies were the worst performing sectors, declined by 12.8%, 6.8% and 6.8% m.o.m respectively. In November, foreign outflows slowed down to MYR700m, bringing YTD foreign outflows to MYR10.7b. The oil and gas sector was affected by the sold down as Brent crude oil price tumbled 22% m.o.m to close at USD59/bbl. The plantation sector was also down as Crude Palm Oil (CPO) price plunged 12.8% m.o.m. to MYR1,762/mt. Technology stocks were sold down in tandem with the drop in Apple share price arising from the concern of lower than expected iPhone sales. Genting Malaysia was hit by the unexpected steep 10% increase in casino duties to 35% during the 2019 Budget announcement. The KLCI was up 0.6% m.o.m, bucking the global equities downtrend. Global market was in a bearish mode, as most were in fear of the yield curve inversion, a critical indicator of an imminent recession and a steep market correction. The United States (US) 10Y-2Y yield curve has narrowed to its lowest since June 2007. The arrest of Huawei CFO, Meng Wanzhou, threw more doubt into whether the US-China trade dispute can be resolved, after a promising start with the 90-day truce. Also, there was concern on prolonged US government shutdown. Outside of blue chip universe, the Malaysian market was weak as shown by FBM70 Index and Bursa Malaysia Small Cap Index which tumbled 3.4% and 7.1% m.o.m respectively. Sector wise, technologies and energy were the worst performing sectors, declined by 8.3% and 8.0% m.o.m respectively. The KLCI was down 0.4% m.o.m, despite strong performance of global equities where Dow Jones surged 7.2% m.o.m. In line with the risk-on sentiment, investors dumped blue chips in exchange for the mid and small cap stocks. Hence, the FBM70 and FBM Small Cap gained 5.7% and 7.2% m.o.m. respectively. Global market was rather bullish as for now since the US Federal signalled it is putting further interest rate rises on hold “in light of global economic and financial developments and muted inflation pressures”. The Federal also pledged flexibility on the path for reducing its balance sheet. This marked a reversal, barely a month ago, from December 2018, when the Federal signalled that "some further gradual increases" were coming. As a consequence of change in US rate hike expectation, US dollar (USD) weakened and Malaysia Ringgit (MYR) strengthened 0.9% m.o.m. to MYR4.10 to the dollar. US-China trade talk had some setbacks when US
7
Commerce Secretary Wilbur Ross says the US-China are “miles and miles” apart from coming to a broader trade deal before the 1 March deadline. On top of that, US Federal prosecutors went after Huawei for financial fraud and allegedly stealing trade secrets. The KLCI was up 1.4% m.o.m, in line with strong performance of Dow Jones. Global market was rather bullish as President Trump extends China tariff deadline to raise tariffs on Chinese goods beyond 1 March, citing substantial progress in the latest round of trade talks. Malaysia’s 4Q18 corporate reporting season was disappointing; with only 45% of companies under Maybank research universe met expectation, down from 48% in the preceding quarter. KLCI earnings growth ended 2018 with -2.5% y.o.y. Maybank research cut 2019 earnings growth to 6.1% from 7.8% y.o.y. previously. The KLCI was down 3.8% m.o.m. The big cap led by the banks dragged the KLCI down. FBM70 and FBMSC performed much better, went up by 1.9% and 1.3% m.o.m. respectively. US 10-Year Treasury yield collapsed 31bps in the month of March to close at 2.41%, which caused an inverted yield curve versus the US 3-Month Treasury bill yield which closed at 2.42%. The Federal funds futures are now discounting a 25bp cut this year and another 25bp rate cut in 2020. Besides pausing the rate hike, the US Federal also announced a schedule for ending balance sheet contraction. As a consequence, the Federal balance sheet contraction will end at the end of September at USD3.70T, or 6.8% below the current level of USD3.97T. The rate collapse came about following the release of weak February manufacturing Purchasing Managers' Index (PMI) numbers from major economies of the world. European and Japan’s PMI was particularly weak dipping below 50, signaling contraction in economic activities. The KLCI was down marginally by -0.1% m.o.m. The mid and small cap as represented by FBM70 and FBMSC performed much better, gone up by 2.6% and 7.2% m.o.m. respectively. MYR was weakened against USD by 1.3% m.o.m. to close at 4.13. Two major news that drove the MYR weakness were: 1) FTSE Russell announced that Malaysia’s “market accessibility level’ has been
put on watch list, with the next review in September 2019. If Malaysia’s classification drops 1 level, it will be removed from FTSE World Government Bond Index. Malaysia weighting in the index is estimated at 0.39% or USD7-8b which is 20% of foreign holdings in Malaysia Government Securities (MGS); and
2) An International Rating Agency views the Malaysian Government's financial aid
of MYR6.2b (USD1.5b or 0.4% of Gross Domestic Product (GDP)) to Federal Land Development Authority (Felda) is a credit negative.
The KLCI was up 0.5% m.o.m bucking the downtrend of global market where the Dow Jones fell 6.7% m.o.m The mid and small cap as represented by FBM70 and FBMSC performed much worse, down by 2.3% and 7.9% m.o.m respectively. On the back of deterioration in global economic outlook from trade wars, US 10-year treasury yield plunged 38bps to close at 2.12%, resulted in inverted yield curve against the 3-month Treasury bill. The US 10Y-3m yield gap had widened to 20bps, compared to 2-3bps in the past few months, signaling weaker growth and possible recession ahead. Back to Malaysia, the recent concluded 1Q19 corporate results were mixed. According to CGSCIMB, revision ratio (% of outperformers vs. underperformers) deteriorated to 0.32x in 1Q19 vs. 0.46x in 4Q18. KLCI earnings growth was cut to -3% from +5% previously for 2019. The KLCI was up 1.3% m.o.m, in line with the strong performance of the Dow Jones, which was up 7.2% m.o.m. The mid and small cap as represented by
8
FBM70 and FBMSC performed even better, up by 2.5% and 3.6% m.o.m respectively. Investors turned bullish by the assurance offered by Federal Chairman Powell, that the Federal “will act as appropriate to sustain the expansion” if the trade situation deteriorates. Subsequently, in the June United States (US) Federal Open Market Committee (FOMC) meeting, the Federal held interest rates steady but sent a clear signal that it will likely cut rates this year as uncertainty on the growth outlook has increased and inflationary pressure has been muted. The result is that money markets are now discounting up to 4 Federal rate cuts in one year’s time to 1.5% from current 2.5%. US 10-year treasury yield declined 12bps to 2.01%, the lowest level since 2016. This sparked the sell-off in the US dollar, where the Dollar Index went down 1.7% m.o.m and the related break out in the Gold price, up 8% m.o.m to US1,410/oz. On top of that, market was greeted by another positive news at the G20 summit, where US President Trump and China President Xi, have agreed to a temporary truce to restart the trade talk. US no longer imposes new tariffs on Chinese products, but the US maintains the current tariff level of 25% of the US250b. US allows Huawei to continue to trade with US companies and purchase products of US companies in a field that does not threaten US national security. The KLCI was down -2.2% m.o.m. The mid and small cap as represented by FBM70 and FBMSC were more resilient, down by -0.7% and up by +4.2% m.o.m respectively. As widely expected by the market, on 31 Jul 2019, US Federal cut interest rate by 25bps, for the first time in a decade, bringing Federal rate down to 2.00-2.25% range. Federal Chairman Powell explained that the cut was an insurance cut as concerns intensified over global growth, tariffs and low inflation but stopped short of signaling the beginning of rate cut cycle. The statement was less dovish than market and President Trump’s expectation thus the Dow fell -1.23% on that day. 10Y US treasury yield hardly moved and stayed at 2.03% on the day of rate cut, signaling that market is still expecting further rate cut.
Market Outlook
In August, global market remained volatile as they were impacted by the ongoing external turmoil whilst the imposition of a fresh round of tariffs by both US-China have further worsen the sentiment. Although global central banks have rolled out their accommodative monetary policy to support the market, investors remained concerned about a potential full-blown trade war. This will continue to linger in the mind of all investors around the globe until it is resolved. Locally, market was not spared from the weak sentiment. It was precipitated by the recent uninspiring 2Q19 corporates’ report cards. Despite being the worst performing market in the region YTD, foreign funds continued to flow out from our equity market. We believe it is best to remain defensive to ride through this difficult period. As we remain defensive, we continue to prefer sectors such as consumer (non-discretionary), oil & gas players involved in maintenance, exporters such as gloves, construction players which are focusing on government’s effort in reviving some shelved projects (as the sector has the highest multiplier effect of 2x) and REITs. We have dropped financial as our preferred sector due to the weakening loans growth outlook and a possibility of interest rate cut in the near term.

9
Additional Information
The following information was updated: 1. Jeyaratnam A/L Tamotharam Pillai was appointed as an Independent Non-
Executive Chairman for AmFunds Management Berhad with effect from 1st April 2019.
Kuala Lumpur, Malaysia AmFunds Management Berhad 17 September 2019
Independent auditors’ report to the unitholders of
AmBalanced
Report on the audit of the financial statements
Opinion
Basis for opinion
Independence and other ethical responsibilities
Information other than the financial statements and auditors’ report thereon
We have audited the financial statements of AmBalanced (“the Fund”), which comprise the statement of financial position as at 31 July 2019, the statement of comprehensive income, statement of changes in equity and statement of cash flows for the year then ended, and notes to the financial statements, including a summary of significant accounting policies, as set out on pages 14 to 47.
In our opinion, the accompanying financial statements give a true and fair view of the financial position of the Fund as at 31 July 2019 and of its financial performance and cash flows for the year then ended in accordance with Malaysian Financial Reporting Standards and International Financial Reporting Standards.
We conducted our audit in accordance with approved standards on auditing in Malaysia and International Standards on Auditing. Our responsibilities under those standards are further described in the Auditor’s Responsibilities for the Audit of the Financial Statements section of our report. We believe that the audit evidence we have obtained is sufficient and appropriate to provide a basis for our opinion.
We are independent of the Fund in accordance with the By-Laws (on Professional Ethics, Conduct and Practice) of the Malaysian Institute of Accountants (“By-Laws”) and the International Ethics Standards Board for Accountants’ Code of Ethics for Professional Accountants (“IESBA Code”), and we have fulfilled our other ethical responsibilities in accordance with the By-Laws and the IESBA Code.
The Manager is responsible for the other information. The other information comprises the Annual Report, but does not include the financial statements of the Fund and our auditors’ report thereon. The Annual Report is expected to be made available to us after the date of this auditors’ report.
Our opinion on the financial statements of the Fund does not cover the other information and we do not and will not express any form of assurance conclusion thereon.
10
Independent auditors’ report to the unitholders of
AmBalanced (cont'd.)
Information other than the financial statements and auditors’ report thereon (cont'd.)
Responsibilities of the Manager and the Trustees for the financial statements
Auditor’s responsibilities for the audit of the financial statements
In connection with our audit of the financial statements of the Fund, our responsibility is to read the other information identified above and, in doing so, consider whether the other information is materially inconsistent with the financial statements of the Fund or our knowledge obtained in the audit or otherwise appears to be materially misstated.
When we read the Annual Report, if we conclude that there is a material misstatement therein, we are required to communicate the matter to the Manager and Trustee of the Fund and take appropriate action to seek to have the uncorrected material misstatement appropriately brought to the attention of users for whom the auditors’ report is prepared.
The Manager is responsible for the preparation of the financial statements of the Fund that give a true and fair view in accordance with Malaysian Financial Reporting Standards and International Financial Reporting Standards. The Manager is also responsible for such internal control as the Manager determines is necessary to enable the preparation of financial statements of the Fund that are free from material misstatement, whether due to fraud or error.
In preparing the financial statements of the Fund, the Manager is responsible for assessing the Fund’s ability to continue as a going concern, disclosing, as applicable, matters related to going concern and using the going concern basis of accounting unless the Manager either intends to liquidate the Fund or to cease operations, or has no realistic alternative to do so.
The Trustee is responsible for ensuring that the Manager maintains proper accounting and other records as are necessary to enable true and fair presentation of these financial statements.
Our objectives are to obtain reasonable assurance about whether the financial statements of the Fund, as a whole are free from material misstatement, whether due to fraud or error, and to issue an auditors’ report that includes our opinion. Reasonable assurance is a high level of assurance, but is not a guarantee that an audit conducted in accordance approved standards on auditing in Malaysia and International Standards on Auditing will always detect a material misstatement when it exists. Misstatements can arise from fraud or error and are considered material if, individually or in the aggregate, they could reasonably be expected to influence the economic decisions of users taken on the basis of these financial statements.
11
Independent auditors’ report to the unitholders of
AmBalanced (cont'd.)
Auditor’s responsibilities for the audit of the financial statements (cont'd.)
As part of an audit in accordance with the approved standards on auditing in Malaysia and International Standards on Auditing, we exercise professional judgment and maintain professional skepticism throughout the planning and performance of the audit. We also:
ª Identify and assess the risks of material misstatement of the financial statements of the Fund, whether due to fraud or error, design and perform audit procedures responsive to those risks, and obtain audit evidence that is sufficient and appropriate to provide a basis for our opinion. The risk of not detecting a material misstatement resulting from fraud is higher than for one resulting from error, as fraud may involve collusion, forgery, intentional omissions, misrepresentations, or the override of internal control.
ª Obtain an understanding of internal control relevant to the audit in order to design audit procedures that are appropriate in the circumstances, but not for the purpose of expressing an opinion on the effectiveness of the Fund’s internal control.
ª Evaluate the appropriateness of accounting policies used and the reasonableness of accounting estimates and related disclosures made by the Manager.
ª Conclude on the appropriateness of the Manager’s use of the going concern basis of accounting and, based on the audit evidence obtained, whether a material uncertainty exists related to events or conditions that may cast significant doubt on the Fund’s ability to continue as a going concern. If we conclude that a material uncertainty exists, we are required to draw attention in our auditors’ report to the related disclosures in the financial statements or, if such disclosures are inadequate, to modify our opinion. Our conclusions are based on the audit evidence obtained up to the date of our auditors’ report. However, future events or conditions may cause the Fund to cease to continue as a going concern.
ª Evaluate the overall presentation, structure and content of the financial statements of the Fund, including the disclosures, and whether the financial statements of the Fund represent the underlying transactions and events in a manner that achieves fair presentation.
We communicate with the Manager regarding, among other matters, the planned scope and timing of the audit and significant audit findings, including any significant deficiencies in internal control that we identify during our audit.
12
Independent auditors’ report to the unitholders of
AmBalanced (cont'd.)
Other matters
Ernst & Young Lee Pei Yin
AF: 0039 No. 03189/05/2021 J
Chartered Accountants Chartered Accountant
Kuala Lumpur, Malaysia
17 September 2019
This report is made solely to the unitholders of the Fund, as a body, in accordance with the Guidelines on Unit Trust Funds issued by Securities Commission Malaysia and for no other purpose. We do not assume responsibility to any other person for the content of this report.
13
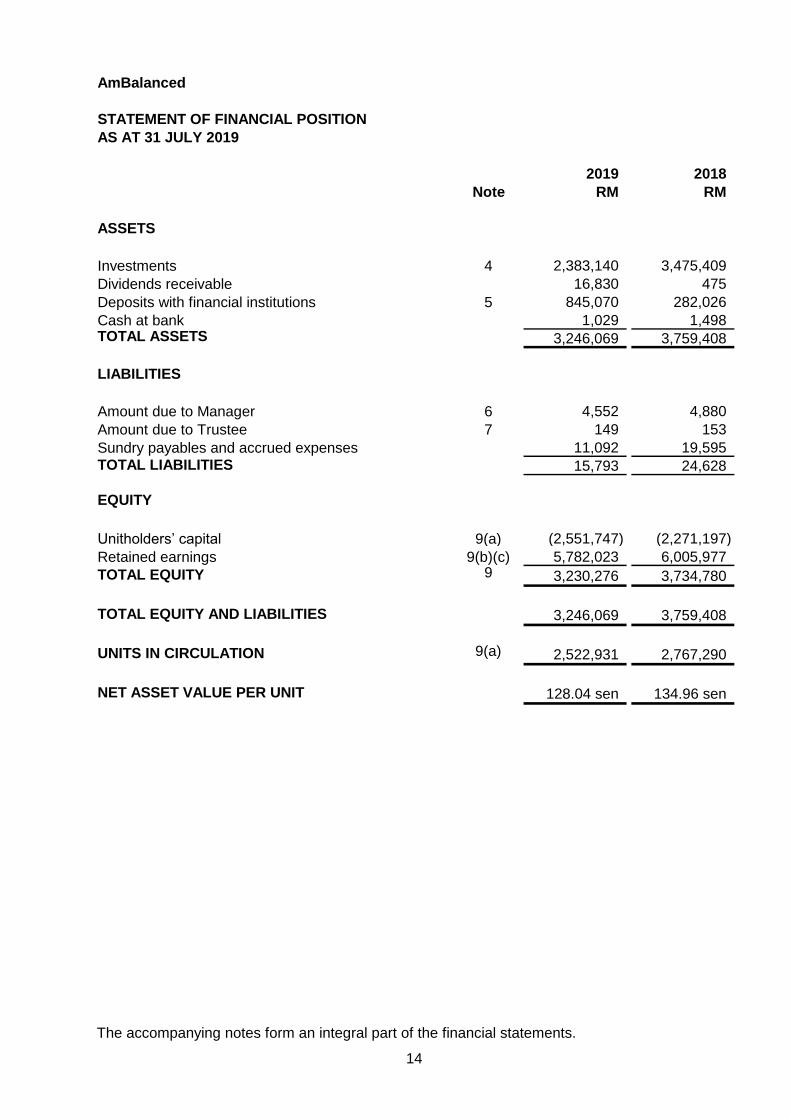
AmBalanced
STATEMENT OF FINANCIAL POSITION
AS AT 31 JULY 2019
2019 2018
Note RM RM
ASSETS
Investments 4 2,383,140 3,475,409
Dividends receivable 16,830 475
Deposits with financial institutions 5 845,070 282,026
Cash at bank 1,029 1,498 TOTAL ASSETS 3,246,069 3,759,408
LIABILITIES
Amount due to Manager 6 4,552 4,880
Amount due to Trustee 7 149 153
Sundry payables and accrued expenses 11,092 19,595
TOTAL LIABILITIES 15,793 24,628
EQUITY
Unitholders’ capital 9(a) (2,551,747) (2,271,197)
Retained earnings 9(b)(c) 5,782,023 6,005,977
TOTAL EQUITY 9 3,230,276 3,734,780
TOTAL EQUITY AND LIABILITIES 3,246,069 3,759,408
UNITS IN CIRCULATION 9(a) 2,522,931 2,767,290
NET ASSET VALUE PER UNIT 128.04 sen 134.96 sen
The accompanying notes form an integral part of the financial statements.
14
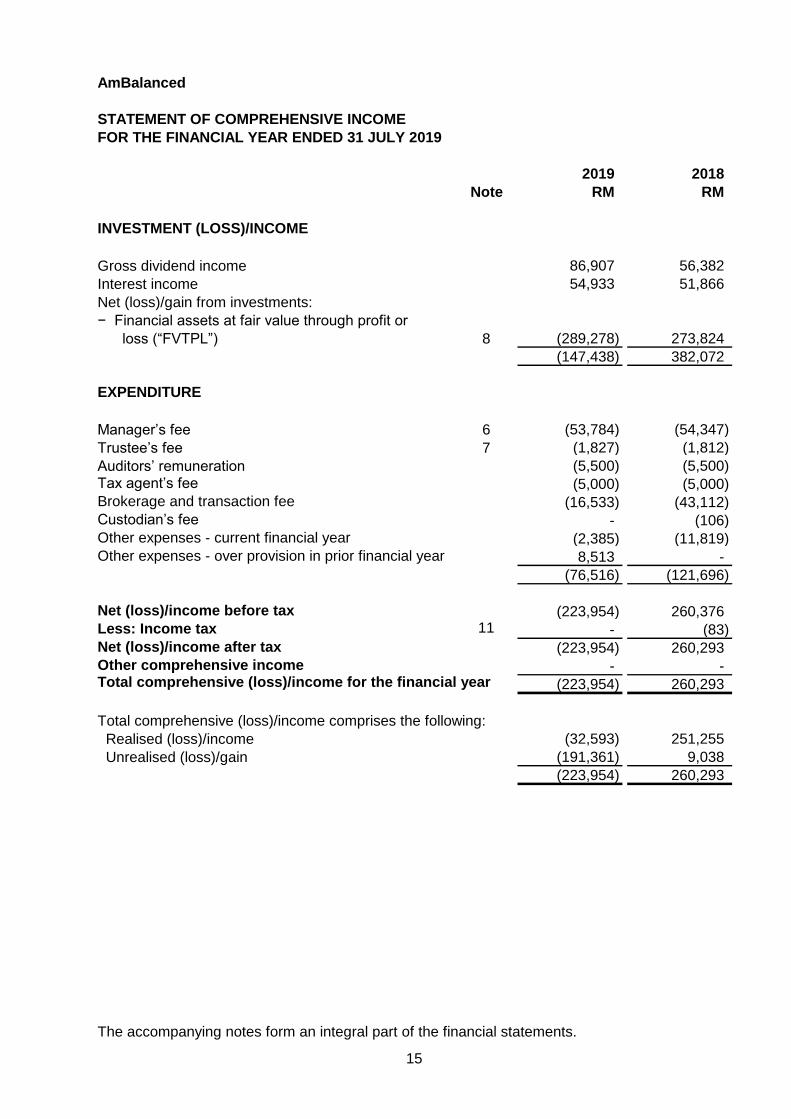
AmBalanced
STATEMENT OF COMPREHENSIVE INCOME
FOR THE FINANCIAL YEAR ENDED 31 JULY 2019
2019 2018
Note RM RM
INVESTMENT (LOSS)/INCOME
Gross dividend income 86,907 56,382
Interest income 54,933 51,866
Net (loss)/gain from investments:
− Financial assets at fair value through profit or
loss (“FVTPL”) 8 (289,278) 273,824
(147,438) 382,072
EXPENDITURE
Manager’s fee 6 (53,784) (54,347)
Trustee’s fee 7 (1,827) (1,812)
Auditors’ remuneration (5,500) (5,500)
Tax agent’s fee (5,000) (5,000)
Brokerage and transaction fee (16,533) (43,112)
Custodian’s fee - (106)
Other expenses - current financial year (2,385) (11,819)
Other expenses - over provision in prior financial year 8,513 -
(76,516) (121,696)
Net (loss)/income before tax (223,954) 260,376
Less: Income tax 11 - (83)
Net (loss)/income after tax (223,954) 260,293
Other comprehensive income - - Total comprehensive (loss)/income for the financial year (223,954) 260,293
Total comprehensive (loss)/income comprises the following:
Realised (loss)/income (32,593) 251,255
Unrealised (loss)/gain (191,361) 9,038
(223,954) 260,293
The accompanying notes form an integral part of the financial statements.
15
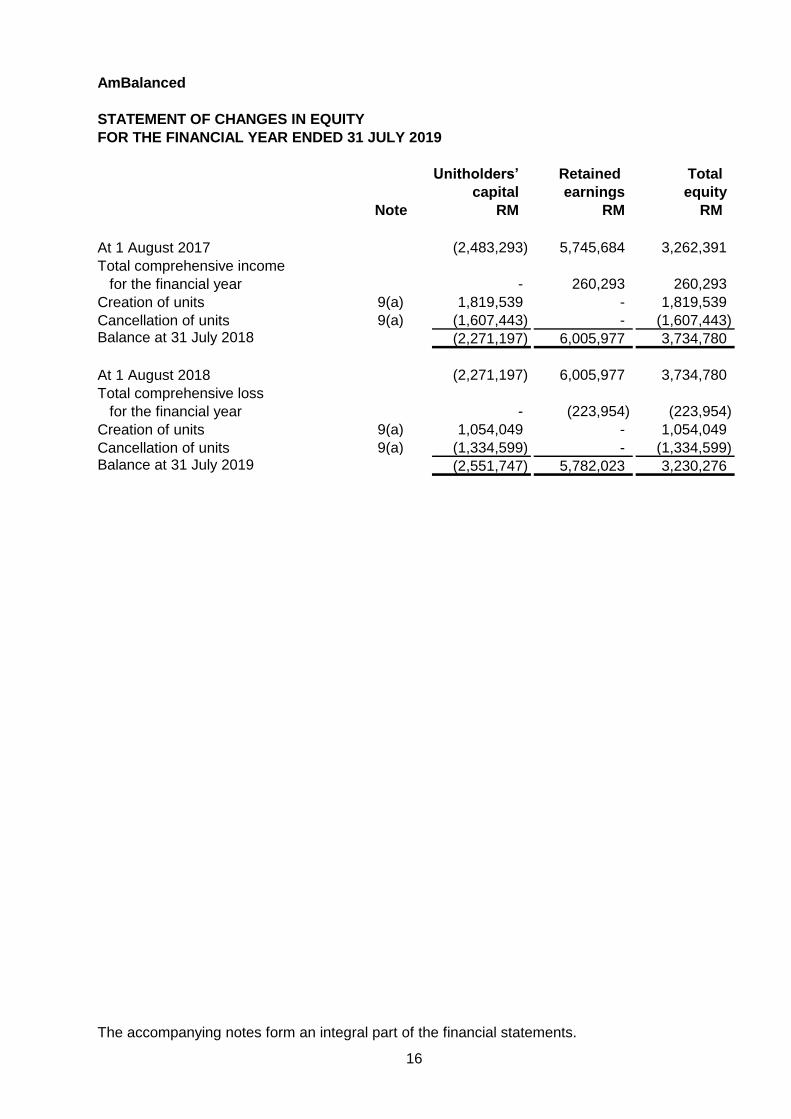
AmBalanced
STATEMENT OF CHANGES IN EQUITY
FOR THE FINANCIAL YEAR ENDED 31 JULY 2019
Unitholders’ Retained Total
capital earnings equity
Note RM RM RM
At 1 August 2017 (2,483,293) 5,745,684 3,262,391
Total comprehensive income
for the financial year - 260,293 260,293
Creation of units 9(a) 1,819,539 - 1,819,539
Cancellation of units 9(a) (1,607,443) - (1,607,443) Balance at 31 July 2018 (2,271,197) 6,005,977 3,734,780
At 1 August 2018 (2,271,197) 6,005,977 3,734,780
Total comprehensive loss
for the financial year - (223,954) (223,954)
Creation of units 9(a) 1,054,049 - 1,054,049
Cancellation of units 9(a) (1,334,599) - (1,334,599) Balance at 31 July 2019 (2,551,747) 5,782,023 3,230,276
The accompanying notes form an integral part of the financial statements.
16
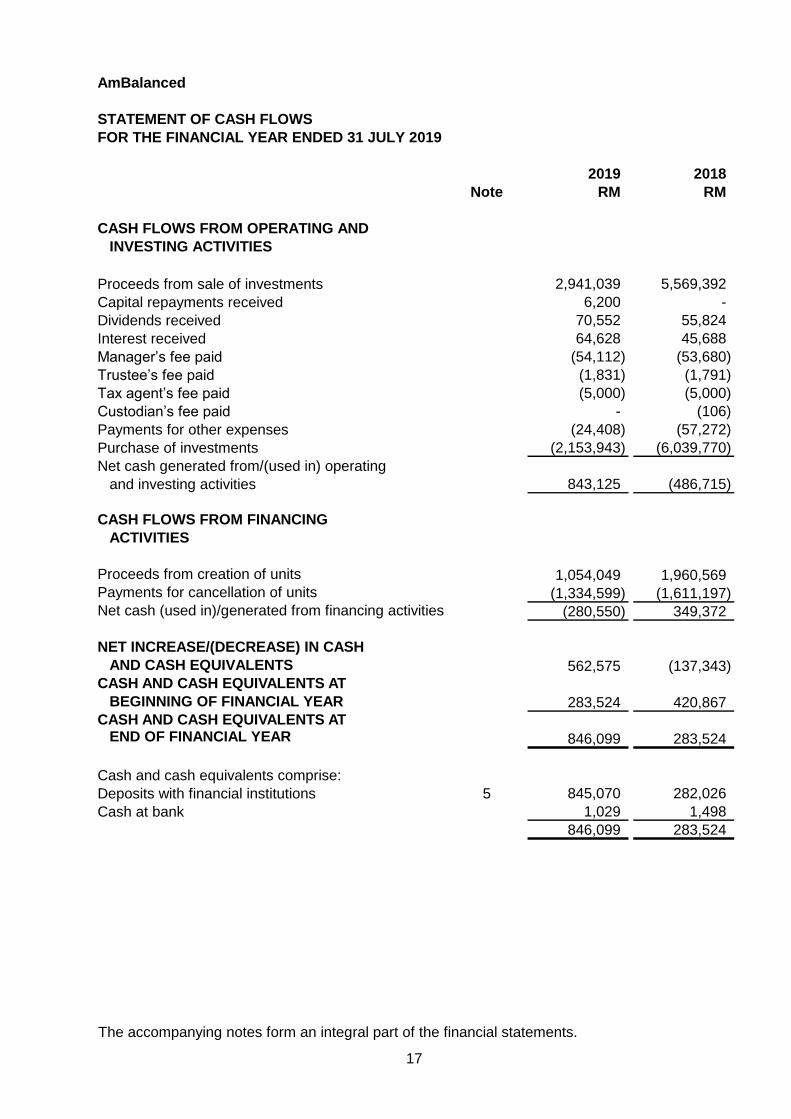
AmBalanced
STATEMENT OF CASH FLOWS
FOR THE FINANCIAL YEAR ENDED 31 JULY 2019
2019 2018
Note RM RM
CASH FLOWS FROM OPERATING AND
INVESTING ACTIVITIES
Proceeds from sale of investments 2,941,039 5,569,392
Capital repayments received 6,200 -
Dividends received 70,552 55,824
Interest received 64,628 45,688
Manager’s fee paid (54,112) (53,680)
Trustee’s fee paid (1,831) (1,791)
Tax agent’s fee paid (5,000) (5,000)
Custodian’s fee paid - (106)
Payments for other expenses (24,408) (57,272)
Purchase of investments (2,153,943) (6,039,770)
Net cash generated from/(used in) operating
and investing activities 843,125 (486,715)
CASH FLOWS FROM FINANCING
ACTIVITIES
Proceeds from creation of units 1,054,049 1,960,569
Payments for cancellation of units (1,334,599) (1,611,197)
Net cash (used in)/generated from financing activities (280,550) 349,372
NET INCREASE/(DECREASE) IN CASH
AND CASH EQUIVALENTS 562,575 (137,343)
CASH AND CASH EQUIVALENTS AT
BEGINNING OF FINANCIAL YEAR 283,524 420,867
CASH AND CASH EQUIVALENTS AT END OF FINANCIAL YEAR 846,099 283,524
Cash and cash equivalents comprise:
Deposits with financial institutions 5 845,070 282,026
Cash at bank 1,029 1,498
846,099 283,524
The accompanying notes form an integral part of the financial statements.
17
AmBalanced
NOTES TO THE FINANCIAL STATEMENTS
FOR THE FINANCIAL YEAR ENDED 31 JULY 2019
1. GENERAL INFORMATION
2. BASIS OF PREPARATION OF FINANCIAL STATEMENTS
Adoption of new standards
MFRS 9 Financial Instruments
MFRS 15 Revenue From Contracts With Customers
MFRS 9 Financial Instruments
AmBalanced (“the Fund”) was established pursuant to a Deed dated 11 September 2003 as
amended by Deeds Supplemental thereto (“the Deed”), between AmFunds Management
Berhad as the Manager, HSBC (Malaysia) Trustee Berhad as the Trustee and all unitholders.
The Fund was set up with the objective of growing the value of investments in longer term
with lower volatility through asset diversification. As provided in the Deed, the “accrual period”
or the financial year shall end on 31 July and the units in the Fund were first offered for sale
on 16 September 2003.
The financial statements of the Fund have been prepared in accordance with Malaysian
Financial Reporting Standards (“MFRS”) as issued by the Malaysian Accounting Standards
Board (“MASB”) and are in compliance with International Financial Reporting Standards.
The financial statements of the Fund have been prepared under the historical cost
convention, unless otherwise stated in the accounting policies.
The accounting policies adopted are consistent with those of the previous financial year
except for the adoption of the following new standards which became effective for the first
time on 1 August 2018:
MFRS 9 replaces the provisions of MFRS 139 Financial Instruments: Recognition and
Measurement that relate to the recognition, classification and measurement, as well as
derecognition of financial instruments, impairment of financial assets and hedge accounting.
As permitted by the transitional provision of MFRS 9, comparative information has not been
restated. The impact arising from the adoption of MFRS 9 is as follows:
The adoption of these new standards did not have any material impact on the financial
statements of the Fund except for those arising from the adoption of MFRS 9 as disclosed
below. Other than the adoption of new accounting policies for financial instruments as
disclosed below, the Fund did not change its accounting policies or make retrospective
adjustments as a result of adopting the new standards.
The financial statements were authorised for issue by the Chief Executive Officer of the
Manager on 17 September 2019.
18
AmBalanced
2. BASIS OF PREPARATION OF FINANCIAL STATEMENTS (CONT'D.)
MFRS 9 Financial Instruments (cont'd.)
(i) Classification and measurement
(ii) Impairment
The loan loss impairment methodology is fundamentally changed under MFRS 9 as it
replaces MFRS 139’s incurred loss approach with a forward-looking expected credit loss
(“ECL”) approach. The impairment requirements based on ECL approach is applicable
for debt financial assets not held at FVTPL. The allowance for expected losses are
determined based on the expected credit losses associated with the probability of default
(“PD”) in the next twelve months unless there has been a significant increase in credit
risk since origination, in which case, the allowance is based on the probability of default
over the lifetime of the asset.
There was no ECL impact on the Fund’s financial assets at amortised cost upon the
adoption of MFRS 9 on 1 August 2018 or during the current financial year.
MFRS 9 requires all financial assets, other than equity instruments and derivatives, to be
classified on the basis of two criteria, namely the entity’s business model for managing
the assets, as well as the instruments’ contractual cash flow characteristics. Financial
assets are measured at amortised cost if they are held within a business model whose
objective is to hold financial assets in order to collect contractual cash flows that are
solely payments of principal and interest. If the financial assets are held within a
business model whose objective is achieved by both selling financial assets and
collecting contractual cash flows that are solely payments of principal and interest, the
assets are measured at fair value through other comprehensive income (“FVOCI”). Any
financial assets that are not measured at amortised cost or FVOCI are measured at fair
value through profit or loss (“FVTPL”). Instruments that qualify for amortised cost or
FVOCI may be irrevocably designated as FVTPL, if doing so eliminates or significantly
reduces a measurement or recognition inconsistency. Equity instruments are normally
measured at FVTPL; nevertheless entities are allowed to irrevocably designate equity
instruments that are not held for trading as FVOCI, with no subsequent reclassification
of gains or losses to the statement of profit or loss.
Upon the adoption of MFRS 9 on 1 August 2018, all the Fund’s equity investments,
collective investment schemes and debt securities continue to be measured at FVTPL.
There is no impact on the Fund’s accounting for financial liabilities, as the new
requirements only affect the accounting for financial liabilities that are designated at
FVTPL and the Fund does not have any such liabilities.
The Fund has established a policy to perform an assessment at the end of each
reporting period of whether credit risk has increased significantly since initial recognition
by considering the change in the risk of default occurring over the remaining life of the
financial instrument. To calculate ECL, the Fund has estimated the risk of a default
occurring on the financial instrument during its expected life. ECLs are estimated based
on the present value of all cash shortfalls over the remaining expected life of the
financial asset, i.e. the difference between the contractual cash flows that are due to the
Fund under the contract and the cash flows that the Fund expect to receive, discounted
at the effective interest rate of the financial asset.
19
AmBalanced
3. SUMMARY OF SIGNIFICANT ACCOUNTING POLICIES
3.1 Income recognition
(i) Dividend/Distribution income
(ii) Interest income
(iii) Gain or loss on disposal of investments
3.2 Income tax
3.3 Functional and presentation currency
Dividend/distribution income is recognised when the Fund’s right to receive payment is
established.
Income is recognised to the extent that it is probable that the economic benefits will flow to
the Fund and the income can be reliably measured. Income is measured at the fair value of
consideration received or receivable.
For all interest-bearing financial assets, interest income is calculated using the effective
interest method. Effective interest rate is the rate that exactly discounts estimated future
cash payments or receipts through the expected life of the financial instrument or a
shorter period, where appropriate, to the net carrying amount of the financial asset. The
calculation takes into account all contractual terms of the financial instrument and
includes any fees or incremental costs that are directly attributable to the instrument and
are an integral part of the effective interest rate, but not future credit losses.
Once the recorded value of a financial asset or a group of similar financial assets has
been reduced due to an impairment loss, interest income continues to be recognised
using the rate of interest used to discount the future cash flows for the purpose of
measuring the impairment loss.
On disposal of investments, the net realised gain or loss on disposal is measured as the
difference between the net disposal proceeds and the carrying amount of the
investments. The net realised gain or loss is recognised in profit or loss.
Current tax assets and liabilities are measured at the amount expected to be recovered from
or paid to the tax authorities. The tax rates and tax laws used to compute the amount are
those that are enacted or substantively enacted at the reporting date.
Current taxes are recognised in profit or loss except to the extent that the tax relates to items
recognised outside profit or loss, either in other comprehensive income or directly in equity.
Functional currency is the currency of the primary economic environment in which the Fund
operates that most faithfully represents the economic effects of the underlying transactions.
The functional currency of the Fund is Ringgit Malaysia which reflects the currency in which
the Fund competes for funds, issues and redeems units. The Fund has also adopted Ringgit
Malaysia as its presentation currency.
20
AmBalanced
3. SUMMARY OF SIGNIFICANT ACCOUNTING POLICIES (CONT'D.)
3.4 Statement of cash flows
3.5 Distribution
3.6 Unitholders’ capital
3.7 Financial assets – initial recognition and measurement
(i) Initial recognition
(ii) Initial measurement
(iii) “Day 1” profit or loss
Cash equivalents are short-term, highly liquid investments that are readily convertible to cash
with insignificant risk of changes in value.
The unitholders’ capital of the Fund meets the definition of puttable instruments and is
classified as equity instruments under MFRS 132 Financial Instruments: Presentation (“MFRS
132”).
Financial assets and financial liabilities are recognised when the Fund becomes a party
to the contractual provisions of the instrument. Regular way purchases and sales of
financial assets are recognised using trade date accounting or settlement date
accounting. The method used is applied consistently for all purchases and sales of
financial assets that belong to the same category of financial assets.
All financial assets are recognised initially at fair value plus, in the case of financial
assets not recorded at fair value through profit or loss, transaction costs that are
attributable to the acquisition of the financial asset. All financial liabilities are recognised
initially at fair value and, in the case of financial liabilities not recorded at fair value
through profit or loss, net of directly attributable transaction costs.
At initial measurement, if the transaction price differs from the fair value, the Fund
immediately recognises the difference between the transaction price and fair value (a
“Day 1” profit or loss) in profit or loss provided that fair value is evidenced by a quoted
price in an active market for an identical asset or liability (i.e. Level 1 input) or based on
a valuation technique that uses only data from observable markets. In all other cases,
the difference between the transaction price and model value is recognised in profit or
loss on a systematic and rational basis that reflects the nature of the instrument over its
tenure.
Distributions are at the discretion of the Fund. A distribution to the Fund’s unitholders is
accounted for as a deduction from realised reserves. A proposed distribution is recognised as
a liability in the period in which it is approved.
The Fund adopts the direct method in the preparation of the statement of cash flows.
21
AmBalanced
3. SUMMARY OF SIGNIFICANT ACCOUNTING POLICIES (CONT'D.)
3.8
(i) Debt instruments
Business model
Cash flow characteristics
(ii) Equity instruments and collective investment schemes
Financial assets – classification and subsequent measurement
The classification and subsequent measurement of debt instruments held by the Fund
are determined based on their business model and cash flow characteristics.
The business model reflects how the Fund manages the financial assets in order to
generate cash flows. That is, whether the Fund’s objective is solely to collect the
contractual cash flows from the assets, or is to collect both the contractual cash flows
and cash flows arising from the sale of assets. If neither of these is applicable (e.g. the
financial assets are held for trading purposes), then the financial assets are classified as
part of “other” business model. Factors considered by the Fund in determining the
business model for a portfolio of assets include past experience on how the cash flows
for these assets were collected, how the asset’s performance is evaluated and reported
to key management personnel, and how risks are assessed and managed.
Where the business model is to hold the financial assets to collect contractual cash
flows, or to collect contractual cash flows and sell, the Fund assesses whether the
financial assets’ contractual cash flows represent solely payment of principal and interest
(“SPPI”). In making this assessment, the Fund considers whether the contractual cash
flows are consistent with a basic lending arrangement, i.e. interest includes only
consideration for time value of money, credit risk, other basic lending risks and a profit
margin that is consistent with a basic lending arrangement. Financial assets with
embedded derivatives are considered in their entirety when determining whether their
cash flows are SPPI.
The Fund subsequently measures its investments in equity investments and collective
investment schemes at FVTPL. Dividends/distribution earned whilst holding the
investments are recognised in profit or loss when the right to the payment has been
established. Gains and losses on the investments, realised and unrealised, are included
in profit or loss.
22
AmBalanced
3. SUMMARY OF SIGNIFICANT ACCOUNTING POLICIES (CONT'D.)
3.9 Financial instruments under MFRS 9
(i) Classification and measurement
The Fund may classify its financial assets under the following categories:
Financial assets at amortised cost
Financial assets at FVOCI
Financial assets at FVTPL
A financial asset is measured at amortised cost if it is held within a business model
whose objective is to hold financial assets in order to collect contractual cash flows and
its contractual terms give rise on specified dates to cash flows that are solely payments
of principal and interest on the principal amount outstanding. The Fund includes in this
category deposits with financial institutions, cash at banks, amounts due from
brokers/financial institutions, amount due from the Manager and other receivables.
The classification of financial assets depends on the Fund’s business model of
managing the financial assets in order to generate cash flows (“business model test”)
and the contractual cash flow characteristics of the financial instruments (“SPPI test”).
The business model test determines whether cash flows will result from collecting
contractual cash flows, selling the financial assets, or both and the assessment is
performed on a portfolio basis. The SPPI test determines whether the contractual cash
flows are solely for payments of principal and interest and the assessment is performed
on a financial instrument basis.
A financial asset is measured at fair value through other comprehensive income
(“FVOCI”) if its business model is both to hold the asset to collect contractual cash flows
and to sell the financial asset. In addition, the contractual terms of the financial assets
give rise on specified dates to cash flows that are solely payments of principal and
interest on the outstanding principal.
These investments are initially recorded at fair value and transaction costs are expensed
in the profit or loss. Subsequent to initial recognition, these investments are remeasured
at fair value. All fair value adjustments are initially recognised through OCI. Debt
instruments at FVOCI are subject to impairment assessment.
Any financial assets that are not measured at amortised cost or FVOCI are measured at
fair value to profit or loss (“FVTPL”). Subsequent to initial recognition, financial assets at
FVTPL are measured at fair value. Changes in the fair value of those financial
instruments are recorded in “Net gain or loss on financial assets at FVTPL”. Interest
earned and dividend revenue elements of such instruments are recorded separately in
“Interest income” and “Dividend income” respectively. Exchange differences on financial
assets at FVTPL are not recognised separately in profit or loss but are included in net
gain or net loss on changes in fair value of financial assets at FVTPL.
23
AmBalanced
3. SUMMARY OF SIGNIFICANT ACCOUNTING POLICIES (CONT'D.)
3.9 Financial instruments under MFRS 9 (cont'd.)
(i) Classification and measurement (cont'd.)
Financial assets at FVTPL (cont'd.)
3.10
3.11 Derecognition of financial instruments
(i) Derecognition of financial asset
- the rights to receive cash flows from the asset have expired, or
-
- the Fund has transferred substantially all the risks and rewards of the asset, or
-
(ii) Derecognition of financial liability
Financial liabilities issued by the Fund are classified as financial liabilities at amortised cost,
where the substance of the contractual arrangement results in the Fund having an obligation
either to deliver cash or another financial asset to the holder. After initial measurement,
financial liabilities are subsequently measured at amortised cost using the effective interest
method. Amortised cost is calculated by taking into account any discount or premium on
acquisition and fees or costs that are an integral part of the effective interest rate.
A financial asset (or, where applicable a part of a financial asset or part of a group of
similar financial assets) is derecognised when:
Instruments that qualify for amortised cost or FVOCI may be irrevocably designated as
FVTPL, if doing so eliminates or significantly reduces a measurement or recognition
inconsistency. Equity instruments are normally measured at FVTPL, nevertheless, the
Fund is allowed to irrevocably designate equity instruments that are not held for trading
as FVOCI, with no subsequent reclassification of gains or losses to profit or loss.
Financial liabilities – classification and subsequent measurement
the Fund has transferred its rights to receive cash flows from the asset or has
assumed an obligation to pay the received cash flows in full without material delay
to a third party under a “pass-through” arrangement; and either:
the Fund has neither transferred nor retained substantially all the risks and
rewards of the asset, but has transferred control of the asset.
A financial liability is derecognised when the obligation under the liability is discharged,
cancelled or expired. Gains and losses are recognised in profit or loss when the liabilities
are recognised, and through the amortisation process.
24
AmBalanced
3. SUMMARY OF SIGNIFICANT ACCOUNTING POLICIES (CONT'D.)
3.12 Financial instruments – expected credit losses
-
-
-
3.13 Determination of fair value
3.14 Classification of realised and unrealised gains and losses
the time value of money; and
reasonable and supportable information that is available without undue cost or effort at
the reporting date about past events, current conditions and forecasts of future
economic conditions.
Financial assets together with the associated allowance are written off when it has exhausted
all practical recovery efforts and there is no realistic prospect of future recovery. The Fund
may also write-off financial assets that are still subject to enforcement activity when there is
no reasonable expectation of full recovery. If a write-off is later recovered, the recovery is
credited to profit or loss.
The Fund assesses on a forward-looking basis the expected credit losses (“ECL”) associated
with its financial assets at amortised cost. The Fund recognises a loss allowance for such
losses at each reporting date. The measurement of ECL reflects:
an unbiased and probability-weighted amount that is determined by evaluating a range
of possible outcomes;
The ECL in respect of financial assets at amortised cost, if any, is recognised in profit or loss.
For investments in local quoted securities, market value is determined based on the closing
price quoted on Bursa Malaysia Berhad. For the investment in collective investment scheme,
fair value is determined based on the closing net asset value per unit of the collective
investment scheme. For investments in local unquoted fixed income securities, fair value is
determined based on the indicative prices from Bond Pricing Agency Malaysia Sdn Bhd plus
accrued interest, which includes the accretion of discount and amortisation of premium.
Adjusted cost of investments relates to the purchase cost plus accrued interest, adjusted for
amortisation of premium and accretion of discount, if any, calculated over the period from the
date of acquisition to the date of maturity of the respective securities as approved by the
Manager and the Trustee. The difference between cost and fair value is treated as unrealised
gain or loss and is recognised in profit or loss. Unrealised gains or losses recognised in profit
or loss are not distributable in nature.
Unrealised gains and losses comprise changes in the fair value of financial instruments for
the period and from reversal of prior period’s unrealised gains and losses for financial
instruments which were realised (i.e. sold, redeemed or matured) during the reporting period.
Realised gains and losses on disposals of financial instruments are classified at fair value
through profit or loss and are calculated using weighted average method. They represent the
difference between an instrument’s initial carrying amount and disposal amount.
25
AmBalanced
3. SUMMARY OF SIGNIFICANT ACCOUNTING POLICIES (CONT'D.)
3.15 Significant accounting estimates and judgments
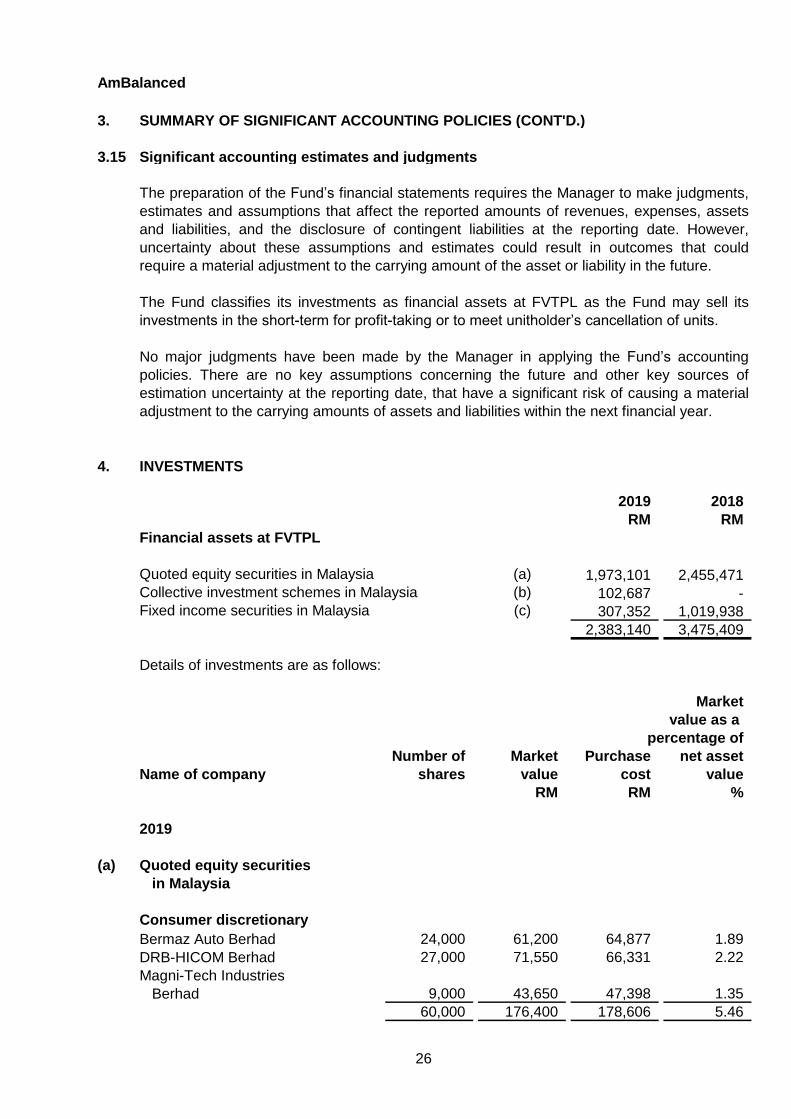
4. INVESTMENTS
2019 2018
RM RM
Financial assets at FVTPL
Quoted equity securities in Malaysia (a) 1,973,101 2,455,471
Collective investment schemes in Malaysia (b) 102,687 -
Fixed income securities in Malaysia (c) 307,352 1,019,938
2,383,140 3,475,409
Details of investments are as follows:
Market
value as a
percentage of
Number of Market Purchase net asset
Name of company shares value cost value
RM RM %
2019
(a) Quoted equity securities
in Malaysia
Consumer discretionary
Bermaz Auto Berhad 24,000 61,200 64,877 1.89
DRB-HICOM Berhad 27,000 71,550 66,331 2.22
Magni-Tech Industries
Berhad 9,000 43,650 47,398 1.35
60,000 176,400 178,606 5.46
No major judgments have been made by the Manager in applying the Fund’s accounting
policies. There are no key assumptions concerning the future and other key sources of
estimation uncertainty at the reporting date, that have a significant risk of causing a material
adjustment to the carrying amounts of assets and liabilities within the next financial year.
The preparation of the Fund’s financial statements requires the Manager to make judgments,
estimates and assumptions that affect the reported amounts of revenues, expenses, assets
and liabilities, and the disclosure of contingent liabilities at the reporting date. However,
uncertainty about these assumptions and estimates could result in outcomes that could
require a material adjustment to the carrying amount of the asset or liability in the future.
The Fund classifies its investments as financial assets at FVTPL as the Fund may sell its
investments in the short-term for profit-taking or to meet unitholder’s cancellation of units.
26
AmBalanced
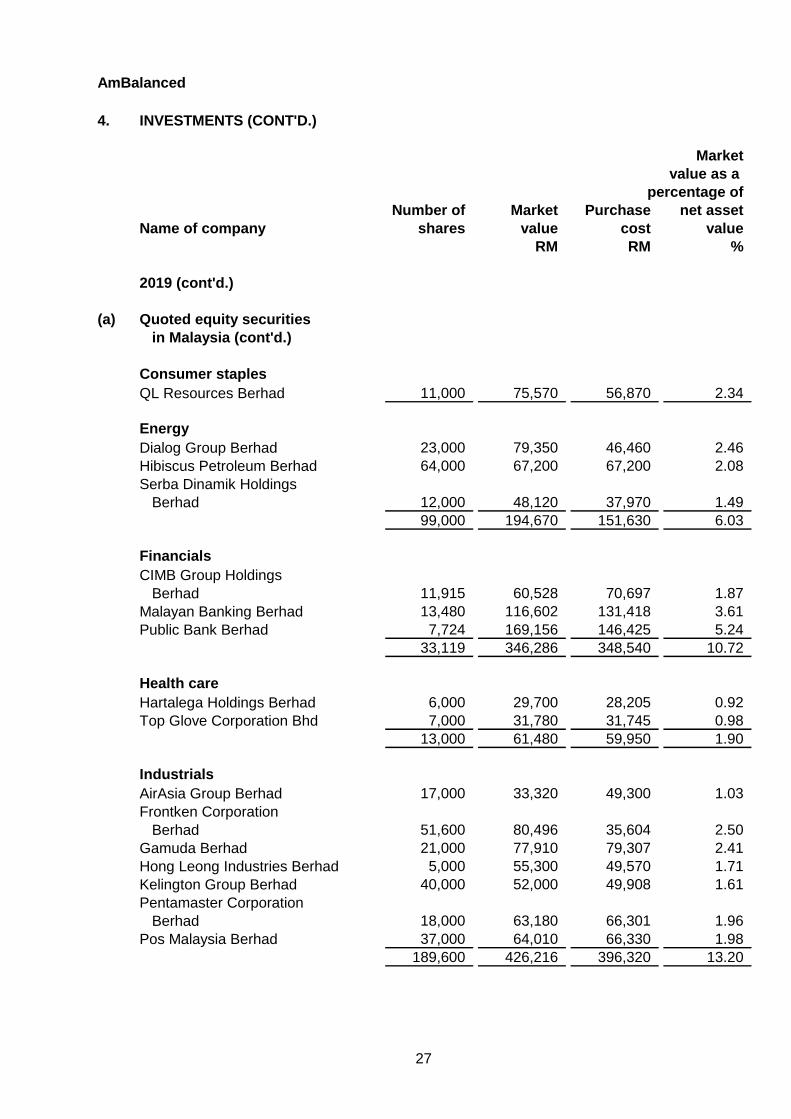
4. INVESTMENTS (CONT'D.)
Market
value as a
percentage of
Number of Market Purchase net asset
Name of company shares value cost value
RM RM %
2019 (cont'd.)
(a) Quoted equity securities
in Malaysia (cont'd.)
Consumer staples
QL Resources Berhad 11,000 75,570 56,870 2.34
Energy
Dialog Group Berhad 23,000 79,350 46,460 2.46
Hibiscus Petroleum Berhad 64,000 67,200 67,200 2.08
Serba Dinamik Holdings
Berhad 12,000 48,120 37,970 1.49
99,000 194,670 151,630 6.03
Financials
CIMB Group Holdings
Berhad 11,915 60,528 70,697 1.87
Malayan Banking Berhad 13,480 116,602 131,418 3.61
Public Bank Berhad 7,724 169,156 146,425 5.24
33,119 346,286 348,540 10.72
Health care
Hartalega Holdings Berhad 6,000 29,700 28,205 0.92
Top Glove Corporation Bhd 7,000 31,780 31,745 0.98
13,000 61,480 59,950 1.90
Industrials
AirAsia Group Berhad 17,000 33,320 49,300 1.03
Frontken Corporation
Berhad 51,600 80,496 35,604 2.50
Gamuda Berhad 21,000 77,910 79,307 2.41
Hong Leong Industries Berhad 5,000 55,300 49,570 1.71
Kelington Group Berhad 40,000 52,000 49,908 1.61
Pentamaster Corporation
Berhad 18,000 63,180 66,301 1.96
Pos Malaysia Berhad 37,000 64,010 66,330 1.98
189,600 426,216 396,320 13.20
27
AmBalanced
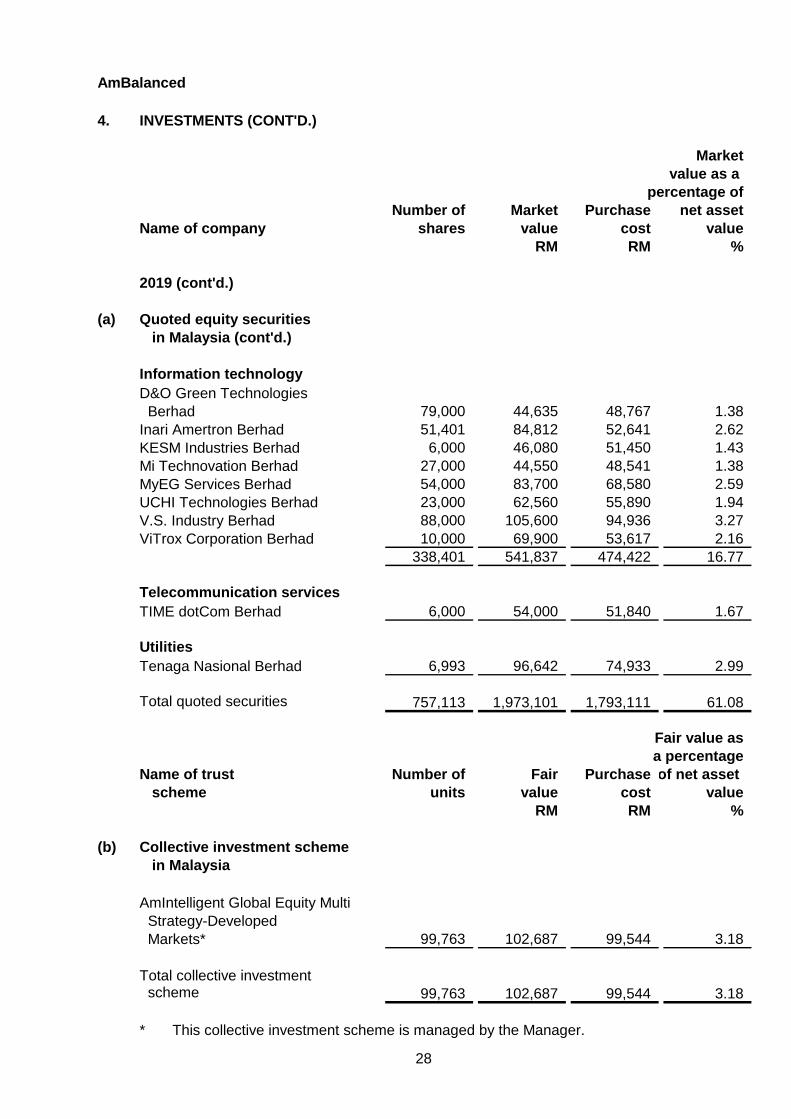
4. INVESTMENTS (CONT'D.)
Market
value as a
percentage of
Number of Market Purchase net asset
Name of company shares value cost value
RM RM %
2019 (cont'd.)
(a) Quoted equity securities
in Malaysia (cont'd.)
Information technology
D&O Green Technologies
Berhad 79,000 44,635 48,767 1.38
Inari Amertron Berhad 51,401 84,812 52,641 2.62
KESM Industries Berhad 6,000 46,080 51,450 1.43
Mi Technovation Berhad 27,000 44,550 48,541 1.38
MyEG Services Berhad 54,000 83,700 68,580 2.59
UCHI Technologies Berhad 23,000 62,560 55,890 1.94
V.S. Industry Berhad 88,000 105,600 94,936 3.27
ViTrox Corporation Berhad 10,000 69,900 53,617 2.16
338,401 541,837 474,422 16.77
Telecommunication services
TIME dotCom Berhad 6,000 54,000 51,840 1.67
Utilities
Tenaga Nasional Berhad 6,993 96,642 74,933 2.99
Total quoted securities 757,113 1,973,101 1,793,111 61.08
Fair value as
a percentage
Name of trust Number of Fair Purchase of net asset
scheme units value cost value
RM RM %
(b) Collective investment scheme
in Malaysia
AmIntelligent Global Equity Multi
Strategy-Developed
Markets* 99,763 102,687 99,544 3.18
Total collective investment scheme 99,763 102,687 99,544 3.18
* This collective investment scheme is managed by the Manager.
28
AmBalanced
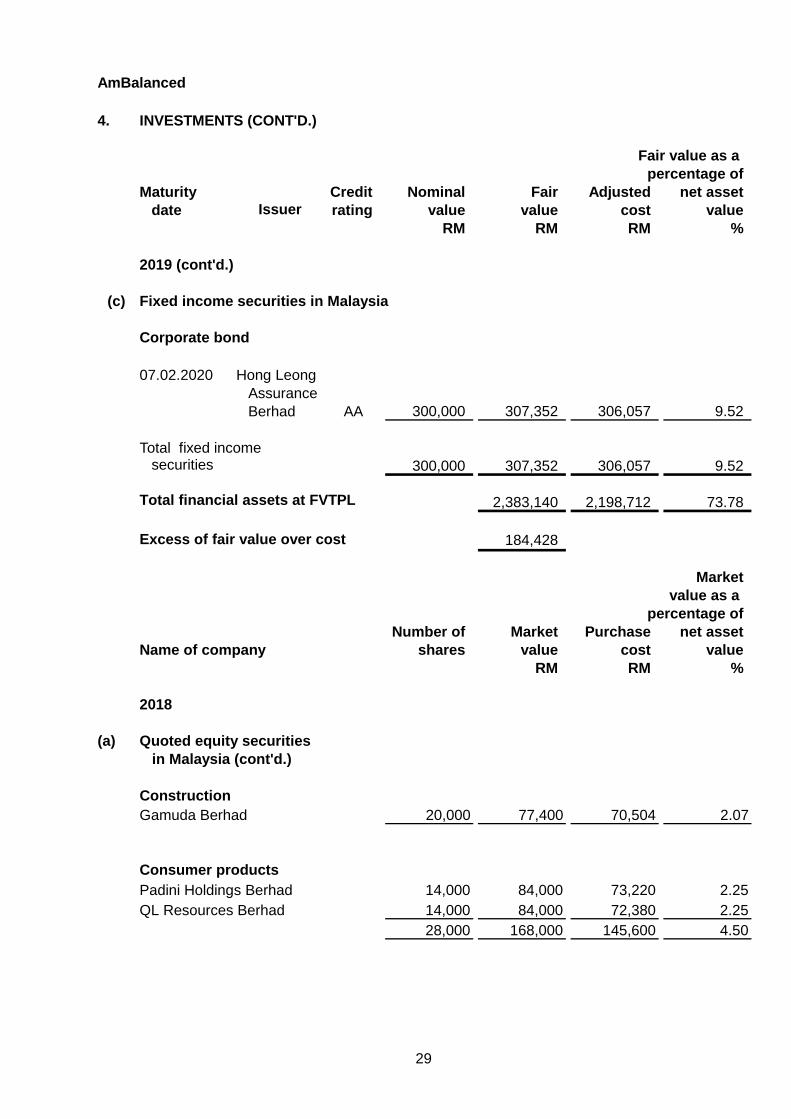
4. INVESTMENTS (CONT'D.)
Fair value as a
percentage of
Maturity Credit Nominal Fair Adjusted net asset
date Issuer rating value value cost value
RM RM RM %
2019 (cont'd.)
(c) Fixed income securities in Malaysia
Corporate bond
07.02.2020 Hong Leong
Assurance
Berhad AA 300,000 307,352 306,057 9.52
Total fixed incomesecurities 300,000 307,352 306,057 9.52
Total financial assets at FVTPL 2,383,140 2,198,712 73.78
Excess of fair value over cost 184,428
Market
value as a
percentage of
Number of Market Purchase net asset
Name of company shares value cost value
RM RM %
2018
(a) Quoted equity securities
in Malaysia (cont'd.)
Construction
Gamuda Berhad 20,000 77,400 70,504 2.07
Consumer products
Padini Holdings Berhad 14,000 84,000 73,220 2.25
QL Resources Berhad 14,000 84,000 72,380 2.25
28,000 168,000 145,600 4.50
29
AmBalanced
4. INVESTMENTS (CONT'D.)
Market
value as a
percentage of
Number of Market Purchase net asset
Name of company shares value cost value
RM RM %
2018 (cont'd.)
(a) Quoted equity securities
in Malaysia (cont'd.)
Finance
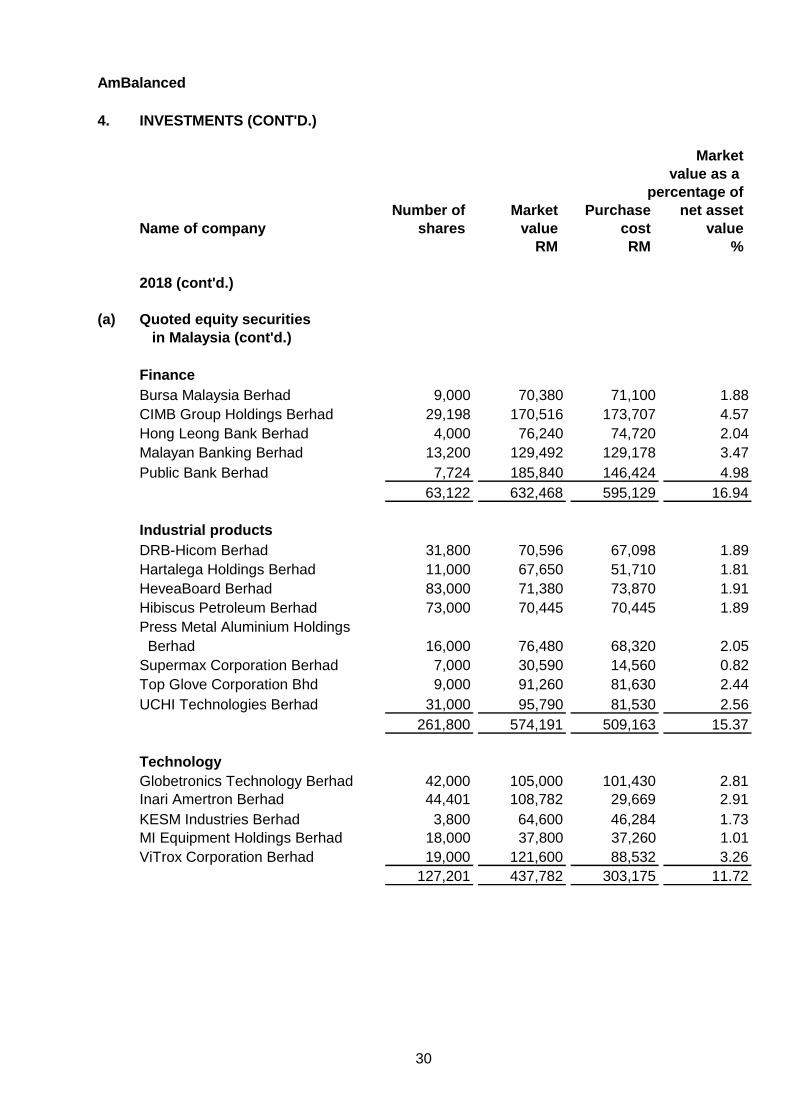
Bursa Malaysia Berhad 9,000 70,380 71,100 1.88
CIMB Group Holdings Berhad 29,198 170,516 173,707 4.57
Hong Leong Bank Berhad 4,000 76,240 74,720 2.04
Malayan Banking Berhad 13,200 129,492 129,178 3.47
Public Bank Berhad 7,724 185,840 146,424 4.98
63,122 632,468 595,129 16.94
Industrial products
DRB-Hicom Berhad 31,800 70,596 67,098 1.89
Hartalega Holdings Berhad 11,000 67,650 51,710 1.81
HeveaBoard Berhad 83,000 71,380 73,870 1.91
Hibiscus Petroleum Berhad 73,000 70,445 70,445 1.89
Press Metal Aluminium Holdings
Berhad 16,000 76,480 68,320 2.05
Supermax Corporation Berhad 7,000 30,590 14,560 0.82
Top Glove Corporation Bhd 9,000 91,260 81,630 2.44
UCHI Technologies Berhad 31,000 95,790 81,530 2.56
261,800 574,191 509,163 15.37
Technology
Globetronics Technology Berhad 42,000 105,000 101,430 2.81
Inari Amertron Berhad 44,401 108,782 29,669 2.91
KESM Industries Berhad 3,800 64,600 46,284 1.73
MI Equipment Holdings Berhad 18,000 37,800 37,260 1.01
ViTrox Corporation Berhad 19,000 121,600 88,532 3.26
127,201 437,782 303,175 11.72
30
AmBalanced
4. INVESTMENTS (CONT'D.)
Market
value as a
percentage of
Number of Market Purchase net asset
Name of company shares value cost value
RM RM %
2018 (cont'd.)
(a) Quoted equity securities
in Malaysia (cont'd.)
Trading/Services
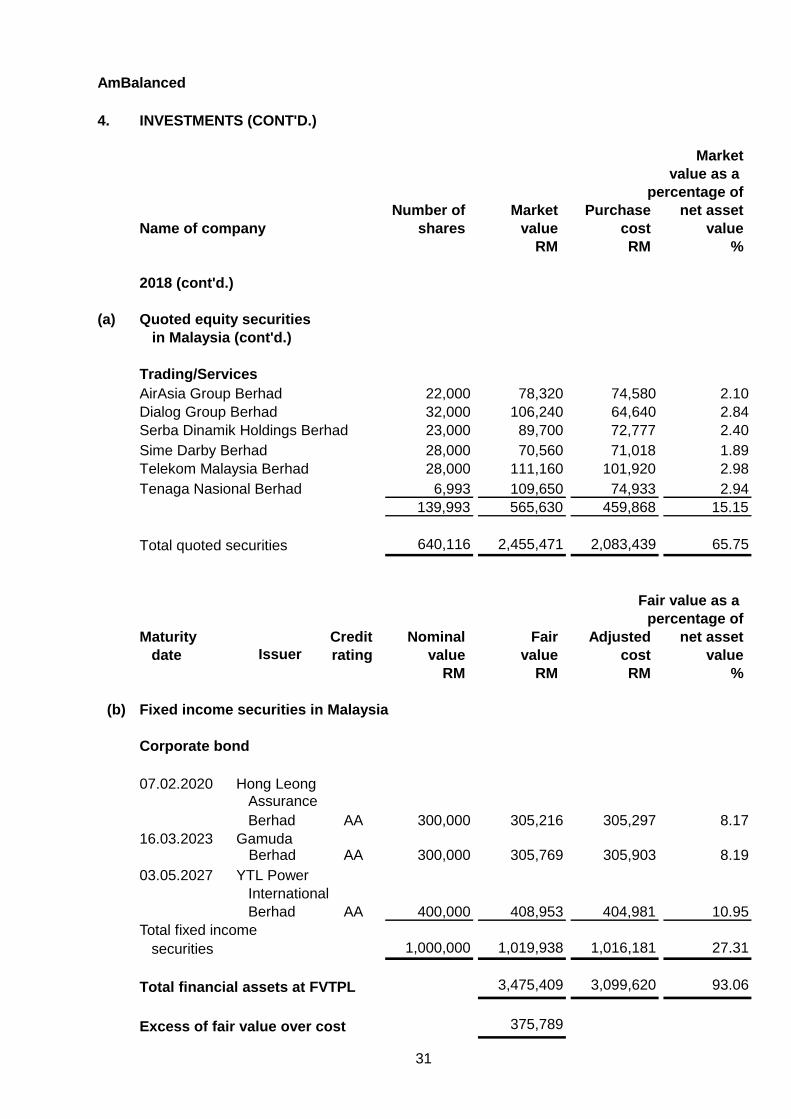
AirAsia Group Berhad 22,000 78,320 74,580 2.10
Dialog Group Berhad 32,000 106,240 64,640 2.84
Serba Dinamik Holdings Berhad 23,000 89,700 72,777 2.40
Sime Darby Berhad 28,000 70,560 71,018 1.89
Telekom Malaysia Berhad 28,000 111,160 101,920 2.98
Tenaga Nasional Berhad 6,993 109,650 74,933 2.94
139,993 565,630 459,868 15.15
Total quoted securities 640,116 2,455,471 2,083,439 65.75
Fair value as a
percentage of
Maturity Credit Nominal Fair Adjusted net asset
date Issuer rating value value cost value
RM RM RM %
(b) Fixed income securities in Malaysia
Corporate bond
07.02.2020 Hong Leong
Assurance
Berhad AA 300,000 305,216 305,297 8.17
16.03.2023 Gamuda Berhad AA 300,000 305,769 305,903 8.19
03.05.2027 YTL Power
International
Berhad AA 400,000 408,953 404,981 10.95
Total fixed income
securities 1,000,000 1,019,938 1,016,181 27.31
Total financial assets at FVTPL 3,475,409 3,099,620 93.06
Excess of fair value over cost 375,789
31
AmBalanced
4. INVESTMENTS (CONT'D.)
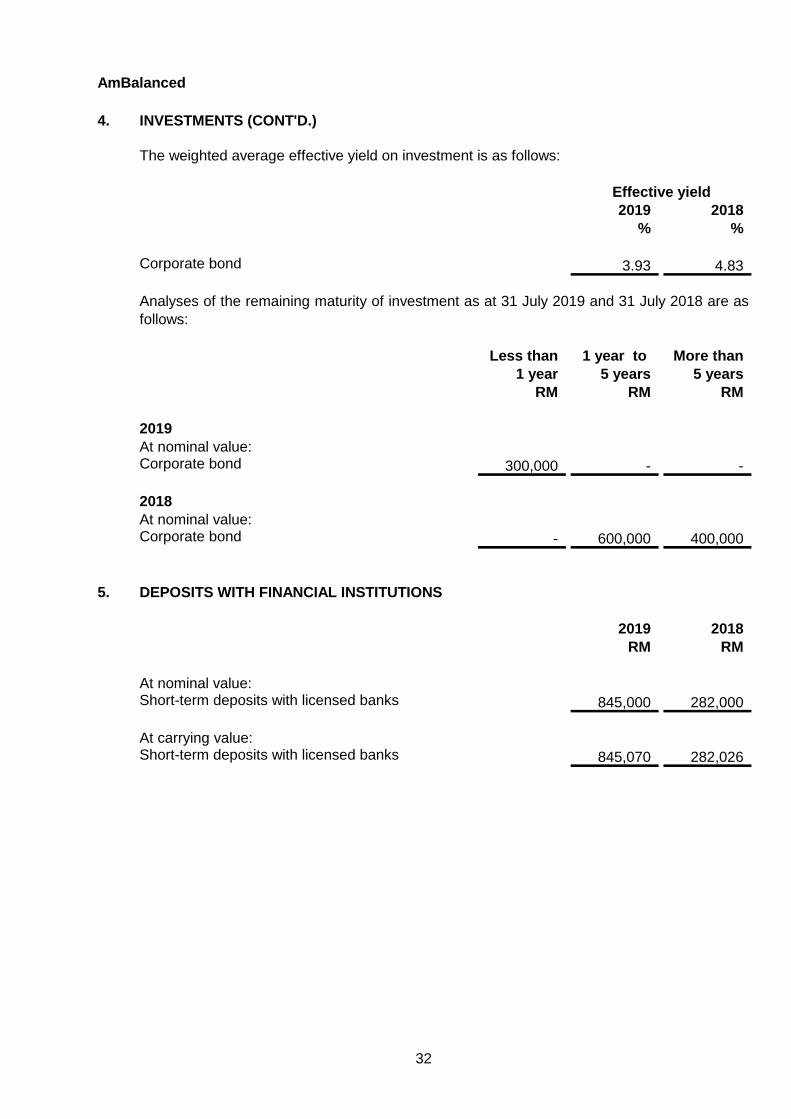
The weighted average effective yield on investment is as follows:
2019 2018
% %
Corporate bond 3.93 4.83
Less than 1 year to More than
1 year 5 years 5 years
RM RM RM
At nominal value:Corporate bond 300,000 - -
At nominal value:Corporate bond - 600,000 400,000
5. DEPOSITS WITH FINANCIAL INSTITUTIONS
2019 2018
RM RM
At nominal value:Short-term deposits with licensed banks 845,000 282,000
At carrying value:Short-term deposits with licensed banks 845,070 282,026
Effective yield
Analyses of the remaining maturity of investment as at 31 July 2019 and 31 July 2018 are as
follows:
2018
2019
32
AmBalanced
5. DEPOSITS WITH FINANCIAL INSTITUTIONS (CONT'D.)
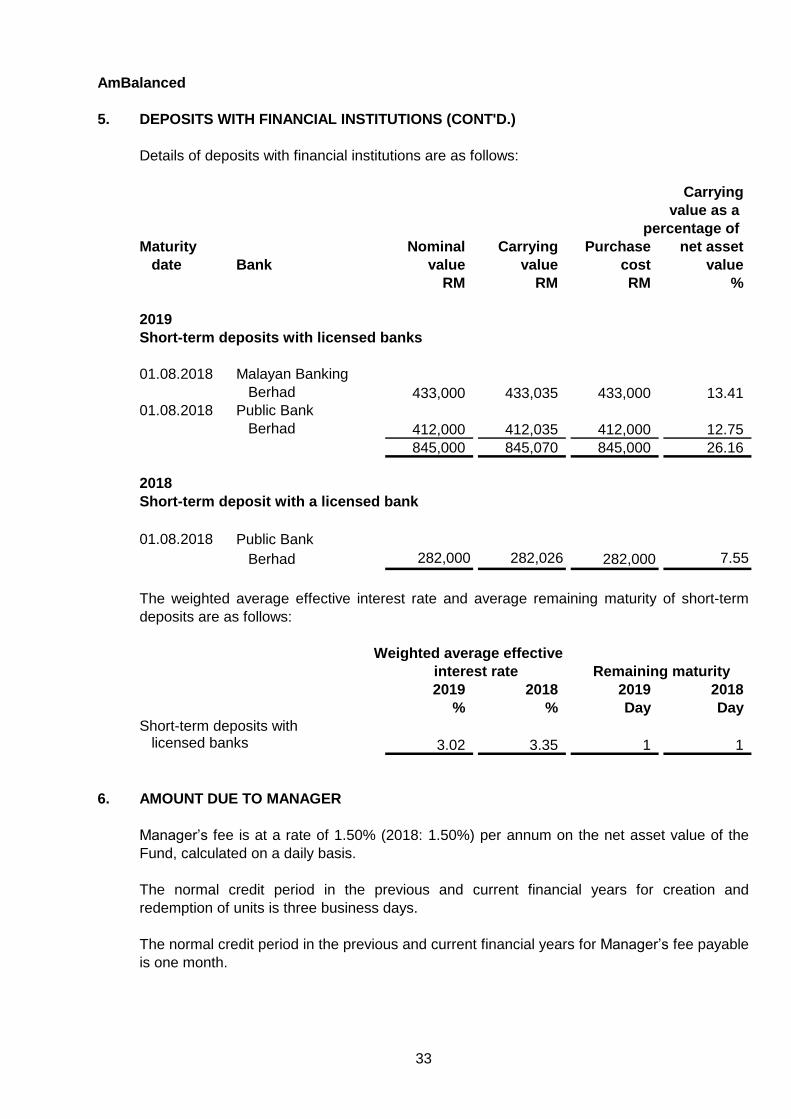
Details of deposits with financial institutions are as follows:
Carrying
value as a
percentage of
Maturity Nominal Carrying Purchase net asset
date Bank value value cost value
RM RM RM %
2019
Short-term deposits with licensed banks
Malayan Banking
Berhad 433,000 433,035 433,000 13.41
Public Bank
Berhad 412,000 412,035 412,000 12.75
845,000 845,070 845,000 26.16
2018
Short-term deposit with a licensed bank
Public Bank
Berhad 282,000 282,026 282,000 7.55
Weighted average effective
2019 2018 2019 2018
% % Day Day
Short-term deposits withlicensed banks 3.02 3.35 1 1
6. AMOUNT DUE TO MANAGER
Manager’s fee is at a rate of 1.50% (2018: 1.50%) per annum on the net asset value of the
Fund, calculated on a daily basis.
01.08.2018
The weighted average effective interest rate and average remaining maturity of short-term
deposits are as follows:
interest rate Remaining maturity
01.08.2018
01.08.2018
The normal credit period in the previous and current financial years for creation and
redemption of units is three business days.
The normal credit period in the previous and current financial years for Manager’s fee payable
is one month.
33
AmBalanced
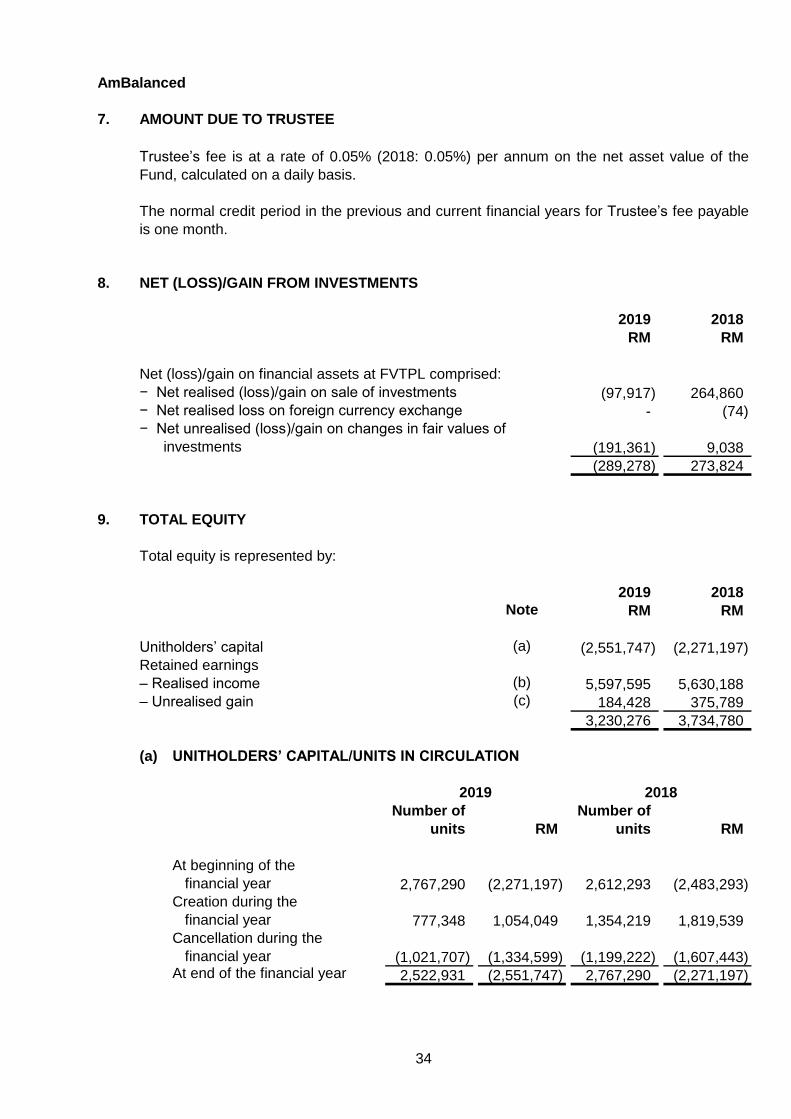
7. AMOUNT DUE TO TRUSTEE
8. NET (LOSS)/GAIN FROM INVESTMENTS
2019 2018
RM RM
Net (loss)/gain on financial assets at FVTPL comprised:
− Net realised (loss)/gain on sale of investments (97,917) 264,860
− Net realised loss on foreign currency exchange - (74)
− Net unrealised (loss)/gain on changes in fair values of
investments (191,361) 9,038
(289,278) 273,824
9. TOTAL EQUITY
Total equity is represented by:
2019 2018
Note RM RM
Unitholders’ capital (a) (2,551,747) (2,271,197)
Retained earnings
– Realised income (b) 5,597,595 5,630,188
– Unrealised gain (c) 184,428 375,789
3,230,276 3,734,780
(a) UNITHOLDERS’ CAPITAL/UNITS IN CIRCULATION
Number of Number of
units RM units RM
At beginning of the
financial year 2,767,290 (2,271,197) 2,612,293 (2,483,293)
Creation during the
financial year 777,348 1,054,049 1,354,219 1,819,539
Cancellation during the
financial year (1,021,707) (1,334,599) (1,199,222) (1,607,443) At end of the financial year 2,522,931 (2,551,747) 2,767,290 (2,271,197)
2018
The normal credit period in the previous and current financial years for Trustee’s fee payable
is one month.
Trustee’s fee is at a rate of 0.05% (2018: 0.05%) per annum on the net asset value of the
Fund, calculated on a daily basis.
2019
34
AmBalanced
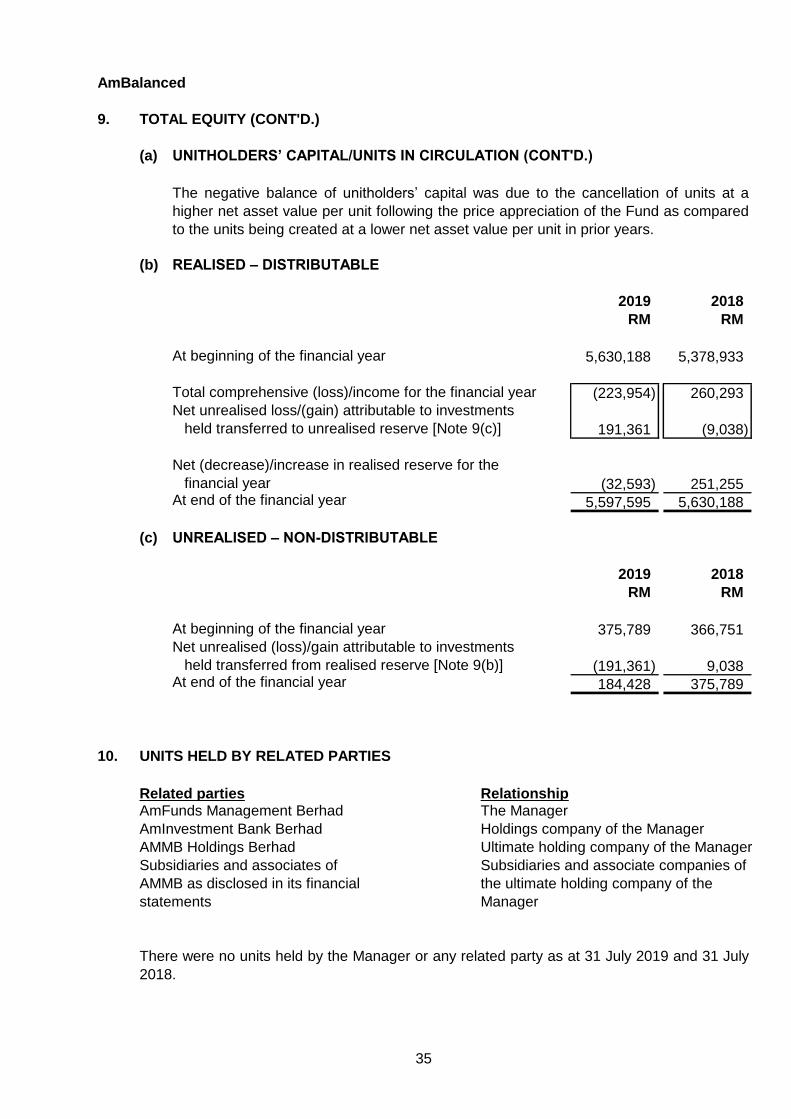
9. TOTAL EQUITY (CONT'D.)
(a) UNITHOLDERS’ CAPITAL/UNITS IN CIRCULATION (CONT'D.)
(b) REALISED – DISTRIBUTABLE
2019 2018
RM RM
At beginning of the financial year 5,630,188 5,378,933
Total comprehensive (loss)/income for the financial year (223,954) 260,293
Net unrealised loss/(gain) attributable to investments
held transferred to unrealised reserve [Note 9(c)] 191,361 (9,038)
Net (decrease)/increase in realised reserve for the
financial year (32,593) 251,255 At end of the financial year 5,597,595 5,630,188
(c) UNREALISED – NON-DISTRIBUTABLE
2019 2018
RM RM
At beginning of the financial year 375,789 366,751
Net unrealised (loss)/gain attributable to investments
held transferred from realised reserve [Note 9(b)] (191,361) 9,038 At end of the financial year 184,428 375,789
10. UNITS HELD BY RELATED PARTIES
Related parties RelationshipAmFunds Management Berhad The Manager
AmInvestment Bank Berhad Holdings company of the Manager
AMMB Holdings Berhad Ultimate holding company of the Manager
There were no units held by the Manager or any related party as at 31 July 2019 and 31 July
2018.
Subsidiaries and associates of
AMMB as disclosed in its financial
statements
The negative balance of unitholders’ capital was due to the cancellation of units at a
higher net asset value per unit following the price appreciation of the Fund as compared
to the units being created at a lower net asset value per unit in prior years.
Subsidiaries and associate companies of
the ultimate holding company of the
Manager
35
AmBalanced
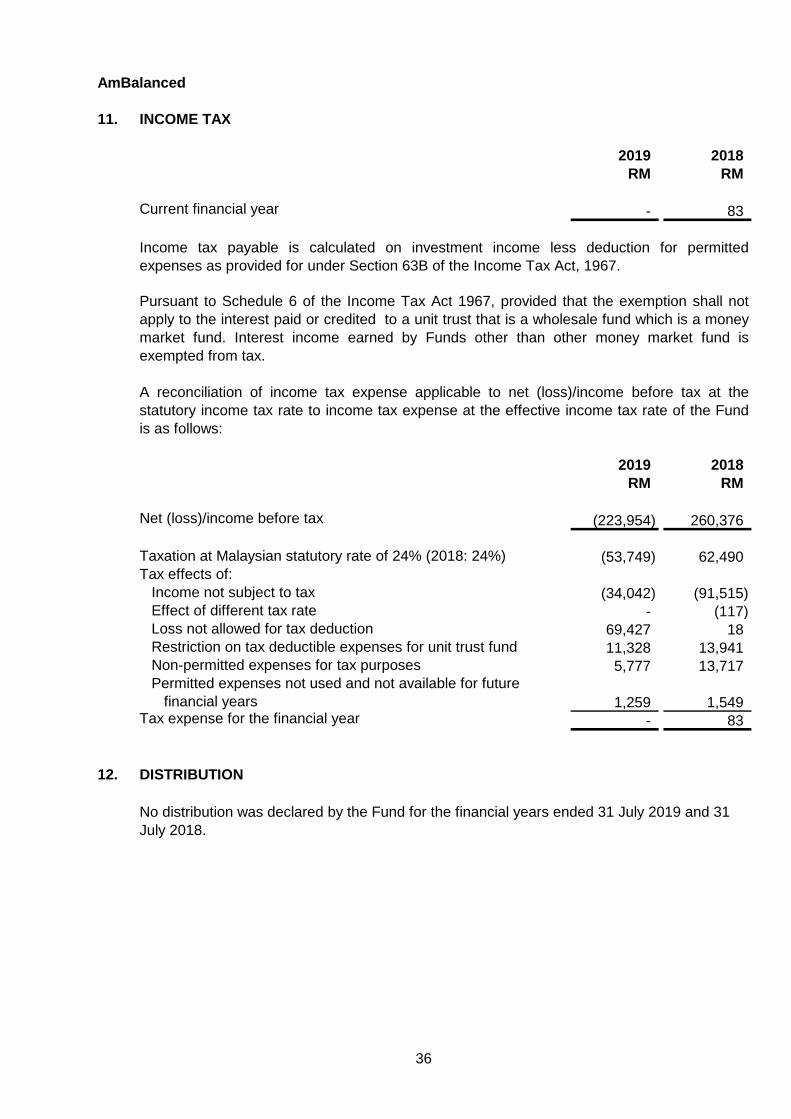
11. INCOME TAX
2019 2018
RM RM
Current financial year - 83
2019 2018
RM RM
Net (loss)/income before tax (223,954) 260,376
Taxation at Malaysian statutory rate of 24% (2018: 24%) (53,749) 62,490
Tax effects of:
Income not subject to tax (34,042) (91,515)
Effect of different tax rate - (117)
Loss not allowed for tax deduction 69,427 18
Restriction on tax deductible expenses for unit trust fund 11,328 13,941
Non-permitted expenses for tax purposes 5,777 13,717
Permitted expenses not used and not available for future
financial years 1,259 1,549 Tax expense for the financial year - 83
12. DISTRIBUTION
Pursuant to Schedule 6 of the Income Tax Act 1967, provided that the exemption shall not
apply to the interest paid or credited to a unit trust that is a wholesale fund which is a money
market fund. Interest income earned by Funds other than other money market fund is
exempted from tax.
A reconciliation of income tax expense applicable to net (loss)/income before tax at the
statutory income tax rate to income tax expense at the effective income tax rate of the Fund
is as follows:
Income tax payable is calculated on investment income less deduction for permitted
expenses as provided for under Section 63B of the Income Tax Act, 1967.
No distribution was declared by the Fund for the financial years ended 31 July 2019 and 31
July 2018.
36
AmBalanced
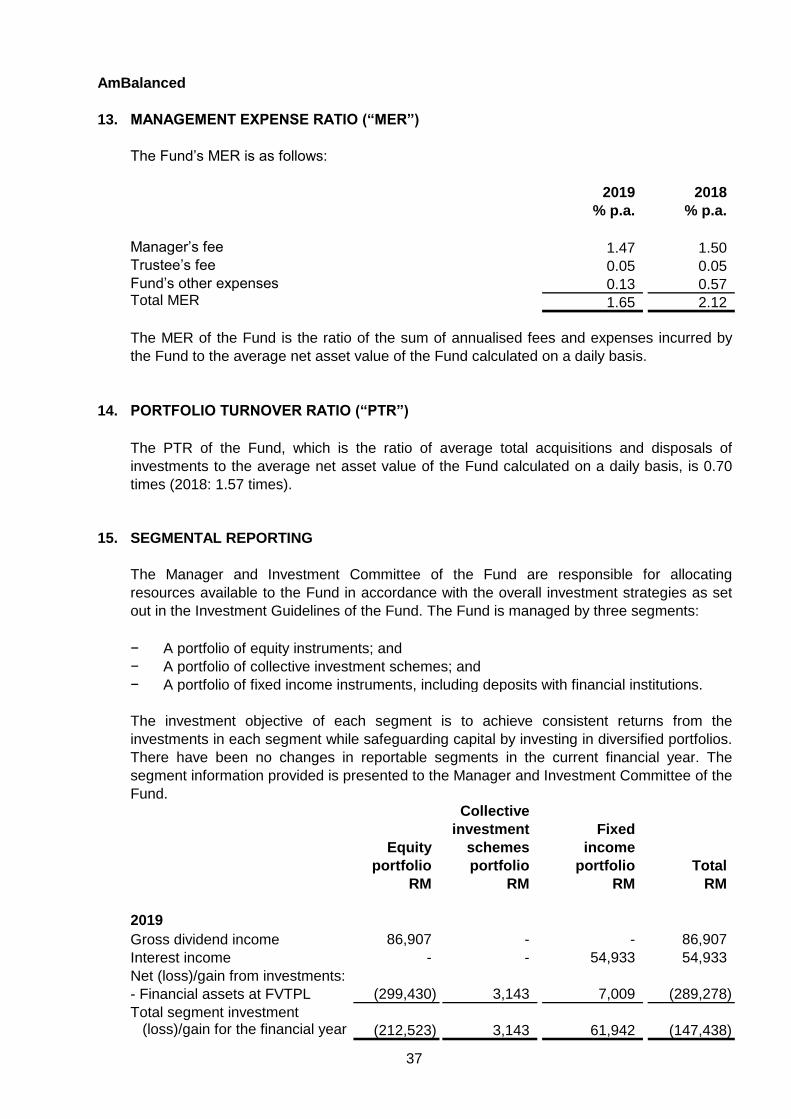
13. MANAGEMENT EXPENSE RATIO (“MER”)
The Fund’s MER is as follows:
2019 2018
% p.a. % p.a.
Manager’s fee 1.47 1.50
Trustee’s fee 0.05 0.05
Fund’s other expenses 0.13 0.57 Total MER 1.65 2.12
14. PORTFOLIO TURNOVER RATIO (“PTR”)
15. SEGMENTAL REPORTING
− A portfolio of equity instruments; and
− A portfolio of collective investment schemes; and
− A portfolio of fixed income instruments, including deposits with financial institutions.
Collective
investment Fixed
Equity schemes income
portfolio portfolio portfolio Total
RM RM RM RM
Gross dividend income 86,907 - - 86,907
Interest income - - 54,933 54,933
Net (loss)/gain from investments:
- Financial assets at FVTPL (299,430) 3,143 7,009 (289,278)
Total segment investment(loss)/gain for the financial year (212,523) 3,143 61,942 (147,438)
The MER of the Fund is the ratio of the sum of annualised fees and expenses incurred by
the Fund to the average net asset value of the Fund calculated on a daily basis.
The Manager and Investment Committee of the Fund are responsible for allocating
resources available to the Fund in accordance with the overall investment strategies as set
out in the Investment Guidelines of the Fund. The Fund is managed by three segments:
The investment objective of each segment is to achieve consistent returns from the
investments in each segment while safeguarding capital by investing in diversified portfolios.
There have been no changes in reportable segments in the current financial year. The
segment information provided is presented to the Manager and Investment Committee of the
Fund.
The PTR of the Fund, which is the ratio of average total acquisitions and disposals of
investments to the average net asset value of the Fund calculated on a daily basis, is 0.70
times (2018: 1.57 times).
2019
37
AmBalanced
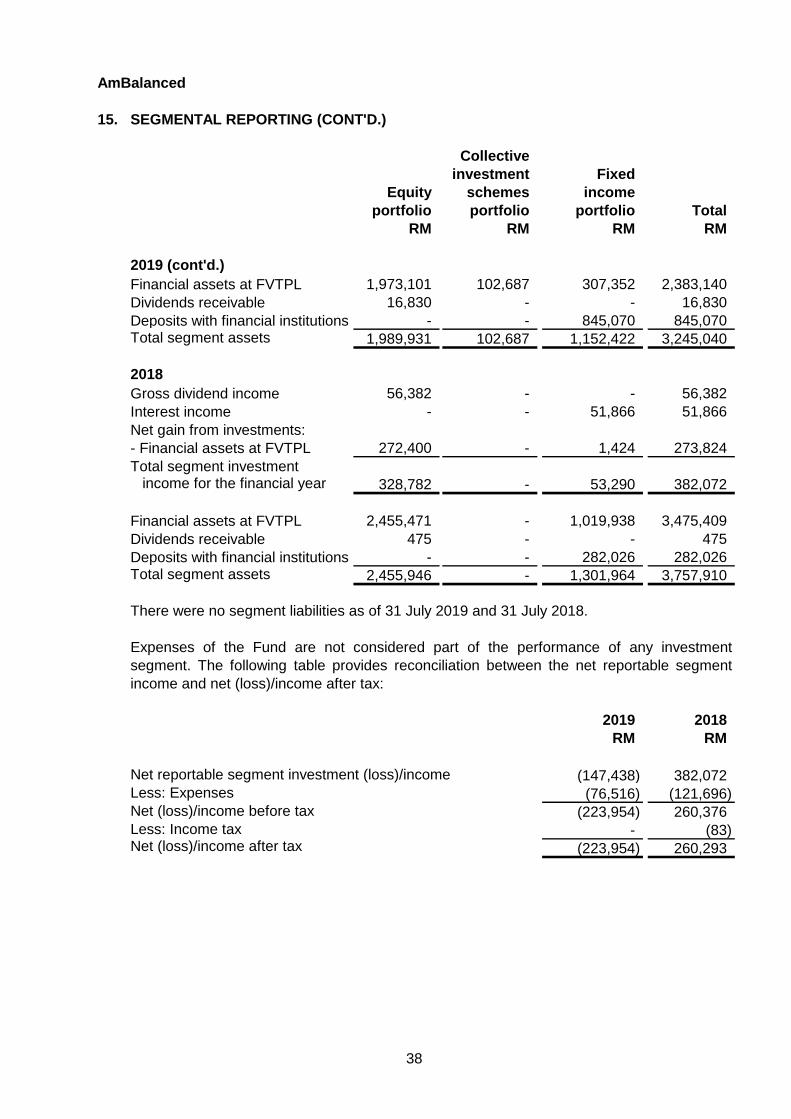
15. SEGMENTAL REPORTING (CONT'D.)
Collective
investment Fixed
Equity schemes income
portfolio portfolio portfolio Total
RM RM RM RM
2019 (cont'd.)
Financial assets at FVTPL 1,973,101 102,687 307,352 2,383,140
Dividends receivable 16,830 - - 16,830
Deposits with financial institutions - - 845,070 845,070 Total segment assets 1,989,931 102,687 1,152,422 3,245,040
Gross dividend income 56,382 - - 56,382
Interest income - - 51,866 51,866
Net gain from investments:
- Financial assets at FVTPL 272,400 - 1,424 273,824
Total segment investmentincome for the financial year 328,782 - 53,290 382,072
Financial assets at FVTPL 2,455,471 - 1,019,938 3,475,409
Dividends receivable 475 - - 475
Deposits with financial institutions - - 282,026 282,026 Total segment assets 2,455,946 - 1,301,964 3,757,910
There were no segment liabilities as of 31 July 2019 and 31 July 2018.
2019 2018
RM RM
Net reportable segment investment (loss)/income (147,438) 382,072
Less: Expenses (76,516) (121,696)
Net (loss)/income before tax (223,954) 260,376
Less: Income tax - (83) Net (loss)/income after tax (223,954) 260,293
2018
Expenses of the Fund are not considered part of the performance of any investment
segment. The following table provides reconciliation between the net reportable segment
income and net (loss)/income after tax:
38
AmBalanced
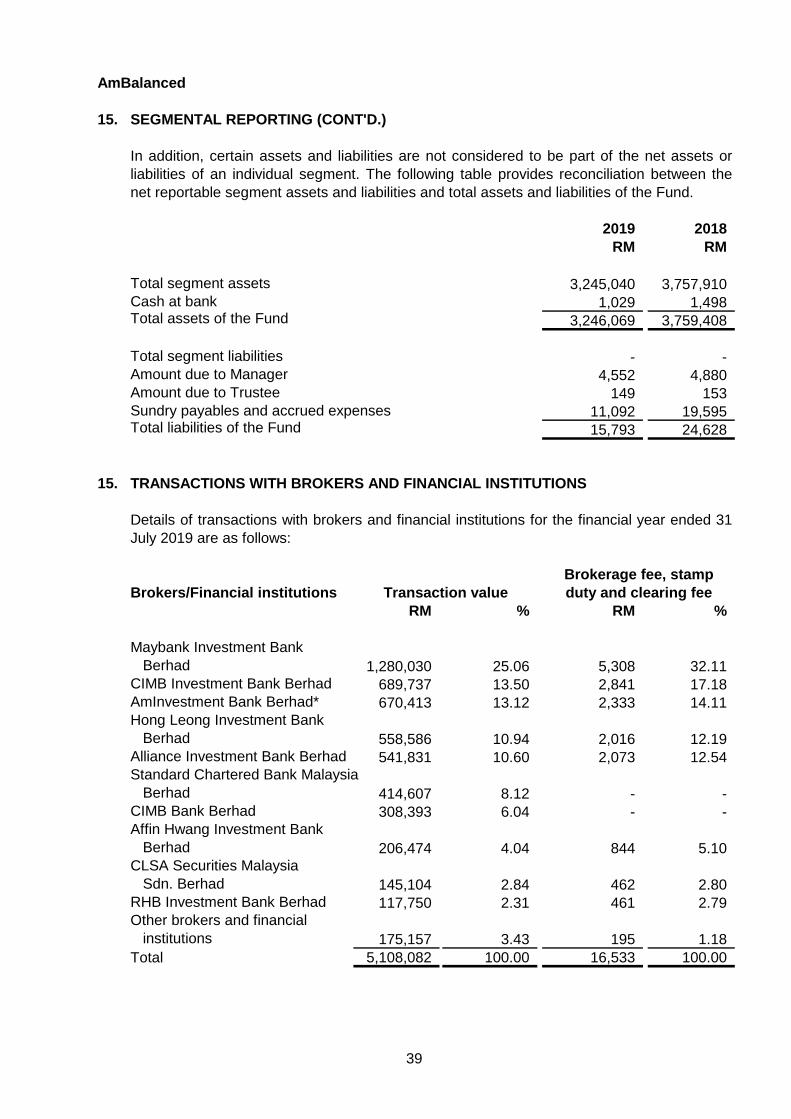
15. SEGMENTAL REPORTING (CONT'D.)
2019 2018
RM RM
Total segment assets 3,245,040 3,757,910
Cash at bank 1,029 1,498 Total assets of the Fund 3,246,069 3,759,408
Total segment liabilities - -
Amount due to Manager 4,552 4,880
Amount due to Trustee 149 153
Sundry payables and accrued expenses 11,092 19,595 Total liabilities of the Fund 15,793 24,628
15. TRANSACTIONS WITH BROKERS AND FINANCIAL INSTITUTIONS
Brokerage fee, stamp
Brokers/Financial institutions Transaction value duty and clearing fee
RM % RM %
Maybank Investment Bank
Berhad 1,280,030 25.06 5,308 32.11
CIMB Investment Bank Berhad 689,737 13.50 2,841 17.18
AmInvestment Bank Berhad* 670,413 13.12 2,333 14.11
Hong Leong Investment Bank
Berhad 558,586 10.94 2,016 12.19
Alliance Investment Bank Berhad 541,831 10.60 2,073 12.54
Standard Chartered Bank Malaysia
Berhad 414,607 8.12 - -
CIMB Bank Berhad 308,393 6.04 - -
Affin Hwang Investment Bank
Berhad 206,474 4.04 844 5.10
CLSA Securities Malaysia
Sdn. Berhad 145,104 2.84 462 2.80
RHB Investment Bank Berhad 117,750 2.31 461 2.79
Other brokers and financial
institutions 175,157 3.43 195 1.18
Total 5,108,082 100.00 16,533 100.00
Details of transactions with brokers and financial institutions for the financial year ended 31
July 2019 are as follows:
In addition, certain assets and liabilities are not considered to be part of the net assets or
liabilities of an individual segment. The following table provides reconciliation between the
net reportable segment assets and liabilities and total assets and liabilities of the Fund.
39
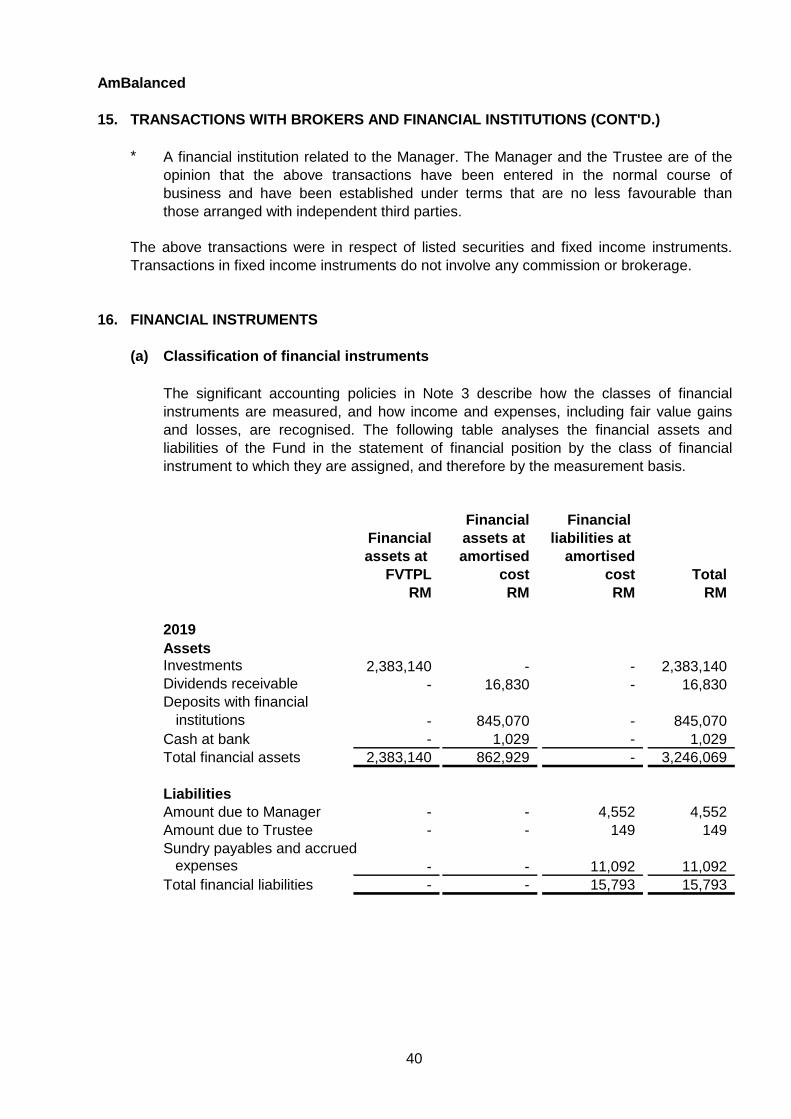
AmBalanced
15. TRANSACTIONS WITH BROKERS AND FINANCIAL INSTITUTIONS (CONT'D.)
*
16. FINANCIAL INSTRUMENTS
(a) Classification of financial instruments
Financial Financial
Financial assets at liabilities at
assets at amortised amortised
FVTPL cost cost Total
RM RM RM RM
AssetsInvestments 2,383,140 - - 2,383,140
Dividends receivable - 16,830 - 16,830
Deposits with financial
institutions - 845,070 - 845,070
Cash at bank - 1,029 - 1,029
Total financial assets 2,383,140 862,929 - 3,246,069
Liabilities
Amount due to Manager - - 4,552 4,552
Amount due to Trustee - - 149 149
Sundry payables and accrued
expenses - - 11,092 11,092
Total financial liabilities - - 15,793 15,793
A financial institution related to the Manager. The Manager and the Trustee are of the
opinion that the above transactions have been entered in the normal course of
business and have been established under terms that are no less favourable than
those arranged with independent third parties.
The above transactions were in respect of listed securities and fixed income instruments.
Transactions in fixed income instruments do not involve any commission or brokerage.
The significant accounting policies in Note 3 describe how the classes of financial
instruments are measured, and how income and expenses, including fair value gains
and losses, are recognised. The following table analyses the financial assets and
liabilities of the Fund in the statement of financial position by the class of financial
instrument to which they are assigned, and therefore by the measurement basis.
2019
40
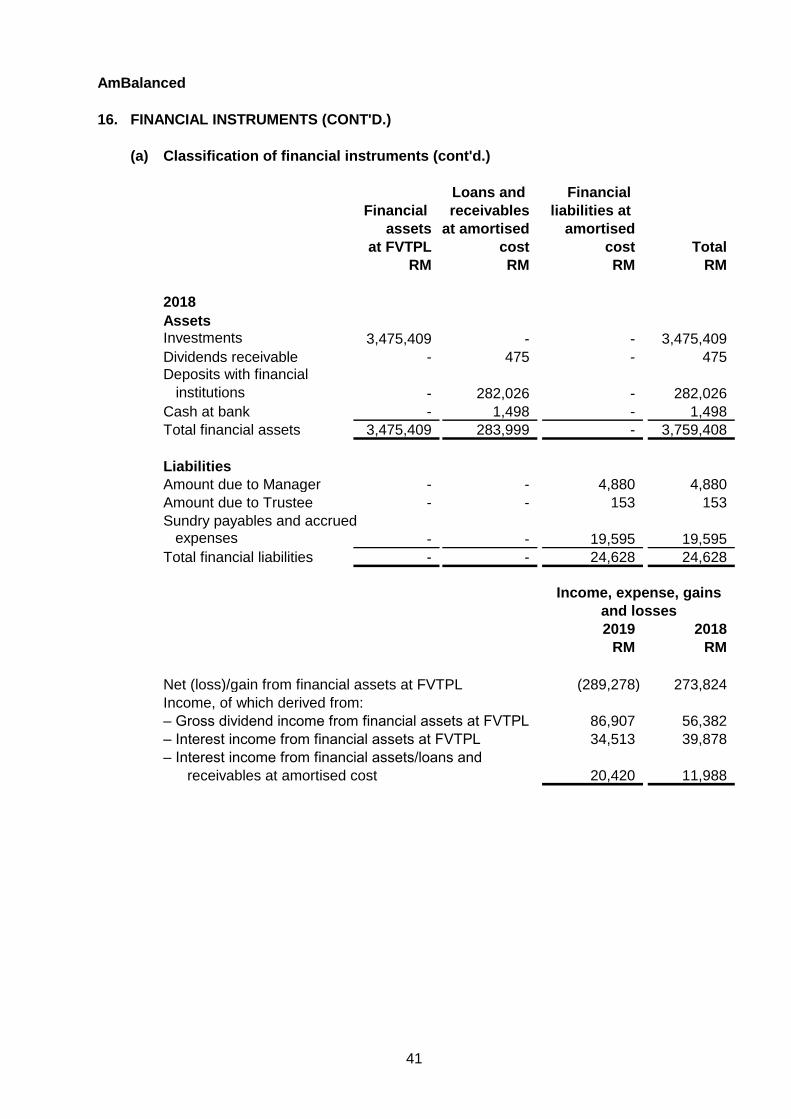
AmBalanced
16. FINANCIAL INSTRUMENTS (CONT'D.)
(a) Classification of financial instruments (cont'd.)
Loans and Financial
Financial receivables liabilities at
assets at amortised amortised
at FVTPL cost cost Total
RM RM RM RM
AssetsInvestments 3,475,409 - - 3,475,409
Dividends receivable - 475 - 475
Deposits with financial
institutions - 282,026 - 282,026
Cash at bank - 1,498 - 1,498
Total financial assets 3,475,409 283,999 - 3,759,408
Liabilities
Amount due to Manager - - 4,880 4,880
Amount due to Trustee - - 153 153
Sundry payables and accrued
expenses - - 19,595 19,595
Total financial liabilities - - 24,628 24,628
Income, expense, gains
and losses
2019 2018
RM RM
Net (loss)/gain from financial assets at FVTPL (289,278) 273,824
Income, of which derived from:
– Gross dividend income from financial assets at FVTPL 86,907 56,382
– Interest income from financial assets at FVTPL 34,513 39,878
– Interest income from financial assets/loans and
receivables at amortised cost 20,420 11,988
2018
41
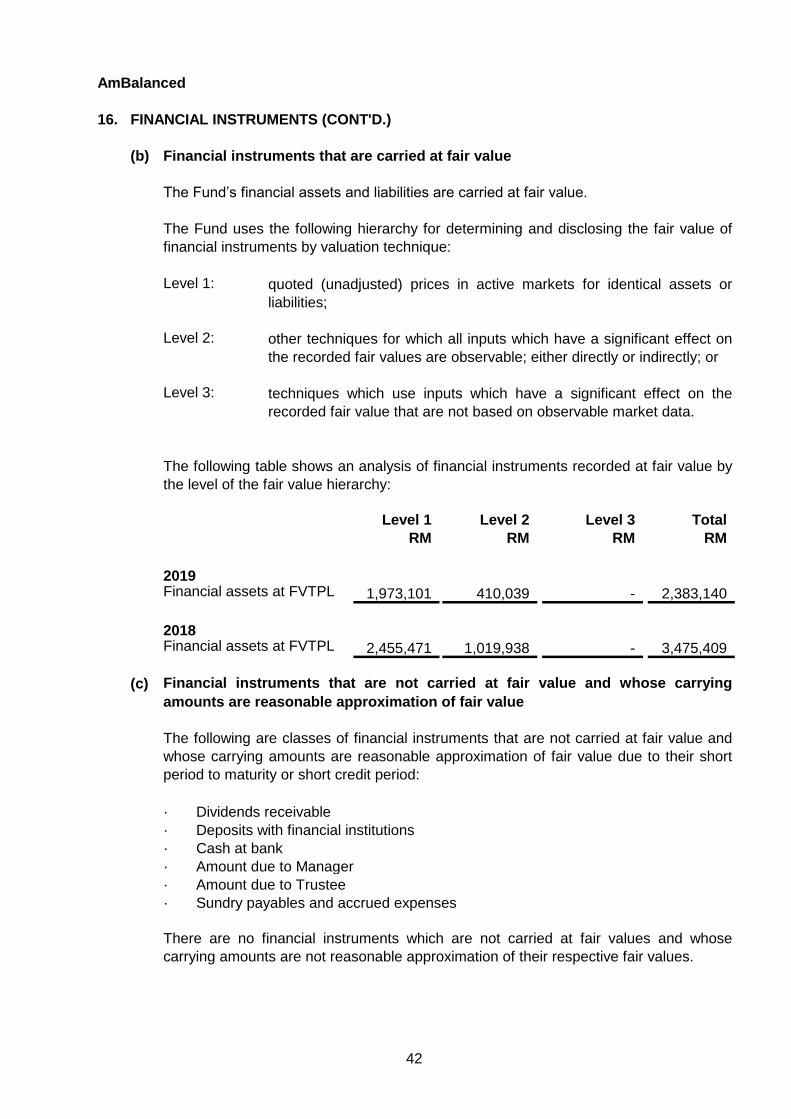
AmBalanced
16. FINANCIAL INSTRUMENTS (CONT'D.)
(b) Financial instruments that are carried at fair value
Level 1:
Level 2:
Level 3:
Level 1 Level 2 Level 3 Total
RM RM RM RM
1,973,101 410,039 - 2,383,140
2,455,471 1,019,938 - 3,475,409
(c)
· Dividends receivable
· Deposits with financial institutions
· Cash at bank
· Amount due to Manager
· Amount due to Trustee
· Sundry payables and accrued expenses
The following table shows an analysis of financial instruments recorded at fair value by
the level of the fair value hierarchy:
The Fund uses the following hierarchy for determining and disclosing the fair value of
financial instruments by valuation technique:
2018Financial assets at FVTPL
Financial assets at FVTPL
There are no financial instruments which are not carried at fair values and whose
carrying amounts are not reasonable approximation of their respective fair values.
The Fund’s financial assets and liabilities are carried at fair value.
2019
other techniques for which all inputs which have a significant effect on
the recorded fair values are observable; either directly or indirectly; or
quoted (unadjusted) prices in active markets for identical assets or
liabilities;
techniques which use inputs which have a significant effect on the
recorded fair value that are not based on observable market data.
Financial instruments that are not carried at fair value and whose carrying
amounts are reasonable approximation of fair value
The following are classes of financial instruments that are not carried at fair value and
whose carrying amounts are reasonable approximation of fair value due to their short
period to maturity or short credit period:
42
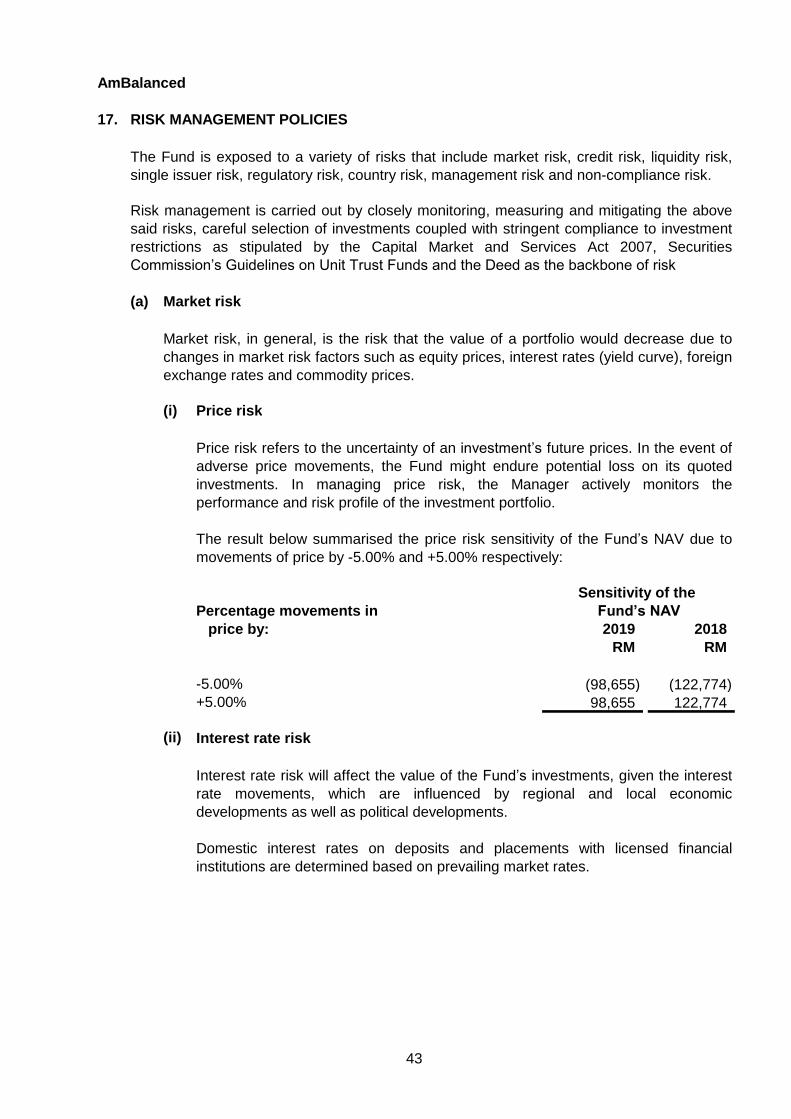
AmBalanced
17. RISK MANAGEMENT POLICIES
(a) Market risk
(i) Price risk
Percentage movements in
price by: 2019 2018
RM RM
(98,655) (122,774)
98,655 122,774
(ii) Interest rate risk
Market risk, in general, is the risk that the value of a portfolio would decrease due to
changes in market risk factors such as equity prices, interest rates (yield curve), foreign
exchange rates and commodity prices.
The result below summarised the price risk sensitivity of the Fund’s NAV due to
movements of price by -5.00% and +5.00% respectively:
Price risk refers to the uncertainty of an investment’s future prices. In the event of
adverse price movements, the Fund might endure potential loss on its quoted
investments. In managing price risk, the Manager actively monitors the
performance and risk profile of the investment portfolio.
The Fund is exposed to a variety of risks that include market risk, credit risk, liquidity risk,
single issuer risk, regulatory risk, country risk, management risk and non-compliance risk.
Risk management is carried out by closely monitoring, measuring and mitigating the above
said risks, careful selection of investments coupled with stringent compliance to investment
restrictions as stipulated by the Capital Market and Services Act 2007, Securities
Commission’s Guidelines on Unit Trust Funds and the Deed as the backbone of risk
Sensitivity of the
Fund’s NAV
-5.00%
+5.00%
Domestic interest rates on deposits and placements with licensed financial
institutions are determined based on prevailing market rates.
Interest rate risk will affect the value of the Fund’s investments, given the interest
rate movements, which are influenced by regional and local economic
developments as well as political developments.
43
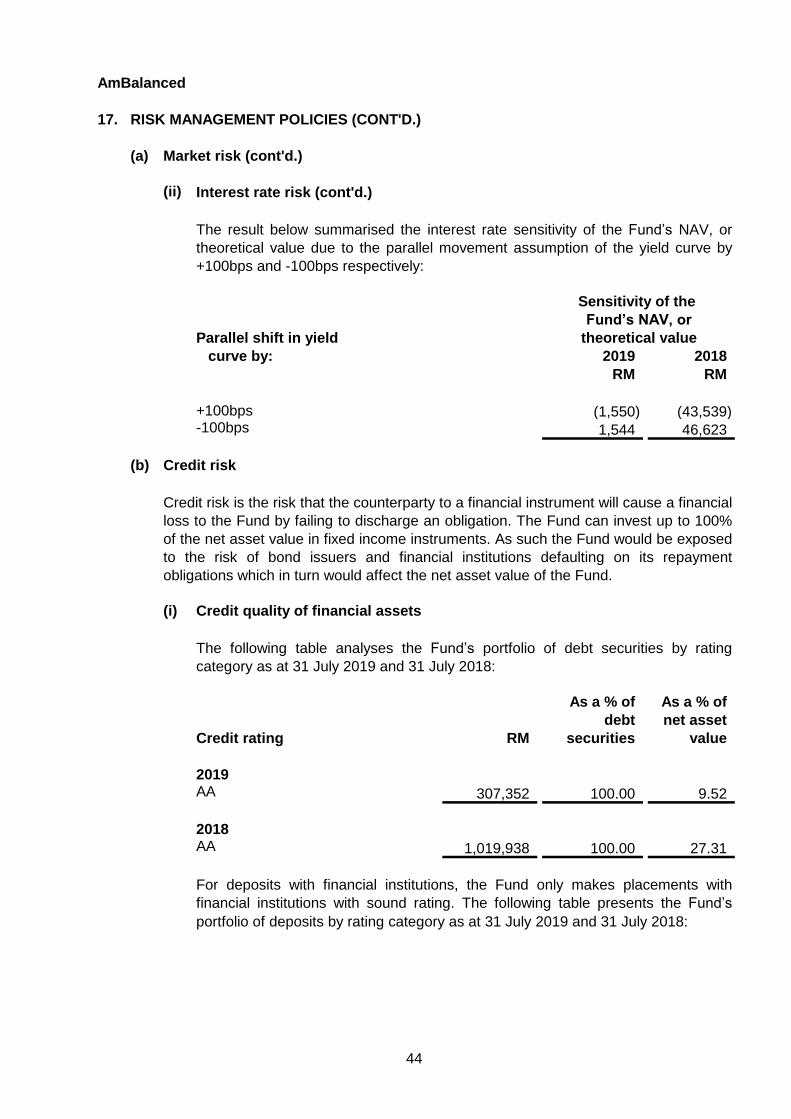
AmBalanced
17. RISK MANAGEMENT POLICIES (CONT'D.)
(a) Market risk (cont'd.)
(ii) Interest rate risk (cont'd.)
Parallel shift in yield
curve by: 2019 2018
RM RM
+100bps (1,550) (43,539) -100bps 1,544 46,623
(b) Credit risk
(i) Credit quality of financial assets
As a % of As a % of
debt net asset
Credit rating RM securities value
AA 307,352 100.00 9.52
AA 1,019,938 100.00 27.31
2018
2019
For deposits with financial institutions, the Fund only makes placements with
financial institutions with sound rating. The following table presents the Fund’s
portfolio of deposits by rating category as at 31 July 2019 and 31 July 2018:
Fund’s NAV, or
theoretical value
Sensitivity of the
The result below summarised the interest rate sensitivity of the Fund’s NAV, or
theoretical value due to the parallel movement assumption of the yield curve by
+100bps and -100bps respectively:
Credit risk is the risk that the counterparty to a financial instrument will cause a financial
loss to the Fund by failing to discharge an obligation. The Fund can invest up to 100%
of the net asset value in fixed income instruments. As such the Fund would be exposed
to the risk of bond issuers and financial institutions defaulting on its repayment
obligations which in turn would affect the net asset value of the Fund.
The following table analyses the Fund’s portfolio of debt securities by rating
category as at 31 July 2019 and 31 July 2018:
44
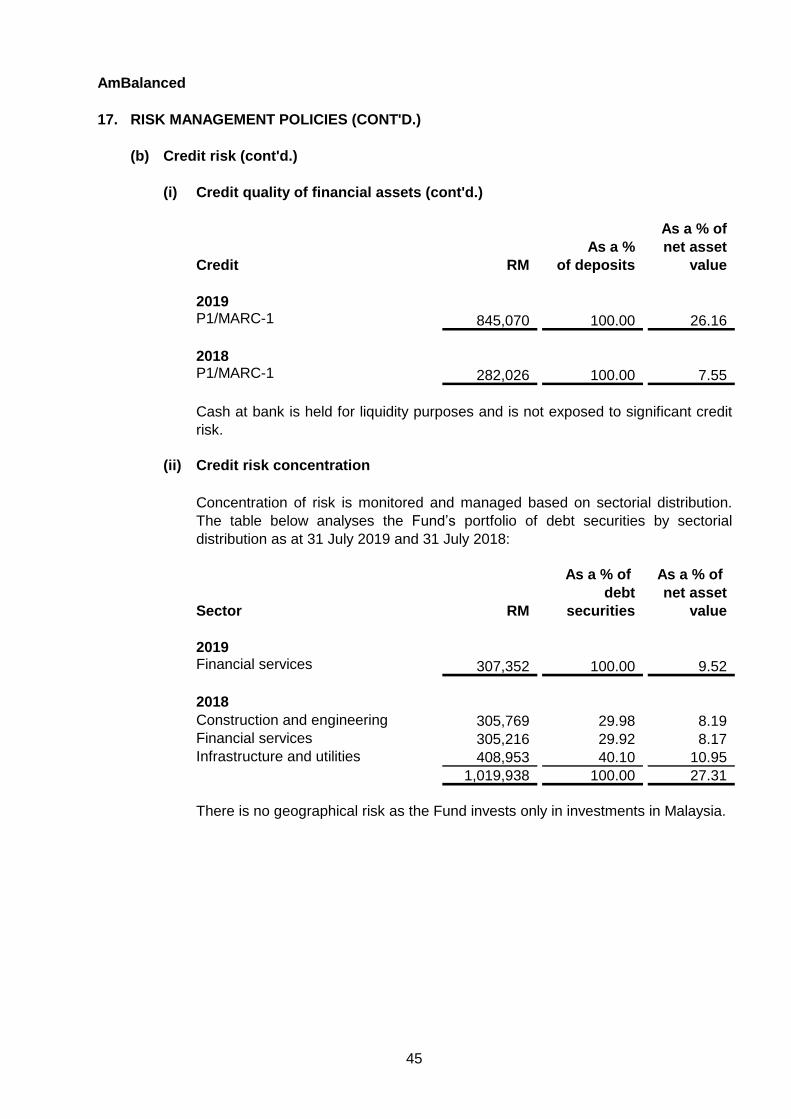
AmBalanced
17. RISK MANAGEMENT POLICIES (CONT'D.)
(b) Credit risk (cont'd.)
(i) Credit quality of financial assets (cont'd.)
A As a % of
As a % net asset
RM of deposits value
P1/MARC-1 845,070 100.00 26.16
P1/MARC-1 282,026 100.00 7.55
(ii) Credit risk concentration
As a % of As a % of
debt net asset
Sector RM securities value
2019Financial services 307,352 100.00 9.52
2018
Construction and engineering 305,769 29.98 8.19
Financial services 305,216 29.92 8.17
Infrastructure and utilities 408,953 40.10 10.95
1,019,938 100.00 27.31
There is no geographical risk as the Fund invests only in investments in Malaysia.
Cash at bank is held for liquidity purposes and is not exposed to significant credit
risk.
Concentration of risk is monitored and managed based on sectorial distribution.
The table below analyses the Fund’s portfolio of debt securities by sectorial
distribution as at 31 July 2019 and 31 July 2018:
2018
Credit
2019
45
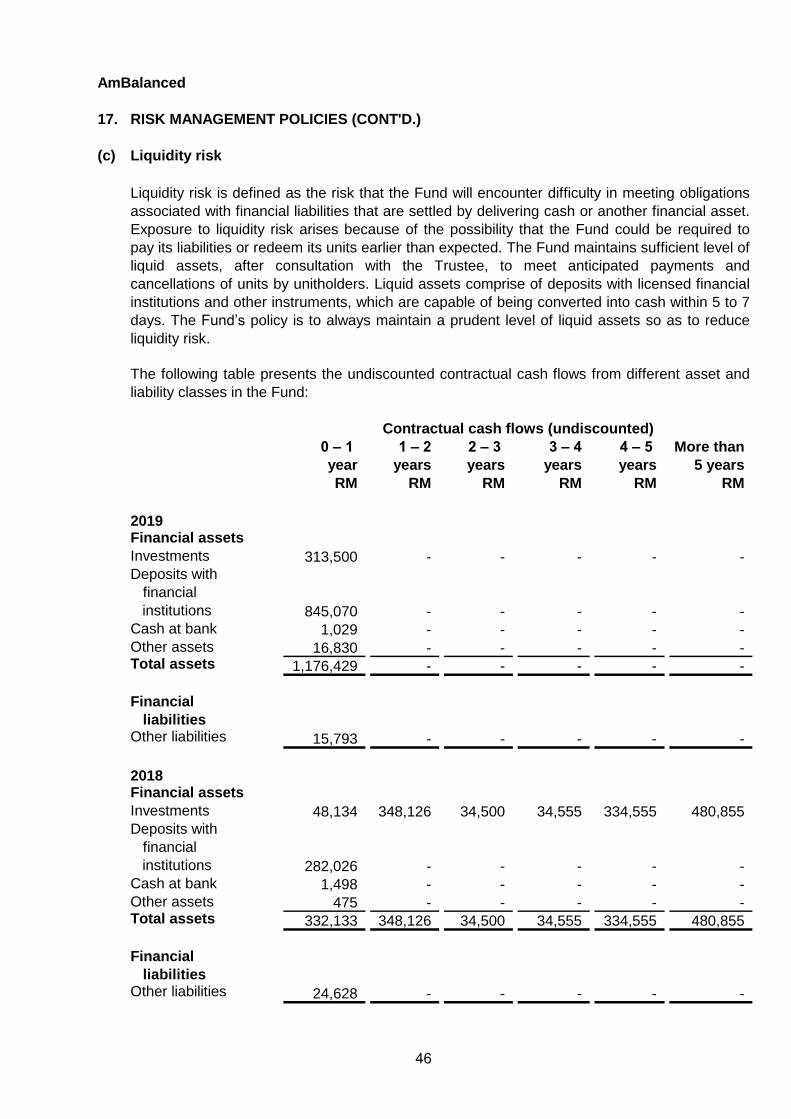
AmBalanced
17. RISK MANAGEMENT POLICIES (CONT'D.)
(c) Liquidity risk
0 – 1 1 – 2 2 – 3 3 – 4 4 – 5 More than
year years years years years 5 years
RM RM RM RM RM RM
2019Financial assets
Investments 313,500 - - - - -
Deposits with
financial
institutions 845,070 - - - - -
Cash at bank 1,029 - - - - -
Other assets 16,830 - - - - - Total assets 1,176,429 - - - - -
Financial
liabilitiesOther liabilities 15,793 - - - - -
2018Financial assets
Investments 48,134 348,126 34,500 34,555 334,555 480,855
Deposits with
financial
institutions 282,026 - - - - -
Cash at bank 1,498 - - - - -
Other assets 475 - - - - - Total assets 332,133 348,126 34,500 34,555 334,555 480,855
Financial
liabilitiesOther liabilities 24,628 - - - - -
Liquidity risk is defined as the risk that the Fund will encounter difficulty in meeting obligations
associated with financial liabilities that are settled by delivering cash or another financial asset.
Exposure to liquidity risk arises because of the possibility that the Fund could be required to
pay its liabilities or redeem its units earlier than expected. The Fund maintains sufficient level of
liquid assets, after consultation with the Trustee, to meet anticipated payments and
cancellations of units by unitholders. Liquid assets comprise of deposits with licensed financial
institutions and other instruments, which are capable of being converted into cash within 5 to 7
days. The Fund’s policy is to always maintain a prudent level of liquid assets so as to reduce
liquidity risk.
Contractual cash flows (undiscounted)
The following table presents the undiscounted contractual cash flows from different asset and
liability classes in the Fund:
46
AmBalanced
17. RISK MANAGEMENT POLICIES (CONT'D.)
(d) Single issuer risk
(e) Regulatory risk
(f) Country risk
(g) Management risk
(h) Non-compliance risk
18. CAPITAL MANAGEMENT
The risk of price fluctuation in foreign securities may arise due to political, financial and
economic events in foreign countries. If this occurs, there is a possibility that the net
asset value of the Fund may be adversely affected.
Any changes in national policies and regulations may have effects on the capital
market and the net asset value of the Fund.
Internal policy restricts the Fund from investing in securities issued by any issuer of not
more than a certain percentage of its net asset value. Under such restriction, the risk
exposure to the securities of any single issuer is diversified and managed based on
internal/external ratings.
This is the risk of the Manager, the Trustee or the Fund not complying with internal
policies, the Deed of the Fund, securities law or guidelines issued by the regulators.
Non-compliance risk may adversely affect the investments of the Fund when the Fund
is forced to rectify the non-compliance.
Poor management of the Fund may cause considerable losses to the Fund that in turn
may affect the net asset value of the Fund.
No changes were made in the objective, policies or processes during the financial years
ended 31 July 2019 and 31 July 2018.
The primary objective of the Fund’s capital management is to ensure that it maximises
unitholders’ value by expanding its fund size to benefit from economies of scale and
achieving growth in net asset value from the performance of its investments.
The Fund manages its capital structure and makes adjustments to it, in light of changes in
economic conditions. To maintain or adjust the capital structure, the Fund may issue new or
bonus units, make distribution payment, or return capital to unitholders by way of redemption
of units.
47
AmBalanced
STATEMENT BY THE MANAGER
For and on behalf of the Manager
Chief Executive Officer
Kuala Lumpur, Malaysia
17 September 2019
I, Goh Wee Peng for and on behalf of the Manager, AmFunds Management Berhad, for
AmBalanced (the “Fund”) do hereby state that in the opinion of the Manager, the accompanying
statement of financial position, statement of comprehensive income, statement of changes in
equity, statement of cash flows and the accompanying notes are drawn up in accordance with
Malaysian Financial Reporting Standards and International Financial Reporting Standards so as
to give a true and fair view of the financial position of the Fund as at 31 July 2019 and the
comprehensive income, the changes in equity and cash flows of the Fund for the financial year
then ended.
Goh Wee Peng
AmFunds Management Berhad
48
TRUSTEE’S REPORT
TO THE UNITHOLDERS OF
AmBalanced
(a)
(b)
(c)
Kuala Lumpur
Tan Bee Nie
Date : 13 September 2019
We have acted as Trustee of AmBalanced (“the Fund”) for the financial year ended 31 July 2019.
To the best of our knowledge, AmFunds Management Berhad (“the Management Company”),
has operated and managed the Fund in accordance with the following:-
limitations imposed on the investment powers of the Management Company and the
Trustee under the Deeds, the Securities Commission’s Guidelines on Unit Trust Funds, the
Capital Markets and Services Act 2007 and other applicable laws;
valuation/pricing is carried out in accordance with the Deeds of the Fund and any
regulatory requirements; and
creation and cancellation of units are carried out in accordance with the Deeds and any
regulatory requirements.
For HSBC (Malaysia) Trustee Berhad
Manager, Investment Compliance Monitoring
49

50
DIRECTORY Head Office 9th & 10th Floor, Bangunan AmBank Group 55, Jalan Raja Chulan, 50200 Kuala Lumpur Tel: (03) 2032 2888 Facsimile: (03) 2031 5210 Email: [email protected] Postal Address AmFunds Management Berhad P.O Box 13611, 50816 Kuala Lumpur
For enquiries about this or any of the other Funds offered by AmFunds Management Berhad Please call 2032 2888 between 8.45 a.m. to 5.45 p.m. (Monday to Thursday),
Friday (8.45 a.m. to 5.00 p.m.)

Semi-Annual Report28 February 2015
03 2032 2888 | aminvest.com | [email protected] m
AmFunds Management Berhad (154432-A)