Embed Size (px)
Citation preview
UN
IVE
RS
ITY
OF
OT
AG
OA
NN
UA
L R
EP
OR
T 2
013
TE
WH
AR
E W
-AN
AN
GA
O O
T-A
GO
2013ANNUAL REPORT
2013ANNUAL REPORT
1
ANNUAL REPORT
2013
un
ive
rs
ity
of
ota
go
an
nu
al
re
po
rt
20
132
University of OtagoLeith Street, Dunedin, New ZealandMail PO Box 56, Dunedin 9054, New ZealandTel 64 3 479 1100Fax 64 3 479 8692Email [email protected] www.otago.ac.nz
ChristchurchUniversity of Otago, Christchurch 2 Riccarton Avenue, Christchurch, New ZealandMail PO Box 4345, Christchurch 8140, New ZealandTel 64 3 364 0530Fax 64 3 364 [email protected]
WellingtonUniversity of Otago, Wellington Mein Street, Newtown, Wellington South, New ZealandMail PO Box 7343, Wellington South 6242, New ZealandTel 64 4 385 5541Fax 64 4 389 [email protected]
Wellington City Office Level 9 Revera House, 48 Mulgrave Street, Thorndon, Wellington, New ZealandMail PO Box 400, Wellington 6140, New ZealandTel 64 4 460 9800Fax 64 4 460 [email protected]
AucklandUniversity of Otago Auckland CentreUniversity of Otago House, 385 Queen Street, Auckland, New ZealandMail PO Box 5543, Wellesley Street, Auckland 1141, New ZealandTel 64 9 373 9700Fax 64 9 373 [email protected]
InvercargillCollege of Education, Southland Campus100 Nelson Street, Invercargill, New ZealandMail PO Box 886, Invercargill 9840, New ZealandTel 64 3 211 6724Fax 64 3 216 [email protected]
3
A research-led University with an international reputation for excellence.
Ko te ArongaHe Whare Wänanga e Aronui ana ki te Rangahau, e Rongonui ana i ngä Töpito o te Ao i te Ao i äna tutukinga ikeike.
MissionThe University of Otago will advance, preserve, promote and apply knowledge, critical thinking and intellectual independence to enhance the understanding, development and well-being of individuals and society. It will achieve this by building on foundations of broad research and teaching capabilities, unique campus learning environments, its nationwide presence and mana, and international links.
Ko tä Te Whare Wänanga o Otägo he whakawhanake, he pupuri, he whakatairanga hoki i te mätauranga, i te ihomatua tätari kaupapa, i te whakaaroaro motuhake o te tangata, kia häpai ai te möhio, te marama, te hiatotanga, otirä, te oranga o te tangata, o te iwi hoki. Mä te rangahau me te tika märika o te whakaako, mä te whai wänanga ahurei, mä te whakaü i töna mana, me öna toronga puta noa i te motu, i te ao hoki ënei whäinga e tutuki.
Vision
un
ive
rs
ity
of
ota
go
an
nu
al
re
po
rt
20
134
Vision and Mission 3
University Governance 6
Organisation Chart 7
Council of the University 8
Executive Group 9
Chancellor’s Introduction 10
Vice-Chancellor’s Review 12
Significant Events 16
Achieving Research Excellence 20
Achieving Excellence in Research-Informed Teaching 24
Ensuring Outstanding Campus Environments and Student Experience 28
Contributing to the National Good and to International Progress 32
Strengthening External Engagement 36
Building and Sustaining Capability 40
Reporting by Outputs 42
Statement of Service Performance 44
Statement of Resources 51
Group Entities Report 58
Financial Review 61
Statement of Responsibility 63
Statement of Accounting Policies 64
Statement of Financial Performance 70
Statement of Comprehensive Income 71
Statement of Changes in Equity 71
Statement of Financial Position 72
Statement of Cash Flows 73
Reconciliation of the Net Surplus 74
Statement of Commitments and Contingencies 75
Notes to the Financial Statements 76
Independent Auditor’s Report 104
Student Services Levy Report 106
Summary Facts and Figures 108
Graphs 115
Contents

5
un
ive
rs
ity
of
ota
go
an
nu
al
re
po
rt
20
136
Legal statusThe University was established by the University of Otago Ordinance of the Provincial Council in 1869, the University of Otago Amendment Act 1961 and the Education Act 1989. It is governed by a Council, which appoints the Vice-Chancellor, who is the chief executive and employer of all other staff.
Statutory roleDefining characteristics of universities in New Zealand, specified in the Education Act 1989, include that their teaching is primarily informed by research, they are repositories of knowledge and expertise, and they accept a role as critic and conscience of society.
The University CouncilThe Council is constituted and empowered according to legislation. Council is chaired by the Chancellor, and comprises elected, appointed and co-opted members representing key stakeholders including alumni, students and staff.
Committees of CouncilSpecific committees report directly to Council on matters including financial management and performance, audit, capital development, ethics, risk management and statutory compliance. It also has a Treaty of Waitangi committee with equal membership from Ngäi Tahu, and the University.The University may, from time to time, establish special working parties to examine particular issues.
The SenateSenate reports directly to Council, advising it primarily on academic matters as the Academic Board of the University. Senate is convened by the Vice-Chancellor and its membership is drawn mainly from the heads of academic departments, but it also includes other senior academics and representatives of other teaching staff and students. It is, in turn, advised by a number of committees and boards.
University autonomy and academic freedomThe Education Act 1989 provides statutory recognition of, and protection for, the institutional autonomy of the University and the academic freedom of its staff and students. In accordance with the Act, the Council and the Vice-Chancellor have a duty to act to preserve and enhance university autonomy and academic freedom.
Governance documentsThe University strategic plan, Strategic Direction to 2020, provides a framework for the development of the University.
The University Investment Plan outlines how the University will give effect to its Strategic Plan, the means by which it will contribute to the Government’s strategies and priorities for tertiary education, and how it will monitor its performance in these matters.
University governance
7
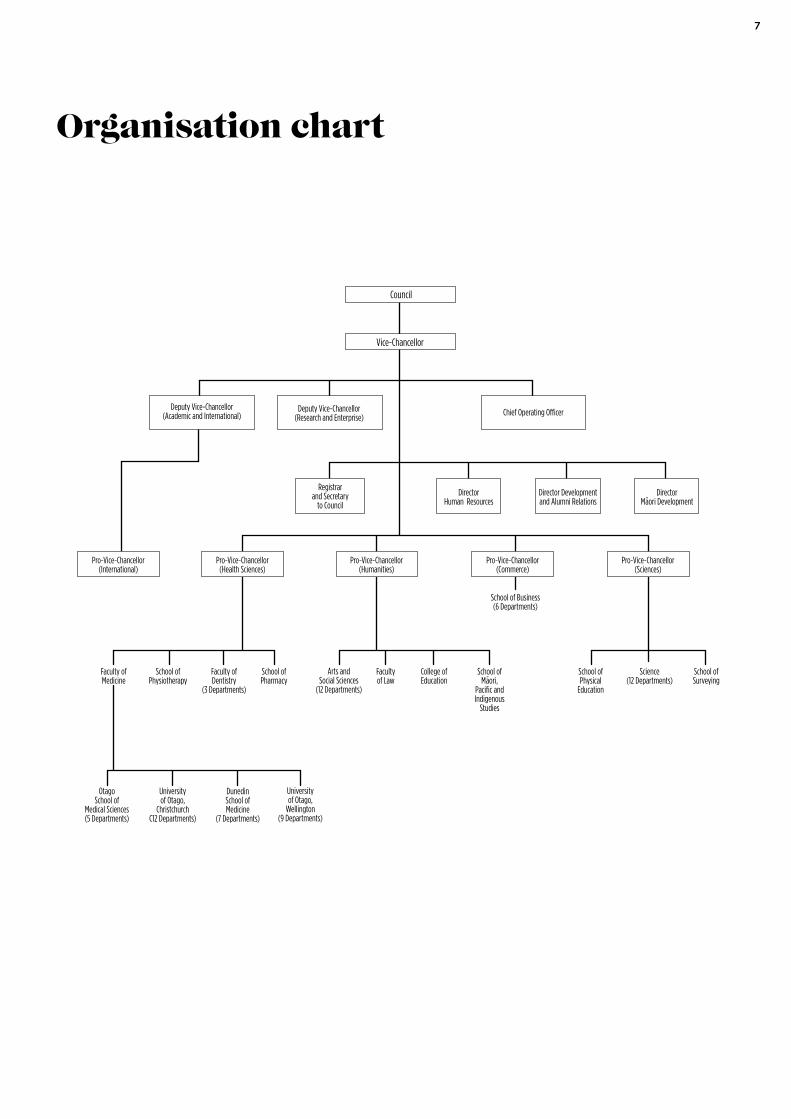
Council
Vice-Chancellor
Deputy Vice-Chancellor(Research and Enterprise)
Registrar and Secretary
to CouncilDirector
Human ResourcesDirector Development and Alumni Relations
Director M-aori Development
Chief Operating OfficerDeputy Vice-Chancellor
(Academic and International)
Faculty ofMedicine
OtagoSchool of
Medical Sciences(5 Departments)
Universityof Otago,
Christchurch C12 Departments)
Universityof Otago,
Wellington(9 Departments)
DunedinSchool ofMedicine
(7 Departments)
School ofPhysiotherapy
Faculty ofDentistry
(3 Departments)
School ofPharmacy
Arts andSocial Sciences
(12 Departments)
Faculty of Law
College ofEducation
School ofM-aori,
Pacific and Indigenous
Studies
School ofPhysical
Education
Science(12 Departments)
School ofSurveying
Pro-Vice-Chancellor(Health Sciences)
Pro-Vice-Chancellor(International)
Pro-Vice-Chancellor(Humanities)
Pro-Vice-Chancellor(Commerce)
Pro-Vice-Chancellor(Sciences)
School of Business(6 Departments)
Organisation chart
un
ive
rs
ity
of
ota
go
an
nu
al
re
po
rt
20
138
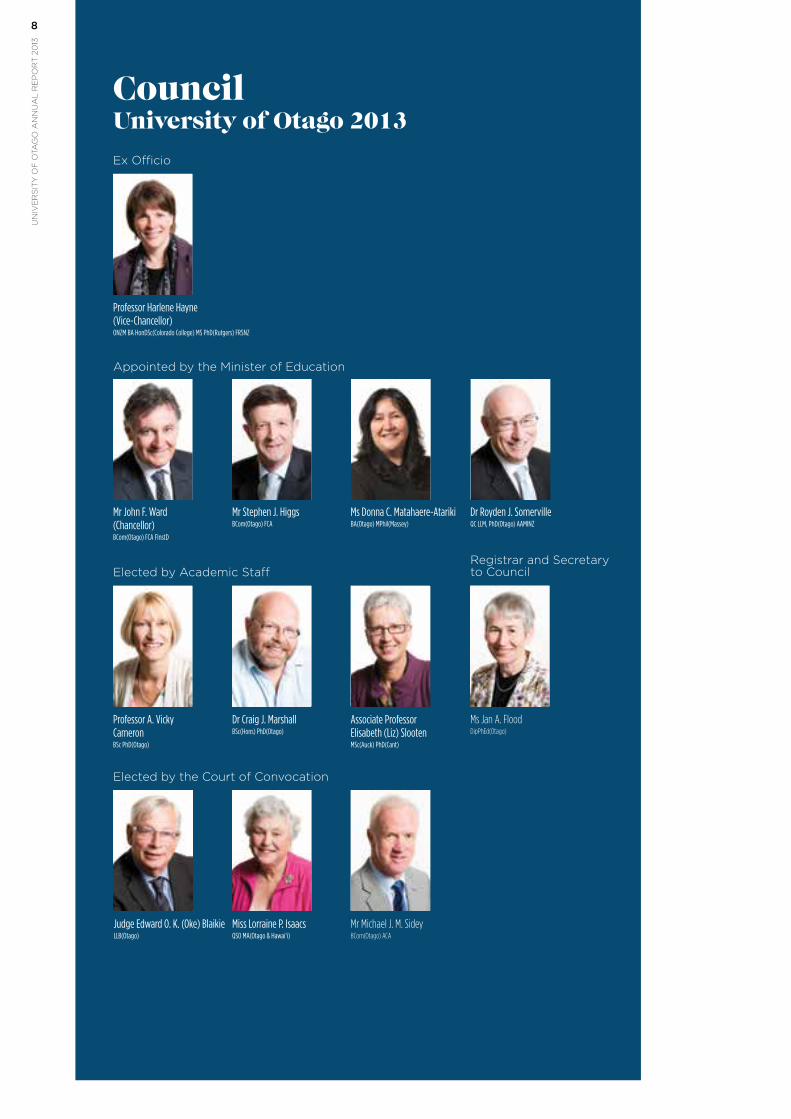
Ex Officio
Registrar and Secretary to Council
Appointed by the Minister of Education
Elected by Academic Staff
Elected by the Court of Convocation
Professor Harlene Hayne(Vice-Chancellor) ONZM BA HonDSc(Colorado College) MS PhD(Rutgers) FRSNZ
Mr John F. Ward(Chancellor)BCom(Otago) FCA FInstD
Professor A. Vicky CameronBSc PhD(Otago)
Judge Edward O. K. (Oke) Blaikie LLB(Otago)
Ms Donna C. Matahaere-AtarikiBA(Otago) MPhil(Massey)
Dr Craig J. MarshallBSc(Hons) PhD(Otago)
Miss Lorraine P. Isaacs QSO MA(Otago & Hawai‘i)
Dr Royden J. SomervilleQC LLM, PhD(Otago) AAMINZ
Ms Jan A. FloodDipPhEd(Otago)
Mr Stephen J. HiggsBCom(Otago) FCA
Associate Professor Elisabeth (Liz) SlootenMSc(Auck) PhD(Cant)
Mr Michael J. M. Sidey BCom(Otago) ACA
Council University of Otago 2013
9
Vice-Chancellor Professor Harlene HayneONZM BA HonDSc(Colorado College) MS PhD(Rutgers) FRSNZ
Deputy Vice-Chancellor (Academic & International)Professor Vernon A. Squire Polar Medal BSc(Hons)(Wales) PhD(Camb) DSc(Wales) FRSNZ FIMA CMath FNZMS
Deputy Vice-Chancellor (Research & Enterprise) Professor Richard J. Blaikie BSc(Hons)(Otago) PhD(Camb) FRSNZ MIEEE MInstP CPhys
Chief Operating Officer Mr A. John Patrick BCom(Otago) FCA CMA
Pro-Vice-Chancellor (Commerce) Professor George L. Benwell BSurv PhD(Melb) MPhil(City) MNZCS MISAust
Pro-Vice-Chancellor (Health Sciences) Professor Peter R. Crampton MB ChB MPH PhD(Otago) DipObst(Auck)FAFPHM MRNZCGP
Pro-Vice-Chancellor (Humanities) Professor Brian D. Moloughney MA(Cant) PhD(ANU)
Pro-Vice-Chancellor (Sciences) Professor Keith A. Hunter MSc(Auck) PhD(E Anglia) FNZIC FRSNZ
Pro-Vice-Chancellor (International) Professor Sarah J. Todd BA(Massey) MCom PhD(Otago)
Director of Human Resources Mr Kevin J. Seales BCom(Cant) MHRINZ
Registrar and Secretary to Council Ms Jan A. Flood DipPhEd(Otago)
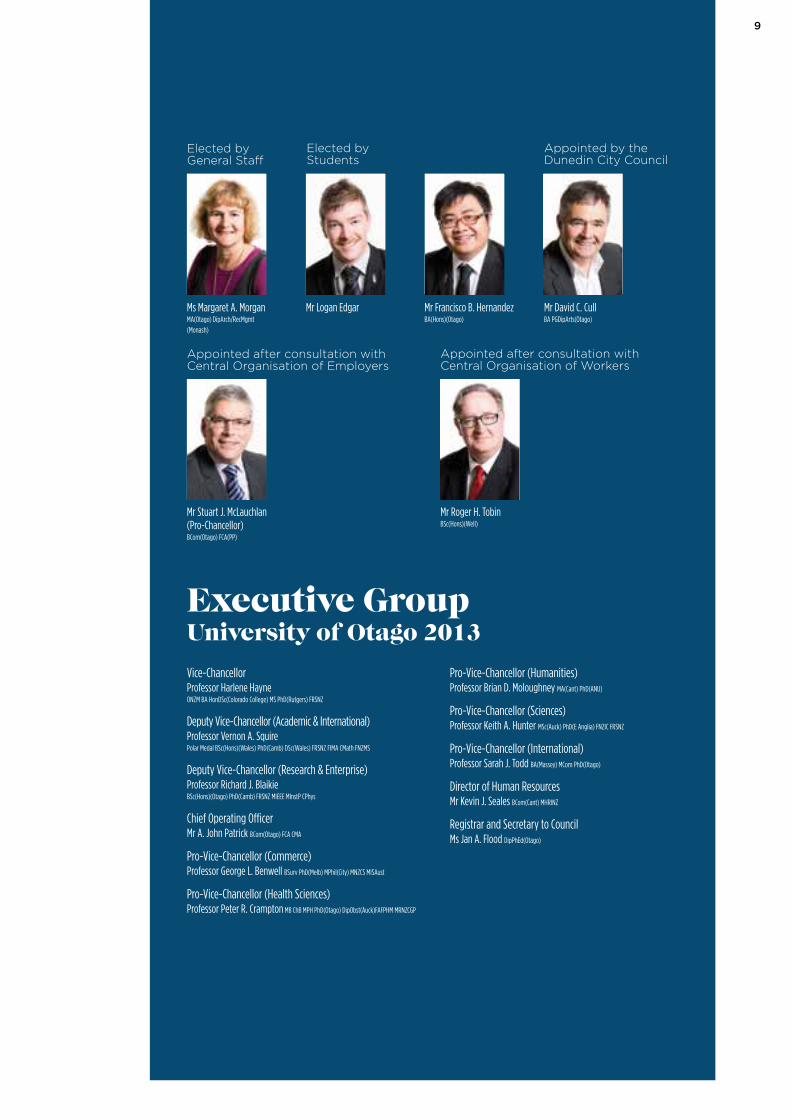
Appointed after consultation with Central Organisation of Employers
Appointed after consultation with Central Organisation of Workers
Appointed by the Dunedin City Council
Mr Stuart J. McLauchlan(Pro-Chancellor) BCom(Otago) FCA(PP)
Mr Roger H. TobinBSc(Hons)(Well)
Mr David C. CullBA PGDipArts(Otago)
Elected by General Staff
Elected by Students
Ms Margaret A. Morgan MA(Otago) DipArch/RecMgmt (Monash)
Mr Logan Edgar Mr Francisco B. HernandezBA(Hons)(Otago)
Executive Group University of Otago 2013
un
ive
rs
ity
of
ota
go
an
nu
al
re
po
rt
20
1310
Chancellor’s introduction
It is my pleasure to introduce the University of Otago’s Annual Report for 2013, a year marked by many achievements and the adoption of a new strategic document that sets our direction for the next seven years.
11
These achievements are canvassed at length, both by Professor Harlene Hayne in her Vice-Chancellor’s Review and in other sections of this report. As Chancellor, I would like to take this opportunity to congratulate and thank staff and students for their hard work, as well as alumni, funders and other stakeholders for their valued contributions to the University throughout 2013.
Over the 11 years I have served on the University Council – five of them as Chancellor – I have become increasingly proud of the importance of this institution to not only Dunedin, but to New Zealand as a whole. Economic data released in 2013 showed that the overall direct impact of the University was $897 million in 2012 and that the downstream effect of this – or total economic impact – was $1.662 billion. The University’s total expenditure in Dunedin was estimated at $800 million – about 16% of the city’s gross domestic product; in Wellington it was $47.1 million; in Christchurch, $46.2 million; and Invercargill, $3.5 million.
Financial considerations are meaningful, but there are other important aspects too. The University’s researchers work in areas of national and international importance, our students are taught by world-leaders in their fields, and our graduates continue to be sought after by employers for their independence, critical thinking and aptitude for life-long learning – a direct result of the unique Otago academic and lifestyle experience.
One of my great privileges as Chancellor is to have the opportunity to personally congratulate these graduates as they complete their studies and go out into the world. In 2013 the University held 12 graduation ceremonies, attended by 3,644 of the 5,701 new graduates and their families.
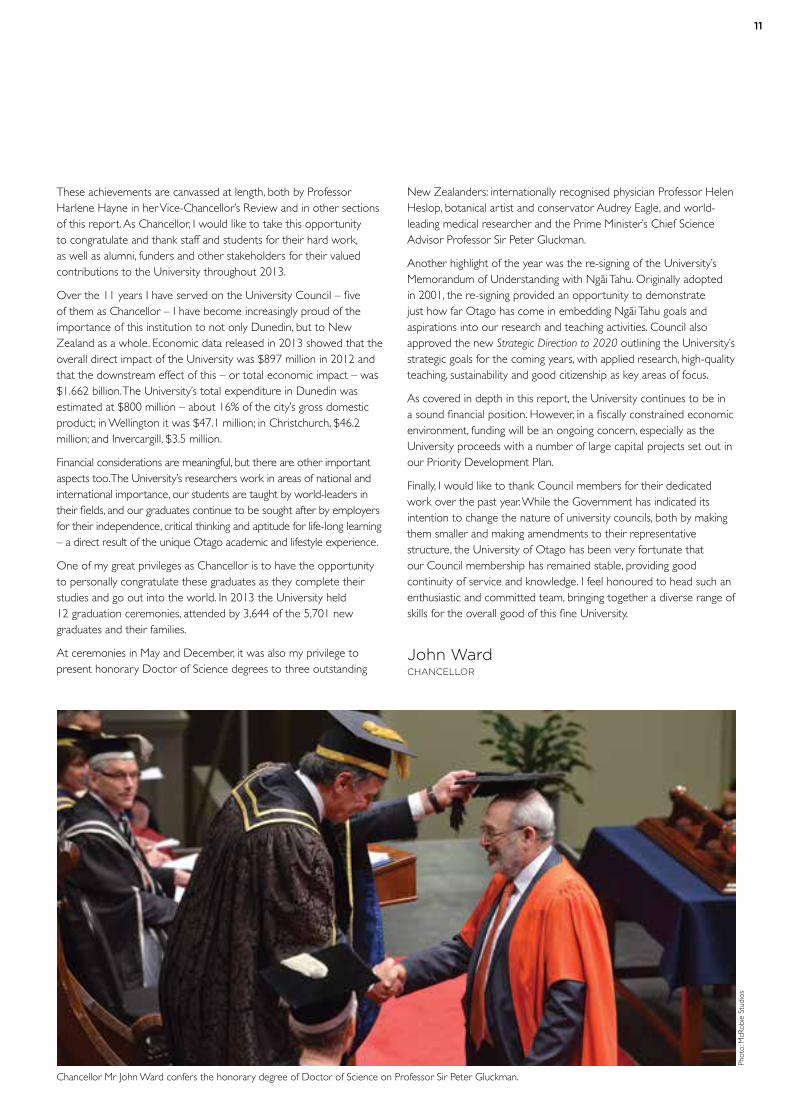
At ceremonies in May and December, it was also my privilege to present honorary Doctor of Science degrees to three outstanding
New Zealanders: internationally recognised physician Professor Helen Heslop, botanical artist and conservator Audrey Eagle, and world-leading medical researcher and the Prime Minister’s Chief Science Advisor Professor Sir Peter Gluckman.
Another highlight of the year was the re-signing of the University’s Memorandum of Understanding with Ngäi Tahu. Originally adopted in 2001, the re-signing provided an opportunity to demonstrate just how far Otago has come in embedding Ngäi Tahu goals and aspirations into our research and teaching activities. Council also approved the new Strategic Direction to 2020 outlining the University’s strategic goals for the coming years, with applied research, high-quality teaching, sustainability and good citizenship as key areas of focus.
As covered in depth in this report, the University continues to be in a sound financial position. However, in a fiscally constrained economic environment, funding will be an ongoing concern, especially as the University proceeds with a number of large capital projects set out in our Priority Development Plan.
Finally, I would like to thank Council members for their dedicated work over the past year. While the Government has indicated its intention to change the nature of university councils, both by making them smaller and making amendments to their representative structure, the University of Otago has been very fortunate that our Council membership has remained stable, providing good continuity of service and knowledge. I feel honoured to head such an enthusiastic and committed team, bringing together a diverse range of skills for the overall good of this fine University.
John WardChANCELLOR
Chancellor Mr John Ward confers the honorary degree of Doctor of Science on Professor Sir Peter Gluckman.
Phot
o: M
cRob
ie S
tudi
os
un
ive
rs
ity
of
ota
go
an
nu
al
re
po
rt
20
1312
Vice-Chancellor’s review
In 2013, the University of Otago continued to be among the world’s leading universities. The talents and achievements of our researchers, teachers and students were recognised nationally and internationally. We achieved a record operating surplus for the 2013 financial year. We were, once again, named among the world’s most beautiful universities and our newly-adopted Strategic Direction to 2020 sets a bold course for the University to achieve its goals into the future.
13
With more than 10,000 universities around the world, I am very proud to report that Otago continues to rank in the top 1-3%. We scored in the 201-300 band in the ARWU (Shanghai) Rankings, in the 226-250 band in the Times Higher Education rankings and 155th in the QS rankings. Within this international ranking system, Otago was the top university in New Zealand for the number of highly-cited publications and for the number of publications per capita. In addition, Otago was again the top New Zealand university in the annual Nature rankings, which measures the output of research articles in the prestigious Nature suite of journals.
Our standing as a research-intensive university plays an important part in our international success. Research is a defining feature of any university’s quality and the high calibre of research at Otago was reinforced by the Tertiary Education Commission’s PBRF (Performance-Based Research Fund) quality assessment, released in April. We were the only university to be ranked in the top four of all of the quality score measures, reaffirming our position as a leading research institution in New Zealand.
I would like to thank everyone for the time and effort that went into preparing submissions for the PBRF assessment and, in particular, our staff at the University of Otago, Christchurch. Our Christchurch campus was very badly affected by the impacts of the earthquakes that have so significantly damaged that city. However, in spite of these difficulties, the campus more than doubled its number of A-graded staff since 2006, confirming its place as a research powerhouse and one of the leading medical schools in the country.
Excellence in research and teaching are central to the core values of this University, providing the platform from which students gain the world-class education for which we are renowned. Some of the achievements of our outstanding staff and students are highlighted throughout this Annual Report, but I would like to make special mention of Professor Robert Poulin who was awarded the University’s Distinguished Research Medal, and Associate Professor Gordon Sanderson who won the Prime Minister’s Supreme Award at the National Tertiary Teaching Excellence Awards. This is the fourth time in the last 11 years that an Otago teacher has won this award, a remarkable achievement that is unrivalled by any other institution in this country. Our proud record of Rhodes Scholarships continued, with Politics honours student Ben Abraham becoming Otago’s 62nd student to receive the prestigious award to study at Oxford University.
Over the past few years, the University of Otago has made a concerted effort to recruit the best and the brightest students from within New Zealand and from overseas. It is now more difficult to gain acceptance to study at Otago and students must maintain satisfactory academic performance to continue their studies here. The strategic decision to lift the academic calibre of our student cohort was bravely taken in 2011. Although this decision resulted in a slight drop in student numbers overall, it has already paid clear dividends in academic outcomes while, at the same time, enhancing prospective students’ enthusiasm to study at Otago. For the second successive
year, our first-year enrolments were up and, in 2013, our student completion rates were the best in the country.
As for all our students, we have extremely high ambitions for our Mäori students and they continue to meet or exceed our expectations. In 2013, our Mäori student numbers reached a record-breaking 9.2% of the domestic roll. The performance of our Mäori students in the Health Sciences First Year programme has resulted in a steady increase in their acceptance into health professional degree programmes. In 2013 Mäori students comprised 14% of the School of Medicine’s and 13% of the Faculty of Dentistry’s domestic student intakes. Over time, these Mäori health professionals will change the human face of health service provision in this country.
Students who study at Otago come from all over New Zealand and from all over the world. While the international recruitment market remains challenging, we have partnership agreements with 97 international universities and, in 2013, our roll included students from 94 different countries, adding to the diversity and vibrancy of Otago campus life.
With more than 80% of our students coming from outside Dunedin, Otago is New Zealand’s only truly residential university. As such, we have a responsibility to ensure that the vibrant Otago lifestyle they enjoy is both healthy and safe. I am extremely proud of the pastoral care offered through our residential colleges, Mäori and Pacific Islands Centres, Student Health Services and Student Learning Centre, and of the many opportunities offered for recreational and cultural pursuits. In 2013 we further widened our peer support initiatives to include a Locals programme, providing social, academic and orientation support to new students – predominately first-years – who are not living in a residential college.
In addition to our responsibility to students, our students also have responsibilities of their own. During Orientation at the beginning of the year, Dunedin Mayor Mr Dave Cull and I personally welcomed 5,000 new students to our University – and to our city – reminding them that they should work hard and make the most of the wonderful opportunities available to them. In addition, we reminded them that a university education is a remarkable privilege and with that privilege comes the responsibility for them to be the best citizens they can be. This message has also been shared with the families of our incoming students. Since becoming Vice-Chancellor, I have taken the opportunity to welcome new parents and families to the University, to share our ethos, to foreshadow some common hiccups that might occur as new students settle in, and to outline strategies for families to help their young people make their way through this exciting transition in their life.
Throughout the year we continued to promote our Student Code of Conduct and I, again, met every student who was in serious trouble as a result of excessive alcohol consumption. The indications are that this approach is working to curb at least some of the alcohol-related anti-social behaviour that has troubled us in the past.
un
ive
rs
ity
of
ota
go
an
nu
al
re
po
rt
20
1314
Otago’s strategic path for the next seven years is outlined in the Strategic Direction to 2020 and was approved by Council in August. Building on our established strengths in research and teaching, this new strategic document provides a broader, bolder outlook for the University, encouraging our researchers to use their talents and resources to help solve some of the social, economic and environmental problems facing New Zealand and the world. Equally, it encourages our academic staff to equip students not only with the skills they need for a successful career but, just as importantly, to become strong and effective leaders, and good citizens of the world in which we live.
We have already taken some big steps toward a number of these goals. In 2013 Otago became the first New Zealand university to be granted Fairtrade accreditation. The Fairtrade ethos fits well with our strategic direction and is proof that we act in an ethically, socially and environmentally responsible manner. Wherever possible, products that are consumed by staff and students will be sourced ethically from places that embody Fairtrade. We also signed a Memorandum of Understanding with World Vision New Zealand to enhance efforts to alleviate poverty, nationally and internationally.
Sustainability is increasingly embedded across our activities and, from 1 January 2014, Otago will become a fully smoke-free University. The smoke-free policy will greatly enhance the outstanding campus environment offered to staff and students who work and study at Otago. More importantly perhaps, we have also provided support to help smokers to quit.
The Strategic Direction to 2020 also outlines our bold intention to harness the time, energy, talents and altruism of our student population for the betterment of the wider community. In 2013, we established a University Volunteer Centre that co-ordinates the needs of the community with the skills of our students. This centre has already been a major success, reaping clear benefits not only for the community, but for the student volunteers as well.
Financially, the University remains in a sound position, reporting a record operating surplus of $36.5 million for the 2013 year. It is important to note that a portion of this surplus was due to three one-off factors that are explained fully later in this report. Despite the strength of our current balance sheet, funding remains a major issue as we try to balance the constraints of Government support and tuition fees against our aspirations for students and staff. Our highly ambitious Priority Development Plan, in particular, will put further strain on our financial resources in coming years as we move into a phase of building and redeveloping a number of key facilities on campus.
The research funding environment has been challenging for Otago in recent years. Constraints in government expenditure and increased competition for static or declining funding pools are concerning, particularly for health-related research. New
“I feel extremely privileged to lead the University of Otago, which is not only recognised for its world-class teaching and research, but also for the collegial nature of the working environment. We will continue to jealously guard that environment at all cost because, in the end, it is one of the major drivers of our continued success.”
15
government research expenditure has been focused in areas away from Otago’s core strengths in health and fundamental sciences, and into agriculture and business-focused engineering and technology research. In response to these new government funding priorities, we have seen good growth in our funding successes in these new areas. We are also actively exploring research collaborations with our Matariki Network partners and those with whom we have memoranda of understanding, such as Jiao Tong University in Shanghai.
We continue our strong focus on research commercialisation, which has been bolstered by a number of successful commercialisation projects over the past 12 months. We follow with great interest the success of one of our biomedical spin-out companies, Pacific Edge Ltd. The company’s share value increased markedly during 2013 in the wake of contracts with two major US health providers and the receipt of the New Zealand Innovators’ supreme award for Cxbladder, its gene test for the detection and management of bladder cancer. Pacific Edge is a clear example of the way in which the outstanding science at Otago can be converted into successful business opportunities that enhance the health and well-being of people around the world.
Each year I have the opportunity to meet with Otago alumni around the world. They typically range in age from their early 20s to their early 90s. Some of them have already taken their place in the world and some are in the early stages of their careers, but they all share a passion for the University of Otago. We will continue to use their passion to help us recruit new students, to employ our graduates, and to provide a safe and welcoming landing pad for newly-minted Otago alumni if they find their first position overseas. We will also continue to call on our alumni community to assist us as we embark on a wide range of capital and research projects.
Late in 2013, Forbes Magazine published an article in which they argued that the biggest leadership challenge in business was the challenge faced by a university president (or Vice-Chancellor). Their point was that a university is not a single business, but rather a collection of many different businesses that require the hard work and co-operation of a large number of extremely bright, highly talented and fiercely independent people. The article also made the point that, unlike many other businesses, universities cannot, and should not, be ruled by fiat, but rather by consensus building and a strong sense of autonomy. I feel extremely privileged to lead the University of Otago, which is not only recognised for its world-class teaching and research, but also for the collegial nature of the working environment. We will continue to jealously guard that environment at all cost because, in the end, it is one of the major drivers of our continued success.
I would like to thank the Council, the academic and general staff and the students at the University of Otago for their hard work and support throughout 2013. Collectively, you have contributed to making 2013 another stellar year for New Zealand’s oldest, finest and most beautiful university.
Professor Harlene HayneVICE-CHANCELLOR
un
ive
rs
ity
of
ota
go
an
nu
al
re
po
rt
20
1316
Senior appointments
Professor Marie Crowe as Director of the Centre for Postgraduate Nursing, University of Otago, Christchurch.
Professor Dawn Elder as Professor of Paediatrics and Child Health, University of Otago, Wellington.
Professor Alison Heather to a Chair in Physiology.
Professor Steven Higgins as Professor of Botany.
Professor Michael LeBuffe to the Baier Chair in Early Modern Philosophy.
Professor Karl Lyons to the University’s Chair in Restorative Dentistry in the Department of Oral Rehabilitation.
Professor Stephen MacDonell as Professor of Information Science.
Professor Helen Nicholson as the University’s Pro-Vice-Chancellor, International.
Rachel Scott as the Publisher of Otago University Press.
Professor Rachel Spronken-Smith as Dean of the Graduate Research School.
Professor Barry Taylor (Women’s and Children’s Health) as Dean of the Dunedin School of Medicine.
Dr Tasileta Teevale as the inaugural Director of Pacific Development.
Significant events
17
Emeritus professorsThe University Council has granted the status of Professor Emeritus to Evan Begg (Clinical Pharmacology, Christchurch), John Campbell (Medicine), John Drummond (Music), Alistair Fox (English), Geoff Kearsley (Media, Film and Communication), James Simpson (Chemistry), Elisabeth Wells (Public Health and General Practice, Christchurch).
Professorial promotionsThe following staff were appointed to professor:
Blair Blakie (Physics), Stephen Cranefield (Information Science), David Gerrard (Dunedin School of Medicine), Mark Hampton (Pathology, Christchurch), Tony Harland (Higher Education Development Centre), John Knight (Marketing), Craig Rodger (Physics), Philip Seddon (Zoology), Richard Troughton (Medicine, Christchurch), Michael Williams (Dunedin School of Medicine), Stephen Wing (Marine Science), Michael Winikoff (Information Science).
The following staff were appointed to associate professor:
Gillian Abel (Public Health and General Practice, Christchurch), Nicola Atwool (Sociology, Gender and Social Work), Caroline Bell (Psychological Medicine, Christchurch), John Birch (Food Science), Michael Black (Biochemistry), Rhiannon Braund (Pharmacy), Roland Broadbent (Women’s and Children’s Health), Rob Burns (Music), Anthony Butler (Radiology, Christchurch), Colin Cheyne (Philosophy), Vijay Devadas (Media, Film and Communication), George Dias (Anatomy), Ruth Empson (Physiology), Timothy Eglinton (Surgery, Christchurch), Ruth Fitzgerald (Anthropology and Archaeology), Catherine Fowler (Media, Film and Communication), Andrew Gorman (Geology), Jean Hay-Smith (Medicine, Wellington), Richard Macknight (Biochemistry), Lisa McNeill (Marketing), Motohide Miyahara (Physical Education, Sport and Exercise Sciences), Karen Nairn (College of Education), Patricia Priest (Preventive and Social Medicine), Lynette Sadleir (Paediatrics and Child Health, Wellington), Sheila Skeaff (Human Nutrition), Joel Tyndall (Pharmacy), Ross Vennell (Marine Science), Sarah Young (Pathology).
The following staff were appointed to research associate professor:
Sarah Derrett (Preventive and Social Medicine), Mira Harrison-Woolrych (Preventive and Social Medicine), Merilyn Hibma (Microbiology and Immunology), Michael Keall (Public Health, Wellington), John Pickering (Medicine, Christchurch), Sylvia Sander (Chemistry), Claudine Stirling (Chemistry).
The following staff were appointed to clinical associate professor:
Helen Lunt (Medicine, Christchurch), Michael Harrison (Surgery and Anaesthesia, Wellington).
Honorary degreesHonorary degrees of Doctor of Science were conferred on internationally recognised physician and researcher Professor Helen Heslop; noted botanical artist and conservationist Audrey Eagle; and world-leading medical researcher and Prime Minister’s Chief Science Advisor Professor Sir Peter Gluckman.
HonoursIn the Queen’s Birthday Honours Associate Professor David Perez was made an Officer of the New Zealand Order of Merit for services to oncology.
ObituariesEmeritus Professor Barbara Heslop (89), a pathologist/immunologist who was instrumental in setting up the New Zealand Society for Immunology and whose work is commemorated by the Royal Australasian College of Surgeons’ Heslop Medal.
Emeritus Professor Lyall McLean (79), a former Head of Accounting and Assistant-Vice-Chancellor of Commerce who played a pivotal role in the construction of the Commerce Building and Executive Residence.
Emeritus Professor John Loutit (87), who was head of the Department of Microbiology for more than 10 years and served as Faculty of Science dean from 1973 to 1975.
Head of the University’s Disability Information and Support Service Donna-Rose MacKay (54), who was a national trailblazer in the area of disability issues and support.
Dr Robert (Robin) Williams (93), an eminent mathematician, physicist and public servant, who was University of Otago Vice-Chancellor from 1967 to 1973.

un
ive
rs
ity
of
ota
go
an
nu
al
re
po
rt
20
1318

19
un
ive
rs
ity
of
ota
go
an
nu
al
re
po
rt
20
1320
Achieving research excellence
The University of Otago is one of New Zealand’s largest and most broadly capable research organisations, a reputation confirmed during 2013 by independent assessments, successes in highly competitive funding rounds, and the national and international recognition of our researchers.
21
The findings of the Performance-Based Research Fund (PBRF) quality evaluations, undertaken in 2012, were released in April 2013 and Otago was the only university to be ranked in the top four in all average quality score (AQS) measures, and improving its 2006 performance in all of them. The University was ranked first for research quality weighted by its postgraduate roll, second for quality relative to enrolments at degree-level and higher, third for the quality of research by staff who submitted portfolios for assessment, and fourth for the measure across all academic staff.
Otago was ranked first or second in 17 subject areas, including first in four of the 10 top-ranked subject areas: law, pharmacy, philosophy and pure and applied mathematics. In addition, the Department of Psychology received the highest score (6.9) for any nominated academic unit at any institution across the country.
Of the 1,318 Otago staff who participated in the evaluation, 735 were ranked as either “A” (high international standing) or “B” (high national standing) for the quality of their research. The results achieved by Otago’s younger, up-and-coming researchers were particularly encouraging – of the 275 new and emerging researchers assessed, 53 received “B” grades and two were recognised as “A” grade. The University’s position as New Zealand’s leading postgraduate research university was also confirmed. Otago postgraduate students enjoy a 3:1 ratio to research-active staff and a 5:1 ratio to “A”- or “B”-rated research staff.
In monetary terms, the University of Otago gained around 20% of the total funding pool. This translated to an estimated $53 million in funding in 2013.
Otago continued to be successful in an increasingly difficult research funding environment, reflecting the quality of the work being undertaken across its campuses. Researchers were awarded $12.8 million from the Marsden Fund to support world-class research in science, technology, social sciences and humanities. Funding was received for a total of 22 research projects, ranging from fungal drug resistance and entrepreneurial networking, to few-atom quantum dynamics and global ocean anoxia. Seven of the projects received fast-start grants.
Projects aimed at improving the health and well-being of New Zealanders gained around $16.5 million in the Health Research Council’s (HRC) funding round. Among them was a significant five-year programme investigating the use of viral proteins in sheep to potentially provide therapies for skin wounds and human conditions such as cancer, inflammatory disorders and viral infection. Other projects focus on cancer genetics, the molecule kisspeptin and its role in fertility and reproduction, rheumatoid arthritis, severe acute maternal morbidity among Mäori women, a school-based asthma support toolkit for Mäori children, and innovative research into the brain mechanisms regulating memory.
Neurological Foundation Funding was received for a further three projects being undertaken by members of Otago’s Brain Health Research Centre – stroke recovery, Parkinson’s disease and improving cognitive performance. Significant funding was also received from the Rheumatic Fever Research Partnership for work by Wellington-based researchers to help identify risk factors for this disease and the potential of probiotics in preventing it.
Two “smart ideas” projects received a total of $1.9 million in the Government’s science investment round, investigating the bio-manufacturing of key industrial chemicals and the development of new bee-friendly insecticides. Another 10 researchers succeeded in gaining $4.6 million as collaborators on other successful Ministry of Business, Innovation and Employment (MBIE)-funded projects and a further 37 staff also received grants from Lottery Health Research.
A Grand Challenges Explorations Grant, funded by the Bill and Melinda Gates Foundation, was gained for a simple cellphone-enabled approach to the diagnosis of parasitic worms in humans. Funding of $100,000 was received from the New Zealand Breast Cancer Foundation for researchers developing a low-cost treatment for triple negative breast cancer, an aggressive cancer that particularly affects younger women. Dr Vijay Devadas (Media, Film and Communication) received a $40,000 grant from the New Zealand India Research Institute to fund a project looking at the social lives of youths in the Indian city of Chennai.
As reflected in much of this research, the University of Otago is strategically committed to contributing to the national and international good through work that enhances health, social and environmental well-being. The Otago Climate Change Network (OCCNet) was established to raise awareness of climate change issues and foster crossdisciplinary projects. Scientists continued their internationally-recognised work to increase our understanding of the oceans – from ocean acidification and impacts on greenhouse gases, to the human effects on marine species and the future for endangered marine mammals.
The ongoing research of the Centre for Neuroendocrinology has cemented its position as one of the top international research groups examining how the brain controls reproduction. Also impressing internationally, the Master of Entrepreneurship programme’s research and application approach led to its winning the Outstanding Entrepreneurship Programme Abroad award from the United States Association of Small Business and Entrepreneurship. The Centre for Sustainable Cities had notable success in translating science research into policy and practice with a housing Warrant of Fitness programme which is to undergo a nationwide trial.
The National Centre for Peace and Conflict Studies, New Zealand’s first centre to combine global crossdisciplinary expertise on the issues of development, peace-building and conflict transformation, received a $500,000 anonymous donation to support a permanent lecturer in peace education and the extension of a postdoctoral
un
ive
rs
ity
of
ota
go
an
nu
al
re
po
rt
20
1322
fellowship on the economics of war and peace. A state-of-the-art physical containment level three (PC3) laboratory was officially opened in June, greatly enhancing Otago’s ability to undertake research into infectious disease.
Otago is strategically committed to fostering joint research programmes and collaborations with other universities and research institutions. For example, Professor David Murdoch (University of Otago, Christchurch) has been working with the Christchurch District Health Board (DHB) and Christchurch Health Laboratories to better identify risk factors for legionnaires’ disease and improved approaches to preventing this disease.
Professor Michael Baker (University of Otago, Wellington), together with ESR (Environmental Science and Research), the University of Auckland and the Auckland DHB, is involved in the SHIVERS project aiming to help Northern Hemisphere countries better plan for, and protect against, potential flu epidemics and pandemics. Similarly, Professor Antony Braithwaite (Pathology) is working with New Zealand and Chinese colleagues on a project to develop new anti-cancer drugs funded through the Strategic Research Alliance Joint Research Programme, which helps facilitate science research collaboration and the commercialisation of science between China and New Zealand.
Two Otago research results were included in the New Zealand Science Media’s top 10 science stories of 2013: Associate Professor Russell Poulter (Biochemistry) confirmed the Chinese origin of the PSA bacterium and genetic clues about why it devastated New Zealand kiwifruit crops; and the study led by Professor Lisa Matisoo-Smith (Anatomy) in which the sequencing of the mitochondrial DNA from human samples from the Wairau Bar burial site showed greater diversity than was expected of New Zealand’s earliest settlers and cast doubt on the theory that New Zealand was settled by small unplanned voyages.
The recognition of research excellence is central to the University’s commitment to strengthening its research culture. World-leading parasite ecology and evolution expert Professor Robert Poulin (Zoology) was the 2013 recipient of the University’s highest research honour, the Distinguished Research Medal.
Behavioural ecologist Dr Shinichi Nakagawa (Zoology) received the Carl Smith Medal and Rowheath Trust Award, which recognise outstanding research performance by early-career staff. Early Career Awards for Distinction in Research were also presented to Dr Karen Brounéus (National Centre for Peace and Conflict Studies), Dr Lyndie Foster Page (Faculty of Dentistry), Dr Carla Meladandri (Chemistry), Dr Suetonia Palmer (Medicine, Christchurch) and Dr Virginia Toy (Geology).
Otago was ranked first or second in
17 subject areas in the PBRF quality assessment
Researchers were awarded a total of
$29.3m in the Marsden and HRC funding rounds
23
Other staff whose work received significant recognition included:
Professor Michael Baker (Public Health, Wellington) who was awarded the HRC’s Liley Medal, in recognition of his 2012 study showing a dramatic rise in the incidence of serious infectious diseases and rising inequalities across populations in New Zealand.
Professor Richard Blaikie (Physics, Deputy Vice-Chancellor (Research and Enterprise)) who was presented with the 2013 Hector Medal for the advancement of physical sciences in recognition of his contributions to the field of nano-optics.
Professor Antony Braithwaite (Pathology), Professor Gregory Cook (Microbiology and Immunology), Professor Jörg Frauendiener (Mathematics and Statistics), Professor Philippa Howden-Chapman (Public Health, Wellington), Professor Lisa Matisoo-Smith (Anatomy) and Professor Richard Walter (Anthropology and Archaeology) who were elected Fellows of the Royal Society of New Zealand.
Professor Brett Delahunt (Pathology, Wellington) who received the International Academy of Pathology Distinguished Pathologist Medal and the Grawitz Medal in recognition of his contributions to the advancement of urological pathology.
Professor Jim McQuillan (Chemistry) who received the Royal Society of New Zealand’s T.K. Sidey Medal, recognising outstanding scientific research in the field of electromagnetic radiation.
Associate Professor Richard Macknight won the New Zealand Society for Plant Biologists’ premier prize, the Roger Slack Award for 2013.
Professor Gerald Tannock (Microbiology and Immunology) who received a James Cook Research Fellowship to support his studies into bacterial communities in the gut and their role in health and disease.
Ms Ceri Warnock (Law) who received New Zealand’s premier legal research award, the 2013 New Zealand Law Foundation International Research Fellowship.
Dr Suetonia Palmer (Medicine, Christchurch) and Dr Angela Wanhalla (History and Art History) gained Rutherford Discovery Fellowships. Dr Palmer and Mr Joseph Antoun (Oral Sciences) also received HRC Emerging Researcher First Grants.
A number of students won scholarships to pursue further study. Politics honours graduate Ben Abraham received a prestigious Rhodes Scholarship for postgraduate studies at Oxford University and Physics honours graduate Edward Linscott was awarded a Cambridge-Rutherford Memorial Scholarship to undertake doctoral studies at the University of Cambridge. Otago Geography master’s graduate David Gawith gained a Woolf Fisher Scholarship to the University of Cambridge.
Ilsa Cooke, Gaya Gnanalingam, Sunkita Howard, Ani Kainamu, Kelly O’Connell and Charlotte Till gained Fulbright New Zealand Science and Innovation Graduate Awards, and Charlotte Greenfield received a Fulbright New Zealand General Graduate Award.
Otago was ranked first or second in
17 subject areas in the PBRF quality assessment
Researchers were awarded a total of
$29.3m in the Marsden and HRC funding rounds
un
ive
rs
ity
of
ota
go
an
nu
al
re
po
rt
20
1324
Achieving excellence inresearch-informedteaching
Teaching excellence is a priority at the University of Otago and this was confirmed by ongoing success in the Tertiary Education Commission’s (TEC) educational performance indicators, the teaching awards received by Otago staff and the performance of Otago students.
25
The University of Otago was ranked top of all New Zealand universities in the educational performance indicators (EPIs) released by the TEC in 2013. These measure course completion, qualification completion, student progression and student retention. Otago was placed first in all four indicators, the first time any university has topped all four since the EPI system was introduced.
The University also featured among the top 100 institutions in the world in 12 subject areas in the 2013 QS World University Rankings. Otago improved its 2012 ranking in 11 of the 30 subject areas under evaluation and was placed among the top 50 institutions worldwide in three subjects, including psychology – which, at 15th place, was the highest ranking of any subject area at a New Zealand university – history and archaeology (24th), and law and legal studies (32nd).
In 2013, 190 undergraduate and postgraduate degree, diploma and certificate programmes were offered across the four academic divisions. New programmes included a Bachelor of Social Work with Honours, Bachelor of Dental Surgery with Honours, Bachelor of Physiotherapy with Honours and Postgraduate Certificate in Pharmacist Prescribing. Eight new one-year coursework masters’ programmes were approved for introduction in 2014 – in Peace and Conflict Studies, Wildlife Management, Applied Science, International Studies, Business Data Science, Finance, Higher Education, and Teaching and Learning. A three-year Bachelor of Performing Arts, comprising the disciplines of theatre, music and dance, will also be introduced in 2014.
Sixty-seven programmes were offered by Distance Learning, 60 of which were at postgraduate level. Initiatives arising from the 2011 Distance Learning review continued to be implemented throughout 2013, including a two-day intensive course development workshop for academics. An off-campus information and support workshop for coursework and research distance students was again held in Auckland.
The 13th Otago Summer School, held in January/February, offered 75 papers and attracted 2,128 enrolments. Of these papers, 26 were either new or had not been offered in 2012 and 51 were available only during Summer School. Most papers (62) were taught in Dunedin, with two taught in Auckland, two in Wellington and nine taught by distance. Twelve papers were taught by visiting international academics especially contracted for Summer School. Two additional Summer School papers were offered in November/December, attracting 97 enrolments in total.
The University experienced an overall decline in enrolments in 2013, down 1.4% from 2012. This was the third successive year that enrolment numbers have decreased, following a period of sustained growth from 2007 to 2010. The total of 18,875 EFTS (equivalent full-time students) comprised 18,600 University EFTS and a further 275 EFTS for the University’s Foundation Studies subsidiary, and was generated by 21,113 individual students (see pages 108-110).
Factors combining to produce this result were similar to those that affected enrolments in 2012. These included the ongoing impact of internal measures – notably, the tightening of admission and academic progress policies – to advance the University strategically in terms of the calibre and nature of its student cohort. External factors included the one-off effect of community education short courses no longer counting for EFTS purposes (the result of another Government policy change), and the winding down of a major international contract affecting enrolments from Malaysia.
Encouragingly, however, there was further recovery in first-year numbers, rising by 3.8% in 2013 after a gain of 4.3% in 2012. (In 2011, first-year numbers dropped following the introduction of an undergraduate enrolment limitation system.) Enrolment in the University’s Foundation Studies subsidiary also increased for a second successive year, by 11.8%. The proportion of commencing students attracted from outside the University’s Otago/Southland home catchment increased slightly to reach 71.8%, the highest in Otago’s history.
Mäori enrolments continued to grow, reaching a record 9.2% of the domestic roll in EFTS terms. Pacific enrolments also increased, comprising 3.3% of domestic EFTS. The number of new students recruited from Australia was 206 (2012:193), including a commencing cohort of 36 students (2012: 42). Approximately half of this group were New Zealand citizens returning from Australia.
International enrolments declined overall, dropping 5.6% for full-fee international EFTS, down 1.6% to 2,648 in head-count terms. This difference between EFTS and head-count performance reflects a growth in short-visit (mainly single-semester) study-abroad students and a drop in full-degree international enrolments.
The international recruitment market remained challenging in 2013, not helped by the continued strength of the New Zealand dollar and increasingly aggressive competition from universities in countries such as the United States and United Kingdom, which are highly attractive destinations for overseas students. Despite this, Otago achieved international enrolment growth from 14 of the 21 countries from which it recruited more than 20 students in 2013.
With a recovery in single-semester study-abroad enrolments from North America (after a post-Canterbury earthquake drop in 2012), the United States – with 9.1% growth – retained its position as Otago’s leading source of international students.
China (up by 7.3% in 2013) displaced Malaysia as the second largest source of international enrolments at Otago. As noted above, Malaysian enrolments dropped 20% as a result of the scheduled winding down of a major teacher-education contract. Together, the US, China and Malaysia accounted for 53% of all international students on campus by head-count and the University is likely to remain dependent on these markets in the short to medium term.
un
ive
rs
ity
of
ota
go
an
nu
al
re
po
rt
20
1326
Of the 94 countries represented in the University’s international student cohort, the US, China and Malaysia supplied more than 400 enrolments each; the UK and India each accounted for just over 100, while Saudi Arabia, Germany and Brunei all accounted for more than 50 enrolments. Solid enrolment growth was also achieved from Iran, Japan, Singapore, Vietnam, Taiwan and Denmark.
In 2013, 200 students spent at least one semester at one of the University’s 97 partner universities (including 13 full-year exchanges). Inbound student numbers were 214, including 11 students who came for the full year. US and Canadian Alumni Scholarships have encouraged good numbers of applicants and an Otago student received the Prime Minister’s scholarship to attend the University of Hong Kong in 2013. New agreements were signed with Ashton Business School, Sun Yat-Sen Business School, Universite Joseph Fourier, Florida International and the University of Leipzig. Student exchange has become increasingly popular, growing more than 13% since 2010.
International PhD head-count numbers increased to 565 (2012: 519), with the highest numbers coming from the US (63) and India (63), ahead of Malaysia (50), Iran (48), UK (43) and Germany (41).
Overall postgraduate enrolments, however, dipped both in absolute terms (down by 150 EFTS) and as a proportion of the roll, slipping from 16.6% to 16.1% of University EFTS. Likely reasons for this included a strengthening economy (generating more job opportunities for graduates) and changes to scholarships for research degree study.
At the end of 2013, there were 1,361 doctoral enrolments (2012: 1,377), including 1,293 PhD candidates (2012: 1,301), 26 Doctor of Education candidates (2012: 26), 36 Doctor of Clinical Dentistry candidates (2012: 46) and six Doctor of Musical Arts candidates (2012: four). There were also 1,216 enrolments at master’s level (2012: 1,281), 1,383 in postgraduate diplomas and certificates (2012: 1,477) and 219 enrolled in postgraduate honours degrees (a new option in 2013), with another 152 enrolled in undergraduate honours degrees (2012: 364).
A record number (247) of doctoral candidates successfully completed their studies in 2013 (2012: 230) and 306 thesis masters’ candidates also finished (2012: 270).
The Graduate Research School was officially launched at the beginning of Graduate Research Month in August and other events that month included a postgraduate Twitter conference, a Chamber Debate and a Three Minute Thesis Competition, won by Daniel Wee (Philosophy). The Graduate Research School renewed and expanded the workshop programme of support offered to graduate research candidates and instigated a Blackboard website with resources for doctoral candidates.
21,113 students enrolled
190 programmes offered
More than
2.1m lectures downloaded
Students come from
94 countries around the world
27
21,113 students enrolled
190 programmes offered
More than
2.1m lectures downloaded
Students come from
94 countries around the world
The University recognises the vital importance of excellent and inspiring teachers for the successful delivery of academic programmes, and remained committed to both enhancing the quality of teaching and celebrating teachers’ outstanding achievements.
Associate Professor Gordon Sanderson (Dunedin School of Medicine), Professor Rachel Spronken-Smith (Graduate Research School) and Dr Moyra Sweetnam Evans (Applied Linguistics) received the University of Otago Teaching Excellence Awards for 2013.
Associate Professor Sanderson went on to take top honours at the national Tertiary Teaching Excellence Awards, winning the Prime Minister’s Supreme Award for Tertiary Teaching Excellence. He was the fourth Otago academic to have won this supreme award in the past 11 years, a performance that remains unmatched by any other institution in New Zealand.
Japanese teaching fellow Haruko Stuart took top honours in the Otago University Students’ Association (OUSA) 2013 teaching awards. Associate Professor Leigh Hale (Physiotherapy), Dr Gill Rutherford (Education) and Mr Tony Zaharic (Biochemistry) received Inclusiveness in Teaching awards. OUSA also named Dr Roslyn Kemp (Microbiology and Immunology) as Research Supervisor of the Year and Associate Professor Jacinta Ruru (Law) as New Supervisor of the Year.
The Evaluation Research and Development section of the Higher Education Development Centre undertook 2,732 teaching and course evaluations throughout the year.
The University remained equally committed to investing in the high quality facilities and support services that sustain teaching excellence. A world-leading virtual environment radiation therapy training system (VERT) was installed for use by students in the Department of Radiation Therapy, Wellington, revolutionising national radiation therapy education and vastly improving training for treating patients.
Significant steps were taken to upgrade and modernise the local area network (LAN) and wireless networks across the University’s campuses. A five-year support agreement was signed with Dimension Data as network services partner, and the University plans to invest $22 million over this time to develop a more responsive, agile, connected campus platform to support teaching, research and administrative activities.
Students continued to use the University’s lecture podcast service in record numbers, with 2,172,480 lectures downloaded throughout the year.
The Library ensured its place as a highly valuable resource for the academic community by implementing a new generation library management system in 2013. It increased its extensive print collections to a total of 3,138,821 items (2012: 3,121,386) and continued to build on its range of electronic resources where appropriate. 215,047 ejournals are now available and accessible ebooks increased to 510,375 (see page 51).
un
ive
rs
ity
of
ota
go
an
nu
al
re
po
rt
20
1328
Ensuring outstanding campus environments and student experience
The University of Otago is renowned for its exceptional campus environments and is committed to providing high-quality and sustainable environments for staff and students, as well as a welcoming environment for local communities and visitors.
29
The University was again recognised as having one of the most beautiful campuses in the world. Following the UK’s Telegraph newspaper ranking of Otago among 16 of the world’s most beautiful campuses 2012, The Huffington Post, an online news aggregator, has ranked Otago among the 15 most beautiful campuses in 2013, alongside the likes of England’s Cambridge and Oxford Universities, the University of Sydney, and Queens University of Belfast.
A revised smoke-free policy was launched at the end of May, making all campuses totally smoke-free from the beginning of 2014. While the Christchurch, Wellington and Invercargill campuses were already smoke-free, the Dunedin campus had allowed smoking at a distance further than six metres from buildings.
In another decision to enhance the Otago campus experience, the University joined eduroam™ (education roaming) which provides a secure collaborative wireless network service to staff, students and visitors on campus and at thousands of locations worldwide.
A common feature of all of the University’s campuses is their location within established settings. This has a significant effect on campus development and the University undertakes to ensure that all building projects reflect and promote a vision of excellence and safety.
A Campus Master Plan was developed in 2010 to provide a vision and direction for the campuses over the next 25-30 years. This, in turn, informs a Priority Development Plan that provides a rolling six-to-eight-year blueprint for capital developments. Key projects in this plan include the redevelopment of the Dental School, science precinct laboratory facilities and Arts Building; an upgrade of the Commerce Building and Atrium; a building in the new Christchurch Health Precinct; a research support building and a biomedical sciences research building.
$50 million has also been allocated in this plan for a programme of seismic strengthening of University buildings to at least 67% of new building standard (NBS) and as close to 100% as possible, to be completed by 2019. The programme continued throughout 2013.
Three non-residential research/operational facilities have been assessed as earthquake prone or below 34% of NBS – the Scott Building (Health Sciences), Property Services building and the unoccupied St David 2 building. Necessary repairs are still being determined. Seismic strengthening has been completed at Carrington College and work at Aquinas College was to be completed in early 2014.
Staff and students moved back into the repaired University of Otago, Christchurch building at the beginning of the 2013 academic year. It had been closed since the devastating February 2011 earthquake, but has been substantially strengthened to 120 per cent of NBS.
The Marsh Study Centre, redeveloped from the former Gardens Tavern at the north end of Castle Street, was opened early in the year and has proven very popular with students. It provides a well-appointed study area for up to 220 students, wi-fi, café and views
of the Dunedin Botanic Garden, and was a winner in the education category of the 2013 Southern Architecture Awards.
Similarly, the high quality and functionality of the space provided by the University of Otago Plaza adjacent to Forsyth Barr Stadium was recognised with an Award of Excellence in the New Zealand Institute of Landscape Architects Awards.
Construction of a new University childcare centre began in July 2013 and was expected to be operational by mid-April 2014. The development, between Castle Street and Montgomery Avenue, will provide places for 140 children. A feature of the project has been the retention of the look and feel of the Castle Street frontage, achieved by the recycling of bay windows, fascias and other decorative moulding from previous Edwardian villas on the site. The units on the Montgomery Avenue side of the complex will provide a modern interpretation of the classic villa. A large landscaped courtyard in the middle of the site will provide connection, play and activity space.
A Visitors’ Centre was built on the Cumberland Street (northwest) facade of the St David Lecture Theatre complex. Due to open in early 2014, the centre features high-tech displays, digital content and memorabilia, providing a high quality “front door” to the University and an interactive experience for visitors.
The Otago Regional Council (ORC) Leith Flood Protection Scheme continued with work on the Leith to Forth Streets reach nearing completion and the Clocktower reach due to start in January 2014. The University has worked closely with the ORC to ensure that the final scheme meets the needs of both parties and that it enhances Otago’s exceptional campus environment. Both reaches are expected to be completed by June 2014.
In early 2013 the University purchased the LivingSpace Dunedin hotel, at 192 Castle Street, and in October work began on the conversion of the building into a residential college, opening for the 2014 academic year. To be called Te Rangi Hïroa College in honour of Otago’s first Mäori graduate, Sir Peter Buck, the new college will cater for 128 undergraduate students and its facilities will include single rooms with ensuite bathrooms, a Head of College apartment, small theatre, large common room, full dining-room service, academic tutorial facilities and recreational space.
The strategic importance of sustainability to the University was strengthened in 2013. Social, ethical and environmental responsibility feature prominently in the Strategic Direction to 2020 document approved by Council in August, and Otago was accredited as New Zealand’s first Fairtrade university. Sustainability measures were incorporated into the planning and approval process for the construction and renovation of campus facilities, as well as internal academic and administrative reviews (beginning in 2015). Environmental data collection, monitoring and reporting systems were also improved.
un
ive
rs
ity
of
ota
go
an
nu
al
re
po
rt
20
1330
3,352 students lived in a residential college
95.4% of students provided positive assessment of the campus, administration and support services
One of the
15 most beautiful campuses in the world
With waste minimisation an integral part of sustainability efforts, 30 new outdoor recycling stations were installed across the campus, with a further 30 smaller stations installed in shared indoor areas including lecture theatre buildings, libraries, the Link, the University Union and Unipol. Sustainability workshops were held as part of the Academic Development Leadership Programmes and OUSA’s Environment Week.
The Otago experience, encompassing the social, cultural and sporting aspects of student life as well as the pursuit of academic excellence, is one of the defining features of the University. It has its roots in the University’s distinctive residential lifestyle, beginning for many students in one of the 14 residential colleges located in and around campus. In 2013, 3,352 students were accommodated in these colleges, including 75 at Abbey College, New Zealand’s first postgraduate college.
As mentioned above, Te Rangi Hiroa College, the University’s 15th residential college, was due to open in February 2014. The University also owns and operates flats for international students, providing accommodation for 533 students in 2013.
As New Zealand’s only true residential University, Otago takes seriously its responsibility to provide outstanding pastoral support. This is provided not only via the residential colleges, but also the University Chaplains, Student Learning Centre, Career Development Centre, Student Health, and Disability Information and Support, as well as targeted support services for international, Mäori and Pacific students.
In 2013 the University enrolled 1,000 students who identified as having a disability affecting study and provided more than 1,720 instances of learning assistance, note-taking, tutoring and other forms of support (see also page 56).
More than 3,512 students attended Student Learning Centre workshops across the University’s campuses. A further 1,048 students accessed one-to-one consultations and 95 weekly peer-assisted study sessions (PASS) were held throughout the academic year.
The University is committed to working in partnership with students, nurturing safe, healthy and sustainable lifestyles, and providing opportunities for high-quality extra-curricular activities. For the second year, the University and OUSA jointly ran the Orientation programme which was a resounding success. A week of music, sport and festivity was opened by a Unismart event at the Forsyth Barr Stadium, attended by both the Vice-Chancellor and the Mayor of Dunedin.
Initiatives to promote the Student Code of Conduct, and particularly the dangers of excessive alcohol consumption, continued throughout the year. The UniPol Gymnasium, located
31
at University Plaza adjacent to the Forsyth Barr Stadium, continued to be very popular with students, with a total of 655,971 visits for the year.
The University is also committed to harnessing student altruism for the betterment of both students and the wider community. Following consultation with OUSA and Dunedin volunteer agencies, the University Volunteering Centre was opened in October to co-ordinate volunteer activities that were already taking place, and to encourage and promote new volunteering opportunities. In one of the centre’s first major projects, more than 80 staff and students volunteered to help at the New Zealand Special Olympics held in Dunedin in November.
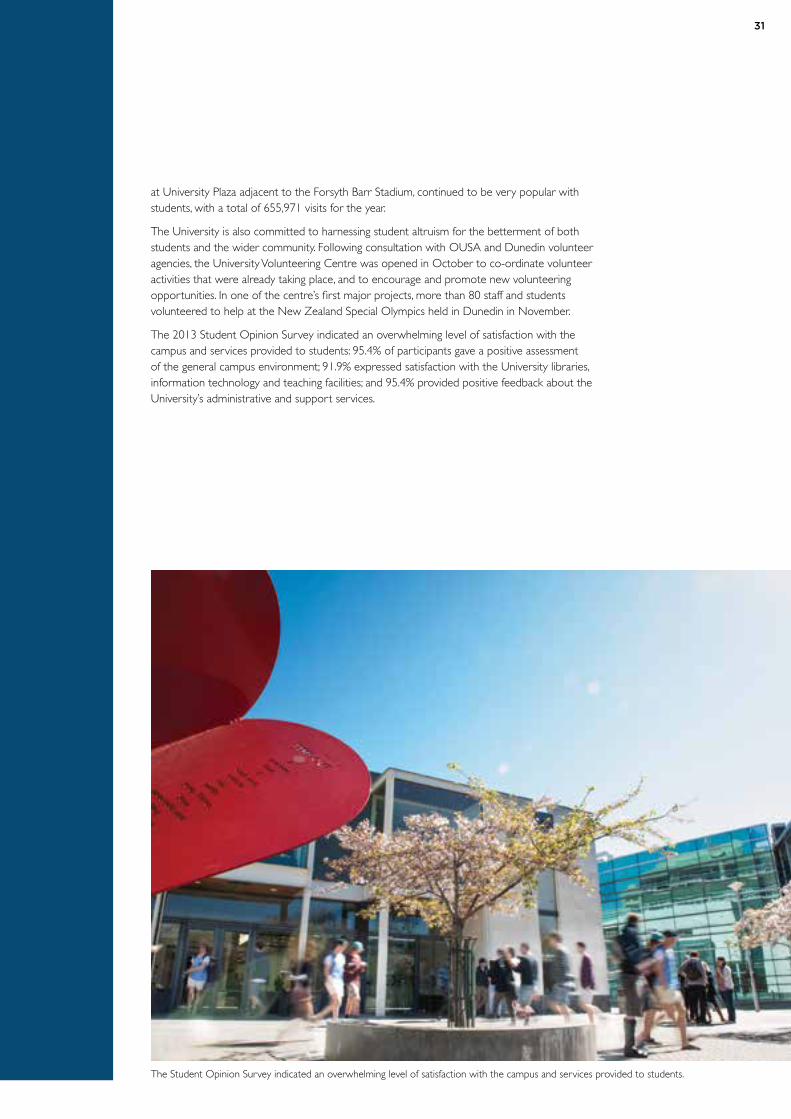
The 2013 Student Opinion Survey indicated an overwhelming level of satisfaction with the campus and services provided to students: 95.4% of participants gave a positive assessment of the general campus environment; 91.9% expressed satisfaction with the University libraries, information technology and teaching facilities; and 95.4% provided positive feedback about the University’s administrative and support services.
The Student Opinion Survey indicated an overwhelming level of satisfaction with the campus and services provided to students.
un
ive
rs
ity
of
ota
go
an
nu
al
re
po
rt
20
1332
Contributing to the national good and to international progress
New Zealand is in the midst of major demographic, social and economic changes which, over the coming decades, will significantly alter this country. The University of Otago has already made a purposeful response to the challenges posed by changing times and is strongly committed to an ongoing contribution to regional, national and international good.
33
As canvassed in the Research Excellence section of this report (see pages 20-23) the University encourages research in areas that support health, development and well-being. Further to this, in October a Memorandum of Understanding (MOU) was signed with World Vision New Zealand to enhance efforts to alleviate poverty, globally and in New Zealand and the Pacific. This will bring together academics, development experts and students to collaborate on research, international programme design and workforce development, and to promote debate around the causes and dynamics of poverty.
The Children’s Issues Centre joined a new UNICEF partnership project to help the research community to understand, plan and conduct ethical research involving children and young people. Researchers in the interdisciplinary ASPIRE2025 group worked to support the government’s 2025 smoke-free Aotearoa goal by undertaking policy-oriented research, attending and presenting at national and international conferences, as well as disseminating their research through blogs, seminars, websites and media releases.
The University is committed to supporting the development and success of Mäori. Continuity is pivotal to this and the Office of Mäori Development plays a key role in implementing the Mäori Strategic Framework (MSF) across the University. The current MSF is coming to an end and work on a new framework, providing strategy and direction until 2020, is expected to be completed in early 2014.
A Memorandum of Understanding between the University of Otago and Te Rünanga o Ngäi Tahu was re-signed in December, re-emphasising the work that has been done over the past decade to embed Ngäi Tahu goals and aspirations into research and teaching activities.
A number of new programmes were introduced for Mäori students and existing programmes continued to be successful. He Käkano, an experiential training programme, was introduced to help foster a culture of Mäori entrepreneurship. This is a collaborative project between the University, Otago Polytechnic and UpStart.
In an inaugural Hikohiko te Uira Mäori Enterprise Internship Programme, three science students spent more than 10 weeks working within the New Zealand science system, across government agencies and with Mäori businesses. The programme, jointly supported by the University, the Federation of Mäori Authorities and Callaghan Innovation, aims to develop Mäori leaders to support the growth of Mäori business and the national economy.
The Division of Sciences held wänanga with local hapu/iwi in Southland, Otago, Marlborough, Hawkes Bay and Northland, and also co-ordinated and supported the science component of Whakahou Mätauranga, a campus-based programme to engage at-risk high school Mäori tauira from Dunedin in education. An academic orientation for Mäori first-year sciences students was established, offering extended support for Mäori students throughout the year, and a Mäori students’ science support group, Te Roopü Pütaiao.
The Division of Health Sciences co-ordinated a number of successful programmes for Mäori including the Tü Kahika foundation programme, Te Whakapuäwai Health Sciences First-Year support programme and Te Ara Hauora, an engagement and recruitment of Mäori students into the health professional and health sciences programmes at Otago.
Te Huka Mätauraka (the Mäori Centre) has been instrumental in supporting Mäori students throughout the year providing academic and pastoral support from Orientation through to the end of the exam period. This includes co-ordinating Türaka Hou (orientation programme), Kä Rikarika-ä-Täne (mentoring programme), and as a general contact point for Mäori students.
Christchurch’s Mäori/Indigenous Health institute (MIHI) won the Australasian Award for innovation in indigenous health curriculum implementation at the international Leaders in Medical Education conference. MIHI oversees the Mäori health component of Otago’s medical curriculum.
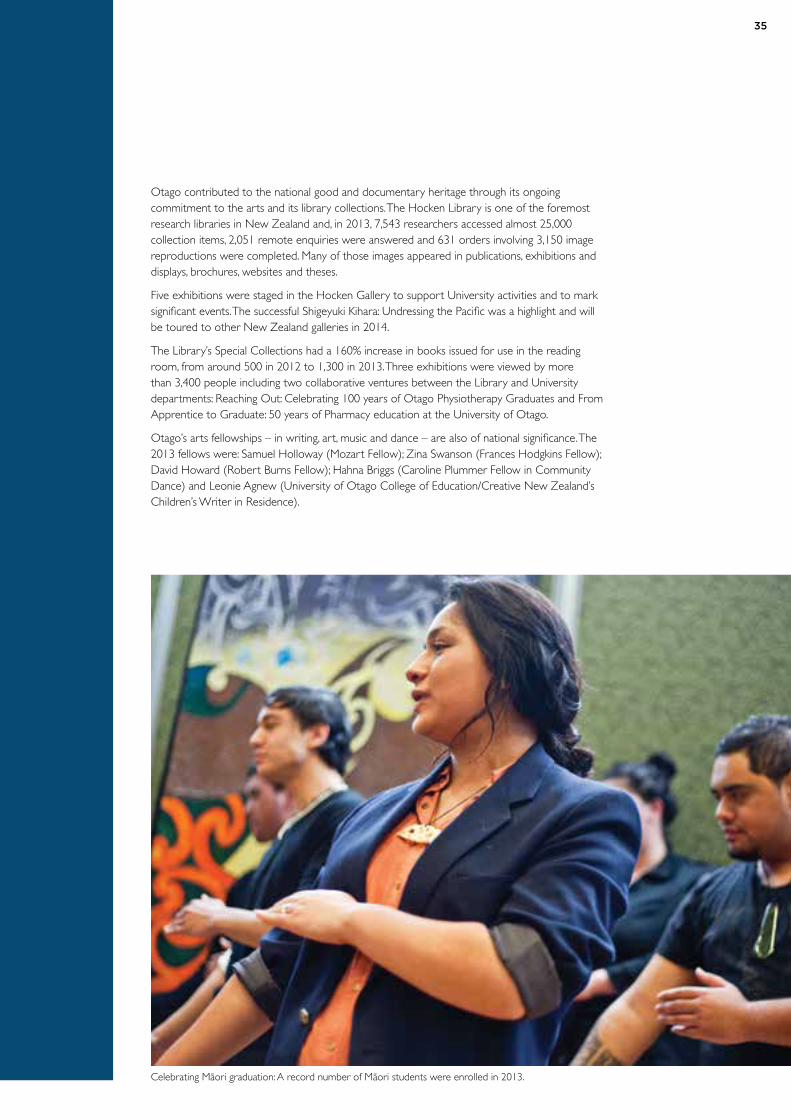
In 2013 a record 1,682 Mäori students were enrolled, representing 8.0% of total enrolments and 9.2% of total domestic EFTS (see also pages 53-55).
A Pacific Strategic Framework was launched in 2013, marking a significant milestone in the University’s longstanding engagement with local, national and regional Pacific communities. Otago’s first Director of Pacific Development, Dr Tasileta Teevale, was appointed to monitor the framework’s implementation. It identifies six over-riding goals to ensure the University meets the needs of Pacific People:
demonstrating and valuing leadership on Pacific matters
encouraging Pacific research excellence
strengthening community engagement
promoting growth and development
encouraging Pacific curricula
contributing to the Pacific region and international progress.
The Pacific Islands Centre continued to provide a range of services for Pacific students, including academic support and mentoring, pastoral care, and links to Pacific Islands networks. Pacific enrolments held steady with 669 students, representing 3.2% of total enrolments (head count) and 3.3% of total domestic EFTS (see also pages 55-56).
Economically, the University makes a significant impact at both local and national levels. The Economic Impact Report, released in 2013, estimated that the overall direct impact of the institution to Dunedin and other centres in New Zealand was $897 million in 2012 (2011: $889.9 million), and that the downstream effect of this – or total economic impact – was $1.662 billion. Total expenditure in Dunedin
un
ive
rs
ity
of
ota
go
an
nu
al
re
po
rt
20
1334
was estimated at $800 million; Wellington, $47.1 million; Christchurch, $46.2 million; and Invercargill, $3.5 million.
Through its many outreach activities, the University engages with and supports a variety of programmes for secondary school students throughout New Zealand. The Hands-on Science programme, that has been held annually since 1989, attracted 249 participants and was run on campus in conjunction with the MacDiarmid Institute’s NanoCamp for Year-12 students.
The Otago University Advanced School Sciences Academy (OUASSA) hosted its third intake of high-potential Year-13 students from provincial/rural, small and low-decile schools and also ran a very successful teacher professional development programme for schools linked to the academy and wänanga programme (see page 33). Fifty Year-11 students from Kapiti and Paraparaumu Colleges attended an open day at the University of Otago, Wellington in May, jointly hosted by the Pacific Health Directorate at Capital and Coast District Health Board and the University.
During November and December, staff from the Bioethics Centre took a Bioethics Roadshow around New Zealand, visiting high schools for day-long workshops, highlighting bioethical issues and contemporary arguments and philosophy around those issues.
The Business School continued to provide sponsorship to the Young Enterprise Trust, fostering business studies and skills in young high school students participating in the trust’s business enterprise programme. The Division of Humanities continued its sponsorship of the annual Shakespeare Globe Centre New Zealand University of Otago Sheilah Winn Shakespeare Festival, and the Southern Sinfonia.
The National Poisons Centre (NPC), based in the Department of Preventive and Social Medicine, continued to provide a 24-hour, 365-days-a-year free phone service to the people of New Zealand. Around 35,000 acute poisoning enquiries were answered in 2013. The centre maintains a database (TOXINZ) of some 190,000 toxic substances that is extensively used in the management of poisoned patients in New Zealand hospitals as well as overseas.
In 2013 an international distributer for TOXINZ was appointed to assist with global distribution and sales (see page 59). The NPC continued to play a vital role in toxicovigilance and poison prevention, involving the identification and evaluation of toxic risks and phenomena in the community. Profiling of calls to the NPC involving synthetic cannabis assisted the Ministry of Health in informing the 2013 Psychoactive Substances Act.
The University’s total economic impact was
$1.662bM-aori students comprised a record
9.2% of domestic EFTS
7,543 researchers used theHocken Collections
35,000 poisoning enquiriesanswered
35
The University’s total economic impact was
$1.662bM-aori students comprised a record
9.2% of domestic EFTS
7,543 researchers used theHocken Collections
35,000 poisoning enquiriesanswered
Otago contributed to the national good and documentary heritage through its ongoing commitment to the arts and its library collections. The Hocken Library is one of the foremost research libraries in New Zealand and, in 2013, 7,543 researchers accessed almost 25,000 collection items, 2,051 remote enquiries were answered and 631 orders involving 3,150 image reproductions were completed. Many of those images appeared in publications, exhibitions and displays, brochures, websites and theses.
Five exhibitions were staged in the Hocken Gallery to support University activities and to mark significant events. The successful Shigeyuki Kihara: Undressing the Pacific was a highlight and will be toured to other New Zealand galleries in 2014.
The Library’s Special Collections had a 160% increase in books issued for use in the reading room, from around 500 in 2012 to 1,300 in 2013. Three exhibitions were viewed by more than 3,400 people including two collaborative ventures between the Library and University departments: Reaching Out: Celebrating 100 years of Otago Physiotherapy Graduates and From Apprentice to Graduate: 50 years of Pharmacy education at the University of Otago.
Otago’s arts fellowships – in writing, art, music and dance – are also of national significance. The 2013 fellows were: Samuel Holloway (Mozart Fellow); Zina Swanson (Frances Hodgkins Fellow); David Howard (Robert Burns Fellow); Hahna Briggs (Caroline Plummer Fellow in Community Dance) and Leonie Agnew (University of Otago College of Education/Creative New Zealand’s Children’s Writer in Residence).
Celebrating Mäori graduation: A record number of Mäori students were enrolled in 2013.
un
ive
rs
ity
of
ota
go
an
nu
al
re
po
rt
20
1336
Strengtheningexternal engagement
While the location of the University of Otago’s main campus in Dunedin offers many outstanding advantages, it also geographically removes the University from the main centres of population and political and economic decision-making. The University must, therefore, work to build strong relationships with New Zealand’s political, business, professional and community leaders and secure representation on key educational, health and research bodies.
37
The Vice-Chancellor Professor Harlene Hayne was appointed as a non-executive member of the New Zealand Treasury Board; re-appointed to the Board of Fulbright New Zealand; and became an associate investigator with Gravida: National Centre for Growth and Development (a government-funded centre for research excellence).
She remains also a member of the Society for Research in Child Development, the International Society for Infant Studies, and the Society for Applied Research in Memory and Cognition; co-director of the New Zealand Innocence Project; a member of the UK Advisory Board for interviewing children; and co-chair of the Office of the Prime Minister’s Science Advisory Committee Working Party on Reducing Social and Psychological Morbidity during Adolescence.
Deputy Vice-Chancellor (Research and Enterprise) Professor Richard Blaikie joined the Board of Gravida: National Centre for Growth and Development and is a principal investigator of the MacDiarmid Institute. Deputy Vice-Chancellor (Academic and International) Professor Vernon Squire served on the boards of the Riddet Institute (a centre of research excellence) and the MacDiarmid Institute.
Professor Warren Tate (Biochemistry) served on the Science Board for the Ministry of Business, Innovation and Employment; Professor Vicky Cameron (Medicine, UOC) joined Professor Graham Wallis (Zoology) on the Marsden Fund Council; and Professor Andrew Mercer (Microbiology and Immunology) served on the HRC Council.
Professor Peter Crampton (Pro-Vice-Chancellor, Health Sciences) served on the Medical Deans Australia New Zealand executive and the National Medical Pipeline Taskforce (Health Workforce New Zealand). Together with the Chief Operating Officer, Mr John Patrick, he is also a member of Christchurch Health Precinct steering group. Professor Keith Hunter (Pro-Vice-Chancellor, Sciences) is on the NIWA board and a member of the International Council for Science’s regional committee for Asia and the Pacific.
Professor George Benwell (Pro-Vice-Chancellor, Commerce) is the deputy chair of Research and Education Advanced Network New Zealand Ltd and the president of the Association of Asia Pacific Business Schools. Professor Brian Moloughney (Pro-Vice-Chancellor, Humanities) is a member of the Advisory Board of Australasian Consortium of Humanities Research Centres, a network for groups engaged in Humanities-based research, and an associate director of the New Zealand Contemporary China Research Centre.
In 2013, 20.7% of staff served on government advisory boards and committees, and 70.7% provided services to public sector departments, statutory authorities, agencies, boards, committees and/or non-governmental organisations.
Community service and outreach activities are an important part of University engagement. In 2013, 90.2 % of surveyed academic staff reported involvement in community service activities (2012: 87.1%). It is estimated that community service typically absorbs 6-10% of an
academic staff member’s professional time. The value of community service by academics in 2013 was estimated at $28.4 million (2012: $28.0 million).
Through these activities many Otago staff received national and international recognition. They included:
Professor Tony Binns (Geography) who received the New Zealand Geographical Society’s Distinguished New Zealand Geographer Medal in recognition of his “outstanding and sustained contributions and service” to geography and society.
Professor Rosalind Gibson (Human Nutrition) who was awarded the 2013 Kellogg International Prize in Nutrition by the American Society of Nutrition.
Professor Charles Higham (Anthropology and Archaeology) who was honoured as one of 10 international researchers at the inaugural Shanghai Archaeology Forum for his decades of work on the origins of South-East Asia’s Angkorian civilisation.
Associate Professor Takashi Shogimen (History and Art History) who won Japan’s 2013 Suntory Prize for Social Sciences and Humanities (History and Civilisation Section), for his book, Yoroppa Seiji Shiso Tanjo (The Birth of European Political Thought).
Dr Margot Skinner (Physiotherapy) who became the first person in the past 10 years to be awarded an honorary fellowship by Physiotherapy New Zealand.
A large number of conferences and symposia were hosted on our campuses. Of particular note was the 20th Biennial Conference on the Biology of Marine Mammals in December, bringing together around 1,100 delegates and 24 exhibitors from more than 30 countries. It was the first time this event had been held in Australasia and was believed to be the largest conference held in Dunedin for a decade.
The biennial ScienceTeller festival was held in October, hosted by the Centre for Science Communication, and again featured a programme of internationally renowned guests and three days of entertaining events. The 48th University of Otago Foreign Policy School focused on the geopolitics of the Pacific with former Fijian Prime Minister Major-General Sitiveni Rabuka as one of the speakers.
A total of 351 open-to-the-public events were held in 2013, including the Winter Lecture Series in Auckland and Wellington which highlighted the real-world benefits of Otago’s research centres, and the inaugural Genetics Week in September. Among the many distinguished speakers on campus was His Holiness the 14th Dalai Lama who held a question and answer session for staff and students in June. This was the first time His Holiness had been hosted by a New Zealand university.
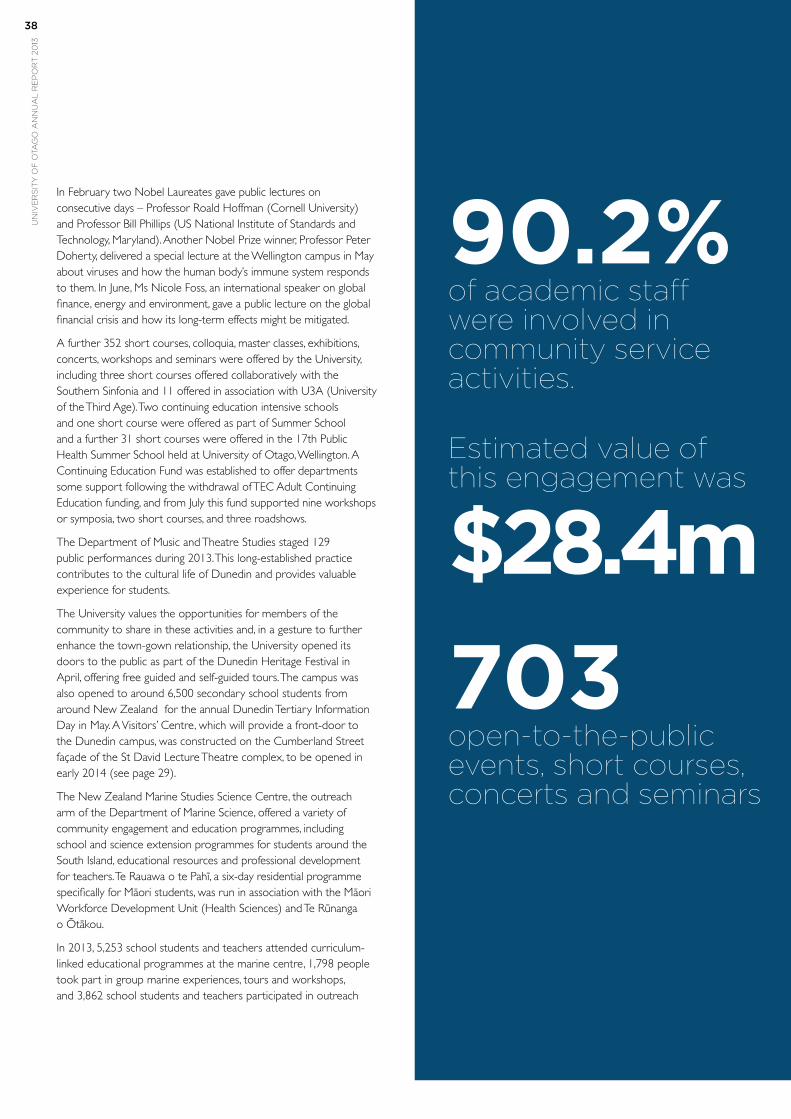
un
ive
rs
ity
of
ota
go
an
nu
al
re
po
rt
20
1338
90.2%of academic staff were involved in community service activities.
Estimated value of this engagement was
$28.4m703open-to-the-public events, short courses,concerts and seminars
In February two Nobel Laureates gave public lectures on consecutive days – Professor Roald Hoffman (Cornell University) and Professor Bill Phillips (US National Institute of Standards and Technology, Maryland). Another Nobel Prize winner, Professor Peter Doherty, delivered a special lecture at the Wellington campus in May about viruses and how the human body’s immune system responds to them. In June, Ms Nicole Foss, an international speaker on global finance, energy and environment, gave a public lecture on the global financial crisis and how its long-term effects might be mitigated.
A further 352 short courses, colloquia, master classes, exhibitions, concerts, workshops and seminars were offered by the University, including three short courses offered collaboratively with the Southern Sinfonia and 11 offered in association with U3A (University of the Third Age). Two continuing education intensive schools and one short course were offered as part of Summer School and a further 31 short courses were offered in the 17th Public Health Summer School held at University of Otago, Wellington. A Continuing Education Fund was established to offer departments some support following the withdrawal of TEC Adult Continuing Education funding, and from July this fund supported nine workshops or symposia, two short courses, and three roadshows.
The Department of Music and Theatre Studies staged 129 public performances during 2013. This long-established practice contributes to the cultural life of Dunedin and provides valuable experience for students.
The University values the opportunities for members of the community to share in these activities and, in a gesture to further enhance the town-gown relationship, the University opened its doors to the public as part of the Dunedin Heritage Festival in April, offering free guided and self-guided tours. The campus was also opened to around 6,500 secondary school students from around New Zealand for the annual Dunedin Tertiary Information Day in May. A Visitors’ Centre, which will provide a front-door to the Dunedin campus, was constructed on the Cumberland Street façade of the St David Lecture Theatre complex, to be opened in early 2014 (see page 29).
The New Zealand Marine Studies Science Centre, the outreach arm of the Department of Marine Science, offered a variety of community engagement and education programmes, including school and science extension programmes for students around the South Island, educational resources and professional development for teachers. Te Rauawa o te Pahï, a six-day residential programme specifically for Mäori students, was run in association with the Mäori Workforce Development Unit (Health Sciences) and Te Rünanga o ötäkou.
In 2013, 5,253 school students and teachers attended curriculum-linked educational programmes at the marine centre, 1,798 people took part in group marine experiences, tours and workshops, and 3,862 school students and teachers participated in outreach
39
90.2%of academic staff were involved in community service activities.
Estimated value of this engagement was
$28.4m703open-to-the-public events, short courses,concerts and seminars
programmes in the Nelson/Marlborough/Tasman district. Visitor numbers were lower due to the Westpac Trust Aquarium being closed to the public after failing to meet seismic evaluation criteria, with the centre’s focus moving increasingly to outreach activities such as the Marine Metre Squared. This citizen science project, designed to involve local communities in long-term monitoring of New Zealand’s coastal environment, was launched in March with support from the Ministry for the Environment Community Environment Fund. More than 450 people registered their interest on the website www.mm2.net.nz
Confucius Institute activities (jointly with the University of Auckland and Fudan University) included Introduction to Business Mandarin classes and a visiting lecturer series. The Mandarin classes, widely promoted by the International Office and Tourism Dunedin, were very well received by local business people. The classes were fully subscribed and there is an extensive waiting list for the 2014 classes. The visiting lecturer project, entitled “Chinese Soft Power and Culture: between complicity and independence”, showcased six visiting lecturers and was also very well received.
Otago’s activities under the umbrella of the Matariki Network of Universities (MNU) continued to flourish with an increasing number of staff and students from across the University engaging in MNU-related initiatives. The Matariki libraries benchmarking project facilitated the enhancement of library services and the sharing of assessment practices across the network. Otago also participated in the Matariki Undergraduate Research Network, a joint initiative with the University of Western Australia and Durham University funding 22 students whose extra-curricular projects focused on internationalisation. Matariki Travel Awards continue to enable research collaboration-related visits to MNU partners.
Engagement with alumni, both in New Zealand and internationally, is highly valued by the University of Otago, maintaining contact with more than 95,000 alumni via electronic and print communications, including the University of Otago Magazine, published in February, June and October. The Office of Development and Alumni Relations organised 16 alumni social events at venues in New Zealand and around the world – in Singapore, Sydney, Brisbane, Melbourne, Hamilton, Tauranga, Napier, Wellington, Wanaka, Queenstown, London, Edmonton, Toronto, San Francisco, Dallas and Philadelphia.
The office also assisted with events hosted by Otago’s regional networks in the US and Indonesia, and with celebrations organised by residential colleges, and provided support for reunions organised by class groups. Alumni gathered on campus for a number of significant celebrations including the Arana College 70th reunion, School of Physiotherapy centenary, 50th anniversary reunion for the Schools of Pharmacy and Surveying, and the University of Otago, Christchurch’s 40th anniversary.
Eighteen Alumni Scholarships were awarded through the Annual Appeal, including two scholarships for students with disabilities and two funded by the Alumni of the University of Otago in America, Inc. Otago’s alumni networks abroad continued to provide invaluable support to the University, and initiatives set up by US, Canadian and Malaysian alumni in recent years have resulted in funding for new prizes, scholarships and research activities. The University’s connection with its alumni community continued to be enhanced by Your Otago Link, the secure website that enables alumni to communicate directly with the University and each other. The first issue of an eNewsletter for alumni and friends was sent out in December 2013.
Three initiatives were supported by the 11th Annual Appeal to alumni: undergraduate scholarships, a Chair in Earthquake Science, and an MRI scanner to support Otago’s neuroscience and biomedical research.
un
ive
rs
ity
of
ota
go
an
nu
al
re
po
rt
20
1340
Building andsustainingcapability
To achieve its long-term goals the University must evolve to meet the challenges of a changing world, secure adequate resources and use these efficiently and effectively.
41
The University continues to maintain sufficient resources to fund operations through prudent financial management. There was a record surplus for the year ended 31 December 2013, largely driven by three one-off factors: agreement with the University’s insurers for the costs of repairing the earthquake damage to the University of Otago, Christchurch building; an increase of the market value of the University’s shareholding in biotechnology company Pacific Edge Limited; and an unexpected reduction in the estimated costs of future liabilities for staff retirement gratuities, sick and long-service leave.
However, the current funding environment continues to be a challenge and the University will need to monitor and modify operating parameters in the future to ensure that any impact on financial performance and financial position is controlled.
A major factor in coming years will be the building phase of the University’s Priority Development Plan as it builds and upgrades a number of key facilities across all campuses, such as the expansion and renovation of the Dental School. This will put a strain on cash resources and will require careful management to ensure financial sustainability can be maintained while still achieving the desired outcomes. (For more information, see the Financial Review page 61.)
Entrepreneurial activities and the successful commercialisation of intellectual property help diversify the funding base and provide additional avenues for investment. Otago Innovation Ltd, the University’s commercialisation company, provides business partners, industry and investors with information about current University of Otago projects, their practical applications, their patent status and market potential. There were a number of successes during 2013 (see also page 59).
Otago Innovation received the BNZ Commercial Deal Award at the inaugural KiwiNet Research Commercialisation Awards for its commercialisation of the National Poisons Centre’s database, TOXINZ. The database contains more than 190,000 documents with comprehensive up-to-date information about poisonous chemicals, pharmaceuticals, plants and animals. Subscriptions to TOXINZ are currently being sold internationally to poison centres, hospitals, state governments and health boards.
Start-up company Photonic Innovations Limited successfully raised capital from Angel investors. The management team was expanded and the company is now developing its first gas sensor device for industry, developed from research out of the Jack Dodd Centre for Quantum Technology and the Department of Physics.
Three new smart-phone apps were successfully promoted: Bonedoc, the brainchild of Dr Phil Blyth (Faculty of Medicine), allows users to step into a “virtual” operating theatre and repair a hip fracture; Flora Finder enables the identification of native trees and shrubs, and provides access to botanical experts; and HelpMePublish aims to help researchers publish their research, providing databases on 13 major subject areas containing information on more than 6,000 reputable
academic journals provided by journal editors, subject experts and academic users.
The annual $50,000 Otago Innovation Proof of Concept grant – established to encourage researchers to think about the commercial applications of their work – was awarded to Associate Professor Chris Pemberton (Medicine, Christchurch) to further develop his world-first test for diagnosing those at imminent risk of heart attack. Otago Innovation also secured $2.4 million (plus gst) over three years from the Ministry of Business, Innovation and Employment for pre-seed funding which will be used to further advance a number of drug development, ICT and diagnostic biomarker projects. Novel diagnostic tests developed by Otago researchers available for commercialisation include those for acute coronary syndrome, unstable angina and ovarian function.
The intellectual capital of staff well engaged in their own academic and professional callings is one of Otago’s greatest resources. In 2013, academic heads of department, directors of centres/programmes, associate deans and other nominated staff participated in a range of Academic Leadership Development Programme activities offered in Dunedin, Christchurch and Wellington. These included individualised induction programmes, networking opportunities, leadership coaching and workshops covering topics such as Otago processes and policies, strategic management, financial and employment decision-making, and effective communication.
The Human Resources Professional Development Programme offered 127 workshops for 1,563 participants. The established commitment to women’s professional development continued, an increase in demand for customised training was ongoing (34 workshops for 513 participants), two cohorts took part in the 10-session Supervisory Skills Programme and a three-day Essential Management series, introduced in 2013, has now become embedded into the Professional Development Programme.
Participation in the Treaty of Waitangi and te reo language courses also increased, possibly in response to the Ngä Taonga Tuku Iho/ Language and Culture competency introduced into the general staff Performance Development Review (PDR) process. In 2013, eight workshops were conducted with a total of 150 participants.
The HR Professional Development programme continues to be reviewed and updated, with the expectation that over the next three years the wholly face-to-face workshop component will continue to decrease, and there will be an increase in blended learning and online development modules, making it easier for staff to access development material at flexible times, regardless of campus location.
A three-year UniForum benchmarking project began in 2012. A survey of general staff functions – which is conducted annually – will benchmark support services against 18 other universities in New Zealand and Australia.
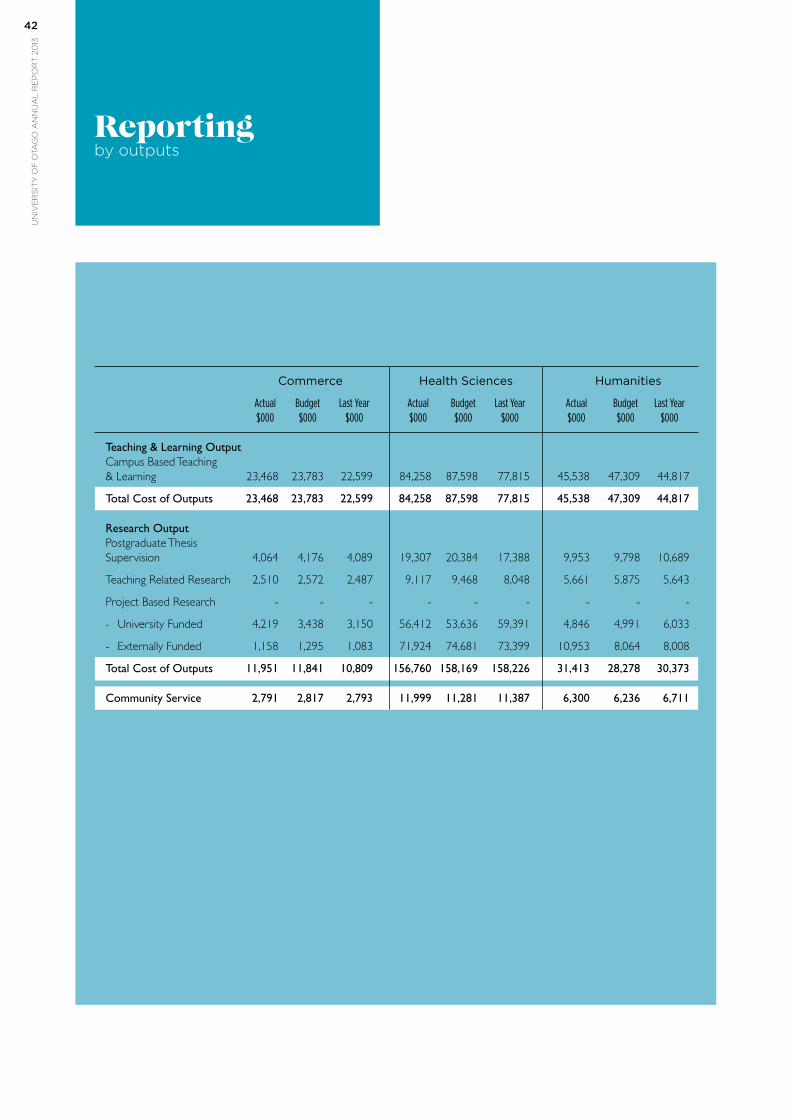
un
ive
rs
ity
of
ota
go
an
nu
al
re
po
rt
20
1342
Reportingby outputs
Commerce Health Sciences Humanities Sciences Service Divisions Total
Actual Budget Last Year Actual Budget Last Year Actual Budget Last Year Actual Budget Last Year Actual Budget Last Year Actual Budget Last Year $000 $000 $000 $000 $000 $000 $000 $000 $000 $000 $000 $000 $000 $000 $000 $000 $000 $000
Teaching & Learning Output Campus Based Teaching & Learning 23,468 23,783 22,599 84,258 87,598 77,815 45,538 47,309 44,817 43,554 44,685 40,153 3,133 3,498 3,267 199,951 206,872 188,651
Total Cost of Outputs 23,468 23,783 22,599 84,258 87,598 77,815 45,538 47,309 44,817 43,554 44,685 40,153 3,133 3,498 3,267 199,951 206,872 188,651
Research OutputPostgraduate Thesis Supervision 4,064 4,176 4,089 19,307 20,384 17,388 9,953 9,798 10,689 12,185 12,418 12,058 18,140 18,449 19,126 63,650 65,225 63,349
Teaching Related Research 2,510 2,572 2,487 9,117 9,468 8,048 5,661 5,875 5,643 5,377 5,573 5,999 - - - 22,665 23,488 22,178
Project Based Research - - - - - - - - - - - - - - - - - -
- University Funded 4,219 3,438 3,150 56,412 53,636 59,391 4,846 4,991 6,033 16,108 15,975 17,580 170 95 102 81,756 77,954 86,255
- Externally Funded 1,158 1,295 1,083 71,924 74,681 73,399 10,953 8,064 8,008 17,130 16,805 17,653 - - - 101,164 100,854 100,143
Total Cost of Outputs 11,951 11,841 10,809 156,760 158,169 158,226 31,413 28,278 30,373 50,800 50,591 53,290 18,310 18,544 19,228 269,235 267,512 271,925
Community Service 2,791 2,817 2,793 11,999 11,281 11,387 6,300 6,236 6,711 7,288 7,171 7,107 - - - 28,378 27,505 27,998
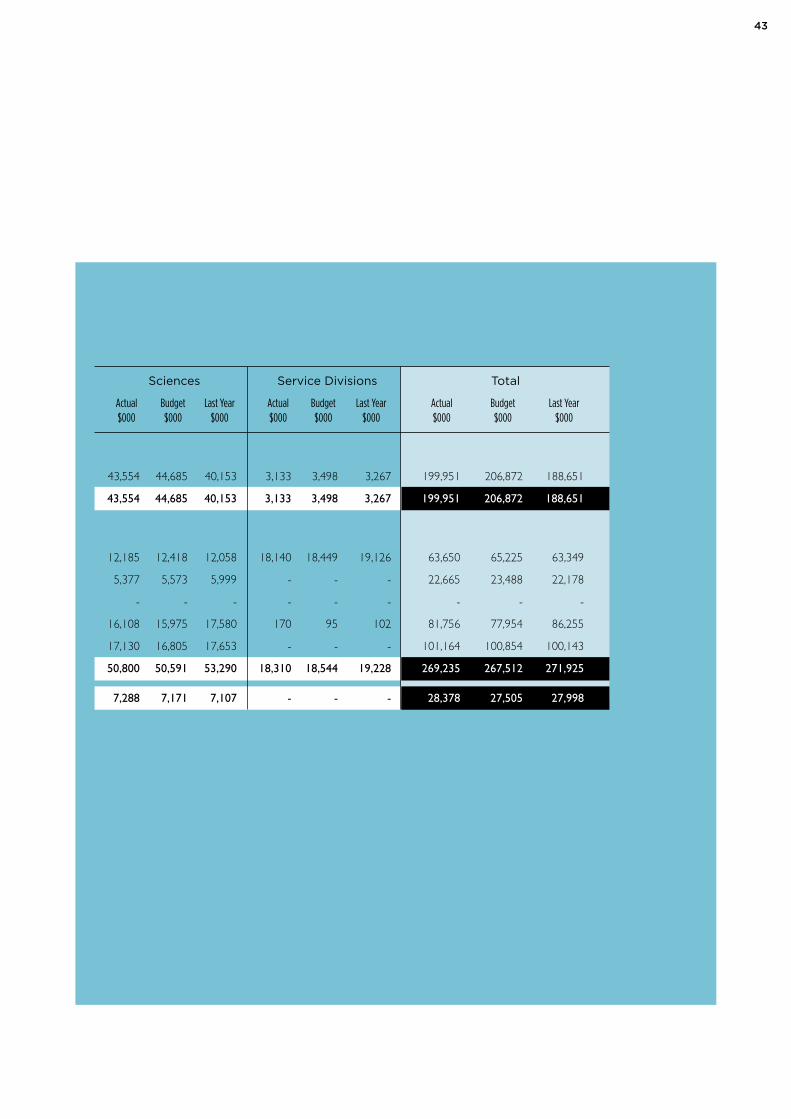
43
Commerce Health Sciences Humanities Sciences Service Divisions Total
Actual Budget Last Year Actual Budget Last Year Actual Budget Last Year Actual Budget Last Year Actual Budget Last Year Actual Budget Last Year $000 $000 $000 $000 $000 $000 $000 $000 $000 $000 $000 $000 $000 $000 $000 $000 $000 $000
Teaching & Learning Output Campus Based Teaching & Learning 23,468 23,783 22,599 84,258 87,598 77,815 45,538 47,309 44,817 43,554 44,685 40,153 3,133 3,498 3,267 199,951 206,872 188,651
Total Cost of Outputs 23,468 23,783 22,599 84,258 87,598 77,815 45,538 47,309 44,817 43,554 44,685 40,153 3,133 3,498 3,267 199,951 206,872 188,651
Research OutputPostgraduate Thesis Supervision 4,064 4,176 4,089 19,307 20,384 17,388 9,953 9,798 10,689 12,185 12,418 12,058 18,140 18,449 19,126 63,650 65,225 63,349
Teaching Related Research 2,510 2,572 2,487 9,117 9,468 8,048 5,661 5,875 5,643 5,377 5,573 5,999 - - - 22,665 23,488 22,178
Project Based Research - - - - - - - - - - - - - - - - - -
- University Funded 4,219 3,438 3,150 56,412 53,636 59,391 4,846 4,991 6,033 16,108 15,975 17,580 170 95 102 81,756 77,954 86,255
- Externally Funded 1,158 1,295 1,083 71,924 74,681 73,399 10,953 8,064 8,008 17,130 16,805 17,653 - - - 101,164 100,854 100,143
Total Cost of Outputs 11,951 11,841 10,809 156,760 158,169 158,226 31,413 28,278 30,373 50,800 50,591 53,290 18,310 18,544 19,228 269,235 267,512 271,925
Community Service 2,791 2,817 2,793 11,999 11,281 11,387 6,300 6,236 6,711 7,288 7,171 7,107 - - - 28,378 27,505 27,998
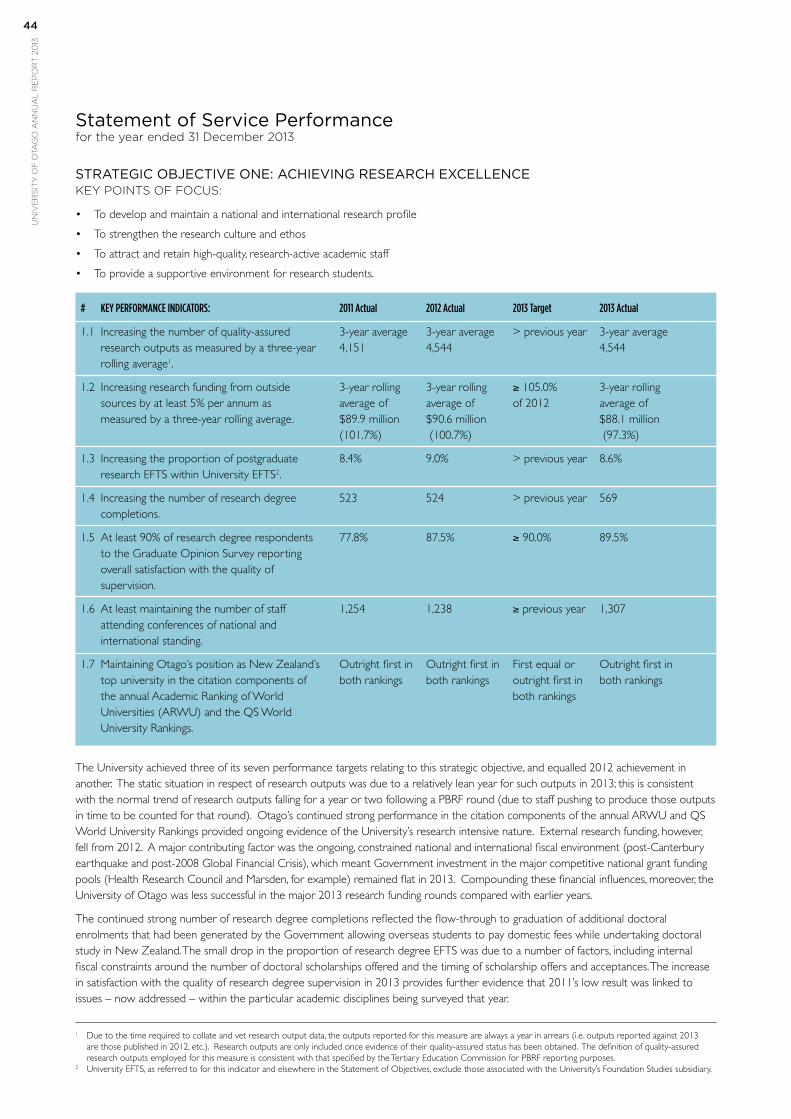
un
ive
rs
ity
of
ota
go
an
nu
al
re
po
rt
20
1344
STRATEGIC OBJECTIVE ONE: ACHIEVING RESEARCH EXCELLENCEKEY POINTS OF FOCUS:
• To develop and maintain a national and international research profile
• To strengthen the research culture and ethos
• To attract and retain high-quality, research-active academic staff
• To provide a supportive environment for research students.
# KEY PERFORMANCE INDICATORS: 2011 Actual 2012 Actual 2013 Target 2013 Actual
1.1 Increasing the number of quality-assured 3-year average 3-year average > previous year 3-year average research outputs as measured by a three-year 4,151 4,544 4,544 rolling average1.
1.2 Increasing research funding from outside 3-year rolling 3-year rolling ≥ 105.0% 3-year rolling sources by at least 5% per annum as average of average of of 2012 average of measured by a three-year rolling average. $89.9 million $90.6 million $88.1 million (101.7%) (100.7%) (97.3%)
1.3 Increasing the proportion of postgraduate 8.4% 9.0% > previous year 8.6% research EFTS within University EFTS2.
1.4 Increasing the number of research degree 523 524 > previous year 569 completions.
1.5 At least 90% of research degree respondents 77.8% 87.5% ≥ 90.0% 89.5% to the Graduate Opinion Survey reporting overall satisfaction with the quality of supervision.
1.6 At least maintaining the number of staff 1,254 1,238 ≥ previous year 1,307 attending conferences of national and international standing.
1.7 Maintaining Otago’s position as New Zealand’s Outright first in Outright first in First equal or Outright first in top university in the citation components of both rankings both rankings outright first in both rankings the annual Academic Ranking of World both rankings Universities (ARWU) and the QS World University Rankings.
The University achieved three of its seven performance targets relating to this strategic objective, and equalled 2012 achievement in another. The static situation in respect of research outputs was due to a relatively lean year for such outputs in 2013; this is consistent with the normal trend of research outputs falling for a year or two following a PBRF round (due to staff pushing to produce those outputs in time to be counted for that round). Otago’s continued strong performance in the citation components of the annual ARWU and QS World University Rankings provided ongoing evidence of the University’s research intensive nature. External research funding, however, fell from 2012. A major contributing factor was the ongoing, constrained national and international fiscal environment (post-Canterbury earthquake and post-2008 Global Financial Crisis), which meant Government investment in the major competitive national grant funding pools (Health Research Council and Marsden, for example) remained flat in 2013. Compounding these financial influences, moreover, the University of Otago was less successful in the major 2013 research funding rounds compared with earlier years.
The continued strong number of research degree completions reflected the flow-through to graduation of additional doctoral enrolments that had been generated by the Government allowing overseas students to pay domestic fees while undertaking doctoral study in New Zealand. The small drop in the proportion of research degree EFTS was due to a number of factors, including internal fiscal constraints around the number of doctoral scholarships offered and the timing of scholarship offers and acceptances. The increase in satisfaction with the quality of research degree supervision in 2013 provides further evidence that 2011’s low result was linked to issues – now addressed – within the particular academic disciplines being surveyed that year.
Statement of Service Performance for the year ended 31 December 2013
1 Due to the time required to collate and vet research output data, the outputs reported for this measure are always a year in arrears (i.e. outputs reported against 2013 are those published in 2012, etc.). Research outputs are only included once evidence of their quality-assured status has been obtained. The definition of quality-assured research outputs employed for this measure is consistent with that specified by the Tertiary Education Commission for PBRF reporting purposes.
2 University EFTS, as referred to for this indicator and elsewhere in the Statement of Objectives, exclude those associated with the University’s Foundation Studies subsidiary.
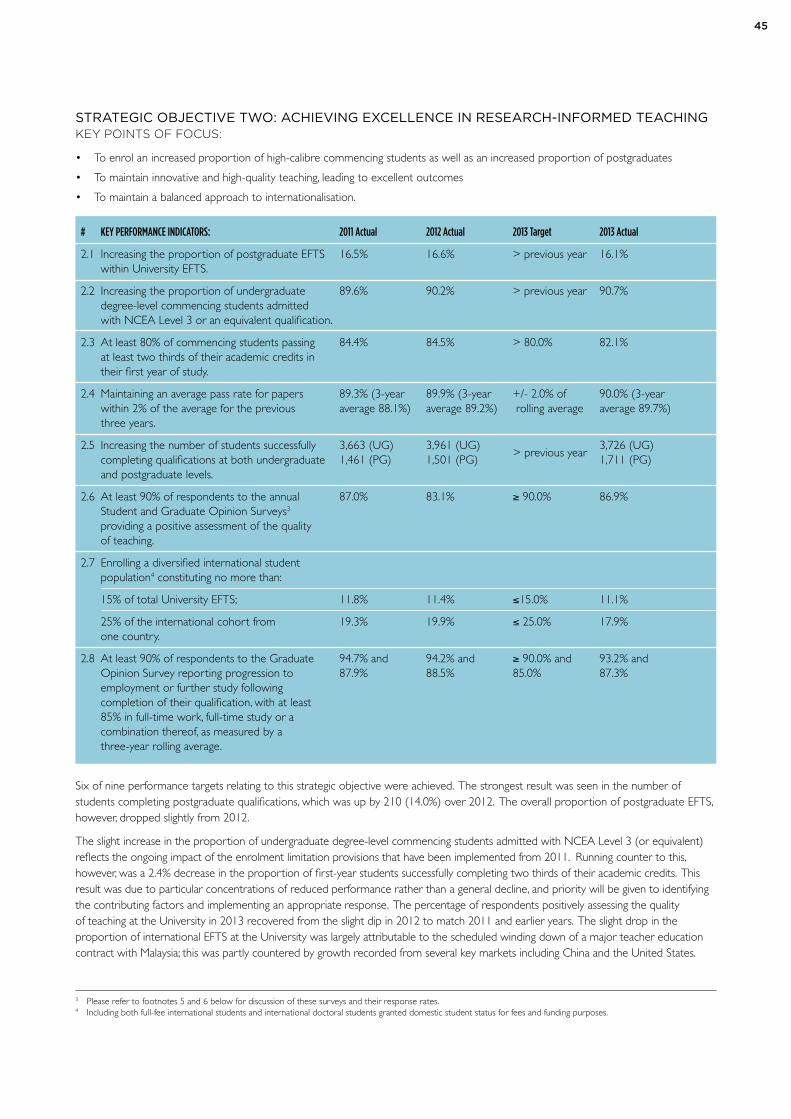
45
STRATEGIC OBJECTIVE TWO: ACHIEVING EXCELLENCE IN RESEARCH-INFORMED TEACHINGKEY POINTS OF FOCUS:
• To enrol an increased proportion of high-calibre commencing students as well as an increased proportion of postgraduates
• To maintain innovative and high-quality teaching, leading to excellent outcomes
• To maintain a balanced approach to internationalisation.
# KEY PERFORMANCE INDICATORS: 2011 Actual 2012 Actual 2013 Target 2013 Actual
2.1 Increasing the proportion of postgraduate EFTS 16.5% 16.6% > previous year 16.1% within University EFTS.
2.2 Increasing the proportion of undergraduate 89.6% 90.2% > previous year 90.7% degree-level commencing students admitted with NCEA Level 3 or an equivalent qualification.
2.3 At least 80% of commencing students passing 84.4% 84.5% > 80.0% 82.1% at least two thirds of their academic credits in their first year of study.
2.4 Maintaining an average pass rate for papers 89.3% (3-year 89.9% (3-year +/- 2.0% of 90.0% (3-year within 2% of the average for the previous average 88.1%) average 89.2%) rolling average average 89.7%) three years.
2.5 Increasing the number of students successfully 3,663 (UG) 3,961 (UG) 3,726 (UG) completing qualifications at both undergraduate 1,461 (PG) 1,501 (PG) 1,711 (PG) and postgraduate levels.
2.6 At least 90% of respondents to the annual 87.0% 83.1% ≥ 90.0% 86.9% Student and Graduate Opinion Surveys3 providing a positive assessment of the quality of teaching.
2.7 Enrolling a diversified international student population4 constituting no more than:
15% of total University EFTS; 11.8% 11.4% ≤15.0% 11.1%
25% of the international cohort from 19.3% 19.9% ≤ 25.0% 17.9% one country.
2.8 At least 90% of respondents to the Graduate 94.7% and 94.2% and ≥ 90.0% and 93.2% and Opinion Survey reporting progression to 87.9% 88.5% 85.0% 87.3% employment or further study following completion of their qualification, with at least 85% in full-time work, full-time study or a combination thereof, as measured by a three-year rolling average.
Six of nine performance targets relating to this strategic objective were achieved. The strongest result was seen in the number of students completing postgraduate qualifications, which was up by 210 (14.0%) over 2012. The overall proportion of postgraduate EFTS, however, dropped slightly from 2012.
The slight increase in the proportion of undergraduate degree-level commencing students admitted with NCEA Level 3 (or equivalent) reflects the ongoing impact of the enrolment limitation provisions that have been implemented from 2011. Running counter to this, however, was a 2.4% decrease in the proportion of first-year students successfully completing two thirds of their academic credits. This result was due to particular concentrations of reduced performance rather than a general decline, and priority will be given to identifying the contributing factors and implementing an appropriate response. The percentage of respondents positively assessing the quality of teaching at the University in 2013 recovered from the slight dip in 2012 to match 2011 and earlier years. The slight drop in the proportion of international EFTS at the University was largely attributable to the scheduled winding down of a major teacher education contract with Malaysia; this was partly countered by growth recorded from several key markets including China and the United States.
3 Please refer to footnotes 5 and 6 below for discussion of these surveys and their response rates. 4 Including both full-fee international students and international doctoral students granted domestic student status for fees and funding purposes.
> previous year
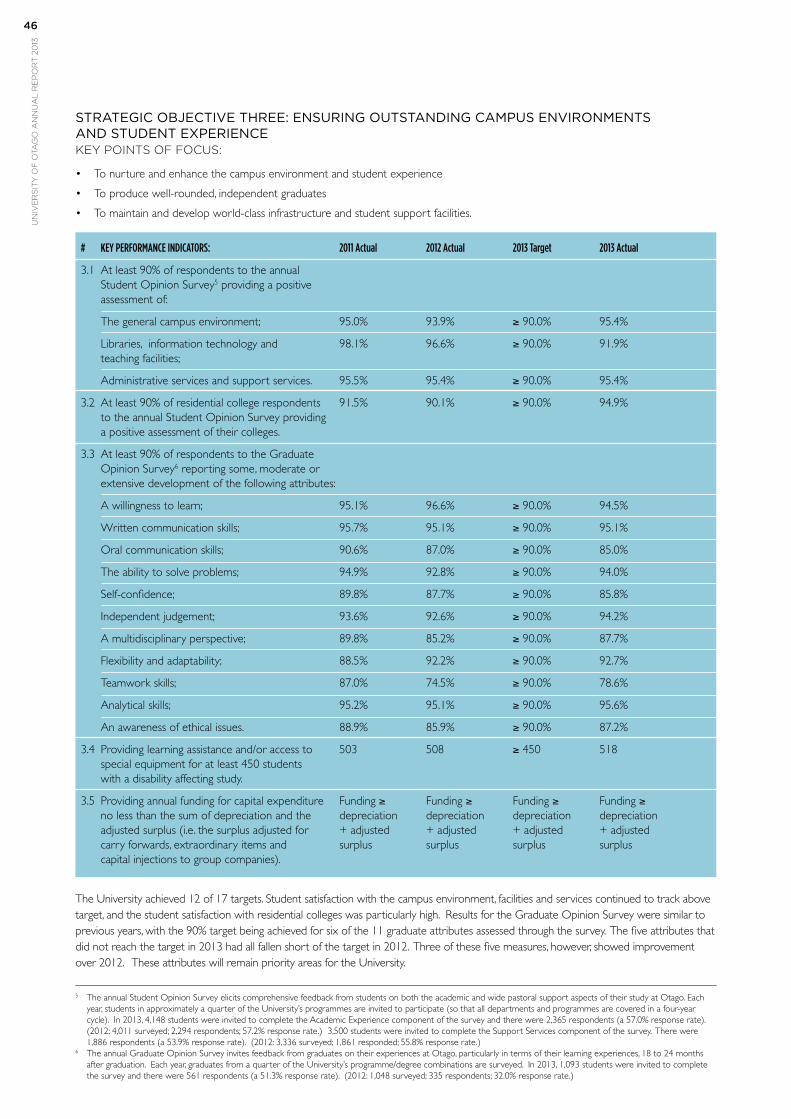
un
ive
rs
ity
of
ota
go
an
nu
al
re
po
rt
20
1346
STRATEGIC OBJECTIVE THREE: ENSURING OUTSTANDING CAMPUS ENVIRONMENTS AND STUDENT EXPERIENCEKEY POINTS OF FOCUS:
• To nurture and enhance the campus environment and student experience
• To produce well-rounded, independent graduates
• To maintain and develop world-class infrastructure and student support facilities.
# KEY PERFORMANCE INDICATORS: 2011 Actual 2012 Actual 2013 Target 2013 Actual
3.1 At least 90% of respondents to the annual Student Opinion Survey5 providing a positive assessment of:
The general campus environment; 95.0% 93.9% ≥ 90.0% 95.4%
Libraries, information technology and 98.1% 96.6% ≥ 90.0% 91.9% teaching facilities;
Administrative services and support services. 95.5% 95.4% ≥ 90.0% 95.4%
3.2 At least 90% of residential college respondents 91.5% 90.1% ≥ 90.0% 94.9% to the annual Student Opinion Survey providing a positive assessment of their colleges.
3.3 At least 90% of respondents to the Graduate Opinion Survey6 reporting some, moderate or extensive development of the following attributes:
A willingness to learn; 95.1% 96.6% ≥ 90.0% 94.5%
Written communication skills; 95.7% 95.1% ≥ 90.0% 95.1%
Oral communication skills; 90.6% 87.0% ≥ 90.0% 85.0%
The ability to solve problems; 94.9% 92.8% ≥ 90.0% 94.0%
Self-confidence; 89.8% 87.7% ≥ 90.0% 85.8%
Independent judgement; 93.6% 92.6% ≥ 90.0% 94.2%
A multidisciplinary perspective; 89.8% 85.2% ≥ 90.0% 87.7%
Flexibility and adaptability; 88.5% 92.2% ≥ 90.0% 92.7%
Teamwork skills; 87.0% 74.5% ≥ 90.0% 78.6%
Analytical skills; 95.2% 95.1% ≥ 90.0% 95.6%
An awareness of ethical issues. 88.9% 85.9% ≥ 90.0% 87.2%
3.4 Providing learning assistance and/or access to 503 508 ≥ 450 518 special equipment for at least 450 students with a disability affecting study.
3.5 Providing annual funding for capital expenditure Funding ≥ Funding ≥ Funding ≥ Funding ≥ no less than the sum of depreciation and the depreciation depreciation depreciation depreciation adjusted surplus (i.e. the surplus adjusted for + adjusted + adjusted + adjusted + adjusted carry forwards, extraordinary items and surplus surplus surplus surplus capital injections to group companies).
The University achieved 12 of 17 targets. Student satisfaction with the campus environment, facilities and services continued to track above target, and the student satisfaction with residential colleges was particularly high. Results for the Graduate Opinion Survey were similar to previous years, with the 90% target being achieved for six of the 11 graduate attributes assessed through the survey. The five attributes that did not reach the target in 2013 had all fallen short of the target in 2012. Three of these five measures, however, showed improvement over 2012. These attributes will remain priority areas for the University.
5 The annual Student Opinion Survey elicits comprehensive feedback from students on both the academic and wide pastoral support aspects of their study at Otago. Each year, students in approximately a quarter of the University’s programmes are invited to participate (so that all departments and programmes are covered in a four-year cycle). In 2013, 4,148 students were invited to complete the Academic Experience component of the survey and there were 2,365 respondents (a 57.0% response rate). (2012: 4,011 surveyed; 2,294 respondents; 57.2% response rate.) 3,500 students were invited to complete the Support Services component of the survey. There were 1,886 respondents (a 53.9% response rate). (2012: 3,336 surveyed; 1,861 responded; 55.8% response rate.)
6 The annual Graduate Opinion Survey invites feedback from graduates on their experiences at Otago, particularly in terms of their learning experiences, 18 to 24 months after graduation. Each year, graduates from a quarter of the University’s programme/degree combinations are surveyed. In 2013, 1,093 students were invited to complete the survey and there were 561 respondents (a 51.3% response rate). (2012: 1,048 surveyed; 335 respondents; 32.0% response rate.)
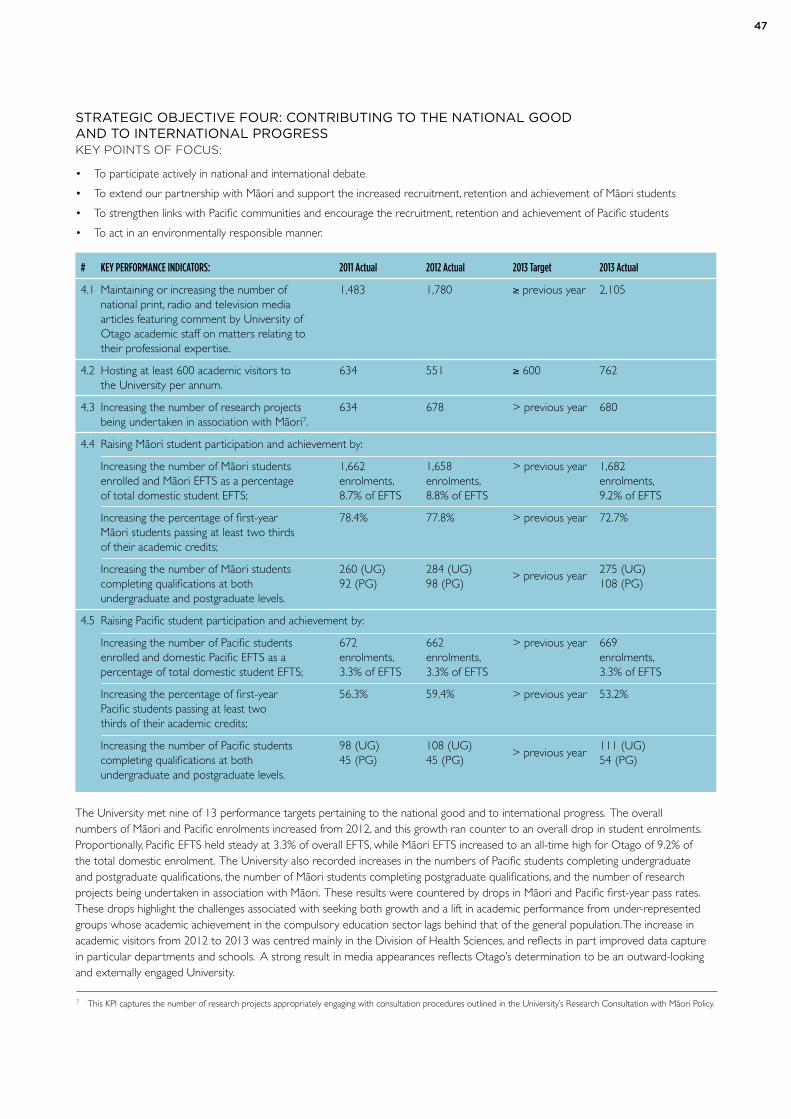
47
STRATEGIC OBJECTIVE FOUR: CONTRIBUTING TO THE NATIONAL GOOD AND TO INTERNATIONAL PROGRESS KEY POINTS OF FOCUS:
• To participate actively in national and international debate
• To extend our partnership with Mäori and support the increased recruitment, retention and achievement of Mäori students
• To strengthen links with Pacific communities and encourage the recruitment, retention and achievement of Pacific students
• To act in an environmentally responsible manner.
# KEY PERFORMANCE INDICATORS: 2011 Actual 2012 Actual 2013 Target 2013 Actual
4.1 Maintaining or increasing the number of 1,483 1,780 ≥ previous year 2,105 national print, radio and television media articles featuring comment by University of Otago academic staff on matters relating to their professional expertise.
4.2 Hosting at least 600 academic visitors to 634 551 ≥ 600 762 the University per annum.
4.3 Increasing the number of research projects 634 678 > previous year 680 being undertaken in association with Mäori7.
4.4 Raising Mäori student participation and achievement by:
Increasing the number of Mäori students 1,662 1,658 > previous year 1,682 enrolled and Mäori EFTS as a percentage enrolments, enrolments, enrolments, of total domestic student EFTS; 8.7% of EFTS 8.8% of EFTS 9.2% of EFTS
Increasing the percentage of first-year 78.4% 77.8% > previous year 72.7% Mäori students passing at least two thirds of their academic credits;
Increasing the number of Mäori students 260 (UG) 284 (UG) 275 (UG) completing qualifications at both 92 (PG) 98 (PG) 108 (PG) undergraduate and postgraduate levels.
4.5 Raising Pacific student participation and achievement by:
Increasing the number of Pacific students 672 662 > previous year 669 enrolled and domestic Pacific EFTS as a enrolments, enrolments, enrolments, percentage of total domestic student EFTS; 3.3% of EFTS 3.3% of EFTS 3.3% of EFTS
Increasing the percentage of first-year 56.3% 59.4% > previous year 53.2% Pacific students passing at least two thirds of their academic credits;
Increasing the number of Pacific students 98 (UG) 108 (UG) 111 (UG) completing qualifications at both 45 (PG) 45 (PG) 54 (PG) undergraduate and postgraduate levels.
The University met nine of 13 performance targets pertaining to the national good and to international progress. The overall numbers of Mäori and Pacific enrolments increased from 2012, and this growth ran counter to an overall drop in student enrolments. Proportionally, Pacific EFTS held steady at 3.3% of overall EFTS, while Mäori EFTS increased to an all-time high for Otago of 9.2% of the total domestic enrolment. The University also recorded increases in the numbers of Pacific students completing undergraduate and postgraduate qualifications, the number of Mäori students completing postgraduate qualifications, and the number of research projects being undertaken in association with Mäori. These results were countered by drops in Mäori and Pacific first-year pass rates. These drops highlight the challenges associated with seeking both growth and a lift in academic performance from under-represented groups whose academic achievement in the compulsory education sector lags behind that of the general population. The increase in academic visitors from 2012 to 2013 was centred mainly in the Division of Health Sciences, and reflects in part improved data capture in particular departments and schools. A strong result in media appearances reflects Otago’s determination to be an outward-looking and externally engaged University.
> previous year
> previous year
7 This KPI captures the number of research projects appropriately engaging with consultation procedures outlined in the University’s Research Consultation with Mäori Policy.
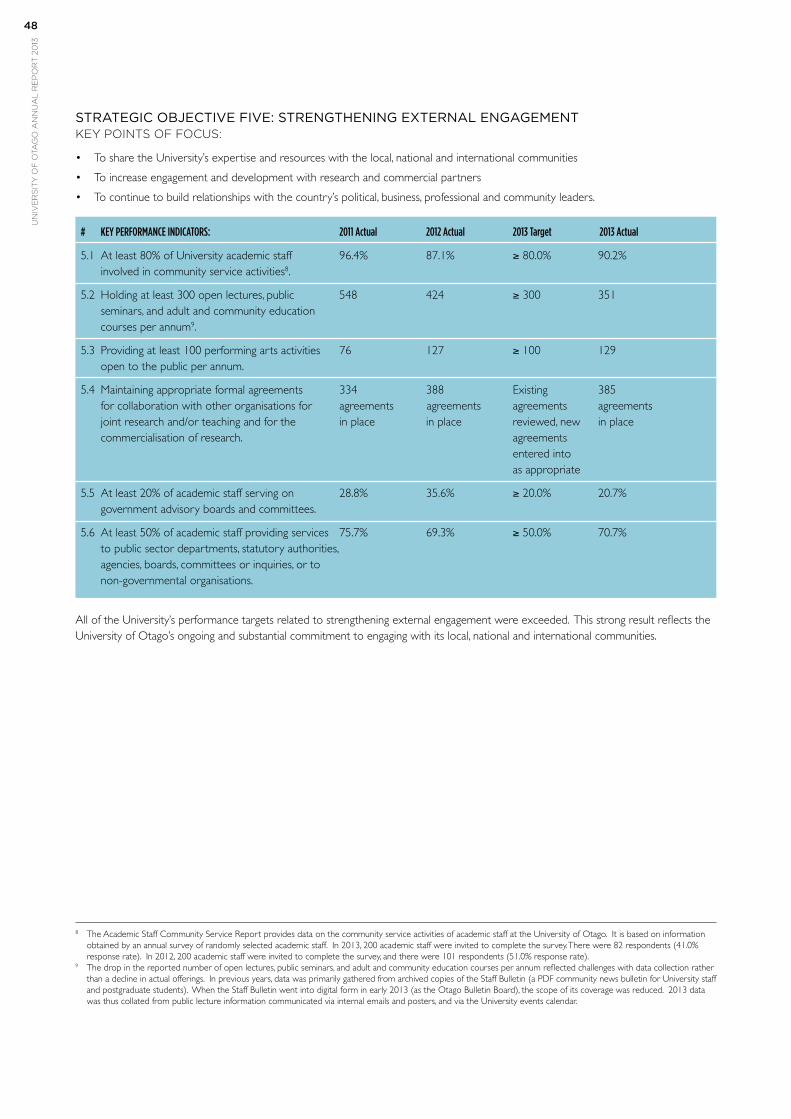
un
ive
rs
ity
of
ota
go
an
nu
al
re
po
rt
20
1348
STRATEGIC OBJECTIVE FIVE: STRENGTHENING EXTERNAL ENGAGEMENTKEY POINTS OF FOCUS:
• To share the University’s expertise and resources with the local, national and international communities
• To increase engagement and development with research and commercial partners
• To continue to build relationships with the country’s political, business, professional and community leaders.
# KEY PERFORMANCE INDICATORS: 2011 Actual 2012 Actual 2013 Target 2013 Actual
5.1 At least 80% of University academic staff 96.4% 87.1% ≥ 80.0% 90.2% involved in community service activities8.
5.2 Holding at least 300 open lectures, public 548 424 ≥ 300 351 seminars, and adult and community education courses per annum9.
5.3 Providing at least 100 performing arts activities 76 127 ≥ 100 129 open to the public per annum.
5.4 Maintaining appropriate formal agreements 334 388 Existing 385 for collaboration with other organisations for agreements agreements agreements agreements joint research and/or teaching and for the in place in place reviewed, new in place commercialisation of research. agreements entered into as appropriate
5.5 At least 20% of academic staff serving on 28.8% 35.6% ≥ 20.0% 20.7% government advisory boards and committees.
5.6 At least 50% of academic staff providing services 75.7% 69.3% ≥ 50.0% 70.7% to public sector departments, statutory authorities, agencies, boards, committees or inquiries, or to non-governmental organisations.
All of the University’s performance targets related to strengthening external engagement were exceeded. This strong result reflects the University of Otago’s ongoing and substantial commitment to engaging with its local, national and international communities.
8 The Academic Staff Community Service Report provides data on the community service activities of academic staff at the University of Otago. It is based on information obtained by an annual survey of randomly selected academic staff. In 2013, 200 academic staff were invited to complete the survey. There were 82 respondents (41.0% response rate). In 2012, 200 academic staff were invited to complete the survey, and there were 101 respondents (51.0% response rate).
9 The drop in the reported number of open lectures, public seminars, and adult and community education courses per annum reflected challenges with data collection rather than a decline in actual offerings. In previous years, data was primarily gathered from archived copies of the Staff Bulletin (a PDF community news bulletin for University staff and postgraduate students). When the Staff Bulletin went into digital form in early 2013 (as the Otago Bulletin Board), the scope of its coverage was reduced. 2013 data was thus collated from public lecture information communicated via internal emails and posters, and via the University events calendar.
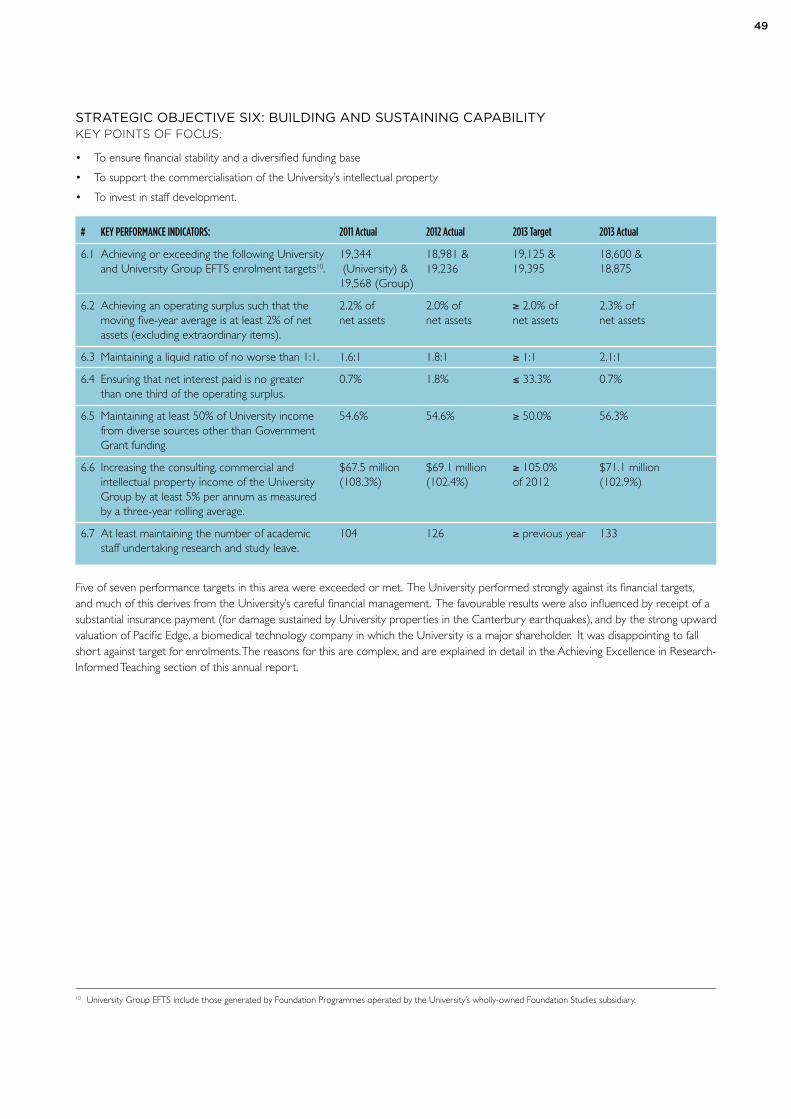
49
STRATEGIC OBJECTIVE SIX: BUILDING AND SUSTAINING CAPABILITYKEY POINTS OF FOCUS:
• To ensure financial stability and a diversified funding base
• To support the commercialisation of the University’s intellectual property
• To invest in staff development.
# KEY PERFORMANCE INDICATORS: 2011 Actual 2012 Actual 2013 Target 2013 Actual
6.1 Achieving or exceeding the following University 19,344 18,981 & 19,125 & 18,600 & and University Group EFTS enrolment targets10. (University) & 19,236 19,395 18,875 19,568 (Group)
6.2 Achieving an operating surplus such that the 2.2% of 2.0% of ≥ 2.0% of 2.3% of moving five-year average is at least 2% of net net assets net assets net assets net assets assets (excluding extraordinary items).
6.3 Maintaining a liquid ratio of no worse than 1:1. 1.6:1 1.8:1 ≥ 1:1 2.1:1
6.4 Ensuring that net interest paid is no greater 0.7% 1.8% ≤ 33.3% 0.7% than one third of the operating surplus.
6.5 Maintaining at least 50% of University income 54.6% 54.6% ≥ 50.0% 56.3% from diverse sources other than Government Grant funding.
6.6 Increasing the consulting, commercial and $67.5 million $69.1 million ≥ 105.0% $71.1 million intellectual property income of the University (108.3%) (102.4%) of 2012 (102.9%) Group by at least 5% per annum as measured by a three-year rolling average.
6.7 At least maintaining the number of academic 104 126 ≥ previous year 133 staff undertaking research and study leave.
Five of seven performance targets in this area were exceeded or met. The University performed strongly against its financial targets, and much of this derives from the University’s careful financial management. The favourable results were also influenced by receipt of a substantial insurance payment (for damage sustained by University properties in the Canterbury earthquakes), and by the strong upward valuation of Pacific Edge, a biomedical technology company in which the University is a major shareholder. It was disappointing to fall short against target for enrolments. The reasons for this are complex, and are explained in detail in the Achieving Excellence in Research-Informed Teaching section of this annual report.
10 University Group EFTS include those generated by Foundation Programmes operated by the University’s wholly-owned Foundation Studies subsidiary.
un
ive
rs
ity
of
ota
go
an
nu
al
re
po
rt
20
1350
51
Land, Buildings and Capital Development There was no significant change in the amount of land owned by, or held in Crown title for, the University. The University’s net assignable floor space increased by 6,425m² (2.9%) in 2013 to 229,929m2.
The Campus Master Plan, adopted in 2010, provides a strategic framework to guide the development of the University’s three campuses. Supporting the Campus Master Plan is a Priority Development Plan (PDP), which identifies high priority projects for development over a rolling six-to-eight-year period. Throughout 2013, work continued on several major projects identified in the current PDP as priorities for the period.
The Marsh Study Centre (a study and social centre), redeveloped on the site of the former Gardens Tavern, was opened early in 2013 and has been very well used by students. The centre was a winner in the education category of the 2013 Southern Architecture Awards. Work commenced mid year on the University’s new Childcare Centre, which occupies a site between Castle Street and Montgomery Avenue. The centre is scheduled to open in 2014.
The University’s Christchurch campus, which sustained serious damage in the 22 February 2011 earthquake, reopened at the start of 2013 following repair and strengthening work. The University’s wider programme of seismic assessment across all campuses continued throughout 2013, in pursuit of the target of strengthening all buildings to at least 67% of new building standard (NBS) and as close to 100% as possible. $50 million has been set aside for this work.
In 2013 the University purchased LivingSpace Dunedin at 192 Castle Street, and a decision was taken to convert the facility into a new residential college, named – with the blessing of his whanau – for notable Otago graduate Te Rangi Hïroa (Sir Peter Buck). Work commenced in October to convert the facility into Te Rangi Hïroa College, which will be a residential college for 128 students from the start of 2014.
Library Resources
The library system continued to evolve as an essential source of information and expertise for the University and the wider community, providing extensive collections, access services, instruction and infrastructure in support of scholarship, creativity and learning. Collaboration between academic and library staff continued to underpin the further development of both physical and online collections.
A particular highlight for 2013 was the implementation of the new generation library management system, Library Search/Ketu, which went live on 2 December.
Throughout the year, the library’s on-site collections increased by 17,435 items (0.6%) over 2012 to comprise a total of 3,138,821 items.
The University community had online access to an increasing component of the library’s collections. While the number of electronic serials decreased slightly to 215,047 (a 7.2% decline from 2012), the number of e-books reached 510,375 (up by 4.2% over 2012). 98.2% of all serials were received in electronic rather than print form in 2013. The number of seating places across the library system increased by 0.9% (40 seats) to reach 4,320.
University staff and students continued to make extensive use of the on-site collections with 341,177 items loaned during the year. Databases, e-journals, e-books and other electronic materials were heavily used both on campus and off campus.
The library maintained a programme of information skills sessions for students. These are designed to develop effective search techniques and competencies in evaluating quality sources of information.
Information about exhibitions mounted by the library can be found in the Contributing to the National Good and to International Progress section of this report (page 32-35).
Information Technology The volume of off-campus computer and telecommunications network traffic decreased from 315,847 gigabytes in 2012 to 315,164 gigabytes in 2013 (a decrease of 0.2%). The slight reduction reflects the ongoing influence of the Internet Traffic Management (ITM) System. The ITM system restricts access to certain categories of websites, and blocks certain traffic types such as “peer to peer”, which previously accounted for a significant amount of student internet traffic.
2,172,480 podcasts of recorded lectures were downloaded for the year, compared with 2,115,459 in 2012 (an increase of 57,021, or 2.7%). 1,348 seating places were provided in student computer laboratories in 2013 (2012; 1,361), and 44,751 enquiries were processed through the Information Technology Services (ITS) Service Desk, up 2.7% from 43,587 in 2012.
The University joined eduroam™ (education roaming), a service offered by the Research and Education Advanced Network New Zealand (REANNZ) which provides a secure, collaborative wireless network service to staff, students and visitors on campus and at thousands of locations worldwide. University of Otago staff and students can use their University of Otago username and password to access the internet and other University of Otago IT resources while visiting eduroam-participating institutions.
Significant steps were taken to upgrade and modernise the University network across the University’s campuses. This work will include the replacement of end-of-life infrastructure; increasing the speed of the University network (to cater for significant growth in demand); improvements to support, monitoring, security and resilience of the network infrastructure; extending wireless access to electronic
Statementof resources
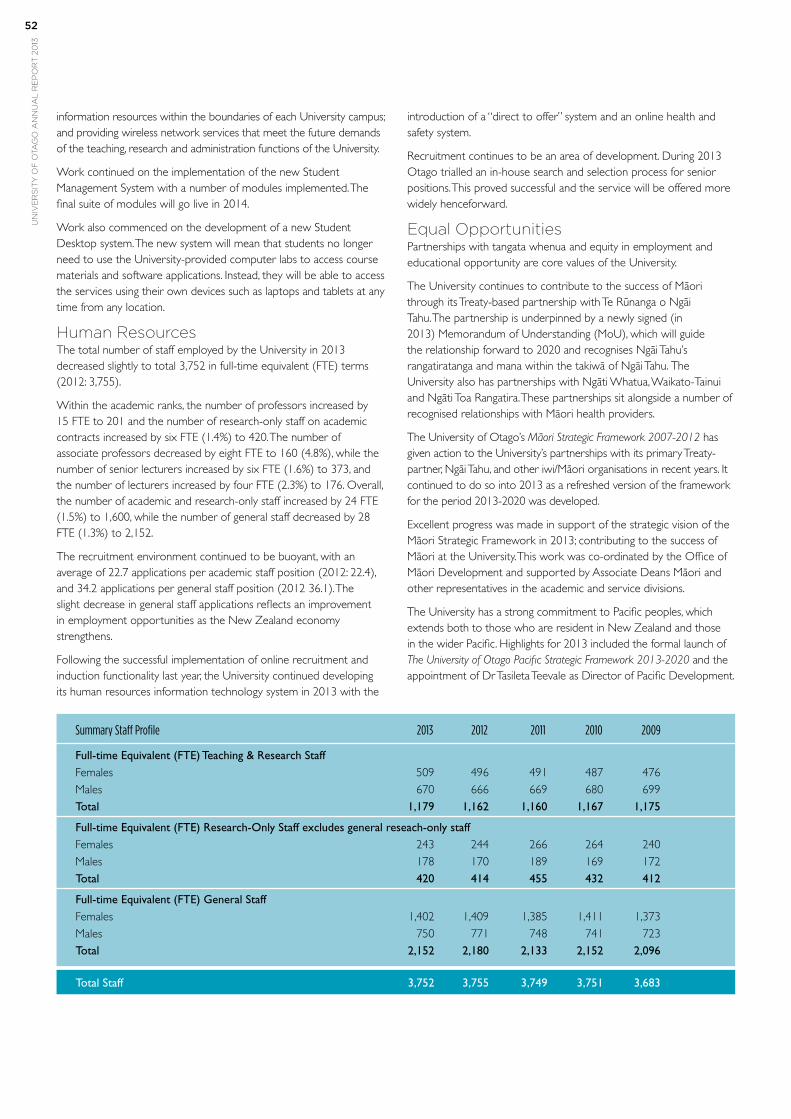
un
ive
rs
ity
of
ota
go
an
nu
al
re
po
rt
20
1352
information resources within the boundaries of each University campus; and providing wireless network services that meet the future demands of the teaching, research and administration functions of the University.
Work continued on the implementation of the new Student Management System with a number of modules implemented. The final suite of modules will go live in 2014.
Work also commenced on the development of a new Student Desktop system. The new system will mean that students no longer need to use the University-provided computer labs to access course materials and software applications. Instead, they will be able to access the services using their own devices such as laptops and tablets at any time from any location.
Human Resources The total number of staff employed by the University in 2013 decreased slightly to total 3,752 in full-time equivalent (FTE) terms (2012: 3,755).
Within the academic ranks, the number of professors increased by 15 FTE to 201 and the number of research-only staff on academic contracts increased by six FTE (1.4%) to 420. The number of associate professors decreased by eight FTE to 160 (4.8%), while the number of senior lecturers increased by six FTE (1.6%) to 373, and the number of lecturers increased by four FTE (2.3%) to 176. Overall, the number of academic and research-only staff increased by 24 FTE (1.5%) to 1,600, while the number of general staff decreased by 28 FTE (1.3%) to 2,152.
The recruitment environment continued to be buoyant, with an average of 22.7 applications per academic staff position (2012: 22.4), and 34.2 applications per general staff position (2012 36.1). The slight decrease in general staff applications reflects an improvement in employment opportunities as the New Zealand economy strengthens.
Following the successful implementation of online recruitment and induction functionality last year, the University continued developing its human resources information technology system in 2013 with the
introduction of a “direct to offer” system and an online health and safety system.
Recruitment continues to be an area of development. During 2013 Otago trialled an in-house search and selection process for senior positions. This proved successful and the service will be offered more widely henceforward.
Equal OpportunitiesPartnerships with tangata whenua and equity in employment and educational opportunity are core values of the University.
The University continues to contribute to the success of Mäori through its Treaty-based partnership with Te Rünanga o Ngäi Tahu. The partnership is underpinned by a newly signed (in 2013) Memorandum of Understanding (MoU), which will guide the relationship forward to 2020 and recognises Ngäi Tahu’s rangatiratanga and mana within the takiwä of Ngäi Tahu. The University also has partnerships with Ngäti Whatua, Waikato-Tainui and Ngäti Toa Rangatira. These partnerships sit alongside a number of recognised relationships with Mäori health providers.
The University of Otago’s Mäori Strategic Framework 2007-2012 has given action to the University’s partnerships with its primary Treaty-partner, Ngäi Tahu, and other iwi/Mäori organisations in recent years. It continued to do so into 2013 as a refreshed version of the framework for the period 2013-2020 was developed.
Excellent progress was made in support of the strategic vision of the Mäori Strategic Framework in 2013; contributing to the success of Mäori at the University. This work was co-ordinated by the Office of Mäori Development and supported by Associate Deans Mäori and other representatives in the academic and service divisions.
The University has a strong commitment to Pacific peoples, which extends both to those who are resident in New Zealand and those in the wider Pacific. Highlights for 2013 included the formal launch of The University of Otago Pacific Strategic Framework 2013-2020 and the appointment of Dr Tasileta Teevale as Director of Pacific Development.
Summary Staff Profile 2013 2012 2011 2010 2009
Full-time Equivalent (FTE) Teaching & Research Staff Females 509 496 491 487 476 Males 670 666 669 680 699 Total 1,179 1,162 1,160 1,167 1,175
Full-time Equivalent (FTE) Research-Only Staff excludes general reseach-only staffFemales 243 244 266 264 240 Males 178 170 189 169 172 Total 420 414 455 432 412
Full-time Equivalent (FTE) General Staff Females 1,402 1,409 1,385 1,411 1,373 Males 750 771 748 741 723 Total 2,152 2,180 2,133 2,152 2,096
Total Staff 3,752 3,755 3,749 3,751 3,683
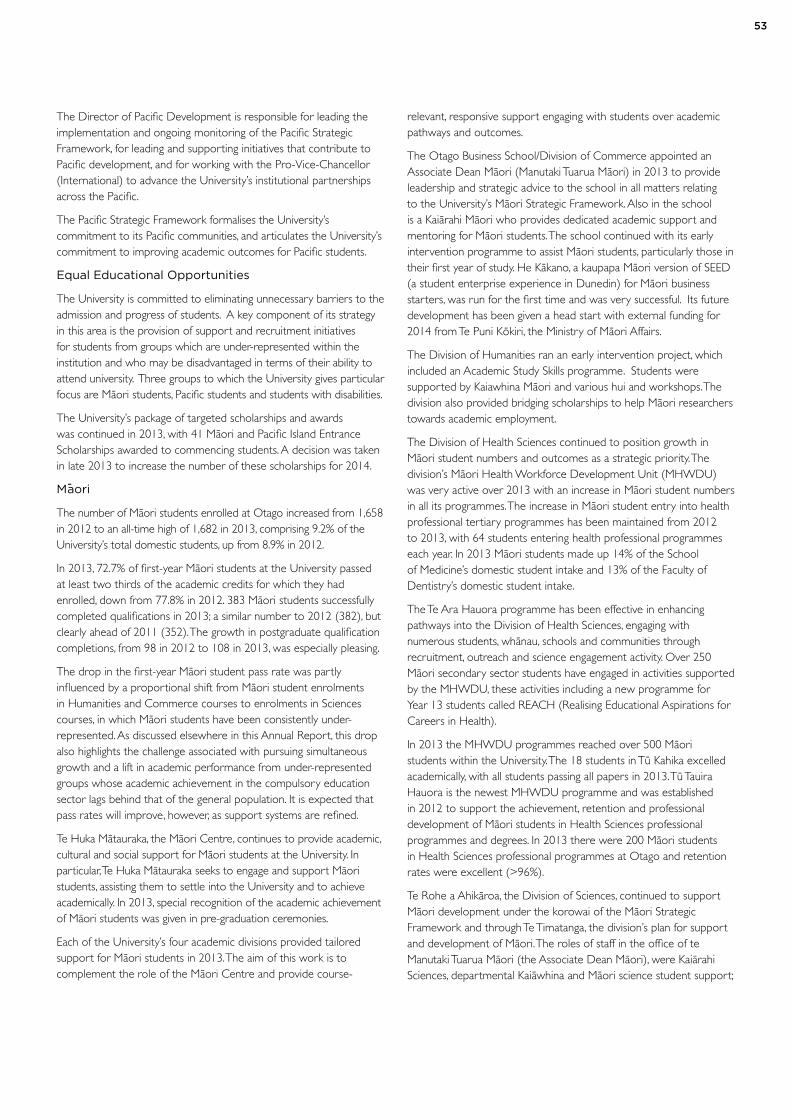
53
The Director of Pacific Development is responsible for leading the implementation and ongoing monitoring of the Pacific Strategic Framework, for leading and supporting initiatives that contribute to Pacific development, and for working with the Pro-Vice-Chancellor (International) to advance the University’s institutional partnerships across the Pacific.
The Pacific Strategic Framework formalises the University’s commitment to its Pacific communities, and articulates the University’s commitment to improving academic outcomes for Pacific students.
Equal Educational Opportunities
The University is committed to eliminating unnecessary barriers to the admission and progress of students. A key component of its strategy in this area is the provision of support and recruitment initiatives for students from groups which are under-represented within the institution and who may be disadvantaged in terms of their ability to attend university. Three groups to which the University gives particular focus are Mäori students, Pacific students and students with disabilities.
The University’s package of targeted scholarships and awards was continued in 2013, with 41 Mäori and Pacific Island Entrance Scholarships awarded to commencing students. A decision was taken in late 2013 to increase the number of these scholarships for 2014.
M-aori
The number of Mäori students enrolled at Otago increased from 1,658 in 2012 to an all-time high of 1,682 in 2013, comprising 9.2% of the University’s total domestic students, up from 8.9% in 2012.
In 2013, 72.7% of first-year Mäori students at the University passed at least two thirds of the academic credits for which they had enrolled, down from 77.8% in 2012. 383 Mäori students successfully completed qualifications in 2013; a similar number to 2012 (382), but clearly ahead of 2011 (352). The growth in postgraduate qualification completions, from 98 in 2012 to 108 in 2013, was especially pleasing.
The drop in the first-year Mäori student pass rate was partly influenced by a proportional shift from Mäori student enrolments in Humanities and Commerce courses to enrolments in Sciences courses, in which Mäori students have been consistently under-represented. As discussed elsewhere in this Annual Report, this drop also highlights the challenge associated with pursuing simultaneous growth and a lift in academic performance from under-represented groups whose academic achievement in the compulsory education sector lags behind that of the general population. It is expected that pass rates will improve, however, as support systems are refined.
Te Huka Mätauraka, the Mäori Centre, continues to provide academic, cultural and social support for Mäori students at the University. In particular, Te Huka Mätauraka seeks to engage and support Mäori students, assisting them to settle into the University and to achieve academically. In 2013, special recognition of the academic achievement of Mäori students was given in pre-graduation ceremonies.
Each of the University’s four academic divisions provided tailored support for Mäori students in 2013. The aim of this work is to complement the role of the Mäori Centre and provide course-
relevant, responsive support engaging with students over academic pathways and outcomes.
The Otago Business School/Division of Commerce appointed an Associate Dean Mäori (Manutaki Tuarua Mäori) in 2013 to provide leadership and strategic advice to the school in all matters relating to the University’s Mäori Strategic Framework. Also in the school is a Kaiärahi Mäori who provides dedicated academic support and mentoring for Mäori students. The school continued with its early intervention programme to assist Mäori students, particularly those in their first year of study. He Käkano, a kaupapa Mäori version of SEED (a student enterprise experience in Dunedin) for Mäori business starters, was run for the first time and was very successful. Its future development has been given a head start with external funding for 2014 from Te Puni Kökiri, the Ministry of Mäori Affairs.
The Division of Humanities ran an early intervention project, which included an Academic Study Skills programme. Students were supported by Kaiawhina Mäori and various hui and workshops. The division also provided bridging scholarships to help Mäori researchers towards academic employment.
The Division of Health Sciences continued to position growth in Mäori student numbers and outcomes as a strategic priority. The division’s Mäori Health Workforce Development Unit (MHWDU) was very active over 2013 with an increase in Mäori student numbers in all its programmes. The increase in Mäori student entry into health professional tertiary programmes has been maintained from 2012 to 2013, with 64 students entering health professional programmes each year. In 2013 Mäori students made up 14% of the School of Medicine’s domestic student intake and 13% of the Faculty of Dentistry’s domestic student intake.
The Te Ara Hauora programme has been effective in enhancing pathways into the Division of Health Sciences, engaging with numerous students, whänau, schools and communities through recruitment, outreach and science engagement activity. Over 250 Mäori secondary sector students have engaged in activities supported by the MHWDU, these activities including a new programme for Year 13 students called REACH (Realising Educational Aspirations for Careers in Health).
In 2013 the MHWDU programmes reached over 500 Mäori students within the University. The 18 students in Tü Kahika excelled academically, with all students passing all papers in 2013. Tü Tauira Hauora is the newest MHWDU programme and was established in 2012 to support the achievement, retention and professional development of Mäori students in Health Sciences professional programmes and degrees. In 2013 there were 200 Mäori students in Health Sciences professional programmes at Otago and retention rates were excellent (>96%).
Te Rohe a Ahikäroa, the Division of Sciences, continued to support Mäori development under the korowai of the Mäori Strategic Framework and through Te Timatanga, the division’s plan for support and development of Mäori. The roles of staff in the office of te Manutaki Tuarua Mäori (the Associate Dean Mäori), were Kaiärahi Sciences, departmental Kaiäwhina and Mäori science student support;
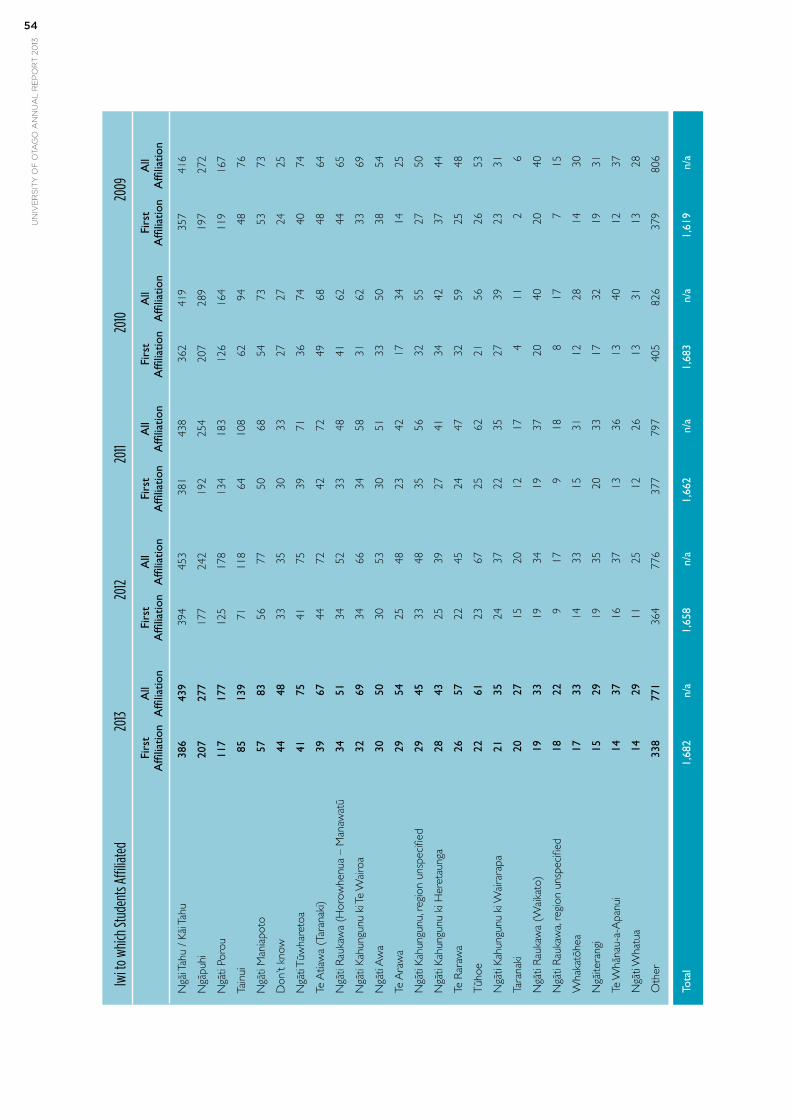
un
ive
rs
ity
of
ota
go
an
nu
al
re
po
rt
20
1354
Iwi to
whic
h Stu
dent
s Affi
liate
d 20
13 20
12 20
11 20
10
2009
Fi
rst
All
Firs
t A
ll
Firs
t A
ll Fi
rst
All
Firs
t A
ll
Affi
liatio
n A
ffilia
tion
Affi
liatio
n A
ffilia
tion
A
ffilia
tion
Affi
liatio
n A
ffilia
tion
Affi
liatio
n A
ffilia
tion
Affi
liatio
n
Ngä
i Tah
u / K
äi T
ahu
386
439
394
453
381
438
362
419
357
416
Ngä
puhi
20
7 27
7 17
7 24
2 19
2 25
4 20
7 28
9 19
7 27
2
Ngä
ti Po
rou
117
177
125
178
134
183
126
164
119
167
Tain
ui
85
139
71
118
64
108
62
94
48
76
Ngä
ti M
ania
poto
57
83
56
77
50
68
54
73
53
73
Don
’t kn
ow
44
48
33
35
30
33
27
27
24
25
Ngä
ti Tü
wha
reto
a 41
75
41
75
39
71
36
74
40
74
Te A
tiaw
a (T
aran
aki)
39
67
44
72
42
72
49
68
48
64
Ngä
ti Ra
ukaw
a (H
orow
henu
a –
Man
awat
ü 34
51
34
52
33
48
41
62
44
65
Ngä
ti Ka
hung
unu
ki T
e W
airo
a 32
69
34
66
34
58
31
62
33
69
Ngä
ti A
wa
30
50
30
53
30
51
33
50
38
54
Te A
raw
a 29
54
25
48
23
42
17
34
14
25
Ngä
ti Ka
hung
unu,
reg
ion
unsp
ecifi
ed
29
45
33
48
35
56
32
55
27
50
Ngä
ti Ka
hung
unu
ki H
eret
aung
a 28
43
25
39
27
41
34
42
37
44
Te R
araw
a 26
57
22
45
24
47
32
59
25
48
Tüho
e 22
61
23
67
25
62
21
56
26
53
Ngä
ti Ka
hung
unu
ki W
aira
rapa
21
35
24
37
22
35
27
39
23
31
Tara
naki
20
27
15
20
12
17
4
11
2 6
Ngä
ti Ra
ukaw
a (W
aika
to)
19
33
19
34
19
37
20
40
20
40
Ngä
ti Ra
ukaw
a, re
gion
uns
peci
fied
18
22
9 17
9
18
8 17
7
15
Wha
katö
hea
17
33
14
33
15
31
12
28
14
30
Ngä
itera
ngi
15
29
19
35
20
33
17
32
19
31
Te W
häna
u-a-
Apa
nui
14
37
16
37
13
36
13
40
12
37
Ngä
ti W
hatu
a 14
29
11
25
12
26
13
31
13
28
Oth
er
338
771
364
776
377
797
405
826
379
806
Tota
l 1,
682
n/a
1,65
8 n/
a 1,
662
n/a
1,68
3 n/
a 1,
619
n/a
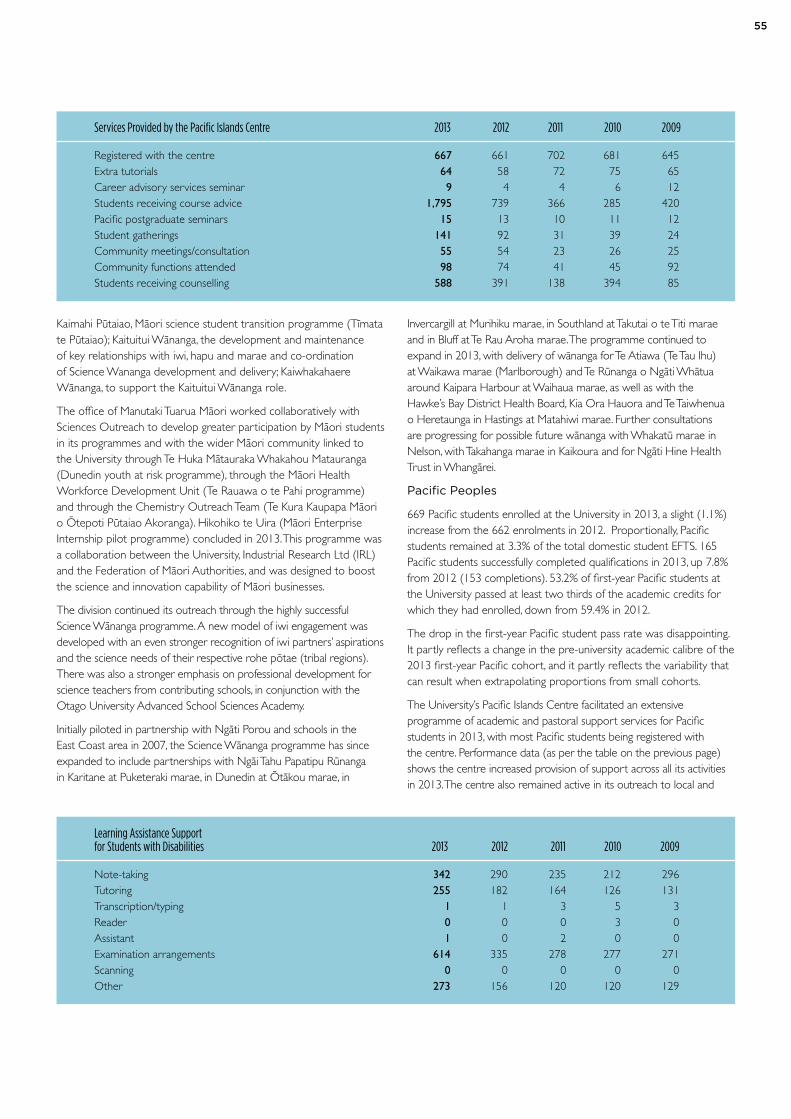
55
Learning Assistance Support for Students with Disabilities 2013 2012 2011 2010 2009
Note-taking 342 290 235 212 296Tutoring 255 182 164 126 131Transcription/typing 1 1 3 5 3Reader 0 0 0 3 0Assistant 1 0 2 0 0Examination arrangements 614 335 278 277 271Scanning 0 0 0 0 0Other 273 156 120 120 129
Services Provided by the Pacific Islands Centre 2013 2012 2011 2010 2009
Registered with the centre 667 661 702 681 645Extra tutorials 64 58 72 75 65Career advisory services seminar 9 4 4 6 12Students receiving course advice 1,795 739 366 285 420Pacific postgraduate seminars 15 13 10 11 12Student gatherings 141 92 31 39 24Community meetings/consultation 55 54 23 26 25Community functions attended 98 74 41 45 92Students receiving counselling 588 391 138 394 85
Kaimahi Pütaiao, Mäori science student transition programme (Tïmata te Pütaiao); Kaituitui Wänanga, the development and maintenance of key relationships with iwi, hapu and marae and co-ordination of Science Wananga development and delivery; Kaiwhakahaere Wänanga, to support the Kaituitui Wänanga role.
The office of Manutaki Tuarua Mäori worked collaboratively with Sciences Outreach to develop greater participation by Mäori students in its programmes and with the wider Mäori community linked to the University through Te Huka Mätauraka Whakahou Matauranga (Dunedin youth at risk programme), through the Mäori Health Workforce Development Unit (Te Rauawa o te Pahi programme) and through the Chemistry Outreach Team (Te Kura Kaupapa Mäori o ötepoti Pütaiao Akoranga). Hikohiko te Uira (Mäori Enterprise Internship pilot programme) concluded in 2013. This programme was a collaboration between the University, Industrial Research Ltd (IRL) and the Federation of Mäori Authorities, and was designed to boost the science and innovation capability of Mäori businesses.
The division continued its outreach through the highly successful Science Wänanga programme. A new model of iwi engagement was developed with an even stronger recognition of iwi partners’ aspirations and the science needs of their respective rohe pötae (tribal regions). There was also a stronger emphasis on professional development for science teachers from contributing schools, in conjunction with the Otago University Advanced School Sciences Academy.
Initially piloted in partnership with Ngäti Porou and schools in the East Coast area in 2007, the Science Wänanga programme has since expanded to include partnerships with Ngäi Tahu Papatipu Rünanga in Karitane at Puketeraki marae, in Dunedin at ötäkou marae, in
Invercargill at Murihiku marae, in Southland at Takutai o te Titi marae and in Bluff at Te Rau Aroha marae. The programme continued to expand in 2013, with delivery of wänanga for Te Atiawa (Te Tau Ihu) at Waikawa marae (Marlborough) and Te Rünanga o Ngäti Whätua around Kaipara Harbour at Waihaua marae, as well as with the Hawke’s Bay District Health Board, Kia Ora Hauora and Te Taiwhenua o Heretaunga in Hastings at Matahiwi marae. Further consultations are progressing for possible future wänanga with Whakatü marae in Nelson, with Takahanga marae in Kaikoura and for Ngäti Hine Health Trust in Whangärei.
Pacific Peoples
669 Pacific students enrolled at the University in 2013, a slight (1.1%) increase from the 662 enrolments in 2012. Proportionally, Pacific students remained at 3.3% of the total domestic student EFTS. 165 Pacific students successfully completed qualifications in 2013, up 7.8% from 2012 (153 completions). 53.2% of first-year Pacific students at the University passed at least two thirds of the academic credits for which they had enrolled, down from 59.4% in 2012.
The drop in the first-year Pacific student pass rate was disappointing. It partly reflects a change in the pre-university academic calibre of the 2013 first-year Pacific cohort, and it partly reflects the variability that can result when extrapolating proportions from small cohorts.
The University’s Pacific Islands Centre facilitated an extensive programme of academic and pastoral support services for Pacific students in 2013, with most Pacific students being registered with the centre. Performance data (as per the table on the previous page) shows the centre increased provision of support across all its activities in 2013. The centre also remained active in its outreach to local and
un
ive
rs
ity
of
ota
go
an
nu
al
re
po
rt
20
1356
national Pacific communities; activities included a special study support programme for Pacific students in Dunedin secondary schools.
A package of targeted scholarships has played an ongoing role in supporting Pacific student recruitment and the full-time Pacific Community Liaison Officer has provided a strong community focus to this recruitment. The University has also continued to offer achievement awards, recognising the top Pacific first-year student and top Pacific final-year student in each academic division.
Each of the University’s four academic divisions provided tailored support for Pacific students in 2013. This work complements the role of the Pacific Islands Centre and provides course-relevant responsive support engaging with students over academic pathways and outcomes.
The School of Business appointed a Pacific Island student academic adviser in 2013. The adviser works with the small cohort of Pacific Students in the division and has implemented the intervention programme already in place in the Division of Humanities. A stronger network of Commerce Pacific Island students is growing and the space dedicated for them two years ago continues to be well used.
The strong programme of work supported by the Division of Health Sciences Pacific Strategic Framework 2011-2015 continued in 2013. This work is supported by the Associate Dean (Pacific) in the Division of Health Sciences, whose role is to recruit, retain and ensure a high completion rate for Pacific students in the division. The Associate Dean (Pacific) also heads the division’s Pacific Islands Research and Student Support Unit (PIRSSU).
One of the major work streams undertaken through the auspices of the PIRSSU is the Pacific Orientation Programme @ Otago (POPO). Piloted in 2011, POPO combines an early residential orientation programme and peer-led mentoring with academic support.
The Pacific Foundation Programme (PFP), which is run through the University’s Foundation Studies subsidiary, supports New Zealand high school leavers of Pacific descent to prepare for first-year study in Health Sciences. Students are given the opportunity to review material they might have covered at high school, while being introduced to university-level material. Students also learn to address the various challenges that students face when they leave home for the first time to study at Otago.
Disabilities Support
The University takes a proactive approach to the recruitment and support of students with disabilities, with its Disability Information and Support service taking a lead role in this area, and working in conjunction with both academic and administrative departments.
In 2013, the University enrolled 1,000 students who identified as having a disability affecting study (2012: 869). Support in the form of learning assistance and/or special equipment requiring a specific financial commitment was provided to 518 students with disabilities in 2013 (2012: 508). 1,213 instances of support were provided in the form of note-taking, assistance with examinations, tutoring, transcription or typing (2012: 808) along with many hours of individual consultations with students provided by the team of trained advisors.
The end of 2013 was marked by the sad and unexpected passing of Donna-Rose McKay, Head of the Disability Information and Support Service, who had served at the University of Otago since 1992. Donna-Rose was the first person to be appointed to such a role in a New Zealand university. She will be remembered for her very considerable determination, energy and fearless advocacy.
Two Alumni Disability Support Scholarships of $5,000 were made available during 2013. These scholarships are offered to students who have demonstrated academic ability and who can show financial need arising from a disability.
Disability Information and Support staff hosted or participated in a number of teaching initiatives or disability awareness raising events across the University in 2013, including sessions with residential college staff, Library staff and Campus Watch on disability awareness. The 2013 Inclusive Teaching Award was also presented as part of the OUSA Teaching Awards, and Disability Information and Support Appreciation Awards acknowledged outstanding work by University staff in this area.
Equal Employment Opportunities
In 2013, the number of women in senior academic positions (senior lecturer and above) increased by 13 FTE (4.9%) to 270 FTE staff. Women now comprise 36.4% of staff at these levels, compared to 35.3% in 2012 and 24.7% as recently as 2005.
While the majority of general staff are female, women continue to be under-represented at the senior levels within the general and management staff.
An Equity Advisory Committee was established by the Vice-Chancellor in 2013. The committee will serve as an approved conduit for receiving and reviewing equity-related information, and initiating appropriate responses. The committee’s initial work will involve reaching out to the University community, forming communication channels and documenting existing equity groups.
A new equity website was launched to provide staff with easy access to equity-related information, and to enable submission of comments and feedback to the Equity Office.
Otago continued to support the Universities New Zealand Women in Leadership Programme, sending six senior women to the programme in 2013. The Women’s Professional Development Programme (jointly co-ordinated between the Higher Education Development Centre and Human Resources), including Women in Leadership at Otago (WiLO), continues. The mentoring programme was supported by career development workshops held across the Dunedin, Wellington and Christchurch campuses. The workshops were attended by 64 women.
The University continued to provide both the Treaty of Waitangi education programme and introductory te reo classes for staff in 2013. Seven te reo classes organized by Human Resources were held with a total of 124 participants. Regular lunchtime te reo classes (Café Reo) were offered to all interested staff.
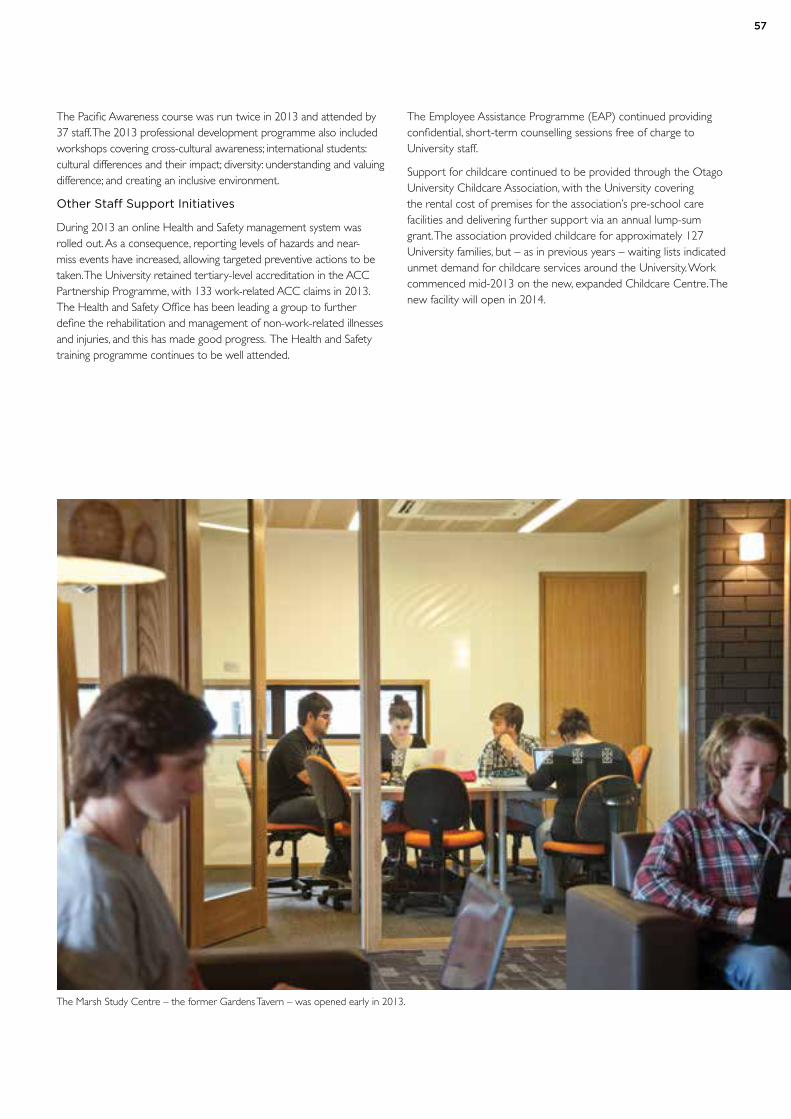
57
The Pacific Awareness course was run twice in 2013 and attended by 37 staff. The 2013 professional development programme also included workshops covering cross-cultural awareness; international students: cultural differences and their impact; diversity: understanding and valuing difference; and creating an inclusive environment.
Other Staff Support Initiatives
During 2013 an online Health and Safety management system was rolled out. As a consequence, reporting levels of hazards and near-miss events have increased, allowing targeted preventive actions to be taken. The University retained tertiary-level accreditation in the ACC Partnership Programme, with 133 work-related ACC claims in 2013. The Health and Safety Office has been leading a group to further define the rehabilitation and management of non-work-related illnesses and injuries, and this has made good progress. The Health and Safety training programme continues to be well attended.
The Employee Assistance Programme (EAP) continued providing confidential, short-term counselling sessions free of charge to University staff.
Support for childcare continued to be provided through the Otago University Childcare Association, with the University covering the rental cost of premises for the association’s pre-school care facilities and delivering further support via an annual lump-sum grant. The association provided childcare for approximately 127 University families, but – as in previous years – waiting lists indicated unmet demand for childcare services around the University. Work commenced mid-2013 on the new, expanded Childcare Centre. The new facility will open in 2014.
The Marsh Study Centre – the former Gardens Tavern – was opened early in 2013.
un
ive
rs
ity
of
ota
go
an
nu
al
re
po
rt
20
1358
This report has been prepared to provide, within the overall Annual Report, further information on the activities and performance of the most significant entities that comprise part of the University Group, but sit outside the University parent.
A full list of Group subsidiary entities and associates, of which there are 14 in all, appears in the Statement of Accounting Policies on page 64 of this Annual Report. The following have been identified as the most significant of these entities for reporting purposes and are covered individually below:
~ The University of Otago Foundation Trust
~ University of Otago Foundation Studies Limited
~ Otago Innovation Limited
~ New Zealand Genomics Limited.
The University of Otago Foundation Trust
Overview
The University of Otago Foundation Trust (the Trust) was established in 2002. It is a registered charitable trust that receives and administers donations, bequests and sponsorship monies for University and academic priorities.
The Trust is an umbrella trust consisting of over 350 individual trust funds. Each fund has specific terms and conditions stating the purpose for which the funds can be distributed to the University.
The investments are managed by the Board of Trustees, which is made up of Council members, senior University staff and investment professionals. The Board holds regular meetings to evaluate the investment performance of the fund and to ensure that the investment objectives are being met. The risks and exposure to individual investments and sectors are regularly monitored and reviewed. The Board receives advice from a board-appointed independent external investment advisor who reviews and endorses investment decisions and offers advice on purchases and sales for the portfolio.
All monies received by the Trust are combined for investment purposes, enabling investment risk to be managed through a diversified portfolio. Investments are spread in a balanced portfolio which includes shares, property, bonds and cash. A detailed investment policy provides guidelines on asset allocation and social responsibility issues, and is regularly reviewed by the Trustees.
The investment objectives of the Foundation Trust are to ensure that, where appropriate, capital is preserved and increased by an amount at least equal to the rate of inflation, and that an income return of 4.5% is achieved.
The fund value has increased substantially over the last decade, with the largest increase being in 2005 when the University partnered with the government and private donors to fund the Leading
Thinkers Initiative. This $50 million project funded specialist University chairs, with the University raising $25 million through private donors and the government matching this amount by providing an additional $25 million.
The investments managed by the Foundation Trust have achieved an average return of 7.1% per annum over the last 10 years. Although the global financial crisis has affected returns in several of these years, the impact was less than that suffered by other similar funds.
2013 Achievements
The net investment return for the 2013 year was 6.6% (2012: 12.4%). The total fund value as at 31 December 2013 was $169.1 million (2012: $160.7 million).
University of Otago Foundation Studies Limited
Overview
Incorporated in 1996, University of Otago Foundation Studies Limited (FSL) provides transition pathways to degree-level study at the University of Otago.
FSL comprises two distinct functional areas: Foundation Year and the Language Centre. The Foundation Year prepares students for degree-level study at the University. While originally conceived as a programme primarily for international students, Foundation Year has become increasingly important as a transition pathway for New Zealand students as well. It includes the innovative and highly successful Tü Kahika Programme for Mäori students wishing to prepare for study in the health sciences, and its Pacific equivalent, the Pacific Foundation Programme.
The Language Centre provides English language tuition to both groups and individuals, almost exclusively from overseas or of recent resident status. In many cases, that tuition develops students so they can proceed to study at Foundation Year and at the University.
2013 Achievements
In 2013, the Foundation Year provided academic tuition to 341 individual domestic and international students, generating 275 EFTS. The 2013 enrolment represented an increase of 11.5% over the 246 EFTS enrolled in 2012.
The Language Centre had 131 EFTS in 2013.
The company generated an operating surplus of $675k or 8.4% on external revenue for the year.
Group Entitiesreport
59
Otago Innovation Limited
Overview
Otago Innovation Limited (Otago Innovation) was established in 1996. It is a wholly-owned subsidiary of the University that has responsibility for the commercialisation of intellectual property arising from research within the University. Much of Otago Innovation’s commercialisation activity is centred upon medical research and biotechnology innovation. A particular focus is bringing emerging technology to the market, including novel gene therapies, drug delivery systems, software, measurement devices and vaccines.
There has also been significant broadening of Otago Innovation’s commercialisation work, including projects in departments that have not traditionally been involved with Otago Innovation (e.g. music, philosophy, computer science).
Otago Innovation provides business partners, industry and investors with information about current University of Otago projects, their practical applications, their patent status and market potential. Otago Innovation’s commercialisation managers assist with the preparation and implementation of business and marketing plans, assist the commercialisation process and ensure key proof of concept targets are managed and met.
Otago Innovation has been involved in a number of company formations based on University of Otago research. These include:
• BLIS Technologies Limited – formed in 2000 and utilising technology from the University of Otago’s Department of Microbiology and Immunology to pursue the commercialisation of BLIS bacteriocin-like inhibitory substances
• Pacific Edge Ltd – a biomedical company formed in 2001 that develops novel diagnostic and therapeutic products to manage cancer and other diseases. The company’s share value increased dramatically in 2013 following the signing of contracts with two major US health providers. Pacific Edge was also the 2013 Supreme Winner of the NZ Innovators Award (for Cxbladder, its gene test for the detection and management of bladder cancer)
• Photonic Innovations Limited – formed in 2005 to commercialise sensor technology developed within the University of Otago
• Immune Solutions Limited – formed in late 2002 to commercialise the Oral Delivery Technology platform (an oral dose lipid matrix delivery system designed to replace injections, aerosols and patches).
Otago Innovation also runs an annual Otago Innovation Proof of Concept Grant competition. The grant, which is valued at $50,000 and awarded to a University of Otago researcher, is to encourage researchers to think about the possible commercial applications of their research, including what an end product or service might look like and who would buy it.
2013 Achievements
The 2013 Otago Innovation Proof of Concept Grant competition was won by Associate Professor Chris Pemberton (of the Christchurch Heart Institute, University of Otago, Christchurch). In total there were 13 applications received, however only 10 were put before the assessment panel.
Otago Innovation was involved in a significant number of initiatives in 2013, which included (but were not restricted to):
• Otago Innovation won the 2013 BNZ Commercial Deal award for commercialising the TOXINZ database. The database contains more than 190,000 documents with comprehensive up-to-date information on poisonous chemicals, pharmaceuticals, plants and animals. Subscriptions to TOXINZ are currently being sold to poison centres, hospitals, state governments and health boards
• Photonic Innovations Limited successfully raised capital from Angel investors during the year. Its management team has expanded and the company is now developing its first gas sensor device for industry
• Novel diagnostic tests developed by Otago researchers became available for commercialisation, including tests for acute coronary syndrome (particularly myocardial infarction), unstable angina, and ovarian function
• The mobile applications Flora Finder, Bonedoc, HelpMePublish were released. Flora Finder allows users to instantly identify native plants using a smart phone’s camera. Bonedoc is a serious game which allows users to perform virtual orthopaedic surgery. HelpMePublish is a tool designed to help researchers analyse, harness and contribute to the publication of research. HelpMePublish provides databases on 13 major subject areas containing information on more than 6000 reputable academic journals provided by journal editors, subject experts and academic users.
New Zealand Genomics Limited
Overview
New Zealand Genomics Limited (NZGL) was established in 2010 as a genomics infrastructure service provider to the New Zealand science community and started delivering services from the final quarter of 2011.
Genomics1 underpins economic development in New Zealand’s biological economy through horticultural, agricultural and human health research endeavour. Examples of application include improvement in human health research, improvements in the dairy, sheep and seafood industries, and improvements in environmental and conservation research.
1 Genomics is a branch of molecular biology concerned with the structure, function, evolution and mapping of genomes.
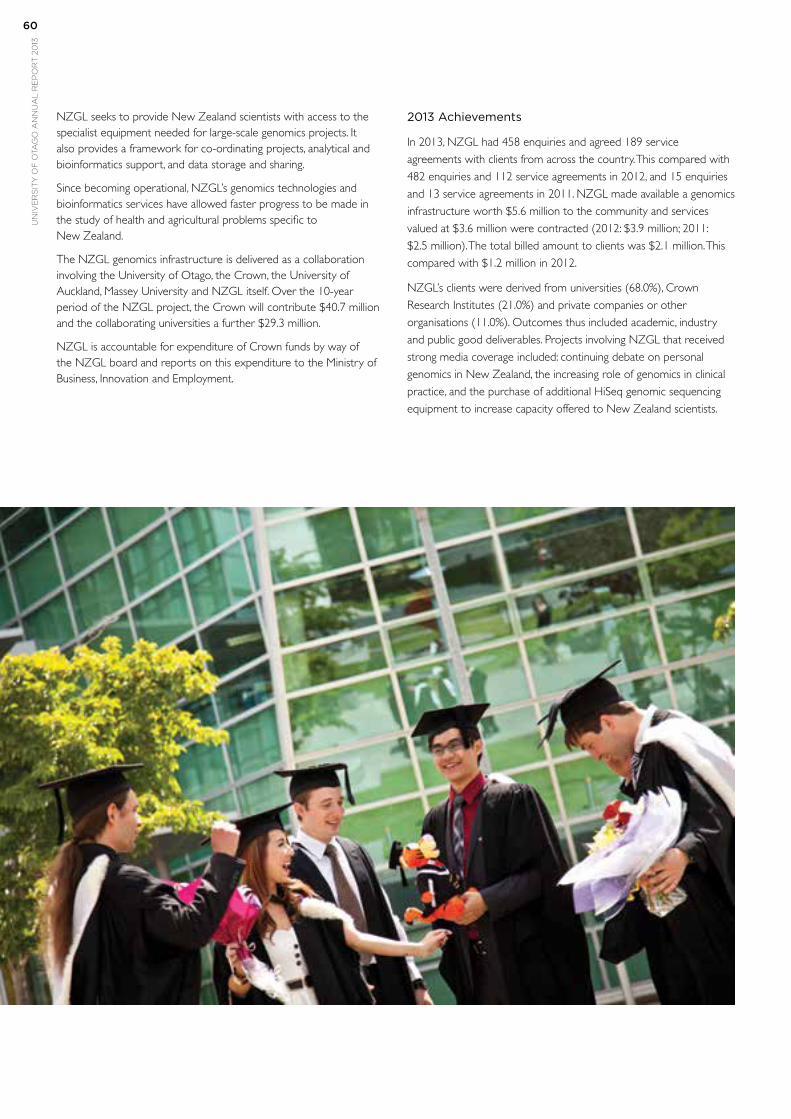
un
ive
rs
ity
of
ota
go
an
nu
al
re
po
rt
20
1360
NZGL seeks to provide New Zealand scientists with access to the specialist equipment needed for large-scale genomics projects. It also provides a framework for co-ordinating projects, analytical and bioinformatics support, and data storage and sharing.
Since becoming operational, NZGL’s genomics technologies and bioinformatics services have allowed faster progress to be made in the study of health and agricultural problems specific to New Zealand.
The NZGL genomics infrastructure is delivered as a collaboration involving the University of Otago, the Crown, the University of Auckland, Massey University and NZGL itself. Over the 10-year period of the NZGL project, the Crown will contribute $40.7 million and the collaborating universities a further $29.3 million.
NZGL is accountable for expenditure of Crown funds by way of the NZGL board and reports on this expenditure to the Ministry of Business, Innovation and Employment.
2013 Achievements
In 2013, NZGL had 458 enquiries and agreed 189 service
agreements with clients from across the country. This compared with
482 enquiries and 112 service agreements in 2012, and 15 enquiries
and 13 service agreements in 2011. NZGL made available a genomics
infrastructure worth $5.6 million to the community and services
valued at $3.6 million were contracted (2012: $3.9 million; 2011:
$2.5 million). The total billed amount to clients was $2.1 million. This
compared with $1.2 million in 2012.
NZGL’s clients were derived from universities (68.0%), Crown
Research Institutes (21.0%) and private companies or other
organisations (11.0%). Outcomes thus included academic, industry
and public good deliverables. Projects involving NZGL that received
strong media coverage included: continuing debate on personal
genomics in New Zealand, the increasing role of genomics in clinical
practice, and the purchase of additional HiSeq genomic sequencing
equipment to increase capacity offered to New Zealand scientists.
61
The University and its controlled entities achieved a satisfying financial result in 2013.
The University’s operating surplus for the year was $36.5 million, a return of 5.9% on revenue and 3.0% on net assets. The surplus was $20.6 million above the budget of $15.9 million and $21.9 million greater than the $14.6 million surplus achieved in 2012. The five-year moving average surplus, for the period 2009 to 2013, was $26.6 million, which was a 2.3% return on net assets and exceeded the University’s own financial performance target of 2.0%.
The University saw a decline in enrolments in 2013, with a final result of 18,600 EFTS. This was 351 EFTS (1.9%) fewer than in 2012, and 525 EFTS (2.7%) fewer than the budget target of 19,125 EFTS. A number of factors combined to produce this result. These included the pipeline impact of measures taken internally in recent years, notably the tightening of academic progress policies, to advance the University strategically in terms of the calibre and nature of its student cohort. At the same time a number of external factors impacted adversely on enrolments. These included the general strengthening of the national economy, the winding down of a major overseas teaching contract and the impact of the high New Zealand dollar on international competitiveness.
2013 was a relatively quiet year for capital expenditure, which, at $62.0 million, was well below the budget of $91.2 million and slightly less than 2012. This was largely due to timing as a number of major building projects, which were expected to begin construction during the year, were still in the planning phase at year end. Several of these projects are very large and complex and it is taking more time than expected to fully address design, staging and decanting issues.
The University Group, which includes the University of Otago, University of Otago Holdings Limited, the University of Otago Foundation Trust, and the Dunedin City Tertiary Accommodation Trust, produced an operating surplus of $45.9 million for the year. This surplus was $22.5 million (96.2%) better than the budget and $13.8 million (43.3%) more than the 2012 result.
The Group surplus represented a return of 7.2% on revenue of $635.9 million and 3.1% on net assets of $1.492 billion. These were comfortably above the Tertiary Education Commission’s minimum guidelines of 3.0% and 1.2% respectively.
This was a good outcome for both the University and the Group and, although the majority of the favourable variance from budget in the operating surplus was caused by three one-off items, part was attributable to careful budget management by staff from all areas of the University.
The most significant one-off variance, at $10.8 million, was the result of reaching early agreement with the University’s insurers on the final costs of the repairs to the medical school buildings in Christchurch, which were badly damaged in the 2011 earthquake.
The repairs were extensive and took place over several years, and the final costs were agreed with the insurers late in 2013. While the recovery of $14.8 million was included in the surplus figure for the year, the majority of the cash will not be received until early 2014.
The second one-off variance was attributable to success in the marketplace by Pacific Edge Limited, a publicly-listed biotechnology company, which originated at the University of Otago. The University enjoyed unrealised gains of almost $2.5 million from the increase in the value of its shareholding in Pacific Edge at year end.
A further $1.9 million was added to the surplus following a reduction in the estimated cost of future liabilities for staff retiring gratuities, long service leave and sick leave. This liability, which is calculated annually, can fluctuate significantly from year to year due to movements in the interest rates which are used by actuaries to discount future liability values to present day ones. For this reason movements are not budgeted.
These three items were non-cash in nature, so it was pleasing to achieve cash-flows from operations for both the University and the Group that were very close to budget.
Maintaining strong cash-flows is the key to funding investment in new equipment and campus infrastructure, particularly the major building projects on the University’s Priority Development Plan, such as the expansion and renovation of the Dental School, which is in the planning stages and will be the single largest construction project ever undertaken by this University.
The financial position of the University and the Group continues to be strong, with equity now totalling $1.492 billion and no significant external debt.
The University’s cash on hand at year end was $93.1 million, which was $43.4 million higher than budget. Much of this variance was caused by the underspending of the capital expenditure budget referred to above and by the timing of cash outflows for project expenditure.
This accumulation of cash is a deliberate strategy to help fund the large projects on the Priority Development Plan.
Financially, 2013 has been a very good year achieved in quite difficult times. The University community has worked hard to make savings and to live within budget. The excellent results, even after allowing for the one-off items described above, are testament to their prudent financial management. A strong balance sheet with high levels of liquidity is a solid foundation for the University as it begins to see many of the projects on the Priority Development Plan move from planning to construction. These exciting developments will change the face of the campus over the next decade.
A J PatrickChief Operating Officer
Financialreview

un
ive
rs
ity
of
ota
go
an
nu
al
re
po
rt
20
1362
63
2013 Financial Statements 1. The Council and management of the University of Otago accept responsibility for the preparation of the annual financial
statements and the Statement of Service Performance and the judgements used in them;
2. The Council and management of the University of Otago accept responsibility for establishing and maintaining a system of
internal control designed to provide reasonable assurance as to the integrity and reliability of financial reporting; and
3. In the opinion of the Council and management of the University of Otago, the annual financial statements and the Statement of Service Performance for the financial year ended 31 December 2013 fairly reflect the financial position and operations of the University of Otago.
Chancellor
Vice-Chancellor
Chief Operating Officer
8 April, 2014
Statementof responsibility
un
ive
rs
ity
of
ota
go
an
nu
al
re
po
rt
20
1364
THE REPORTING ENTITy
The University of Otago was founded in 1869 by an Ordinance of the Otago Provincial Council, and is New Zealand’s oldest University. In 1874 the University of Otago became an affiliated college of the University of New Zealand, which was established by statute in 1870. However, in 1961 the University of New Zealand was disestablished and the University of Otago acquired its present legal status and was granted the power to confer degrees by the University of Otago Amendment Act 1961.
The financial statements presented here are for the reporting entity, University of Otago (Parent), and the Group consisting of the Subsidiary and Associate companies, controlled Trusts and the Dunedin City Tertiary Accommodation Trust.
The Group Subsidiary and Associate companies are:
~ University of Otago Holdings Limited. Holding company. 100% owned by the University.
~ Otago Innovation Limited. Company to hold and develop the commercial interests of the University. 100% owned by University of Otago Holdings Limited.
~ University of Otago Foundation Studies Limited. Operates the foundation year programme and an English language school. 100% owned by University of Otago Holdings Limited.
~ New Zealand Genomics Limited. Set up in collaboration with the University of Auckland and Massey University with the objective of creating a national infrastructure for making advanced genomics technologies accessible and affordable for New Zealand scientists, while also being accessible to commercial organisations. 100% owned by University of Otago Holdings Limited.
~ Unipol Recreation Limited. Owns a building in Anzac Avenue. 100% owned by University of Otago Holdings Limited.
~ University Union Limited. Owner of the University Union building. 50% owned by University of Otago Holdings Limited.
~ New Zealand Centre for Reproductive Medicine Limited. No longer trading – business assets sold. 50% owned by University of Otago Holdings Limited.
~ Unihealth Limited. Not trading. 50% owned by University of Otago Holdings Limited.
~ LCO New Zealand Limited. Owns and operates a software system for libraries serving four Universities. 31% owned by University of Otago Holdings Limited.
~ BPAC NZ Limited. This company works with the Division of Health Sciences to provide best practice advocacy services to primary, secondary and tertiary health providers in the area of medication prescribing. 20% owned by University of Otago Holdings Limited.
~ Upstart Incubation Trustee Company Limited. Non operational – has no assets or liabilities. 33% owned by University of Otago Holdings Limited.
~ Immune Solutions Limited. This company is working with the Department of Microbiology to develop oral vaccines for the treatment of tuberculosis in animals, particularly possums. 100% owned by Otago Innovation Limited.
~ Photonic Innovations Limited. Developer of revolutionary laser technology. 57.1% owned by Otago Innovation Limited.
~ Menixis Limited. Developing particle analysis technology. 17% owned by Otago Innovation Limited.
The controlled Trusts include the University of Otago Foundation Trust, and the Hocken Collections established for the benefit of theUniversity of Otago. The University is the beneficiary of all the Trusts and appoints the Trustees.
The Dunedin City Tertiary Accommodation Trust owns and operates City College and is jointly controlled by the University of Otago and the Otago Polytechnic.
The primary objective of the University and Group is to provide goods and services for the community for social benefit rather than make a financial return. Accordingly, the University has designated itself and the Group as public benefit entities for the purposes of New Zealand equivalents to the International Financial Reporting standards (NZ IFRS).
The financial statements of the University and Group are for the year ended 31 December 2013. The financial statements were authorised for issue by Council on 8 April 2014.
Statementof accounting policiesfor the year ended 31 December 2013
65
BASIS OF PREPARATION OF THE FINANCIAL STATEMENTS
The accompanying financial statements are presented in accordance with Section 220 of the Education Act 1989, the Crown Entities Act 2004, and New Zealand Generally Accepted Accounting Practice (NZ GAAP). They comply with NZ IFRS and other applicable Financial Reporting Standards, as appropriate for public benefit entities.
The accounting policies set out below have been applied consistently to all periods presented in these financial statements.
The accounting principles followed by the Group are those recognised as appropriate for the measurement and reporting of financial performance and financial position on a historical cost basis, with the exception that certain property, plant and equipment have been revalued and some other financial assets have been shown at fair value (Refer Accounting Policy 12).
The financial statements are presented in New Zealand dollars and all values are rounded to the nearest thousand dollars ($000). The functional currency of the University of Otago is New Zealand dollars.
The financial statements include:
~ Statement of Financial Performance,
~ Statement of Comprehensive Income,
~ Statement of Changes in Equity,
~ Statement of Financial Position,
~ Statement of Cash Flows,
~ Reconciliation of the Net Surplus with the Net Cash Flows from Operating Activities,
~ Statement of Commitments and Contingencies, and
~ Notes to and Forming Part of the Financial Statements.
The financial statements include the operations of the University of Otago, its subsidiary and associate companies and its controlled Trusts. The subsidiary companies and Trusts have been included in the consolidated accounts by line aggregation of assets, liabilities, revenues, expenses and cash flows. Associate companies and the Dunedin City Tertiary Accommodation Trust have been consolidated on an equity accounting basis, which shows the share of the surpluses/deficits in the University’s statement of financial performance and the share of post-acquisition increases/decreases in net assets in the University’s Statement of Financial Position.
All significant inter-entity transactions have been eliminated on consolidation.
ACCOUNTING POLICIES
The following accounting policies, which materially affect the measurement of financial performance and financial position, have been applied.
1. RevenuesGovernment Grants and Student FeesGovernment grants and student fees are recognised as income on entitlement.
Research FundsIncome received for research which will provide reciprocal benefits to the research funding provider is recognised in the Statement of Financial Performance as “Externally Funded Research” income when research expenditure is incurred. Those research funds which are not expended at year end are included in the Statement of Financial Position as “Funds Received in Advance” to recognise the future obligations to complete the research. (Refer Note 11)
Income for research which provides no reciprocal benefits to the research funding provider is recognised in the Statement of Financial Performance as “Externally Funded Research” income when received.
Pledged DonationsPledged donations are recognised in the Statement of Financial Performance as “Trust Donations” when the pledge agreement is signed. When payments are made they are recorded against the asset. Pledged donations are recorded at their face value. (Refer Note 19)
un
ive
rs
ity
of
ota
go
an
nu
al
re
po
rt
20
1366
OtherWhere physical assets are acquired for nil consideration the fair value of the asset received is recognised as revenue.
Dividends are recognised when the right to receive payment has been established.
Revenue from sale of goods and services is recognised on sale.
2. BudgetsThe budgets reported in these Financial Statements are those approved by University Council on 27 November 2012.
3. Foreign CurrenciesTransactions and balances in foreign currencies are converted at the New Zealand rate of exchange ruling at the date of the transaction and balance date respectively. Foreign exchange gains and losses have been recognised in the Statement of Financial Performance.
4. Trade and Other ReceivablesAccounts receivable are valued at estimated realisable value. Amounts not considered recoverable are written off in the period in which they are identified.
5. Property, Plant and EquipmentThe University’s land and buildings are revalued when there has been a significant movement in the market value or depreciated replacement cost. They were revalued on 31 December 2010 in accordance with NZ IAS 16 “Property, Plant and Equipment” and the New Zealand Property Institute’s Valuation Standard 3, “Valuations for Financial Reporting”. The basis of valuation was as follows.
~ Land was valued at market value;
~ Specialised buildings and improvements were valued at depreciated replacement cost; and
~ Non-specialised buildings and improvements were valued at market value.
The valuation was completed by a Registered Valuer employed by the University and has been reviewed by an independent RegisteredValuer (Chapman Consultancy (2008) Limited) and confirmed as appropriate for financial reporting purposes (Refer Note 8).
No revaluation was deemed necessary in 2013.
Costs incurred in researching and determining the feasibility of acquiring a fixed asset, prior to final approval to purchase, have been recognised as an expense.
All Crown-owned land and buildings (if any) used by the University are included as part of the University’s assets. Although legal title has not been transferred, the University has assumed all the normal risks and rewards of ownership.
Capital work in progress is valued at cost and is not depreciated.
Library books and periodicals, with the exception of rare books and special library collections, have been valued at cost less accumulated depreciation. Library electronic resources in the form of annual subscriptions are written off at the time of purchase.
Rare books and special library collections were valued as at 31 December 1994 by expert University Library staff, based on the net current value of items following the generally accepted methodology employed by the Alexander Turnbull Library. Any additions to the collection have been valued at cost. (Refer Note 16)
The Hocken Library Collections were revalued at 1 January 2006 by an independent Registered Valuer (Peter Webb Galleries). The University elected to adopt optional exemption appendix D1 (c) of NZ IFRS 1 and has recognised the revalued amounts as fair value, and used this as the deemed cost. Any additions since 1 January 2006 have been valued at cost. (Refer Note 17)
University artworks were valued at 1 January 2006 by an independent Registered Valuer (Peter Webb Galleries). The University elected to adopt optional exemption appendix D1 (c) of NZ IFRS 1 and has recognised the valued amounts as fair value, and used this as the deemed cost. Any additions since 1 January 2006 have been valued at cost.
Plant, motor vehicles, equipment and furniture are recorded at cost less accumulated depreciation and impairment losses. Asset purchases of less than $2,000 are expensed at cost on acquisition, with the exception of furniture and computers which are capitalised regardless of cost.
The useful life of each asset class and the depreciation rates used in the preparation of these statements are as follows:
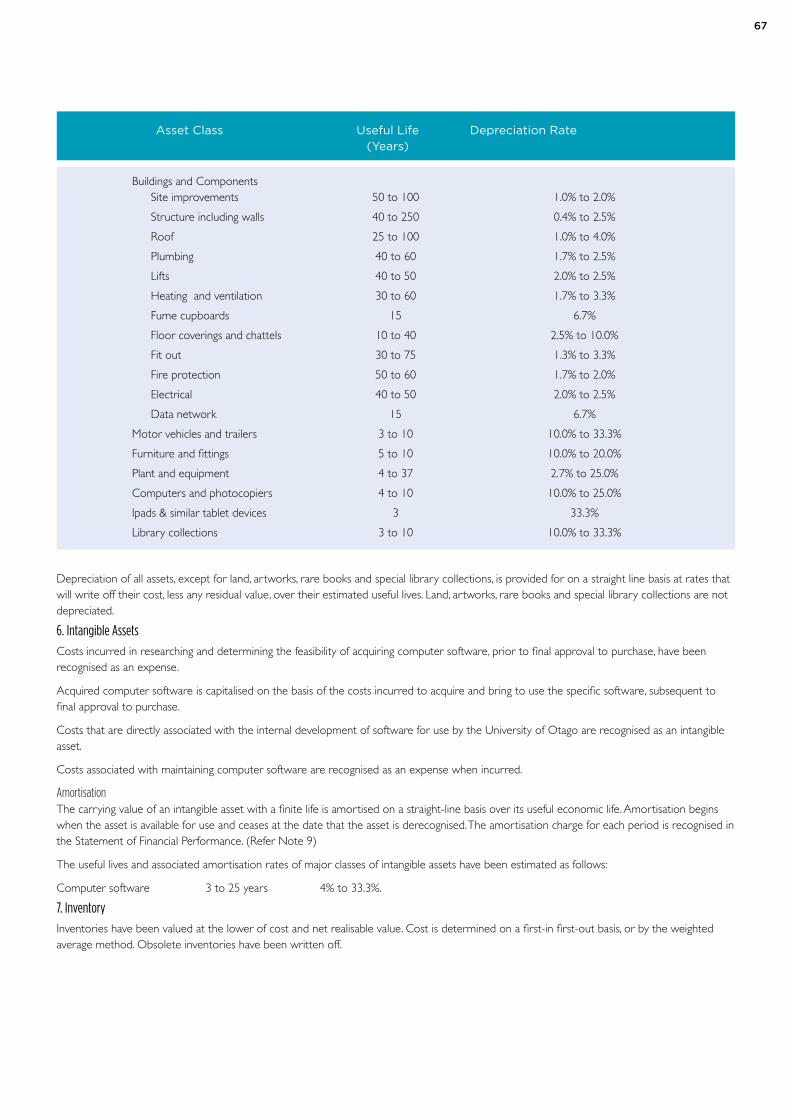
67
Asset Class Useful Life Depreciation Rate (Years)
Buildings and Components Site improvements 50 to 100 1.0% to 2.0%
Structure including walls 40 to 250 0.4% to 2.5%
Roof 25 to 100 1.0% to 4.0%
Plumbing 40 to 60 1.7% to 2.5%
Lifts 40 to 50 2.0% to 2.5%
Heating and ventilation 30 to 60 1.7% to 3.3%
Fume cupboards 15 6.7%
Floor coverings and chattels 10 to 40 2.5% to 10.0%
Fit out 30 to 75 1.3% to 3.3%
Fire protection 50 to 60 1.7% to 2.0%
Electrical 40 to 50 2.0% to 2.5%
Data network 15 6.7%
Motor vehicles and trailers 3 to 10 10.0% to 33.3%
Furniture and fittings 5 to 10 10.0% to 20.0%
Plant and equipment 4 to 37 2.7% to 25.0%
Computers and photocopiers 4 to 10 10.0% to 25.0%
Ipads & similar tablet devices 3 33.3%
Library collections 3 to 10 10.0% to 33.3%
Depreciation of all assets, except for land, artworks, rare books and special library collections, is provided for on a straight line basis at rates that will write off their cost, less any residual value, over their estimated useful lives. Land, artworks, rare books and special library collections are not depreciated.
6. Intangible AssetsCosts incurred in researching and determining the feasibility of acquiring computer software, prior to final approval to purchase, have been recognised as an expense.
Acquired computer software is capitalised on the basis of the costs incurred to acquire and bring to use the specific software, subsequent to final approval to purchase.
Costs that are directly associated with the internal development of software for use by the University of Otago are recognised as an intangible asset.
Costs associated with maintaining computer software are recognised as an expense when incurred.
AmortisationThe carrying value of an intangible asset with a finite life is amortised on a straight-line basis over its useful economic life. Amortisation begins when the asset is available for use and ceases at the date that the asset is derecognised. The amortisation charge for each period is recognised in the Statement of Financial Performance. (Refer Note 9)
The useful lives and associated amortisation rates of major classes of intangible assets have been estimated as follows:
Computer software 3 to 25 years 4% to 33.3%.
7. InventoryInventories have been valued at the lower of cost and net realisable value. Cost is determined on a first-in first-out basis, or by the weighted average method. Obsolete inventories have been written off.
un
ive
rs
ity
of
ota
go
an
nu
al
re
po
rt
20
1368
8. Goods and Services Tax (GST)The financial statements are prepared on a basis which excludes GST. Accounts receivable and accounts payable are GST inclusive. GST owing to the Inland Revenue Department as at 31 December 2013 is included in accounts payable.
The net GST paid to, or received from the IRD, is classified as an operating cash flow in the statement of cash flows.
9. Employee EntitlementsAnnual leave for academic and general staff has been accrued. In addition an accrual has been made for retirement gratuities and sickleave for both academic and general staff and long service leave for general staff. Retirement gratuities, long service leave and sick leavehave been accrued on the following basis:
~ Long Service leave which has vested to the employee (an entitlement has been established) has been measured at nominal value using remuneration rates current at reporting date. This is included as a Current Liability.
~ Retirement gratuities which have vested to the employee (an entitlement has been established) have been measured at nominal value using remuneration rates current at the time of entitlement. This is included as a Current Liability.
~ Retirement gratuities and long service leave which have not yet vested in the employee (no entitlement has been established) have been measured using the present value measurement basis which discounts expected future cash outflows. This is treated as a Non Current Liability.
~ Sick leave has been measured using the present value measurement basis which discounts expected future cash outflows. This is treated as a Non-Current Liability.
~ Employee entitlements relating to the sale of intellectual property have been valued using the value of the intellectual property at balance date as the basis for the entitlement.
10. Finance LeasesFinance leases, which effectively transfer to the University of Otago and Group companies all the risks and benefits incidental to ownership of the leased item, are capitalised. The leased assets and corresponding lease liabilities are disclosed and the leased assets are depreciated over the period that benefits are received from their use.
11. Operating LeasesAn operating lease is a lease that does not transfer substantially all the risk and rewards incidental to ownership of an asset. Lease payments under an operating lease are recognised as an expense on a straight line basis over the lease term.
12. Other Financial AssetsThe University classifies its Other Financial Assets into the following four categories: financial assets at fair value through the Statement of Financial Performance; loans and receivables; held to maturity investments and available for sale assets. The classification depends on the purpose for which the investments were acquired. Management determines the classification of its investments at initial recognition and re-evaluates this designation at reporting date. Financial assets are initially measured at fair value plus transition costs.
Financial assets at fair value through the Statement of Financial PerformanceA financial asset is classified in this category if acquired principally for the purpose of selling in the short term or if so designated by management. These include investments in quoted shares. After initial recognition they are measured at fair values. Gains or losses on measurement are recognised in the Statement of Financial Performance.
Loans and receivablesThese are non-derivative financial assets with fixed or determinable payments that are not quoted in an active market. These include shareholders advances; loans and short term deposits. After initial recognition they are measured at amortised cost using the effective interest method. Gains and losses where the asset is impaired or derecognised are recognised in the Statement of Financial Performance.
Held-to-maturity investmentsThese are assets with fixed or determinable payments and fixed maturities that the University has the positive intention and ability to hold to maturity. The University and Group have no investments in this category.
Available-for-sale assetsThese are those non-derivative financial assets that are designated as available for sale or are not classified as financial assets at fair value through the Statement of Financial Performance, loans and receivables or held to maturity investments. The University and Group have no assets in this category.
University investments in its subsidiaries are carried at cost. Investments in associate companies are valued at cost plus the share of retained profits.
69
13. Accounting for Derivative Financial Instruments and Hedging ActivitiesThe University uses derivative financial instruments to hedge exposure to foreign exchange risks arising from operating activities. The University does not hold or issue derivative financial instruments for trading purposes.
Derivatives are initially recognised at fair value on the date a derivative contract is entered into and subsequently remeasured at fair value.
14. Financial Instruments The University is party to financial instruments as part of its everyday operations. These financial instruments give rise to both a financial asset at one enterprise and a financial liability or equity instrument at another enterprise. These financial assets and liabilities include bank accounts, term deposits, accounts receivables, prepayments and accounts payable.
Revenues and expenses including gains and losses in relation to all financial instruments are recognised in the Statement of Financial Performance. All financial instruments are shown at their estimated fair value.
15. Statement of Cash Flows~ Cash & Cash Equivalents includes cash in hand, deposits held at call with banks, other short-term highly liquid investments with original
maturities of three months or less, and bank overdrafts.
~ Operating Activities include cash received from all income sources and record the cash payments made for the supply of goods and services.
~ Investing Activities are those activities relating to the acquisition and disposal of non-current assets.
~ Financing Activities comprise activities that change the debt structure of the University.
16. TaxationThe University, its subsidiaries and Trusts are exempt from the payment of income tax as they are treated by the Inland Revenue Department as charitable organisations. Accordingly, no charge for income tax applies or has been provided for.
17. ACC Partnership ProgrammeThe University of Otago belongs to the ACC Partnership Programme whereby the University accepts the management and financial responsibility of work-related illnesses and accidents of employees. Under the ACC Partnership Programme, the University is effectively providing accident insurance to employees and this is accounted for as an insurance contract. The value of this liability represents the expected future payments in relation to accidents and illnesses occurring up to the Statement of Financial Position date for which the University has responsibility under the terms of the Partnership Programme.
The liability for claims reported prior to balance date has been determined by assuming that the future experience for each current claim is consistent with historical claim information since the commencement of the programme. The liability for injuries or illnesses that have occurred up to balance date, but not yet reported or not fully reported, has been determined by reference to historical information of the time it takes to report injury or illness.
The value of the liability is measured at the present value of the future payments for which the University has responsibility using a risk free discount rate. The value of the liability includes a risk margin that represents the inherent uncertainty of the present value of the expected future payments. No allowance has been made in the financial statements for an ACC liability, as it is deemed to be immaterial.
18. Superannuation SchemesDefined contribution schemes: Obligations for contributions to defined contribution superannuation schemes are recognised as an expense in the statement of financial performance.
Defined benefit schemes: The University belongs to the Government Superannuation Fund and the NPFDB scheme which are Defined Benefit Plan Contribution Schemes. The University has no underwriting responsibilities as any shortfall is met by the Government. As such, the schemes are accounted for as defined contribution plans. (Refer Note 12)
19. Critical Accounting Estimates and AssumptionsIn preparing these financial statements the University has made estimates and assumptions concerning the future. These estimates and assumptions may differ from the subsequent actual results. Estimates and judgements are continually evaluated and are based on historical experience and other factors, including expectations or future events that are believed to be reasonable under the circumstances.
20. Prior Period Comparatives: Where necessary prior period comparatives have been restated in line with current year’s reporting.
CHANGES IN ACCOUNTING POLICIES
All accounting policies have been applied on a basis consistent with the previous year.
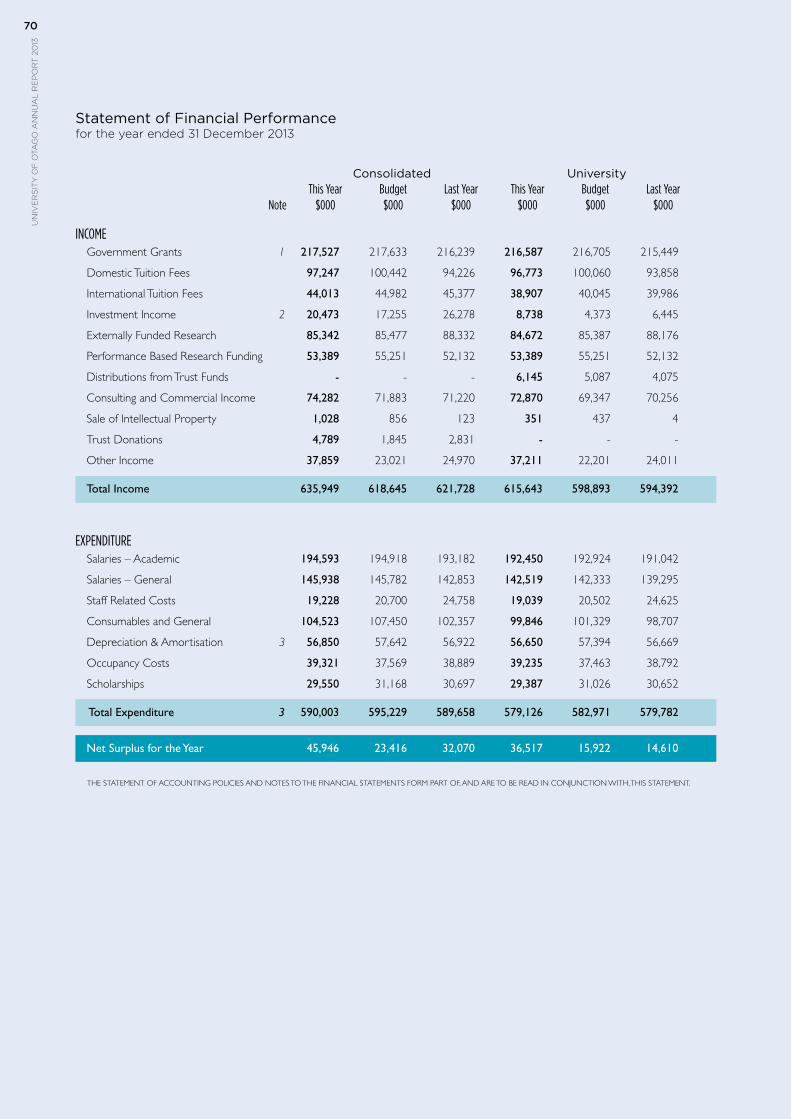
un
ive
rs
ity
of
ota
go
an
nu
al
re
po
rt
20
1370
un
ive
rs
ity
of
ota
go
an
nu
al
re
po
rt
20
1370
Consolidated University This Year Budget Last Year This Year Budget Last Year Note $000 $000 $000 $000 $000 $000
INCOME
Government Grants 1 217,527 217,633 216,239 216,587 216,705 215,449
Domestic Tuition Fees 97,247 100,442 94,226 96,773 100,060 93,858
International Tuition Fees 44,013 44,982 45,377 38,907 40,045 39,986
Investment Income 2 20,473 17,255 26,278 8,738 4,373 6,445
Externally Funded Research 85,342 85,477 88,332 84,672 85,387 88,176
Performance Based Research Funding 53,389 55,251 52,132 53,389 55,251 52,132
Distributions from Trust Funds - - - 6,145 5,087 4,075
Consulting and Commercial Income 74,282 71,883 71,220 72,870 69,347 70,256
Sale of Intellectual Property 1,028 856 123 351 437 4
Trust Donations 4,789 1,845 2,831 - - -
Other Income 37,859 23,021 24,970 37,211 22,201 24,011
Total Income 635,949 618,645 621,728 615,643 598,893 594,392
EXPENDITURE Salaries – Academic 194,593 194,918 193,182 192,450 192,924 191,042
Salaries – General 145,938 145,782 142,853 142,519 142,333 139,295
Staff Related Costs 19,228 20,700 24,758 19,039 20,502 24,625
Consumables and General 104,523 107,450 102,357 99,846 101,329 98,707
Depreciation & Amortisation 3 56,850 57,642 56,922 56,650 57,394 56,669
Occupancy Costs 39,321 37,569 38,889 39,235 37,463 38,792
Scholarships 29,550 31,168 30,697 29,387 31,026 30,652
Total Expenditure 3 590,003 595,229 589,658 579,126 582,971 579,782
Net Surplus for the Year 45,946 23,416 32,070 36,517 15,922 14,610
THE STATEMENT OF ACCOUNTING POLICIES AND NOTES TO THE FINANCIAL STATEMENTS FORM PART OF, AND ARE TO BE READ IN CONJUNCTION WITH, THIS STATEMENT.
Statement of Financial Performancefor the year ended 31 December 2013
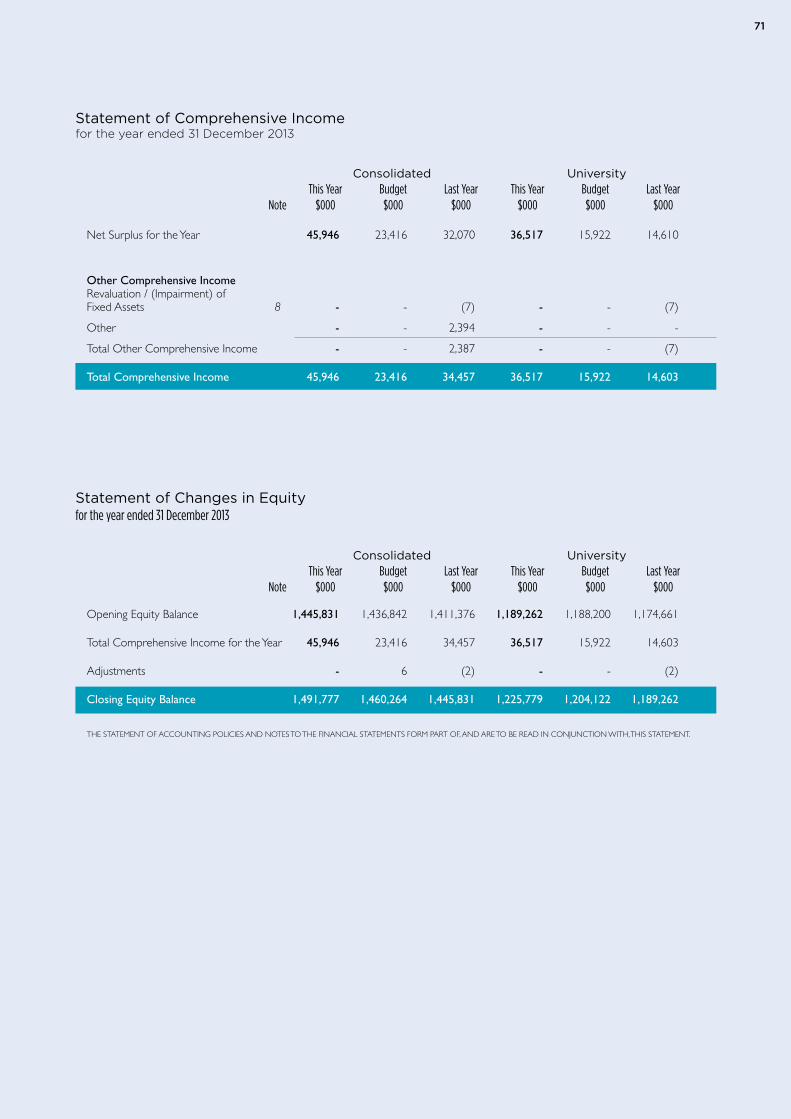
7171
Consolidated University This Year Budget Last Year This Year Budget Last Year Note $000 $000 $000 $000 $000 $000
Net Surplus for the Year 45,946 23,416 32,070 36,517 15,922 14,610
Other Comprehensive Income Revaluation / (Impairment) of Fixed Assets 8 - - (7) - - (7)
Other - - 2,394 - - -
Total Other Comprehensive Income - - 2,387 - - (7)
Total Comprehensive Income 45,946 23,416 34,457 36,517 15,922 14,603
Statement of Changes in Equityfor the year ended 31 December 2013
Consolidated University This Year Budget Last Year This Year Budget Last Year Note $000 $000 $000 $000 $000 $000 Opening Equity Balance 1,445,831 1,436,842 1,411,376 1,189,262 1,188,200 1,174,661
Total Comprehensive Income for the Year 45,946 23,416 34,457 36,517 15,922 14,603
Adjustments - 6 (2) - - (2)
Closing Equity Balance 1,491,777 1,460,264 1,445,831 1,225,779 1,204,122 1,189,262
THE STATEMENT OF ACCOUNTING POLICIES AND NOTES TO THE FINANCIAL STATEMENTS FORM PART OF, AND ARE TO BE READ IN CONJUNCTION WITH, THIS STATEMENT.
Statement of Comprehensive Incomefor the year ended 31 December 2013
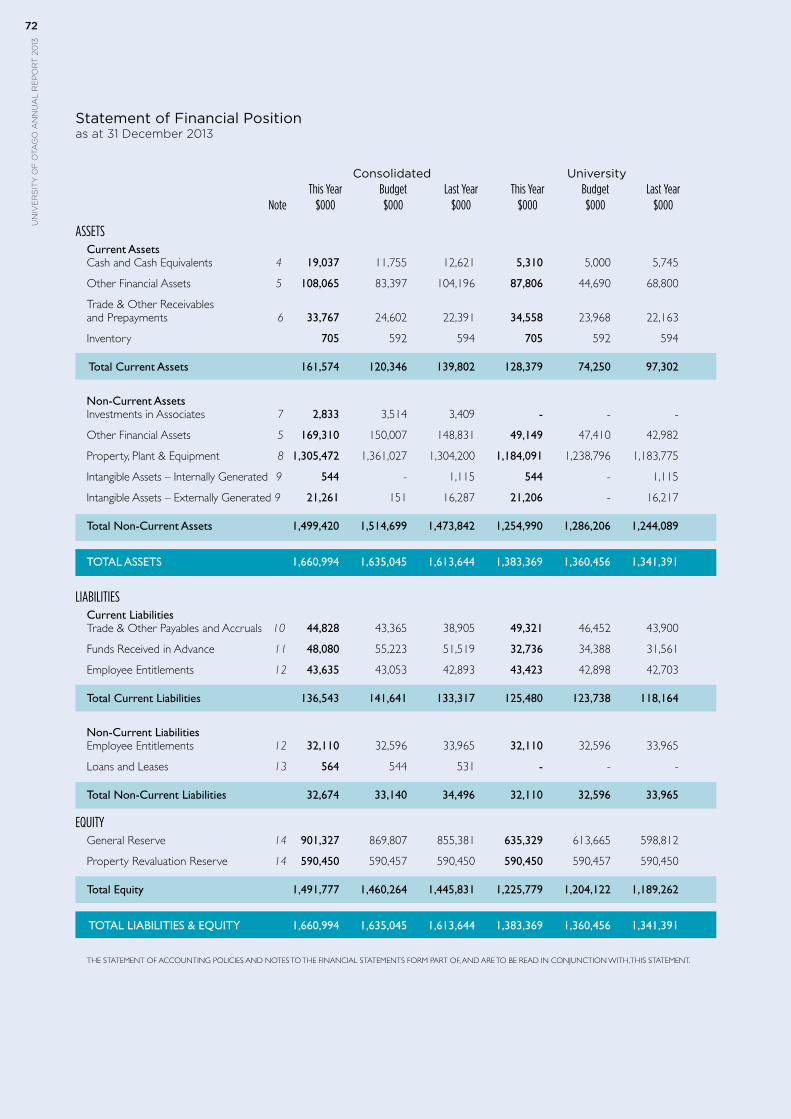
un
ive
rs
ity
of
ota
go
an
nu
al
re
po
rt
20
1372
un
ive
rs
ity
of
ota
go
an
nu
al
re
po
rt
20
1372
Statement of Financial Positionas at 31 December 2013
Consolidated University This Year Budget Last Year This Year Budget Last Year Note $000 $000 $000 $000 $000 $000
ASSETS
Current Assets Cash and Cash Equivalents 4 19,037 11,755 12,621 5,310 5,000 5,745
Other Financial Assets 5 108,065 83,397 104,196 87,806 44,690 68,800
Trade & Other Receivables and Prepayments 6 33,767 24,602 22,391 34,558 23,968 22,163
Inventory 705 592 594 705 592 594
Total Current Assets 161,574 120,346 139,802 128,379 74,250 97,302
Non-Current Assets Investments in Associates 7 2,833 3,514 3,409 - - -
Other Financial Assets 5 169,310 150,007 148,831 49,149 47,410 42,982
Property, Plant & Equipment 8 1,305,472 1,361,027 1,304,200 1,184,091 1,238,796 1,183,775
Intangible Assets – Internally Generated 9 544 - 1,115 544 - 1,115
Intangible Assets – Externally Generated 9 21,261 151 16,287 21,206 - 16,217
Total Non-Current Assets 1,499,420 1,514,699 1,473,842 1,254,990 1,286,206 1,244,089
TOTAL ASSETS 1,660,994 1,635,045 1,613,644 1,383,369 1,360,456 1,341,391
LIABILITIESCurrent Liabilities Trade & Other Payables and Accruals 10 44,828 43,365 38,905 49,321 46,452 43,900
Funds Received in Advance 11 48,080 55,223 51,519 32,736 34,388 31,561
Employee Entitlements 12 43,635 43,053 42,893 43,423 42,898 42,703
Total Current Liabilities 136,543 141,641 133,317 125,480 123,738 118,164
Non-Current Liabilities Employee Entitlements 12 32,110 32,596 33,965 32,110 32,596 33,965
Loans and Leases 13 564 544 531 - - -
Total Non-Current Liabilities 32,674 33,140 34,496 32,110 32,596 33,965
EQUITY General Reserve 14 901,327 869,807 855,381 635,329 613,665 598,812
Property Revaluation Reserve 14 590,450 590,457 590,450 590,450 590,457 590,450
Total Equity 1,491,777 1,460,264 1,445,831 1,225,779 1,204,122 1,189,262
TOTAL LIABILITIES & EQUITY 1,660,994 1,635,045 1,613,644 1,383,369 1,360,456 1,341,391
THE STATEMENT OF ACCOUNTING POLICIES AND NOTES TO THE FINANCIAL STATEMENTS FORM PART OF, AND ARE TO BE READ IN CONJUNCTION WITH, THIS STATEMENT.
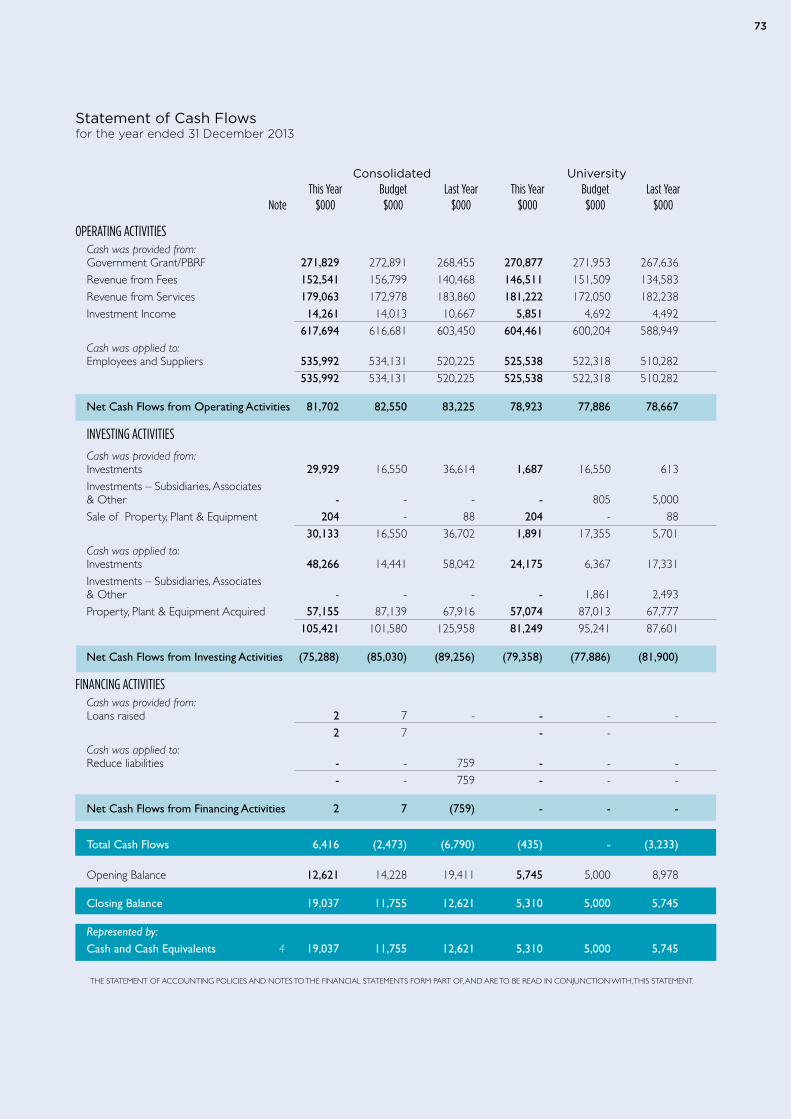
7373
Consolidated University This Year Budget Last Year This Year Budget Last Year Note $000 $000 $000 $000 $000 $000
OPERATING ACTIVITIESCash was provided from: Government Grant/PBRF 271,829 272,891 268,455 270,877 271,953 267,636 Revenue from Fees 152,541 156,799 140,468 146,511 151,509 134,583 Revenue from Services 179,063 172,978 183,860 181,222 172,050 182,238 Investment Income 14,261 14,013 10,667 5,851 4,692 4,492 617,694 616,681 603,450 604,461 600,204 588,949 Cash was applied to: Employees and Suppliers 535,992 534,131 520,225 525,538 522,318 510,282 535,992 534,131 520,225 525,538 522,318 510,282
Net Cash Flows from Operating Activities 81,702 82,550 83,225 78,923 77,886 78,667
INVESTING ACTIVITIES
Cash was provided from: Investments 29,929 16,550 36,614 1,687 16,550 613 Investments – Subsidiaries, Associates & Other - - - - 805 5,000 Sale of Property, Plant & Equipment 204 - 88 204 - 88 30,133 16,550 36,702 1,891 17,355 5,701 Cash was applied to: Investments 48,266 14,441 58,042 24,175 6,367 17,331 Investments – Subsidiaries, Associates & Other - - - - 1,861 2,493 Property, Plant & Equipment Acquired 57,155 87,139 67,916 57,074 87,013 67,777 105,421 101,580 125,958 81,249 95,241 87,601
Net Cash Flows from Investing Activities (75,288) (85,030) (89,256) (79,358) (77,886) (81,900)
FINANCING ACTIVITIES Cash was provided from: Loans raised 2 7 - - - - 2 7 - - Cash was applied to: Reduce liabilities - - 759 - - - - - 759 - - -
Net Cash Flows from Financing Activities 2 7 (759) - - -
Total Cash Flows 6,416 (2,473) (6,790) (435) - (3,233) Opening Balance 12,621 14,228 19,411 5,745 5,000 8,978
Closing Balance 19,037 11,755 12,621 5,310 5,000 5,745
Represented by: Cash and Cash Equivalents 4 19,037 11,755 12,621 5,310 5,000 5,745
THE STATEMENT OF ACCOUNTING POLICIES AND NOTES TO THE FINANCIAL STATEMENTS FORM PART OF, AND ARE TO BE READ IN CONJUNCTION WITH, THIS STATEMENT.
Statement of Cash Flowsfor the year ended 31 December 2013
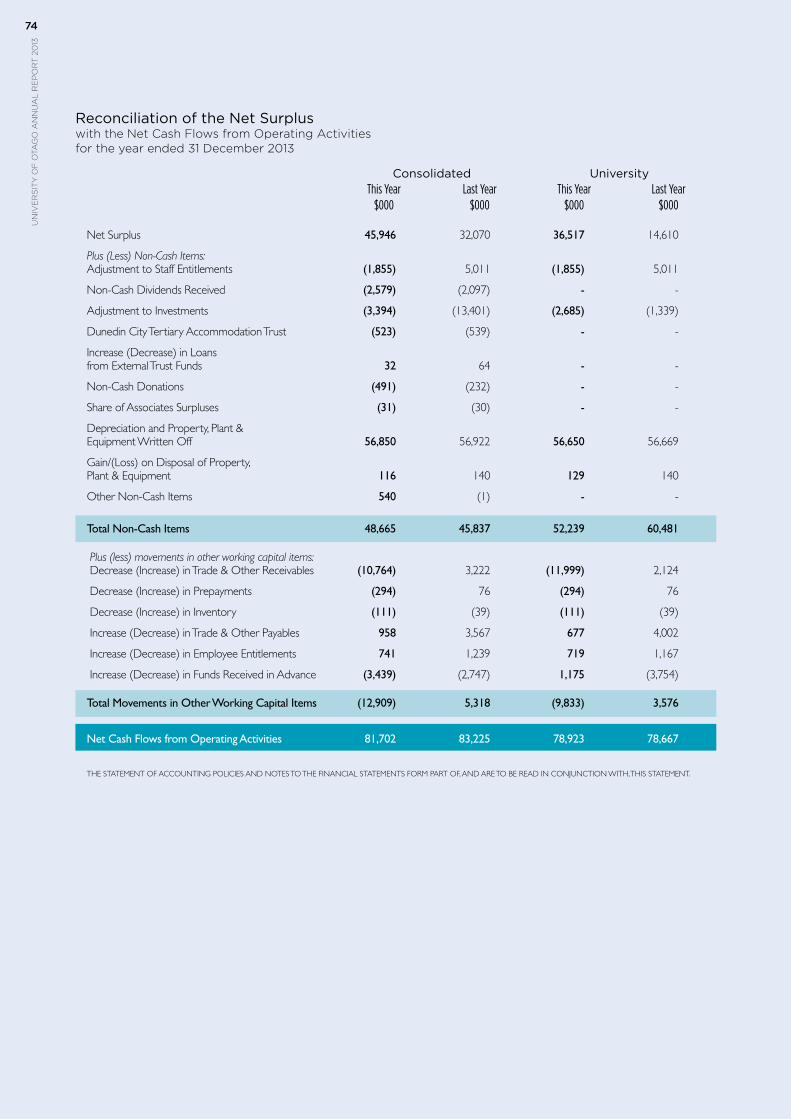
un
ive
rs
ity
of
ota
go
an
nu
al
re
po
rt
20
1374
un
ive
rs
ity
of
ota
go
an
nu
al
re
po
rt
20
1374
Consolidated University This Year Last Year This Year Last Year $000 $000 $000 $000
Net Surplus 45,946 32,070 36,517 14,610
Plus (Less) Non-Cash Items: Adjustment to Staff Entitlements (1,855) 5,011 (1,855) 5,011
Non-Cash Dividends Received (2,579) (2,097) - -
Adjustment to Investments (3,394) (13,401) (2,685) (1,339)
Dunedin City Tertiary Accommodation Trust (523) (539) - -
Increase (Decrease) in Loans from External Trust Funds 32 64 - -
Non-Cash Donations (491) (232) - -
Share of Associates Surpluses (31) (30) - -
Depreciation and Property, Plant & Equipment Written Off 56,850 56,922 56,650 56,669
Gain/(Loss) on Disposal of Property, Plant & Equipment 116 140 129 140
Other Non-Cash Items 540 (1) - -
Total Non-Cash Items 48,665 45,837 52,239 60,481
Plus (less) movements in other working capital items: Decrease (Increase) in Trade & Other Receivables (10,764) 3,222 (11,999) 2,124
Decrease (Increase) in Prepayments (294) 76 (294) 76
Decrease (Increase) in Inventory (111) (39) (111) (39)
Increase (Decrease) in Trade & Other Payables 958 3,567 677 4,002
Increase (Decrease) in Employee Entitlements 741 1,239 719 1,167
Increase (Decrease) in Funds Received in Advance (3,439) (2,747) 1,175 (3,754)
Total Movements in Other Working Capital Items (12,909) 5,318 (9,833) 3,576
Net Cash Flows from Operating Activities 81,702 83,225 78,923 78,667
THE STATEMENT OF ACCOUNTING POLICIES AND NOTES TO THE FINANCIAL STATEMENTS FORM PART OF, AND ARE TO BE READ IN CONJUNCTION WITH, THIS STATEMENT.
Reconciliation of the Net Surpluswith the Net Cash Flows from Operating Activitiesfor the year ended 31 December 2013
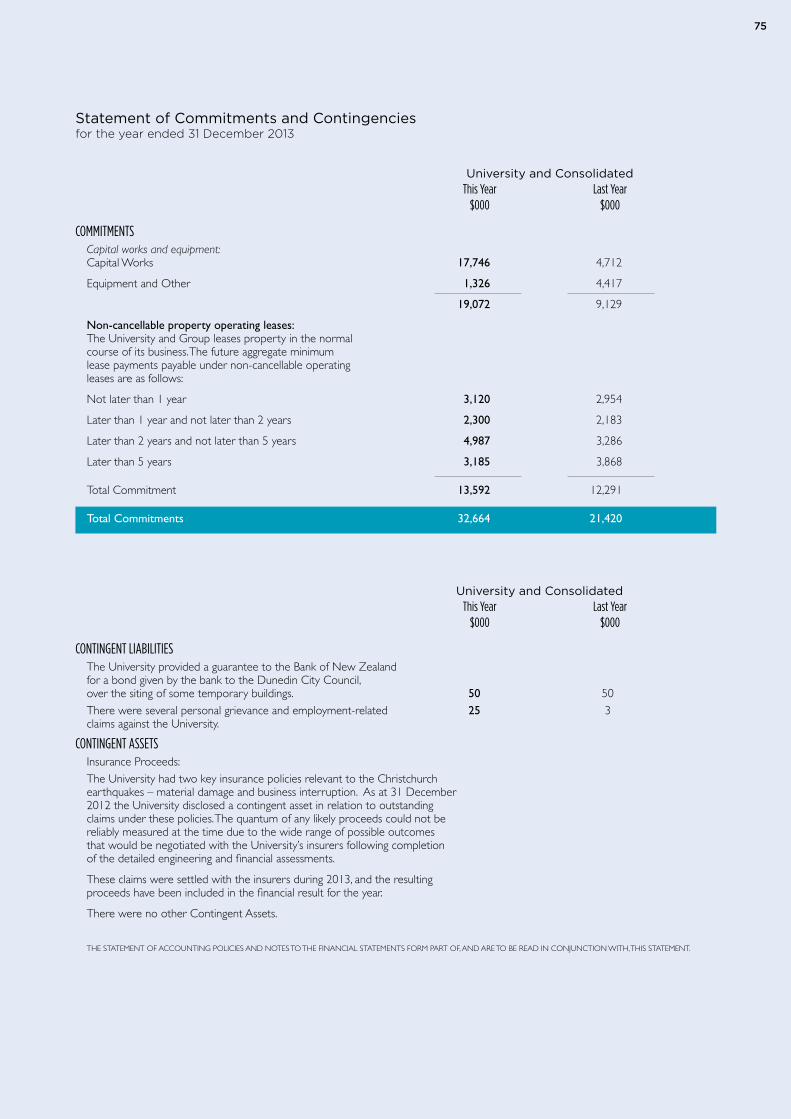
7575
University and Consolidated This Year Last Year $000 $000
COMMITMENTS Capital works and equipment:Capital Works 17,746 4,712
Equipment and Other 1,326 4,417
19,072 9,129
Non-cancellable property operating leases:The University and Group leases property in the normal course of its business. The future aggregate minimum lease payments payable under non-cancellable operating leases are as follows:
Not later than 1 year 3,120 2,954
Later than 1 year and not later than 2 years 2,300 2,183
Later than 2 years and not later than 5 years 4,987 3,286
Later than 5 years 3,185 3,868
Total Commitment 13,592 12,291
Total Commitments 32,664 21,420
University and Consolidated This Year Last Year $000 $000
CONTINGENT LIABILITIES The University provided a guarantee to the Bank of New Zealand for a bond given by the bank to the Dunedin City Council, over the siting of some temporary buildings. 50 50 There were several personal grievance and employment-related 25 3 claims against the University.
CONTINGENT ASSETS Insurance Proceeds: The University had two key insurance policies relevant to the Christchurch earthquakes – material damage and business interruption. As at 31 December 2012 the University disclosed a contingent asset in relation to outstanding claims under these policies. The quantum of any likely proceeds could not be reliably measured at the time due to the wide range of possible outcomes that would be negotiated with the University’s insurers following completion of the detailed engineering and financial assessments.
These claims were settled with the insurers during 2013, and the resulting proceeds have been included in the financial result for the year.
There were no other Contingent Assets.
THE STATEMENT OF ACCOUNTING POLICIES AND NOTES TO THE FINANCIAL STATEMENTS FORM PART OF, AND ARE TO BE READ IN CONJUNCTION WITH, THIS STATEMENT.
Statement of Commitments and Contingenciesfor the year ended 31 December 2013
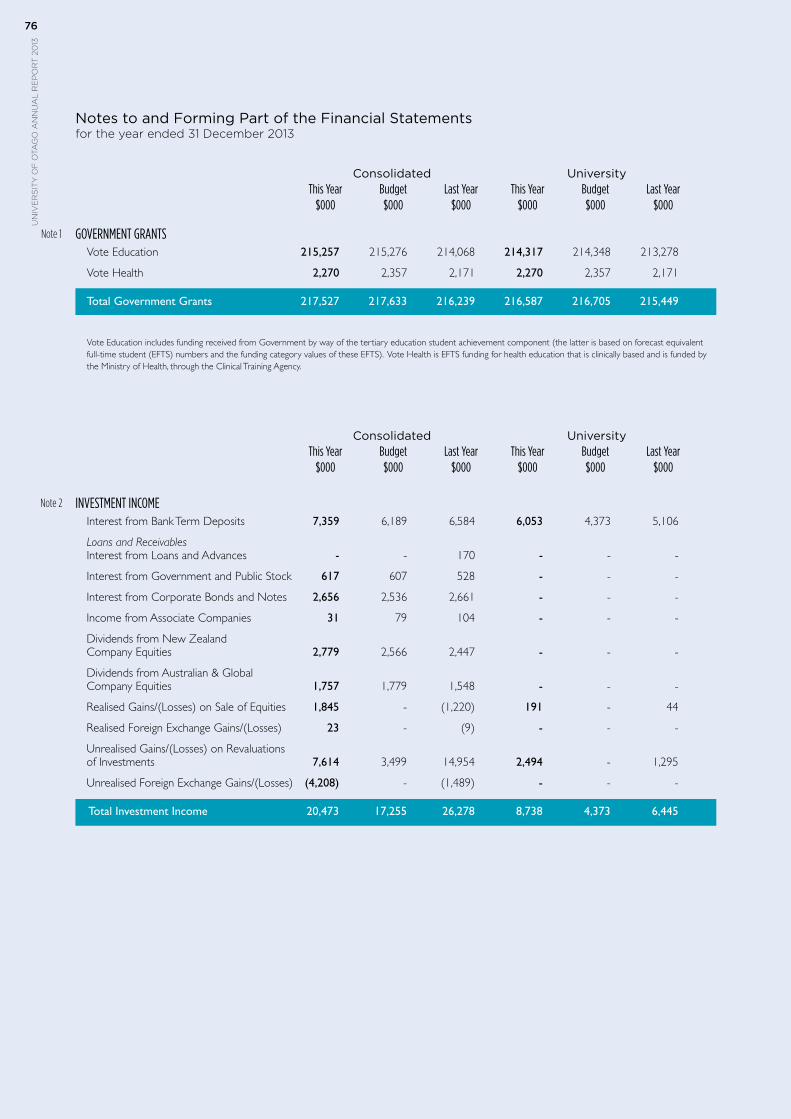
un
ive
rs
ity
of
ota
go
an
nu
al
re
po
rt
20
1376
un
ive
rs
ity
of
ota
go
an
nu
al
re
po
rt
20
1376
Consolidated University This Year Budget Last Year This Year Budget Last Year $000 $000 $000 $000 $000 $000
GOVERNMENT GRANTS Vote Education 215,257 215,276 214,068 214,317 214,348 213,278
Vote Health 2,270 2,357 2,171 2,270 2,357 2,171
Total Government Grants 217,527 217,633 216,239 216,587 216,705 215,449
Vote Education includes funding received from Government by way of the tertiary education student achievement component (the latter is based on forecast equivalent full-time student (EFTS) numbers and the funding category values of these EFTS). Vote Health is EFTS funding for health education that is clinically based and is funded by the Ministry of Health, through the Clinical Training Agency.
Consolidated University This Year Budget Last Year This Year Budget Last Year $000 $000 $000 $000 $000 $000
INVESTMENT INCOME Interest from Bank Term Deposits 7,359 6,189 6,584 6,053 4,373 5,106
Loans and Receivables Interest from Loans and Advances - - 170 - - -
Interest from Government and Public Stock 617 607 528 - - -
Interest from Corporate Bonds and Notes 2,656 2,536 2,661 - - -
Income from Associate Companies 31 79 104 - - -
Dividends from New Zealand Company Equities 2,779 2,566 2,447 - - -
Dividends from Australian & Global Company Equities 1,757 1,779 1,548 - - -
Realised Gains/(Losses) on Sale of Equities 1,845 - (1,220) 191 - 44
Realised Foreign Exchange Gains/(Losses) 23 - (9) - - -
Unrealised Gains/(Losses) on Revaluations of Investments 7,614 3,499 14,954 2,494 - 1,295
Unrealised Foreign Exchange Gains/(Losses) (4,208) - (1,489) - - -
Total Investment Income 20,473 17,255 26,278 8,738 4,373 6,445
Note 1
Note 2
Notes to and Forming Part of the Financial Statementsfor the year ended 31 December 2013
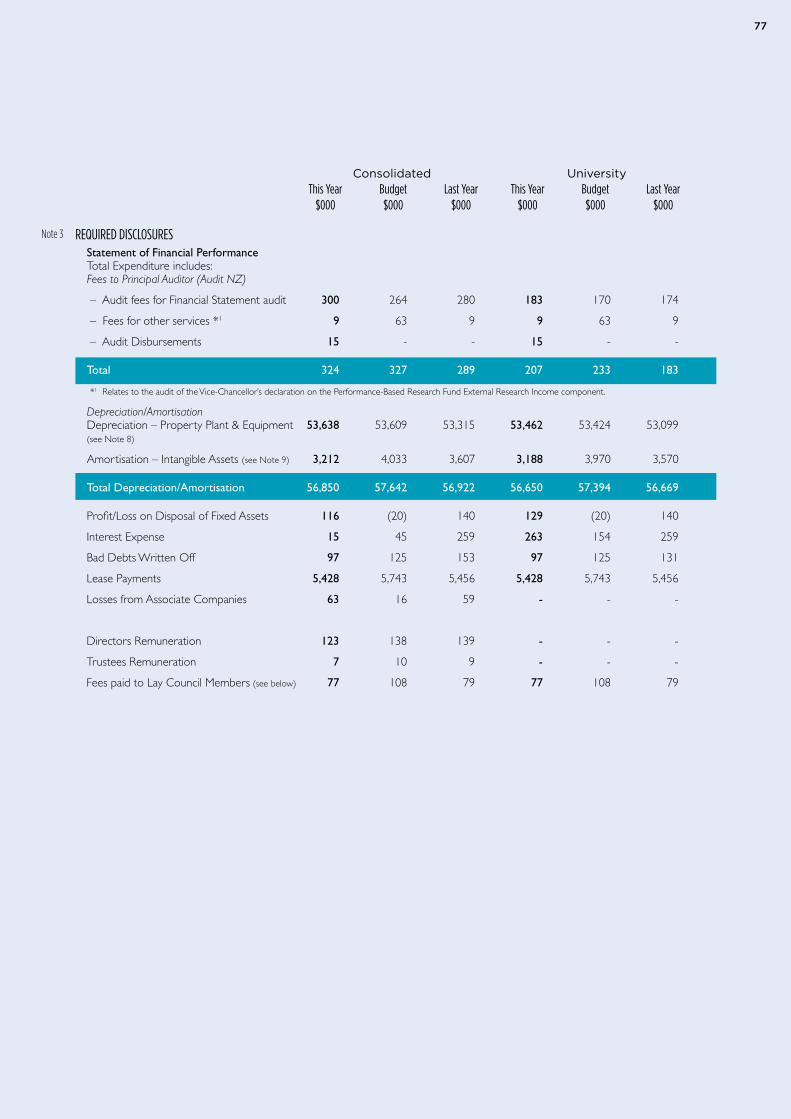
7777
Note 3
Consolidated University This Year Budget Last Year This Year Budget Last Year $000 $000 $000 $000 $000 $000
REQUIRED DISCLOSURES Statement of Financial PerformanceTotal Expenditure includes:Fees to Principal Auditor (Audit NZ)
– Audit fees for Financial Statement audit 300 264 280 183 170 174
– Fees for other services *1 9 63 9 9 63 9
– Audit Disbursements 15 - - 15 - -
Total 324 327 289 207 233 183
*1 Relates to the audit of the Vice-Chancellor’s declaration on the Performance-Based Research Fund External Research Income component.
Depreciation/Amortisation Depreciation – Property Plant & Equipment 53,638 53,609 53,315 53,462 53,424 53,099 (see Note 8)
Amortisation – Intangible Assets (see Note 9) 3,212 4,033 3,607 3,188 3,970 3,570
Total Depreciation/Amortisation 56,850 57,642 56,922 56,650 57,394 56,669
Profit/Loss on Disposal of Fixed Assets 116 (20) 140 129 (20) 140
Interest Expense 15 45 259 263 154 259
Bad Debts Written Off 97 125 153 97 125 131
Lease Payments 5,428 5,743 5,456 5,428 5,743 5,456
Losses from Associate Companies 63 16 59 - - -
Directors Remuneration 123 138 139 - - -
Trustees Remuneration 7 10 9 - - -
Fees paid to Lay Council Members (see below) 77 108 79 77 108 79
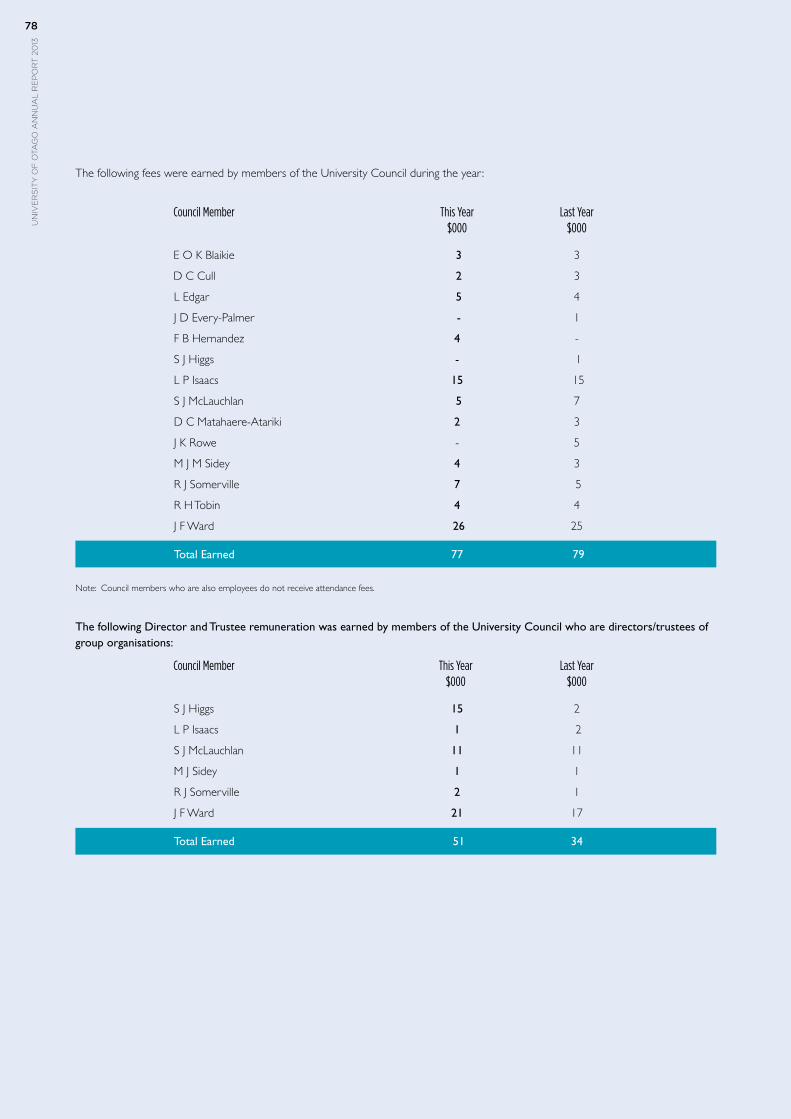
un
ive
rs
ity
of
ota
go
an
nu
al
re
po
rt
20
1378
un
ive
rs
ity
of
ota
go
an
nu
al
re
po
rt
20
1378
The following fees were earned by members of the University Council during the year :
Council Member This Year Last Year $000 $000
E O K Blaikie 3 3
D C Cull 2 3
L Edgar 5 4
J D Every-Palmer - 1
F B Hernandez 4 -
S J Higgs - 1
L P Isaacs 15 15
S J McLauchlan 5 7
D C Matahaere-Atariki 2 3
J K Rowe - 5
M J M Sidey 4 3
R J Somerville 7 5
R H Tobin 4 4
J F Ward 26 25
Total Earned 77 79
Note: Council members who are also employees do not receive attendance fees.
The following Director and Trustee remuneration was earned by members of the University Council who are directors/trustees of group organisations:
Council Member This Year Last Year $000 $000 S J Higgs 15 2
L P Isaacs 1 2
S J McLauchlan 11 11
M J Sidey 1 1
R J Somerville 2 1
J F Ward 21 17
Total Earned 51 34
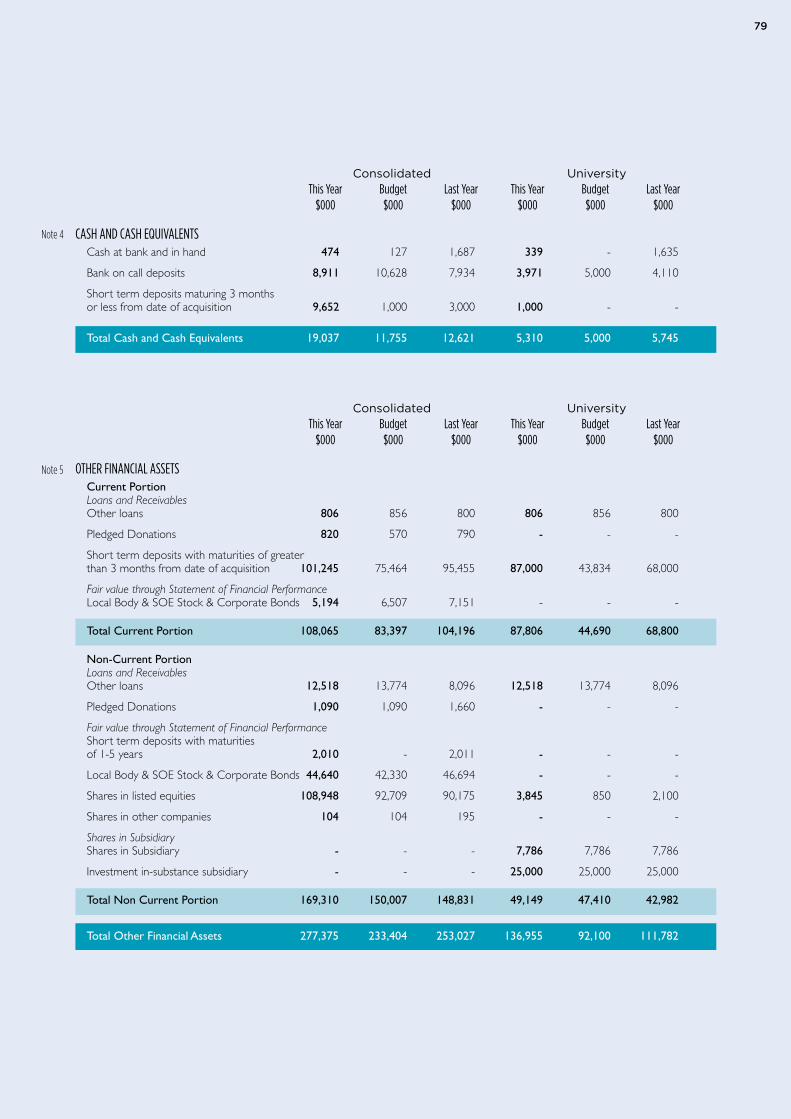
7979
Consolidated University This Year Budget Last Year This Year Budget Last Year $000 $000 $000 $000 $000 $000
CASH AND CASH EQUIVALENTS Cash at bank and in hand 474 127 1,687 339 - 1,635
Bank on call deposits 8,911 10,628 7,934 3,971 5,000 4,110
Short term deposits maturing 3 months or less from date of acquisition 9,652 1,000 3,000 1,000 - -
Total Cash and Cash Equivalents 19,037 11,755 12,621 5,310 5,000 5,745
Consolidated University This Year Budget Last Year This Year Budget Last Year $000 $000 $000 $000 $000 $000
OTHER FINANCIAL ASSETS Current Portion Loans and ReceivablesOther loans 806 856 800 806 856 800
Pledged Donations 820 570 790 - - -
Short term deposits with maturities of greater than 3 months from date of acquisition 101,245 75,464 95,455 87,000 43,834 68,000
Fair value through Statement of Financial Performance Local Body & SOE Stock & Corporate Bonds 5,194 6,507 7,151 - - -
Total Current Portion 108,065 83,397 104,196 87,806 44,690 68,800
Non-Current PortionLoans and ReceivablesOther loans 12,518 13,774 8,096 12,518 13,774 8,096
Pledged Donations 1,090 1,090 1,660 - - -
Fair value through Statement of Financial Performance Short term deposits with maturities of 1-5 years 2,010 - 2,011 - - -
Local Body & SOE Stock & Corporate Bonds 44,640 42,330 46,694 - - -
Shares in listed equities 108,948 92,709 90,175 3,845 850 2,100
Shares in other companies 104 104 195 - - -
Shares in Subsidiary Shares in Subsidiary - - - 7,786 7,786 7,786
Investment in-substance subsidiary - - - 25,000 25,000 25,000
Total Non Current Portion 169,310 150,007 148,831 49,149 47,410 42,982
Total Other Financial Assets 277,375 233,404 253,027 136,955 92,100 111,782
Note 4
Note 5
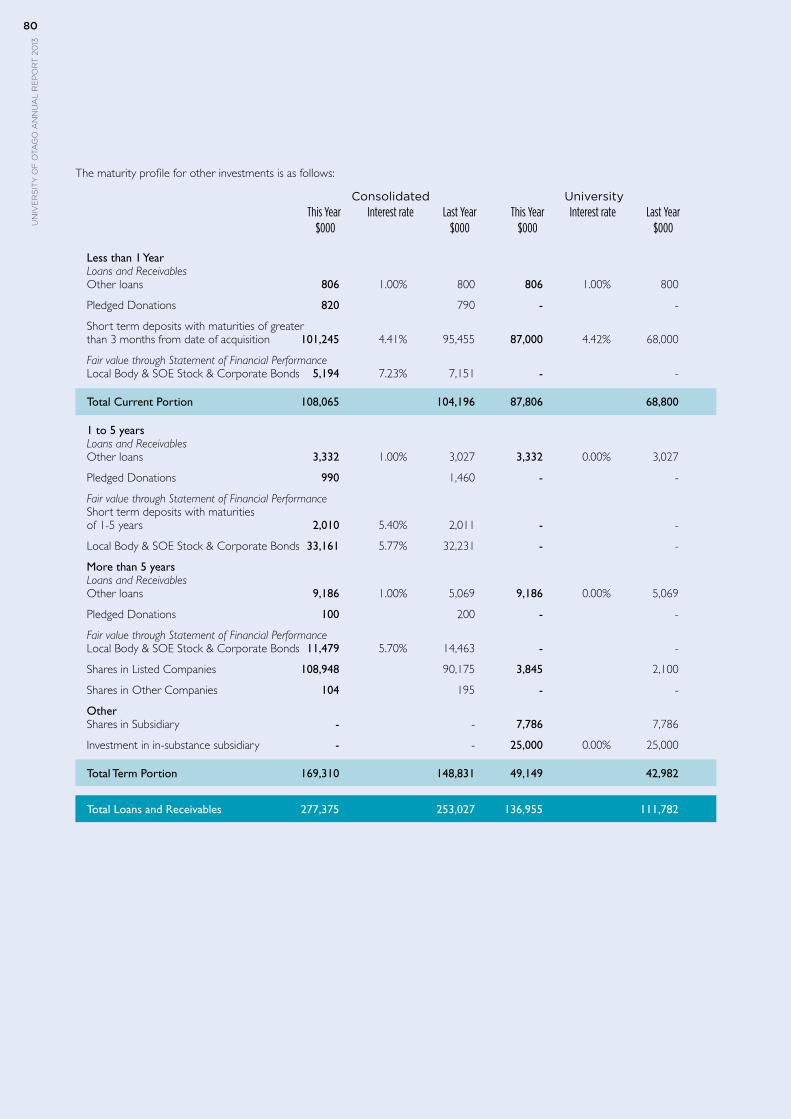
un
ive
rs
ity
of
ota
go
an
nu
al
re
po
rt
20
1380
un
ive
rs
ity
of
ota
go
an
nu
al
re
po
rt
20
1380
The maturity profile for other investments is as follows:
Consolidated University This Year Interest rate Last Year This Year Interest rate Last Year $000 $000 $000 $000
Less than 1 Year Loans and Receivables Other loans 806 1.00% 800 806 1.00% 800
Pledged Donations 820 790 - -
Short term deposits with maturities of greater than 3 months from date of acquisition 101,245 4.41% 95,455 87,000 4.42% 68,000
Fair value through Statement of Financial Performance Local Body & SOE Stock & Corporate Bonds 5,194 7.23% 7,151 - -
Total Current Portion 108,065 104,196 87,806 68,800
1 to 5 years Loans and Receivables Other loans 3,332 1.00% 3,027 3,332 0.00% 3,027
Pledged Donations 990 1,460 - -
Fair value through Statement of Financial Performance Short term deposits with maturities of 1-5 years 2,010 5.40% 2,011 - -
Local Body & SOE Stock & Corporate Bonds 33,161 5.77% 32,231 - -
More than 5 years Loans and Receivables Other loans 9,186 1.00% 5,069 9,186 0.00% 5,069
Pledged Donations 100 200 - -
Fair value through Statement of Financial Performance Local Body & SOE Stock & Corporate Bonds 11,479 5.70% 14,463 - -
Shares in Listed Companies 108,948 90,175 3,845 2,100
Shares in Other Companies 104 195 - -
Other Shares in Subsidiary - - 7,786 7,786
Investment in in-substance subsidiary - - 25,000 0.00% 25,000
Total Term Portion 169,310 148,831 49,149 42,982
Total Loans and Receivables 277,375 253,027 136,955 111,782
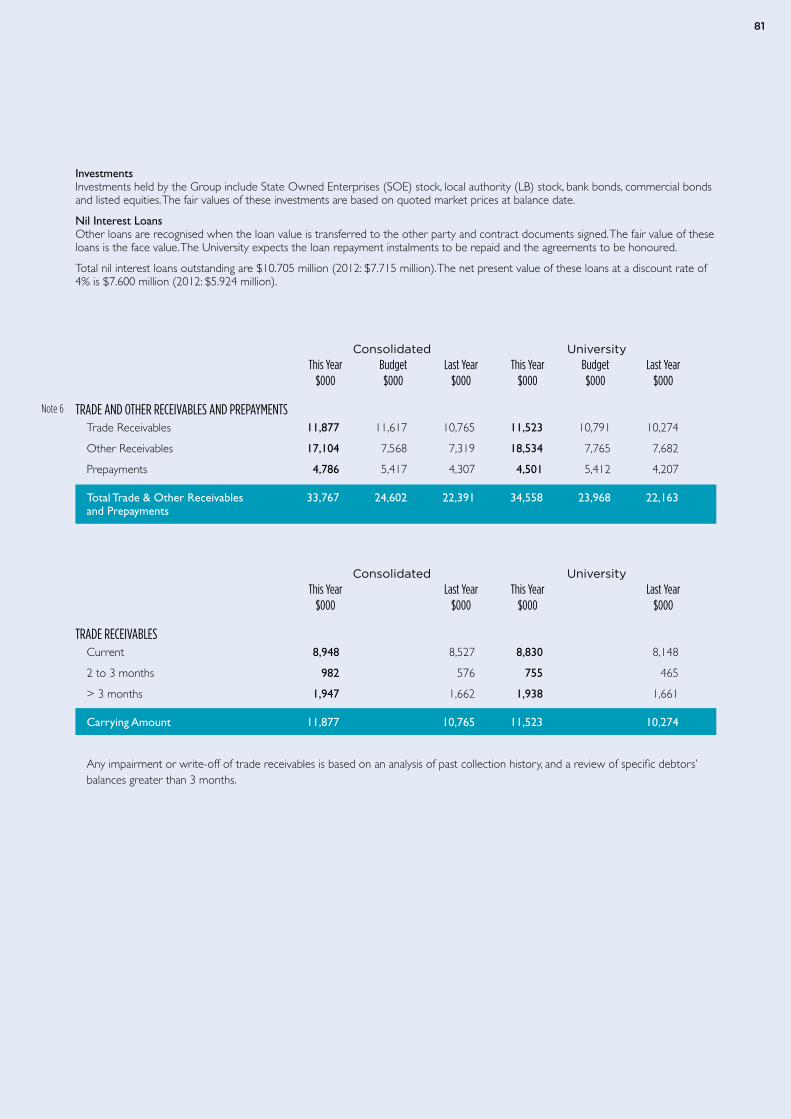
8181
InvestmentsInvestments held by the Group include State Owned Enterprises (SOE) stock, local authority (LB) stock, bank bonds, commercial bonds and listed equities. The fair values of these investments are based on quoted market prices at balance date.
Nil Interest LoansOther loans are recognised when the loan value is transferred to the other party and contract documents signed. The fair value of these loans is the face value. The University expects the loan repayment instalments to be repaid and the agreements to be honoured.
Total nil interest loans outstanding are $10.705 million (2012: $7.715 million). The net present value of these loans at a discount rate of 4% is $7.600 million (2012: $5.924 million).
Consolidated University This Year Budget Last Year This Year Budget Last Year $000 $000 $000 $000 $000 $000
TRADE AND OTHER RECEIVABLES AND PREPAYMENTSTrade Receivables 11,877 11,617 10,765 11,523 10,791 10,274
Other Receivables 17,104 7,568 7,319 18,534 7,765 7,682
Prepayments 4,786 5,417 4,307 4,501 5,412 4,207
Total Trade & Other Receivables 33,767 24,602 22,391 34,558 23,968 22,163 and Prepayments
Consolidated University This Year Last Year This Year Last Year $000 $000 $000 $000
TRADE RECEIVABLES Current 8,948 8,527 8,830 8,148
2 to 3 months 982 576 755 465
> 3 months 1,947 1,662 1,938 1,661
Carrying Amount 11,877 10,765 11,523 10,274
Any impairment or write-off of trade receivables is based on an analysis of past collection history, and a review of specific debtors’ balances greater than 3 months.
Note 6
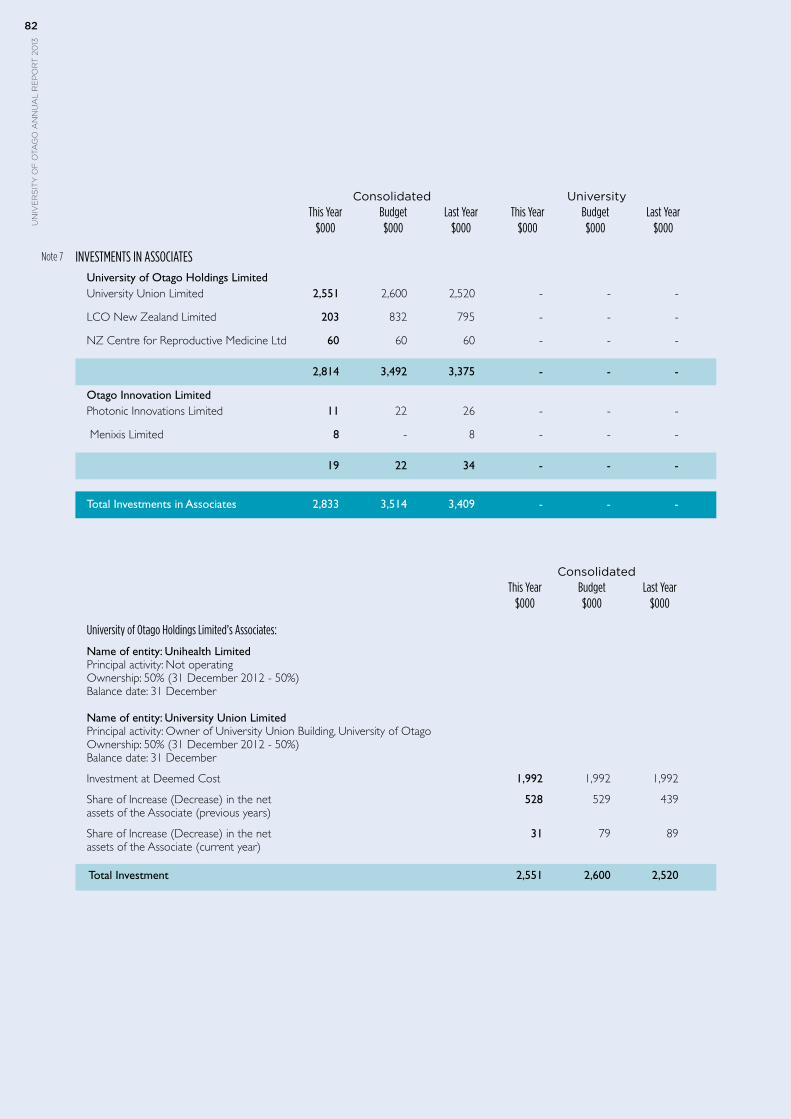
un
ive
rs
ity
of
ota
go
an
nu
al
re
po
rt
20
1382
un
ive
rs
ity
of
ota
go
an
nu
al
re
po
rt
20
1382
Consolidated University This Year Budget Last Year This Year Budget Last Year $000 $000 $000 $000 $000 $000
INVESTMENTS IN ASSOCIATES University of Otago Holdings Limited University Union Limited 2,551 2,600 2,520 - - -
LCO New Zealand Limited 203 832 795 - - -
NZ Centre for Reproductive Medicine Ltd 60 60 60 - - -
2,814 3,492 3,375 - - -
Otago Innovation Limited Photonic Innovations Limited 11 22 26 - - -
Menixis Limited 8 - 8 - - -
19 22 34 - - -
Total Investments in Associates 2,833 3,514 3,409 - - -
Consolidated This Year Budget Last Year $000 $000 $000
University of Otago Holdings Limited’s Associates:
Name of entity: Unihealth Limited Principal activity: Not operating Ownership: 50% (31 December 2012 - 50%) Balance date: 31 December Name of entity: University Union Limited Principal activity: Owner of University Union Building, University of Otago Ownership: 50% (31 December 2012 - 50%) Balance date: 31 December
Investment at Deemed Cost 1,992 1,992 1,992
Share of Increase (Decrease) in the net 528 529 439 assets of the Associate (previous years)
Share of Increase (Decrease) in the net 31 79 89 assets of the Associate (current year)
Total Investment 2,551 2,600 2,520
Note 7
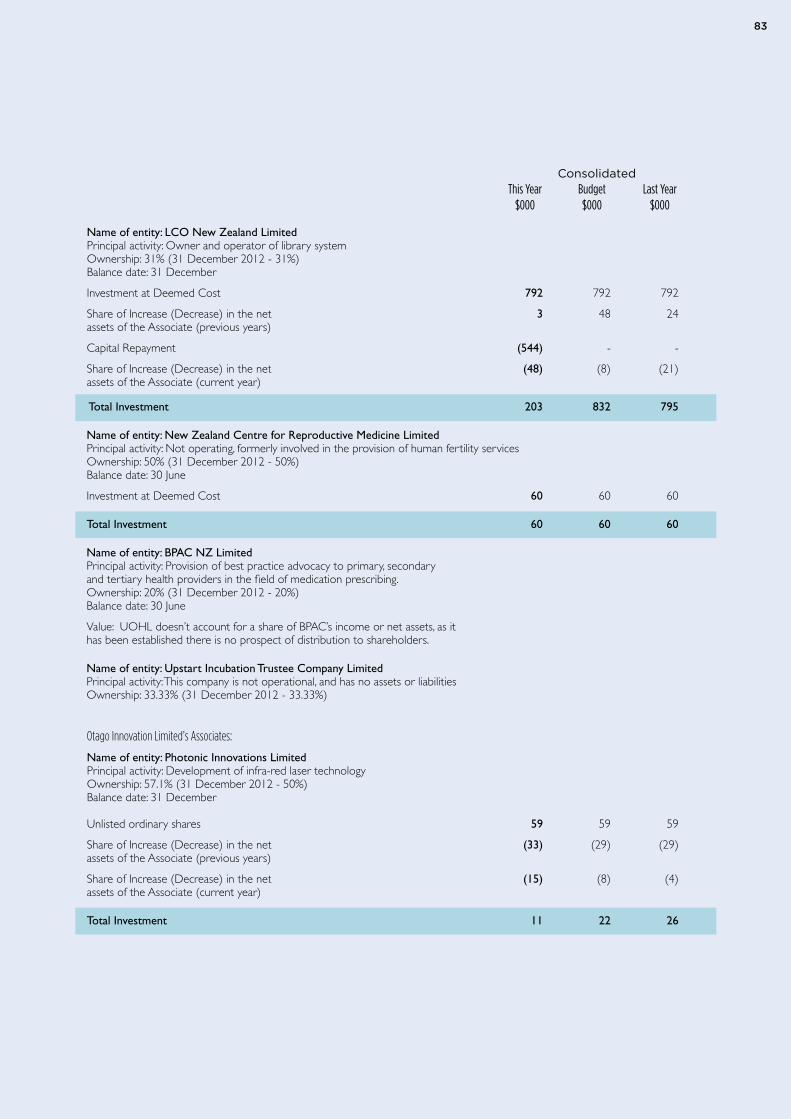
8383
Consolidated This Year Budget Last Year $000 $000 $000
Name of entity: LCO New Zealand Limited Principal activity: Owner and operator of library system Ownership: 31% (31 December 2012 - 31%) Balance date: 31 December
Investment at Deemed Cost 792 792 792
Share of Increase (Decrease) in the net 3 48 24 assets of the Associate (previous years)
Capital Repayment (544) - -
Share of Increase (Decrease) in the net (48) (8) (21)assets of the Associate (current year)
Total Investment 203 832 795
Name of entity: New Zealand Centre for Reproductive Medicine Limited Principal activity: Not operating, formerly involved in the provision of human fertility services Ownership: 50% (31 December 2012 - 50%) Balance date: 30 June
Investment at Deemed Cost 60 60 60
Total Investment 60 60 60
Name of entity: BPAC NZ Limited Principal activity: Provision of best practice advocacy to primary, secondary and tertiary health providers in the field of medication prescribing. Ownership: 20% (31 December 2012 - 20%) Balance date: 30 June
Value: UOHL doesn’t account for a share of BPAC’s income or net assets, as it has been established there is no prospect of distribution to shareholders.
Name of entity: Upstart Incubation Trustee Company Limited Principal activity: This company is not operational, and has no assets or liabilities Ownership: 33.33% (31 December 2012 - 33.33%)
Otago Innovation Limited’s Associates:
Name of entity: Photonic Innovations Limited Principal activity: Development of infra-red laser technology Ownership: 57.1% (31 December 2012 - 50%) Balance date: 31 December Unlisted ordinary shares 59 59 59
Share of Increase (Decrease) in the net (33) (29) (29)assets of the Associate (previous years)
Share of Increase (Decrease) in the net (15) (8) (4)assets of the Associate (current year)
Total Investment 11 22 26
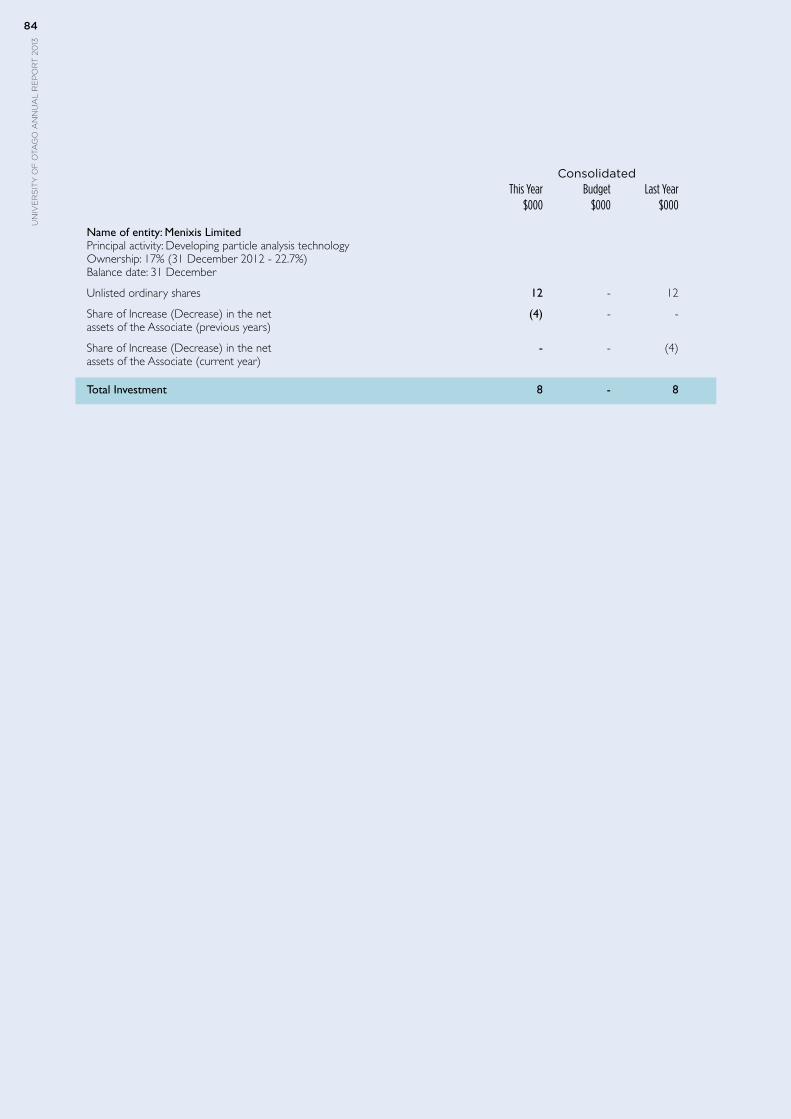
un
ive
rs
ity
of
ota
go
an
nu
al
re
po
rt
20
1384
un
ive
rs
ity
of
ota
go
an
nu
al
re
po
rt
20
1384
Consolidated This Year Budget Last Year $000 $000 $000
Name of entity: Menixis Limited Principal activity: Developing particle analysis technology Ownership: 17% (31 December 2012 - 22.7%) Balance date: 31 December
Unlisted ordinary shares 12 - 12
Share of Increase (Decrease) in the net (4) - - assets of the Associate (previous years)
Share of Increase (Decrease) in the net - - (4)assets of the Associate (current year)
Total Investment 8 - 8
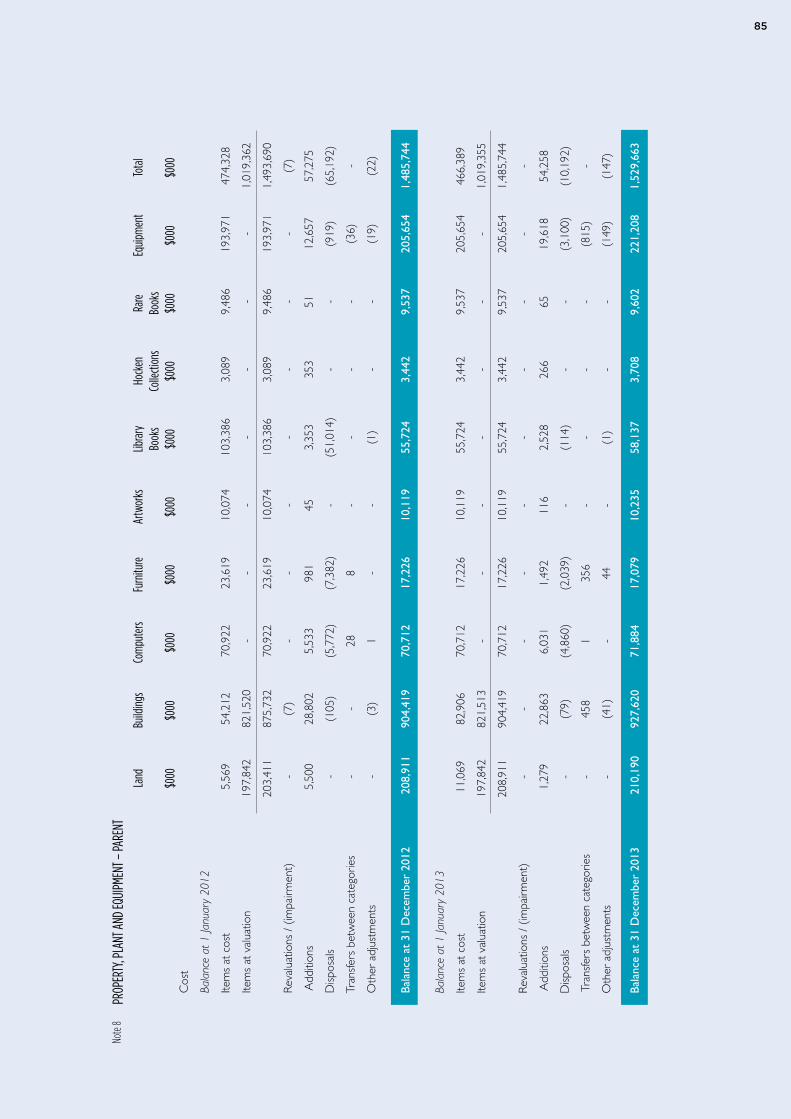
8585
PROP
ERTY
, PLA
NT A
ND EQ
UIPM
ENT –
PARE
NT
La
nd
Build
ings
Com
pute
rs Fu
rnitu
re
Artw
orks
Lib
rary
Ho
cken
Ra
re
Equip
men
t To
tal
Book
s Co
llecti
ons
Book
s
$000
$0
00
$000
$0
00
$000
$0
00
$000
$0
00
$000
$0
00
Cos
t
Bala
nce
at 1
Janu
ary
2012
Item
s at
cos
t
5,5
69
54,
212
7
0,92
2
23,
619
1
0,07
4
103
,386
3
,089
9
,486
1
93,9
71
474
,328
Item
s at
val
uatio
n
197,
842
8
21,5
20
-
-
-
-
-
-
-
1
,019
,362
20
3,41
1
875
,732
7
0,92
2
23,
619
1
0,07
4
103
,386
3
,089
9
,486
1
93,9
71
1,4
93,6
90
Reva
luat
ions
/ (im
pairm
ent)
-
(7)
-
-
-
-
-
-
-
(7)
Add
ition
s
5,5
00
28,
802
5
,533
9
81
45
3
,353
3
53
51
1
2,65
7
57,
275
Disp
osal
s
-
(
105)
(
5,77
2)
(7,
382)
-
(51
,014
) -
-
(
919)
(
65,1
92)
Tran
sfer
s be
twee
n ca
tego
ries
-
-
2
8
8
-
-
-
-
(36
) -
Oth
er a
djus
tmen
ts
-
(
3)
1
-
-
(1)
-
-
(
19)
(22
)
Ba
lanc
e at
31
Dec
embe
r 20
12
208
,911
9
04,4
19
70,
712
1
7,22
6
10,
119
5
5,72
4
3,4
42
9,5
37
205
,654
1
,485
,744
Ba
lanc
e at
1 Ja
nuar
y 20
13
Item
s at
cos
t
11,
069
8
2,90
6
70,
712
1
7,22
6
10,
119
5
5,72
4
3,4
42
9,5
37
205
,654
4
66,3
89
Item
s at
val
uatio
n
197,
842
8
21,5
13
-
-
-
-
-
-
-
1
,019
,355
20
8,91
1
904
,419
7
0,71
2
17,
226
1
0,11
9
55,
724
3
,442
9
,537
2
05,6
54
1,4
85,7
44
Reva
luat
ions
/ (im
pairm
ent)
-
-
-
-
-
-
-
-
-
-
Add
ition
s
1,2
79
22,
863
6
,031
1
,492
1
16
2,5
28
266
6
5
19,
618
5
4,25
8
Disp
osal
s
-
(
79)
(4,
860)
(
2,03
9)
-
(
114)
-
-
(
3,10
0)
(10
,192
)
Tra
nsfe
rs b
etw
een
cate
gorie
s
-
4
58
1
356
-
-
-
-
(
815)
-
Oth
er a
djus
tmen
ts
-
(
41)
-
4
4
-
(
1)
-
-
(14
9)
(14
7)
Bala
nce
at 3
1 D
ecem
ber
2013
2
10,1
90
927
,620
7
1,88
4
17,
079
1
0,23
5
58,
137
3
,708
9
,602
2
21,2
08
1,5
29,6
63
Note
8
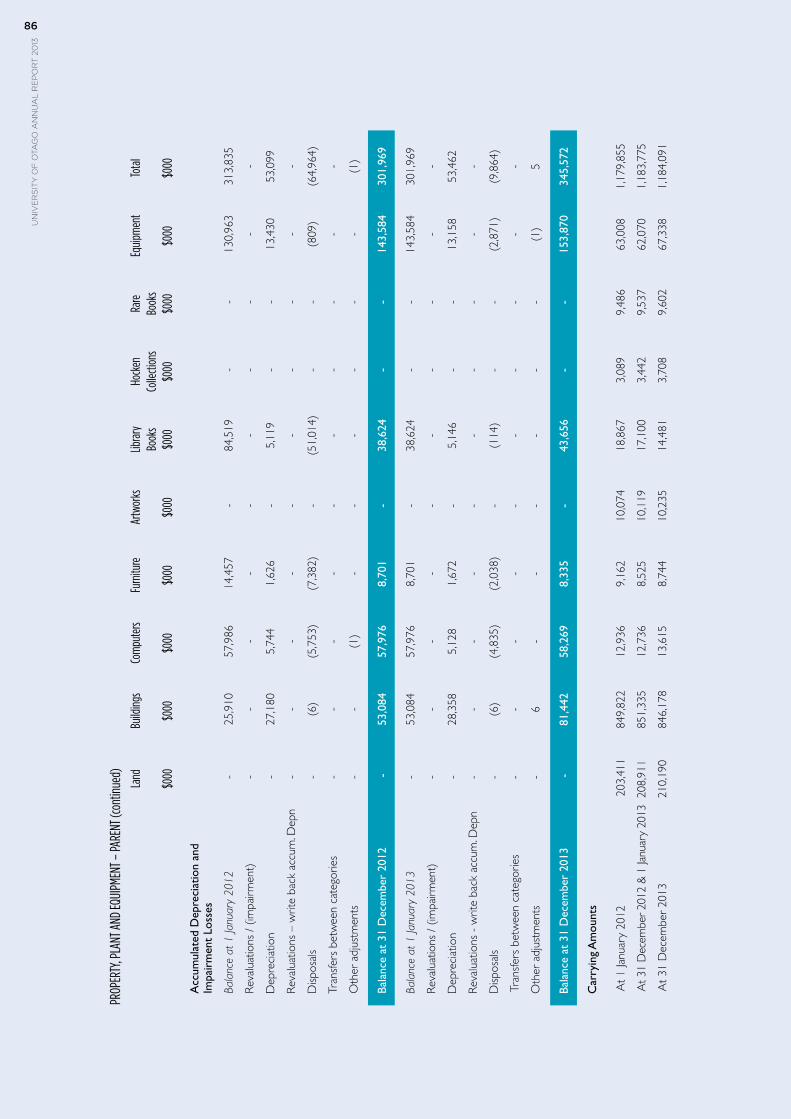
un
ive
rs
ity
of
ota
go
an
nu
al
re
po
rt
20
1386
un
ive
rs
ity
of
ota
go
an
nu
al
re
po
rt
20
1386
PROP
ERTY
, PLA
NT A
ND EQ
UIPM
ENT –
PARE
NT (c
ontin
ued)
La
nd
Build
ings
Com
pute
rs Fu
rnitu
re
Artw
orks
Lib
rary
Ho
cken
Ra
re
Equip
men
t To
tal
Book
s Co
llecti
ons
Book
s
$000
$0
00
$000
$0
00
$000
$0
00
$000
$0
00
$000
$0
00
Acc
umul
ated
Dep
reci
atio
n an
d
Impa
irm
ent
Loss
es
Bala
nce
at 1
Janu
ary
2012
-
25,
910
5
7,98
6
14,
457
-
84,
519
-
-
1
30,9
63
313
,835
Reva
luat
ions
/ (im
pairm
ent)
-
-
-
-
-
-
-
-
-
-
Dep
reci
atio
n
-
2
7,18
0
5,7
44
1,6
26
-
5
,119
-
-
1
3,43
0
53,
099
Reva
luat
ions
– w
rite
back
acc
um. D
epn
-
-
-
-
-
-
-
-
-
-
Disp
osal
s
-
(
6)
(5,
753)
(
7,38
2)
-
(
51,0
14)
-
-
(80
9)
(64
,964
)
Tran
sfer
s be
twee
n ca
tego
ries
-
-
-
-
-
-
-
-
-
-
Oth
er a
djus
tmen
ts
-
-
(1)
-
-
-
-
-
-
(
1)
Bala
nce
at 3
1 D
ecem
ber
2012
-
53,
084
5
7,97
6
8,7
01
-
3
8,62
4
-
-
143
,584
3
01,9
69
Bala
nce
at 1
Janu
ary
2013
-
53,
084
5
7,97
6
8,7
01
-
3
8,62
4
-
-
143
,584
3
01,9
69
Reva
luat
ions
/ (im
pairm
ent)
-
-
-
-
-
-
-
-
-
-
Dep
reci
atio
n
-
2
8,35
8
5,1
28
1,6
72
-
5
,146
-
-
1
3,15
8
53,
462
Reva
luat
ions
- w
rite
back
acc
um. D
epn
-
-
-
-
-
-
-
-
-
-
Disp
osal
s
-
(
6)
(4,
835)
(
2,03
8)
-
(
114)
-
-
(
2,87
1)
(9,
864)
Tra
nsfe
rs b
etw
een
cate
gorie
s
-
-
-
-
-
-
-
-
-
-
Oth
er a
djus
tmen
ts
-
6
-
-
-
-
-
-
(
1)
5
Bala
nce
at 3
1 D
ecem
ber
2013
-
81,
442
5
8,26
9
8,3
35
-
4
3,65
6
-
-
153
,870
3
45,5
72
Car
ryin
g A
mou
nts
At
1 Ja
nuar
y 20
12
203
,411
8
49,8
22
12,
936
9
,162
1
0,07
4
18,
867
3
,089
9
,486
6
3,00
8
1,1
79,8
55
At 3
1 D
ecem
ber
2012
& 1
Janu
ary
2013
20
8,91
1
851
,335
1
2,73
6
8,5
25
10,
119
1
7,10
0
3,4
42
9,5
37
62,
070
1
,183
,775
At
31 D
ecem
ber
2013
21
0,19
0
846
,178
1
3,61
5
8,7
44
10,
235
1
4,48
1
3,7
08
9,6
02
67,
338
1
,184
,091
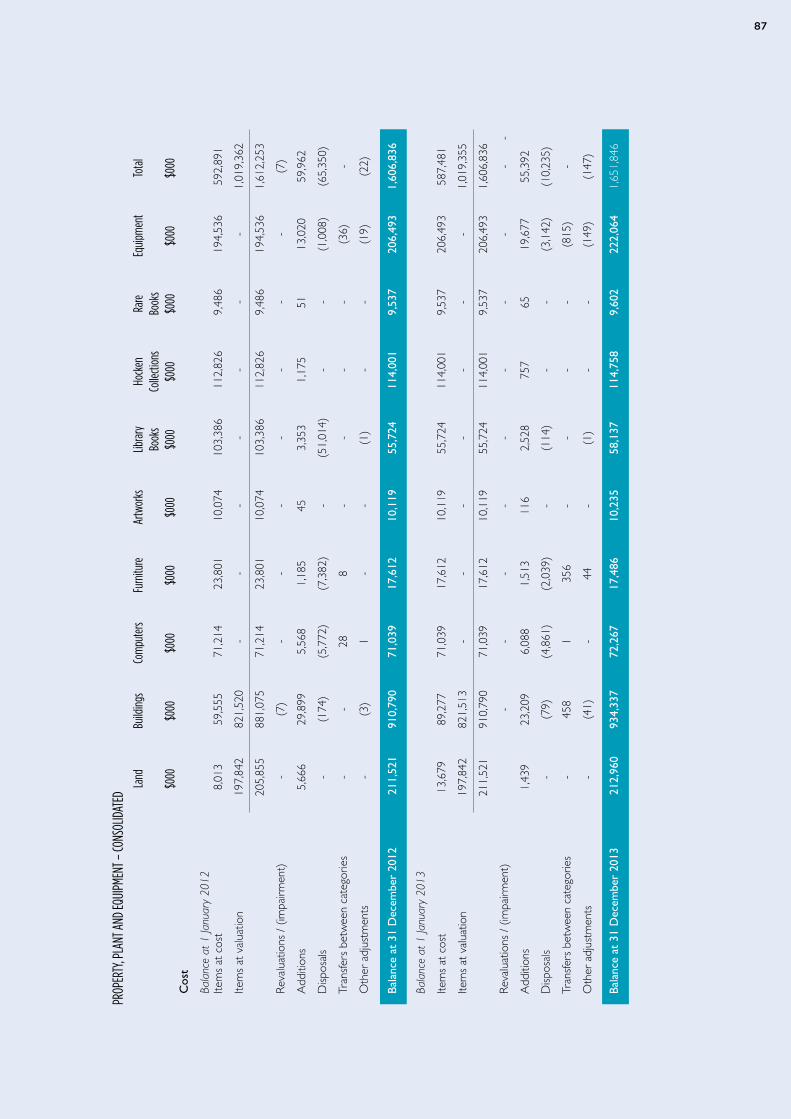
8787
PROP
ERTY
, PLA
NT A
ND EQ
UIPM
ENT –
CONS
OLIDA
TED
La
nd
Build
ings
Com
pute
rs Fu
rnitu
re
Artw
orks
Lib
rary
Ho
cken
Ra
re
Equip
men
t To
tal
Book
s Co
llecti
ons
Book
s
$000
$0
00
$000
$0
00
$000
$0
00
$000
$0
00
$000
$0
00
Cos
t
Bala
nce
at 1
Janu
ary
2012
Item
s at
cos
t
8,0
13
59,
555
7
1,21
4
23,
801
1
0,07
4
103
,386
1
12,8
26
9,4
86
194
,536
5
92,8
91
Item
s at
val
uatio
n
197
,842
8
21,5
20
-
-
-
-
-
-
-
1
,019
,362
2
05,8
55
881
,075
7
1,21
4
23,
801
1
0,07
4
103
,386
1
12,8
26
9,4
86
194
,536
1
,612
,253
Reva
luat
ions
/ (im
pairm
ent)
-
(7)
-
-
-
-
-
-
-
(7)
Add
ition
s
5,6
66
29,
899
5
,568
1
,185
4
5
3,3
53
1,1
75
51
1
3,02
0
59,
962
Disp
osal
s
-
(
174)
(
5,77
2)
(7,
382)
-
(51
,014
) -
-
(
1,00
8)
(65
,350
)
Tran
sfer
s be
twee
n ca
tego
ries
-
-
2
8
8
-
-
-
-
(36
) -
Oth
er a
djus
tmen
ts
-
(
3)
1
-
-
(1)
-
-
(
19)
(22
)
Bala
nce
at 3
1 D
ecem
ber
2012
2
11,5
21
910
,790
7
1,03
9
17,
612
1
0,11
9
55,
724
1
14,0
01
9,5
37
206
,493
1
,606
,836
Bala
nce
at 1
Janu
ary
2013
Item
s at
cos
t
13,
679
8
9,27
7
71,
039
1
7,61
2
10,
119
5
5,72
4
114
,001
9
,537
2
06,4
93
587
,481
Item
s at
val
uatio
n
197
,842
8
21,5
13
-
-
-
-
-
-
-
1
,019
,355
2
11,5
21
910
,790
7
1,03
9
17,
612
1
0,11
9
55,
724
1
14,0
01
9,5
37
206
,493
1
,606
,836
Reva
luat
ions
/ (im
pairm
ent)
-
-
-
-
-
-
-
-
-
-
Add
ition
s
1,4
39
23,
209
6
,088
1
,513
1
16
2,5
28
757
6
5
19,
677
5
5,39
2
Disp
osal
s
-
(
79)
(4,
861)
(
2,03
9)
-
(
114)
-
-
(
3,14
2)
(10
,235
)
Tran
sfer
s be
twee
n ca
tego
ries
-
458
1
3
56
-
-
-
-
(81
5)
-
Oth
er a
djus
tmen
ts
-
(
41)
-
4
4
-
(
1)
-
-
(14
9)
(14
7)
Ba
lanc
e at
31
Dec
embe
r 20
13
212
,960
9
34,3
37
72,
267
1
7,48
6
10,
235
5
8,13
7
114
,758
9
,602
2
22,0
64
1,6
51,8
46
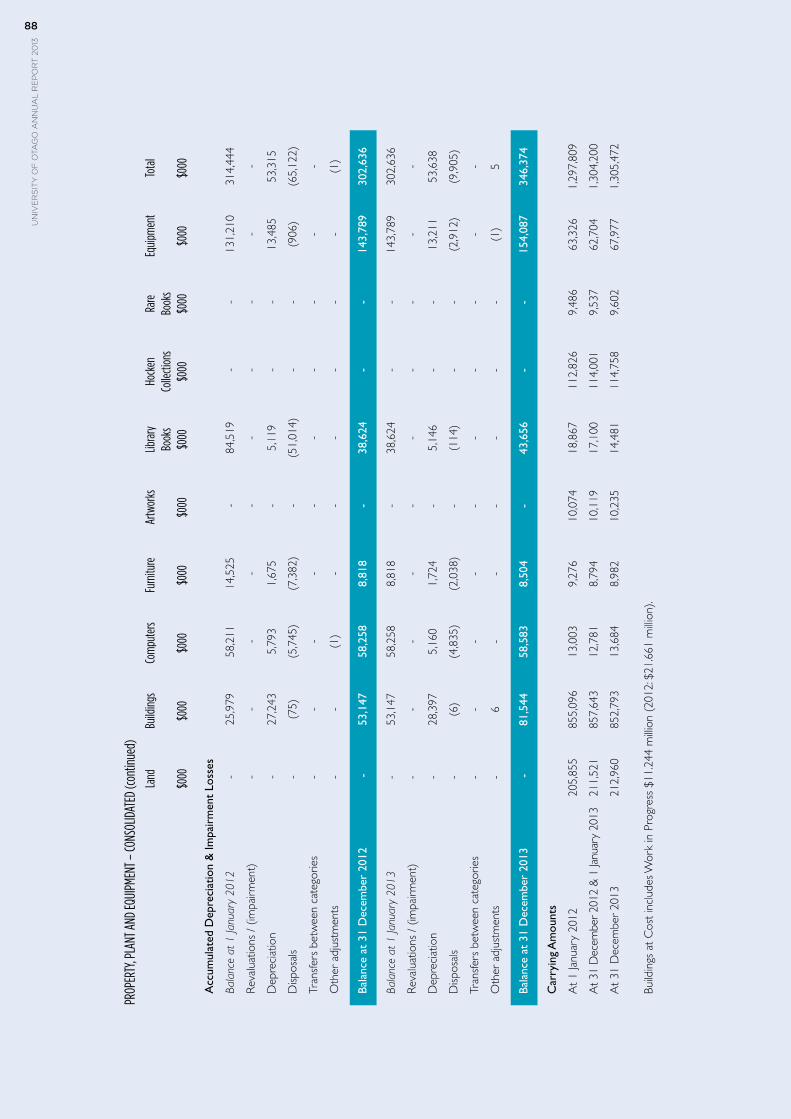
un
ive
rs
ity
of
ota
go
an
nu
al
re
po
rt
20
1388
un
ive
rs
ity
of
ota
go
an
nu
al
re
po
rt
20
1388
PROP
ERTY
, PLA
NT A
ND EQ
UIPM
ENT –
CONS
OLIDA
TED
(cont
inued
)
Land
Bu
ilding
s Co
mpu
ters
Furn
iture
Ar
twor
ks
Libra
ry
Hock
en
Rare
Eq
uipm
ent
Tota
l
Bo
oks
Colle
ction
s Bo
oks
$0
00
$000
$0
00
$000
$0
00
$000
$0
00
$000
$0
00
$000
Acc
umul
ated
Dep
reci
atio
n &
Impa
irm
ent
Loss
es
Bala
nce
at 1
Janu
ary
2012
-
25,
979
5
8,21
1
14,
525
-
84,
519
-
-
1
31,2
10
314
,444
Reva
luat
ions
/ (im
pairm
ent)
-
-
-
-
-
-
-
-
-
-
Dep
reci
atio
n
-
2
7,24
3
5,7
93
1,6
75
-
5
,119
-
-
1
3,48
5
53,
315
Disp
osal
s
-
(
75)
(5,
745)
(
7,38
2)
-
(
51,0
14)
-
-
(90
6)
(65
,122
)
Tran
sfer
s be
twee
n ca
tego
ries
-
-
-
-
-
-
-
-
-
-
Oth
er a
djus
tmen
ts
-
-
(1)
-
-
-
-
-
-
(
1)
Bala
nce
at 3
1 D
ecem
ber
2012
-
53,
147
5
8,25
8
8,8
18
-
3
8,62
4
-
-
143
,789
3
02,6
36
Bala
nce
at 1
Janu
ary
2013
-
53,
147
5
8,25
8
8,8
18
-
3
8,62
4
-
-
143
,789
3
02,6
36
Reva
luat
ions
/ (im
pairm
ent)
-
-
-
-
-
-
-
-
-
-
Dep
reci
atio
n
-
2
8,39
7
5,1
60
1,7
24
-
5
,146
-
-
1
3,21
1
53,
638
Disp
osal
s
-
(
6)
(4,
835)
(
2,03
8)
-
(
114)
-
-
(
2,91
2)
(9,
905)
Tran
sfer
s be
twee
n ca
tego
ries
-
-
-
-
-
-
-
-
-
-
Oth
er a
djus
tmen
ts
-
6
-
-
-
-
-
-
(
1)
5
Bala
nce
at 3
1 D
ecem
ber
2013
-
81,
544
5
8,58
3
8,5
04
-
4
3,65
6
-
-
154
,087
3
46,3
74
Car
ryin
g A
mou
nts
At
1 Ja
nuar
y 20
12
205
,855
8
55,0
96
13,
003
9
,276
1
0,07
4
18,
867
1
12,8
26
9,4
86
63,
326
1
,297
,809
At 3
1 D
ecem
ber
2012
& 1
Janu
ary
2013
2
11,5
21
857
,643
1
2,78
1
8,7
94
10,
119
1
7,10
0
114
,001
9
,537
6
2,70
4
1,3
04,2
00
At
31 D
ecem
ber
2013
2
12,9
60
852
,793
1
3,68
4
8,9
82
10,
235
1
4,48
1
114
,758
9
,602
6
7,97
7
1,3
05,4
72
Build
ings
at
Cos
t in
clud
es W
ork
in P
rogr
ess
$11.
244
milli
on (
2012
: $21
.661
milli
on).
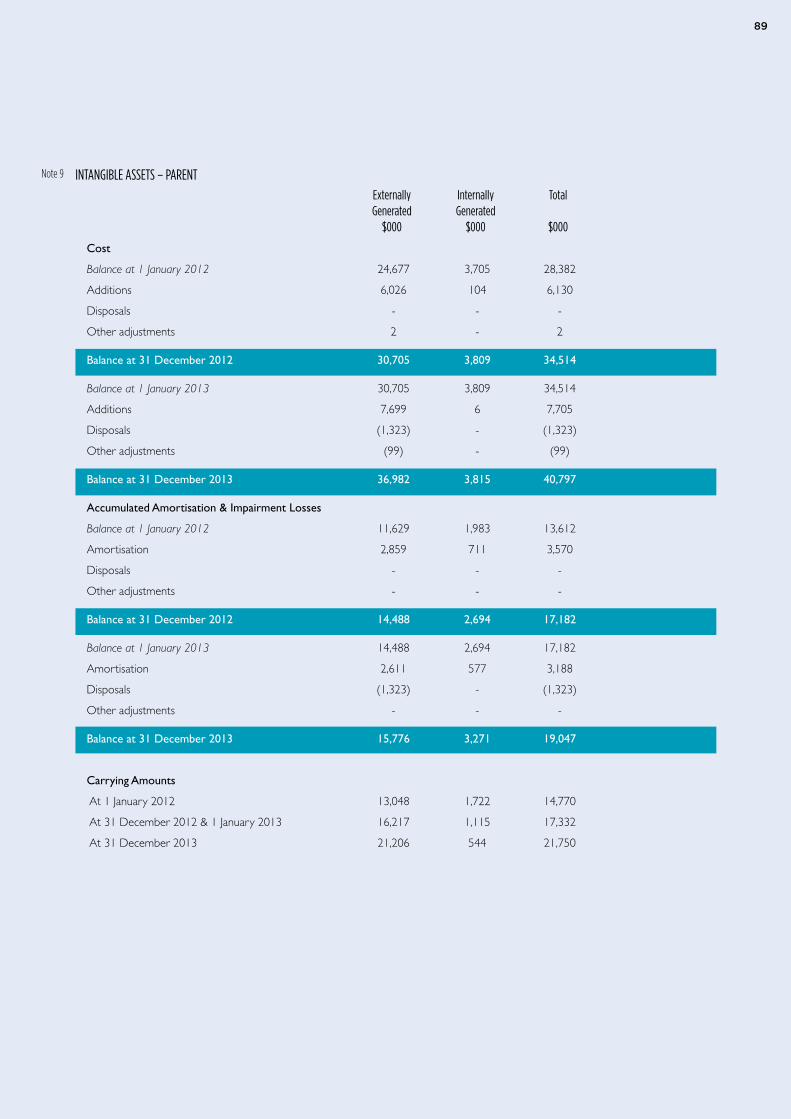
8989
INTANGIBLE ASSETS – PARENT Externally Internally Total Generated Generated $000 $000 $000
Cost
Balance at 1 January 2012 24,677 3,705 28,382
Additions 6,026 104 6,130
Disposals - - -
Other adjustments 2 - 2
Balance at 31 December 2012 30,705 3,809 34,514
Balance at 1 January 2013 30,705 3,809 34,514
Additions 7,699 6 7,705
Disposals (1,323) - (1,323)
Other adjustments (99) - (99)
Balance at 31 December 2013 36,982 3,815 40,797
Accumulated Amortisation & Impairment Losses
Balance at 1 January 2012 11,629 1,983 13,612
Amortisation 2,859 711 3,570
Disposals - - -
Other adjustments - - -
Balance at 31 December 2012 14,488 2,694 17,182
Balance at 1 January 2013 14,488 2,694 17,182
Amortisation 2,611 577 3,188
Disposals (1,323) - (1,323)
Other adjustments - - -
Balance at 31 December 2013 15,776 3,271 19,047
Carrying Amounts
At 1 January 2012 13,048 1,722 14,770
At 31 December 2012 & 1 January 2013 16,217 1,115 17,332
At 31 December 2013 21,206 544 21,750
Note 9
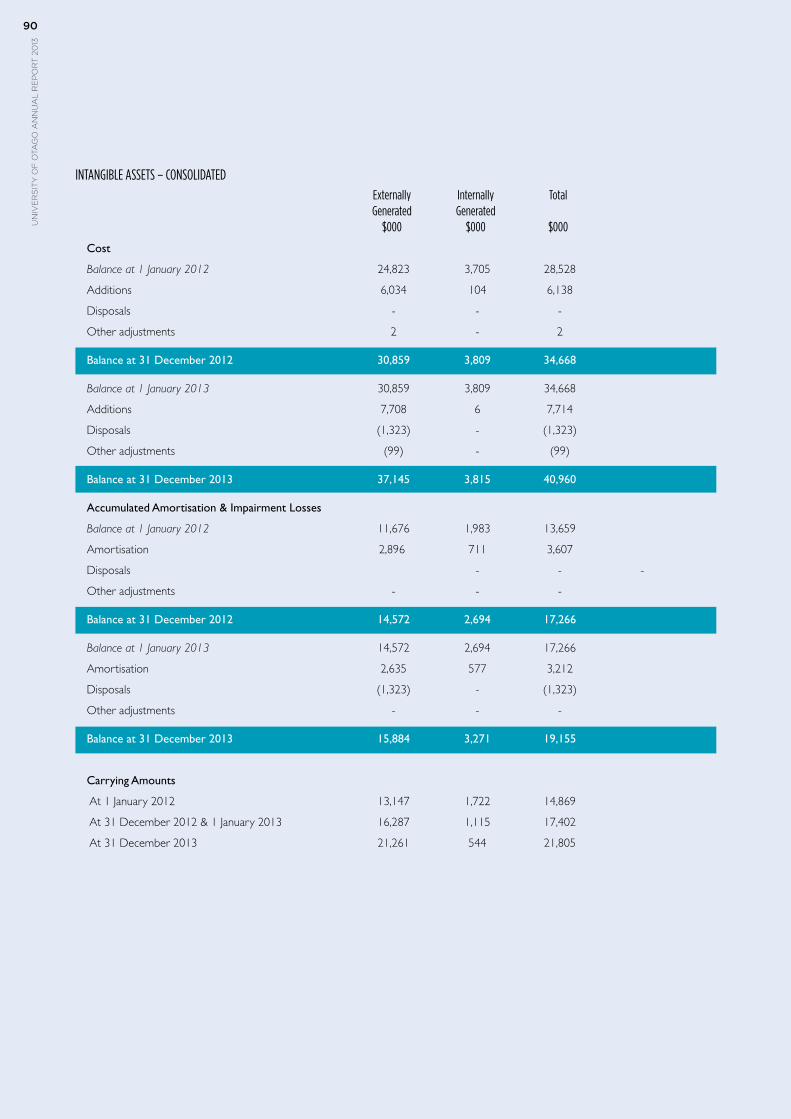
un
ive
rs
ity
of
ota
go
an
nu
al
re
po
rt
20
1390
un
ive
rs
ity
of
ota
go
an
nu
al
re
po
rt
20
1390
INTANGIBLE ASSETS – CONSOLIDATED Externally Internally Total Generated Generated $000 $000 $000
Cost
Balance at 1 January 2012 24,823 3,705 28,528
Additions 6,034 104 6,138
Disposals - - -
Other adjustments 2 - 2
Balance at 31 December 2012 30,859 3,809 34,668
Balance at 1 January 2013 30,859 3,809 34,668
Additions 7,708 6 7,714
Disposals (1,323) - (1,323)
Other adjustments (99) - (99)
Balance at 31 December 2013 37,145 3,815 40,960
Accumulated Amortisation & Impairment Losses
Balance at 1 January 2012 11,676 1,983 13,659
Amortisation 2,896 711 3,607
Disposals - - -
Other adjustments - - -
Balance at 31 December 2012 14,572 2,694 17,266
Balance at 1 January 2013 14,572 2,694 17,266
Amortisation 2,635 577 3,212
Disposals (1,323) - (1,323)
Other adjustments - - -
Balance at 31 December 2013 15,884 3,271 19,155
Carrying Amounts
At 1 January 2012 13,147 1,722 14,869
At 31 December 2012 & 1 January 2013 16,287 1,115 17,402
At 31 December 2013 21,261 544 21,805
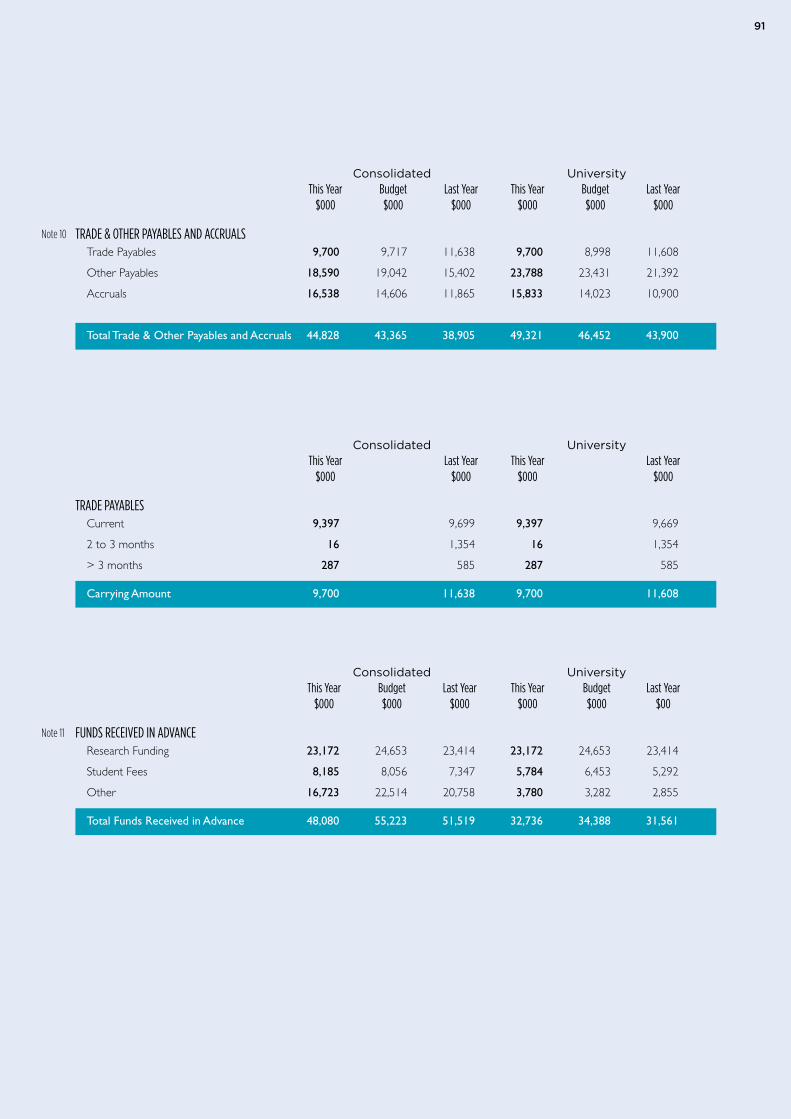
9191
Consolidated University This Year Budget Last Year This Year Budget Last Year $000 $000 $000 $000 $000 $000
TRADE & OTHER PAYABLES AND ACCRUALSTrade Payables 9,700 9,717 11,638 9,700 8,998 11,608
Other Payables 18,590 19,042 15,402 23,788 23,431 21,392
Accruals 16,538 14,606 11,865 15,833 14,023 10,900
Total Trade & Other Payables and Accruals 44,828 43,365 38,905 49,321 46,452 43,900
Consolidated University This Year Last Year This Year Last Year $000 $000 $000 $000
TRADE PAYABLES Current 9,397 9,699 9,397 9,669
2 to 3 months 16 1,354 16 1,354
> 3 months 287 585 287 585
Carrying Amount 9,700 11,638 9,700 11,608
Consolidated University This Year Budget Last Year This Year Budget Last Year $000 $000 $000 $000 $000 $00 FUNDS RECEIVED IN ADVANCE
Research Funding 23,172 24,653 23,414 23,172 24,653 23,414
Student Fees 8,185 8,056 7,347 5,784 6,453 5,292
Other 16,723 22,514 20,758 3,780 3,282 2,855
Total Funds Received in Advance 48,080 55,223 51,519 32,736 34,388 31,561
Note 10
Note 11
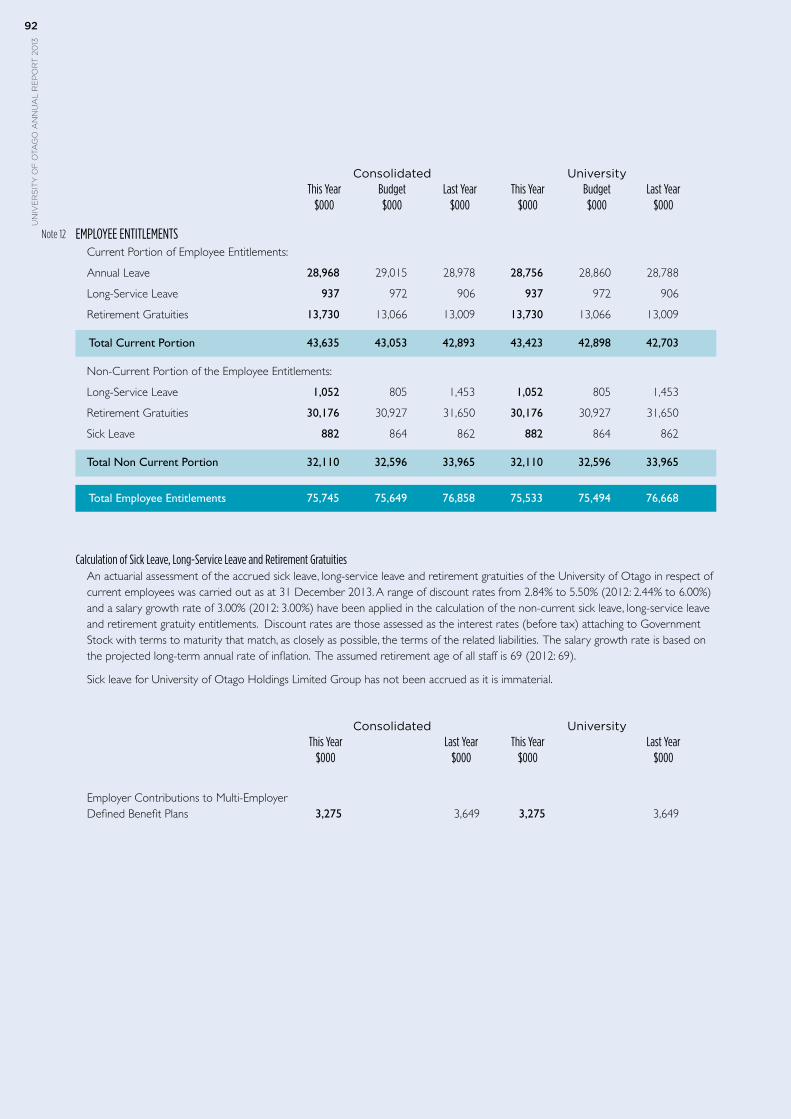
un
ive
rs
ity
of
ota
go
an
nu
al
re
po
rt
20
1392
un
ive
rs
ity
of
ota
go
an
nu
al
re
po
rt
20
1392
Consolidated University This Year Budget Last Year This Year Budget Last Year $000 $000 $000 $000 $000 $000
EMPLOYEE ENTITLEMENTS Current Portion of Employee Entitlements:
Annual Leave 28,968 29,015 28,978 28,756 28,860 28,788
Long-Service Leave 937 972 906 937 972 906
Retirement Gratuities 13,730 13,066 13,009 13,730 13,066 13,009
Total Current Portion 43,635 43,053 42,893 43,423 42,898 42,703
Non-Current Portion of the Employee Entitlements:
Long-Service Leave 1,052 805 1,453 1,052 805 1,453
Retirement Gratuities 30,176 30,927 31,650 30,176 30,927 31,650
Sick Leave 882 864 862 882 864 862
Total Non Current Portion 32,110 32,596 33,965 32,110 32,596 33,965
Total Employee Entitlements 75,745 75,649 76,858 75,533 75,494 76,668
Calculation of Sick Leave, Long-Service Leave and Retirement GratuitiesAn actuarial assessment of the accrued sick leave, long-service leave and retirement gratuities of the University of Otago in respect of current employees was carried out as at 31 December 2013. A range of discount rates from 2.84% to 5.50% (2012: 2.44% to 6.00%) and a salary growth rate of 3.00% (2012: 3.00%) have been applied in the calculation of the non-current sick leave, long-service leave and retirement gratuity entitlements. Discount rates are those assessed as the interest rates (before tax) attaching to Government Stock with terms to maturity that match, as closely as possible, the terms of the related liabilities. The salary growth rate is based on the projected long-term annual rate of inflation. The assumed retirement age of all staff is 69 (2012: 69).
Sick leave for University of Otago Holdings Limited Group has not been accrued as it is immaterial.
Consolidated University This Year Last Year This Year Last Year $000 $000 $000 $000
Employer Contributions to Multi-Employer Defined Benefit Plans 3,275 3,649 3,275 3,649
Note 12
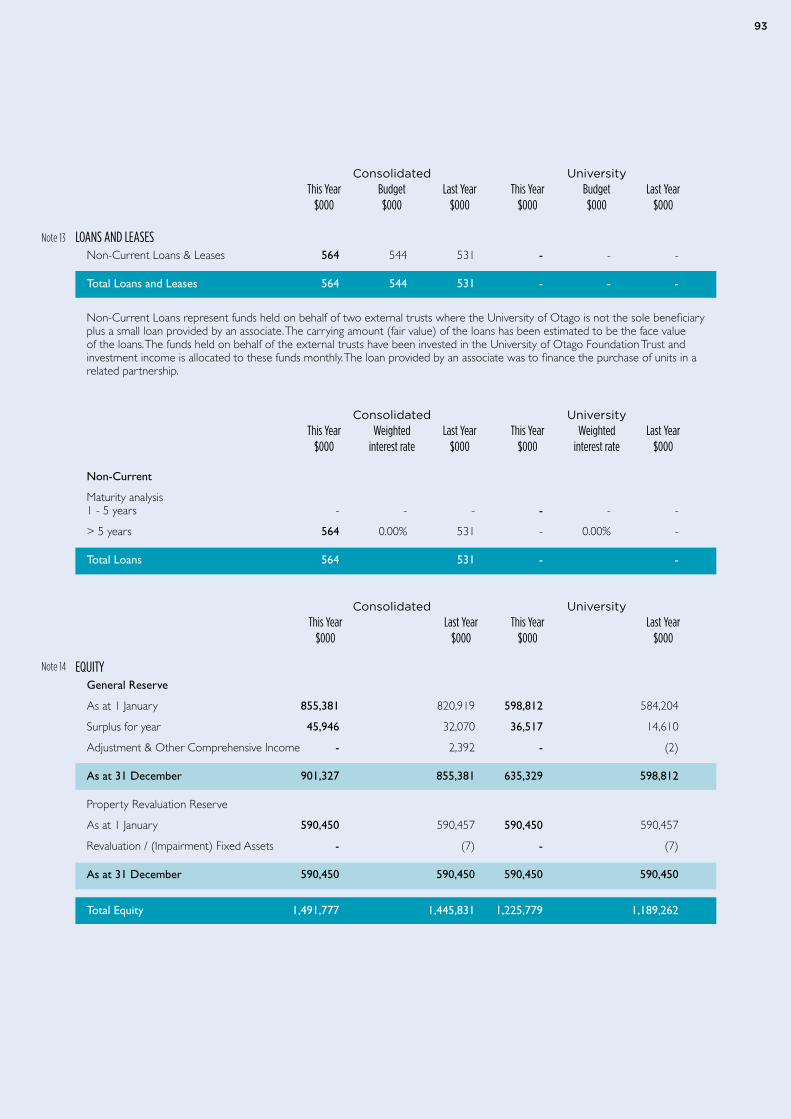
9393
Consolidated University This Year Budget Last Year This Year Budget Last Year $000 $000 $000 $000 $000 $000
LOANS AND LEASES Non-Current Loans & Leases 564 544 531 - - -
Total Loans and Leases 564 544 531 - - -
Non-Current Loans represent funds held on behalf of two external trusts where the University of Otago is not the sole beneficiary plus a small loan provided by an associate. The carrying amount (fair value) of the loans has been estimated to be the face value of the loans. The funds held on behalf of the external trusts have been invested in the University of Otago Foundation Trust and investment income is allocated to these funds monthly. The loan provided by an associate was to finance the purchase of units in a related partnership.
Consolidated University This Year Weighted Last Year This Year Weighted Last Year $000 interest rate $000 $000 interest rate $000
Non-Current
Maturity analysis1 - 5 years - - - - - -
> 5 years 564 0.00% 531 - 0.00% -
Total Loans 564 531 - -
Consolidated University This Year Last Year This Year Last Year $000 $000 $000 $000
EQUITY
General Reserve
As at 1 January 855,381 820,919 598,812 584,204
Surplus for year 45,946 32,070 36,517 14,610
Adjustment & Other Comprehensive Income - 2,392 - (2)
As at 31 December 901,327 855,381 635,329 598,812
Property Revaluation Reserve
As at 1 January 590,450 590,457 590,450 590,457
Revaluation / (Impairment) Fixed Assets - (7) - (7)
As at 31 December 590,450 590,450 590,450 590,450
Total Equity 1,491,777 1,445,831 1,225,779 1,189,262
Note 13
Note 14
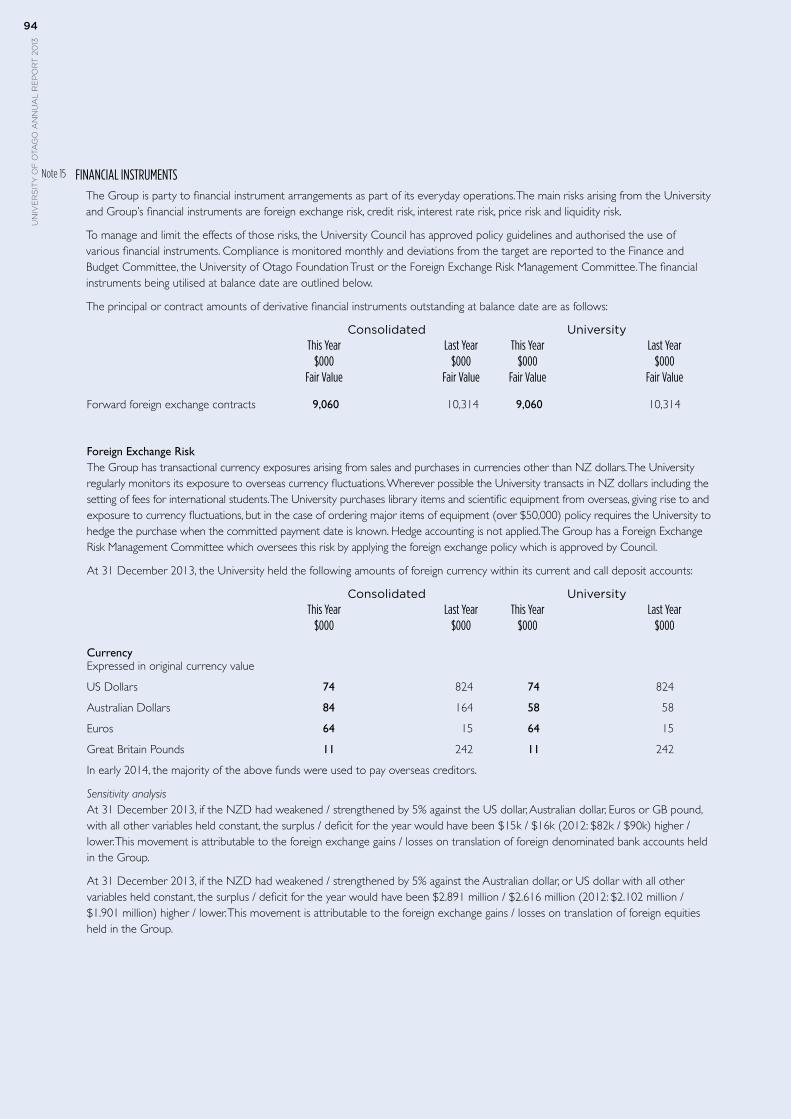
un
ive
rs
ity
of
ota
go
an
nu
al
re
po
rt
20
1394
un
ive
rs
ity
of
ota
go
an
nu
al
re
po
rt
20
1394
FINANCIAL INSTRUMENTS The Group is party to financial instrument arrangements as part of its everyday operations. The main risks arising from the University and Group’s financial instruments are foreign exchange risk, credit risk, interest rate risk, price risk and liquidity risk.
To manage and limit the effects of those risks, the University Council has approved policy guidelines and authorised the use of various financial instruments. Compliance is monitored monthly and deviations from the target are reported to the Finance and Budget Committee, the University of Otago Foundation Trust or the Foreign Exchange Risk Management Committee. The financial instruments being utilised at balance date are outlined below.
The principal or contract amounts of derivative financial instruments outstanding at balance date are as follows:
Consolidated University This Year Last Year This Year Last Year $000 $000 $000 $000 Fair Value Fair Value Fair Value Fair Value
Forward foreign exchange contracts 9,060 10,314 9,060 10,314
Foreign Exchange Risk The Group has transactional currency exposures arising from sales and purchases in currencies other than NZ dollars. The University regularly monitors its exposure to overseas currency fluctuations. Wherever possible the University transacts in NZ dollars including the setting of fees for international students. The University purchases library items and scientific equipment from overseas, giving rise to and exposure to currency fluctuations, but in the case of ordering major items of equipment (over $50,000) policy requires the University to hedge the purchase when the committed payment date is known. Hedge accounting is not applied. The Group has a Foreign Exchange Risk Management Committee which oversees this risk by applying the foreign exchange policy which is approved by Council.
At 31 December 2013, the University held the following amounts of foreign currency within its current and call deposit accounts:
Consolidated University This Year Last Year This Year Last Year $000 $000 $000 $000
CurrencyExpressed in original currency value
US Dollars 74 824 74 824
Australian Dollars 84 164 58 58
Euros 64 15 64 15
Great Britain Pounds 11 242 11 242
In early 2014, the majority of the above funds were used to pay overseas creditors.
Sensitivity analysisAt 31 December 2013, if the NZD had weakened / strengthened by 5% against the US dollar, Australian dollar, Euros or GB pound, with all other variables held constant, the surplus / deficit for the year would have been $15k / $16k (2012: $82k / $90k) higher / lower. This movement is attributable to the foreign exchange gains / losses on translation of foreign denominated bank accounts held in the Group.
At 31 December 2013, if the NZD had weakened / strengthened by 5% against the Australian dollar, or US dollar with all other variables held constant, the surplus / deficit for the year would have been $2.891 million / $2.616 million (2012: $2.102 million / $1.901 million) higher / lower. This movement is attributable to the foreign exchange gains / losses on translation of foreign equities held in the Group.
Note 15
9595
Credit RiskCredit risk is the risk that a third party will default on its obligation to the Group, causing the Group to incur a loss.
In the normal course of business, credit risk arises from debtors, deposits with banks and derivative financial instruments assets.
Trade receivables constitute a minimal concentration of credit risk due to the large number of customers included in the Group’s customer base.
The Group consults with professional investment advisors and has an investment policy which is regularly reviewed. The Group places its investments with institutions that have a high credit rating. It also reduces its exposure to risk by limiting the amount that can be invested in any one institution. The Group believes that this policy reduces the risk of any loss which could arise from its investment activities.
Short term deposits are only placed with the major New Zealand trading banks approved under the investment policy. Not more than one third of the maximum annual value of cash deposits can be held with any one approved bank.
Interest-Rate RiskThe Group has minimal exposure to interest-rate risk from loans.
Sensitivity analysisAt 31 December 2013, if interest rates on investments had strengthened / weakened by plus or minus 0.5%, the surplus for the year would have been $532k (2012: $502k) higher / lower. This movement is attributable to interest earning deposits held.
Price RiskPrice risk is the risk that the value of a financial instrument will fluctuate as a result of changes in market prices. The University and Group are exposed to equity security prices on its equity investments. These prices move in line with market movements in listed securities. The University and Group holds listed equity instruments which are publicly traded on the NZX and ASX exchanges.
Sensitivity analysisIf the NZX50 and the ASX100 index and the global index at 31 December 2013 had fluctuated by plus or minus 5% and equity instruments moved proportionately, the effect would have been to increase/decrease the fair value by $5.453 million / $5.453 million (2012: $4.406 million / $4.406 million).
Liquidity RiskLiquidity risk is the risk that the Group will encounter difficulty raising liquid funds to meet commitments as they fall due.
Management of liquidity riskPrudent liquidity risk management implies maintaining sufficient cash, the availability of funding through an adequate amount of committed credit facilities, and the ability to close out market positions. Flexibility in funding is maintained by keeping committed credit lines available. The University and the Group have a maximum amount that can be drawn down against its overdraft facility of $30 million (2012: $30 million). There are no restrictions on the use of this facility.
The University and the Group manages liquidity risk by continuously monitoring forecast and actual cash flow requirements and matching the maturity profiles of financial assets and liabilities.
RARE BOOKS AND SPECIAL LIBRARY COLLECTIONS The University holds a number of gifted collections of books, manuscripts, and artworks within the Central, Medical and Dental Libraries. The collections were valued at 31 December 1994, based on net current value, by expert University staff following the generally accepted methodology employed by the Alexander Turnbull Library. The total valuation of the Rare Books and Special Collections is $9.602 million (2012: $9.537 million). Additions at cost in 2013 were $65k (2012: $51k). (Refer Note 8)
Note 16
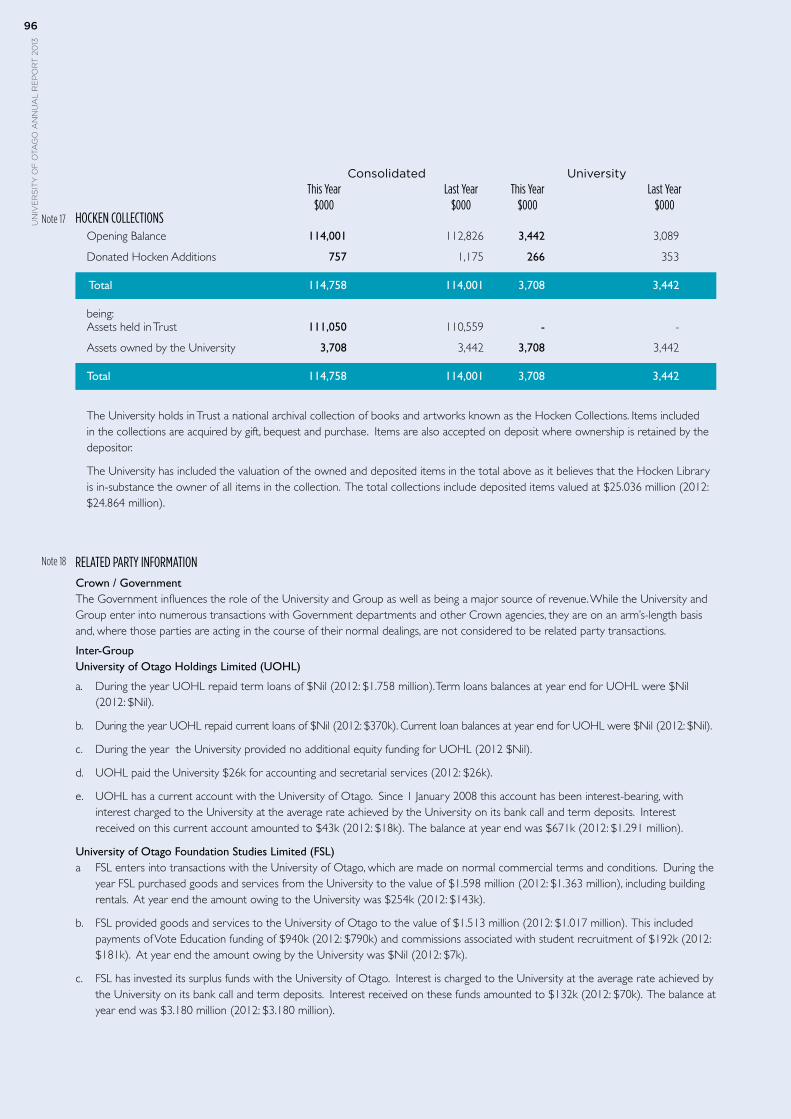
un
ive
rs
ity
of
ota
go
an
nu
al
re
po
rt
20
1396
un
ive
rs
ity
of
ota
go
an
nu
al
re
po
rt
20
1396
Consolidated University This Year Last Year This Year Last Year $000 $000 $000 $000
HOCKEN COLLECTIONS Opening Balance 114,001 112,826 3,442 3,089
Donated Hocken Additions 757 1,175 266 353
Total 114,758 114,001 3,708 3,442
being: Assets held in Trust 111,050 110,559 - -
Assets owned by the University 3,708 3,442 3,708 3,442
Total 114,758 114,001 3,708 3,442
The University holds in Trust a national archival collection of books and artworks known as the Hocken Collections. Items included in the collections are acquired by gift, bequest and purchase. Items are also accepted on deposit where ownership is retained by the depositor.
The University has included the valuation of the owned and deposited items in the total above as it believes that the Hocken Library is in-substance the owner of all items in the collection. The total collections include deposited items valued at $25.036 million (2012: $24.864 million).
RELATED PARTY INFORMATIONCrown / Government The Government influences the role of the University and Group as well as being a major source of revenue. While the University and Group enter into numerous transactions with Government departments and other Crown agencies, they are on an arm’s-length basis and, where those parties are acting in the course of their normal dealings, are not considered to be related party transactions.
Inter-Group University of Otago Holdings Limited (UOHL)
a. During the year UOHL repaid term loans of $Nil (2012: $1.758 million). Term loans balances at year end for UOHL were $Nil (2012: $Nil).
b. During the year UOHL repaid current loans of $Nil (2012: $370k). Current loan balances at year end for UOHL were $Nil (2012: $Nil).
c. During the year the University provided no additional equity funding for UOHL (2012 $Nil).
d. UOHL paid the University $26k for accounting and secretarial services (2012: $26k).
e. UOHL has a current account with the University of Otago. Since 1 January 2008 this account has been interest-bearing, with interest charged to the University at the average rate achieved by the University on its bank call and term deposits. Interest received on this current account amounted to $43k (2012: $18k). The balance at year end was $671k (2012: $1.291 million).
University of Otago Foundation Studies Limited (FSL) a FSL enters into transactions with the University of Otago, which are made on normal commercial terms and conditions. During the
year FSL purchased goods and services from the University to the value of $1.598 million (2012: $1.363 million), including building rentals. At year end the amount owing to the University was $254k (2012: $143k).
b. FSL provided goods and services to the University of Otago to the value of $1.513 million (2012: $1.017 million). This included payments of Vote Education funding of $940k (2012: $790k) and commissions associated with student recruitment of $192k (2012: $181k). At year end the amount owing by the University was $Nil (2012: $7k).
c. FSL has invested its surplus funds with the University of Otago. Interest is charged to the University at the average rate achieved by the University on its bank call and term deposits. Interest received on these funds amounted to $132k (2012: $70k). The balance at year end was $3.180 million (2012: $3.180 million).
Note 17
Note 18
9797
Otago Innovation Limited (OIL) a. OIL enters into transactions with the University of Otago, which are made on normal commercial terms and conditions. During the
year OIL purchased goods and services from the University to the value of $662k (2012: $654k). At year end the amount owing to the University was $16k (2012: $53k).
b. During the year OIL supplied services to the University to the value of $518k (2012: $618k). At year end the amount owing by the University was $54k (2012: $46k).
c. Immune Solutions Limited enters into transactions with the University of Otago, which are made on normal commercial terms and conditions. During the year Immune Solutions Limited purchased goods and services from the University to the value of $27k (2012: $32k). At year end the amount owing to the University was $Nil (2012: $3k).
d. During the year Immune Solutions Limited supplied services to the University to the value of $Nil (2012: $35k). At year end the amount owing by the University was $Nil (2012: $6k).
New Zealand Genomics Limited (NZGL) a. NZGL enters into transactions with the University of Otago, which are made on normal commercial terms and conditions. During
the year NZGL purchased goods and services from the University to the value of $2.962 million (2012: $1.938 million), including building rental and collaborator payments. At year end the amount owing to the University was $354k (2012: $646k).
b. NZGL provided goods and services to the University of Otago to the value of $408k (2012: $282k). At year end the amount owing by the University was $9k (2012: $80k).
Unipol Recreation Limited (URL) a. URL paid the University $8k for accounting and secreterial services (2012: $8k).
b. The University arranges insurance for URL including material damage, business interruption and liability policies. The cost of this insurance was $4k (2012: $3k).
c. URL has a current account with the University of Otago. This account is interest-bearing, with interest charged to the University at the average rate achieved by the University on its bank call and term deposits. Interest received on this current account amounted to $73k (2012: $152k). The balance at year end was $1.740 million (2012: $1.791 million).
d. URL sold equipment and vehicles to the University to the value of $Nil (2012: $454k).
e. URL received rent from the University to the value of $12k (2012: $Nil).
f. URL paid the University occupancy costs of $28k (2012: $Nil).
University Union Limited (UUL)
a. During the year the University entered into transactions with UUL, an associate company of University of Otago Holdings Limited. The transactions were made on commercial terms and conditions. The University paid UUL $342k for rent (2012: $314k). UUL paid the University of Otago ground rent of $105k (2012: $99k).
University of Otago Trusts a. During the year, the University entered into transactions with its Trusts. These were made on commercial terms and conditions. The
University received investment management fees of $622k (2012: $556k) and received distributions of $6.145 million (2012: $4.075 million). The University has a current account with the Trust. The balance at year end was negative $1.281 million (2012: $45k).
Key Management Personnel During the year key management personnel which includes the Chancellor, Councillors, Vice-Chancellor and other senior management personnel, as part of a normal customer relationship, may have been involved in minor transactions with the University of Otago on an arm’s-length basis.
Close family members of Councillors and key management personnel are employed by the University. The terms and conditions of those arrangements are no more favourable than the University would have agreed had there been no relationships to Councillors or key management personnel.
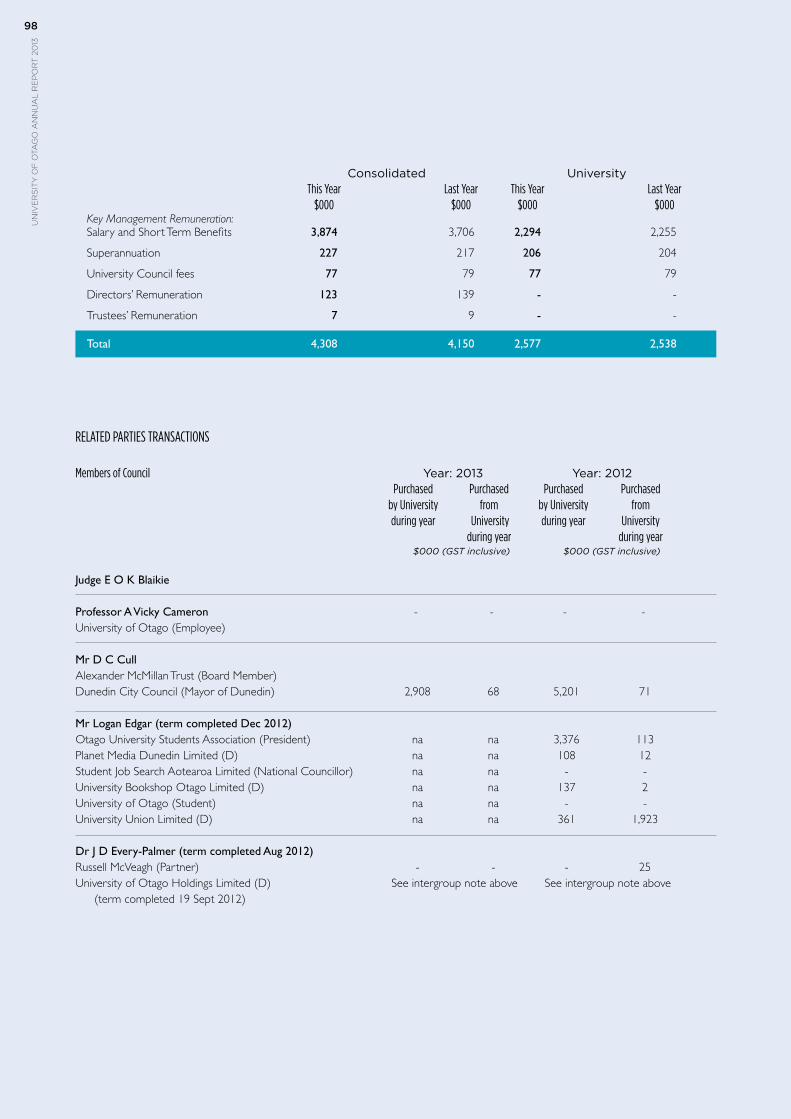
un
ive
rs
ity
of
ota
go
an
nu
al
re
po
rt
20
1398
un
ive
rs
ity
of
ota
go
an
nu
al
re
po
rt
20
1398
Consolidated University This Year Last Year This Year Last Year $000 $000 $000 $000Key Management Remuneration: Salary and Short Term Benefits 3,874 3,706 2,294 2,255
Superannuation 227 217 206 204
University Council fees 77 79 77 79
Directors’ Remuneration 123 139 - -
Trustees’ Remuneration 7 9 - -
Total 4,308 4,150 2,577 2,538
RELATED PARTIES TRANSACTIONS
Members of Council Year: 2013 Year: 2012 Purchased Purchased Purchased Purchased by University from by University from during year University during year University during year during year
$000 (GST inclusive) $000 (GST inclusive)
Judge E O K Blaikie Professor A Vicky Cameron - - - - University of Otago (Employee) Mr D C Cull Alexander McMillan Trust (Board Member) Dunedin City Council (Mayor of Dunedin) 2,908 68 5,201 71
Mr Logan Edgar (term completed Dec 2012) Otago University Students Association (President) na na 3,376 113 Planet Media Dunedin Limited (D) na na 108 12 Student Job Search Aotearoa Limited (National Councillor) na na - - University Bookshop Otago Limited (D) na na 137 2 University of Otago (Student) na na - - University Union Limited (D) na na 361 1,923
Dr J D Every-Palmer (term completed Aug 2012) Russell McVeagh (Partner) - - - 25 University of Otago Holdings Limited (D) See intergroup note above See intergroup note above (term completed 19 Sept 2012)
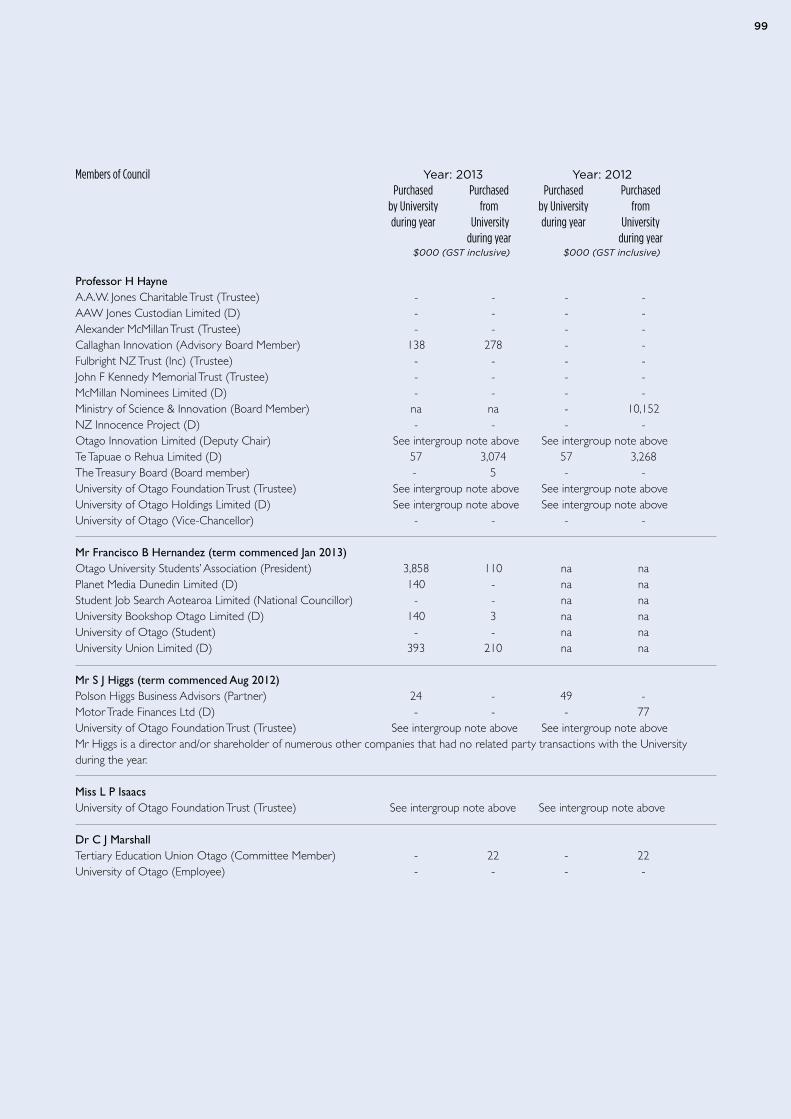
9999
Members of Council Year: 2013 Year: 2012 Purchased Purchased Purchased Purchased by University from by University from during year University during year University during year during year
$000 (GST inclusive) $000 (GST inclusive)
Professor H Hayne A.A.W. Jones Charitable Trust (Trustee) - - - - AAW Jones Custodian Limited (D) - - - - Alexander McMillan Trust (Trustee) - - - - Callaghan Innovation (Advisory Board Member) 138 278 - - Fulbright NZ Trust (Inc) (Trustee) - - - - John F Kennedy Memorial Trust (Trustee) - - - - McMillan Nominees Limited (D) - - - - Ministry of Science & Innovation (Board Member) na na - 10,152 NZ Innocence Project (D) - - - - Otago Innovation Limited (Deputy Chair) See intergroup note above See intergroup note above Te Tapuae o Rehua Limited (D) 57 3,074 57 3,268 The Treasury Board (Board member) - 5 - - University of Otago Foundation Trust (Trustee) See intergroup note above See intergroup note above University of Otago Holdings Limited (D) See intergroup note above See intergroup note above University of Otago (Vice-Chancellor) - - - - Mr Francisco B Hernandez (term commenced Jan 2013) Otago University Students’ Association (President) 3,858 110 na na Planet Media Dunedin Limited (D) 140 - na na Student Job Search Aotearoa Limited (National Councillor) - - na na University Bookshop Otago Limited (D) 140 3 na na University of Otago (Student) - - na na University Union Limited (D) 393 210 na na Mr S J Higgs (term commenced Aug 2012) Polson Higgs Business Advisors (Partner) 24 - 49 - Motor Trade Finances Ltd (D) - - - 77 University of Otago Foundation Trust (Trustee) See intergroup note above See intergroup note above Mr Higgs is a director and/or shareholder of numerous other companies that had no related party transactions with the Universityduring the year.
Miss L P Isaacs University of Otago Foundation Trust (Trustee) See intergroup note above See intergroup note above Dr C J Marshall Tertiary Education Union Otago (Committee Member) - 22 - 22 University of Otago (Employee) - - - -
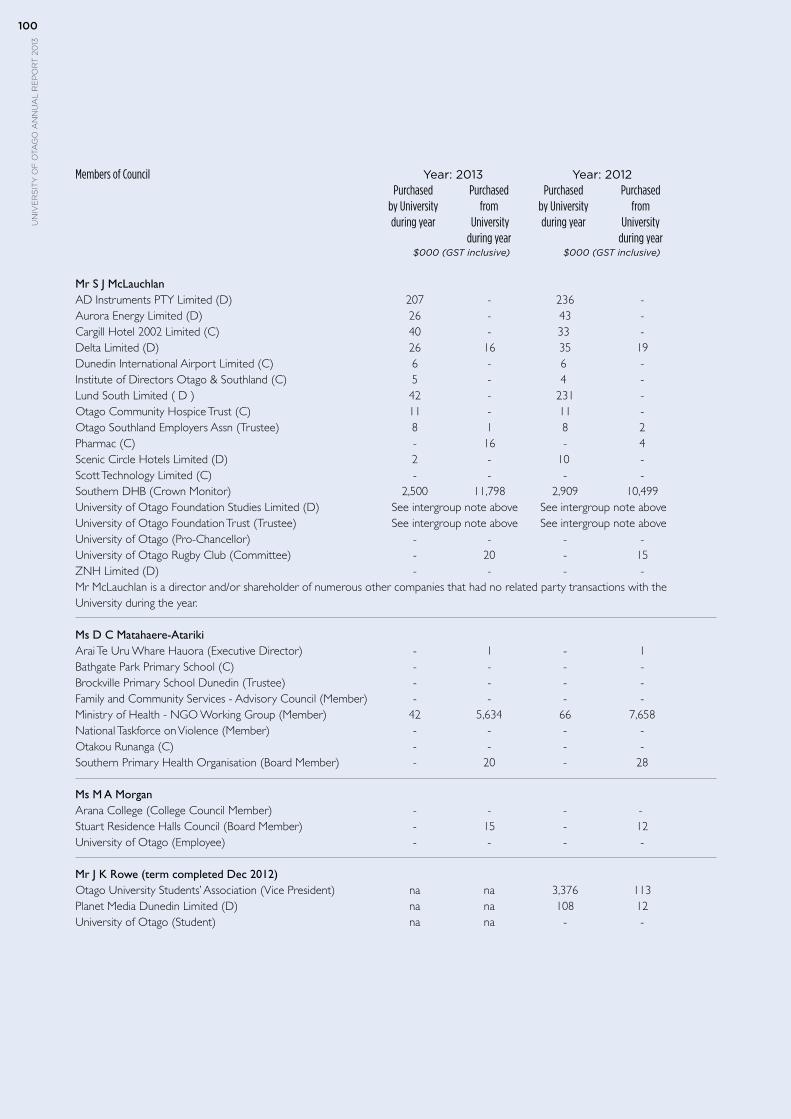
un
ive
rs
ity
of
ota
go
an
nu
al
re
po
rt
20
13100
un
ive
rs
ity
of
ota
go
an
nu
al
re
po
rt
20
13100
Members of Council Year: 2013 Year: 2012 Purchased Purchased Purchased Purchased by University from by University from during year University during year University during year during year
$000 (GST inclusive) $000 (GST inclusive)
Mr S J McLauchlan AD Instruments PTY Limited (D) 207 - 236 - Aurora Energy Limited (D) 26 - 43 - Cargill Hotel 2002 Limited (C) 40 - 33 - Delta Limited (D) 26 16 35 19 Dunedin International Airport Limited (C) 6 - 6 - Institute of Directors Otago & Southland (C) 5 - 4 - Lund South Limited ( D ) 42 - 231 - Otago Community Hospice Trust (C) 11 - 11 - Otago Southland Employers Assn (Trustee) 8 1 8 2 Pharmac (C) - 16 - 4 Scenic Circle Hotels Limited (D) 2 - 10 - Scott Technology Limited (C) - - - - Southern DHB (Crown Monitor) 2,500 11,798 2,909 10,499 University of Otago Foundation Studies Limited (D) See intergroup note above See intergroup note above University of Otago Foundation Trust (Trustee) See intergroup note above See intergroup note above University of Otago (Pro-Chancellor) - - - - University of Otago Rugby Club (Committee) - 20 - 15 ZNH Limited (D) - - - - Mr McLauchlan is a director and/or shareholder of numerous other companies that had no related party transactions with theUniversity during the year. Ms D C Matahaere-Atariki Arai Te Uru Whare Hauora (Executive Director) - 1 - 1 Bathgate Park Primary School (C) - - - - Brockville Primary School Dunedin (Trustee) - - - - Family and Community Services - Advisory Council (Member) - - - - Ministry of Health - NGO Working Group (Member) 42 5,634 66 7,658 National Taskforce on Violence (Member) - - - - Otakou Runanga (C) - - - - Southern Primary Health Organisation (Board Member) - 20 - 28
Ms M A Morgan Arana College (College Council Member) - - - -Stuart Residence Halls Council (Board Member) - 15 - 12 University of Otago (Employee) - - - -
Mr J K Rowe (term completed Dec 2012) Otago University Students’ Association (Vice President) na na 3,376 113 Planet Media Dunedin Limited (D) na na 108 12 University of Otago (Student) na na - -
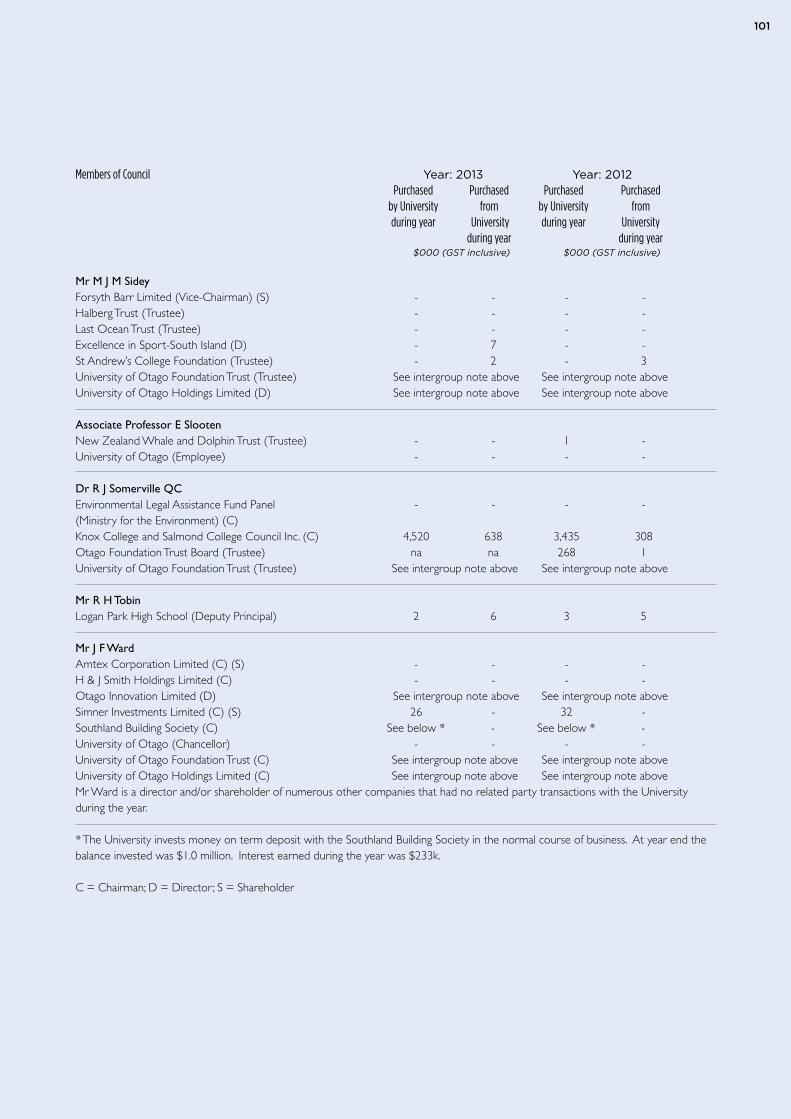
101101
Members of Council Year: 2013 Year: 2012 Purchased Purchased Purchased Purchased by University from by University from during year University during year University during year during year
$000 (GST inclusive) $000 (GST inclusive)
Mr M J M Sidey Forsyth Barr Limited (Vice-Chairman) (S) - - - - Halberg Trust (Trustee) - - - - Last Ocean Trust (Trustee) - - - - Excellence in Sport-South Island (D) - 7 - - St Andrew’s College Foundation (Trustee) - 2 - 3 University of Otago Foundation Trust (Trustee) See intergroup note above See intergroup note above University of Otago Holdings Limited (D) See intergroup note above See intergroup note above Associate Professor E Slooten New Zealand Whale and Dolphin Trust (Trustee) - - 1 - University of Otago (Employee) - - - - Dr R J Somerville QC Environmental Legal Assistance Fund Panel - - - - (Ministry for the Environment) (C) Knox College and Salmond College Council Inc. (C) 4,520 638 3,435 308 Otago Foundation Trust Board (Trustee) na na 268 1 University of Otago Foundation Trust (Trustee) See intergroup note above See intergroup note above Mr R H Tobin Logan Park High School (Deputy Principal) 2 6 3 5 Mr J F Ward Amtex Corporation Limited (C) (S) - - - - H & J Smith Holdings Limited (C) - - - - Otago Innovation Limited (D) See intergroup note above See intergroup note above Simner Investments Limited (C) (S) 26 - 32 - Southland Building Society (C) See below * - See below * -University of Otago (Chancellor) - - - - University of Otago Foundation Trust (C) See intergroup note above See intergroup note above University of Otago Holdings Limited (C) See intergroup note above See intergroup note above Mr Ward is a director and/or shareholder of numerous other companies that had no related party transactions with the Universityduring the year. * The University invests money on term deposit with the Southland Building Society in the normal course of business. At year end thebalance invested was $1.0 million. Interest earned during the year was $233k. C = Chairman; D = Director; S = Shareholder
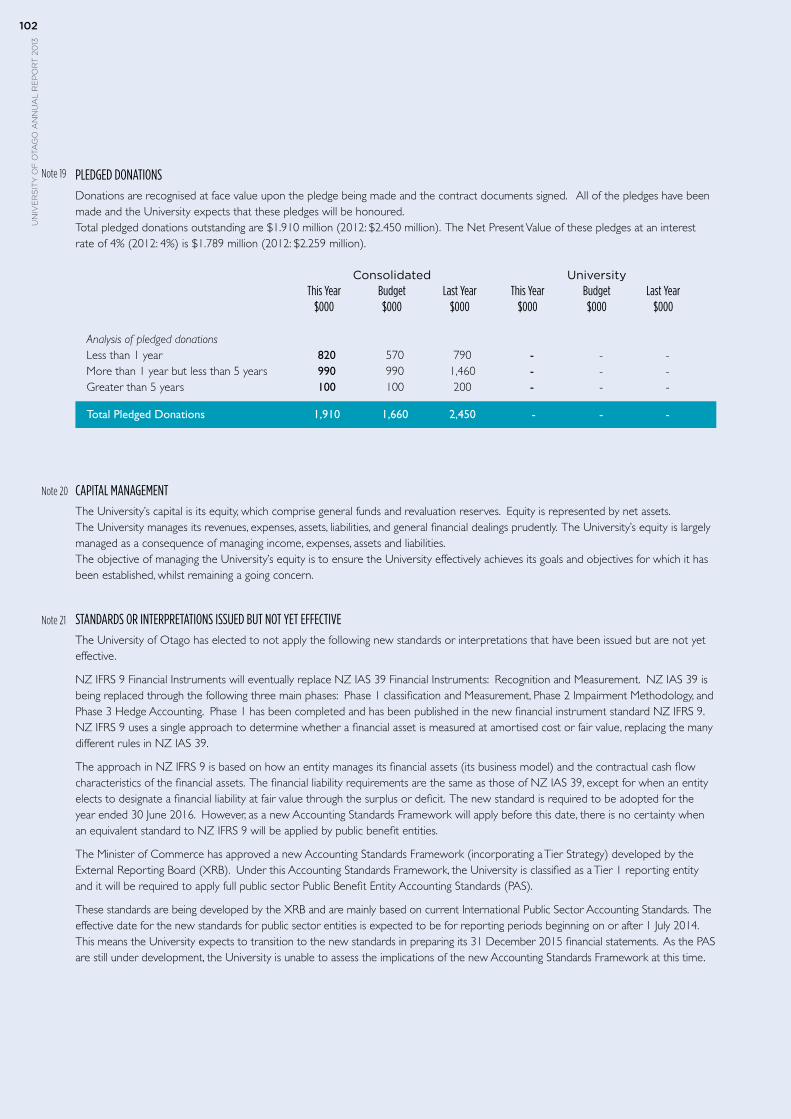
un
ive
rs
ity
of
ota
go
an
nu
al
re
po
rt
20
13102
un
ive
rs
ity
of
ota
go
an
nu
al
re
po
rt
20
13102
PLEDGED DONATIONS Donations are recognised at face value upon the pledge being made and the contract documents signed. All of the pledges have beenmade and the University expects that these pledges will be honoured.Total pledged donations outstanding are $1.910 million (2012: $2.450 million). The Net Present Value of these pledges at an interestrate of 4% (2012: 4%) is $1.789 million (2012: $2.259 million). Consolidated University This Year Budget Last Year This Year Budget Last Year $000 $000 $000 $000 $000 $000
Analysis of pledged donations Less than 1 year 820 570 790 - - - More than 1 year but less than 5 years 990 990 1,460 - - - Greater than 5 years 100 100 200 - - -
Total Pledged Donations 1,910 1,660 2,450 - - -
CAPITAL MANAGEMENT The University’s capital is its equity, which comprise general funds and revaluation reserves. Equity is represented by net assets.The University manages its revenues, expenses, assets, liabilities, and general financial dealings prudently. The University’s equity is largelymanaged as a consequence of managing income, expenses, assets and liabilities.The objective of managing the University’s equity is to ensure the University effectively achieves its goals and objectives for which it hasbeen established, whilst remaining a going concern. STANDARDS OR INTERPRETATIONS ISSUED BUT NOT YET EFFECTIVEThe University of Otago has elected to not apply the following new standards or interpretations that have been issued but are not yet effective.
NZ IFRS 9 Financial Instruments will eventually replace NZ IAS 39 Financial Instruments: Recognition and Measurement. NZ IAS 39 is being replaced through the following three main phases: Phase 1 classification and Measurement, Phase 2 Impairment Methodology, and Phase 3 Hedge Accounting. Phase 1 has been completed and has been published in the new financial instrument standard NZ IFRS 9. NZ IFRS 9 uses a single approach to determine whether a financial asset is measured at amortised cost or fair value, replacing the many different rules in NZ IAS 39.
The approach in NZ IFRS 9 is based on how an entity manages its financial assets (its business model) and the contractual cash flow characteristics of the financial assets. The financial liability requirements are the same as those of NZ IAS 39, except for when an entity elects to designate a financial liability at fair value through the surplus or deficit. The new standard is required to be adopted for the year ended 30 June 2016. However, as a new Accounting Standards Framework will apply before this date, there is no certainty when an equivalent standard to NZ IFRS 9 will be applied by public benefit entities.
The Minister of Commerce has approved a new Accounting Standards Framework (incorporating a Tier Strategy) developed by the External Reporting Board (XRB). Under this Accounting Standards Framework, the University is classified as a Tier 1 reporting entity and it will be required to apply full public sector Public Benefit Entity Accounting Standards (PAS).
These standards are being developed by the XRB and are mainly based on current International Public Sector Accounting Standards. The effective date for the new standards for public sector entities is expected to be for reporting periods beginning on or after 1 July 2014. This means the University expects to transition to the new standards in preparing its 31 December 2015 financial statements. As the PAS are still under development, the University is unable to assess the implications of the new Accounting Standards Framework at this time.
Note 20
Note 21
Note 19

103103
Note 22
Due to the change in the Accounting Standards Framework for public benefit entities, it is expected that all new NZ IFRS and amendments to existing NZ IFRS will not be applicable to public benefit entities. Therefore, the XRB has effectively frozen the financial reporting requirements for public benefit entities up until the new Accounting Standard Framework is effective. Accordingly, no disclosure has been made about new or amended NZ IFRS that exclude public benefit entities from their scope.
There are no other standards or interpretations issued, but not yet effective, that the University of Otago has not yet applied.
EVENTS AFTER THE BALANCE DATE There were no significant events after balance date.
un
ive
rs
ity
of
ota
go
an
nu
al
re
po
rt
20
13104
un
ive
rs
ity
of
ota
go
an
nu
al
re
po
rt
20
13104
Independent Auditor’s Report
To the readers of the University of Otago and group’s financial statements and Statement of Service Performance for the year ended 31 December 2013
The Auditor-General is the auditor of the University of Otago (the University) and group. The Auditor-General has appointed me, Andy Burns, using the staff and resources of Audit New Zealand, to carry out the audit of the financial statements and non-financial performance information of the University and group on her behalf.
We have audited:
• the financial statements of the University and group on pages 64 to 103, that comprise the statement of financial position and statement of commitments and contingencies as at 31 December 2013, the statement of accounting policies, statement of financial performance, statement of comprehensive income, statement of changes in equity and statement of cash flows for the year ended on that date and the notes to the financial statements that include other explanatory information; and
• the non-financial performance information of the University and group in the statement of service performance on pages 44 to 49 and group entities report on pages 58 to 60.
Opinion
In our opinion:
• the financial statements of the University and group on pages 64 to 103:
– comply with generally accepted accounting practice in New Zealand; and
– fairly reflect the University and group’s:
~ financial position as at 31 December 2013; and
~ financial performance and cash flows for the year ended on that date;
• the non-financial performance information of the University and group on pages 44 to 49 and pages 58 to 60 fairly reflects the University and group’s service performance achievements measured against the performance targets adopted in the investment plan for the year ended 31 December 2013.
Our audit was completed on 8 April 2014. This is the date at which our opinion is expressed.
The basis of our opinion is explained below. In addition, we outline the responsibilities of the Council and our responsibilities, and we explain our independence.
Basis of opinion
We carried out our audit in accordance with the Auditor-General’s Auditing Standards, which incorporate the International Standards on Auditing (New Zealand). Those standards require that we comply with ethical requirements and plan and carry out our audit to obtain reasonable assurance about whether the financial statements and non-financial performance information are free from material misstatement.
Material misstatements are differences or omissions of amounts and disclosures that, in our judgement, are likely to influence readers’ overall understanding of the financial statements and non-financial performance information. If we had found material misstatements that were not corrected, we would have referred to them in our opinion.
An audit involves carrying out procedures to obtain audit evidence about the amounts and disclosures in the financial statements and non-financial performance information. The procedures selected depend on our judgement, including our assessment of risks of material misstatement of the financial statements and non-financial performance information, whether due to fraud or error. In making those risk assessments, we consider internal control relevant to the University and group’s preparation of the financial statements and non-financial performance information that fairly reflect the matters to which they relate. We consider internal control in order to design audit procedures that are appropriate in the circumstances but not for the purpose of expressing an opinion on the effectiveness of the University and group’s internal control.
105105
An audit also involves evaluating:
• the appropriateness of accounting policies used and whether they have been consistently applied;
• the reasonableness of the significant accounting estimates and judgements made by the Council;
• the adequacy of all disclosures in the financial statements and non-financial performance information; and
• the overall presentation of the financial statements and non-financial performance information.
We did not examine every transaction, nor do we guarantee complete accuracy of the financial statements and non-financial performance information. Also we did not evaluate the security and controls over the electronic publication of the financial statements and non-financial performance information.
We have obtained all the information and explanations we have required and we believe we have obtained sufficient and appropriate audit evidence to provide a basis for our audit opinion.
Responsibilities of the Council
The Council is responsible for preparing financial statements that:
• comply with generally accepted accounting practice in New Zealand; and
• fairly reflect the University and group’s financial position, financial performance and cash flows.
The Council is also responsible for preparing non-financial performance information that fairly reflects the University and group’s service performance achievements measured against the performance targets adopted in the investment plan.
The Council is responsible for such internal control as it determines is necessary to enable the preparation of financial statements and non-financial performance information that are free from material misstatement, whether due to fraud or error. The Council is also responsible for the publication of the financial statements and non-financial performance information, whether in printed or electronic form.
The Council’s responsibilities arise from the Education Act 1989 and the Crown Entities Act 2004.
Responsibilities of the Auditor
We are responsible for expressing an independent opinion on the financial statements and non-financial performance information and reporting that opinion to you based on our audit. Our responsibility arises from section 15 of the Public Audit Act 2001 and the Crown Entities Act 2004.
Independence
When carrying out the audit, we followed the independence requirements of the Auditor-General, which incorporate the independence requirements of the External Reporting Board.
In addition to the audit, we carried out an assurance engagement reporting on the Vice-Chancellor’s annual declaration on the Performance-Based Research Fund external research income. This assurance engagement is compatible with those independence requirements.
Other than the audit, we have no relationship with or interests in the University or any of its subsidiaries.
Andy Burns
Audit New Zealand On behalf of the Auditor-General Dunedin, New Zealand
un
ive
rs
ity
of
ota
go
an
nu
al
re
po
rt
20
13106
This report has been prepared in accordance with clause 6 of the Ministerial Direction on Compulsory Student Services Fees 2012.
This clause requires the University to publish a description of the services funded out of the compulsory student services fee and an income and expenditure statement for each type of student service in its Annual Report.
Summary
During 2013, the University and OUSA reviewed the previous year’s Service Level Agreement (SLA) and related service level performance. While both parties were very pleased with both the quality and level of outputs, a number of minor improvements were identified and addressed through some minor changes to the 2013 SLA with OUSA and other third party providers. OUSA remained the principal provider of third-party services in 2013. The University also provided a number of services funded from the Student Services Fee.
University Provided Services funded from the Student Services FeeRecreation Services Recreation and fitness programmes, social
sport, UNIPOL gym.
Student Health Services Primary health care via GPs, practice nurses, counsellors, health educator and a psychiatrist.
Careers Services Careers advice, guidance and providing employment information to assist students transitioning from University to the workplace.
Internet Access – Sport, The provision of high-speed internet for Cultural and Recreation on-campus students’ personal use (non academic purposes). It does not cover internet use for academic purposes, which is covered by tuition fees.
Financial Support Student emergency fund. and Advice
Advocacy: Counselling Chaplaincy service. and Pastoral Care
OUSA Provided Services funded from the Student Services FeeStudent Support Centre • Co-ordination of the system of senate, (Advocacy and Legal division, department and class Advice; Counselling; representatives Careers) • Advocacy/Student Support Centre programmes
• Orientation in collaboration with the University • Support for Te Roopü • Financial support and advice • Advocacy and pastoral care • Education Quality Support Network • Careers guidance through volunteering in conjunction with the University • Student Job Search.
Clubs and Societies • Sports, recreation and cultural activities (Sport and Recreation • USNZ level sports and games and Cultural Activities) tournaments • Blues and Golds sports and cultural awards • Orientation • Capping Week and Capping Show • Battle of the Bands • Market days • Re-Orientation • International food festival • Music gigs • Postgrad coffee hour • Film Festival and World Cinema Showcase • Future DJ • Art week • Volunteers • Te Roopü.
Media Student communication activities • Planet Media Dunedin • Critic Magazine • Radio One 91FM • Onefest • Orientation Magazine • Facebook presence • Web presence.
Childcare Services Provided by the Otago University Childcare AssociationChildcare Pre-school childcare services for students who are parents.
Chaplaincy Services Provided by the Otago Tertiary Chaplaincy Trust BoardAdvocacy: Counselling Chaplaincy service provided by the Otago and Pastoral Care Tertiary Chaplaincy Trust Board.
Student Services levy report
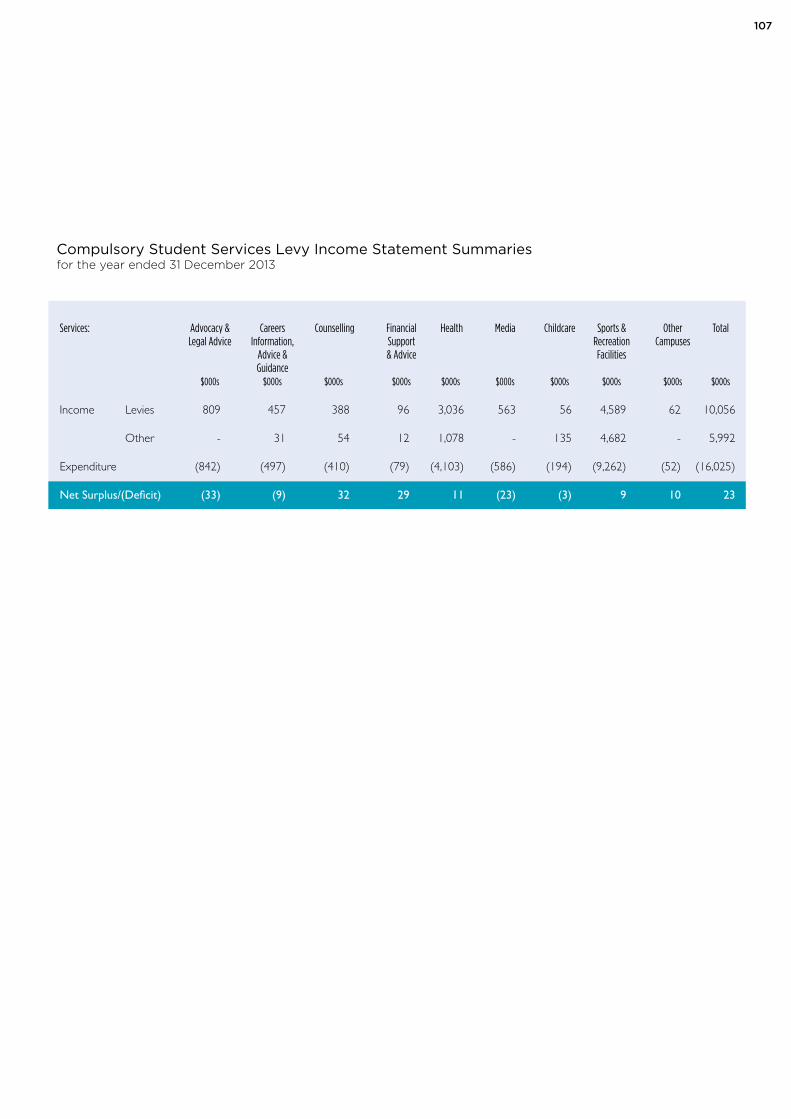
107
Compulsory Student Services Levy Income Statement Summariesfor the year ended 31 December 2013
Services: Advocacy & Careers Counselling Financial Health Media Childcare Sports & Other Total Legal Advice Information, Support Recreation Campuses Advice & & Advice Facilities Guidance $000s $000s $000s $000s $000s $000s $000s $000s $000s $000s
Income Levies 809 457 388 96 3,036 563 56 4,589 62 10,056
Other - 31 54 12 1,078 - 135 4,682 - 5,992
Expenditure (842) (497) (410) (79) (4,103) (586) (194) (9,262) (52) (16,025)
Net Surplus/(Deficit) (33) (9) 32 29 11 (23) (3) 9 10 23
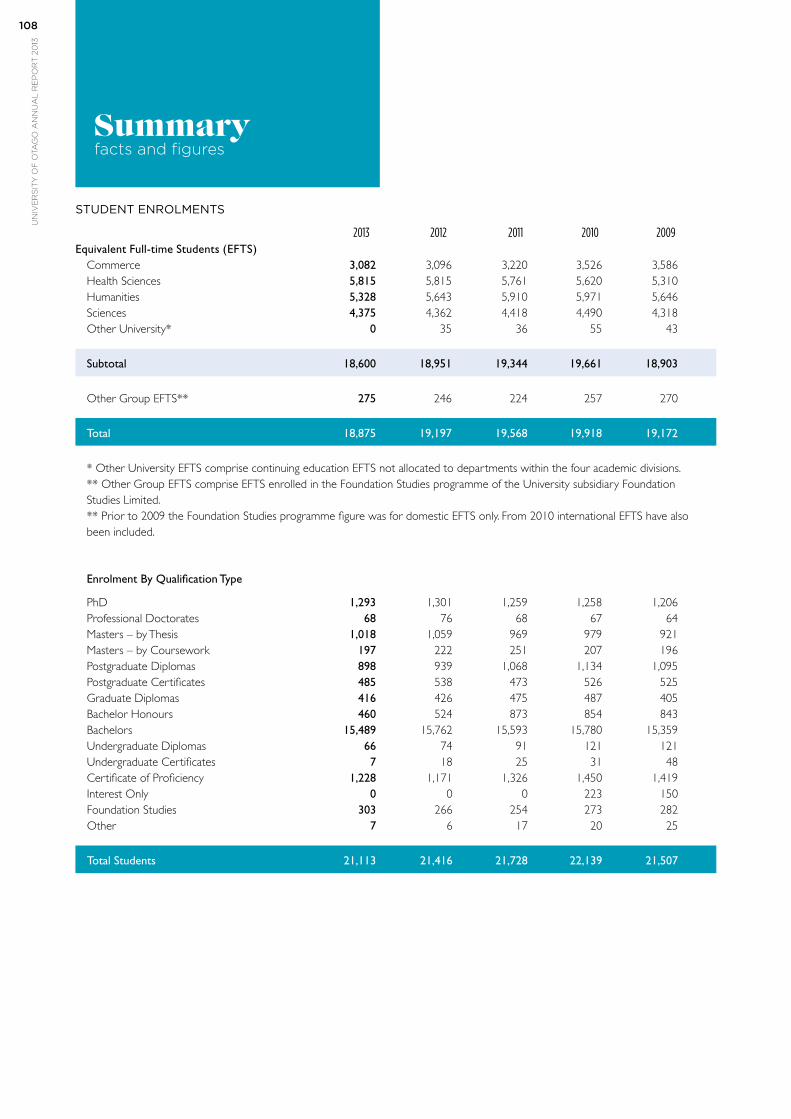
un
ive
rs
ity
of
ota
go
an
nu
al
re
po
rt
20
13108
STUDENT ENROLMENTS
2013 2012 2011 2010 2009 Equivalent Full-time Students (EFTS)
Commerce 3,082 3,096 3,220 3,526 3,586Health Sciences 5,815 5,815 5,761 5,620 5,310 Humanities 5,328 5,643 5,910 5,971 5,646 Sciences 4,375 4,362 4,418 4,490 4,318 Other University* 0 35 36 55 43
Subtotal 18,600 18,951 19,344 19,661 18,903
Other Group EFTS** 275 246 224 257 270
Total 18,875 19,197 19,568 19,918 19,172
* Other University EFTS comprise continuing education EFTS not allocated to departments within the four academic divisions. ** Other Group EFTS comprise EFTS enrolled in the Foundation Studies programme of the University subsidiary Foundation Studies Limited. ** Prior to 2009 the Foundation Studies programme figure was for domestic EFTS only. From 2010 international EFTS have also been included.
Enrolment By Qualification Type
PhD 1,293 1,301 1,259 1,258 1,206Professional Doctorates 68 76 68 67 64Masters – by Thesis 1,018 1,059 969 979 921Masters – by Coursework 197 222 251 207 196Postgraduate Diplomas 898 939 1,068 1,134 1,095Postgraduate Certificates 485 538 473 526 525Graduate Diplomas 416 426 475 487 405Bachelor Honours 460 524 873 854 843Bachelors 15,489 15,762 15,593 15,780 15,359Undergraduate Diplomas 66 74 91 121 121Undergraduate Certificates 7 18 25 31 48Certificate of Proficiency 1,228 1,171 1,326 1,450 1,419Interest Only 0 0 0 223 150Foundation Studies 303 266 254 273 282Other 7 6 17 20 25
Total Students 21,113 21,416 21,728 22,139 21,507
Summaryfacts and figures
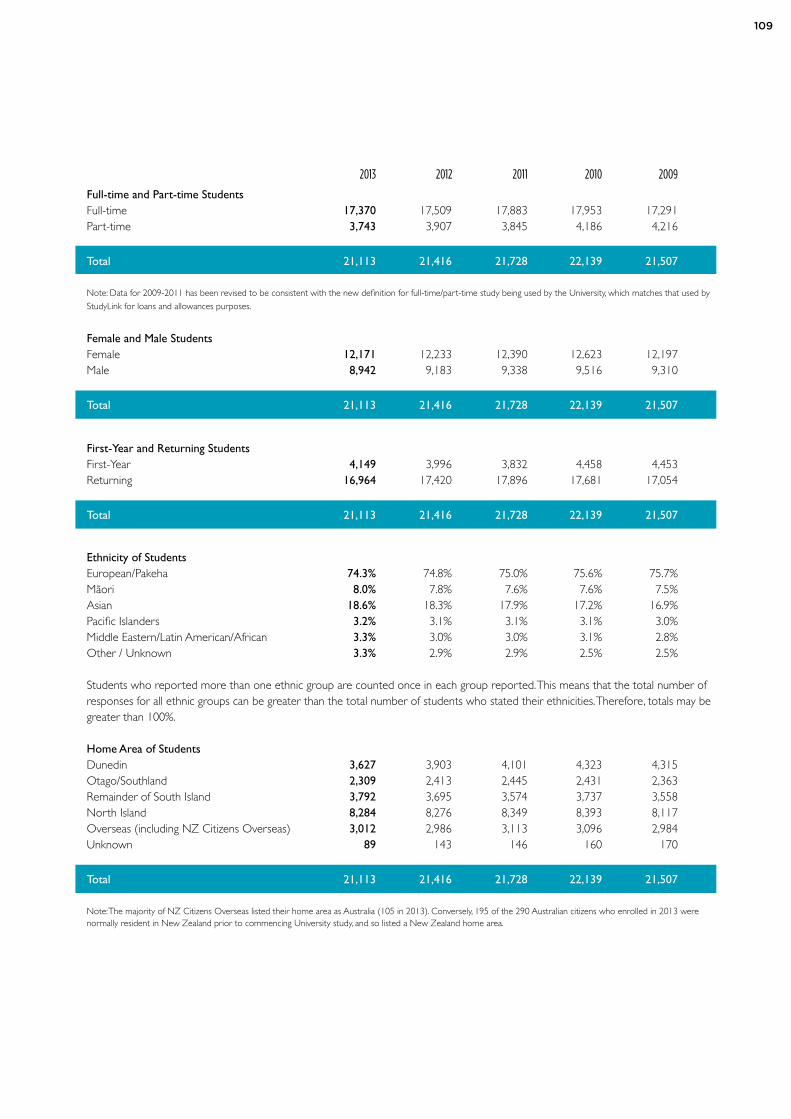
109
2013 2012 2011 2010 2009
Full-time and Part-time Students Full-time 17,370 17,509 17,883 17,953 17,291Part-time 3,743 3,907 3,845 4,186 4,216
Total 21,113 21,416 21,728 22,139 21,507
Note: Data for 2009-2011 has been revised to be consistent with the new definition for full-time/part-time study being used by the University, which matches that used by StudyLink for loans and allowances purposes.
Female and Male Students Female 12,171 12,233 12,390 12,623 12,197Male 8,942 9,183 9,338 9,516 9,310
Total 21,113 21,416 21,728 22,139 21,507
First-Year and Returning Students First-Year 4,149 3,996 3,832 4,458 4,453 Returning 16,964 17,420 17,896 17,681 17,054
Total 21,113 21,416 21,728 22,139 21,507
Ethnicity of Students European/Pakeha 74.3% 74.8% 75.0% 75.6% 75.7%Mäori 8.0% 7.8% 7.6% 7.6% 7.5%Asian 18.6% 18.3% 17.9% 17.2% 16.9%Pacific Islanders 3.2% 3.1% 3.1% 3.1% 3.0%Middle Eastern/Latin American/African 3.3% 3.0% 3.0% 3.1% 2.8%Other / Unknown 3.3% 2.9% 2.9% 2.5% 2.5% Students who reported more than one ethnic group are counted once in each group reported. This means that the total number of responses for all ethnic groups can be greater than the total number of students who stated their ethnicities. Therefore, totals may be greater than 100%. Home Area of Students Dunedin 3,627 3,903 4,101 4,323 4,315Otago/Southland 2,309 2,413 2,445 2,431 2,363Remainder of South Island 3,792 3,695 3,574 3,737 3,558North Island 8,284 8,276 8,349 8,393 8,117Overseas (including NZ Citizens Overseas) 3,012 2,986 3,113 3,096 2,984Unknown 89 143 146 160 170
Total 21,113 21,416 21,728 22,139 21,507
Note: The majority of NZ Citizens Overseas listed their home area as Australia (105 in 2013). Conversely, 195 of the 290 Australian citizens who enrolled in 2013 were normally resident in New Zealand prior to commencing University study, and so listed a New Zealand home area.
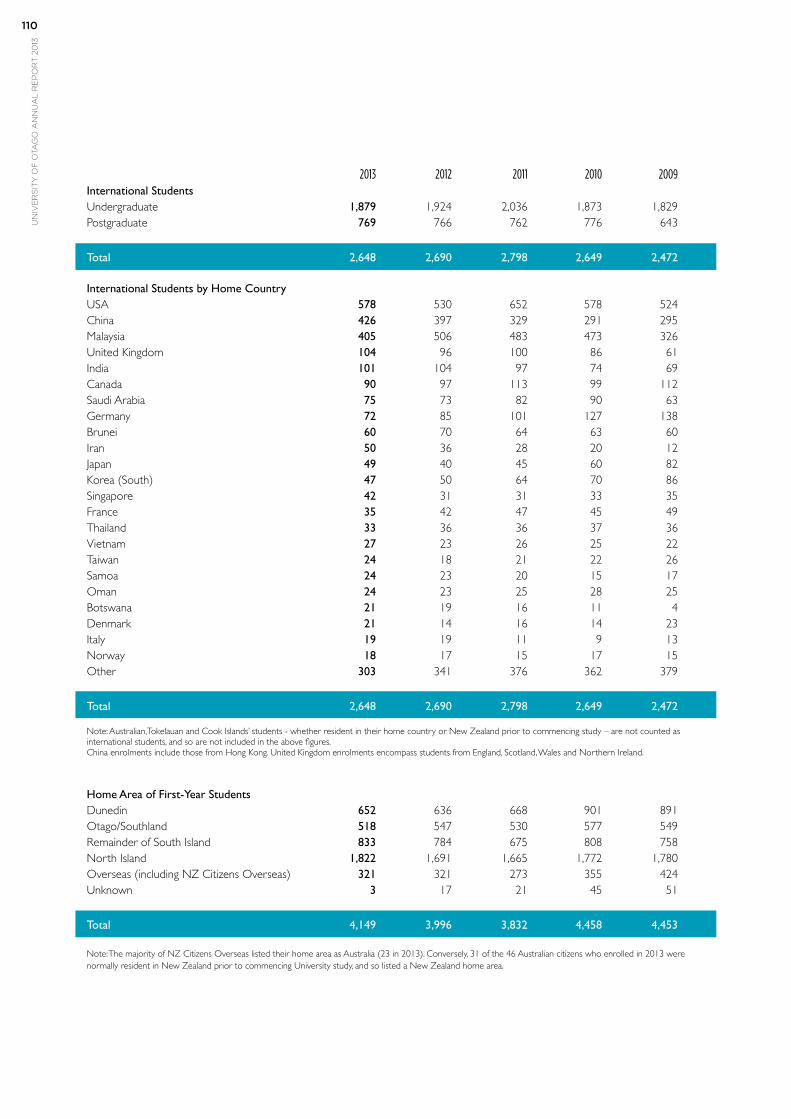
un
ive
rs
ity
of
ota
go
an
nu
al
re
po
rt
20
13110
2013 2012 2011 2010 2009International Students Undergraduate 1,879 1,924 2,036 1,873 1,829 Postgraduate 769 766 762 776 643
Total 2,648 2,690 2,798 2,649 2,472
International Students by Home Country USA 578 530 652 578 524China 426 397 329 291 295Malaysia 405 506 483 473 326United Kingdom 104 96 100 86 61India 101 104 97 74 69Canada 90 97 113 99 112Saudi Arabia 75 73 82 90 63Germany 72 85 101 127 138Brunei 60 70 64 63 60Iran 50 36 28 20 12Japan 49 40 45 60 82Korea (South) 47 50 64 70 86Singapore 42 31 31 33 35France 35 42 47 45 49Thailand 33 36 36 37 36Vietnam 27 23 26 25 22Taiwan 24 18 21 22 26Samoa 24 23 20 15 17Oman 24 23 25 28 25Botswana 21 19 16 11 4Denmark 21 14 16 14 23Italy 19 19 11 9 13Norway 18 17 15 17 15Other 303 341 376 362 379
Total 2,648 2,690 2,798 2,649 2,472
Note: Australian,Tokelauan and Cook Islands’ students - whether resident in their home country or New Zealand prior to commencing study – are not counted as international students, and so are not included in the above figures. China enrolments include those from Hong Kong. United Kingdom enrolments encompass students from England, Scotland, Wales and Northern Ireland.
Home Area of First-Year Students Dunedin 652 636 668 901 891Otago/Southland 518 547 530 577 549Remainder of South Island 833 784 675 808 758North Island 1,822 1,691 1,665 1,772 1,780Overseas (including NZ Citizens Overseas) 321 321 273 355 424Unknown 3 17 21 45 51
Total 4,149 3,996 3,832 4,458 4,453 Note: The majority of NZ Citizens Overseas listed their home area as Australia (23 in 2013). Conversely, 31 of the 46 Australian citizens who enrolled in 2013 were normally resident in New Zealand prior to commencing University study, and so listed a New Zealand home area.
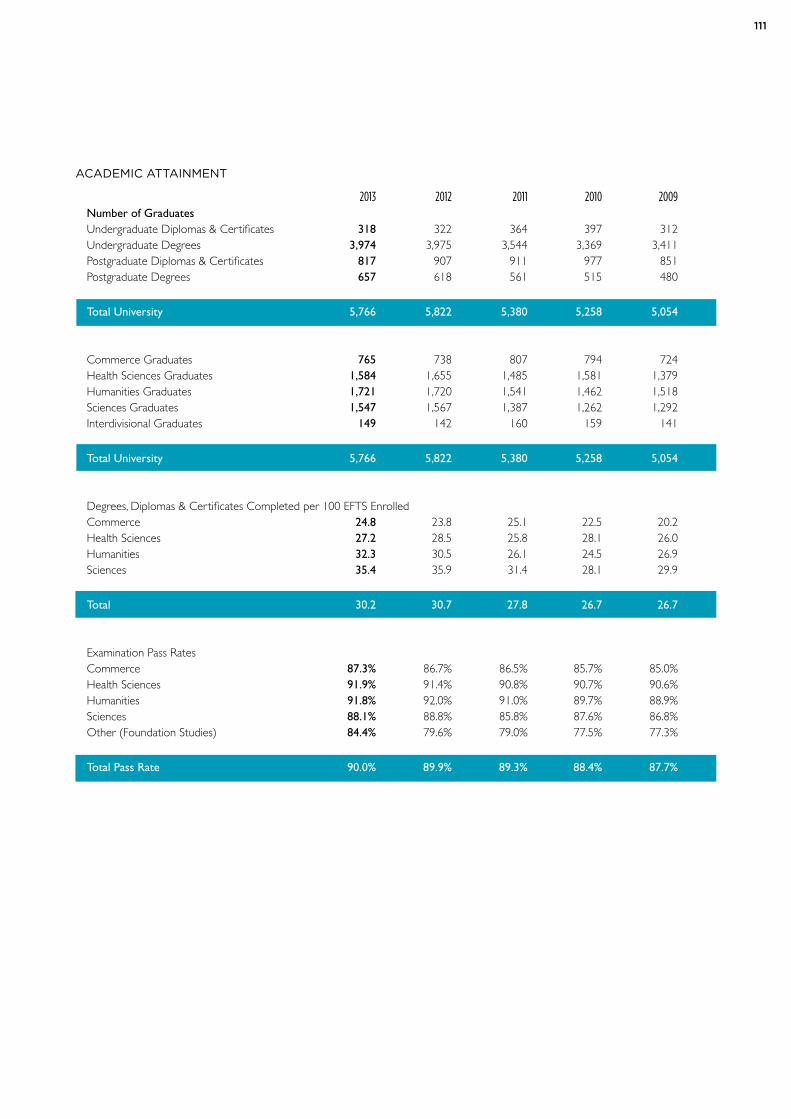
111
ACADEMIC ATTAINMENT
2013 2012 2011 2010 2009Number of Graduates Undergraduate Diplomas & Certificates 318 322 364 397 312 Undergraduate Degrees 3,974 3,975 3,544 3,369 3,411 Postgraduate Diplomas & Certificates 817 907 911 977 851 Postgraduate Degrees 657 618 561 515 480
Total University 5,766 5,822 5,380 5,258 5,054 Commerce Graduates 765 738 807 794 724 Health Sciences Graduates 1,584 1,655 1,485 1,581 1,379Humanities Graduates 1,721 1,720 1,541 1,462 1,518Sciences Graduates 1,547 1,567 1,387 1,262 1,292Interdivisional Graduates 149 142 160 159 141
Total University 5,766 5,822 5,380 5,258 5,054 Degrees, Diplomas & Certificates Completed per 100 EFTS Enrolled Commerce 24.8 23.8 25.1 22.5 20.2Health Sciences 27.2 28.5 25.8 28.1 26.0Humanities 32.3 30.5 26.1 24.5 26.9Sciences 35.4 35.9 31.4 28.1 29.9
Total 30.2 30.7 27.8 26.7 26.7 Examination Pass Rates Commerce 87.3% 86.7% 86.5% 85.7% 85.0%Health Sciences 91.9% 91.4% 90.8% 90.7% 90.6%Humanities 91.8% 92.0% 91.0% 89.7% 88.9%Sciences 88.1% 88.8% 85.8% 87.6% 86.8%Other (Foundation Studies) 84.4% 79.6% 79.0% 77.5% 77.3%
Total Pass Rate 90.0% 89.9% 89.3% 88.4% 87.7%
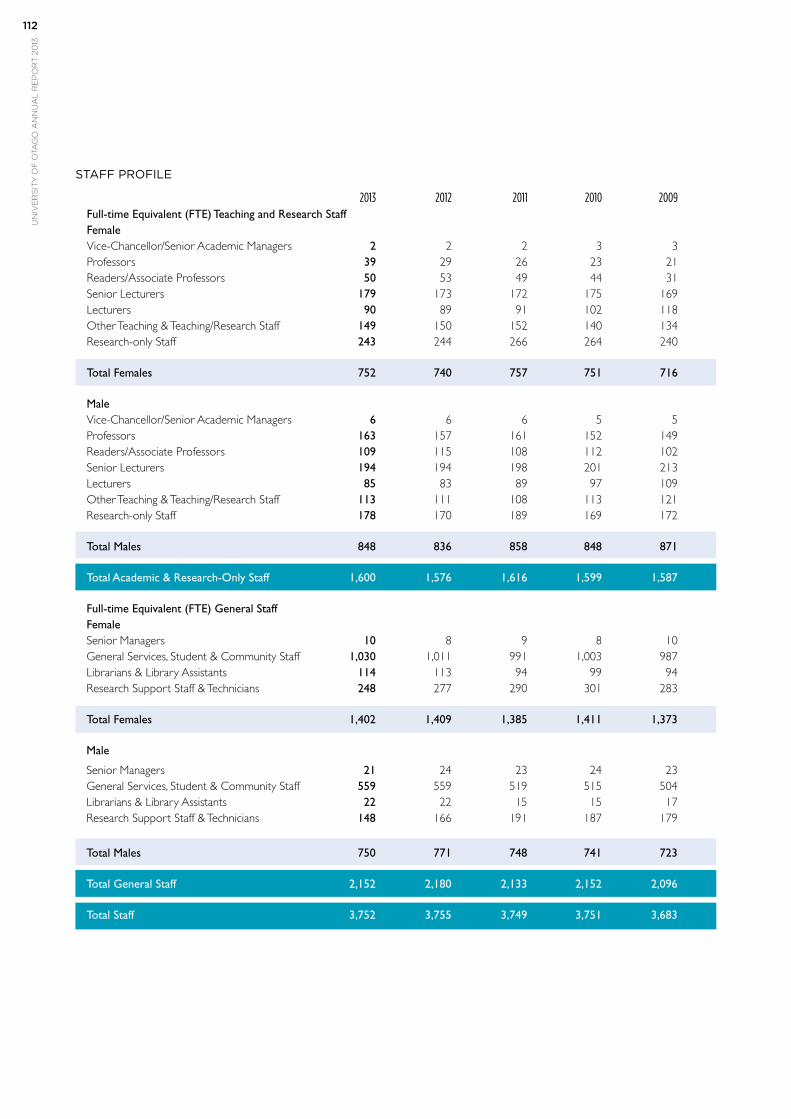
un
ive
rs
ity
of
ota
go
an
nu
al
re
po
rt
20
13112
STAFF PROFILE
2013 2012 2011 2010 2009Full-time Equivalent (FTE) Teaching and Research Staff Female Vice-Chancellor/Senior Academic Managers 2 2 2 3 3 Professors 39 29 26 23 21 Readers/Associate Professors 50 53 49 44 31 Senior Lecturers 179 173 172 175 169 Lecturers 90 89 91 102 118 Other Teaching & Teaching/Research Staff 149 150 152 140 134 Research-only Staff 243 244 266 264 240
Total Females 752 740 757 751 716
Male Vice-Chancellor/Senior Academic Managers 6 6 6 5 5 Professors 163 157 161 152 149 Readers/Associate Professors 109 115 108 112 102 Senior Lecturers 194 194 198 201 213 Lecturers 85 83 89 97 109 Other Teaching & Teaching/Research Staff 113 111 108 113 121 Research-only Staff 178 170 189 169 172
Total Males 848 836 858 848 871
Total Academic & Research-Only Staff 1,600 1,576 1,616 1,599 1,587
Full-time Equivalent (FTE) General Staff Female Senior Managers 10 8 9 8 10 General Services, Student & Community Staff 1,030 1,011 991 1,003 987 Librarians & Library Assistants 114 113 94 99 94 Research Support Staff & Technicians 248 277 290 301 283
Total Females 1,402 1,409 1,385 1,411 1,373
Male
Senior Managers 21 24 23 24 23 General Services, Student & Community Staff 559 559 519 515 504 Librarians & Library Assistants 22 22 15 15 17 Research Support Staff & Technicians 148 166 191 187 179
Total Males 750 771 748 741 723
Total General Staff 2,152 2,180 2,133 2,152 2,096
Total Staff 3,752 3,755 3,749 3,751 3,683
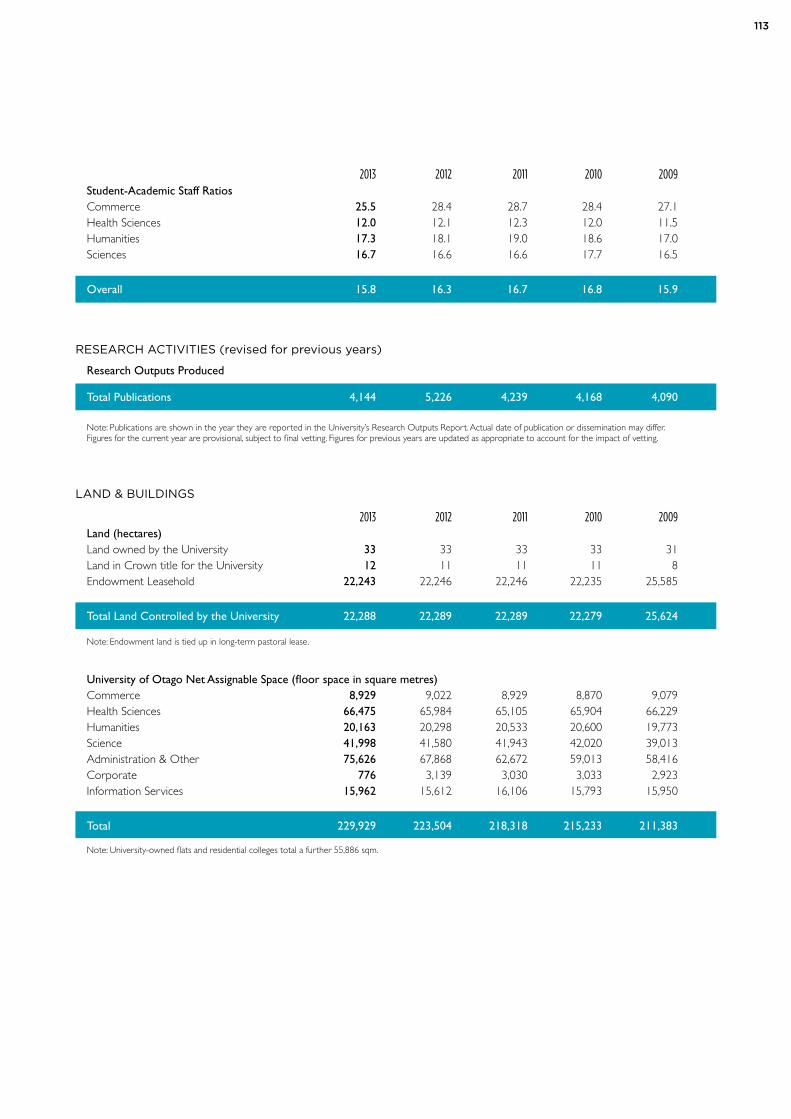
113
2013 2012 2011 2010 2009 Student-Academic Staff Ratios Commerce 25.5 28.4 28.7 28.4 27.1Health Sciences 12.0 12.1 12.3 12.0 11.5Humanities 17.3 18.1 19.0 18.6 17.0Sciences 16.7 16.6 16.6 17.7 16.5
Overall 15.8 16.3 16.7 16.8 15.9
RESEARCH ACTIVITIES (revised for previous years)
Research Outputs Produced
Total Publications 4,144 5,226 4,239 4,168 4,090
Note: Publications are shown in the year they are reported in the University’s Research Outputs Report. Actual date of publication or dissemination may differ. Figures for the current year are provisional, subject to final vetting. Figures for previous years are updated as appropriate to account for the impact of vetting.
LAND & BUILDINGS
2013 2012 2011 2010 2009 Land (hectares) Land owned by the University 33 33 33 33 31Land in Crown title for the University 12 11 11 11 8Endowment Leasehold 22,243 22,246 22,246 22,235 25,585
Total Land Controlled by the University 22,288 22,289 22,289 22,279 25,624
Note: Endowment land is tied up in long-term pastoral lease.
University of Otago Net Assignable Space (floor space in square metres)Commerce 8,929 9,022 8,929 8,870 9,079Health Sciences 66,475 65,984 65,105 65,904 66,229Humanities 20,163 20,298 20,533 20,600 19,773Science 41,998 41,580 41,943 42,020 39,013Administration & Other 75,626 67,868 62,672 59,013 58,416Corporate 776 3,139 3,030 3,033 2,923Information Services 15,962 15,612 16,106 15,793 15,950
Total 229,929 223,504 218,318 215,233 211,383
Note: University-owned flats and residential colleges total a further 55,886 sqm.
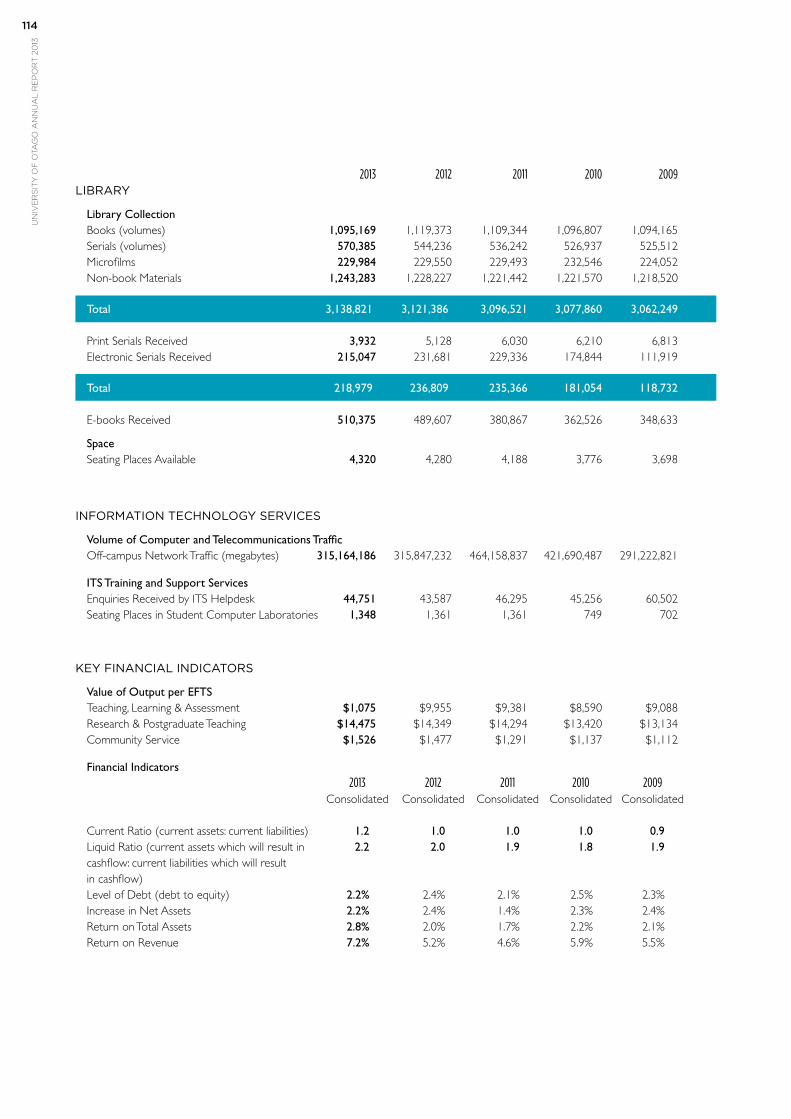
un
ive
rs
ity
of
ota
go
an
nu
al
re
po
rt
20
13114
2013 2012 2011 2010 2009LIBRARY
Library Collection Books (volumes) 1,095,169 1,119,373 1,109,344 1,096,807 1,094,165Serials (volumes) 570,385 544,236 536,242 526,937 525,512Microfilms 229,984 229,550 229,493 232,546 224,052Non-book Materials 1,243,283 1,228,227 1,221,442 1,221,570 1,218,520
Total 3,138,821 3,121,386 3,096,521 3,077,860 3,062,249 Print Serials Received 3,932 5,128 6,030 6,210 6,813Electronic Serials Received 215,047 231,681 229,336 174,844 111,919
Total 218,979 236,809 235,366 181,054 118,732 E-books Received 510,375 489,607 380,867 362,526 348,633
Space Seating Places Available 4,320 4,280 4,188 3,776 3,698
INFORMATION TECHNOLOGY SERVICES
Volume of Computer and Telecommunications Traffic Off-campus Network Traffic (megabytes) 315,164,186 315,847,232 464,158,837 421,690,487 291,222,821
ITS Training and Support Services Enquiries Received by ITS Helpdesk 44,751 43,587 46,295 45,256 60,502 Seating Places in Student Computer Laboratories 1,348 1,361 1,361 749 702
KEY FINANCIAL INDICATORS
Value of Output per EFTS Teaching, Learning & Assessment $1,075 $9,955 $9,381 $8,590 $9,088Research & Postgraduate Teaching $14,475 $14,349 $14,294 $13,420 $13,134Community Service $1,526 $1,477 $1,291 $1,137 $1,112
Financial Indicators 2013 2012 2011 2010 2009 Consolidated Consolidated Consolidated Consolidated Consolidated Current Ratio (current assets: current liabilities) 1.2 1.0 1.0 1.0 0.9 Liquid Ratio (current assets which will result in 2.2 2.0 1.9 1.8 1.9 cashflow: current liabilities which will result in cashflow) Level of Debt (debt to equity) 2.2% 2.4% 2.1% 2.5% 2.3% Increase in Net Assets 2.2% 2.4% 1.4% 2.3% 2.4% Return on Total Assets 2.8% 2.0% 1.7% 2.2% 2.1% Return on Revenue 7.2% 5.2% 4.6% 5.9% 5.5%
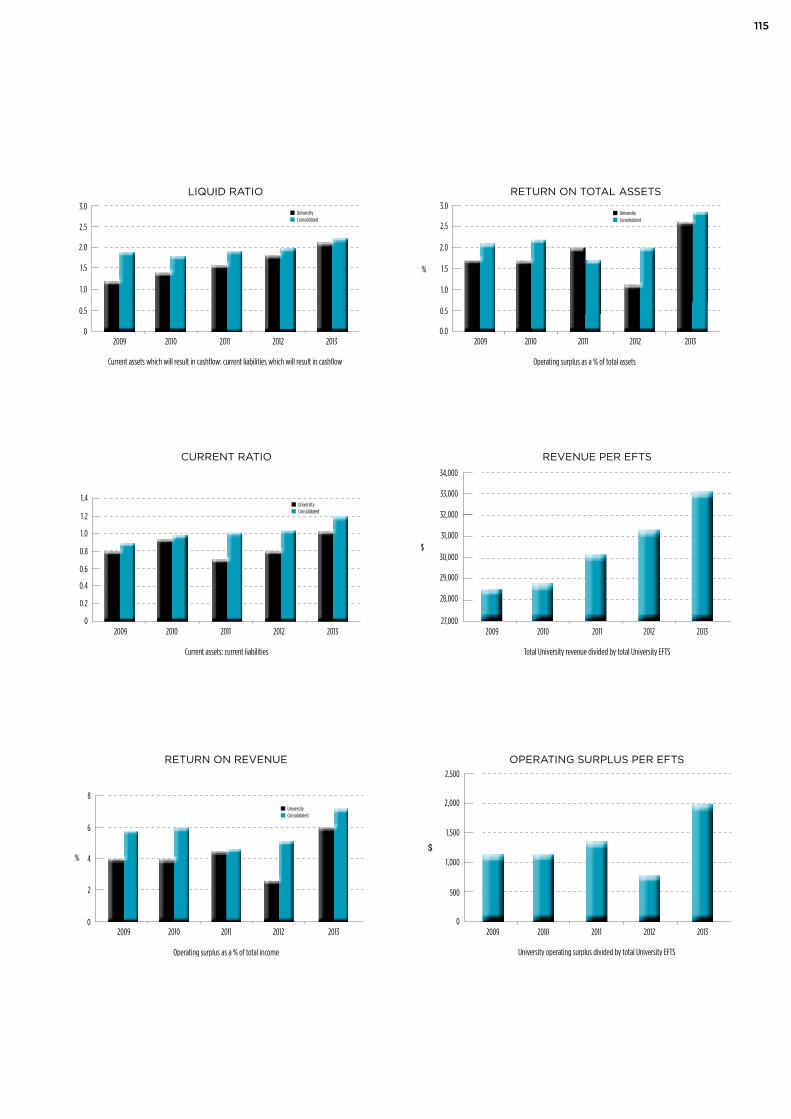
115
Operating surplus as a % of total assets
%
1.0
1.5
2.0
3.0
2.5
0.5
0.0
RETURN ON TOTAL ASSETS
2009 2010 2011 2012 2013
UniversityConsolidated
Operating surplus as a % of total income
8
6
4
2
0
%
RETURN ON REVENUE
2009 2010 2011 2012 2013
UniversityConsolidated
Current assets: current liabilities
1.4
1.2
0.8
0.4
0.2
1.0
0.6
0
CURRENT RATIO
2009 2010 2011 2012 2013
UniversityConsolidated
Current assets which will result in cashflow: current liabilities which will result in cashflow
2009
3.0
2.5
1.5
0.5
2.0
1.0
0
LIQUID RATIO
2010 2011 2012 2013
UniversityConsolidated
Total University revenue divided by total University EFTS
$
27,000
28,000
29,000
31,000
32,000
33,000
30,000
34,000
REVENUE PER EFTS
2009 2010 2011 2012 2013
$
500
1,000
1,500
2,500
2,000
0
OPERATING SURPLUS PER EFTS
University operating surplus divided by total University EFTS
2009 2010 2011 2012 2013
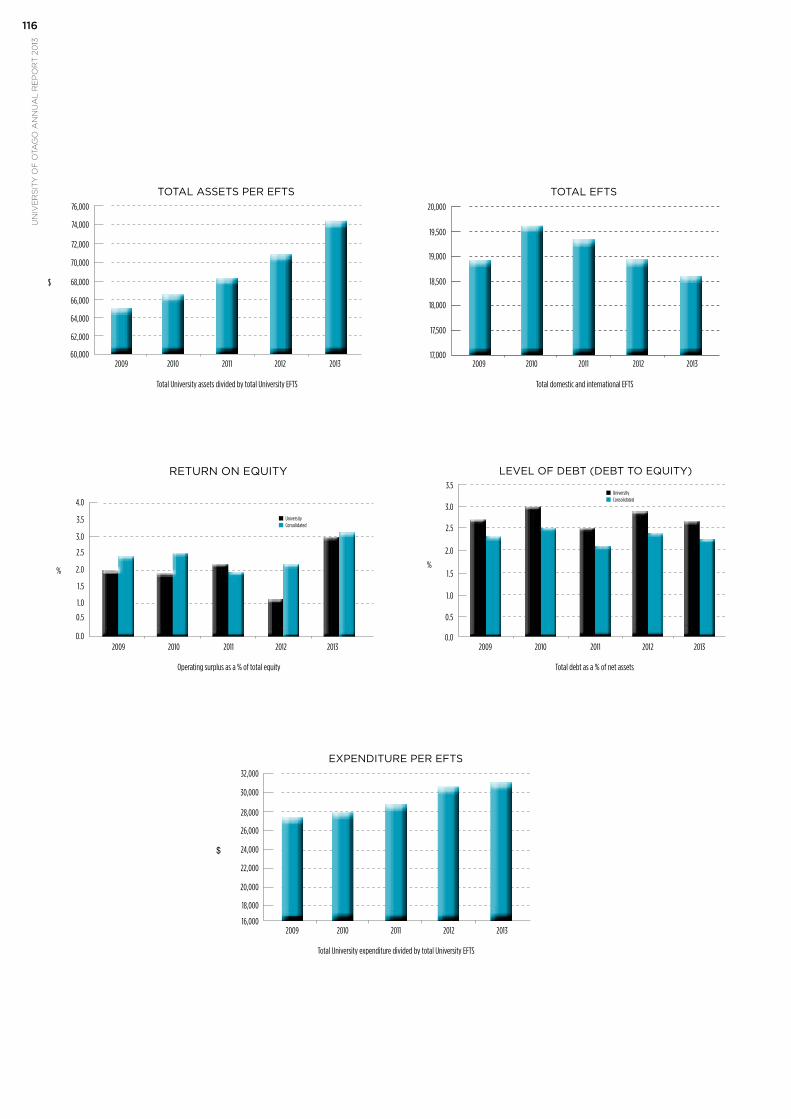
un
ive
rs
ity
of
ota
go
an
nu
al
re
po
rt
20
13116
18,000
18,500
19,000
20,000
19,500
17,500
17,000
TOTAL EFTS
Total domestic and international EFTS
2009 2010 2011 2012 2013
$ 68,000
70,000
72,000
76,000
74,000
66,000
64,000
62,000
60,000
TOTAL ASSETS PER EFTS
Total University assets divided by total University EFTS
2009 2010 2011 2012 2013
%
3.0
2.0
1.0
0.0
4.0
RETURN ON EQUITY
Operating surplus as a % of total equity
0.5
1.5
2.5
3.5
Total debt as a % of net assets
%
1.0
1.5
2.0
2.5
3.0
3.5
0.5
0.0
LEVEL OF DEBT (DEBT TO EQUITY)
UniversityConsolidated
20092009 20102010 20112011 20122012 20132013
$
32,000
30,000
28,000
26,000
24,000
22,000
20,000
18,000
16,000
EXPENDITURE PER EFTS
Total University expenditure divided by total University EFTS
2009 2010 2011 2012 2013
UniversityConsolidated
UN
IVE
RS
ITY
OF
OT
AG
OA
NN
UA
L R
EP
OR
T 2
013
TE
WH
AR
E W
-AN
AN
GA
O O
T-A
GO
2013ANNUAL REPORT
2013ANNUAL REPORT