Embed Size (px)
Citation preview
Bulletin of the Marine Geology, Vol. 35, No. 2, December 2020, pp. 79 to 90
79
Application of Spectral Decomposition and RGB Blending for Delineation of “S” Channel At Asri Basin
Aplikasi Dekomposisi Spektral dan RGB Blending untuk Delineasi Channel "S" di Cekungan Asri
Swasty Aninda Piranti1,2, Shaska Zulivandama2, Noor Cahyo Dwi Aryanto2, Andi Agus Nur3, Ildrem Syafri3
1Study Program of Master, Faculty of Geology, Padjadjaran University2Marine Geological Institute of Indonesia3Faculty of Geology, Padjadjaran University
Corresponding author: [email protected]
(Received 02 October 2020; in revised form 05 October 2020; accepted 13 November 2020)
ABSTRACT: Gita member is part of Talang Akar Formation is known as hydrocarbon reservoir at AsriBasin, eastern part of South Sumatra. This formation consists of several depositional systems such as braidedchannel, meandering channel, fluvial-deltaic, and estuarine system. A channel system was an interestingsystem developed in the Asri Basin, however, to get the channel distribution in Asri Basin is quite challengingbecause the thickness of the channels caused its appearance is generally close or under seismic resolution, theexistence of coal below our target also affects the impression of “S” sand on seismic data. In this study,spectral decomposition and RGB Blending have been successful to identify “S” sand. RGB Blending map isextracted from 15 Hz as low frequency, 45 Hz as middle frequency, and 75 Hz as high frequency. Ourinterpretation was applied at RGB Blending map and reveal the “S” sand is classified as a meanderingchannel depositional system with the main direction of the channel is Northeast – Southwest.
Keywords: spectral decomposition, RGB Blending, Gita reservoir, Asri Basin
ABSTRAK : Anggota Gita merupakan bagian dari Formasi Talang Akar yang dikenal sebagai reservoarhidrokarbon di Cekungan Asri, Sumatra Selatan bagian timur. Formasi ini terdiri dari beberapa sistem pengendapanseperti sistem sungai teranyam, meander, fluvial-delta, dan estuari. Sistem pengendapan sungai purba di CekunganAsri merupakan sistem yang menarik untuk dieksplorasi namun untuk mendapatkan persebaran sungai tersebutmerupakan hal yang menantang dikarenakan tipisnya ketebalan sungai yang mengakibatkan kenampakannya padadata seismik berada disekitar atau bahkan dibawah resolusi seismik, keberadaan lapisan batubara dibawah targetturut mempengaruhi kenampakan pasir “S” pada data seismik. Dekomposisi spektral serta RGB Blending yangdiaplikasikan pada penelitian ini dapat mengidentifikasi pasir “S”. Peta RGB Blending diekstraksi dari beberapafrekuensi, yaitu frekuensi 15 Hz yang diambil sebagai frekuensi rendah, 45 Hz sebagai frekuensi tengah, dan 75 Hzsebagai frekuensi tinggi. Selanjutnya dilakukan interpretasi pada peta hasil RGB Blending dan menunjukkan pasir“S” diklasifikasikan sebagai sungai dengan sistem meander dengan arah utama sedimentasi adalah Timurlaut -Baratdaya.
Kata kunci: dekomposisi spektral, RGB Blending, reservoar Gita, Cekungan Asri
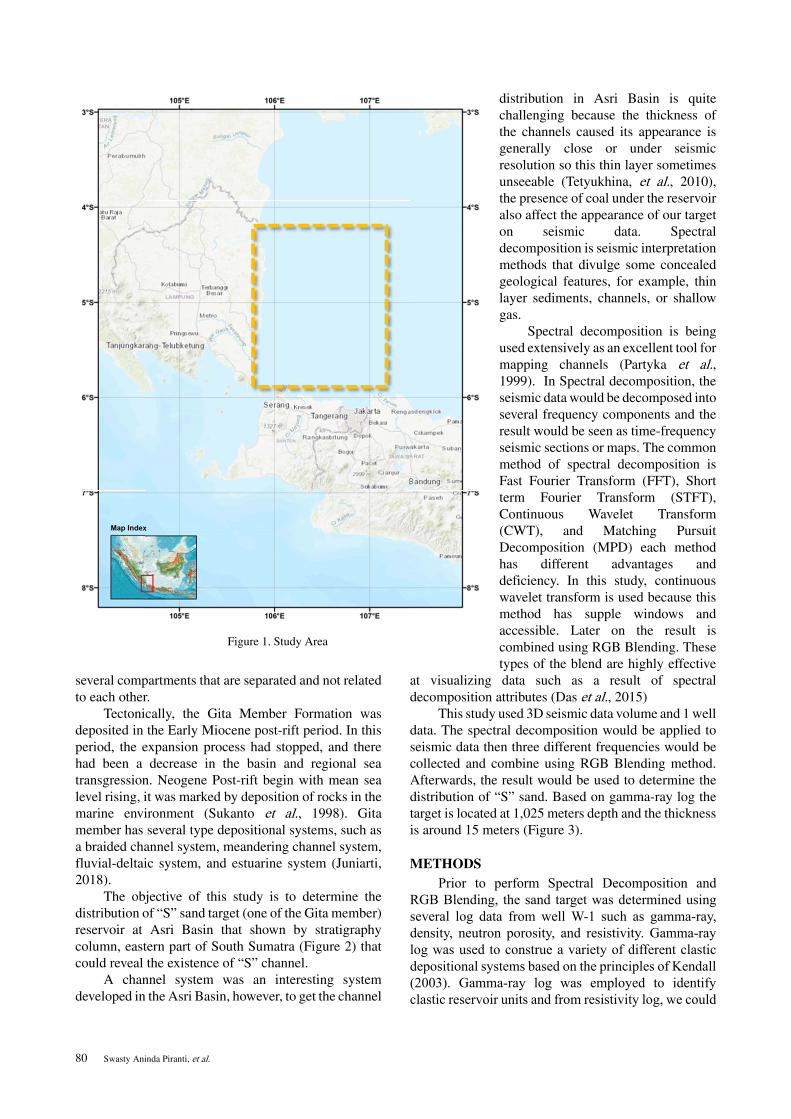
INTRODUCTIONThe study area (Figure 1) is located at Asri Basin,
it is bordered by the Sunda Shelf in the north, the BilitonBasin and the Karimun Jawa Arc in the east, theLampung Highland in the west, and in the south by theWest Java Basin and the Seribu Platform. This basin hasan area of ??about 3500 km2 with a sediment thickness
up to 16,000 feet which was formed in the Paleocene toPleistocene (Sukanto et al., 1998). The oilfields in theAsri Basin are dominated by structural traps and acombination of stratigraphic traps (Young et al., 1991).Kusuma (2010) states that the reservoir in the Gitamember, part of Talang Akar Formation, is consist of
Contributorship:The main contributors: Swasty Aninda Piranti and Shaska Zulivandama while, The member contributors: Noor Cahyo Dwi Aryanto, Andi Agus Nur, Ildrem Syafri.
80 Swasty Aninda Piranti, et al.
several compartments that are separated and not relatedto each other.
Tectonically, the Gita Member Formation wasdeposited in the Early Miocene post-rift period. In thisperiod, the expansion process had stopped, and therehad been a decrease in the basin and regional seatransgression. Neogene Post-rift begin with mean sealevel rising, it was marked by deposition of rocks in themarine environment (Sukanto et al., 1998). Gitamember has several type depositional systems, such asa braided channel system, meandering channel system,fluvial-deltaic system, and estuarine system (Juniarti,2018).
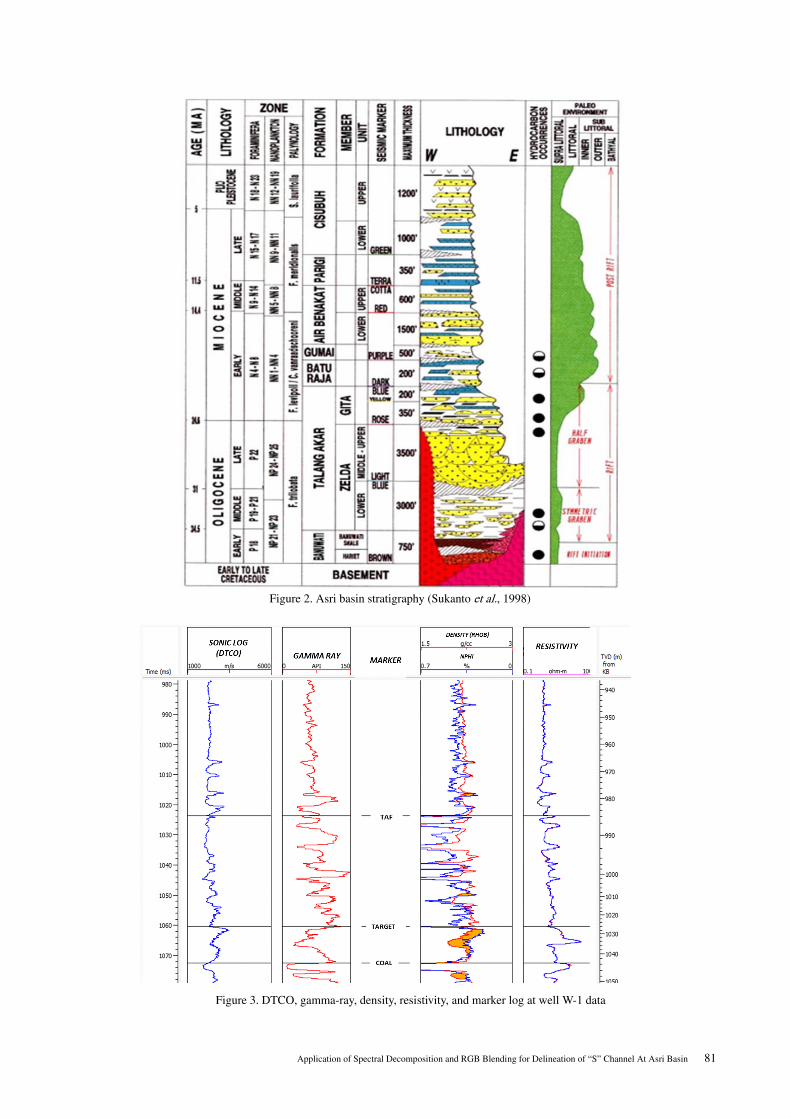
The objective of this study is to determine thedistribution of „S‰ sand target (one of the Gita member)reservoir at Asri Basin that shown by stratigraphycolumn, eastern part of South Sumatra (Figure 2) thatcould reveal the existence of „S‰ channel.
A channel system was an interesting systemdeveloped in the Asri Basin, however, to get the channel
distribution in Asri Basin is quitechallenging because the thickness ofthe channels caused its appearance isgenerally close or under seismicresolution so this thin layer sometimesunseeable (Tetyukhina, et al., 2010),the presence of coal under the reservoiralso affect the appearance of our targeton seismic data. Spectraldecomposition is seismic interpretationmethods that divulge some concealedgeological features, for example, thinlayer sediments, channels, or shallowgas.
Spectral decomposition is beingused extensively as an excellent tool formapping channels (Partyka et al.,1999). In Spectral decomposition, theseismic data would be decomposed intoseveral frequency components and theresult would be seen as time-frequencyseismic sections or maps. The commonmethod of spectral decomposition isFast Fourier Transform (FFT), Shortterm Fourier Transform (STFT),Continuous Wavelet Transform(CWT), and Matching PursuitDecomposition (MPD) each methodhas different advantages anddeficiency. In this study, continuouswavelet transform is used because thismethod has supple windows andaccessible. Later on the result iscombined using RGB Blending. Thesetypes of the blend are highly effective
at visualizing data such as a result of spectraldecomposition attributes (Das et al., 2015)
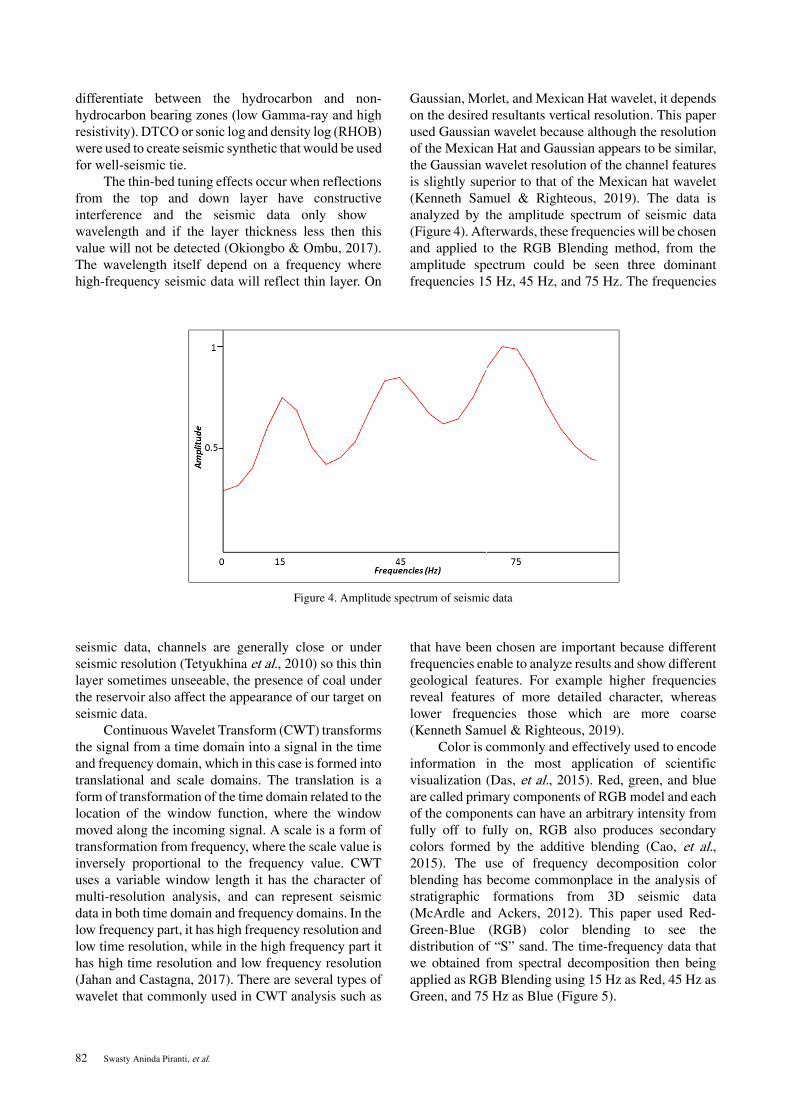
This study used 3D seismic data volume and 1 welldata. The spectral decomposition would be applied toseismic data then three different frequencies would becollected and combine using RGB Blending method.Afterwards, the result would be used to determine thedistribution of „S‰ sand. Based on gamma-ray log thetarget is located at 1,025 meters depth and the thicknessis around 15 meters (Figure 3).
METHODSPrior to perform Spectral Decomposition and
RGB Blending, the sand target was determined usingseveral log data from well W-1 such as gamma-ray,density, neutron porosity, and resistivity. Gamma-raylog was used to construe a variety of different clasticdepositional systems based on the principles of Kendall(2003). Gamma-ray log was employed to identifyclastic reservoir units and from resistivity log, we could
�Figure 1. Study Area
Application of Spectral Decomposition and RGB Blending for Delineation of „S‰ Channel At Asri Basin 81
Figure 2. Asri basin stratigraphy (Sukanto et al., 1998)
Figure 3. DTCO, gamma-ray, density, resistivity, and marker log at well W-1 data
82 Swasty Aninda Piranti, et al.
differentiate between the hydrocarbon and non-hydrocarbon bearing zones (low Gamma-ray and highresistivity). DTCO or sonic log and density log (RHOB)were used to create seismic synthetic that would be usedfor well-seismic tie.
The thin-bed tuning effects occur when reflectionsfrom the top and down layer have constructiveinterference and the seismic data only show ¼wavelength and if the layer thickness less then thisvalue will not be detected (Okiongbo & Ombu, 2017).The wavelength itself depend on a frequency wherehigh-frequency seismic data will reflect thin layer. On
seismic data, channels are generally close or underseismic resolution (Tetyukhina et al., 2010) so this thinlayer sometimes unseeable, the presence of coal underthe reservoir also affect the appearance of our target onseismic data.
Continuous Wavelet Transform (CWT) transformsthe signal from a time domain into a signal in the timeand frequency domain, which in this case is formed intotranslational and scale domains. The translation is aform of transformation of the time domain related to thelocation of the window function, where the windowmoved along the incoming signal. A scale is a form oftransformation from frequency, where the scale value isinversely proportional to the frequency value. CWTuses a variable window length it has the character ofmulti-resolution analysis, and can represent seismicdata in both time domain and frequency domains. In thelow frequency part, it has high frequency resolution andlow time resolution, while in the high frequency part ithas high time resolution and low frequency resolution(Jahan and Castagna, 2017). There are several types ofwavelet that commonly used in CWT analysis such as
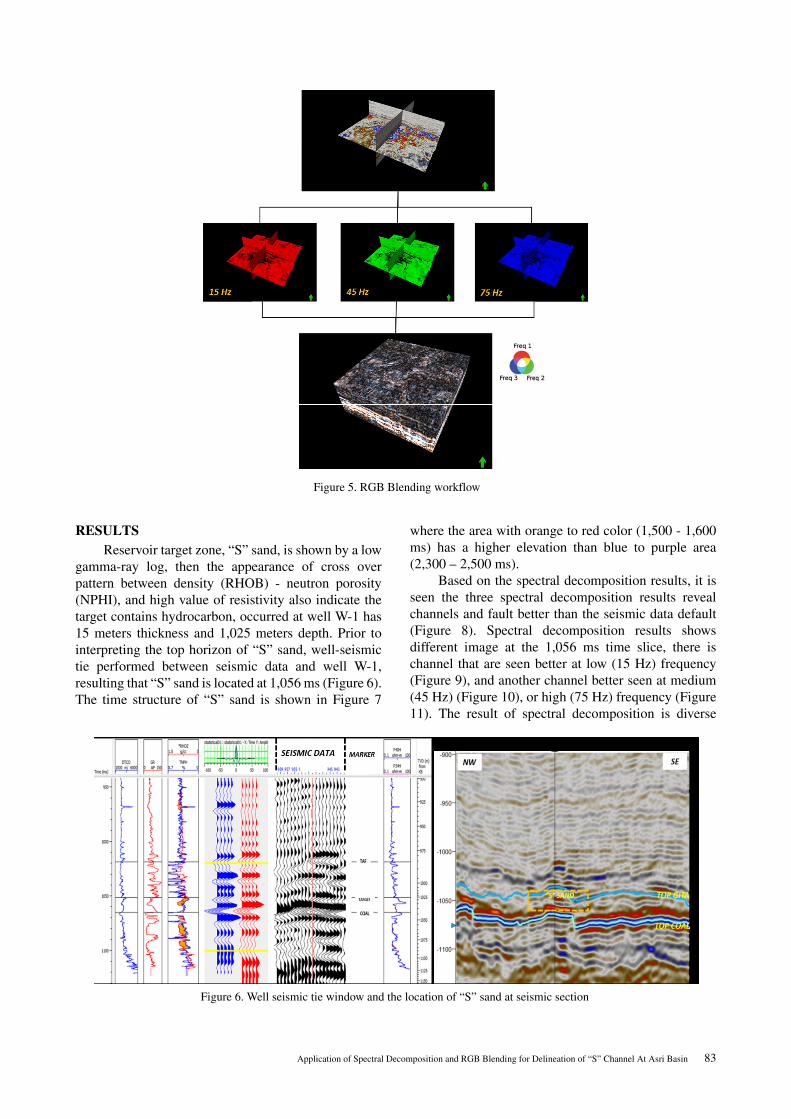
Gaussian, Morlet, and Mexican Hat wavelet, it dependson the desired resultants vertical resolution. This paperused Gaussian wavelet because although the resolutionof the Mexican Hat and Gaussian appears to be similar,the Gaussian wavelet resolution of the channel featuresis slightly superior to that of the Mexican hat wavelet(Kenneth Samuel & Righteous, 2019). The data isanalyzed by the amplitude spectrum of seismic data(Figure 4). Afterwards, these frequencies will be chosenand applied to the RGB Blending method, from theamplitude spectrum could be seen three dominantfrequencies 15 Hz, 45 Hz, and 75 Hz. The frequencies
that have been chosen are important because differentfrequencies enable to analyze results and show differentgeological features. For example higher frequenciesreveal features of more detailed character, whereaslower frequencies those which are more coarse(Kenneth Samuel & Righteous, 2019).
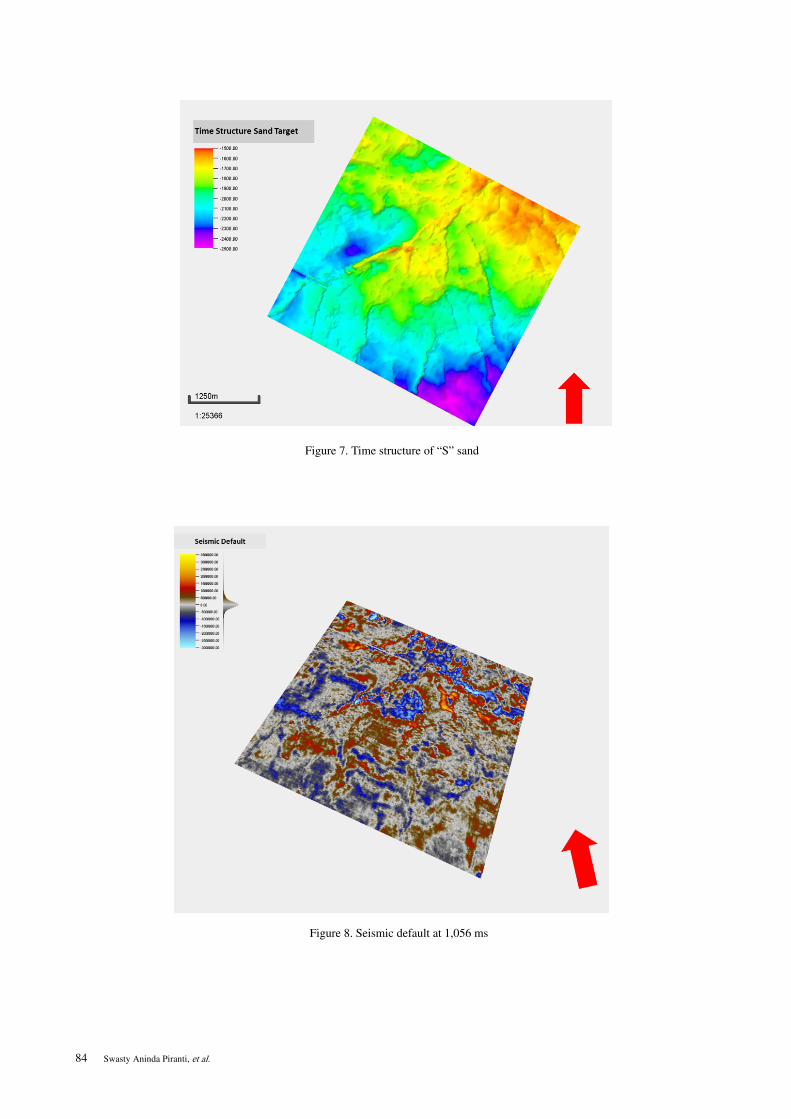
Color is commonly and effectively used to encodeinformation in the most application of scientificvisualization (Das, et al., 2015). Red, green, and blueare called primary components of RGB model and eachof the components can have an arbitrary intensity fromfully off to fully on, RGB also produces secondarycolors formed by the additive blending (Cao, et al.,2015). The use of frequency decomposition colorblending has become commonplace in the analysis ofstratigraphic formations from 3D seismic data(McArdle and Ackers, 2012). This paper used Red-Green-Blue (RGB) color blending to see thedistribution of „S‰ sand. The time-frequency data thatwe obtained from spectral decomposition then beingapplied as RGB Blending using 15 Hz as Red, 45 Hz asGreen, and 75 Hz as Blue (Figure 5).
�Figure 4. Amplitude spectrum of seismic data
Application of Spectral Decomposition and RGB Blending for Delineation of „S‰ Channel At Asri Basin 83
RESULTSReservoir target zone, „S‰ sand, is shown by a low
gamma-ray log, then the appearance of cross overpattern between density (RHOB) - neutron porosity(NPHI), and high value of resistivity also indicate thetarget contains hydrocarbon, occurred at well W-1 has15 meters thickness and 1,025 meters depth. Prior tointerpreting the top horizon of „S‰ sand, well-seismictie performed between seismic data and well W-1,resulting that „S‰ sand is located at 1,056 ms (Figure 6).The time structure of „S‰ sand is shown in Figure 7
where the area with orange to red color (1,500 - 1,600ms) has a higher elevation than blue to purple area(2,300 – 2,500 ms).
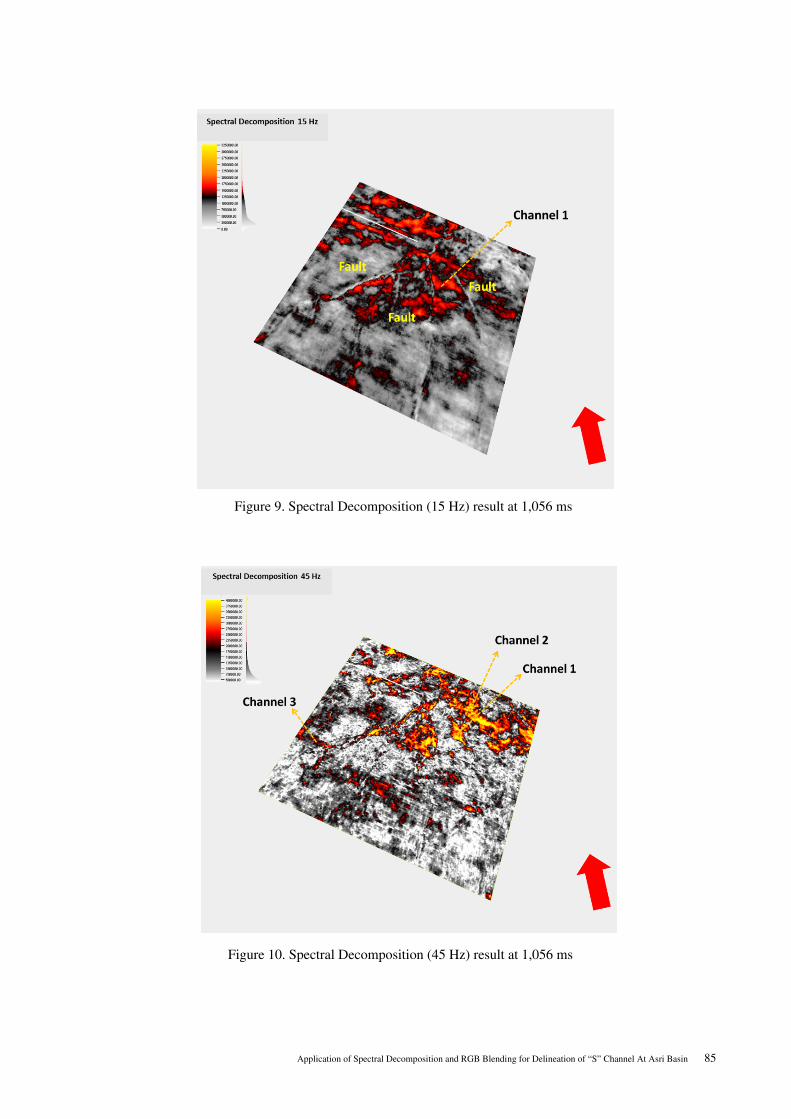
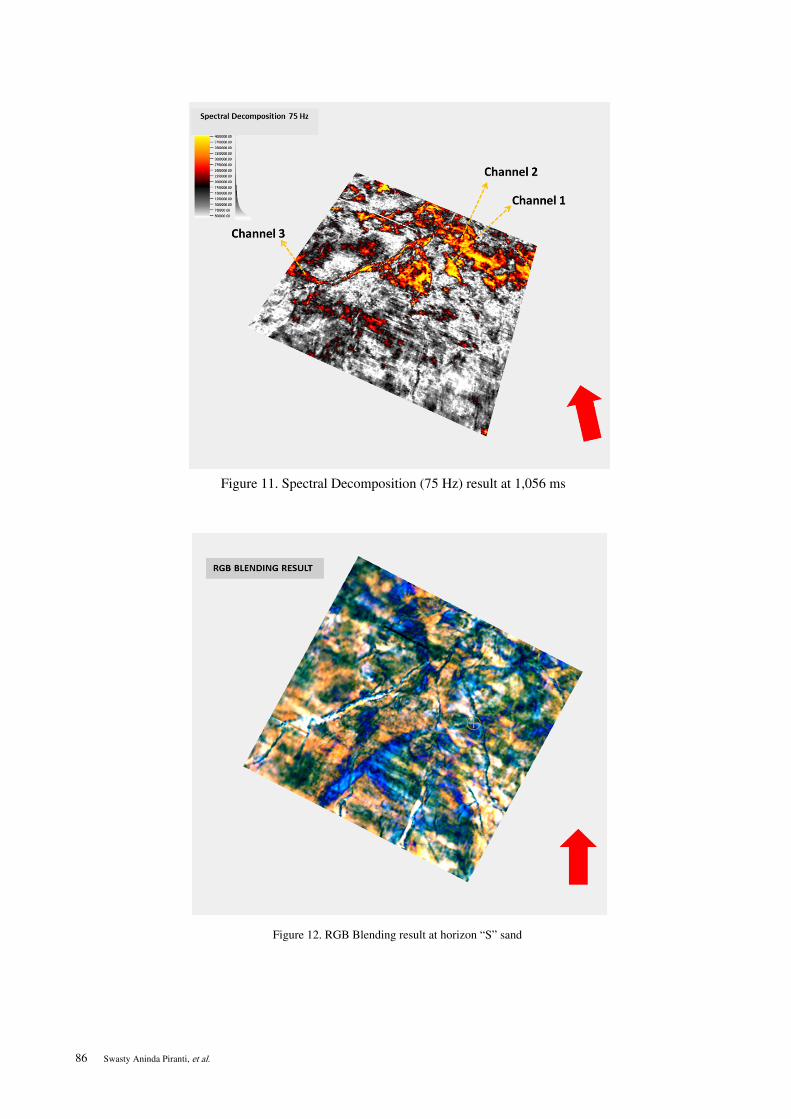
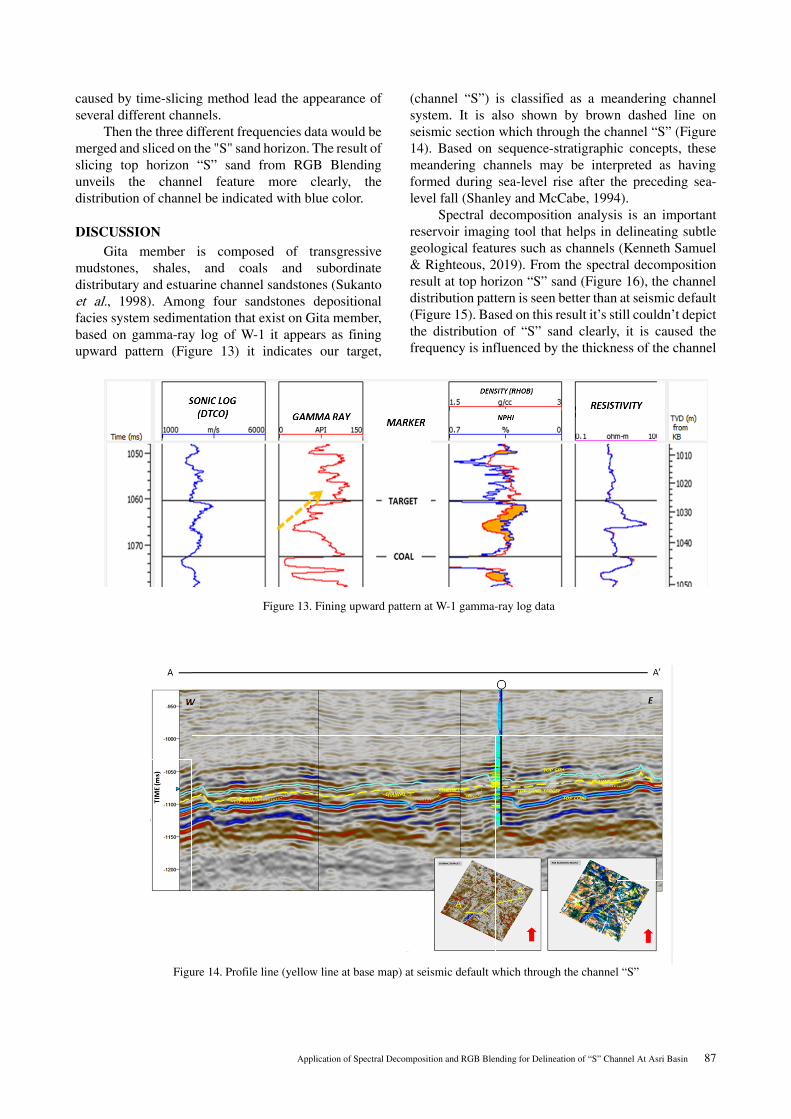
Based on the spectral decomposition results, it isseen the three spectral decomposition results revealchannels and fault better than the seismic data default(Figure 8). Spectral decomposition results showsdifferent image at the 1,056 ms time slice, there ischannel that are seen better at low (15 Hz) frequency(Figure 9), and another channel better seen at medium(45 Hz) (Figure 10), or high (75 Hz) frequency (Figure11). The result of spectral decomposition is diverse
Figure 5. RGB Blending workflow
Figure 6. Well seismic tie window and the location of „S‰ sand at seismic section
84 Swasty Aninda Piranti, et al.
Figure 7. Time structure of „S‰ sand
Figure 8. Seismic default at 1,056 ms
Application of Spectral Decomposition and RGB Blending for Delineation of „S‰ Channel At Asri Basin 85
Figure 10. Spectral Decomposition (45 Hz) result at 1,056 ms
Figure 9. Spectral Decomposition (15 Hz) result at 1,056 ms
86 Swasty Aninda Piranti, et al.
Figure 11. Spectral Decomposition (75 Hz) result at 1,056 ms
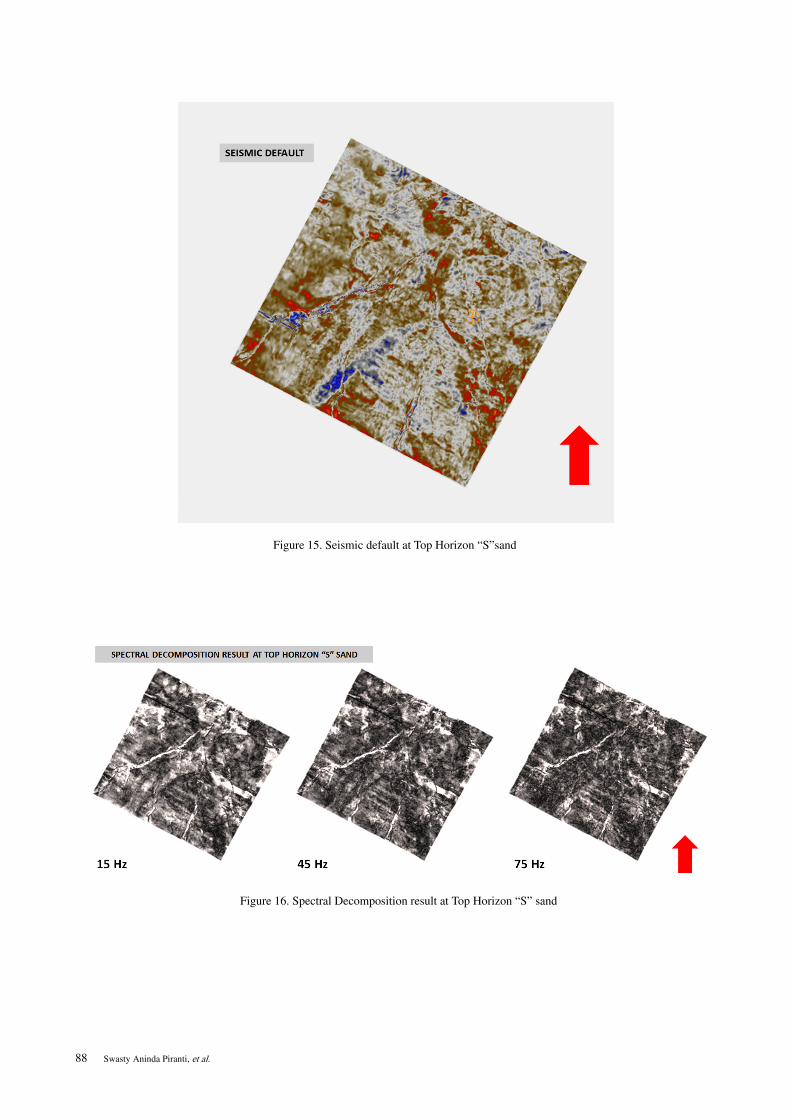
Figure 12. RGB Blending result at horizon „S‰ sand
Application of Spectral Decomposition and RGB Blending for Delineation of „S‰ Channel At Asri Basin 87
caused by time-slicing method lead the appearance ofseveral different channels.
Then the three different frequencies data would bemerged and sliced on the "S" sand horizon. The result ofslicing top horizon „S‰ sand from RGB Blendingunveils the channel feature more clearly, thedistribution of channel be indicated with blue color.
DISCUSSIONGita member is composed of transgressive
mudstones, shales, and coals and subordinatedistributary and estuarine channel sandstones (Sukantoet al., 1998). Among four sandstones depositionalfacies system sedimentation that exist on Gita member,based on gamma-ray log of W-1 it appears as finingupward pattern (Figure 13) it indicates our target,
(channel „S‰) is classified as a meandering channelsystem. It is also shown by brown dashed line onseismic section which through the channel „S‰ (Figure14). Based on sequence-stratigraphic concepts, thesemeandering channels may be interpreted as havingformed during sea-level rise after the preceding sea-level fall (Shanley and McCabe, 1994).
Spectral decomposition analysis is an importantreservoir imaging tool that helps in delineating subtlegeological features such as channels (Kenneth Samuel& Righteous, 2019). From the spectral decompositionresult at top horizon „S‰ sand (Figure 16), the channeldistribution pattern is seen better than at seismic default(Figure 15). Based on this result itÊs still couldnÊt depictthe distribution of „S‰ sand clearly, it is caused thefrequency is influenced by the thickness of the channel
Figure 13. Fining upward pattern at W-1 gamma-ray log data
Figure 14. Profile line (yellow line at base map) at seismic default which through the channel „S‰
88 Swasty Aninda Piranti, et al.
Figure 15. Seismic default at Top Horizon „S‰sand
Figure 16. Spectral Decomposition result at Top Horizon „S‰ sand
Application of Spectral Decomposition and RGB Blending for Delineation of „S‰ Channel At Asri Basin 89
which the higher the frequency used bring the higherresolution of the target.
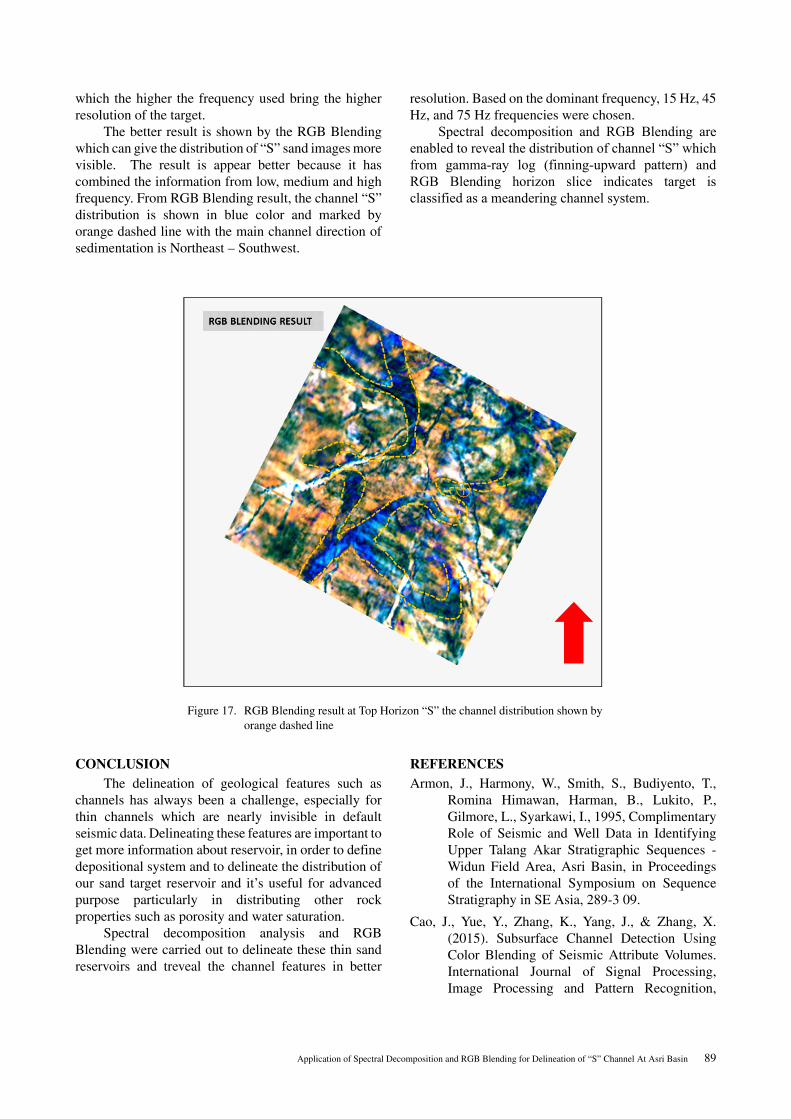
The better result is shown by the RGB Blendingwhich can give the distribution of „S‰ sand images morevisible. The result is appear better because it hascombined the information from low, medium and highfrequency. From RGB Blending result, the channel „S‰distribution is shown in blue color and marked byorange dashed line with the main channel direction ofsedimentation is Northeast – Southwest.
CONCLUSIONThe delineation of geological features such as
channels has always been a challenge, especially forthin channels which are nearly invisible in defaultseismic data. Delineating these features are important toget more information about reservoir, in order to definedepositional system and to delineate the distribution ofour sand target reservoir and itÊs useful for advancedpurpose particularly in distributing other rockproperties such as porosity and water saturation.
Spectral decomposition analysis and RGBBlending were carried out to delineate these thin sandreservoirs and treveal the channel features in better
resolution. Based on the dominant frequency, 15 Hz, 45Hz, and 75 Hz frequencies were chosen.
Spectral decomposition and RGB Blending areenabled to reveal the distribution of channel “S” whichfrom gamma-ray log (finning-upward pattern) andRGB Blending horizon slice indicates target isclassified as a meandering channel system.
REFERENCESArmon, J., Harmony, W., Smith, S., Budiyento, T.,
Romina Himawan, Harman, B., Lukito, P.,Gilmore, L., Syarkawi, I., 1995, ComplimentaryRole of Seismic and Well Data in IdentifyingUpper Talang Akar Stratigraphic Sequences -Widun Field Area, Asri Basin, in Proceedingsof the International Symposium on SequenceStratigraphy in SE Asia, 289-3 09.
Cao, J., Yue, Y., Zhang, K., Yang, J., & Zhang, X.(2015). Subsurface Channel Detection UsingColor Blending of Seismic Attribute Volumes.International Journal of Signal Processing,Image Processing and Pattern Recognition,
Figure 17. RGB Blending result at Top Horizon „S‰ the channel distribution shown byorange dashed line
90 Swasty Aninda Piranti, et al.
8(12), 157–170. https://doi.org/10.14257/ijsip.2015.8.12.16
Das, U. K., Pant, D. C., & Parida, G. (2015).Application Of Multi-Attributes And SpectralDecomposition With RGB Blending ForUnderstanding The Strati-Structural Features: ACase Study. 10th Biennial InternationalConference & Exposition.
Juniarti, A. (2018). Facies and Depositional Analysisof Sandstone „X‰ in Gita Member Talang AkarFormation, At Alpha Field, Asri Basin, (May2007). https://doi.org/10.29118/ipa.2392.07.sg.015
Kendall C (2003) Use of well logs for sequencestratigraphic interpretation of the subsurface.USC sequence stratigraphy web, University ofSouth Carolina.
Kenneth Samuel, O., & Righteous, O. (2019).Application of Spectral Decomposition andSeismic Attributes For Channel Geometry andInfill Lithology Determination: A Case Studyfrom The Southern North Sea Basin.International Journal of Earth Science andGeophysics, 5(1). https://doi.org/10.35840/2631-5033/1823
Kusuma, Y. R., 2010, Karakteristik Reservoar 34-1E:Analisis Fasies dan Kompartementalisasi,Lapangan Widuri, Cekungan Asri, SumateraSelatan Bagian Tenggara, Institut TeknologiBandung, 46 Hal
Jahan, I. and Castagna, J. 2017. Spectraldecomposition using time-frequency continuouswavelet transforms for fault detection in theBakken Formation. SEG International SpectralDecomposition with Continuous WaveletTransform for Hydrocarbon Zone Detection ofNorth Bali Waters 91 Exposition and 87thAnnual Meeting, 2190-2194. DOI: 10.1190/segam2017-17670965.1.
McArdle, N. J., & Ackers, M. A. (2012).Understanding seismic thin-bed responses usingfrequency decomposition and RGB blending.First Break, 30(12), 57–65. https://doi.org/10.3997/1365-2397.2012022
Okiongbo, K. S., & Ombu, R. (2017). Nonlin .Processes Geophys . Discuss ., https://doi.org/10.5194/npg-2017-62 Manuscript under reviewfor journal Nonlin . Processes Geophys .Discussion started?: 27 October 2017Delineation of shallow channel geometry andinfill lithology using Spectral d, (October),1–18.
Partyka GA, Gridley J, Lopez J (1999) Interpretationalapplications of spectral decomposition inreservoir characterization. The Leading Edge18: 353-360.
Tetyukhina, D., Luthi, S. M., Van Vliet, L. J., &Wapenaar, K. (2018). High-resolution reservoircharacterization by 2-D model-driven seismicBayesian inversion: An example from a Tertiarydeltaic clinoform system in the North Sea. 78thSociety of Exploration GeophysicistsInternational Exposition and Annual Meeting,SEG 2008, 75(6), 1880–1884.
Shanley,K.W., & McCabe.P.J.,( 1994). Perspective onthe sequence stratigraphy of continental strata.AAPG Bulletin, 78,544-568
Sukanto, J., F, Nunuk., Aldrich, J.B., Rinehart, G.P.,Mirchell, J., (1998), Petroleum System of theAsri Basin, Java Sea, Indonesia, Proceeding IPA26th Annual Convention, Jakarta,291-312.
Young, R., Harmony, W.E., Gunawan J., Budiyento T.,1991, Widuri Field, Offshore SoutheastSumatra: Sandbody Geometries and theReservoir Model, Proceedings of the IndonesianPetroleum Association, 20/1, 385-417.


![[Tuts] Bermain Blending Mode](https://img.pdfslide.tips/doc/110x75/563db91a550346aa9a9a0aa1/tuts-bermain-blending-mode.jpg)