Embed Size (px)
Citation preview

i
CERTIFICATION
The undersigned certifies that, he has read and hereby recommends for acceptance by
the Open University of Tanzania this Dissertation titled Assessment of Inventory
Management in Parastatal Organisations in Tanzania: A case of VETA Kigoma in
partial fulfillment of the requirements for the Degree of Master of Business
Administration (MBA).
………………………………
Dr. Odass Bilame
(Supervisor)
Date:…………………....

ii
COPYRIGHT
This Dissertation should not be reproduced by any means, in full or in part, except for
short extract in a fair dealing, for research or private study, critical scholarly review or
discourse with an acknowledgement, without written permission of the Directorate of
Postgraduate Studies, on behalf of both the author and the Open University of Tanzania.

iii
DECLARATION
I, John Medard, declare that this Dissertation is my own original work and that it has
not been presented and will not be presented to any other University for a similar or any
other degree award.
Signature:……………………
Date:…………………………

iv
DEDICATION
I dedicate this dissertation to my beloved grandmother the late Elizabeth Abel Ngofilo
may God let her rest in peace. I also dedicate it to my mother Cresensia John Mayeka
and other family members for their encouragement.

v
ACKNOWLEDGEMENT
It is quite true without any objection that this work could not have been completed
without moral, tolerance and material assistance from a substantial number of people,
either directly or indirectly participated in making sure that the work is successfully
completed. For that fact it is impossible to thank all those whose assistance enabled me
to produce this work, although the below mentioned some can represent the rest.
I wish to express my sincere appreciation to my research supervisor Dr. Odass Bilame
the Senior Lecturer and Head of Department – Economics at St. Augustine University
of Tanzania (SAUT) for his outstanding guidance, encouragement and commitment.
My appreciation should also go to the Open University of Tanzania (OUT) specifically
to the Lecturers Dr. Ngatuni P and Dr. Katunzi T.M who real paved me a way on how
to go about doing a research work through their class presentation on Research
Methodology.
Moreover I would like to express my particular deep gratitude to the Management of
VETA Kigoma(Kigoma RVTSC) under the Management of Mr. Ng’wandu Raphael the
Principal for allowing me to pursue MBA – Executive programme at the Open
University of Tanzania also special thanks should go to the members of Kigoma
RVTSC Management Mr. Alban S. Kisomba – Human Resource and Administrative
Manager, Mr. Hamenya K.Ntabaye – Registrar and Mr. Rodrick J. Mota – Bursar for
their tireless support and encouragement despite the difficulties I faced on the study.

vi
ABSTRACT
The primary purpose of this study was to Assess the Inventory Management in
Parastatal Organisations in Tanzania, VETA Kigoma being taken as a case of focus.
The study was guided by three research objectives namely, to examine the adherence to
professionalism with respect to materials management, to examine the level of
technology adopted to ensure inventory control and to examine the method used in
evaluating inventory.
120 respondents were involved in the study, data were analysed using Statistical
Package for Social Sciences (SPSS 16.0 for windows). Purposive sampling was used
together information from the targeted respondents as the study wanted to obtain
relevant data from the field in order to have viable findings.
The study revealed that the centre had qualified personnel in materials management, the
study realized that the centre had been using Materials Requirements Planning (MRP)
technique to ensure inventory control, inventories were controlled electronically using
inventory system called Microsoft dynamics – Navision. The study revealed that the
centre used First In First Out (FIFO) system in evaluating or pricing stocks to ensure
efficiency in stores operations.
The study concluded that there was a notable improvement in materials management in
parastatals unlike previous years where stores functions were done by unqualified
people which resulted to unnecessary losses to the government.
vii
TABLE OF CONTENTS
CERTIFICATION…..……..…………………………………………………………...i
COPYRIGHT………………….……………………….................................................ii
DECLARATION………..………………………………………………………...…..iii
DEDICATION…………………………………………………………………………iv
ACKNOWLEDGEMENT………...…………………………………………………...v
ABSTRACT……………..…………………………………………………………….vi
LIST OF TABLES…………………...……...………………….…………………….xii
LIST OF FIGURES…………………...…………...……..…………………………..xiv
LIST OF APPENDICES………………………..………………………………….…xv
LIST OF ABBREVIATIONS AND ACRONYMS……...……………………….....xvi
CHAPTER ONE
1.0 INTRODUCTION……..………………………………………….....................1
1.1 Background Information to the Problem…..……….…………………….……..1
1.2 Statement of the Problem.……………..……...………..………………………..3
1.3 Objectives of the Research Study……………………....……….……............... 4
1.3.1 General Objective…………...……………….………..…………………..……..4
1.3.2 Specific Objectives…………………….….……………..………………………5
1.4 Research Questions……………..…………………..……………………….......5
1.4.1 General Question……………………..……….……………………....………....5

viii
1.4.2 Specific Questions…………....…….…………………………………………….5
1.5 Significance of the Study……………..………….…………………..…….….6
1.6 Limitation of the Study……………..…..….………………...…………………...7
1.7 Scope of the Study………………..…….…….....…..……………………………8
1.8 Conceptual Framework ……………..….……………….……………...………..8
1.9 Organisation of the Study………………...……………..……….…...….............10
CHAPTER TWO
2.0 LITERATURE REVIEW….…..……………………………….……….………11
2.1 Theoretical Literature Review…………………………………......…...…..……..11
2.2 Empirical Literature Review …………………...……….………..........………....24
CHAPTER THREE
3.0 RESEARCH METHODOLOGY………………………………………………...32
3.1 Research Design ………….…….….………......... ………………………………..32
3.2 Study Area……..…………….………………………………….….……................33
3.3 Population……………………..…………..……….…………….…………………33
3.4 Sample and Sample Size……………...…………….……….………………..........34
3.5 Sampling Procedure…………………...…….………....…….………………..........35
3.6 Types of Data……………………….…….…………...….……………….….........36
3.7 Data Collection Methods………...…..…………...………..…….............................37
3.8 Reliability and Validity of Data………..…………………….…….........................40
ix
3.8.1 Reliability of Data…………….………..……..………………..………………...40
3.8.2 Validity of Data……………..…………….…..………………....……………….41
3.9 Management and Analysis of Data………………….…..……….……………….42
3.9.1 Data Management……………..…....…………..……………….…......................42
3.9.2 Data Analysis…… …………..…..………….……………….………….………42
CHAPTER FOUR
4.0 DATA PRESENTATION, ANALYSIS AND DISCUSSION…………….….....44
4.1 Introduction………………………………………………………………………...44
4.2 Status of the Distribution and Collected Questionnaire………..…………………..44
4.2.1 Distribution of Respondents by Age…………………...………...…………….45
4.2.1.1 Staff Distribution by Age…………………………..…………………………..45
4.2.1.2 Vocational Trainees’ Distribution by Age…………...……………...…..……..46
4.2.2 Distribution of Respondents by Gender…...…………………………………...47
4.2.2.1 Staff Distribution by Gender……………………...…………...……………….47
4.2.2.2 Vocational Trainees’ Distribution by Gender…………….……………………47
4.2.3 Respondents’ Marital Status………………...……………….………………....48
4.2.3.1 Staff Marital Status…………………...……….……...………………………...48
4.2.3.2 Vocational Trainees’ Marital Status…………………………..…...…………...49
4.2.4 Respondents’ Education Level…….………...……...………………………….50
4.2.4.1 Staff Education Level………………………..…………………………………50
4.2.4.2 Vocational Trainees’ Education Level…………...………………..…………...51

x
4.2.5 Respondents’ Physical Disability……………………….…………...…………52
4.2.5.1 Staff Physical Disability…………………..……..………………...…………...52
4.2.5.2 Vocational Trainee’s Physical Disability…………...……………………..…...53
4.3 Rationale of Keeping Inventory………………...………..…………………….54
4.4 Trainees Practical Training Materials……...................................…..………….54
4.5 Method Used to Evaluate Inventory……..………………………...……………55
4.6 Examination of the Stores Officer Qualification………….…………………….56
4.7 Centre General Performance on Meeting Trainees’ Requirements……………..56
4.8 Costs for Inventory Mismanagements……………………….......……………...57
4.9 Technique Used to Determine Demand of Materials……………….………….58
4.10 Centre Inventory Management Effectiveness Ranking……………...……….....60
4.11 Out of Stock Situation………..…………………….…………..……………….61
4.12 Seminar Attendance Frequency for Capacity Building……………...……...…..62
4.13 Status of the Centre Warehouse………….…………………......………………63
4.14 Stock Control Method Used by the Centre……………….…………….……….64
4.15 Centre Stock Taking Policy…………………..….……...……………….……...65
4.16 Centre Salary Payment Satisfaction…………………….……….………….…..66
4.17 Overtime Payment for Extra Working Hours……………..………………….…67
4.18 Annual Procurement Plan Adherence……………………….………..………...68
4.19 Receipt of Requested Materials Timely Without any Delay…………..…...…...69
4.20 Instructions Prepared for Stocktaking Exercise……………………..……….…70
4.21 Codification of Centre Assets for Control Purpose……….…………………….70

xi
CHAPTER FIVE
5.0 SUMMARY, CONCLUSION AND RECOMMENDATIONS
5.1 Summary of Findings…………..…………...………………...……………………72
5.2 Conclusion……………….…………………………………...…………………….73
5.3 Recommendations………….……………………...............……………………….74
5.4 Areas for Further Study……….……………………………………………..……..76
References ……………………….…………………………………........................77
Appendices …………….…….…….………………………………..……………...82

xii
LIST OF TABLES
Table 3.1 Sample Size Selection ………………......…..…............................................35
Table 4.1 Involvement of Respondents in the Study……….…………………….….…44
Table 4.2 Staff Distribution by Age……………………...…………..………………...45
Table 4.3 Vocational Trainees’ Distribution by Age………………………...………...46
Table 4.4 Staff Distribution by Gender……………………..………...………………..47
Table 4.5 Vocational Trainees’ Distribution by Gender…………….…………….…...48
Table 4.6 Staff Marital Status………………...……………………………...…………49
Table 4.7 Vocational Trainees’ Marital Status……………….……………..……..…...50
Table 4.8 Staff Education Level…………………...………………...…...…………….51
Table 4.9 Vocational Trainees’ Education Level………………………..………..……52
Table 4.10 Staff Physical Disability…………………….……………...…..…………..53
Table 4.11 Vocational Trainees’ Physical Disability…………………………………..53
Table 4.12 Trainees’ Response on Practical Training for Each Module………...….….55
Table 4.13 Response on Ranking Centre General Performance….…………..………..57
Table 4.14 Response on Percentage of Loss due to Inventory Mismanagement……....58
Table 4.15 Response on Method Used to Determine Demand of Materials………..….59
Table 4.16 Response on Inventory Management Effectiveness Ranking……………...60
Table 4.17 Response on Stock out Problem………………………...……………….....61
Table 4.18 Response on Frequency of Seminar Attendance...........................................63
Table 4.19 Response on the Status of the Centre Warehouse…………………..……...64
xiii
Table 4.20 Response on Stock Control Method Used by the Centre……..……….…...65
Table 4.21 Response on Centre Stocktaking Policy…………………….……..…...…..66
Table 4.22 Response on Centre Salary Scale Payment Satisfaction…………...……....67
Table 4.23 Response on Overtime Payment due to Works done on Extra Hours……...68
Table 4.24 Response on Adherence of Annual Procurement Plan………………….….69
Table 4.25 Response on Receipt of Requested Materials………………………….......70
Table 4.26 Response on Codification of Centre Assets………………………...…..….71
xiv
LIST OF FIGURES
Figure 1.1 Diagrammatic Presentation of the Relationship Between Variables...........…9
Figure 2.1 Cost versus Order Quantity……………………………….…..……...……..19
Figure 2.2 ABC curve Showing Percentage of Value versus Percentage of Items…….22

xv
LIST OF APPENDICES
Appendix I. Questionnaire for Staff………………...………………….………………82
Appendix II. Questionnaire for Trainees…………….……………………..…………..92
xvi
LIST OF ABBREVIATIONS AND ACRONYMS
A.B.C Always Better Control
B.O.T Bank of Tanzania
EOQ Economic Order Quantity
FIFO First in First Out
KASHWASA Kahama Shinyanga Water Supply Authority
KGM Kigoma
LIFO Last In First Out
L.T Lead Time
MRP Materials Requirement Planning
MSD Medical Stores Department
MTUWASA Mtwara Urban Water Supply Authority
OUT Open University of Tanzania
PA Public Authority
RVTSC Regional Vocational Training Services Centre
SAUT St Augustine University of Tanzania
SPSS Statistical Package for Social Sciences
TPDC Tanzania Petroleum Development Corporation
VETA Vocational Education and Training Authority
W.C.M Working Capital Management
W. I.P Work in Progress

1
CHAPTER ONE
1.0 INTRODUCTION
1.1Background Information to the Problem
Inventories in many organizations occupy a large part of costs which possibly affects
the profitability of that organization. The route cause or source is mismanagement of
inventories hence it may lead to deterioration, loss, theft, obsolescence, absolute and
surplus or deficiency. This situation has been noticed to many parastatal organistions in
Tanzania where they failed to meet customer requirements resulting to poor customer
service being rendered, which actually caused by poor demand forecasting of raw
materials and poor financial plan on inventories to be procured and then stored
(Wambura, 2009).
Most firms keep raw materials and finished products on hand to meet demand. These
are inventories and they allow the firm to have some stock in the ordering time for
materials and services scheduled. Inventory kept at low levels so as to minimize storage
costs and the need to keep inventory higher to meet customers demand.
Organizations including public and private face great challenges in managing
inventories, poor inventory management may result in under stocking, overstocking as
well as high inventory total costs. In order for the organizations to manage inventory
effectively need to employ control methods such as the EOQ model to obtain

2
reasonable ordered quantities for its raw materials, he added that due to poor inventory
management in 1990 Urafiki Textile Mills Co. Ltd failed to operate as resulted to
financial problem by so doing between 1992 and 1994 the factory was privatized to the
Chinese government through joint venture where Tanzania owns 49% and China owns
51% this agreement became effective since 1997 (Mwansele, 2011).
Inventories need management in order for the organisation to meet objectives of value
maximization, when managing inventories remember that you want to avoid placing too
much funds in inventory because it will result in declining profitability and returned
cash flow.
Organizations need to manage efficiently inventories in order to prevent all types of
wastage including over stocking, pilferage, expiry and stock outs. Factors contributing
to those stock outs on one hand and over stocking on the other hand are not very clear,
logistics skills level is poor and inventories are not well managed. Personnel dealing
with supply chain activities need to be trained in procurement and inventory
management as inventories are not well managed and most of the personnel did not
know the method specifically to be used in controlling inventory (Kagashe, et al. 2012).
Holding of inventories can cost an organization about 25% to 40% of the value, lost
sales and customer dissatisfaction can occur as the cause of inventory, therefore
efficient inventory management is very important in supply chain operations as helps
the organization to maintain competitive advantage. Inventories exist at every stage of
3
the supply chain so has to be kept optimal, although to most organizations inventory
management section is ignored resulting to inventory mismanagement. (Makweba,
2009).
The above stated facts from different studies conducted by various academicians proves
that inventories in both private and public organizations is not well managed resulting
to unnecessary losses as inventories on the balance sheet represent from 20% to 60% of
total assets so has to be handled with great care for smooth running of the organisation’s
operations.
1.2 Statement of the Problem
The World Bank report shows that approximately 5% of global GDP disappear through
mismanagement of resources as there is no proper control over the inventory as the
result economy of most countries especially to less developed countries like Tanzania
fail to grow at the reasonable and preferable percentage (Kant, 2007).
The annual report of the Controller and Auditor General (CAG) on the audit of Public
Authorities (PA) and Other Bodies (OBs) for the financial year 2010/2011 revealed that
several weaknesses were observed in relation to inventory management and these
problems were encountered to seven Public Authorities which include, Tanzania
Electricity Supply Company (TANESCO), Tanzania Petroleum Development
Corporation (TPDC), Kahama Shinyanga Water Supply Authority (KASHWASA),

4
Mtwara Urban Water Supply Authority (MTUWASA), Arusha Water Supply
Authority, Medical Stores Department (MSD) and Bank of Tanzania (BoT).
Approximately 10.83 billion were lost by the Public Authorities which were mainly
contributed by inventory mismanagement in parastatals (Utouh, 2012).
The main question of concern is why there has been poor inventory management in
government parastatals? Is it because of poor skills of those stores / procurement
specialists? Or is it because of lack of moral integrity? This proposed study will try to
examine why there have been poor performances on inventory management by
ascertaining the factors which probably might be the possible solution on the conceptual
problem of “why inventory mismanagement in Tanzania” The study will base on three
important objectives namely, to examine the adherence to professionalism with respect
to materials management, to examine the level of technology adopted to ensure
inventory control and to examine the method used in evaluating inventory.
The study will be conducted to parastatal organizations in Tanzania, taking VETA
Kigoma as a case area of focus.
1.3 Objectives of the Research Study
1.3.1 General Objective
The general objective was to assess the inventory management in parastatal
organizations in Tanzania.

5
1.3.2 Specific Objectives
The specific objectives of the study were;
To examine the adherence to professionalism with respect to materials
management.
To examine the level of technology adopted to ensure inventory control.
To examine the method used in evaluating inventory.
1.4 Research Questions
1.4.1 General Question
The general question was to what extent is inventory managed in parastatal
organisations?
1.4.2 Specific Questions
The specific questions of the study were;
Does the education level of stores staff determine efficiency over inventory
control?
Is the system adopted adequate for proper control of stock?
How is the inventory priced to ensure efficiency?

6
1.5 Significance of the Study
The output of this research study was likely to be beneficial to the following groups as
given below
The policy makers will be aware of the situation taking place to government owned
organization especially on the issues associated with inventory management so as to
revise the existing policies if possible so as to incorporate the recommendations and
findings revealed from the study.
The study will be a stepping stone for new knowledge generation to future studies who
will be interested in conducting further research study on related research topics, since
will understand well how to go about their studies so as to come up with new findings
which will be added to the existing knowledge.
The findings and recommendations will be used by Kigoma RVTSC itself in realising
the importance of using various mentioned techniques of inventory management and
bring awareness to personnel working in the organization and hence improve
performance as inventory is a necessary evil has to be handled with great care.
The study will enable to have practical training by integrating theoretical knowledge
obtained in library (reviewing various literatures) on inventory management with real
situations happening and practiced by the organizations. Also as partial fulfillment of
7
the requirements for the award of the Degree of Master of Business Administration
(MBA) of the Open University of Tanzania (OUT).
The Open University of Tanzania (OUT) will be informed about the real situation
taking place to Parastatal organisatons in Tanzania on inventory management a case of
VETA Kigoma, since two original copies will be submitted to the OUT for library
reference.
1.6 Limitation of the Study
In conducting this study the researcher faced the following challenges
It happened that some questionnaires filled by respondents other than expected ones
which resulted to reduced reliability and validity of information collected, some
respondents demanded allowances or remunerations at abnormal rates which could not
be afforded by the researcher, the frequent power cut affected the timely completion of
the research report and the questionnaires for vocational trainees were prepared in
English language therefore translation was necessary.
Since the study based on only one geographical area (Kigoma region) might happen that
the findings not be a good representative to other parastatal organizations in the country
although the study tried to make sure that the scope and objectivity of the study is
maintained.

8
1.7 The Scope of the Study
It is difficult to study all parastatal organizations which are government owned
organizations being made to provide valuable services to the citizens of Tanzania that is
why the study selected VETA Kigoma to represent among many known parastatal
organizations in Tanzania. At Kigoma RVTSC the study involved the sections, finance
section, purchasing section, warehouse/stores section, production section, training
section, human resource section, administration section, principal office and registrar
office. These were sections which the study considered to provide relevant and valuable
information on the study of assessing inventory management.
1.8 Conceptual Framework (Conceptual Model)
Conceptual framework is a level of theory in which descriptive categories are
systematically placed within a broad structure of explicit and assumed propositions,
statements of relationships between two or more empirical properties to be accepted or
rejected (Nachmias, 2003).
In a conceptual framework, you are required to put the concepts together as in a jigsaw
puzzle, you work out how all the concepts fit together and relate to one another. The
first stage of theorizing identifies and clarifies concepts; second stage concentrates on
the connections and relationships between the concepts. A conceptual framework is
formed of patterns of concepts and their interconnections (Fisher, et al. 2010).

9
It has been found that various issues contribute to proper functioning of inventory
management objective in any organization, some of these variables on which inventory
management depends includes, proper demand forecasting, assured lead time, proper
record keeping of stock, proper inventory system, qualified personnel and proper
inventory pricing technique.
The variables under this study of inventory management were related by the study in the
following manner as illustrated here below.
Proper demand forecasting (I1 )
Assured lead time (I2)
Effective
Inventory
Management
(EIM)
Proper record keeping of stock (I3)
Proper inventory system (I4)
Qualified personnel (I5)
Proper inventory pricing technique (I6)
Figure 1.1 Diagrammatic Presentation of the Relationship between Variables
Source: Researcher’s perception, 2013
10
1.9 Organisation of the Study
The study was assessing inventory management at VETA Kigoma. The study covered
five chapters, chapter one was about the overview of the study which included
introduction of the study, background information of the study, statement of the
problem, objectives of the research, research questions, significance of the study,
limitation of the study, scope of the study and conceptual framework.
Chapter two was concerned with literature review which was divided into two parts that
is theoretical literature review based on theories & concepts and empirical studies done
by other researchers within and outside Tanzania on the same research topic resulting to
the research gap.
Chapter three was concerned with research methodology which included, research
design, study area, population, sample and sample size, sampling procedures, types of
data sought, data collection methods, reliability and validity of measurement as well as
data management and analysis.
Chapter four was concerned with data presentation, analysis and discussion of findings.
Chapter five was concerned with summary, conclusion, recommendation and areas for
further studies.

11
CHAPTER TWO
2.0 LITERATURE REVIEW
2. 1 Theoretical Literature Review
Before an effective system of inventory control can be implemented it is essential to
analyse from records of usage what has been the trend of demand for a given item of
stock over an approximate period of time with a view to forecasting future
requirements. He further added that inventory or stock control refers to the techniques
used to ensure that stocks of raw materials or other supplies, work in progress and
finished goods are kept at levels which provide maximum service levels at minimum
costs (Lysons, 2000).
Inventories are materials and supplies that a business or institution carries either for sale
or to provide inputs or supplies to the production process. All businesses and
institutions require inventories. Often they are substantial part of total assets. He further
said that financially inventories are very important to manufacturing companies, on the
balance sheet they usually represent from 20% to 60% of total assets. As inventories are
used their value is converted into cash which improves the cash flow and return on
investment. There is a cost for carrying inventories which increases operating costs and
decreases profits hence good inventory management is essential (Arnold,et al. 2008).

12
2.1.1 Functions of Inventory
Saleem (1997) contributed that inventories are essential for keeping the production
wheel moving. Inventories keep the market going and distribution system intact. They
serve as lubrication and spring for production-distribution system.
He has given the following important functions of inventories:
Inventories gear up production, inventories provide a cushion to prevent stock outs,
inventories strike a balance between the objectives of the stores department and those of
the enterprise as the whole, inventories help in avoiding un necessary wastage and
blocking up of valuable working capital, inventories act as an insurance against errors in
demand forecasts and a well planned inventory scheme helps in efficient, smooth and
effective service to customers at a lesser cost with the help of lower investment through
planned but reduced inventories.
2.1.2 Inventory Management Concept
William Fox points out that Management is the whole process of planning, organizing,
and controlling are the organic functions of management. According to him , an organic
function is a function which is invariably basic to, and inherent in, managerial activity
whenever and wherever it is performed. These functions are performed in each and
every situation. However, staffing and directing are also important functions of
management (Saleem, 1997).
13
Inventory Management is responsible for planning and controlling inventory from the
raw material stage to the customer. Since inventory either results from production or
supports it, the two cannot be managed separately and therefore must be coordinated.
Inventory must be considered at each of the planning levels and is thus part of
production planning, master planning with end items and materials requirements
planning with components, parts and raw material (Arnold, et al. 2008).
(Lysons and Farrington, 2006) contributed that inventory management covers a wide
variety of activities. These activities will vary from organization to organization. The
scope of inventory management will also be influenced according to whether it is
primarily concerned with Materials Management (MM) or Physical Distribution
Management (PDM) or centralized or decentralized. There is clearly a significant
difference in the complexity of managing inventory based at a single location and that
where inventory is located at possibly hundreds of distribution centres. Said that
globalization is another factor that increases the complexity of inventory management.
Irrespective of such considerations, however, inventory management is likely to be
comprised of such activities such as:
Demand management – ensuring that required operational and maintenance supplies are
available in the right quantities and at the right time, forecasting future demand
requirements, managing items with difficult supply and demand patterns related to
seasonal demand, changes in end use applications or meeting demands for the
14
customisation of products, reviewing safety stock levels and controlling minimum and
maximum amounts of inventory items of both quantity and value, implementing lean
inventory policies, such as just in time (JIT) contracts to minimize investment in
inventory.
Liaising with purchasing section to ensure that supplies are replenished in accordance
with corporate and procurement policies, developing cost-effective systems and
procedures relating to the ordering, procurement and budgeting of supplies and
controlling the receipt, inspection (where necessary), recording, location and issue of
supplies to users.
Ensuring the safety and security of supplies and the avoidance of loss a result of
deterioration, theft, waste and obsolescence, coordination of inventory to ensure that
supplies can be rapidly located, preparation and interpretation of reports on stock levels,
stock usage and surplus stock, liaison with auditors regarding all aspects of inventory,
appropriate disposal of scrap, surplus and obsolete items.
According to them, the term supplies means all the materials, goods and services used
in the enterprise regardless of whether they are purchased outside, transferred from
another branch of the company or manufactured in house.

15
They have provided aims of inventory management which are four mainly known;
To provide both internal and external customers with the required service levels in
terms of quantity and order rate fill, to ascertain present and future requirements for all
types of inventory to avoid over stocking while avoiding ‘bottlenecks’ in production, to
keep costs to a minimum by variety reduction, economical lot sizes and analysis of
costs incurred in obtaining and carrying inventories and to provide upstream and
downstream inventory visibility in the supply chain.
2.1.3 Cash Flow Analysis
When inventory is purchased as raw material, it is recorded as an asset. When it enters
production, it is recorded as work in progress (WIP) Inventory, and as it is processed its
value increases by the amount of direct labour applied to it and the overhead attributed
to its processing. The material is said to absorb overhead, when the goods are ready for
sale they do not become revenue until they are sold.
However the expenses incurred in producing the goods must be paid for. This raises
another financial issue, business must have the cash to pay their bills, cash is generated
by sales and the flow of cash into a business must be sufficient to pay bills as they
become due. Businesses develop financial statements showing the cash flows into and
out of the business. Any shortfall of cash must be provided for perhaps by borrowing or
in some other way.

16
This type of analysis is called Cash Flow Analysis. Financial Inventory Performance
measures from a financial point of view, inventory is an asset and represents money that
is tied up and cannot be used for other purposes. Inventory has a carrying cost that is the
costs of capital, storage and risk. Finance people wants as little inventory as possible
and needs some measure of the level of inventory (Arnold, et al. 2008).
Total capital in any organization is of two types namely capital invested in fixed assets
such as buildings, plant, machinery etc, is termed as fixed capital and a cut in this
cannot be effected, but a reduction in what is known as working capital, high percentage
of which is locked up in inventories, is possible and there is a definite scope of
increasing the profit earning capacity of the organization.
Thus, efficient management of inventories may result in more profit margins since it
will reduce the operational and inventory cost resulting in reduction of production cost,
more competitive capacity, heavy turnover and increase in profitability. Surpluses cause
financial hardships because they tie up capital and shortages lead to poor operational
results, but satisfactory and scientific inventory control eliminates these shortcomings.
Thus proves its importance (Saleem, 1997).
2.1.4 Methods of Evaluating Inventory
There are four methods accounting uses to cost inventory namely first in first out
(FIFO), last in first out (LIFO), average cost (A.C) and standard cost (S.C). Each has

17
implications for the value placed on inventory. If there is little change in the price of an
item, any of the four ways will produce about the same results, however in rising or
falling prices they can be a pronounced difference. There is no relationship with the
actual physical movement of actual items in any of the method. Whatever method is
used is only to account for usage.
i. First In First Out (FIFO)
This method assumes that the oldest (first) item in stock is sold first. In rising prices,
replacement is at a higher price than the assumed cost. This method does not reflect
current prices and replacement will be understated. The reverse is true in a falling price
market.
ii. Last In First Out (LIFO)
This method assumes the nearest (last) item in stock is the first sold. In rising prices,
replacement is at the current price. In a falling price market existing inventory is
overvalued. However, the company is left with an inventory that may be grossly under
stated in value.

18
iii. Average Cost (A.C)
This method assumes an average of all prices paid for the article. The problem with this
method in changing prices (rising or falling) is that the cost used is not related to the
actual cost
iv. Standard Cost (S.C)
This method uses cost determined before production begins. The cost includes direct
material, direct labor and overhead. Any difference between the standard cost and actual
cost is stated as a variance (Arnold, et al. 2008).
2.1.5 Inventory Management Techniques/ Tools
As it has been pointed out earlier, the goal of inventory management is framed on cost
minimization so as to maximize the shareholders wealth, which is the main goal of the
firm. Here under are the inventory management techniques / tools to be employed for
efficiency production and profit maximization.
i. Economic Order Quantity Model (EOQ)
It is the best known approach for explicitly establishing an optimum inventory level. It
is a mathematical approach to the ordering of inventories where the combined costs of
ordering and carrying inventory are kept at minimum. While the ordering cost are costs

19
associated with the purchases of inventory, the carrying costs are cost incurred from
receipt inventories to the sale point.
The optimum order quantity is found where annual holding costs = annual holding costs
as shown in the figure below.
Figure 2.1 Cost versus Order Quantity
Source: Arnold, et al. (2008)
Total cost (T C) = Ordering cost (O) + Holding cost (H)
EOQ occurs at an order quantity in which the ordering cost equal to holding costs
Solving mathematically then,
20
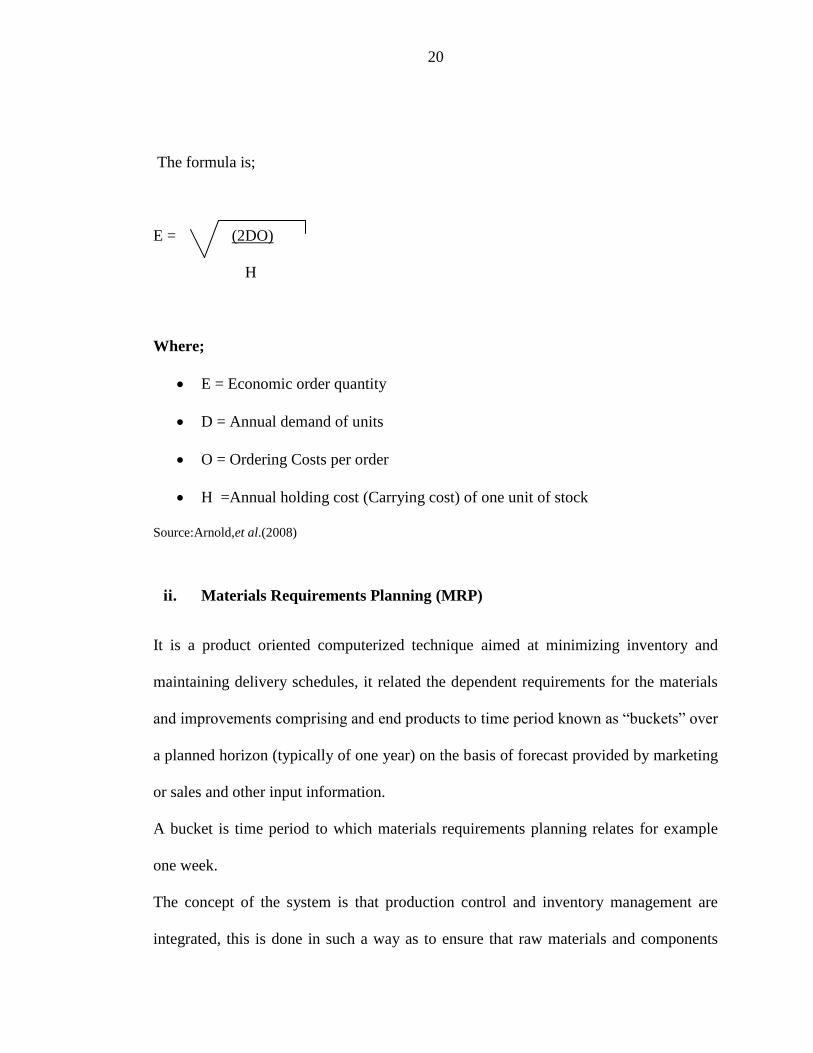
The formula is;
E = (2DO)
H
Where;
E = Economic order quantity
D = Annual demand of units
O = Ordering Costs per order
H =Annual holding cost (Carrying cost) of one unit of stock
Source:Arnold,et al.(2008)
ii. Materials Requirements Planning (MRP)
It is a product oriented computerized technique aimed at minimizing inventory and
maintaining delivery schedules, it related the dependent requirements for the materials
and improvements comprising and end products to time period known as “buckets” over
a planned horizon (typically of one year) on the basis of forecast provided by marketing
or sales and other input information.
A bucket is time period to which materials requirements planning relates for example
one week.
The concept of the system is that production control and inventory management are
integrated, this is done in such a way as to ensure that raw materials and components

21
are only made available when they are actually required and not before (Arnold, et al.
2008).
iii. Just In Time (JIT) Philosophy
This has been defined by Lee white as an inventory control philosophy whose goal is to
maintain just enough material in just the right place at just the right time to make just
the right amount of product, just in time JIT is the method of managing inventories such
that each item in production is made immediately as needed for the next step in the
production process, or each item purchased is delivered just in time. This can reduce
inventory levels virtually to zero. The basic goal of JIT is to have enough inventories on
hand to meet immediate production needs. The inventory is produced or purchased just
in time when needed (Lysons, 2000).
iv. The ABC Inventory Control Technique
To have better control at a reasonable cost it is helpful to classify the item according to
their importance. The ABC principle is based on the observation that a small number of
items often dominate the results achieved in any situation. This observation was first
made by an Italian law. As applied to inventories, it is usually found that the
relationship between the percentage of items and the percentage of annual dollar usage
follows a pattern in which three groups can be defined. Group A about 20% of the items
account for about 80% of the dollar usage, Group B about 30% of the items account for

22
about 15% of the dollar usage and Group C about 50% of the items account for about
5% of the dollar usage (Arnold,et al.2008).
Note: The percentages above are approximately and should not be taken as absolute.
The figure below shows the classification of items.
Figure 2.2 ABC Curve showing Percentage of Value versus Percentage of Items
Source: Arnold,et al.2008.
v. F S N Analysis Method
This Analysis is based on movement of items in the storehouse. The items are classified
as Fast moving (F), Slow moving (S) and Non moving (N). However this method of
23
analysis is useful in locating and identifying the absolute items. This analysis helps in
avoiding investments in Non moving or Slow moving items, the FSN analysis is also
useful in preventing obsolescence and facilitates timely control (Saleem, 1997).
2.1.6 Reasons / Benefits for Holding Inventories
( Lucey, 2003) has provided some benefits or reasons for holding inventories in an
organization which includes:
To enable production process to flow smoothly and efficiently, to absorb seasonal
fluctuations in usage or demand, to meet possible shortages in the future, to take
advantage of bulk purchasing discount, to provide buffer between production process -
this is applicable to work in progress inventory that effectively decouple operation, to
absorb variation in demand and production, to ensure that sufficient goods are available
to meet anticipated demand, as a deliberate investment policy particularly in times of
inflation or possible shortages and as a necessary part of the production process, e.g. the
maturity of the whiskey.

24
2.2 Empirical Literature Review
Here under includes abroad cases and Tanzania cases regarding the research study.
2.2.1 Abroad Cases
(Morgan, 2009) conducted a research study in United States of America on inventory
management performance to Alien Technology Corporation as his case study which is a
leading provider of radio frequency identification products for global customers, the
company is also involved with pharmaceutical products where by other companies wins
to supply pharmaceutical product to the government of United States of America
because of its good customer services well organized and planned.
The findings revealed that Alien Technology Corporation is almost 95% efficiency on
inventory management practices where by the corporation manufactures products very
high volume and at a low costs. The company provides a family of Radio Frequency
Identification product for a variety applications including supply chain management,
logistics to improve inventory management and reduce operating costs.
The researcher added that efficiency inventory management of the Alien Technology
Corporation is achieved by applying just in time purchase by assuring smooth and well
maintained relationship with suppliers of materials to ensure constant supply when the
corporation is in need of raw materials to facilitate production. The Alien Technology
Corporation in the balance sheet shown 20% value of inventory and this is normal to the

25
Company since there are some materials which are available in small quantities and are
essential to the company.
The researcher concluded that for any company to grow should take greater control on
inventory because inventories are heart to the manufacturing companies for the purpose
of meeting customer demand without running stock out or over stock situation.
Alien, Alientechnology and the Alien logo are trademarks registered of Alien
Technology Corporation in the United States of America and other countries. More
information about Alien Technology Corporation can be found on the company’s
website.
In United Kingdom, (Weber and Rick, 2008) revealed that organisations’ goal and
satisfaction are achievable within the given time limitations, however control of
inventory system which typically represents 45% to 90% of all expenses for an
organization, is needed to ensure that it has the right goods on hand to avoid stock outs
also to prevent shrinkage and run certain accounting, many organizations have fair
enough of their limited resources, capital tied up in their major assets and inventory.
Worth than that, they may have their capital tied up in the wrong kind of inventory.
Inventory may be old, worn out, shop worn, obsolete, or the wrong size, or colours, or
there may be an imbalance among different product lines that reduces the customer
appeal and concerns of the total operation. (Stevenson, 2006) revealed that inventory

26
management is a key operations management activity, effective inventory management
is critical to the smooth operation of most businesses and their supply chains. Good
inventory management has an impact on operations, marketing and finance
departments. Poor inventory management hinders operations, reduces customer
satisfaction and raises operating costs.
In Botswana, (Thiertel, 2000) revealed that the nature of Botswana Range Inventory
Management Project and the fact that national range inventory and monitoring system
has yet to be put in place, meaning that there has so far been no enhancement. In the
opinion of the evaluations, any enhancement remains a distant and unlikely possibility.
In Kenya, (Gerald and Odhiambo, 2012) revealed that 23% of the organizations were
found to recognize materials management as they had in charge reporting directly to the
Chief Executive Officer. However generally Kenyan organizations are not practicing
professionalism in materials management and owing to the huge amount of resources
they are committing on materials related activities, a lot of emphasis need to be directed
towards materials management and it should be recognized as a top management
function. Also revealed that Kenyan organizations spend an average of 56% of their
annual sales turnover on materials and materials related costs while the majority of the
organizations had not given due recognition to materials function. 64% of the
organizations were found to be applying materials management concept, though most
were doing so unknowingly, majority of the organizations have material functions

27
performed by general managers and production managers. Most Kenyans have not yet
recognized professionalism in materials management as most sensitive positions like
purchasing and supplies are undertaken by non professionals. This is a great undoing in
this globally competitive market and recommended that much emphasis and attention
should be given to materials management to enable organizations achieve the best
optimal cost structures as such need to create departments dealing with materials
function to enable easy control and monitoring costs.
In Zimbabwe, (Lisa et al,. 2003) on their study revealed that inventory management,
storage and distribution of goods to users is efficiently done for example to hospitals
drugs are distributed in an efficient manner because qualified people are employed with
right qualifications and experience in materials related functions and the entire system
of inventory management is computerized to ensure good performance.
In South Africa, (Musara, 2012) conducted a study and revealed that the majority of
organizations are not applying Just In Time (JIT) inventory management principles, he
added that there are challenges impeding the implementation of Just In Time (JIT)
principles in the organizations, these challenges include, lack of reliable supplier
networks, lack of capital and lack of knowledge of immediate financial gain among
others, further more statistically significant positive correlations between the application
of JIT inventory management principles and cost efficiency, quality and flexibility were
found. It is therefore deduced that organizations can benefit significantly in terms of

28
improved quality of products, increased operational, costs cuts and increased flexibility
b y applying the JIT inventory management principle.
In Uganda, (Namagembe, 2010) her study revealed that a significant positive
relationship between information sharing and inventory management means that if
chain partners implement information technologies and collaborate among each other,
then inventory management could improve, also in her study revealed that a significant
positive relationship between inventory management and customer satisfaction means
that in order to obtain high levels of customer satisfaction there is need for better
inventory management. She further showed that significant positive relationship
between information sharing and customer satisfaction which implies that increased
levels of information sharing among chains partners lead to improved levels in customer
satisfaction.
2.2.2 Tanzania Cases
The assessment of inventory management effectiveness can also be evaluated from the
assessment of the effectiveness of inventory management and control process as one
aspect that contribute to or enhance inventory management practices.
(Kazare, 2009) researched on the assessment of the effectiveness of inventory
management and control process at Saint Augustine University of Tanzania (SAUT) –
Mwanza. His findings revealed that 67% of respondents said two procurement

29
personnel are holder of first degree and 33% of respondents said that is just only one
procurement personnel who hold degree plus C P S P. He said, this means that
procurement personnel at SAUT are qualified approximately by 80%, and this is a good
indicator that procurement and supply chain management field at SAUT is taken as
field of professional.
Therefore effective inventory management and control could be achieved on the ground
that the function is under competent and qualified professional people because the
quality of the activities is determined by the quality of people.
He added that apart from the qualifications of procurement personnel, revealed that
SAUT procure materials at the beginning of each semester whereby economic order
quantity (EOQ) is being applied, procurement planning and how to procure and stock
those requirement are being done accordingly too.
This implies that, the University Procurement Personnels are familiar with the scope of
inventory management and control which encompasses with determination of what to
acquire and stock, when to acquire and stock them and how much to acquire and stock
with due regard to the associated costs of ordering, carrying and stock out costs.
Furthermore, the researcher revealed that procurement personnel at SAUT do not attend
seminars on inventory management and control even once per year, and SAUT herself

30
had never provided short courses and training on inventory management and control to
her workers, stores officer in particular.
(Utouh, 2012) according to the Controller and Auditor General (CAG) report for the
financial 2010/2011 on the audit of Public Authorities (PA) and Other Bodies (OBs) in
Tanzania observed that inventories as assets in the form of materials or supplies to be
consumed in the production process or in rendering of services, inventories represent a
large portion of the entity’s investment and must be well managed in order to minimize
losses that might result from inventory mismanagement. In fact, Public Authorities and
Other bodies (OBs) cannot absorb the types of losses arising from poor inventory
management over a period of time. Unless inventories are properly managed and
controlled, they become unreliable, inefficient and costly. From the report
recommended that Public Authorities should have a proper inventory system which can
capture all the details regarding to inventory so as to establish a list of potential revenue
and to avoid unnecessary losses incurred by the service providers.
2.3 Research Gap
From the theoretical and empirical literature reviews the study realized that, there are
notably inventory mismanagement to organizations leading to unnecessary losses not
planned and the reason behind is unclear. Many studies have been addressing
procurement procedures in parastatal organizations and ignoring inventory management
which to Tanzanian context alarming losses has been reported by the Controller and

31
Auditor General on inventory mismanagement. Therefore this study has tried to
ascertain the factors contributing to why inventory mismanagement to government
parastatals? By taking VETA Kigoma as a case area of focus.

32
CHAPTER THREE
3.0 RESEARCH METHODOLOGY
3.1 Research Design
There are many definitions of research design but no one definition imparts the full
range of important aspects (Cooper and Schindler, 2003).
Research design is the program that guides the investigator in the process of collecting,
analyzing and interpreting observations. Or is blue print that enables the investigator to
come up with solution to the problem and guides him or her in various stages of the
research (Nachmias, 2003).
A research design is the conceptual structure within which research is conducted, it
contribute the blue print for the collections, measurement and analysis of data (Kothari,
1990).
The study used a cross sectional type of research design due to the fact that the study
was conducted once and involved only few variables which seem essential. A cross
sectional survey method was used together information through asking questions to
representative cross section of the population point in time.

33
3.2 Study Area
The study used VETA Kigoma to represent all parastatal organisations available in
Tanzania which are made to provide service to the citizens of Tanzania.VETA Kigoma
which is known as Kigoma RVTSC is found in Kigoma Region and is located at Mulole
area, provides vocational education to Tanzanians and has fifteen vocational courses
which are; Welding and Metal Fabrication, Auto body repair/Panel beating, Information
and Communication Technology, Painting and Sign writing, Motor vehicle mechanics,
Auto electric, Tailoring/Designing Sewing and Cloth Technology, Food production,
Carpentry and joinery, Masonry and Brick laying, Secretarial and Computer,
Refrigeration and Air Condition, Plumbing, Electronics and Domestic Electrical
Installation. It has capacity of taking four hundred eighty six trainees on which two
hundred eight are boarding trainees and two hundred seventy eight are day trainees.
3.3 Population
Population is defined as a cluster of statistically equivalent individuals or a collection of
individuals who are genetically exchangeable (Lawson, 2012). For this study the
population included all staffs and vocational trainees of Kigoma Regional Vocational
Training Services Centre (VETA Kigoma). From the identified population, the
representative sample was drawn.

34
3.4 Sample and Sample Size
3.4.1 Sample
A sample is a subset or portion of the total population, where as population is totality of
the objects under investigation (Blank, 1984).
An optimal sample should be one which fulfills the requirements of efficiency,
responsiveness, reliability and flexibility (Kothari, 2006).
It should be noted that, from a study point of view the term population not only
applicable to human beings but also to any case of interest in a study. In this study the
targeted population on which the study obtained information was staffs and vocational
trainees of Kigoma RVTSC where the representative sample was drawn.
3.4.2 Sample Size
Sample size is the number of items to be selected from the universe to constitute a
sample. The size of sample should neither be excessively large nor too small. It should
be optimum; an optimum sample is one which fulfills the requirements of efficiency,
representativeness, reliability and flexibility. Budgetary constraint must invariably be
taken into consideration when we decide the sample and the sample size (Kothari,
2004).

35
A sample size of 120 respondents was used in this study on which 40 respondents were
staffs and 80 respondents were vocational trainees.
Actually the sample size of 120 respondents was enough to give good value of the data
to be collected in the field leading to relevant research findings of the study on the
assessment of inventory management to VETA Kigoma.
Table 3.1 Sample Size Selection
Source: Researcher, 2013
This approach was arrived at basing on Namagembe, (2010).
3.5 Sampling Procedures
Sampling procedure refers to, techniques used in selecting the items for the sample.
The study used non probability sampling technique called purposive sampling.
Category Sample size % of sample selected
Trainees 80 66.67
Staffs 40 33.33
Total 120 100

36
Non probability sampling is that sampling procedure which does not afford any basis
for estimating the probability that each item in the population has equal chance of being
included in the sample. In this type of sampling, items of the sample are selected
deliberately by the study; his choice concerning the items remains supreme (Kothari,
2004).
The study used purposive sampling because wanted to obtain information from the right
people who can assist at large in coming up with valuable data which are valid and
reliable when tested under the same conditions. Also the sample size was reasonable
and attainable to use purposive sampling since was not too large and only the study was
interested to get information from the respondents whom think that relevant data can be
gathered for the study.
3.6 Types of Data
Data are facts, figures and other relevant materials past and present serving as bases for
study and analysis (Krishnaswami, 1993).
There are two types of data namely primary data and secondary data on which the study
should keep in mind. In order for the study to be effective and reliable in bringing good
value of the data to be collected the study employed both primary and secondary data in
assessing the inventory management at Kigoma RVTSC.

37
3.6.1 Primary Data
Primary data are those which are collected afresh and for the first time, and this happen
to be original in character (Kothari, 2004).
The study used personal interviews with structured questionnaires where by the
respondents were requested to fill in the questionnaires, the questionnaires had both
closed and open- ended questions so as to obtain the opinions and comments of the
respondents, also participant observation was used during the study.
3.6.2 Secondary Data
Secondary data are those data obtained from literature sources, which have already been
collected by other people for some other purposes; it is the second hand information
which includes both raw data and published one (Saunders, et al. 2000).
The study extracted data from recorded documents at Kigoma RVTSC which seemed
relevant to the study on assessment of inventory management.
3.7 Data Collection Methods
The study collected information from the field using basically the following pointed
out investigation methods of data collection, observation, interview, questionnaire and
reviewing various documents relating to the topic understudy.

38
3.7.1 Observation
Observation becomes a scientific tool and the method of data collection for the study
when it serves in formulating research purpose, is systematic planned and recorded and
is subjected to check and control of validity and reliability. Observation is the way an
investigator observes things around him without asking from the respondents.
This method of data collection refers to the circumstance of being in or around an
ongoing setting and recording facts as they are observed, listened or experienced. The
investigator in this case actually works or interacts with the study setting (Ndunguru,
2007).
The study used participant observation as this approach was deemed to be more reliable
together information easily. The main advantage of this method was that, subjective
bias was eliminated and information that was obtained exactly related to what was
happening.
3.7.2 Interview Method
Interview method is the method of collecting data that involves presentation of oral -
verbal stimuli and reply in terms of oral – verbal responses. Personal interview is the
method of collecting data that requires a person known as the interviewer asking
questions generally in a face to face contact to the other person or persons. At times the
interviewee may also ask certain questions and the interviewer respond to these
questions, but usually the interviewer initiates the interview and collects the information
(Kothari, 2004).

39
Regarding to this study on assessment of inventory management, the study used
personal interview method
3.7.3 Questionnaire Method
Questionnaire is simply a formalized set of questions for eliciting information, the term
questionnaire is often used by studies to refer set of questions which will be mailed to
respondents for them to answer and turn to the sponsor of the study (Blank, 1984).
Structured questionnaires are those questionnaires in which there are definite concrete
and predetermined questions. Resort is taken to this sort of standardization to ensure
that all respondents reply to the same set of questions. The form of the questions may be
either closed ( ie…of the type “yes” or “no” or open (ie..Inviting force response) but
should be stated in advance and not constructed during questioning (Kothari, 2004).
The study constructed structured questionnaires both open ended and closed ended
questions so as to grasp the reliable and valid data regarding to the assessment of
inventory management at VETA Kigoma to which these questionnaires were filled by
the respondents targeted. Closed ended questions are easier to analyse, easier to
administer and are economical in terms of time and money, where as open ended
questions permit depth insight to hidden issues which need to be explained. Also
biasness is eliminated on the use of questionnaire method.
40
3.7.4 Review of Documents
Documentation method is about gathering data from a secondary source. The
documentary sources of data play an important role in disseminating knowledge in all
disciplines. The documentary sources of data for research purposes include published
books, manuscripts, journals, research reports, newspapers and other unpublished
literally works (Ndunguru, 2007).
Documents are secondary form of data collected and stored by organizations or
governments so as to be used by externals who are interested with those data to use in
any relevant area to which can fit, these includes articles, income statements of the
organizations, government manuals, reports etc (Saunders, et al. 2000).
3.8 Reliability and Validity of Data
3.8.1 Reliability of Data
Reliability is the extent to which data collection technique will yield consistent
findings, similar observations would be made or conclusions reached by other
researcher (Saunders, 2007).
Reliability of a measuring instrument is its ability to produce consistency measurement
each time when we administer an instrument to the same population and contain a
similar results we say that the instrument is reliable (Kumar, 2005).

41
The study tested or estimated the reliability of information collected to Kigoma RVTSC
on assessment of inventory management through grouping questions in a questionnaire
in two groups of respondents being given exactly the same questions of the same
concept each group with similar conditions and the findings revealed that similar results
were obtained by the study which proves the reliability of the information collected.
3.8.2 Validity of Data
Validity is the degree to which a measuring instrument measures what it is supposed to
measure (Nachmias, 2008). This was achieved by the study as respondents were
cooperative and answers were correctly recorded and analysed properly, the sample
chosen was representative where right questions were asked to respondents for the study
to achieve its purpose.
The study assured high degree of accuracy through selecting the sample from a true
representative of population and to use the current documents of VETA Kigoma to
ensure validity of information to be collected.

42
3.9 Management and Analysis of Data
3.9.1 Data Management
Data management is the whole process of detecting as well as correcting error and in
consistencies in data. It includes identification of missing data, detecting of entry errors
and the like. The main purpose is to ensure data quality (Sharma, 2005).
Unsuitable data for the intended study were dropped and remained with suitable data
only, and this was achieved through planning, organising and controlling the entire
process of data collection from the targeted respondents by eliminating biasness
situation and selecting only current data from the organization documents which can
reflect reality.
3.9.2 Data Analysis
Data collected were edited and coded. These processed data were analysed using
Statistical Package for Social Sciences (SPSS 16.0 for windows), the print out of
information from the SPSS was analysed and was presented in the forms of tables and a
discussion of the information contained in those table was done. This was done by
preparing Data file starting on the variable view then proceed on Data view, the Data
view displayed actual data and new variables created.
The variable view window contained the definitions of each variable in the data set
including its name, type, label, width, alignment and other informations. The output

43
window was where the results of queries were done. To run the SPSS data were entered
directly into the package, analysis function commanded then descriptive statistics
resulted to preparing frequencies. The output was printed directly copied from the
output viewer and pasted to word for presentation and discussion of findings in the
study.

44
CHAPTER FOUR
4.0 DATA PRESENTATION, ANALYSIS AND DISCUSSION
4.1 Introduction
This chapter presents the results of the study. Data gathered were coded, analysed using
Statistical Package for Social Sciences (SPSS) and descriptive statistical methods which
are frequencies and percentages interpreted and discussed. The findings have been
presented in tabular forms for better and clear understanding.
4.2 Respondents Involved in the Study
The study involved 40 respondents from staff of VETA Kigoma and 80 respondents
from vocational trainees of VETA Kigoma. All questionnaires distributed to
respondents were 100% collected as indicated in Table 4.1 below.
Table 4.1: Involvement of Respondents in the Study
Questionnaires Number of
respondents
Collected % of Total
Kigoma RVTSC staff 40 40 100
Kigoma RVTSC trainees 80 80 100
Total 120 120 100
Source: Field data, 2013

45
4.2.1 Distribution of Respondents by Age
4.2.1.1 Staff Distribution by Age
Table 4.2 indicates the respondents’ (staff) distribution by age on which the study
revealed that 15% aged between 18 – 30 years, 60% aged between 31 – 45 years and
25% aged between 46 – 60 years. This implies that most of the staff aged between 18 –
45 years which amounted 75% by giving indication that the experienced staff still
available at a good percentage which results to high quality training to vocational
trainees as teachers still have enough energy to impart knowledge to trainees by so
doing skilled labour force in the country increases resulting to reducing unemployed
gap hence economic growth. The staff who are approaching the retiring age are between
46 – 60 years which constitute only 25%. This information is summarized by Table 4.2
below.
Table 4.2 Staff Distribution by Age
Age category Frequency Percent
Valid 18 - 30 years 6 15.0
31 - 45 years 24 60.0
46 - 60 years 10 25.0
Total 40 100.0
Source: Field data, 2013

46
4.2.1.2 Vocational Trainees’ Distribution by Age
Table 4.3 indicates the respondents’ (vocational trainees) distribution by age on which
the study revealed that 92.5% aged between 18 – 25 years, 6.2% aged between 26 – 30
years and 1.2% aged between 31 years and above. This implies that most of the
vocational trainees aged between 18 – 25 years which amounted 92.5% by giving
indication that the enrollment of VETA trainees lies at the age of 18 to 25 years which
is a good age interval as trainees will acquire knowledge and use it effective while still
strong enough and capable of working hard by so doing the economy of the country
grow tremendously in the sense that most of them will be employed in various
organizations or industries and others will be self employment as in their syllabus they
are studying entrepreneurship aiming at self employment. Table 4.3 below shows
vocational trainees’ distribution by age.
Table 4.3 Vocational Trainees’ Distribution by Age
Age
category
Frequency Percent
Valid 18 - 25years 74 92.5
26 - 30 years 5 6.2
31years and above 1 1.2
Total 80 100.0
Source: Field data, 2013

47
4.2.2 Distribution of Respondents by Gender
4.2.2.1 Staff Distribution by Gender
Table 4.4 indicates the respondents’ (staff) distribution by gender on which the study
revealed that 80% were male and 20% were female. This implies that most of the staff
of Kigoma RVTSC are male which amounted 80% by giving indication that most of the
teachers at the centre are males by that fact the government has the responsibility of
encouraging girls in secondary schools to take science subjects so as to increase the
number of female staff in higher learning institutions and by so doing women in one
way or another are empowered. Table 4.4 below summarizes the distribution of
respondents (staff) by gender.
Table 4.4 Staff Distribution by Gender
Gender Frequency Percent
Valid Male 32 80.0
Female 8 20.0
Total 40 100.0
Source: Field data, 2013
4.2.2.2 Vocational Trainees’ Distribution by Gender
Table 4.5 indicates the respondents’ (vocational trainees) distribution by gender on
which the study revealed that 56.2% were male and the remaining 43.8% were female.
This implies that there is a gender balance in making enrollment of vocational trainees
to VETA institutions which by so doing reduces dependent gap as even girls are given

48
high priority in making sure that they acquire vocational education to increase the
skilled labour force in Tanzania and hence improved life standard of women as will be
imparted with knowledge to apply it in their future life. The slogan that “to educate the
woman is to educate the nation” comes true through this observation. Table 4.5 shows
vocational trainees’ distribution by gender.
Table 4.5 Vocational Trainees’ Distribution by Gender
Gender Frequency Percent
Valid Male 45 56.2
Female 35 43.8
Total 80 100.0
Source: Field data, 2013
4.2.3 Respondents’ Marital Status
4.2.3.1 Staff Marital Status
Table 4.6 indicates the respondents’ (staffs) marital status on which the study revealed
that 15% were single (unmarried), 82.5% were married and 2.5% divorced. This implies
that most of the staff of Kigoma RVTSC are married which amounted 82.5% by giving
indication that learning process is well done as instructors are matured enough by that
fact they are giving wise and constructive ideas concerning real life situations to
trainees by so doing makes the trainees to work hard enough to attain their future
expectations and hence improved life standard from the individual level to the national
level. Table 4.6 shows staff marital status.

49
Table 4.6 Staff Marital Status
Status Frequency Percent
Valid Single 6 15.0
Married 33 82.5
Divorced 1 2.5
Total 40 100.0
Source: Field data, 2013
4.2.3.2 Vocational Trainees’ Marital Status
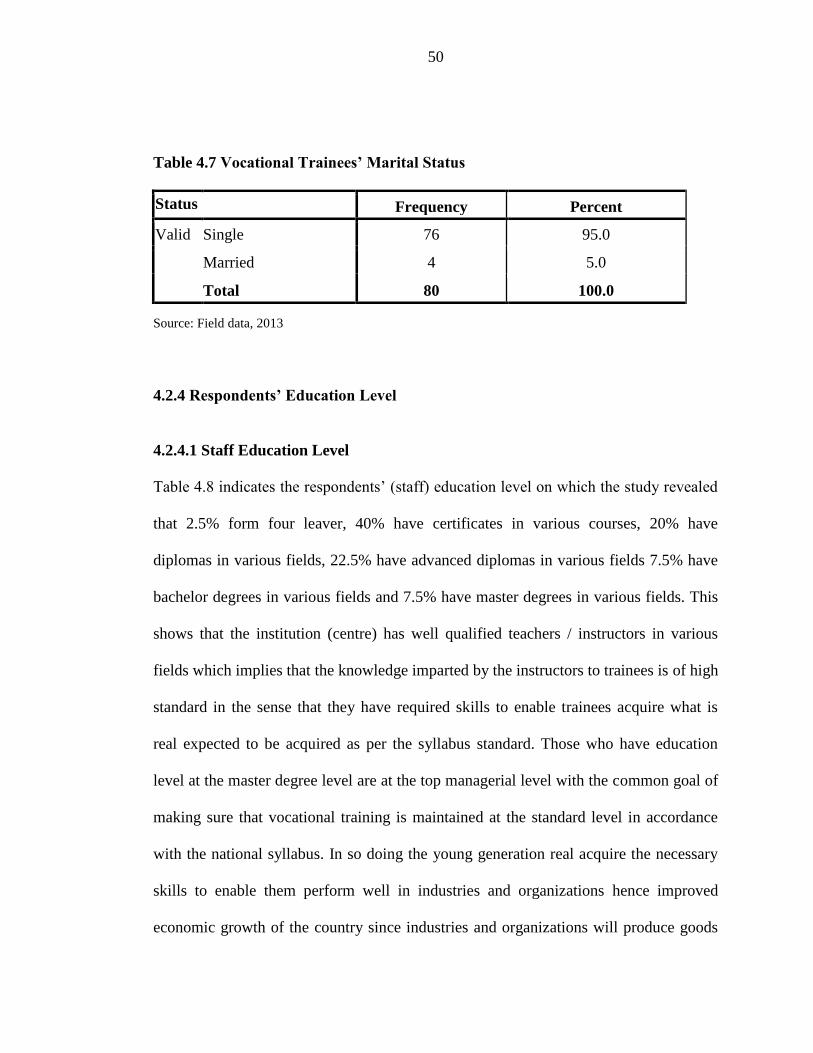
Table 4.7 indicates the respondents’ (vocational trainees) marital status on which the
study revealed that 95% were single (unmarried) and the remaining 5% were married.
This has been reflected in Table 4.3 which showed that most of the vocational trainees
aged between 18 – 25 years which amounted 92.5% by giving indication that the
enrollment of VETA trainees lies at the age of 18 to 25 years. This is a good indicator
that the young generation is real considered by the national policy in making sure that is
skilled enough aiming at reducing the unemployment gap as to train the young
generation is to train the whole nation. By that fact Vocational Education and Training
Authority (VETA) have been established purposely by the Government through the
VET Act No.1 of 1994 to make sure that the young generations acquire quality training
on vocational education. Table 4.7 shows vocational trainees’ marital status.
50
Table 4.7 Vocational Trainees’ Marital Status
Status Frequency Percent
Valid Single 76 95.0
Married 4 5.0
Total 80 100.0
Source: Field data, 2013
4.2.4 Respondents’ Education Level
4.2.4.1 Staff Education Level
Table 4.8 indicates the respondents’ (staff) education level on which the study revealed
that 2.5% form four leaver, 40% have certificates in various courses, 20% have
diplomas in various fields, 22.5% have advanced diplomas in various fields 7.5% have
bachelor degrees in various fields and 7.5% have master degrees in various fields. This
shows that the institution (centre) has well qualified teachers / instructors in various
fields which implies that the knowledge imparted by the instructors to trainees is of high
standard in the sense that they have required skills to enable trainees acquire what is
real expected to be acquired as per the syllabus standard. Those who have education
level at the master degree level are at the top managerial level with the common goal of
making sure that vocational training is maintained at the standard level in accordance
with the national syllabus. In so doing the young generation real acquire the necessary
skills to enable them perform well in industries and organizations hence improved
economic growth of the country since industries and organizations will produce goods

51
and service of high standard using these skilled labour force. Table 4.8 shows staff
education level.
Table 4.8 Staff Education Level
Level Frequency Percent
Valid Form four 1 2.5
Certificate 16 40.0
Diploma 8 20.0
Advanced diploma 9 22.5
Bachelor degree 3 7.5
Masters degree 3 7.5
Total 40 100.0
Source: Field data, 2013
4.2.4.2 Vocational Trainees’ Education Level
Table 4.9 indicates the respondents’ (vocational trainees) education level on which the
study revealed that 5% were standard seven and 95% were form four. This implies that
the form four education is a necessary education to all Tanzanians according to the
national policy as every ward has a secondary school to make every pupil completing
standard seven education to join with secondary education because learning
environment have been improved by the Government to make sure that the young
generation acquire the necessary education for their future life in so doing the poverty
margin is a bit reduced if not eliminated. That is why the study revealed that 95% of
trainees are form four leaver which is a significant improvement to the nation unlike the

52
previous years where most of the trainees enrolled by the Vocational Education and
Training Authority (VETA) were standard seven. Table 4.9 shows vocational trainees’
education level.
Table 4.9 Vocational Trainees’ Education Level
Level Frequency Percent
Valid Standard seven 4 5.0
Form four 76 95.0
Total 80 100.0
Source: Field data, 2013
4.2.5 Respondents’ Physical Disability
4.2.5.1 Staff Physical Disability
Table 4.10 indicates the respondents’ (staff) physical disability on which the study
revealed that 12.5% had physical disability and the remaining 87.5% were physically
fit. During investigation the study realized that those disabled staff the situation was not
so critical enough as they continued with the normal routine of the centre’s daily
operations as the core activity is training. By that fact the centre is not losing any thing
with the stay of 12.5% disabled staff whose disability was not critical to disrupt the
learning process. Table 4.9 shows staff physical disability.

53
Table 4.10 Staff Physical Disability
Disabled Frequency Percent
Valid Yes 5 12.5
No 35 87.5
Total 40 100.0
Source: Field data, 2013
4.2.5.2 Vocational Trainees’ Physical Disability
Table 4.11 indicates the respondents’ (vocational trainees) physical disability on which
the study revealed that only 1.2% had physical disability and the remaining 98.8% were
physically fit. This implies that most of the trainees enrolled by the institution (centre)
are physically fit and by so doing even their practical performance in learning process is
high as most of their practicals need a person who is actually physically fit especially to
courses like Welding and Metal fabrication, Panel beating, Domestic electrical
installation, Motor vehicle mechanics, Plumbing, Carpentry and joinery and others
which need health fitness. Table 4.11 shows vocational trainees’ physical disability.
Table 4.11 Vocational Trainees’ Physical Disability
Disabled Frequency Percent
Valid Yes 1 1.2
No 79 98.8
Total 80 100.0
Source: Field data, 2013

54
4.3 Rationale of Keeping Inventory
The study on the respondents (staff) response on the rationale of keeping inventory
revealed that all staff agreed that inventory is a necessary evil by any means to their
daily centre operations have to stock in order to make sure that the learning process is
efficiency and effective in the sense that materials are made available at the time when
needed at a certain stage of training as theory and practical both go together to make
trainees understand well the module which is taught, and is only possible to attain this if
materials are stored and wait to be used at the time when needed.
4.4 Trainees Practical Training Materials
Table 4.12 indicates the respondents (vocational trainees) response on the practical
training for each module on which the study revealed that 92.5% said that they receive
practical training for each module timely and the remaining 7.5% said that they do not
receive practical training for each module timely. Since vocational trainees who said
that practical training for each module taught to them timely amounted 92.5% this
implies that the learning process at the centre is running effectively with the purpose of
making sure that the trainees are competent to their field and by so doing the skilled
labour force expected by the nation becomes true as trainees are well equipped with
knowledge. Table 4.12 shows trainees practical training materials.

55
Table 4.12 Trainees Practical Training Materials
Response Frequency Percent
Valid Yes 74 92.5
No 6 7.5
Total 80 100.0
Source: Field data, 2013
4.5 Method Used to Evaluate Inventory
The study on the respondents (staff) response on the method used to evaluate inventory
(How is the inventory priced to ensure efficiency?) revealed that all the staff said that
First In First Out (FIFO) method is used to evaluate/price inventory in the organization
which implies that the earlier the material received in store the first the material is
issued from store, this situation or fact had been proved by the vocational instructors as
their training materials request in accordance with what type of materials are needed
first for the teaching module before the next module to start. By so doing this signifies
that the first materials purchased are the first materials to be issued from store for use.
This method of First In First Out (FIFO) has been discussed by Arnold, et al. 2008
which is based on the principle that the oldest (first) item in stock is issued first and vice
versa.

56
4.6 Examination of the Stores Officer Qualification
The respondents agreed that the education level of stores staff determine efficiency over
inventory control and the study on the respondents (staff) response on the qualification
of the stores officer revealed that all the staff said that the stores officer of the centre
(institution) has a Certified Procurement and Supplies Professional (CPSP) certificate
hence is a well qualified personnel as far as materials management is concerning. This
implies that the centre is well equipped to procurement and supplies section or unit in so
doing efficiency and effectiveness in materials management is achieved as all procedures
concerning stores operations are adhered. This has been supported by Kazare, 2009 who
stated that effective inventory management and control can be achieved on the ground
that all procurement and stores functions are under competent and qualified professional
people because the quality of the activities is determined by the quality of people.
4.7 Centre General Performance on Meeting Trainees’ Needs
Table 4.13 indicates the respondents (vocational trainees) response on the centre general
performance on meeting trainees’ requirements on the study revealed that 22.5% said
that the centre general performance is very good, 67.5% said that the centre general
performance is good and the remaining 10% said that the centre general performance is
satisfactory. Here the general performance include trainees treatment, trainees meal
time table, quality of food delivered, trainees teaching module, practical training
attended and the general entertainments like sports and games materials. The study
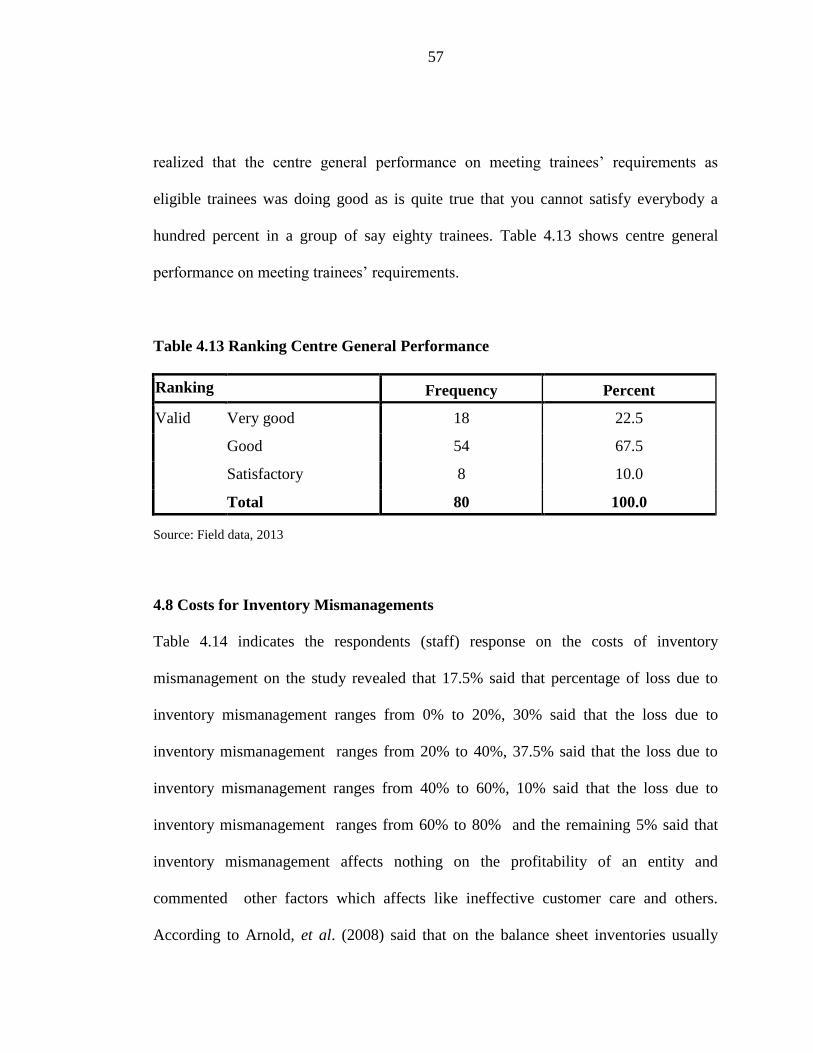
57
realized that the centre general performance on meeting trainees’ requirements as
eligible trainees was doing good as is quite true that you cannot satisfy everybody a
hundred percent in a group of say eighty trainees. Table 4.13 shows centre general
performance on meeting trainees’ requirements.
Table 4.13 Ranking Centre General Performance
Ranking Frequency Percent
Valid Very good 18 22.5
Good 54 67.5
Satisfactory 8 10.0
Total 80 100.0
Source: Field data, 2013
4.8 Costs for Inventory Mismanagements
Table 4.14 indicates the respondents (staff) response on the costs of inventory
mismanagement on the study revealed that 17.5% said that percentage of loss due to
inventory mismanagement ranges from 0% to 20%, 30% said that the loss due to
inventory mismanagement ranges from 20% to 40%, 37.5% said that the loss due to
inventory mismanagement ranges from 40% to 60%, 10% said that the loss due to
inventory mismanagement ranges from 60% to 80% and the remaining 5% said that
inventory mismanagement affects nothing on the profitability of an entity and
commented other factors which affects like ineffective customer care and others.
According to Arnold, et al. (2008) said that on the balance sheet inventories usually

58
represent from 20% to 60% of total assets therefore have to be handled with great care.
This statement is supported by 67.5% of respondents who said that the loss due to
inventory mismanagement constitute from 20% to 60%. Table 4.14 shows response on
percentage of loss due to inventory mismanagement.
Table 4.14 Percentage of Loss due to Inventory Mismanagement
Ranking Frequency Percent
Valid 0% to 20% 7 17.5
20% to 40% 12 30.0
40% t0 60% 15 37.5
60% to 80% 4 10.0
Not applicable 2 5.0
Total 40 100.0
Source: Field data, 2013
4.9 Technique Used to Determine Demand of Materials
Table 4.15 indicates the respondents (staff) response on the method/technique adopted
to ensure inventory control which intended to observe if the system adopted was
adequate for proper control of stock although they generally agreed that they are using
adequate method/system for proper control of stock, the study revealed that 20% said
that the institution / centre use Economic Oder Quantity in determining demand of
materials needed, 75% said that the centre apply Materials Requirement Planning
(MRP) to determine demand of materials needed, 2.5% said that the centre use Just In
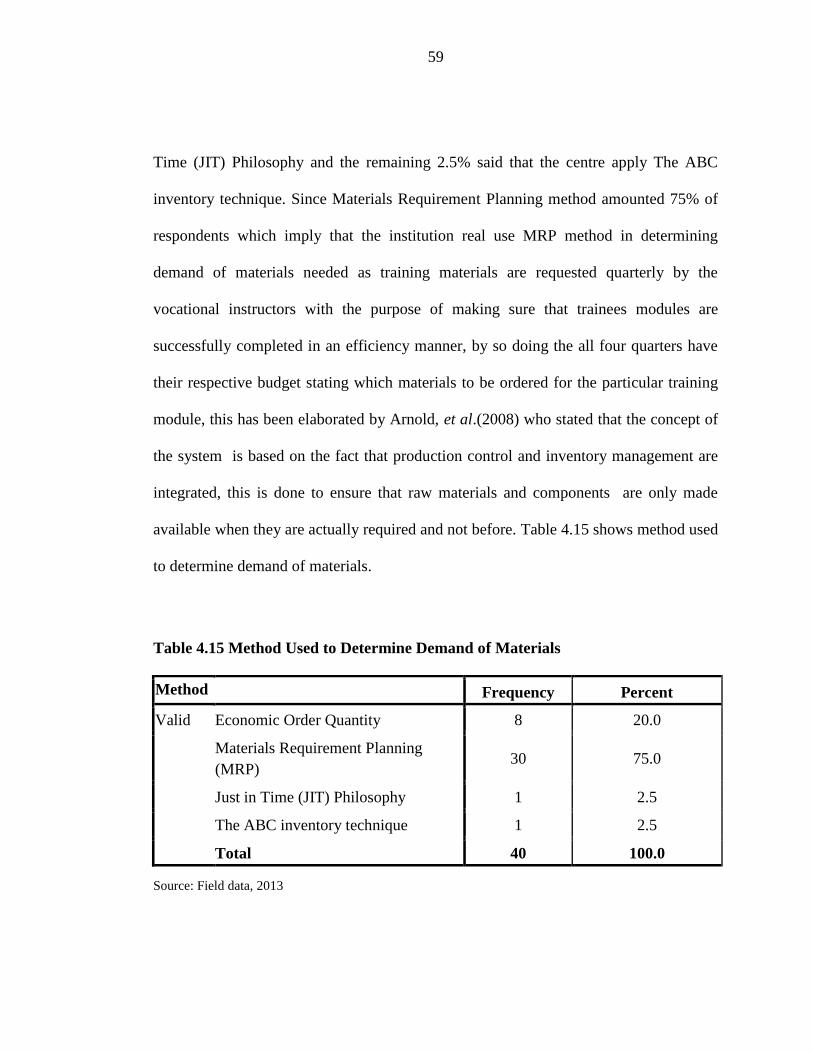
59
Time (JIT) Philosophy and the remaining 2.5% said that the centre apply The ABC
inventory technique. Since Materials Requirement Planning method amounted 75% of
respondents which imply that the institution real use MRP method in determining
demand of materials needed as training materials are requested quarterly by the
vocational instructors with the purpose of making sure that trainees modules are
successfully completed in an efficiency manner, by so doing the all four quarters have
their respective budget stating which materials to be ordered for the particular training
module, this has been elaborated by Arnold, et al.(2008) who stated that the concept of
the system is based on the fact that production control and inventory management are
integrated, this is done to ensure that raw materials and components are only made
available when they are actually required and not before. Table 4.15 shows method used
to determine demand of materials.
Table 4.15 Method Used to Determine Demand of Materials
Method Frequency Percent
Valid Economic Order Quantity 8 20.0
Materials Requirement Planning
(MRP) 30 75.0
Just in Time (JIT) Philosophy 1 2.5
The ABC inventory technique 1 2.5
Total 40 100.0
Source: Field data, 2013

60
4.10 Centre Inventory Management Effectiveness Ranking
Table 4.16 indicates the respondents (staff) response on the inventory management
effectiveness ranking on the study revealed that 2.5% said that the centre on inventory
management is effective by 20%, 2.5% said that the centre is effective by 40%, 22.5%
said that the centre is effective by 60% and the remaining 72.5% said that the centre on
inventory management is effective by 80%. This had been reflected in Table 4.15 which
the findings revealed that the centre stores officer is qualified personnel holding a
Certified Procurement and Supplies Professional (CPSP) certificate and is registered by
the Procurement and Supplies Professional and Technicians Board (PSPTB). Since the
respondents who said centre inventory management is effective by 80% amounted
72.5% which implies that the institution is performing well as far as materials
management is concerned. Table 4.16 shows centre inventory management
effectiveness ranking.
Table 4.16 Inventory Management Effectiveness Ranking
Ranking Frequency Percent
Valid 20% effective 1 2.5
40% effective 1 2.5
60% effective 9 22.5
80% effective 29 72.5
Total 40 100.0
Source: Field data, 2013

61
4.11 Stock out Situation
Table 4.17 indicates the respondents (staff) response on the stock out problem on the
study revealed that 17.5% agreed that there is a notable stock out situation which was
mostly caused by technicality of the materials requested by the users (technical
specifications) which made the items needed to a bit delay to be delivered by suppliers
or service providers, but the immediate solution of this problem is to make request
earlier for materials whose specifications seem a bit complicated so as to give the
procurement unit ample time to process the order and deliver the requested materials
timely and training process successful, the remaining 82.5% said that there is no
notable stock out problem on the centre daily operations as every activity is scheduled
and put in procurement plan by so doing all the materials to be purchased for the whole
year to facilitate training activities are known and specifications are put clear. Table
4.17 shows response on stock out situation.
Table 4.17 Response on Stock out Situation
Response Frequency Percent
Valid Yes 7 17.5
No 33 82.5
Total 40 100.0
Source: Field data, 2013

62
4.12 Seminar Attendance Frequency for Capacity Building
Table 4.18 indicates the respondents (staff) response on the frequency of seminar
attendance for capacity building on the study revealed that 27.5% said that they attend
seminar with regard to their professional once per year, 5% said that they attend
seminars for capacity building twice per year, 5% said that they attend seminar with
regard to their professional quarterly which means after three month period they attend
a certain seminar or workshop to enhance their professional , 22.5% said that seminars
which attend with regard to their professionals are unscheduled meaning that there is
no proper schedule given by the human resource manager to employees concerning
workshops or seminars to be attended for the year as per the budget and 40% said that
Not applicable meaning that there is no such an arrangement to the centre or institution
concerning sending employees/staff to seminars or workshops to enhance their
professionals. This implies that to the centre there is a poor attendance of
staffs/employees going to various seminars or workshops to enhance their fields of
professional which is a bad image to the centre as is obvious understood that capacity
building to staffs is of greater important since technology, syllabus and methods of
teaching keep on changing therefore staffs have to equip with those changes and
implement in the training process. Table 4.18 shows seminar attendance frequency for
capacity building.

63
Table 4.18 Response on Seminar Attendance Frequency
Response Frequency Percent
Valid Once per year 11 27.5
Twice per year 2 5.0
Quarterly 2 5.0
Unscheduled 9 22.5
Not applicable 16 40.0
Total 40 100.0
Source: Field data, 2013
4.13 Status of the Centre Warehouse
Table 4.19 indicates the respondents (staff) response on the status of the centre
warehouse on the study revealed that 2.5% said that the centre warehouse is strongly
well equipped with all required facilities of a warehouse, 60% said that the centre
warehouse is in good condition and the remaining 37.5% said that the centre warehouse
is at satisfactory level. This implies that the centre warehouse has no all required
facilities of warehouse but is in a good condition which is supported by 60% of the
respondents by that facts need to be maintained and more effort turned to it by the
centre management minor improvement so as to be well equipped with all facilities of
the warehouse which leads to efficiency and effective stores operations as far as
materials management is concerned. Table 4.19 shows status of the centre warehouse.

64
Table 4.19 Response on Status of the Centre Warehouse
Status Frequency Percent
Valid Strongly well equipped 1 2.5
Good condition 24 60.0
Satisfactory 15 37.5
Total 40 100.0
Source: Field data, 2013
4.14 Stock Control Method Used by the Centre
Table 4.20 indicates the respondents (staff) response on the status of the stock control
method used by the centre on the study revealed that 20% said that the stocks are
controlled manually using stores ledger and the remaining 80% said that inventories are
controlled electronically using available inventory system known as Microsoft Navision
which is implemented by the centre. This signifies that the institution is well equipped
with stock control technology which ensures effective and efficiency management over
inventories as is obvious understood that inventories carry 20% to 60% of total assets
on the balance sheet so much control has to be exercised on inventories to ensure centre
operations. By that fact the institution is performing well on inventory control as the
system adopted is accuracy and reliable.Table 4.20 shows stock control method used by
the centre.

65
Table 4.20 Response on Stock Control Method Used by the Centre
Method Frequency Percent
Valid Manually using stores ledger 8 20.0
Electronically using available
inventory system 32 80.0
Total 40 100.0
Source: Field data, 2013
4.15 Centre Stock Taking Policy
Table 4.21 indicates the respondents (staff) response on the centre stock taking policy
on the study revealed that 97.5% said that the centre stock taking exercise is conducted
annually (once per year) and the remaining 2.5% said that the centre stock taking
exercise is conducted quarterly meaning that it is done every after three month period.
This implies that the centre has a policy of conducting stock taking annually for the
purpose of making physical verification of assets owned by the centre with their
respective values. Stock taking exercise is very important to be undertaken with diligent
care as determines how wealthy the organization is. The study revealed that the centre is
doing well because adheres all procedures and instructions set for conducting stock
taking exercise. Table 4.21 shows response on centre stock taking policy.

66
Table 4.21 Response on Centre Stock Taking Policy
Period Frequency Percent
Valid Annually 39 97.5
Quarterly 1 2.5
Total 40 100.0
Source: Field data, 2013
4.16 Centre Salary Scale Payment Satisfaction
Table 4.22 indicates the respondents (staff) response on the centre salary scale
payments on the study revealed that 20% said that they are satisfied with the salaries
they are paid by the authority and the remaining 80% said that they are not satisfied
with the salaries they are paid in the sense arguing that do not reflect the real life
situations in so doing they decide to practice entrepreneurial activities so as to bridge
the gap and cope with the current situation of life. This implies that some training
activities are not performed properly by the staff because they are busy with their
personal issues claiming that they are not satisfied by the salary structure they are paid
which actually is a threat to the organization or institution so this salary problem has to
be reconciled properly for staff betterment. Table 4.22 shows response on centre salary
scale payment satisfaction.
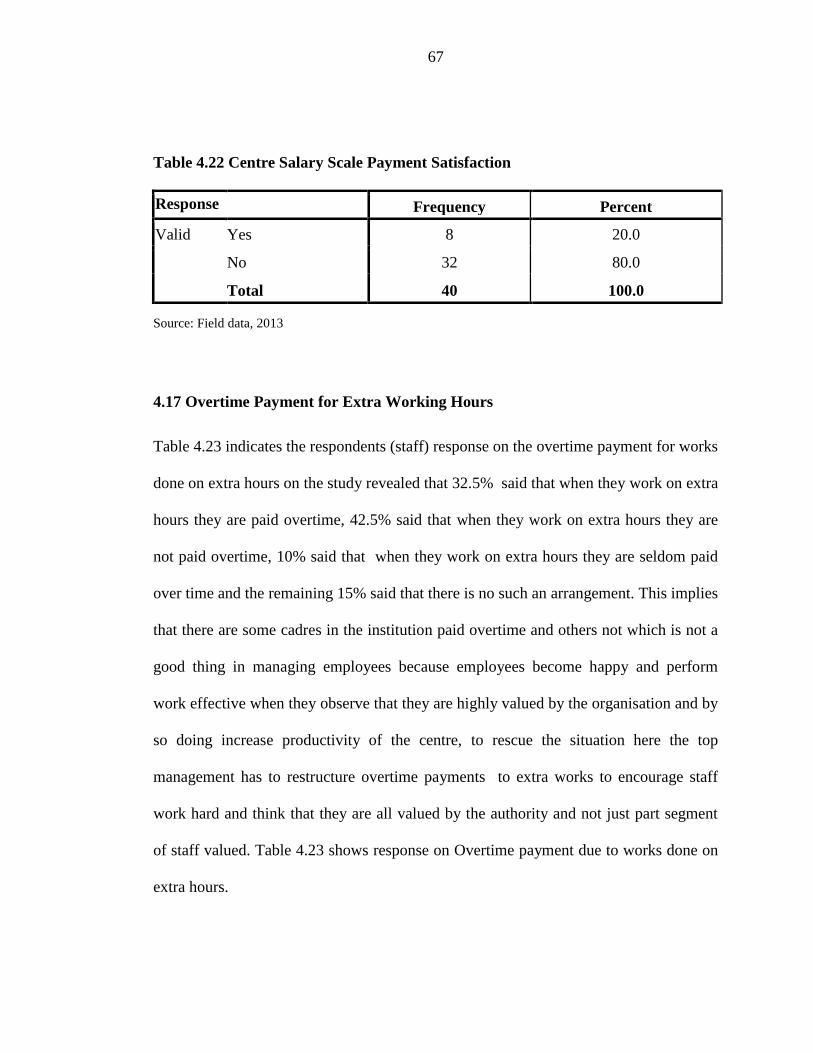
67
Table 4.22 Centre Salary Scale Payment Satisfaction
Response Frequency Percent
Valid Yes 8 20.0
No 32 80.0
Total 40 100.0
Source: Field data, 2013
4.17 Overtime Payment for Extra Working Hours
Table 4.23 indicates the respondents (staff) response on the overtime payment for works
done on extra hours on the study revealed that 32.5% said that when they work on extra
hours they are paid overtime, 42.5% said that when they work on extra hours they are
not paid overtime, 10% said that when they work on extra hours they are seldom paid
over time and the remaining 15% said that there is no such an arrangement. This implies
that there are some cadres in the institution paid overtime and others not which is not a
good thing in managing employees because employees become happy and perform
work effective when they observe that they are highly valued by the organisation and by
so doing increase productivity of the centre, to rescue the situation here the top
management has to restructure overtime payments to extra works to encourage staff
work hard and think that they are all valued by the authority and not just part segment
of staff valued. Table 4.23 shows response on Overtime payment due to works done on
extra hours.

68
Table 4.23 Overtime Payment for Extra Working Hours
Response Frequency Percent
Valid Paid 13 32.5
Not paid 17 42.5
Seldom paid 4 10.0
No such arrangement 6 15.0
Total 40 100.0
Source: Field data, 2013
4.18 Annual Procurement Plan Adherence
Table 4.24 indicates the respondents (staff) response on the annual procurement plan
adherence on the study revealed that ten 10% said that the centre annual procurement
plan is strongly adhered, 85% said that the centre annual procurement plan is
satisfactory adhered and the remaining 5% said that the centre annual procurement plan
is somehow adhered. Since respondents who said that the centre annual procurement
plan is satisfactory adhered amounted 85% it implies that the centre is doing good in
making sure that everything needed to be procured in the year is incorporated in the
annual procurement plan and proposing the appropriate method of procurement to fit as
per the budget estimate. By so doing the centre discourages any purchases out of the
annual procurement plan which results to efficiency and effective operation. Table 4.24
shows response on adherence of annual procurement plan.
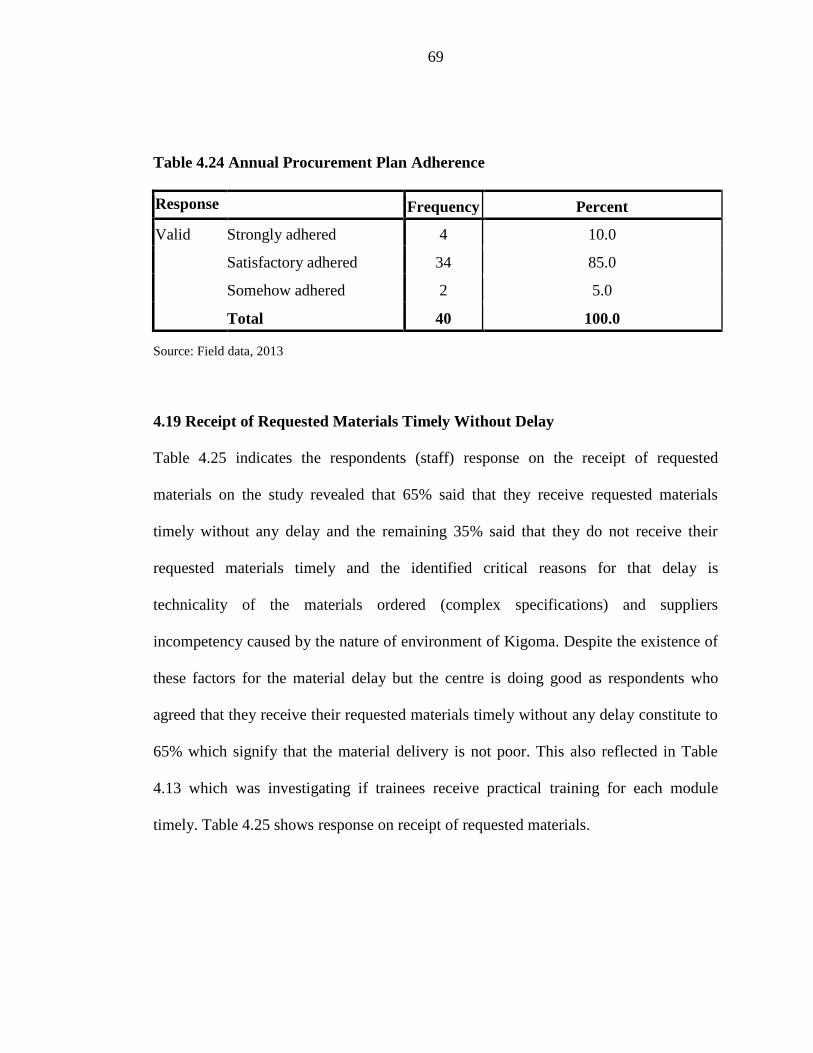
69
Table 4.24 Annual Procurement Plan Adherence
Response Frequency Percent
Valid Strongly adhered 4 10.0
Satisfactory adhered 34 85.0
Somehow adhered 2 5.0
Total 40 100.0
Source: Field data, 2013
4.19 Receipt of Requested Materials Timely Without Delay
Table 4.25 indicates the respondents (staff) response on the receipt of requested
materials on the study revealed that 65% said that they receive requested materials
timely without any delay and the remaining 35% said that they do not receive their
requested materials timely and the identified critical reasons for that delay is
technicality of the materials ordered (complex specifications) and suppliers
incompetency caused by the nature of environment of Kigoma. Despite the existence of
these factors for the material delay but the centre is doing good as respondents who
agreed that they receive their requested materials timely without any delay constitute to
65% which signify that the material delivery is not poor. This also reflected in Table
4.13 which was investigating if trainees receive practical training for each module
timely. Table 4.25 shows response on receipt of requested materials.

70
Table 4.25 Response on Receipt of Requested Materials
Response Frequency Percent
Valid Yes 26 65.0
No 14 35.0
Total 40 100.0
Source: Field data, 2013
4.20 Instructions Prepared for Stocktaking Exercise
The study on the respondents (staff) response on the instructions prepared for
stocktaking exercise revealed that all the respondents agreed that the instructions for the
stocktaking exercise are prepared and given to all members involved in the stocktaking
exercise accompanied by an official letter for that appointment stating the
commencement of the exercise and the sections or areas which the appointee will be
dealing with, one day seminar is conducted by the centre procurement unit on how the
stock taking exercise will be conducted. This implies that the centre is aware about the
significant of the stocktaking exercise because it involves stock count and the physical
verification of all assets of the centre which are reflected in the balance sheet of the
organization, in so doing identifies all the organization assets.
4.21 Codification of Centre Assets for Control Purpose
Table 4.26 indicates the respondents (staff) response on the codification of centre assets
on the study revealed that 82.5% said that all centre assets are coded to ensure control

71
and the remaining 17.5% said that not all centre assets are coded. During the interview
the respondents said that for the newly purchased assets which are not coded by that
time waiting to be coded later are issued to the user department using an official stores
document to signify receipt of that centre property.
This implies that the organization is very careful on its assets as proper control is
exercised over centre assets and by so doing the centre minimizes the risks of loosing of
assets unnecessarily due to improper control.
The study observed that this was successfully done because the organization had
competent and qualified procurement personnel responsible for making sure that
everything is done in accordance with the organization policy and public procurement
act with its corresponding regulations. Table 4.26 shows response on codification of
centre assets.
Table 4.26 Response on Codification of Centre Assets
Response Frequency Percent
Valid Yes 33 82.5
No 7 17.5
Total 40 100.0
Source: Field data, 2013

72
CHAPTER FIVE
5.0 SUMMARY, CONCLUSION AND RECOMMENDATIONS
5.1 Summary of Findings
The study revealed that the centre had a competent and qualified personnel in materials
management which resulted to effective and efficiency performance of the stores
operations and procurement functions as all the procedures of stores and procurement
are adhered. By that fact the centre general performance on meeting trainees’
requirements had been realized to generally good which had been reflected in Table
4.13.
Through the findings the study revealed that Materials requirement Planning (MRP)
technique was used to by the organization to ensure inventory control whereby the
materials or items to support training were ordered quarterly by the vocational
instructors with the purpose of making sure that trainees’ modules are successfully
done, this was reflected in analysis of Table 4.15, in addition to that inventories were
controlled electronically using inventory system called Microsoft Dynamics – Navision,
2009 Version which had been implemented by the centre to ensure accuracy and
reliability of stores operations from the material requisition order stage to issuing stage
of materials, therefore the centre had moved from manual stores operation system to
electronically computerized inventory system.

73
The study also came to realize that First In First Out (FIFO) system was used to
evaluate or price inventories to ensure efficiency lying under the principle that “the
earlier the material received in store the first the material is issued from store” and this
method was appropriate as staff request materials needed for the first module before the
next module to start as planned in the teaching modules.
5.2 Conclusion
Overall the study found that inventory management in parastatal organizations is
improving as the government is struggling to make sure that qualified and competent
professionals are employed and highly paid and who are knowledgeable with the
computerized inventory system with the goal of ensuring high performance as far as
materials management is concerned, unlike previous years where materials management
functions were or stores operations were conducted manually using stores ledger which
was not effective and in addition to that materials management functions were ignored
and operated by unqualified people in materials management on which the government
resulted to operating parastatal organizations at loss with no any return since no proper
control was exercise over materials management section.

74
5.3 Recommendations
Based on the findings of the study, the following recommendations have been put
forward.
1. In order for the centre to enhance and maintain quality training the technical
materials have to order from the suppliers who are potential and have capability
of delivering the requested materials as per specifications and ignoring suppliers
or service providers whose capability and financial position is poor to enable
them deliver the items ordered timely.
2. The government have to improve the salary scale to staff or employees as their
morale of for work had been decreased because they are underpaid, this had
been noted by the study to employees of VETA Kigoma as they were
complaining that salaries do not reflect the real life situation, if this problem will
not be taken seriously by the government professional and experienced
employees shall quit from employment and look for green pastures somewhere
else whose payments to employees are satisfactory.
3. Capacity building to staff with regard to their professionals have to be exercised
as the technology is always changing therefore staff have to cope with the
75
changing environment so as to be up to date resulting to efficiency and effective
performance due to the fact that employees will be well equipped and current.
4. Warehouse has to be well equipped with all necessary facilities and make sure
that the stores officer becomes the custodian of the warehouse because it keeps
most valuable organization property therefore much care have to be exercised to
make sure that warehouse is maintained at the standard level and all
responsibilities and control of stores operations left to only one person to ensure
protection of materials stored.
5. The study revealed that the function of codification of assets of the organization
was centralized to head quarter which is not proper because delays the function
of codification of newly purchased assets resulting to attracting people to steal
as arrangement of people coming from the head quarter with the purpose of
coding items not coded takes time and cost to the organization. Therefore it is
advised to decentralize the function of codification of newly purchased assets
whereby all centres shall make arrangement for codification of uncoded assets
for the purpose of ensuring control of the organization property.

76
5.4 Areas for Further Study
In the view of the study findings with the purpose of establishing dependable, reliable,
valid and comprehensive conclusion on the assessment of inventory management in
parastatal organizations in Tanzania, another study from other environments not
Kigoma (as the study was limited to only Kigoma Region) could be carried out taking a
large representative sample of the entire population that was not covered in this study
for the purpose of validating the findings revealed by this study.
77
REFERENCES
Arnold J. R.T,Chapman S.N and Clive L.M. (2008), Introduction to Materials
Management, 6th
edition, Pearson Prentice Hall.
Compton .H.K. (1985), Supplies and Materials Management, 3rd
edition. Great Britain,
Butler & Tanner Ltd.
Dobler. D. W. and Lee L Jr (1982), Purchasing and Materials Managemet,4th
edition,
Tata McGraw-Hill Publishing Company Ltd.
Drury. C.(1992), Management and Cost Accounting, 5th
edition,. New York. Mac
Donald and Evance Ltd.
Fisher, Buglear. J and Lowry D (2010), Researching and Writing a Dissertation: An
essential guide for business students, 3rd
edition, England, Pearson Education
Limited.
Garrison. R.H and Noreen, E.E (2000), Managerial Accounting, 9th
edition, U.S.A.
Irwin Mc Graw Hil.

78
Gerald O.O and Odhiambo O.M (2012), Assessment of Materials Management in
Kenyan Manufacturing Firms, Journal of Business Studies Quarterly, Vol. 3,
No. 3, PP. 40 – 49.
Jossep. D and Morrison. A. (1994), Storage and Supply of Materials 6th
edition, Great
Britain: Bell and Bain, Glasgow.
Kagashe, G.A and Massawe T. (2012), Medicine Stock out and Inventory Management
Problems in Public Hospitals in Tanzania, International Journal of Pharmacy,
2(2): 252 – 259.
Kazare B (2009), Assessment of the Effectiveness of Inventory Management and
Control Process in Higher Learning Institutions in Tanzania, Saint Augustine
University of Tanzania (SAUT) – Mwanza.
Ketchian C. D. and Pinches E.G (1992) Essentials of Financial Management 4th
Edition, New York. Harper Collins Publishers.
Kothari C.R. (2006), Research Methodology, Methods and Techniques, 4th
edition,
London UK, Mc Graw – Hill Book Co.

79
Kothari C.R. (2004), Research Methodology, Methods and Techniques 2nd
Edition, ,
India, Dharmesh Printers New Delhi
Krishnaswami, O.R (2003), Methodology of Research in Social Sciences,1st edition
India, Himalaya Publishing House.
Lawson, D.J (2012), Populations in Statistical Genetic Modeling and Inference 5th
edition, United Kingdom: Heribonn Institute for Mathematical Research,
University of Bristol.
Lysons. K (2002), Purchasing and supply chain management,2nd
edition, Bail and Bam
ltd, Great Britain.
Lysons K. and Farrington. B (2006), Purchasing & Supply chain Management, 7th
edition,London, Person Education Ltd.
Morgan H.C (2009), Inventory Management Performannceto Alien Technology
Corporation (ATC) in United States of America.
Morrison. A (1977), Storage and Control of Stock, 2nd
edition, London Pittman
Publication Ltd.

80
Mugenda and Mugenda (1999), Research Methods, Quantitative and Qualitative
approaches, Acts Press, Nairobi Kenya.
Musara M. (2012), Impact of just in time (JIT) Inventory System on Efficiency, Quality
and Flexibility among Manufacturing Sector, Small and Medium Enterprise
(SMEs) in South Africa. African Journal of Business Management Vol. 6 (17),
PP. 5786 – 5791.
Mwansele H.A, Sichona F.J and Akarro RJ, (2011), Determination of Inventory Control
Policies at Urafiki Textile Mills Co. Ltd in Dar es salaam, Tanzania, Business
and Economics Journal, Volume 2011: BEJ – 23.
Nachmias . C.F (2003), Research Methodology in the Social Sciences, 5th
edition,
Published in London.
Namagembe Sheila (2010), Information Sharing, Inventory Management and Customer
Satisfaction in the Downstream Chain of Manufacturing Firms In Uganda,
Makerere University – Kampala.
Philibert C. Ndunguru (2007), Lectures on Research Methodology for Social sciences,
1st edition, Mzumbe University, Research Information and Publications
Department.

81
Saleem N.A (1990), Cost Accounting Simplified, N. A Saleem Publishers Nairobi-
Kenya.
Saleem N. A. (1997), Storekeeping and Stock Control Simplified,1st edition, Nairobi:
N.A. Saleem Publishers.
Saunders. M and Frankfort S. (2007), Research Methods for Business Students, 4th
edition, Millan: Rotolito Lombarda S. P.A
Sekaran .U. (2003), Research Methods for Business,4th
edition, Malloy Lithographing
Utouh L. (2012), Annual General Report of the Controller and Auditor General (CAG),
on the Audit of Public Authorities and Other Bodies for the Financial year
2010/2011 in the United Republic of Tanzania.
Weber and Rick (2008), Are you on top of inventory? A Report on Inventory
Management Practices in United Kingdom, British Business and Economics
Journal, Vol. 21, No. 2, PP. 205 – 227.

82
APPENDICES
Appendix I. Questionnaires to the Targeted Respondents (Staff)
General guiding
i. Please put tick ( ) where appropriate
ii. Briefly explain shortly where necessary in space provided there in
iii. Please don’t respond to the question which you are not sure with (leave it)
Questions
1. Gender
a) Male [ ]
b) Female [ ]
2. Age
a) 0 – 17 Years [ ]
b) 18 – 30 Years [ ]
c) 31 – 45 Years [ ]
d) 46 – 60 Years [ ]
e) 61 years and above [ ]
3. Marital status
a) Single [ ]
b) Married [ ]
c) Divorced [ ]
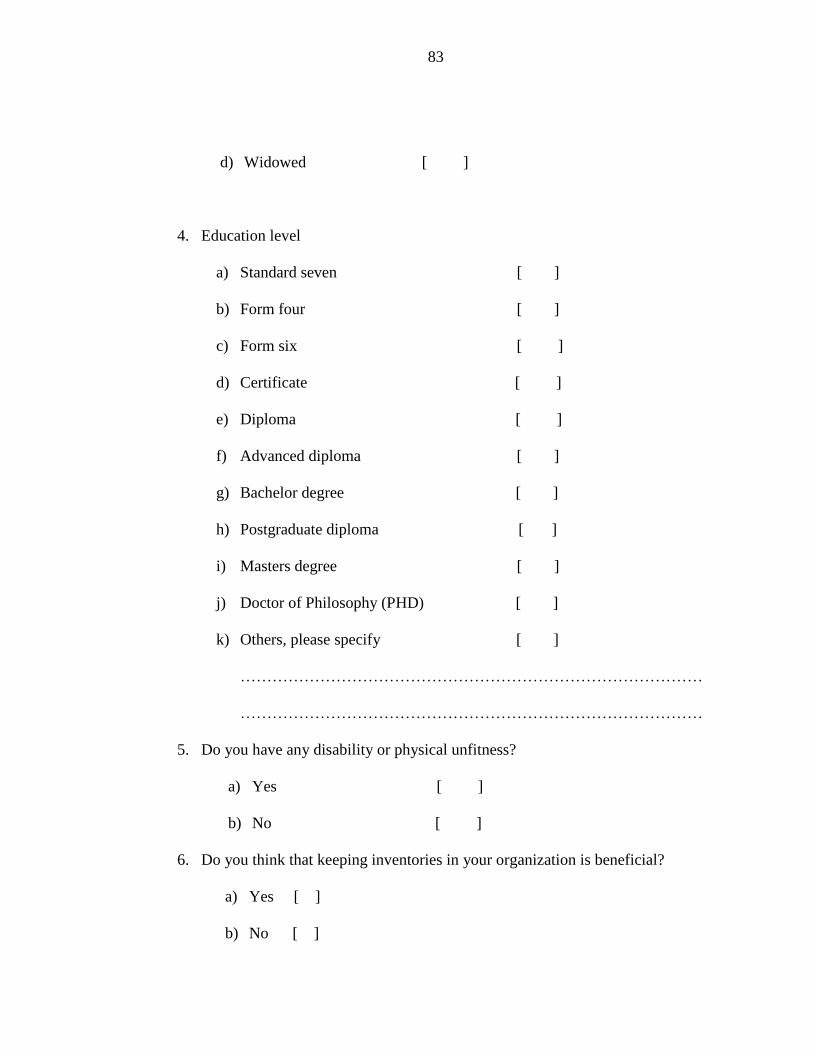
83
d) Widowed [ ]
4. Education level
a) Standard seven [ ]
b) Form four [ ]
c) Form six [ ]
d) Certificate [ ]
e) Diploma [ ]
f) Advanced diploma [ ]
g) Bachelor degree [ ]
h) Postgraduate diploma [ ]
i) Masters degree [ ]
j) Doctor of Philosophy (PHD) [ ]
k) Others, please specify [ ]
……………………………………………………………………………
……………………………………………………………………………
5. Do you have any disability or physical unfitness?
a) Yes [ ]
b) No [ ]
6. Do you think that keeping inventories in your organization is beneficial?
a) Yes [ ]
b) No [ ]

84
7. What method does the organization use to evaluate inventory?
a/ First in first out ( FIFO) [ ]
b/ Last in first out (LIFO) [ ]
c/ Average cost (A C) [ ]
d/ Standard cost (S C) [ ]
e/ Others please specify [ ]
……………………………………………………………………………………
……………………………………………………………………………………
8. Does the organization have a computer system analyst?
a/ Yes [ ]
b/ No [ ]
9. What is the qualification of the stores officer in your organization?
a/ standard seven with experience of Materials Management [ ]
b/ Form four with experience of Materials Management [ ]
c/ Form six with experience of Materials Management [ ]
d/ Certificate in Materials Management [ ]
e/ Diploma in Materials Management [ ]
f/ Advanced Diploma/ Degree in Materials Management [ ]
g/ Certified procurement and supplies professional ( C P S P) [ ]
h/ Advanced Diploma/ Degree in Computer Study [ ]
i/ Any other qualifications (please specify) [ ]

85
……………………………………………………………………………………………
……………………………………………………………………………………………
10. Does inventory mismanagement affect the profitability of your organization?
a/ Yes [ ]
b/ No [ ]
11. If the answer in question ten above is ‘Yes’ affects to what extent?
i/ 0% to 20% [ ]
ii/ 20% to 40% [ ]
iii/ 40% to 60% [ ]
iv/ 60% to 80% [ ]
v/ 80% to 100% [ ]
12. “Professionally, one should not either under or over stock”
What are the methods/ techniques your organization employs to determine the
demand of materials your customers need?
a/ Economic Order Quantity (EOQ) [ ]
b/ Materials Requirements Planning (MRP) [ ]
c/ Just In Time (JIT) Philosophy [ ]
d/ The ABC inventory technique [ ]
e/ Fast moving, Slow moving and Non moving items (FSN) Analysis [ ]
f/ Others please specify [ ]
……………………………………………………………………………………
……………………………………………………………………………………..

86
13. How can you assess inventory management effectiveness in your organization?
a/ 20% effective [ ]
b/ 40% effective [ ]
c/ 60% effective [ ]
d/ 80% effective [ ]
e/ 100% effective [ ]
14. Have you noticed several times that your organization faced a problem of out of
stock?
a/ Yes [ ]
b/ No [ ]
15. If the answer in question fourteen above is ‘Yes’ what is the main cause?
a/ Suppliers’ financial constraints [ ]
b/ Late provision of orders to Suppliers [ ]
c/ Stores officer incompetency [ ]
d/ Technicality of materials ordered [ ]
e/ Late requests placed by the user department [ ]
f/ Others please specify [ ]
……………………………………………..............................................................
……………………………………………………………………………………..

87
16. Do you attend seminars with regard to your professional?
a/ Yes [ ]
b/ No [ ]
17. If the answer in question sixteen above is “Yes” how frequency?
a/ Once per year [ ]
b/ Twice per year [ ]
c/ Quarterly [ ]
d/ Unscheduled [ ]
e/ Others please specify [ ]
………………………………………………………………………………….
…………………………………………………………………………………...
18. Does your organization have a warehouse?
a/ Yes [ ]
b/ No [ ]
19. If the answer in question eighteen above is “Yes” is it well equipped with all
required facilities of a warehouse?
a/ Strongly well equipped [ ]
b/ Good condition [ ]
c/ Satisfactory [ ]
d/ Bad condition [ ]

88
20. How do you control stocks in your organisation?
a/ Manually using stores ledger [ ]
b/ Electronically using available inventory system [ ]
21. Do you conduct stock taking in your organization?
a/ Yes [ ]
b/ No [ ]
22. If the answer in question twenty one above is “Yes” how frequency is done?
a/ Annually [ ]
b/ Semi annually [ ]
c/ Quarterly [ ]
d/ Unscheduled [ ]
e/ Others please specify [ ]
…………………………………………………………………………………
…………………………………………………………………………………...
23. Are you satisfied with your salary scale you are paid?
a/ Yes [ ]
b/ No [ ]
24. When you work on extra hours are you paid overtime?
a/ Paid [ ]
b/ Not paid [ ]
c/ Seldom paid [ ]
d/ No such arrangement [ ]

89
25. Does your organization prepare annual procurement plan?
a/ Yes [ ]
b/ No [ ]
26. If the answer in question twenty five above is “Yes” how effective is it adhered?
a/ Strongly adhered [ ]
b/ Satisfactory adhered [ ]
c/ Somehow adhered [ ]
d/ Not adhered at all [ ]
27. Do you receive your requested materials timely without any delay?
a/ Yes [ ]
b/ No [ ]
28. If the answer in question twenty seven above is “Yes” .Do you receive all materials
as you requested without any deficit?
a/ Yes [ ]
b/ No [ ]
29. Is there any instruction prepared and send to all staff involved in the stock taking
exercise for information before?
a/ Yes [ ]
b/ No [ ]
30. Are the organization’s assets all coded to ensure control?
a/ Yes [ ]
b/ No [ ]

90
31. If the answer in question thirty above is “No”, what way used to ensure control to
some organisation properties not coded?
a/ Kept in store waiting for codification [ ]
b/ Given to user department with official stores document [ ]
c/ Given to user department without official stores document [ ]
d/ Others please specify [ ]
…………………………………………………………………………………
…………………………………………………………………………………
32. What is your position in the organization?
a) Principal [ ]
b) Human resource manager [ ]
c) Registrar [ ]
d) Bursar [ ]
e) Accountant [ ]
f) Stores officer [ ]
g) Supplies assistant [ ]
h) Vocational instructor [ ]
i) Librarian [ ]
j) Assistant librarian [ ]
k) Kitchen supervisor [ ]
l) Cook [ ]
m) Personal secretary [ ]

91
n) Receptionist [ ]
o) Registry assistant [ ]
p) Office attendant [ ]
q) Others please specify [ ]
…………………………………………………………………………………...
…………………………………………………………………………………...
Thank you for your Cooperation

92
Appendix II. Questionnaires to the Targeted Respondents (Vocational Trainees)
General guiding
i. Please put tick ( ) where appropriate
ii. Briefly explain shortly where necessary in space provided there in
iii. Please don’t respond to the question which you are not sure with (leave it)
Questions
1. Gender
a) Male [ ]
b) Female [ ]
2. Age
a) 0 – 17 Years [ ]
b) 18 – 25 Years [ ]
c) 26 – 30 Years [ ]
d) 31 years and above [ ]
3. Marital status
a) Single [ ]
b) Married [ ]
c) Divorced [ ]
d) Widowed [ ]

93
4. Education level
a) Standard seven [ ]
b) Form four [ ]
c) Form six [ ]
d) Certificate [ ]
e) Diploma [ ]
f) Others, please specify [ ]
……………………………………………………………………………
……………………………………………………………………………
5. Do you have any disability or physical unfitness?
a) Yes [ ]
b) No [ ]
6. Are you getting practical training of each module timely?
a) Yes [ ]
b) No [ ]
7. If the answer in question six above is “Yes” to what extent satisfied?
a) 20% [ ]
b) 40% [ ]
c) 60% [ ]
d) 80% [ ]
e) Above 80% [ ]

94
8. Are you satisfied with the delivery schedule of your daily meals at the centre
with regard to trainees’ meal timetable?
a) Yes [ ]
b) No [ ]
9. If the answer in question eight above is ‘Yes” to what extent satisfied?
a) 20% [ ]
b) 40% [ ]
c) 60% [ ]
d) 80% [ ]
e) Above 80% [ ]
10. How can you comment on the general performance of the centre towards
meeting your requirements as eligible trainee?
a) Very good [ ]
b) Good [ ]
c) Satisfactory [ ]
d) Worse [ ]
11. Are your practical and theoretical training materials delivered timely for each
quarter?
a) Yes [ ]
b) No [ ]

95
12. If the answer in question eleven above is “No” what are the reasons for that late
delivery?
a) The stores officer is not competent [ ]
b) Top management problem in giving decisions [ ]
c) Poor capabilities of suppliers for the materials [ ]
d) Others, please specify [ ]
………………………………………………………………………………
……………………………………………………………………………….
Thank you for your Cooperation