Embed Size (px)
Citation preview

Assessing the impact of lava flows during the 2020
unrest of the Svartsengi volcanic system on the
Reykjanes peninsula, Iceland
Simone Tarquini§a
, Massimiliano Favallia , Melissa A Pfeffer
b, Mattia de’ Michieli Vitturi
a , Sara Barsotti
b, Gro B. M.
Pedersenc, Bergrún A Óladóttir
b,c, Esther H Jensen
b
aIstituto Nazionale di Geofisica e Vulcanologia
via Cesare Battisti 53, I - 56125 Pisa, Italy bIcelandic Meteorological Office
Bústaðavegur 7 - 9, 105 Reykjavík, Iceland cNordic Volcanological Center, Institute of Earth Sciences, University of Iceland
Askja - Sturlugata 7, 102 Reykjavík § [email protected]
Abstract—In January 2020, inflation up to 5 cm was detected in the
volcanic system of Svartsengi, Reykjanes peninsula (Iceland). The
inflation was probably linked to the movement of magma which
was estimated to be at a depth of 3-5 km. Shortly after the detection
of the inflation, the Scientific Advisory Board responsible for
tackling the unrest deemed possible that the unrest could evolve
into an effusive eruption. We used both the MrLavaLoba and the
DOWNFLOW codes to simulate the area potentially inundated by
lava flows in order to assess the hazard posed in case of an effusive
eruption. The DOWNFLOW code was used to create a suite of
10,000 simulations which were used to derive maps of the lava flow
hazards. These maps can be dynamically updated to account for
ongoing modifications suggested by the geophysical signals of the
monitoring system. The MrLavaLoba code, in turn, was tuned
based on the historical lava flows in the area, so it would be ready
to simulate potential lava flow fields if an eruption began. At the
time of writing (April 2020), the area appears have experienced two
intrusions and is currently in a waning phase. However, the lava
flow modeling carried out constitutes an example of rapid response
during an ongoing crisis. The post-processing of DOWNFLOW
simulations can also allow for preliminary estimations of the time
left before lava flow inundates given targets, providing effective
support for stakeholders.
I. INTRODUCTION
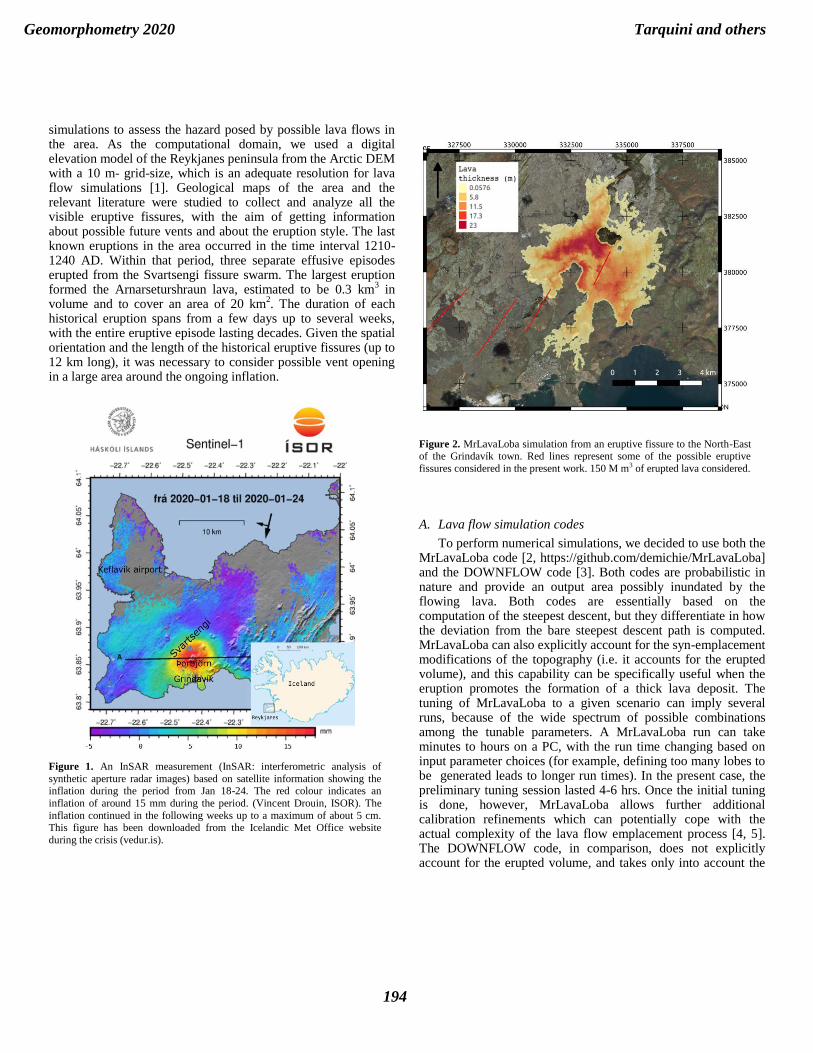
In mid-January 2020, inflation was detected in the south of the Reykjanes peninsula (Iceland), within the Svartsengi volcanic system. The inflation was accompanied by an earthquake swarm, and was centered close to Thorbjörn, a hill immediately to the North of the town of Grindavík (Fig. 1).
The collected geophysical data suggested that a magma body was moving upwards through the feeding system of Svartsengi, modeled to be at a depth of 3-5 km. The maximum deformation observed from the GPS stations was about 8 cm (as of end-April 2020; vedur.is). If the magma reached the surface, lava flows would have threatened inhabited areas (~ 3500 people), important facilities (e.g. a geothermal powerplant) and the main road linking the capital Reykjavík to the international airport. It was important to assess the possible impact from lava flows using models.
The present contribution summarizes how we used numerical lava flow modeling to prepare for a potential eruption and enhance mitigation planning during the crisis. At the time of writing the present abstract (end-April 2020), a second period of inflation has stalled and it appears that the unrest of Svartsengi is in a potentially temporary waning phase. However, we deemed useful to document the work carried out during the initial intrusion, which could be of use in the future.
II. METHODS
Throughout the duration of the crisis, all the data collected by the monitoring system and the results provided by data post-processing were discussed during Scientific Advisory Board meetings. The board was formed by a team of scientists from Icelandic institutions and local stakeholders. The reports of the board meetings were rapidly published online (Icelandic Met Office website, vedur.is), to provide timely communication to the whole community. We carried out a series of lava flow numerical
Simone Tarquini, Massimiliano Favalli, Melissa Pfeffer, Mattia De' Michieli Vitturi, Sara Barsotti, Gro Pedersen, Bergrn Arna ôladttir and Esther Hjensen (2020):
in Massimiliano Alvioli, Ivan Marchesini, Laura Melelli & Peter Guth, eds., Proceedings of the Geomorphometry 2020 Conference, doi:10.30437/GEOMORPHOMETRY2020_52.
Assessing the impact of lava flows during the unrest of Svartsengi volcano in the Reykjanes peninsula, Iceland:
193
simulations to assess the hazard posed by possible lava flows in the area. As the computational domain, we used a digital elevation model of the Reykjanes peninsula from the Arctic DEM with a 10 m- grid-size, which is an adequate resolution for lava flow simulations [1]. Geological maps of the area and the relevant literature were studied to collect and analyze all the visible eruptive fissures, with the aim of getting information about possible future vents and about the eruption style. The last known eruptions in the area occurred in the time interval 1210-1240 AD. Within that period, three separate effusive episodes erupted from the Svartsengi fissure swarm. The largest eruption formed the Arnarseturshraun lava, estimated to be 0.3 km
3 in
volume and to cover an area of 20 km2. The duration of each
historical eruption spans from a few days up to several weeks, with the entire eruptive episode lasting decades. Given the spatial orientation and the length of the historical eruptive fissures (up to 12 km long), it was necessary to consider possible vent opening in a large area around the ongoing inflation.
Figure 1. An InSAR measurement (InSAR: interferometric analysis of
synthetic aperture radar images) based on satellite information showing the inflation during the period from Jan 18-24. The red colour indicates an
inflation of around 15 mm during the period. (Vincent Drouin, ISOR). The
inflation continued in the following weeks up to a maximum of about 5 cm. This figure has been downloaded from the Icelandic Met Office website
during the crisis (vedur.is).
Figure 2. MrLavaLoba simulation from an eruptive fissure to the North-East of the Grindavík town. Red lines represent some of the possible eruptive
fissures considered in the present work. 150 M m3 of erupted lava considered.
A. Lava flow simulation codes
To perform numerical simulations, we decided to use both the MrLavaLoba code [2, https://github.com/demichie/MrLavaLoba] and the DOWNFLOW code [3]. Both codes are probabilistic in nature and provide an output area possibly inundated by the flowing lava. Both codes are essentially based on the computation of the steepest descent, but they differentiate in how the deviation from the bare steepest descent path is computed. MrLavaLoba can also explicitly account for the syn-emplacement modifications of the topography (i.e. it accounts for the erupted volume), and this capability can be specifically useful when the eruption promotes the formation of a thick lava deposit. The tuning of MrLavaLoba to a given scenario can imply several runs, because of the wide spectrum of possible combinations among the tunable parameters. A MrLavaLoba run can take minutes to hours on a PC, with the run time changing based on input parameter choices (for example, defining too many lobes to be generated leads to longer run times). In the present case, the preliminary tuning session lasted 4-6 hrs. Once the initial tuning is done, however, MrLavaLoba allows further additional calibration refinements which can potentially cope with the actual complexity of the lava flow emplacement process [4, 5]. The DOWNFLOW code, in comparison, does not explicitly account for the erupted volume, and takes only into account the
Geomorphometry 2020 Tarquini and others
194

pre-emplacement topography (details can be found in the Ref. [3]). In spite of its simplicity, DOWNFLOW has been demonstrated to be effective during several volcanic crises [1]. Additional characteristics of the DOWNFLOW code are that it is easy to tune (essentially only one parameter), and it is very fast (a few seconds for each run), making this code ideal for the creation of a large suite of simulations [6, 7].
III. RESULTS AND CONCLUSIONS
The two codes were used in parallel. MrLavaLoba was tuned
to a spectrum of possible eruptive scenarios, in order to
reproduce a range of lava deposit thicknesses and lava flow
lengths based on given erupted volumes (e.g. Figure 2). We
considered that, if an effusive event actually occurred, this code
could have allowed to account for the specific emplacement
style (e.g. a given thickening) by iteratively modifying the
tuning of the code parameters on the basis of the available data
from the monitoring system [8].
Figure 3. Lava flow hazard map of the area potentially affected by an eruption linked to the inflation in the Reykjanes peninsula. The map was derived by post-
processing DOWNFLOW simulations triggered from a grid of about 10,000 computational vents (bounding box of the grid in green).
DOWNFLOW, instead, was used to derive a large database
of lava flow simulations triggered from a regular 100 m-spaced
grid of about 10,000 vents covering a wide area around
Thorbjörn. This database was obtained in about 10 h by using a
cluster for parallel computing hosted at the National Institute of
Geophysics and Volcanology in Pisa (Italy). The database of
simulations was then post-processed considering a given
probability density function (pdf) of future vent opening
(quantifying the opening probability of each vent), and a given
probability of reaching a given maximum flow length.
We initially set a uniform pdf of vent opening, so that the
opening probability is equal at each potential vent. The latter
settings allow to highlight the effect of other factors than vent
position, such as topography and flow length, in the resulting
flow propagation. Based on the available geological mapping of
this area, we set a uniform probability of reaching a flow length
between 0 and 7 km, obtaining the hazard map in Figure 3. This
map shows a maximum probability of lava flow inundation
extending north from the south coast halfway through the green
square (Figure 3).
Figure 4. Map showing, at each point, the remaining down-flow distance to
reach the town of Grindavík (enclosed by the white polygon). Down-flow distances are measured along the lava flow path computed by the simulations.
We derived additional hazard maps by considering different
pdf of vent opening since the geophysical data (e.g. inflation,
earthquakes) suggested that the probability of opening may be
higher in certain areas than elsewhere. As an example, in the
early days of the crisis, it was suggested that a more likely site
of eruption was along the westernmost of the four possible
Geomorphometry 2020 Tarquini and others
195

eruptive fissures illustrated in Figure 2 (red segments), thus we
created a pdf of vent opening assigning a uniform probability to
all the computational vents laying within 100 m from the fissure,
and 0 to all the other vents. From an operational viewpoint, we
remind that a post-processing iteration of the described database
takes about half an hour.
A different type of post processing of the same database of
DOWNFLOW simulations allows to “invert” the map to
visualize specific characteristics of the simulated lava flows with
respect to given “targets”, i.e. a given asset vulnerable to the
potential lava flow [6, 9]. Figure 4 shows a map in which each
point is attributed with the minimum distance a lava flow
venting at (or reaching) that point has still to travel, along the
simulation path, to reach the town of Grindavík (with a
population of 3,300). During the present crisis, it was possible
that an effusive vent could open quite close to the town. For this
reason, stakeholders where especially interested in the
assessment of the “time left” for possible evacuation. We note
that the map of Figure 4 constitutes a significant step forward in
that direction, because upon estimation of a range of possible
average lava flow front advancement velocity, the down-flow
distance can be easily translated into an estimation of the time
left for evacuation. On the basis of a preliminary literature
review [10 - 12] we believe a reasonable range of lava flow front
advancement velocity is between 5 and 150 mh-1
, and we
propose alternative color legends for Figure 4 providing the time
left for minimum and maximum advancement velocities (Figure
5).
Figure 5. Alternative color legends for the map in Figure 4. From the left: The default legend showing the down-flow distance; the “time left” legend assuming
a lava flow front advancement velocity (v) of 5 mh-1; and the “time left” legend
assuming a lava flow front advancement velocity of 150 mh-1.
All the maps created during this work (including those
showed in the present abstract) have been presented and
discussed during Scientific Advisory Board meetings, and
constituted effective support to the decision makers.
REFERENCES
[1] Tarquini, S., M. Favalli, 2016. “Simulating the area covered by lava flows using the DOWNFLOW code”. Geological Society, London, Special Publications, 426(1), 293-312.
[2] De’ Michieli Vitturi, M., & Tarquini, S. (2018). MrLavaLoba: A new probabilistic model for the simulation of lava flows as a settling process. Journal of Volcanology and Geothermal Research, 349, 323-334.
[3] Favalli, M., Pareschi, M. T., Neri, A., & Isola, I. (2005). Forecasting lava flow paths by a stochastic approach. Geophysical Research Letters, 32 (3).
[4] Tarquini, S., de' Michieli Vitturi, M., Jensen, E. H., Pedersen, G. B., Barsotti, S., Coppola, D., & Pfeffer, M. A. (2018). Modeling lava flow propagation over a flat landscape by using MrLavaLoba: the case of the 2014–2015 eruption at Holuhraun, Iceland. Ann. Geophys. 62:228.
[5] Applegarth LJ, Pinkerton H, James MR, Calvari S (2010b) Morphological complexities and hazards during the emplacement of channel-fed `a`ā lava flow fields: a study of the 2001 lower flow field on Etna. Bull Volcanol 72:641–656.
[6] Favalli, M., Tarquini, S., Fornaciai, A., & Boschi, E. (2009). A new approach to risk assessment of lava flow at Mount Etna. Geology, 37(12), 1111-1114.
[7] Favalli, M., Tarquini, S., Papale, P., Fornaciai, A., & Boschi, E. (2012). Lava flow hazard and risk at Mt. Cameroon volcano. Bulletin of V4olcanology, 74(2), 423-439.
[8] Harris, A. J. L., Carn, S., Dehn, J., Del Negro, C., Guđmundsson, M. T., Cordonnier, B., ... & De Groeve, T. (2016). Conclusion: recommendations and findings of the RED SEED working group. Geological Society, London, Special Publications, 426(1), 567-648.
[9] Richter, N., Favalli, M., de Zeeuw-van Dalfsen, E., Fornaciai, A., Fernandes, R. M. D. S., Pérez, N. M., ... & Walter, T. R. (2016). Lava flow hazard at Fogo Volcano, Cabo Verde, before and after the 2014-2015 eruption. Natural Hazards & Earth System Sciences, 16(8).
[10] Pedersen, G. B. M., Höskuldsson, A., Dürig, T., Thordarson, T., Jonsdottir, I., Riishuus, M. S., ... & Sigmundsson, F. (2017). Lava field evolution and emplacement dynamics of the 2014–2015 basaltic fissure eruption at Holuhraun, Iceland. Journal of Volcanology and Geothermal Research, 340, 155-169.
[11] Sigurðsson O (1974). Jarðeldar á Heimaey 1973. Týli 4, 5–26.
[12] Einarsson Þ (1974). Gosið á Heimaey í máli og myndum. Heimskringla. Reykjavík
Geomorphometry 2020 Tarquini and others
196