Embed Size (px)
Citation preview
KSCE Journal of Civil Engineering (2013) 17(2):377-385DOI 10.1007/s12205-013-1930-4
− 377 −
www.springer.com/12205
Highway Engineering
Assessment of Expressway Construction Using Quality Performance Index (QPI)
Youn-Jae Lee*, Suk-Keun Rhee**, Dong-Soo Kim***, and Cheong Lee****
Received February 2, 2012/Revised June 5, 2012/Accepted July 1, 2012
···································································································································································································································
Abstract
Since quality control in expressway construction is generally performed by monitoring during the process of construction, it isdifficult to perform a quantitative assessment of the level of quality in reality. In order to solve this problem and improve the level ofquality, the Korea Expressway Corporation (KEC) has developed a Quality Performance Index (QPI) that quantitatively assessesthe level of quality of the final product, and has practically applied it to a site. By verifying the reliability of the assessment resultsproduced by the QPI, this study provides a basis for the implementation of QPI in assessment of overall quality in construction.Keywords: Quality Performance Index (QPI), quality assessment, durability assessment, functionality index
···································································································································································································································
1. Introduction
Since the opening of the Kyungbu Expressway in 1969, itscontinually increased expansion, extended period of public service,and the rapid increase in the appearance of defects caused by thedeterioration of the level of quality control, have led to a gradualincrease in maintenance costs.
Given this situation that highlights the importance of a qualitycontrol environment, we see that objective, performance-basedquality control for construction structures, rather than monitoring-based quality control during the process of construction, is needed,in order to ensure high quality expressway construction.
In order to establish a performance measurement system for theexpressway, Korea Expressway Corporation (KEC) has analyzedthe function and the rate of defect occurrence for road structures,including bridge structures and pavement materials. Based on theresults of this analysis, KEC has developed a Quality PerformanceIndex (QPI) in accordance with the relevant specifications, and hasapplied it to the site. QPI is an objective and quantitative perfor-mance measurement index for construction structures. The objectiveof this study is to verify that it can produce objective qualityassessment standards by analyzing the reliability of the results ob-tained using QPI, and to establish a practical quality control systemby quantifying the level of quality of expressway construction.
2. Quality Assessment Items
2.1 OutlineAssessment items were divided into two categories - dura-
bility and functionality - with consideration of different construc-tion site conditions and work processes. Then, detailed assessmentcriteria for each item were established so that quantitative assess-ment could be performed by investigating the types of construc-tion work that have a high possibility of defects occurring intheir structural performance. This was achieved through ananalysis of the status of defects, and the combined opinions ofroad construction experts, with regard to three target routes,namely the Namhae line, the Jungbu inland line, and the Daegu-Pohang line.
In order to confirm the possibility of applying the selected as-sessment items and detailed assessment criteria to a constructionsite, a pilot assessment was performed for the construction sitesof 6 lines, namely the Daejeon-Dangjin, Mokpo-Gwangyang,Yeoju-Yangpyeong, Eumseong-Chungju, and Jeonju-Namwon,Namwon-Kwangyang expressways, and the appropriateness ofthe assessment index for each item, along with the effectivenessof the assessment grades, were confirmed.
2.2 Selection of Quality Assessment Items and Measure-ment Method
First, the importance of construction structures and the fre-quency of the occurrence of defects for the selected items ofquality assessment were prioritized. Then, by targeting differenttypes of construction work that allow for objective and quantitativeperformance measurement, these items were selected after as-sessing and analyzing their appropriateness through a question-naire survey, consultations, and site assessment. Table 1 is asummary of the major assessment items selected in this study.
*Managing Director, Korea Expressway Corporation, Seongnam 461-703, Korea (E-mail: [email protected])**Member, Professor, Civil Engineering Department, College of Engineering, Kyung Hee University, Yongin 446-701, Korea (E-mail: [email protected])
***Member, Director, Korea Expressway Corporation, Seongnam 461-703, Korea (Corresponding Author, E-mail: [email protected])****Director, Korea Expressway Corporation, Seongnam 461-703, Korea (E-mail: [email protected])
Youn-Jae Lee, Suk-Keun Rhee, Dong-Soo Kim, and Cheong Lee
− 378 − KSCE Journal of Civil Engineering
2.3 Detailed Assessment CriteriaAs a detailed assessment standard for the assessment items, a
weight was determined for each assessment item and was thenapplied to the final assessment formula by performing defectoccurrence analysis, targeting 3 expressways that are currently inpublic service, namely the Namhae line, the Jungbu inland line,and the Daegu-Pohang line. A questionnaire survey was alsoconducted with road construction experts.
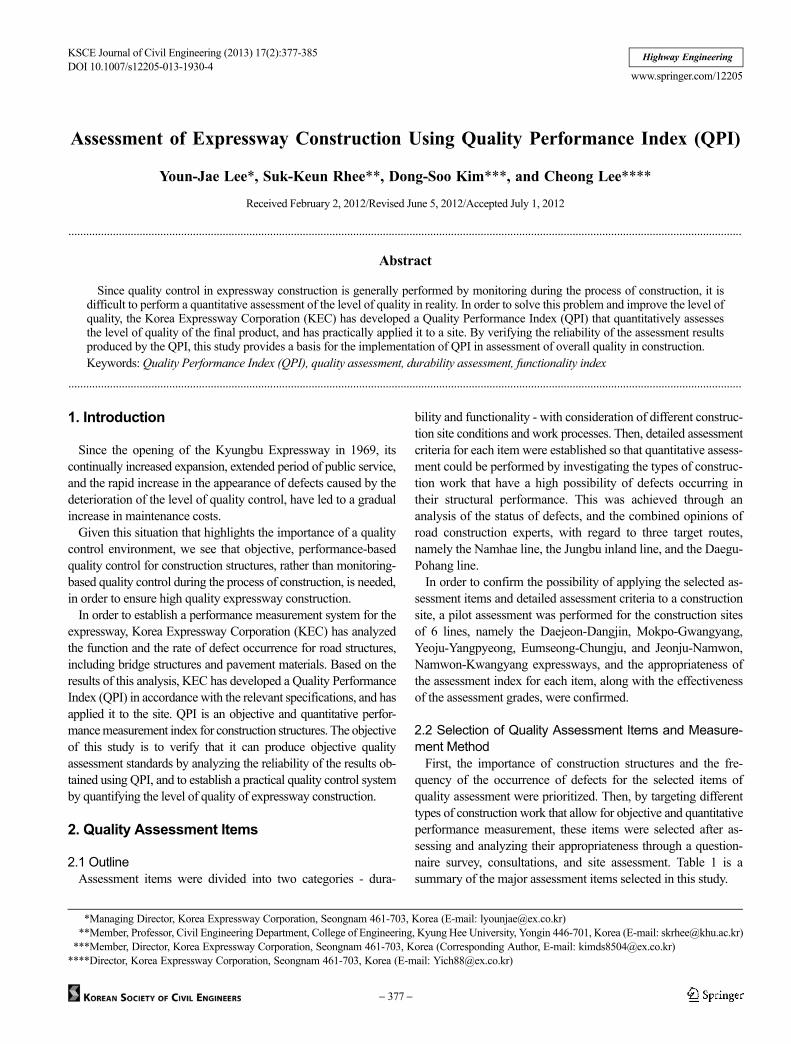
Figure 1 presents a graphic analysis of the rate of defect occur-rence for the different types of work involved in construction.
During the stage of road construction, the defect rate forstructural work (25%) and pavement work (22%) are shown tobe quite high. In addition, while the defect occurrence rate forcivil, tunnel, and drainage works was shown to be approximately15%, that of auxiliary work was approximately 6%.
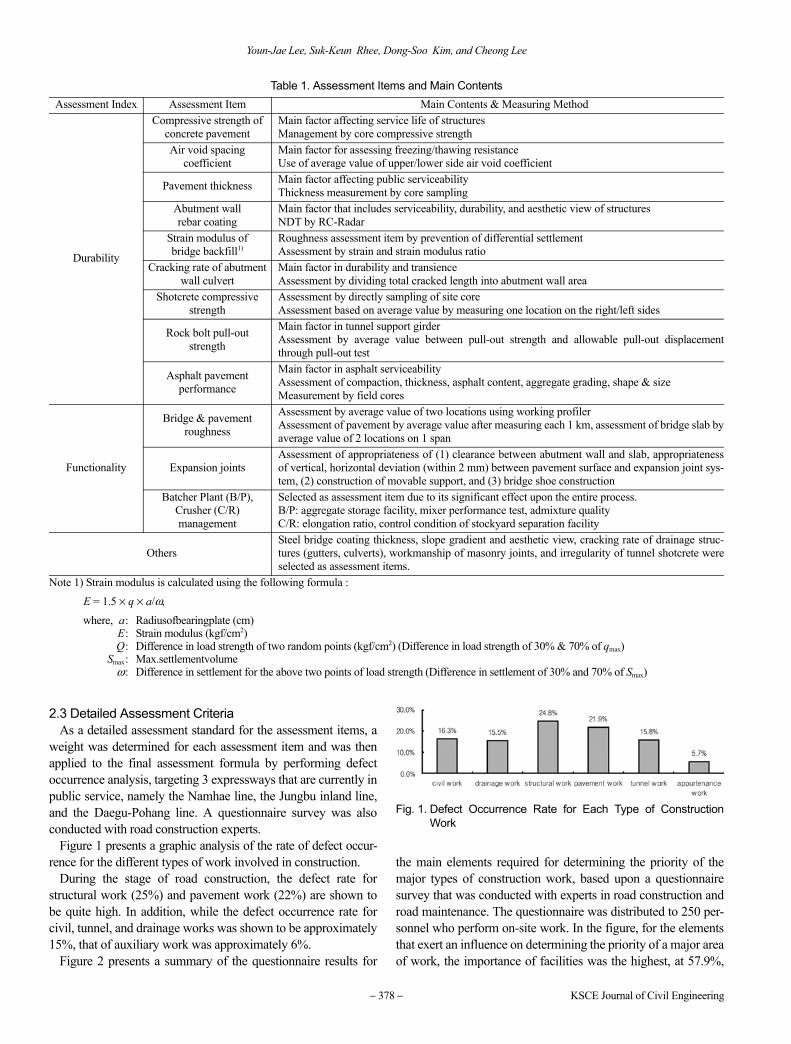
Figure 2 presents a summary of the questionnaire results for
the main elements required for determining the priority of themajor types of construction work, based upon a questionnairesurvey that was conducted with experts in road construction androad maintenance. The questionnaire was distributed to 250 per-sonnel who perform on-site work. In the figure, for the elementsthat exert an influence on determining the priority of a major areaof work, the importance of facilities was the highest, at 57.9%,
Table 1. Assessment Items and Main ContentsAssessment Index Assessment Item Main Contents & Measuring Method
Durability
Compressive strength ofconcrete pavement
Main factor affecting service life of structuresManagement by core compressive strength
Air void spacingcoefficient
Main factor for assessing freezing/thawing resistanceUse of average value of upper/lower side air void coefficient
Pavement thickness Main factor affecting public serviceabilityThickness measurement by core sampling
Abutment wallrebar coating
Main factor that includes serviceability, durability, and aesthetic view of structuresNDT by RC-Radar
Strain modulus ofbridge backfill1)
Roughness assessment item by prevention of differential settlementAssessment by strain and strain modulus ratio
Cracking rate of abutmentwall culvert
Main factor in durability and transienceAssessment by dividing total cracked length into abutment wall area
Shotcrete compressivestrength
Assessment by directly sampling of site coreAssessment based on average value by measuring one location on the right/left sides
Rock bolt pull-outstrength
Main factor in tunnel support girderAssessment by average value between pull-out strength and allowable pull-out displacementthrough pull-out test
Asphalt pavementperformance
Main factor in asphalt serviceabilityAssessment of compaction, thickness, asphalt content, aggregate grading, shape & sizeMeasurement by field cores
Functionality
Bridge & pavementroughness
Assessment by average value of two locations using working profilerAssessment of pavement by average value after measuring each 1 km, assessment of bridge slab byaverage value of 2 locations on 1 span
Expansion jointsAssessment of appropriateness of (1) clearance between abutment wall and slab, appropriatenessof vertical, horizontal deviation (within 2 mm) between pavement surface and expansion joint sys-tem, (2) construction of movable support, and (3) bridge shoe construction
Batcher Plant (B/P),Crusher (C/R)management
Selected as assessment item due to its significant effect upon the entire process.B/P: aggregate storage facility, mixer performance test, admixture qualityC/R: elongation ratio, control condition of stockyard separation facility
OthersSteel bridge coating thickness, slope gradient and aesthetic view, cracking rate of drainage struc-tures (gutters, culverts), workmanship of masonry joints, and irregularity of tunnel shotcrete wereselected as assessment items.
Note 1) Strain modulus is calculated using the following formula :
E = 1.5 × q × a/ω,
where, a: Radiusofbearingplate (cm)E: Strain modulus (kgf/cm2)Q: Difference in load strength of two random points (kgf/cm2) (Difference in load strength of 30% & 70% of qmax)
Smax: Max.settlementvolumeω: Difference in settlement for the above two points of load strength (Difference in settlement of 30% and 70% of Smax)
Fig. 1. Defect Occurrence Rate for Each Type of ConstructionWork
Assessment of Expressway Construction Using Quality Performance Index (QPI)
Vol. 17, No. 2 / March 2013 − 379 −
followed by the frequency of defect occurrence, at 31.7%. Thelowest priority was given to the construction cost, at 2.4%. We cantherefore conclude that it is important to perform constructionwith the utmost integrity, so that no defects will appear at thetime of quality control, and so facilities can be well maintainedon a sustained basis, as well (Lee and Jang, 2011).
2.4 QPI Formula and Results of Pilot Assessment2.4.1 Formula for Quality Performance Index
Depending upon the detailed assessment items and the as-sessment method, weights were determined, as shown on Fig. 2,which reflect the defect elements for the different areas of con-struction work analyzed in Figs. 1 and 2. These were based uponsite features and the opinions of road construction experts.
In addition, the assessment results were quantified by setting agrade for each assessment result. The grade criteria for eachassessment item are as follows.
• The compressive strength of concrete pavement was assessedby measuring the mean compressive strength (based on aspecial specification for the expressway being studied: 6-4,concrete quality inspection) after sampling the core (Φ150mm × 300 mm) in two places. 27 MPa, which is a value of4.5 MPa (based upon the pavement flexural strength) wasmultiplied by 6, utilizing the ratio between concrete compres-sive strength and flexural strength (1/6-1/8); this was esti-mated as the 5th grade. 36 MPa, a value multiplied by 8, wasas estimated as the 1st grade, the 2nd, 3rd, and 4th grades wereestimated by distributing the 1st grade and 5th grade equally,and a value below 27 MPa was estimated as the 6th grade.
• The air void spacing coefficient of concrete was measuredusing the mean value of the air-void spacing coefficient ofthe upper side and lower side by sampling the core (Φ 100mm) in two places. As an assessment grade, 0.2 mm (testbasis: ASTM, air-void spacing coefficient), which is the ACIrecommended standard, was estimated as the 5th grade,which is the lowest basis. Based upon the results of the testassessment for each grade, leaving a deviation of 0.02 mm,the 1st grade was estimated as 0.12 mm, the 2nd grade as 0.14mm, the 3rd grade as 0.16 mm, and the 4th grade as 0.18 mm,and the case of over 0.2 mm was estimated as the 6th grade(Kim and Oh, 2008).
• The thickness estimation grade for concrete pavement wasassessed by sampling the core (Φ 150 mm × 300 mm) in twoplaces, and as an assessment grade, in order to facilitate pre-cise construction on-site and ensure the thickness of each
pavement layer, a site core thickness within the specificationstandard (expressway specialized specification standard : 10-1 cement concrete pavement, design thickness within -5%)was estimated as the 5th grade, a thickness within -4% as the4th grade, within-3% as the 3rd grade, and within-2% as the2nd grade. That which exceeded the design pavement thick-ness and was within +3% was estimated as the 1st grade, andthat below-5% as the 6th grade (KEC, 2009).
• The shape and size of the aggregate used for asphalt pave-ment was assessed by measuring the standard density (ex-pressway special spec. 8-3) of the site mixture after samplingthe core (Φ 150 mm) in 2 places. For the assessment grade, adegree of compaction over 96%, based on the spec., was esti-mated as the 5th grade, that over 99% of the standard densityas the 1st grade, the 2nd, 3rd, and 4th grades were estimated bydistributing them equally at a 1.5 grade, and a value below96% was estimated as the 6th grade (KEC, 2009).
• The rebar coating thickness of the abutment wall was mea-sured using a rebar detector (RC-Radar) at three locations.The minimum value among those measured was assessed,and the assessment grade was estimated to prevent thediminishment of the durability of the structure and deteriora-tion of the rebar adhesion due to deficient coating, by facili-tating precise construction. In the case that the coating wasgreater than the design coating thickness or within 110%, itwas estimated as the 1st grade, if it was over 97% as the 2nd
grade, over 94% as the 3rd grade, over 90% as the 4th grade,over 85% or exceeding 110% as the 5th grade, and any otherthickness not mentioned above was estimated as the 6th grade(Son and Kim, 1999).
• Grade estimation for the strain modulus of abutment backfillwas measured by averaging the plate bearing test value fromtwo places. As regards the assessment grades, using the spec-ification standard of Germany as a target value, a strain coef-ficient (Eavg) within 2.2 and a modulus of the subgrade reactionK value over 30 were estimated as the 5th grade. Based upon apilot assessment, in the case that the overall surveyed valuessatisfy the modulus of the subgrade reaction and the straincoefficient is below 50% of the target value, this was estimatedas the 1st grade, a value below Eavg 60% as the 2nd grade, belowEavg 70% as the 3rd grade, below Eavg 80%, that below targetvalue as 5th grade, and values for Eavg not mentioned abovewere estimated as the 6th grade (Oh and Suh, 2007).
• The crack ratio of the abutment wall and culvert was esti-mated by dividing the sum of the crack lengths of the sur-veyed section area after taking samples from 5 places in theabutment wall and 10 places in the culvert (5 from places ofpassage, 5 from places with water channels). The crack ratiowas assessed by the mean value of each place. As regards theassessment grade, based on the results of pilot site assess-ment, a mean crack ratio within 0.10 was estimated as the 1st
grade, within 0.30 as the 2nd grade, within 0.60 as the 3rd
grade, within 1.00 as the 4rd grade, within 1.50 as the 5th
grade, and any crack ratio not mentioned above was esti-
Fig. 2. Results of Questionnaire Survey by Road ConstructionExperts
Youn-Jae Lee, Suk-Keun Rhee, Dong-Soo Kim, and Cheong Lee
− 380 − KSCE Journal of Civil Engineering
mated as the 6th grade.• The roughness of the pavement and bridge was measured by
measuring the IRI at 2 places on the main line pavement. Asregards the assessment grade based on the specification, inthe case that the roughness is 1.2 m/km as a result of measur-ing the main line pavement performed by civil engineering,this was estimated as the 1st grade, if it was within 1.3 m/km asthe 2nd grade, within 1.4 m/km as the 3rd grade, within 1.5 m/km as the 4th grade, within 1.6 m/km as the 5th grade, and incases in which none of the above are applicable, the case wasestimated as the 6th grade. In the case of the bridge, a measure-ment result that was within 30% was estimated as the 1st grade,within 60% as the 2nd grade, within 80% as the 3rd grade,within 90% as the 4th grade, within the desired value as the 5th
grade, and if the above cases did not apply to the result, it wasestimated as the 6th grade.
• Regarding the expansion joint of a bridge, by measuring theexpansion joint and the condition of the bridge support at 3places on a bridge, we assessed the clearance appropriate-ness, step height of the expansion joint, eccentricity of thebridge support, and appropriateness of the construction of thebridge support. We did this using a checklist based on theexpressway's standard specification for the conditions of slabclearance control, using the mean value of the 3 selected places.
• The compressive strength of shotcrete was assessed by mea-suring the mean compressive strength (expressway standardspec. 7-5) by sampling the core (Φ 100 mm) in 2 places. Asregards the assessment grade, the design-based strength wasestimated as the 1st grade, the spec.-based strength (85% of thedesign-based strength, 17 MPa) was estimated as the 5th grade,the 2nd, 3rd, and 4th grades were estimated by distributing a 1.5grade equally, and a strength below 17 MPa was estimated asthe 6th grade.In addition, as regards the rockbolt pull-out strength, themean value of the pullout test value (strain) for 2 locations onthe site was applied. As regards the assessment grade at thetime of the pullout test, a mean displacement over 80% ofpull-out within the controlled test value was estimated as thelowest base (5th grade), and as a result of testing based on thetest assessment, pull-out within 80% of the controlled testvalue was estimated as 1st grade, within 85% as the 2nd grade,within 90% as the 3rd grade, within 95% as the 4th grade, anda result that exceeded the test value was estimated as the 6th
grade (KEC, 2009).• The site B/P and C/R condition were assessed using a check-
list, and in the case that C/R assessment became impossible,it was applied by converting it to a B/P assessment score.
Finally, the QPI could be estimated using a weighted averagevalue comprised of the scores for each item obtained by siteassessment.
QPI = Qc + Qd + Qb + Qp + Qt + Qf (1)
The estimation of the index for each type of construction work
was calculated as follows:
• Civil index (Qc)
(2)• Drainage Work Index (Qd)
(3)• Bridge Work Index (Qb)
(4)• Pavement Work Index (Qp)
(5)• Tunnel Work Index (Qt)
(6)• Auxiliary Work Index (Qf)
Ad × BR, CR Control (7)
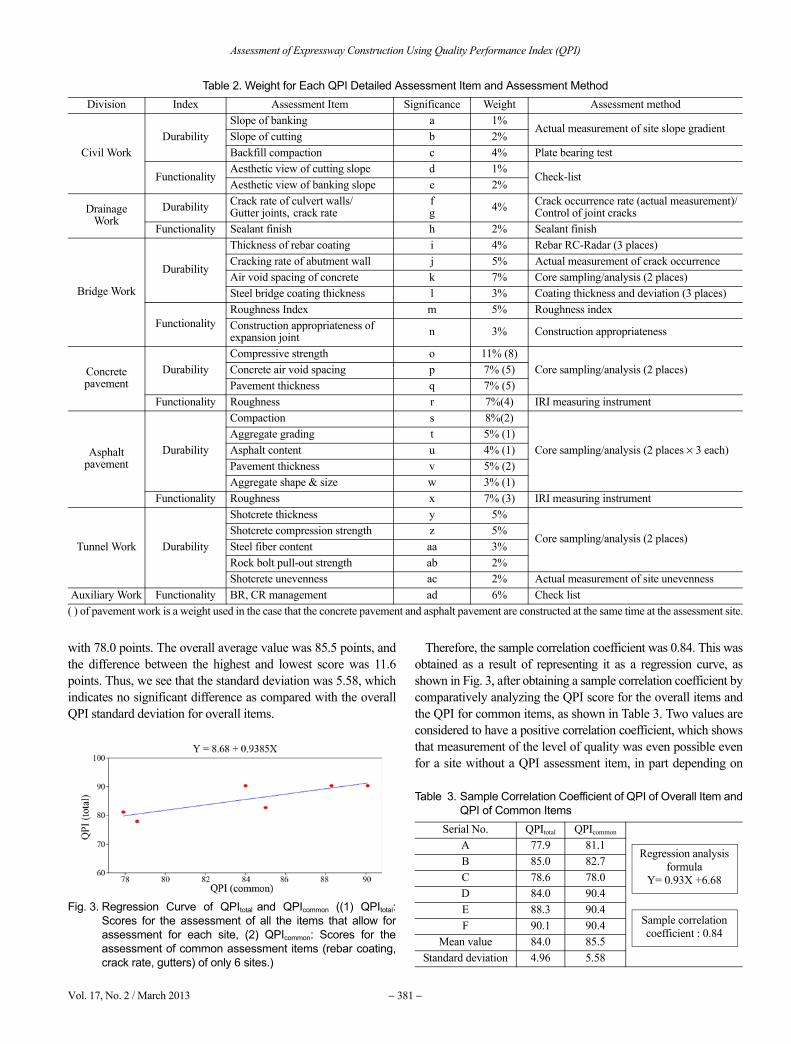
The applied weights, with consideration of the QPI detailedassessment item and site features, are shown in the followingTable 2.
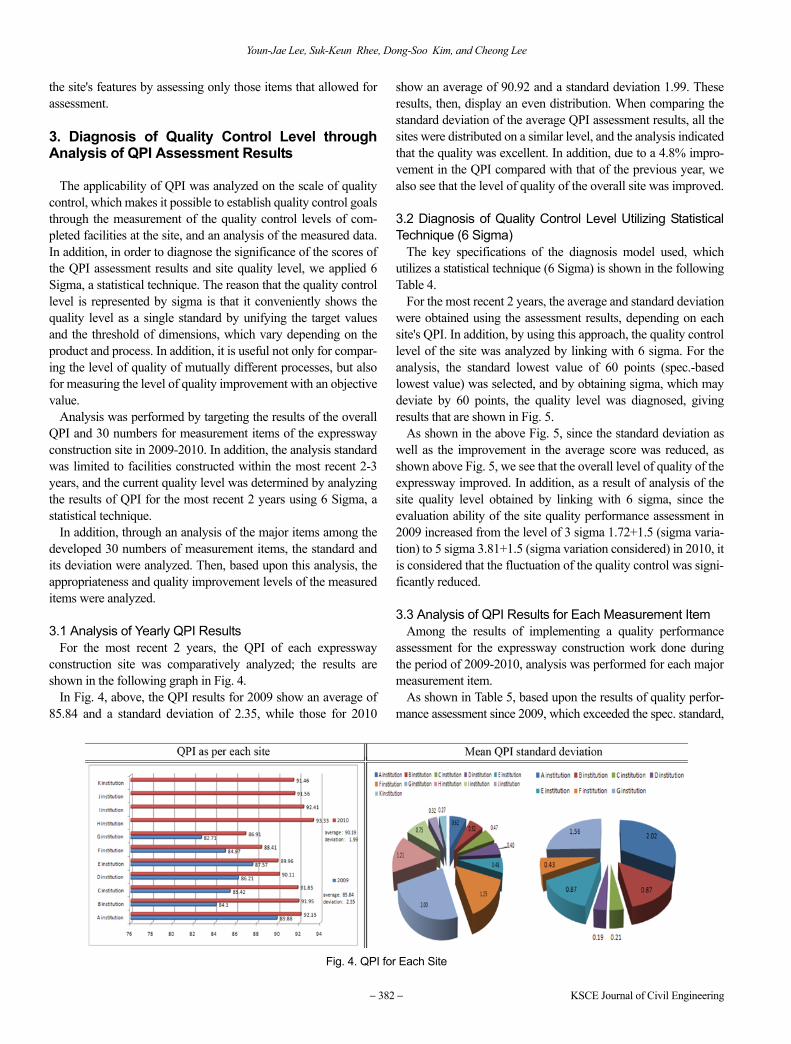
2.4.2 Value Results of Site Pilot AssessmentIn the results for the overall QPI items for each site for the 6
expressway lines, site F presented the highest score, with 90.1points, and site A was the lowest, with 77.9 points. The overallaverage value was 84 points, and the difference between thehighest score and lowest score was 12.2 points, with a standarddeviation of 4.96. Depending on the site, some sites may onlyhave permitted partial QPI assessment of an item. In this case,the assessment result was estimated by assessing the items thatallowed for assessment, and converting the sum of the weight ofthese assessed items to 100 points.
In order to compare the QPI for each common item, a commonQPI item was assessed for each site, and sites D, E, F presentedthe highest scores, with 90.4 points, and site C the lowest score,
a × slope of banking + b × slope of cutting + c × stain ratioof backfill + d × aesthetic view of cutting slope + e × aestheticview of banking slope
a + b + c + d + e
f × culvert wall crack ratio + g × gutter joint + h × sealant finishedf + g + h
i × reinforced cover thickness + j × crack ratio + k × air-voidspacing + l × steel bridge coating thickness + m × roughness+ n × expansion joint
I + j + k + l + m + n
o × compressive strength + p × air-void spacing + q × pavementthickness + r × concrete pavement roughness + s × compactiondegree × t × aggregate grading + u × asphalt content + v × pave-ment thickness + w × aggregate shape and size + x × asphaltpavement roughness
o + p + q + r + s + t + u + v + w + x
y × shotcrete thickness + z × shotcrete compressive strength +aa × steel fiber + ab × rock bolt pull-out + ac × shotcrete irregul-arities
y + z + aa + ab +ac
Assessment of Expressway Construction Using Quality Performance Index (QPI)
Vol. 17, No. 2 / March 2013 − 381 −
with 78.0 points. The overall average value was 85.5 points, andthe difference between the highest and lowest score was 11.6points. Thus, we see that the standard deviation was 5.58, whichindicates no significant difference as compared with the overallQPI standard deviation for overall items.
Therefore, the sample correlation coefficient was 0.84. This wasobtained as a result of representing it as a regression curve, asshown in Fig. 3, after obtaining a sample correlation coefficient bycomparatively analyzing the QPI score for the overall items andthe QPI for common items, as shown in Table 3. Two values areconsidered to have a positive correlation coefficient, which showsthat measurement of the level of quality was even possible evenfor a site without a QPI assessment item, in part depending on
Table 2. Weight for Each QPI Detailed Assessment Item and Assessment MethodDivision Index Assessment Item Significance Weight Assessment method
Civil WorkDurability
Slope of banking a 1%Actual measurement of site slope gradient
Slope of cutting b 2%Backfill compaction c 4% Plate bearing test
FunctionalityAesthetic view of cutting slope d 1%
Check-listAesthetic view of banking slope e 2%
DrainageWork
Durability Crack rate of culvert walls/Gutter joints, crack rate
fg 4% Crack occurrence rate (actual measurement)/
Control of joint cracksFunctionality Sealant finish h 2% Sealant finish
Bridge Work
Durability
Thickness of rebar coating i 4% Rebar RC-Radar (3 places)Cracking rate of abutment wall j 5% Actual measurement of crack occurrenceAir void spacing of concrete k 7% Core sampling/analysis (2 places)Steel bridge coating thickness l 3% Coating thickness and deviation (3 places)
FunctionalityRoughness Index m 5% Roughness indexConstruction appropriateness ofexpansion joint n 3% Construction appropriateness
Concretepavement
DurabilityCompressive strength o 11% (8)
Core sampling/analysis (2 places)Concrete air void spacing p 7% (5)Pavement thickness q 7% (5)
Functionality Roughness r 7%(4) IRI measuring instrument
Asphaltpavement
Durability
Compaction s 8%(2)
Core sampling/analysis (2 places × 3 each)Aggregate grading t 5% (1)Asphalt content u 4% (1)Pavement thickness v 5% (2)Aggregate shape & size w 3% (1)
Functionality Roughness x 7% (3) IRI measuring instrument
Tunnel Work Durability
Shotcrete thickness y 5%
Core sampling/analysis (2 places)Shotcrete compression strength z 5%Steel fiber content aa 3%Rock bolt pull-out strength ab 2%Shotcrete unevenness ac 2% Actual measurement of site unevenness
Auxiliary Work Functionality BR, CR management ad 6% Check list( ) of pavement work is a weight used in the case that the concrete pavement and asphalt pavement are constructed at the same time at the assessment site.
Fig. 3. Regression Curve of QPItotal and QPIcommon ((1) QPItotal:Scores for the assessment of all the items that allow forassessment for each site, (2) QPIcommon: Scores for theassessment of common assessment items (rebar coating,crack rate, gutters) of only 6 sites.)
Table 3. Sample Correlation Coefficient of QPI of Overall Item andQPI of Common Items
Serial No. QPItotal QPIcommon
Regression analysisformula
Y= 0.93X +6.68
Sample correlationcoefficient : 0.84
A 77.9 81.1 B 85.0 82.7 C 78.6 78.0 D 84.0 90.4 E 88.3 90.4 F 90.1 90.4
Mean value 84.0 85.5 Standard deviation 4.96 5.58
Youn-Jae Lee, Suk-Keun Rhee, Dong-Soo Kim, and Cheong Lee
− 382 − KSCE Journal of Civil Engineering
the site's features by assessing only those items that allowed forassessment.
3. Diagnosis of Quality Control Level throughAnalysis of QPI Assessment Results
The applicability of QPI was analyzed on the scale of qualitycontrol, which makes it possible to establish quality control goalsthrough the measurement of the quality control levels of com-pleted facilities at the site, and an analysis of the measured data.In addition, in order to diagnose the significance of the scores ofthe QPI assessment results and site quality level, we applied 6Sigma, a statistical technique. The reason that the quality controllevel is represented by sigma is that it conveniently shows thequality level as a single standard by unifying the target valuesand the threshold of dimensions, which vary depending on theproduct and process. In addition, it is useful not only for compar-ing the level of quality of mutually different processes, but alsofor measuring the level of quality improvement with an objectivevalue.
Analysis was performed by targeting the results of the overallQPI and 30 numbers for measurement items of the expresswayconstruction site in 2009-2010. In addition, the analysis standardwas limited to facilities constructed within the most recent 2-3years, and the current quality level was determined by analyzingthe results of QPI for the most recent 2 years using 6 Sigma, astatistical technique.
In addition, through an analysis of the major items among thedeveloped 30 numbers of measurement items, the standard andits deviation were analyzed. Then, based upon this analysis, theappropriateness and quality improvement levels of the measureditems were analyzed.
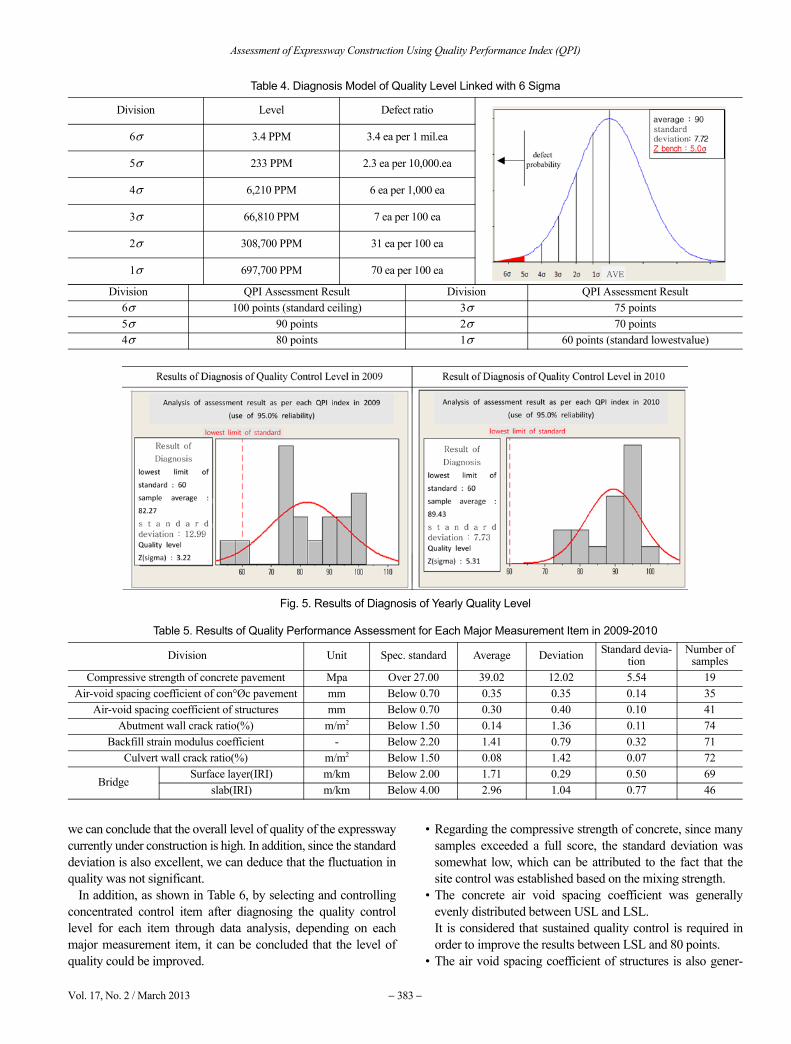
3.1 Analysis of Yearly QPI ResultsFor the most recent 2 years, the QPI of each expressway
construction site was comparatively analyzed; the results areshown in the following graph in Fig. 4.
In Fig. 4, above, the QPI results for 2009 show an average of85.84 and a standard deviation of 2.35, while those for 2010
show an average of 90.92 and a standard deviation 1.99. Theseresults, then, display an even distribution. When comparing thestandard deviation of the average QPI assessment results, all thesites were distributed on a similar level, and the analysis indicatedthat the quality was excellent. In addition, due to a 4.8% impro-vement in the QPI compared with that of the previous year, wealso see that the level of quality of the overall site was improved.
3.2 Diagnosis of Quality Control Level Utilizing StatisticalTechnique (6 Sigma)
The key specifications of the diagnosis model used, whichutilizes a statistical technique (6 Sigma) is shown in the followingTable 4.
For the most recent 2 years, the average and standard deviationwere obtained using the assessment results, depending on eachsite's QPI. In addition, by using this approach, the quality controllevel of the site was analyzed by linking with 6 sigma. For theanalysis, the standard lowest value of 60 points (spec.-basedlowest value) was selected, and by obtaining sigma, which maydeviate by 60 points, the quality level was diagnosed, givingresults that are shown in Fig. 5.
As shown in the above Fig. 5, since the standard deviation aswell as the improvement in the average score was reduced, asshown above Fig. 5, we see that the overall level of quality of theexpressway improved. In addition, as a result of analysis of thesite quality level obtained by linking with 6 sigma, since theevaluation ability of the site quality performance assessment in2009 increased from the level of 3 sigma 1.72+1.5 (sigma varia-tion) to 5 sigma 3.81+1.5 (sigma variation considered) in 2010, itis considered that the fluctuation of the quality control was signi-ficantly reduced.
3.3 Analysis of QPI Results for Each Measurement ItemAmong the results of implementing a quality performance
assessment for the expressway construction work done duringthe period of 2009-2010, analysis was performed for each majormeasurement item.
As shown in Table 5, based upon the results of quality perfor-mance assessment since 2009, which exceeded the spec. standard,
Fig. 4. QPI for Each Site
Assessment of Expressway Construction Using Quality Performance Index (QPI)
Vol. 17, No. 2 / March 2013 − 383 −
we can conclude that the overall level of quality of the expresswaycurrently under construction is high. In addition, since the standarddeviation is also excellent, we can deduce that the fluctuation inquality was not significant.
In addition, as shown in Table 6, by selecting and controllingconcentrated control item after diagnosing the quality controllevel for each item through data analysis, depending on eachmajor measurement item, it can be concluded that the level ofquality could be improved.
• Regarding the compressive strength of concrete, since manysamples exceeded a full score, the standard deviation wassomewhat low, which can be attributed to the fact that thesite control was established based on the mixing strength.
• The concrete air void spacing coefficient was generallyevenly distributed between USL and LSL.It is considered that sustained quality control is required inorder to improve the results between LSL and 80 points.
• The air void spacing coefficient of structures is also gener-
Table 4. Diagnosis Model of Quality Level Linked with 6 Sigma
Division Level Defect ratio
6σ 3.4 PPM 3.4 ea per 1 mil.ea
5σ 233 PPM 2.3 ea per 10,000.ea
4σ 6,210 PPM 6 ea per 1,000 ea
3σ 66,810 PPM 7 ea per 100 ea
2σ 308,700 PPM 31 ea per 100 ea
1σ 697,700 PPM 70 ea per 100 ea
Division QPI Assessment Result Division QPI Assessment Result6σ 100 points (standard ceiling) 3σ 75 points5σ 90 points 2σ 70 points4σ 80 points 1σ 60 points (standard lowestvalue)
Fig. 5. Results of Diagnosis of Yearly Quality Level
Table 5. Results of Quality Performance Assessment for Each Major Measurement Item in 2009-2010
Division Unit Spec. standard Average Deviation Standard devia-tion
Number of samples
Compressive strength of concrete pavement Mpa Over 27.00 39.02 12.02 5.54 19Air-void spacing coefficient of con°Øc pavement mm Below 0.70 0.35 0.35 0.14 35
Air-void spacing coefficient of structures mm Below 0.70 0.30 0.40 0.10 41Abutment wall crack ratio(%) m/m2 Below 1.50 0.14 1.36 0.11 74
Backfill strain modulus coefficient - Below 2.20 1.41 0.79 0.32 71Culvert wall crack ratio(%) m/m2 Below 1.50 0.08 1.42 0.07 72
BridgeSurface layer(IRI) m/km Below 2.00 1.71 0.29 0.50 69
slab(IRI) m/km Below 4.00 2.96 1.04 0.77 46
Youn-Jae Lee, Suk-Keun Rhee, Dong-Soo Kim, and Cheong Lee
− 384 − KSCE Journal of Civil Engineering
ally distributed evenly between USL, at 80 points. and sincethe assessment results focus on the average level, an excel-lent level of quality is shown.
• Since the results of crack assessment of the abutment wall/culvert crack rate is near to that of USL, a very high qualitylevel is shown.
Table 6. Analysis Results of Quality Performance Assessment for Each Measurement Item <Compressive Strength of Con’c Pavement> <Air-void Spacing Coefficient of Con’c Pavement>
<Air-void spacing Coefficient of Structures> <Abutment Wall Crack Ratio>
<Backfill Strain Modulus Coefficient> <Culvert Wall Crack Ratio>
<Bridge Surface Layer IRI> <Bridge Slab IRI>
Assessment of Expressway Construction Using Quality Performance Index (QPI)
Vol. 17, No. 2 / March 2013 − 385 −
• Since the backfill strain modulus is generally extensively dis-tributed between USL and 80 points, and the IRI of bridgesurface layer and slab is generally evenly distributed betweenUSL and LSL, it is considered that sustained control isrequired in order to improve the results between LSL and 80points.
4. Conclusions
As a result of correlation analysis of the resulting valuesdepending on each site and on common items on each site, asobtained through pilot assessment of 6 sites in 2008, the samplecorrelation coefficient was found to be as high as 0.84. Therefore,since the effect of the number of assessment items influencingthe results was not significant, it was considered that this valuecould be applied to all the sites, regardless of the number ofassessment items.
In addition, as a result of analyzing the applicability of QPIitems through assessment of expressway construction sites in2009-2010, the crack ratio (visual inspection) being performedby NDT among its assessment items minimized the variations,depending upon the assessment personnel, by estimating thecrack length (total cracks, including hair cracks) as comparedwith the area. In addition, since the instrument used for measure-ment (RC-Radar) measurement of the rebar coating thicknessestimated the commonly applicable standard, as compared withthe actual coring results, the reliability and objectivity of assess-ment were confirmed. In the case of the degree of backfill strainmodulus, since even the effect of long-term settlement wasidentifiable, as well as that of short-term settlement, this degreewas considered to be a more precise assessment item than theplate bearing test.
The assessment items of the QPI obtained through this diver-sified quality test and verification are considered to be a universal
(general) assessment standard that sufficiently considers a varietyof site features.
By comparatively analyzing the QPI data, quantitative qualitycontrol performed for each site becomes convenient, and by con-trolling the QPI through its program, a less-than-reliable processwas able to be extensively controlled by identifying the QPI,depending on each site. In addition, through the objective indexof the QPI, the current quality level could be diagnosed and posi-tive quality control could be performed for quality improvement.In addition, as a result of the diagnosis of the site's quality controllevel obtained by linking the site's assessment results with 6sigma, the ability to determine the quality control level was foundto be excellent. It was concluded that through quality perfor-mance assessment, quality measurement and the diagnosis of thelevel of quality could become convenient, making it possible toperform objective quality control by establishing and confirminggoals with regard to quality.
References
Kim, J. H. and Oh, G. J. (2008). “A study on rebar detection dependingon various factors by using electronic induction method andelectromagnetic wave rader method.” In Proc. of Korea Institute forStructural Maintenance Inspection, Vol. 12, No. 4, pp. 179-186.
Korea Expressway Corporation (2009). Special specification ofExpressway Project - Civil Part.
Lee, C. and Jang, G. Y. (2011). “A study on quality assessment ofexpressway construction utilizing QPI.” Korean Society of CivilEngineers Monthly Magazine, Sep. 2011, pp. 35-41 (in Korean).
Oh, S. B. and Suh, W. S. (2007). “Estimating technique of straincoefficient by using finite element analysis of repeated load platebearing test.” In Proc. of the Korea Geo-Environmental Society, Vol.8, No. 6, pp. 61-68.
Son, C. S. and Kim, Y. S. (1999). “A study on an effect of air-voidsystem for freezing resistance of fly ash concrete.” The Collection ofConstruction Associate of Korea, Vol. 15, No. 5, pp. 127-134.