Embed Size (px)
Citation preview
AST 4320 – Kosmologi og ekstragalak6sk astronomi
Høsten 2013
Ins6tu= for teore6sk astrofysikk, UiO
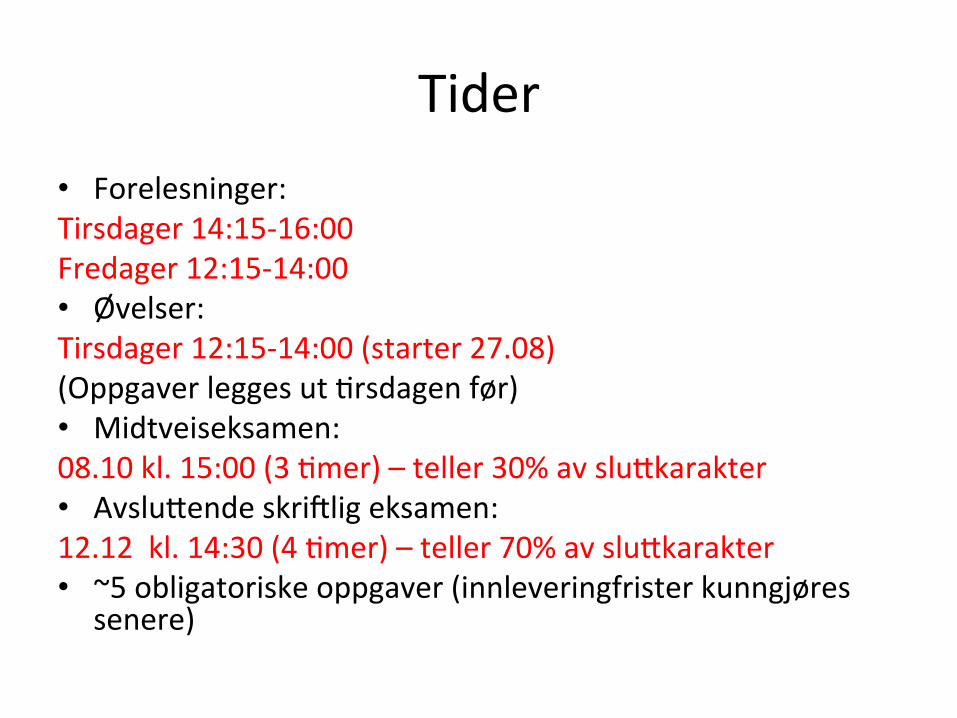
Tider • Forelesninger: Tirsdager 14:15-‐16:00 Fredager 12:15-‐14:00 • Øvelser: Tirsdager 12:15-‐14:00 (starter 27.08) (Oppgaver legges ut 6rsdagen før) • Midtveiseksamen: 08.10 kl. 15:00 (3 6mer) – teller 30% av slu=karakter • Avslu=ende skriSlig eksamen: 12.12 kl. 14:30 (4 6mer) – teller 70% av slu=karakter • ~5 obligatoriske oppgaver (innleveringfrister kunngjøres
senere)
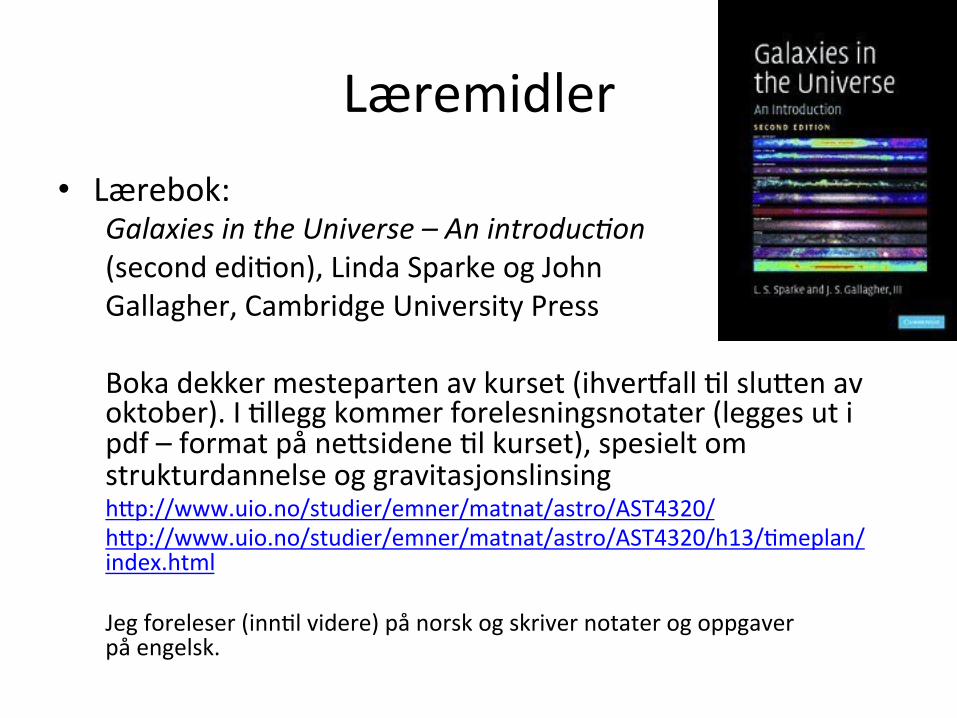
Læremidler • Lærebok:
Galaxies in the Universe – An introduc5on (second edi6on), Linda Sparke og John Gallagher, Cambridge University Press Boka dekker mesteparten av kurset (ihver`all 6l slu=en av oktober). I 6llegg kommer forelesningsnotater (legges ut i pdf – format på ne=sidene 6l kurset), spesielt om strukturdannelse og gravitasjonslinsing h=p://www.uio.no/studier/emner/matnat/astro/AST4320/ h=p://www.uio.no/studier/emner/matnat/astro/AST4320/h13/6meplan/index.html Jeg foreleser (inn6l videre) på norsk og skriver notater og oppgaver på engelsk.
Undervisere
• Håkon Dahle, rom 501, [email protected] h=p://folk.uio.no/hdahle Telefon: 22 85 75 31 • Gruppelærer (tom. 10.09) : Amir Hammami, [email protected]
• (Gruppelærer 17.09: Håkon Dahle) • Gruppelærer (fom. 24.09) : Max Grönke, [email protected]
Main topics in the course • The Milky Way as a galaxy • Galaxies: Different types, their structure/content, dynamics, scaling
rela6ons, and evolu6on • (Ac6ve galac6c nuclei, gas and dust in the interstellar and
intergalac6c medium, and their evolu6on) • The physics of galaxy clusters, and their use as a cosmological
probe • Dark ma=er and large-‐scale structure forma6on and evolu6on • Using gravita6onal lensing to study the physics of galaxies and
clusters (including dark ma=er) and the evolu6on of structure in the universe
• I will discuss relevant observa6onal methods (op6cal, IR, sub-‐mm, X-‐ray) and the most important past and future surveys to the extent necessary/as 6me allows.
Context • These topics could easily fill 3-‐4 courses, but I’ll try to focus on
things that will be par6cularly important and relevant for Master students at ITA, while also providing basic background knowledge on other key topics in extragalac6c astronomy
• Current cosmology research at ITA includes theory (dark energy, modified gravity, neutrinos), N-‐body simula6ons beyond the “standard” (ΛCDM) model, studies of the Cosmic Microwave background radia6on (Planck++), using galaxy clusters as gravita6onal lenses, and will soon include radia6ve transfer modeling of early galaxies
• My aim is to give you background knowledge (not covered by earlier or subsequent courses) needed to start a master degree in one of these topics. I will assume background knowledge from AST 4220 (Cosmology I)
• Another goal is to get an ini6al exposure to reading relevant scien6fic literature, e.g. papers in Astrophysical Journal, Astronomy & Astrophysics, and Monthly No5ces of the Royal Astronomical Society

So let’s get started…
Lecture I: preliminaries (Chapter 1, sec6ons 1.1, 1.3.1)
• Stars and their spectra • Photometry: Measuring light • Galaxy photometry • Photometric redshiSs
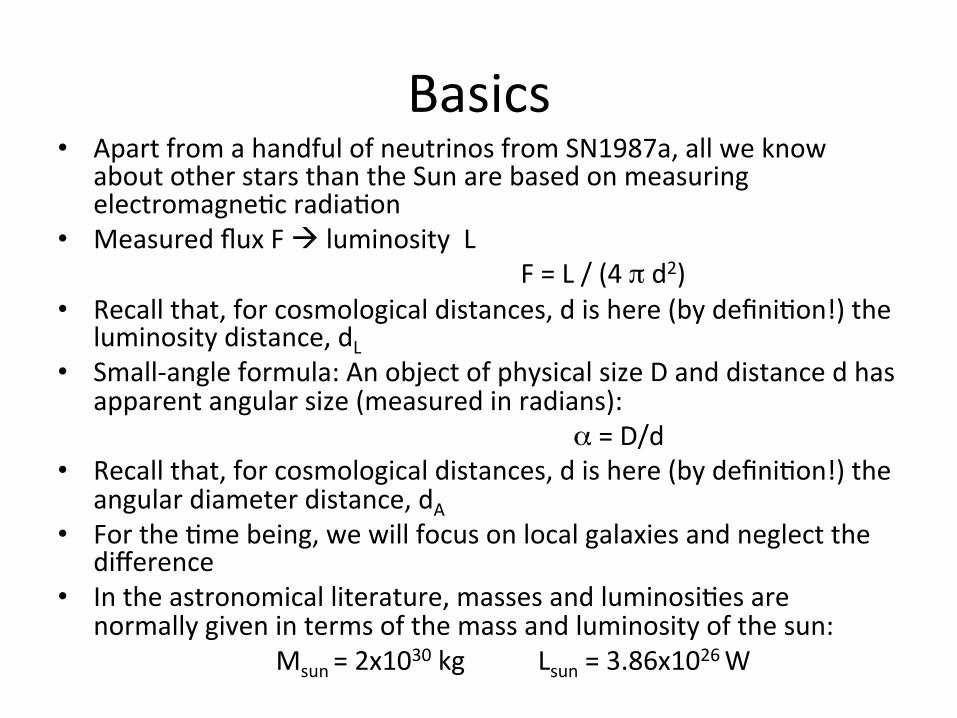
Basics • Apart from a handful of neutrinos from SN1987a, all we know
about other stars than the Sun are based on measuring electromagne6c radia6on
• Measured flux F à luminosity L F = L / (4 π d2) • Recall that, for cosmological distances, d is here (by defini6on!) the
luminosity distance, dL • Small-‐angle formula: An object of physical size D and distance d has
apparent angular size (measured in radians): α = D/d • Recall that, for cosmological distances, d is here (by defini6on!) the
angular diameter distance, dA • For the 6me being, we will focus on local galaxies and neglect the
difference • In the astronomical literature, masses and luminosi6es are
normally given in terms of the mass and luminosity of the sun: Msun = 2x1030 kg Lsun = 3.86x1026 W
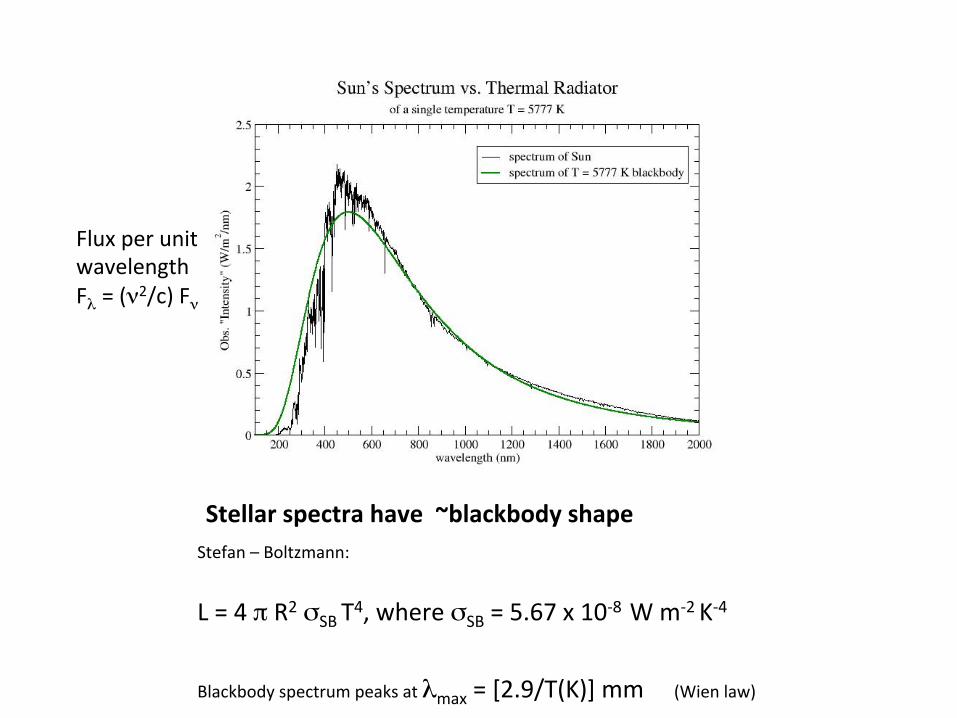
Stellar spectra have ~blackbody shape Stefan – Boltzmann:
L = 4 π R2 σSB T4, where σSB = 5.67 x 10-‐8 W m-‐2 K-‐4 Blackbody spectrum peaks at λmax = [2.9/T(K)] mm (Wien law)
Flux per unit wavelength Fλ = (ν2/c) Fν
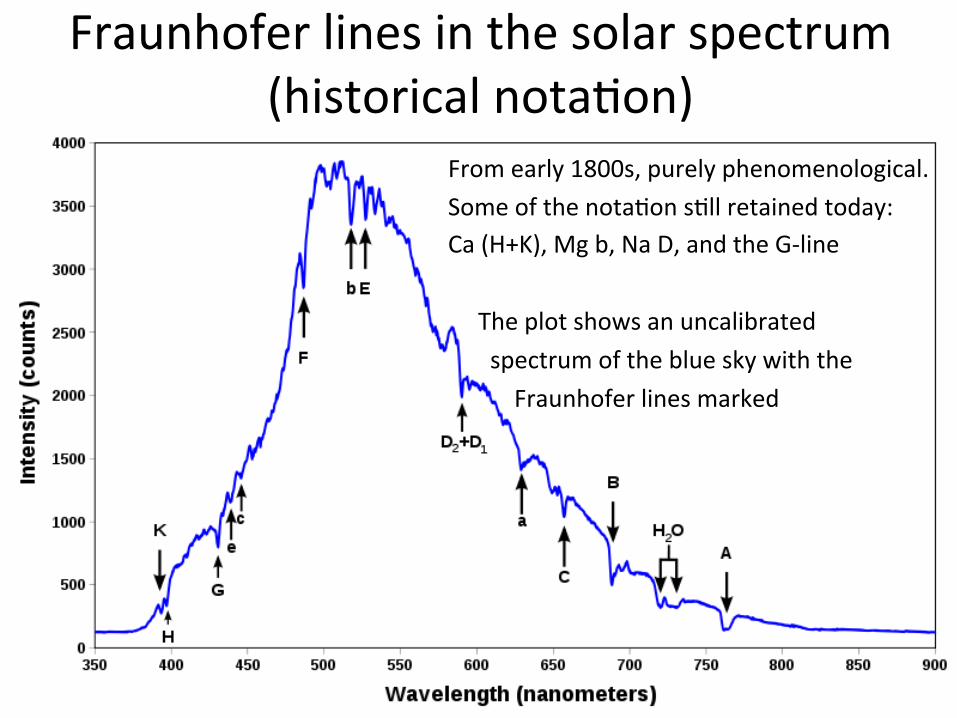
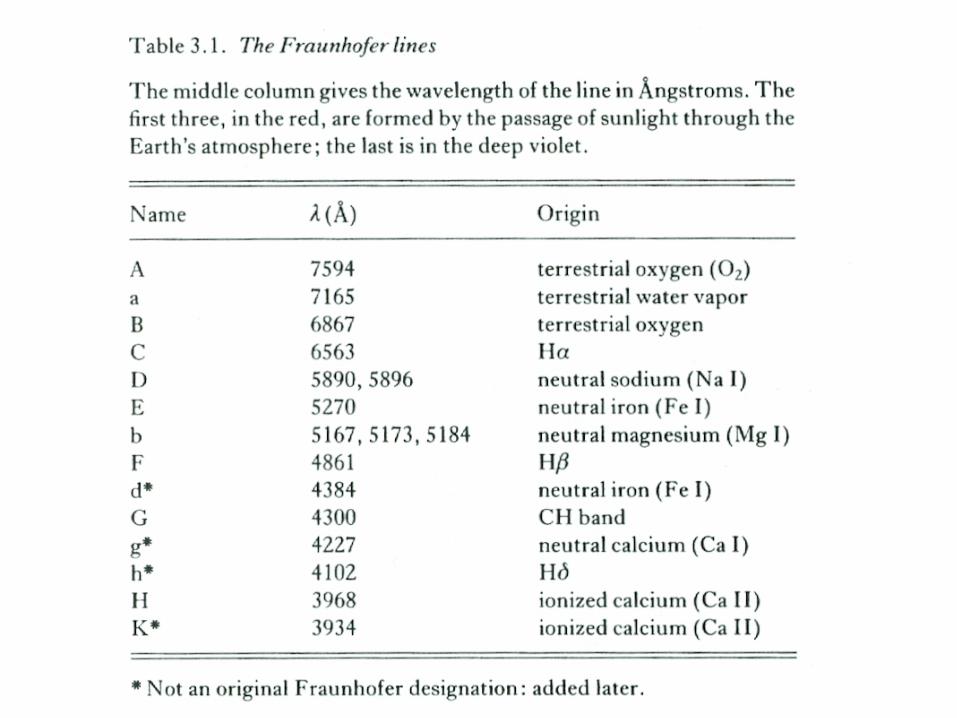
Fraunhofer lines in the solar spectrum (historical nota6on)
From early 1800s, purely phenomenological. Some of the nota6on s6ll retained today: Ca (H+K), Mg b, Na D, and the G-‐line The plot shows an uncalibrated spectrum of the blue sky with the Fraunhofer lines marked
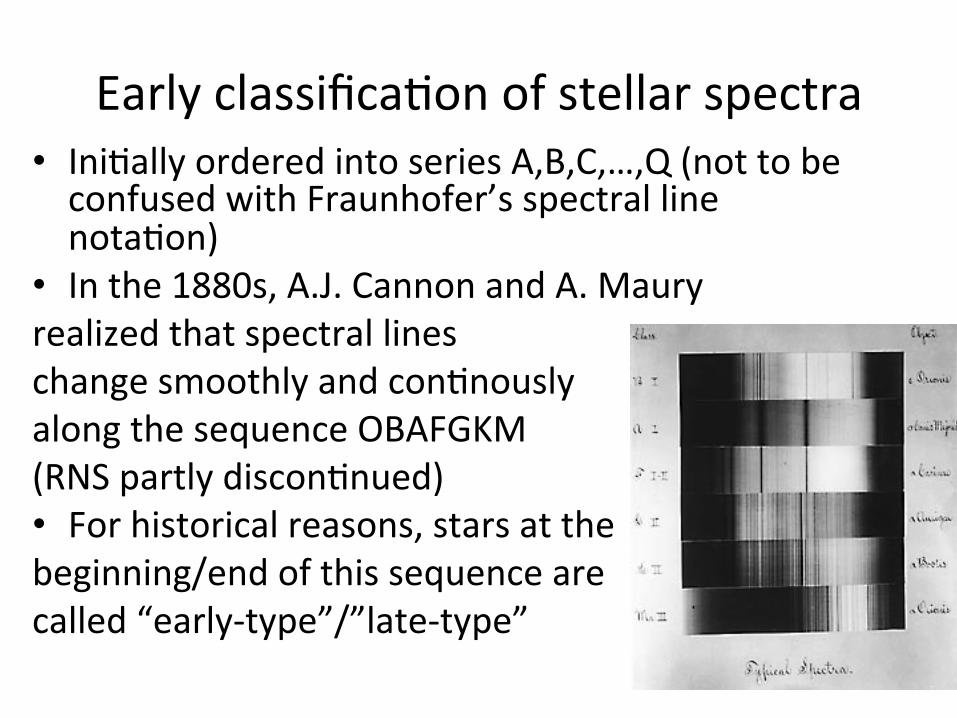
Early classifica6on of stellar spectra • Ini6ally ordered into series A,B,C,…,Q (not to be confused with Fraunhofer’s spectral line nota6on)
• In the 1880s, A.J. Cannon and A. Maury realized that spectral lines change smoothly and con6nously along the sequence OBAFGKM (RNS partly discon6nued) • For historical reasons, stars at the beginning/end of this sequence are called “early-‐type”/”late-‐type”
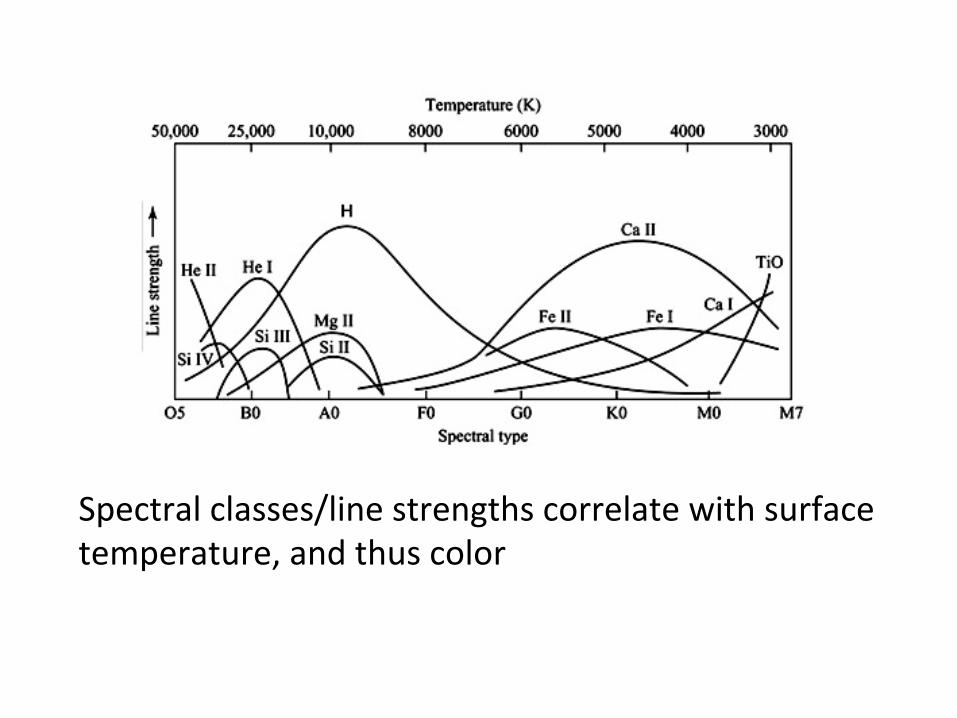
Spectral classes/line strengths correlate with surface temperature, and thus color
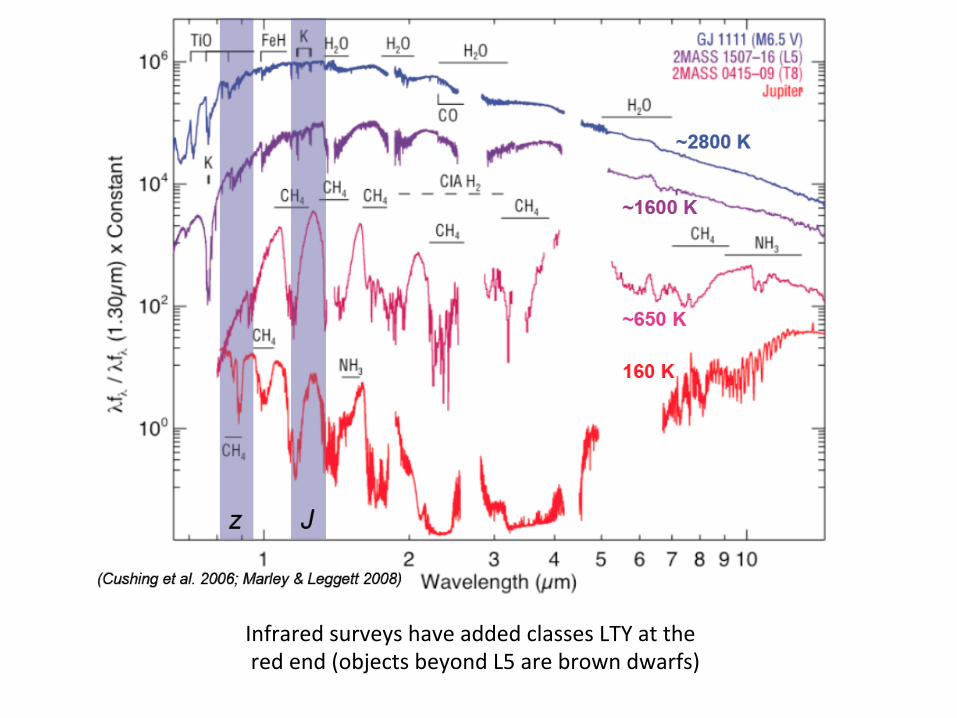
Infrared surveys have added classes LTY at the red end (objects beyond L5 are brown dwarfs)
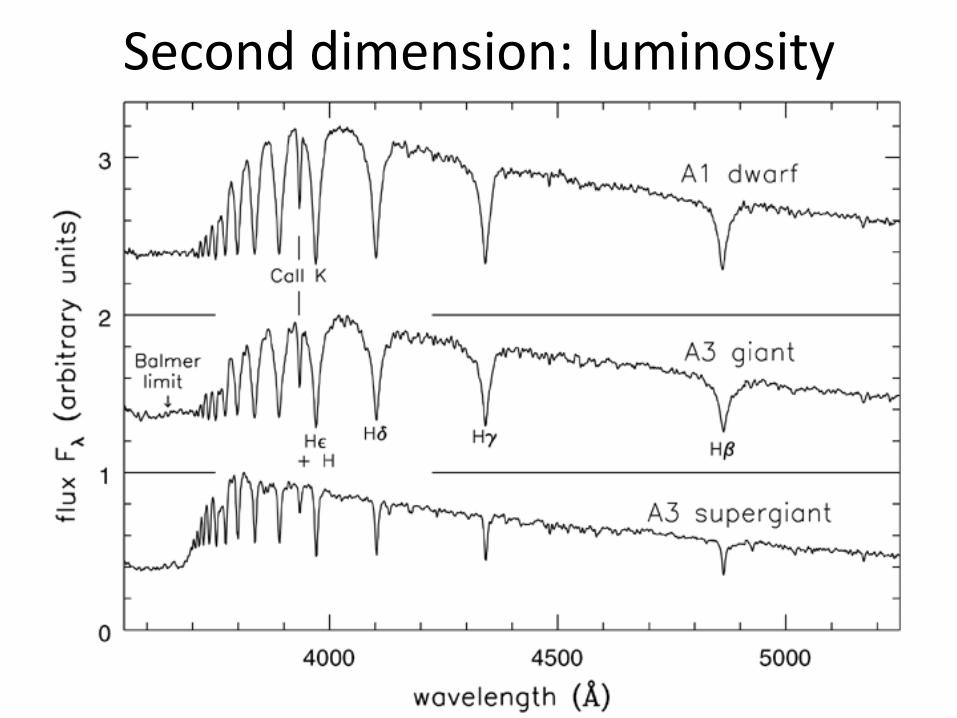
Second dimension: luminosity
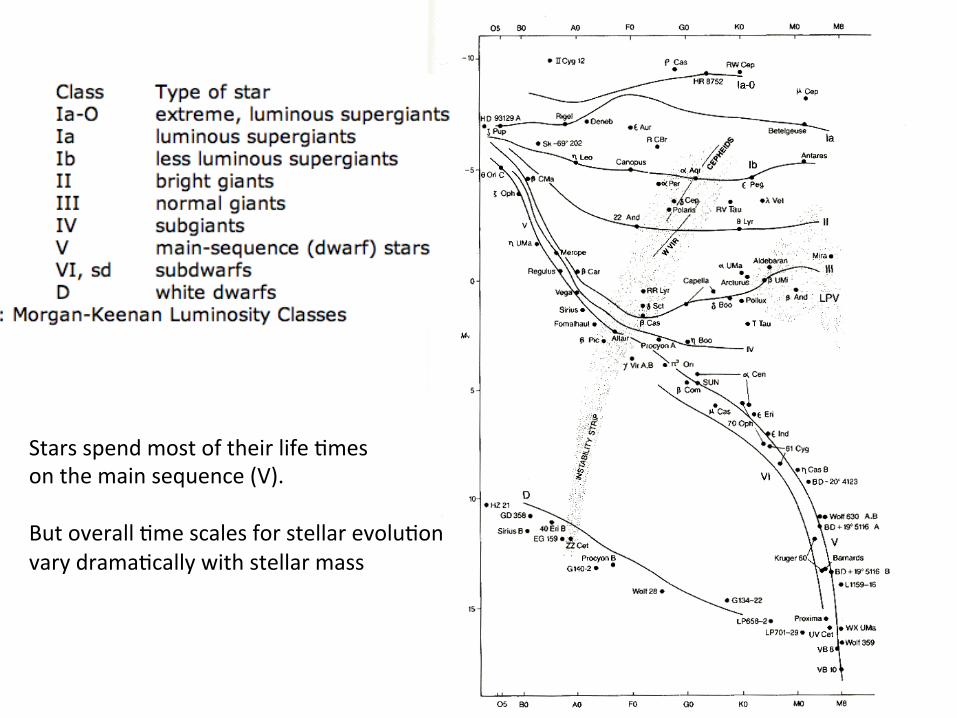
Stars spend most of their life 6mes on the main sequence (V). But overall 6me scales for stellar evolu6on vary drama6cally with stellar mass
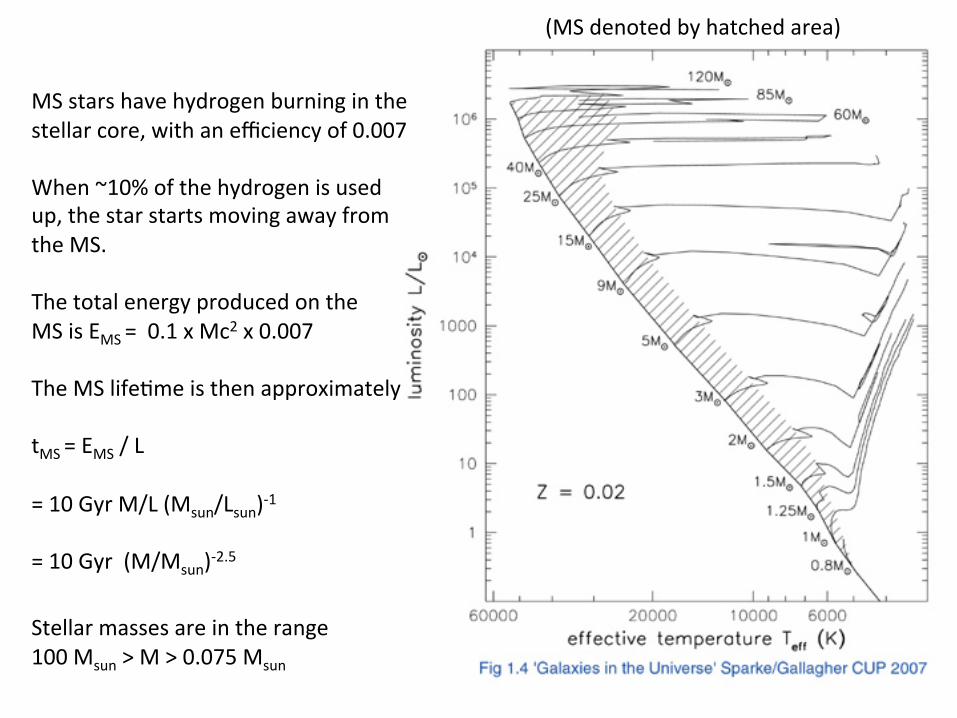
MS stars have hydrogen burning in the stellar core, with an efficiency of 0.007 When ~10% of the hydrogen is used up, the star starts moving away from the MS. The total energy produced on the MS is EMS = 0.1 x Mc2 x 0.007 The MS life6me is then approximately tMS = EMS / L = 10 Gyr M/L (Msun/Lsun)-‐1 = 10 Gyr (M/Msun)-‐2.5
Stellar masses are in the range 100 Msun > M > 0.075 Msun
(MS denoted by hatched area)
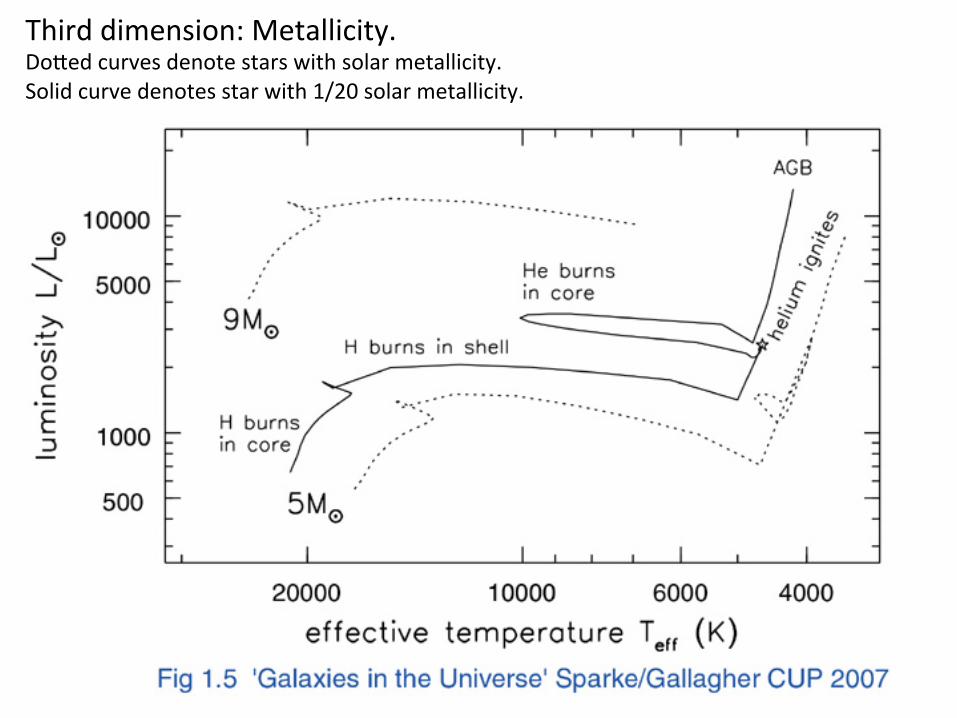
Third dimension: Metallicity. Do=ed curves denote stars with solar metallicity. Solid curve denotes star with 1/20 solar metallicity.
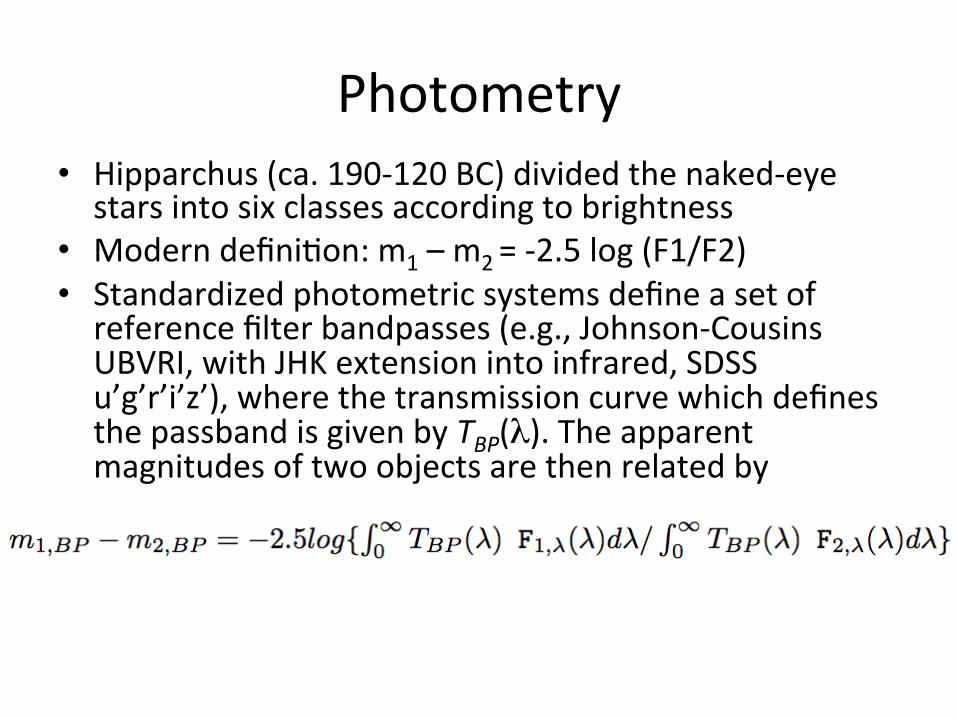
Photometry • Hipparchus (ca. 190-‐120 BC) divided the naked-‐eye stars into six classes according to brightness
• Modern defini6on: m1 – m2 = -‐2.5 log (F1/F2) • Standardized photometric systems define a set of reference filter bandpasses (e.g., Johnson-‐Cousins UBVRI, with JHK extension into infrared, SDSS u’g’r’i’z’), where the transmission curve which defines the passband is given by TBP(λ). The apparent magnitudes of two objects are then related by
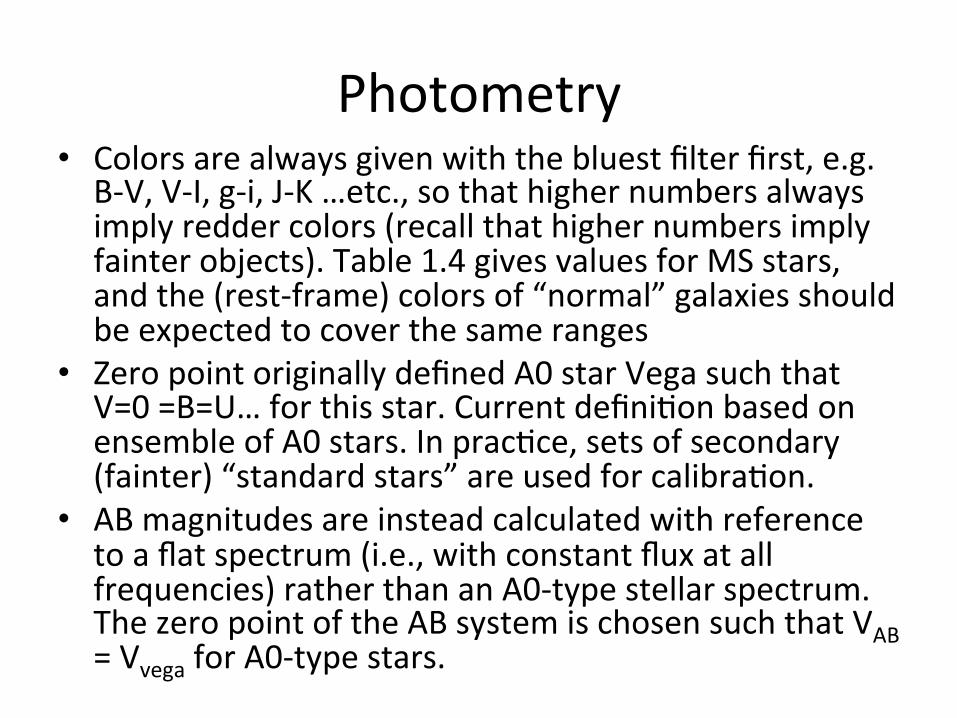
Photometry • Colors are always given with the bluest filter first, e.g. B-‐V, V-‐I, g-‐i, J-‐K …etc., so that higher numbers always imply redder colors (recall that higher numbers imply fainter objects). Table 1.4 gives values for MS stars, and the (rest-‐frame) colors of “normal” galaxies should be expected to cover the same ranges
• Zero point originally defined A0 star Vega such that V=0 =B=U… for this star. Current defini6on based on ensemble of A0 stars. In prac6ce, sets of secondary (fainter) “standard stars” are used for calibra6on.
• AB magnitudes are instead calculated with reference to a flat spectrum (i.e., with constant flux at all frequencies) rather than an A0-‐type stellar spectrum. The zero point of the AB system is chosen such that VAB = Vvega for A0-‐type stars.
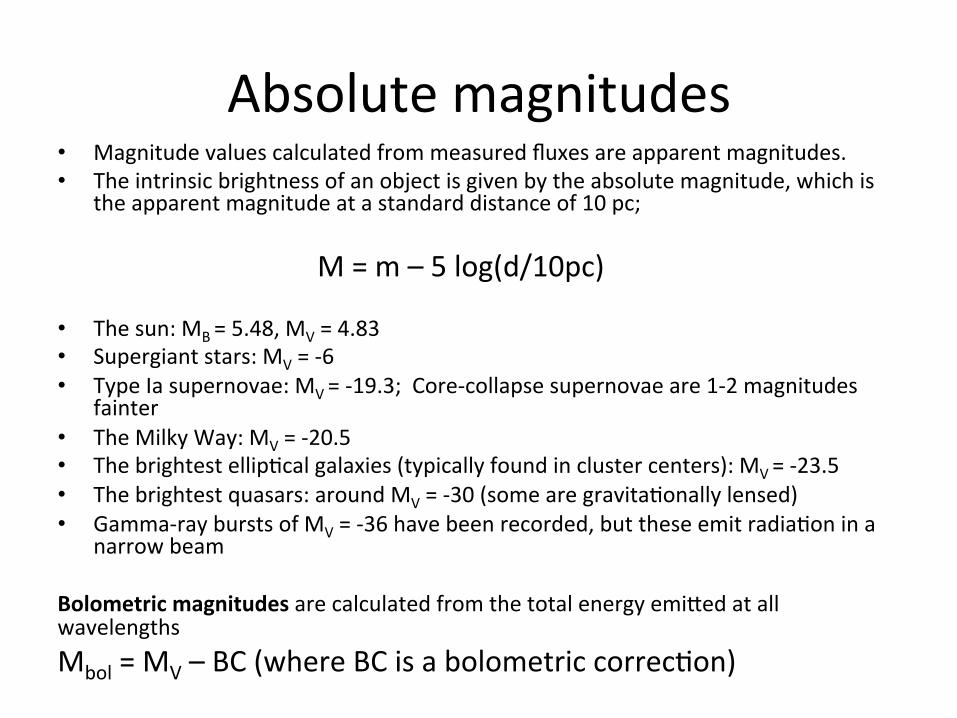
Absolute magnitudes • Magnitude values calculated from measured fluxes are apparent magnitudes. • The intrinsic brightness of an object is given by the absolute magnitude, which is
the apparent magnitude at a standard distance of 10 pc; M = m – 5 log(d/10pc) • The sun: MB = 5.48, MV = 4.83 • Supergiant stars: MV = -‐6 • Type Ia supernovae: MV = -‐19.3; Core-‐collapse supernovae are 1-‐2 magnitudes
fainter • The Milky Way: MV = -‐20.5 • The brightest ellip6cal galaxies (typically found in cluster centers): MV = -‐23.5 • The brightest quasars: around MV = -‐30 (some are gravita6onally lensed) • Gamma-‐ray bursts of MV = -‐36 have been recorded, but these emit radia6on in a
narrow beam Bolometric magnitudes are calculated from the total energy emi=ed at all wavelengths Mbol = MV – BC (where BC is a bolometric correc6on)
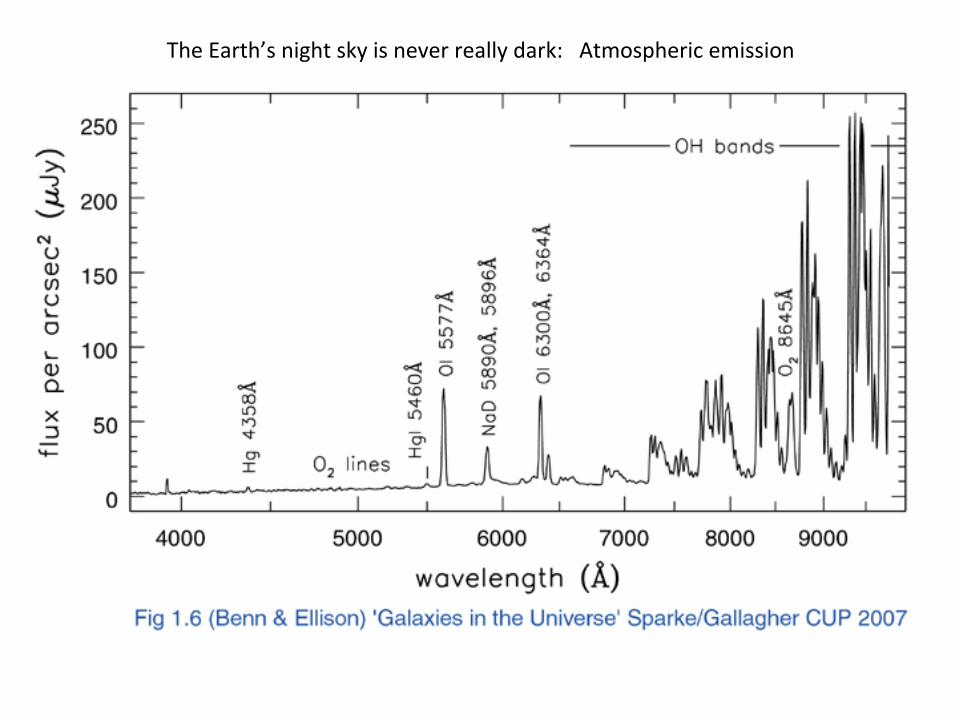
The Earth’s night sky is never really dark: Atmospheric emission
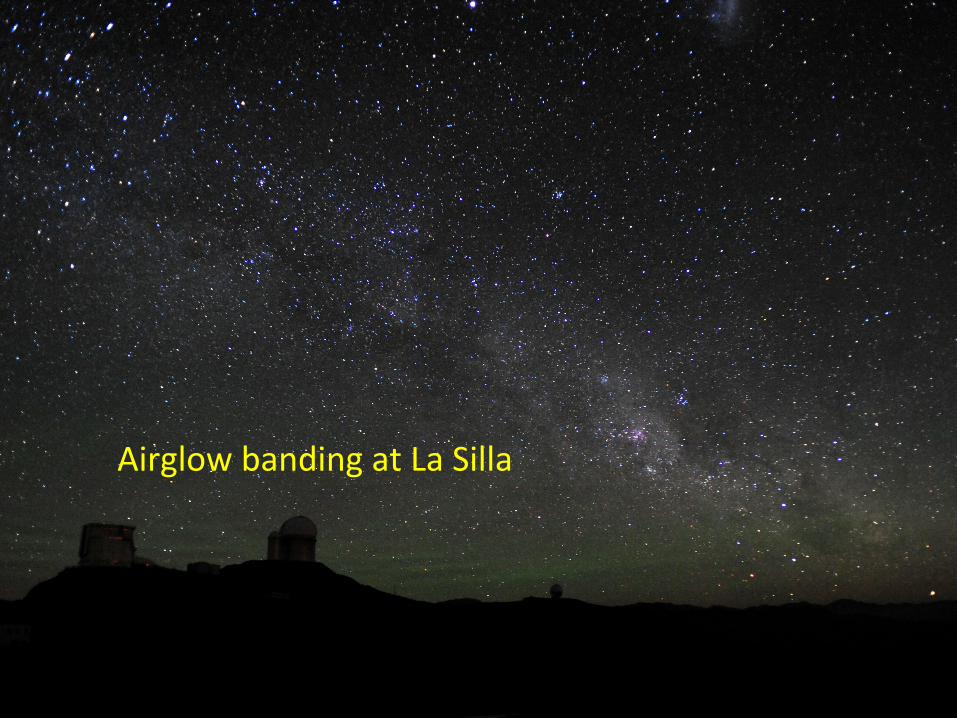
Airglow banding at La Silla
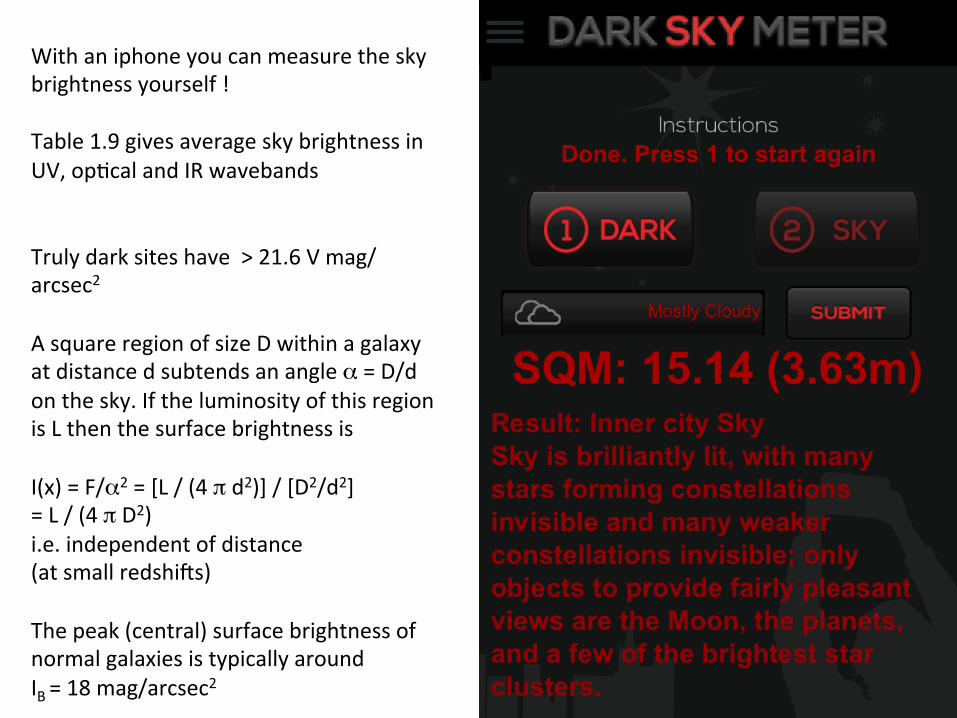
With an iphone you can measure the sky brightness yourself ! Table 1.9 gives average sky brightness in UV, op6cal and IR wavebands Truly dark sites have > 21.6 V mag/ arcsec2 A square region of size D within a galaxy at distance d subtends an angle α = D/d on the sky. If the luminosity of this region is L then the surface brightness is I(x) = F/α2 = [L / (4 π d2)] / [D2/d2] = L / (4 π D2) i.e. independent of distance (at small redshiSs) The peak (central) surface brightness of normal galaxies is typically around IB = 18 mag/arcsec2
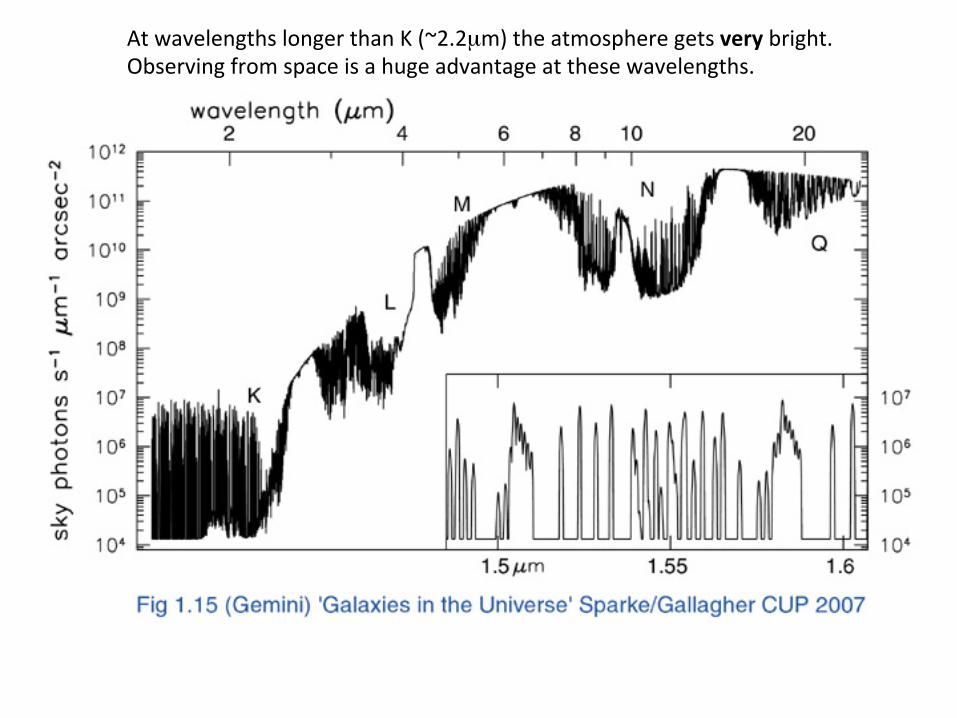
At wavelengths longer than K (~2.2µm) the atmosphere gets very bright. Observing from space is a huge advantage at these wavelengths.
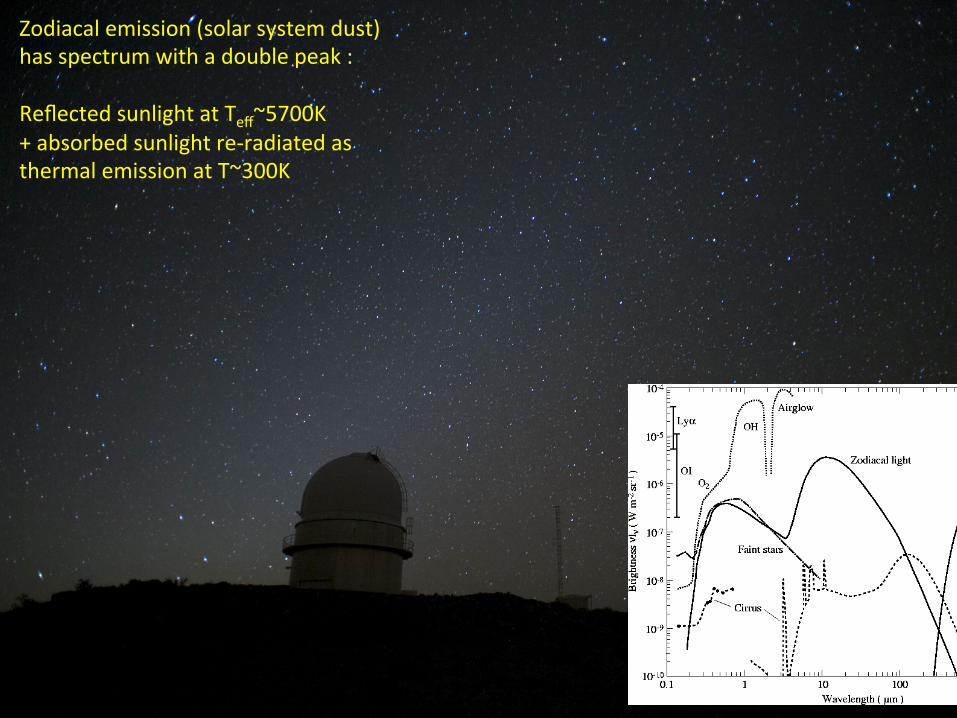
Zodiacal emission (solar system dust) has spectrum with a double peak : Reflected sunlight at Teff~5700K + absorbed sunlight re-‐radiated as thermal emission at T~300K
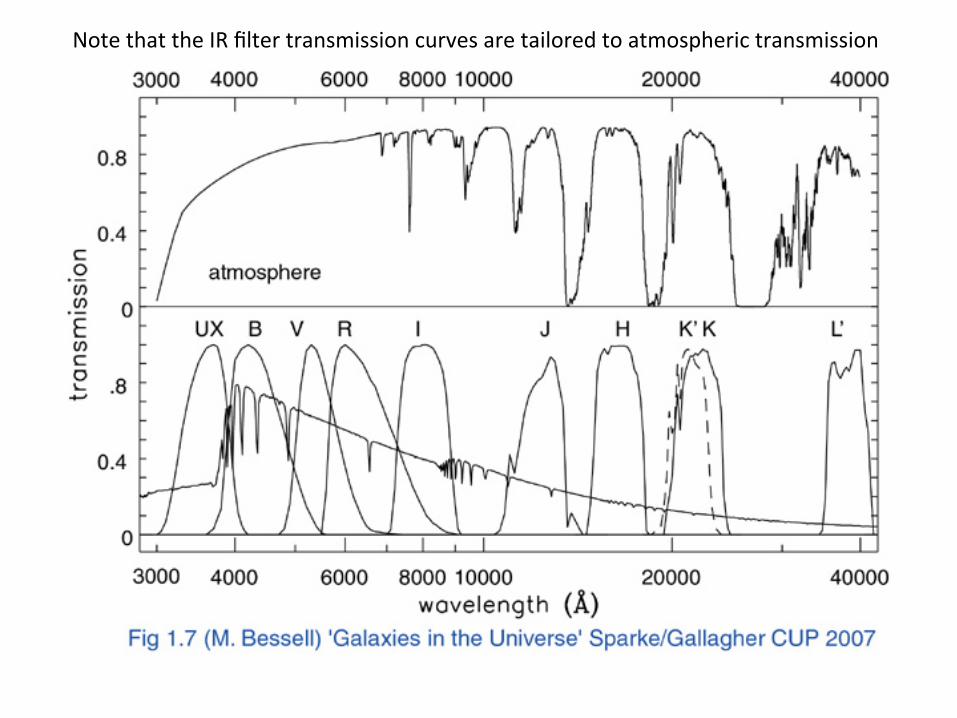
Note that the IR filter transmission curves are tailored to atmospheric transmission
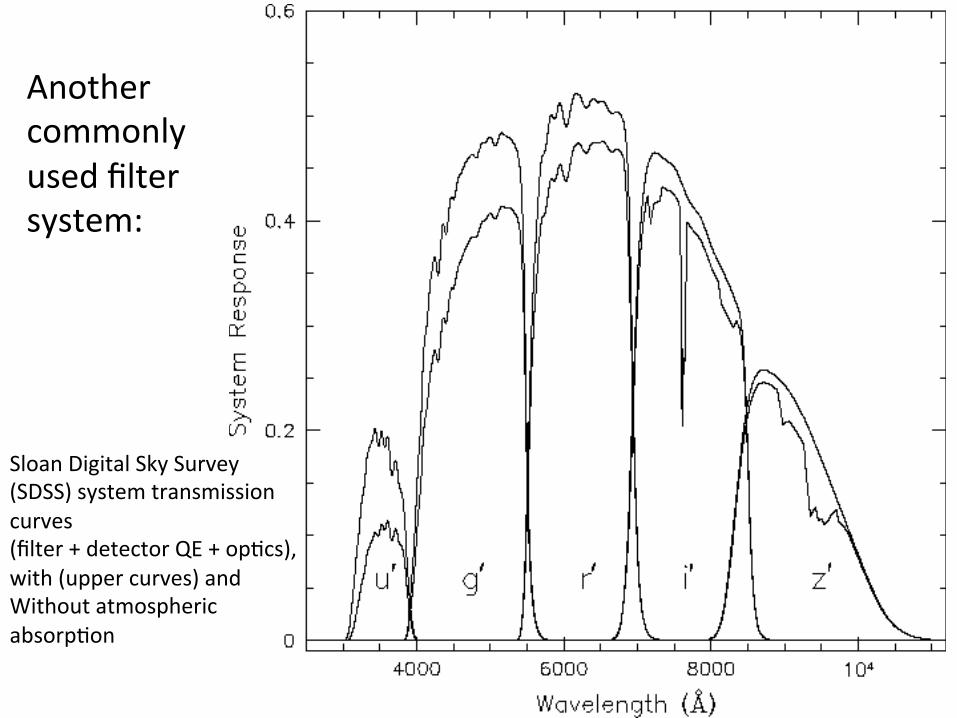
Sloan Digital Sky Survey (SDSS) system transmission curves (filter + detector QE + op6cs), with (upper curves) and Without atmospheric absorp6on
Another commonly used filter system:
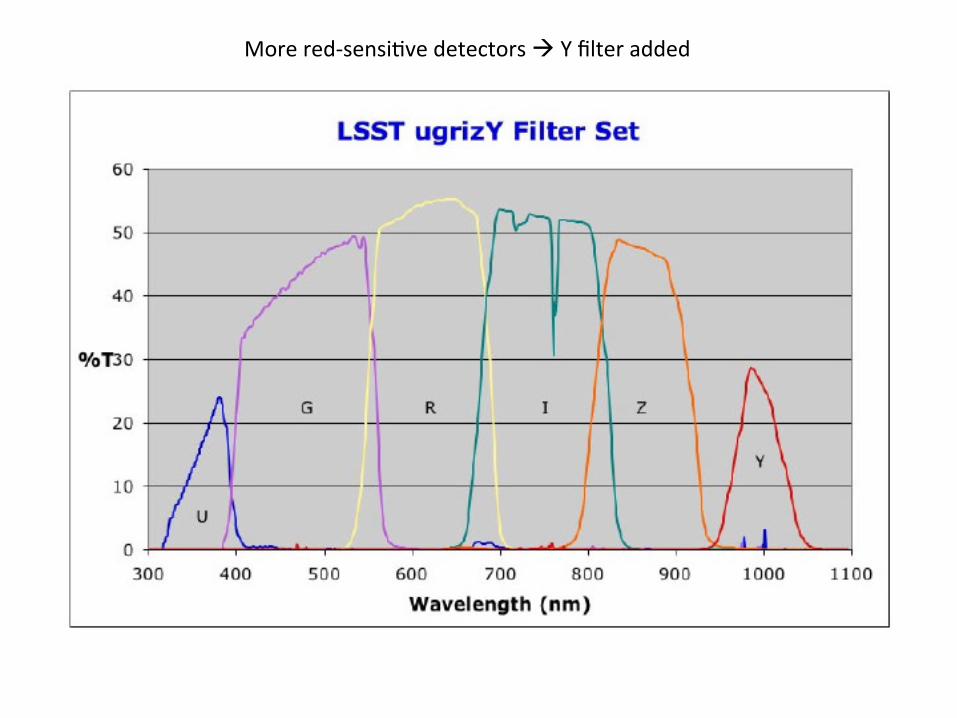
More red-‐sensi6ve detectors à Y filter added
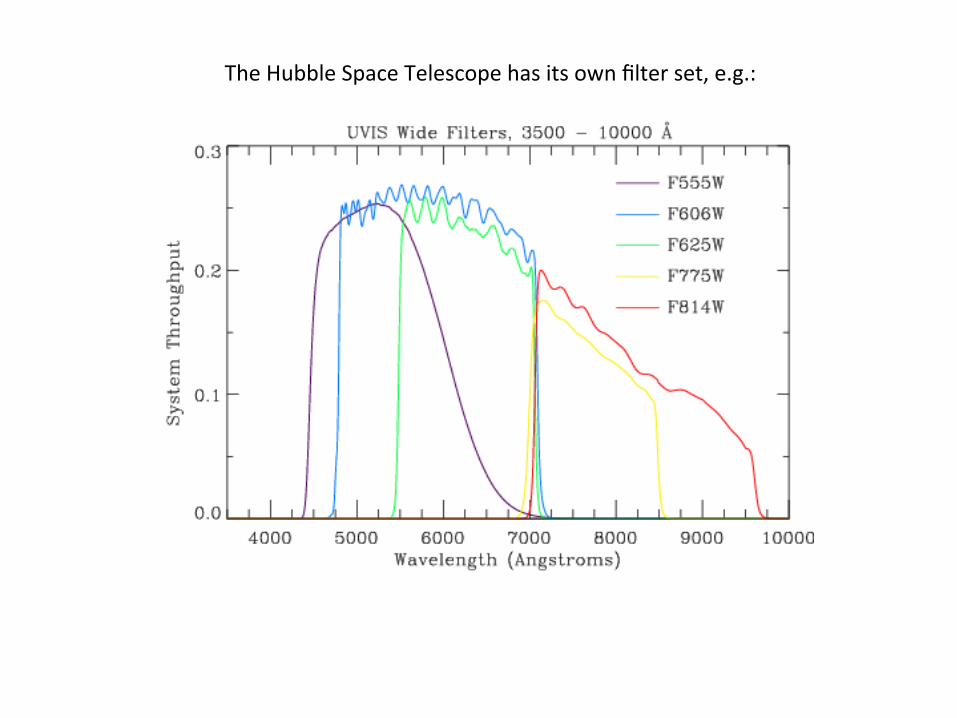
The Hubble Space Telescope has its own filter set, e.g.:
More examples of broad-‐, intermediate-‐, and narrow-‐band filters: h=p://www.not.iac.es/instruments/filters/filters.php
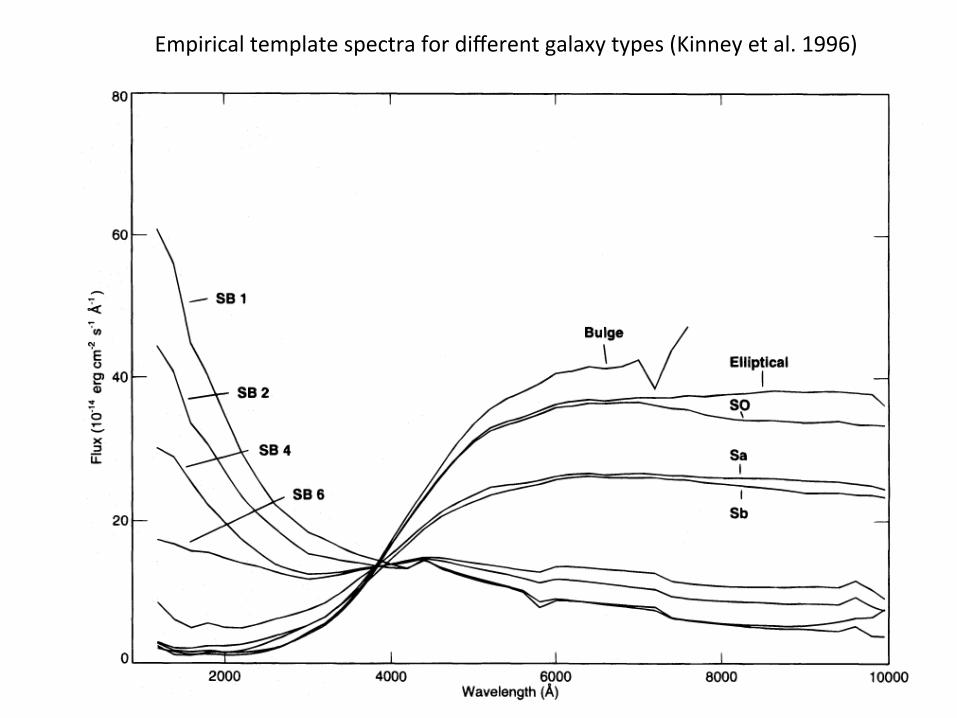
Empirical template spectra for different galaxy types (Kinney et al. 1996)
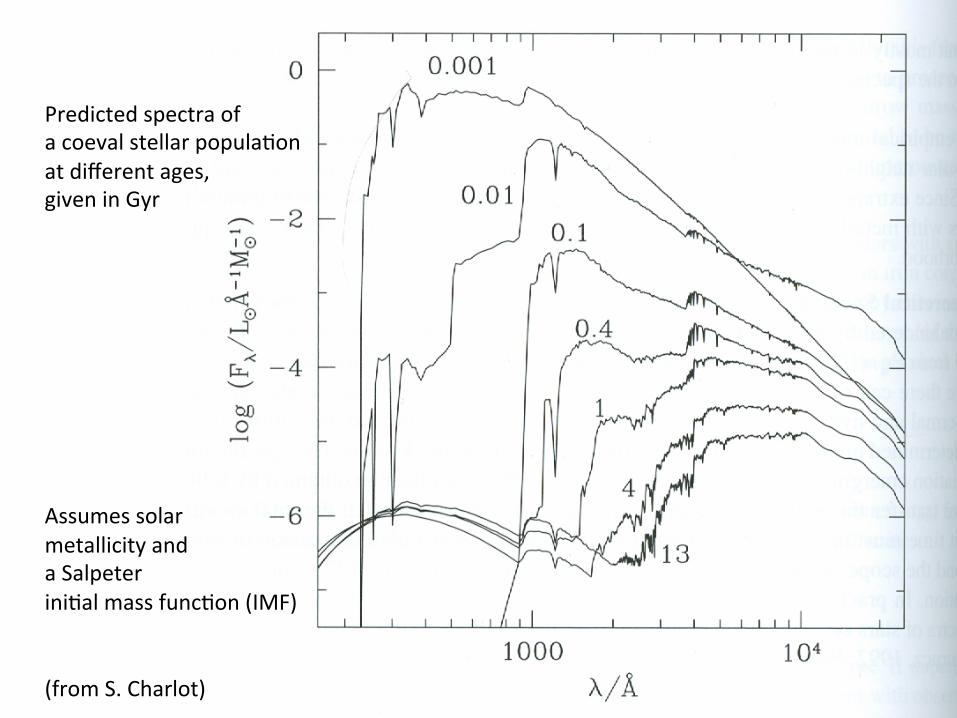
Stellar popula6on synthesis Predicted spectra of a coeval stellar popula6on at different ages, given in Gyr Assumes solar metallicity and a Salpeter ini6al mass func6on (IMF) (from S. Charlot)
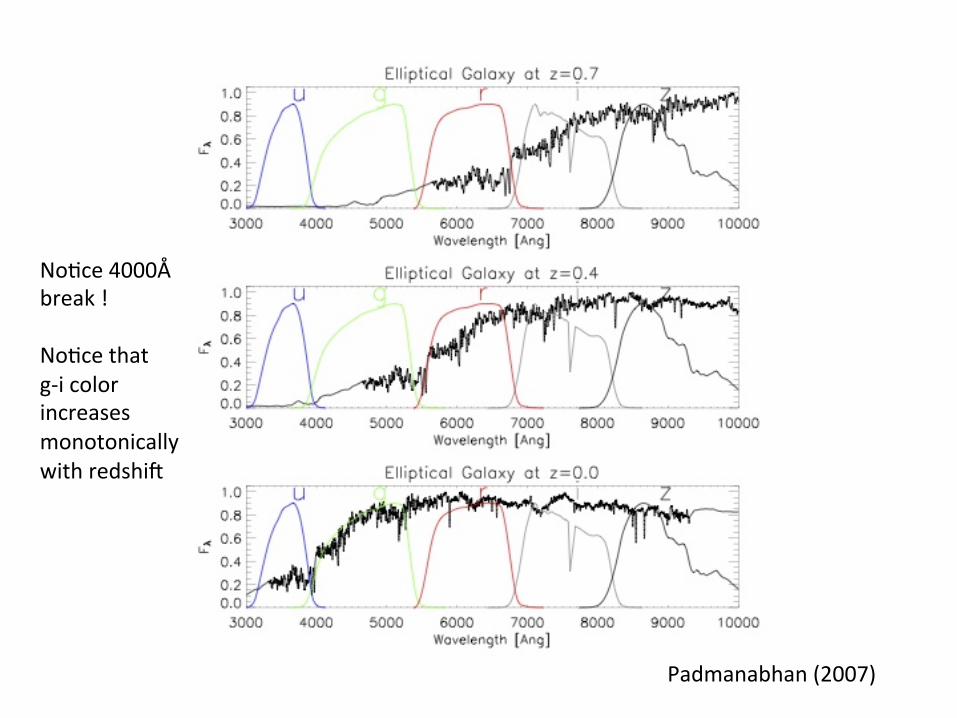
Padmanabhan (2007)
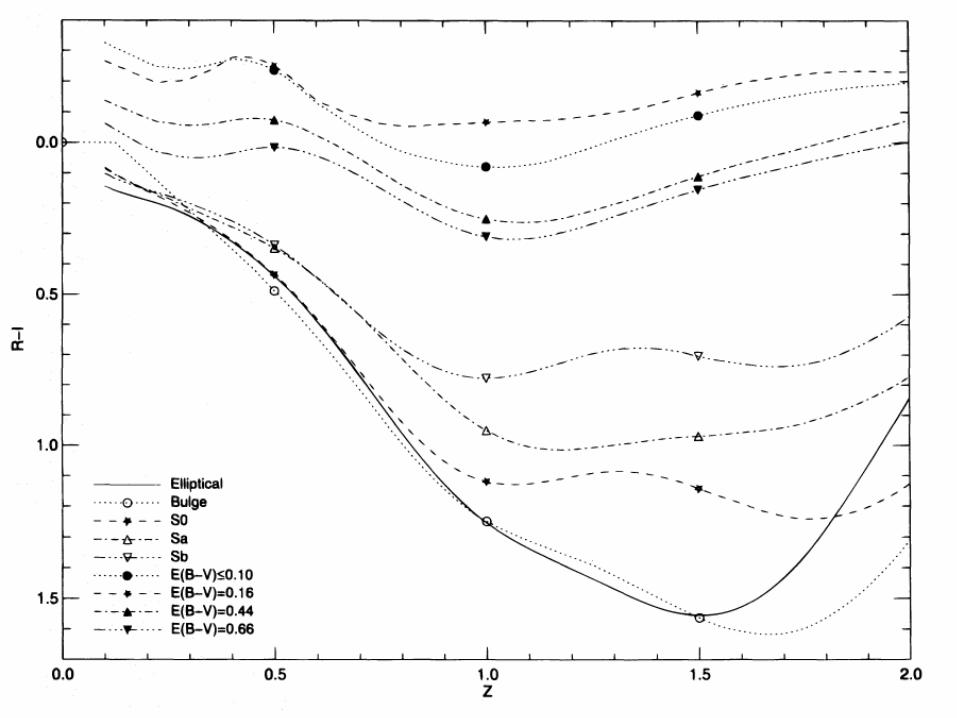
No6ce 4000Å break ! No6ce that g-‐i color increases monotonically with redshiS
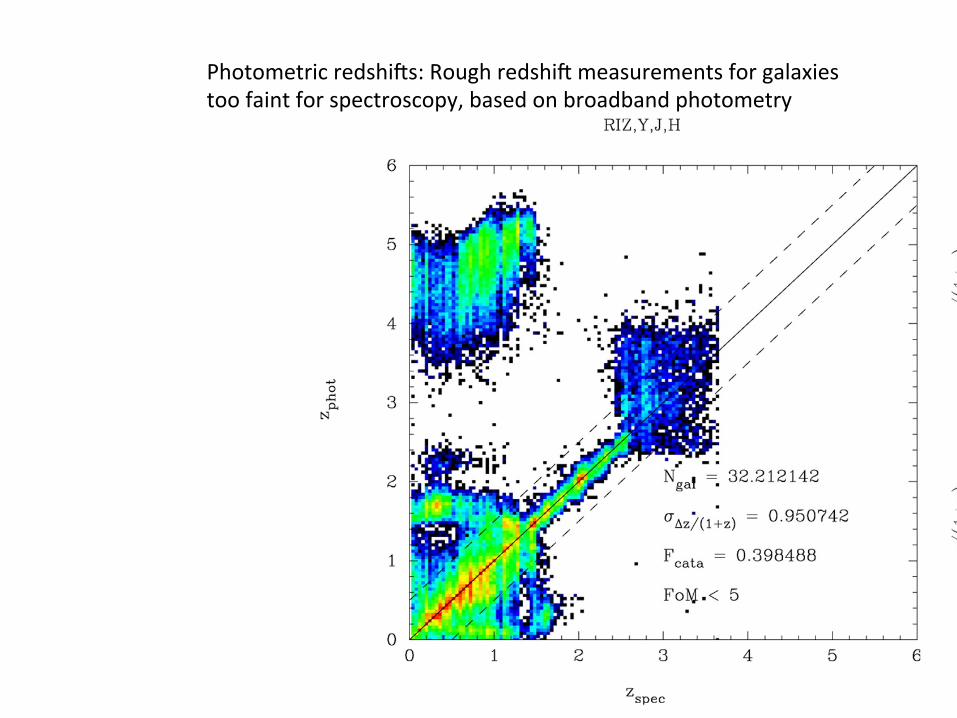
Photometric redshiSs: Rough redshiS measurements for galaxies too faint for spectroscopy, based on broadband photometry
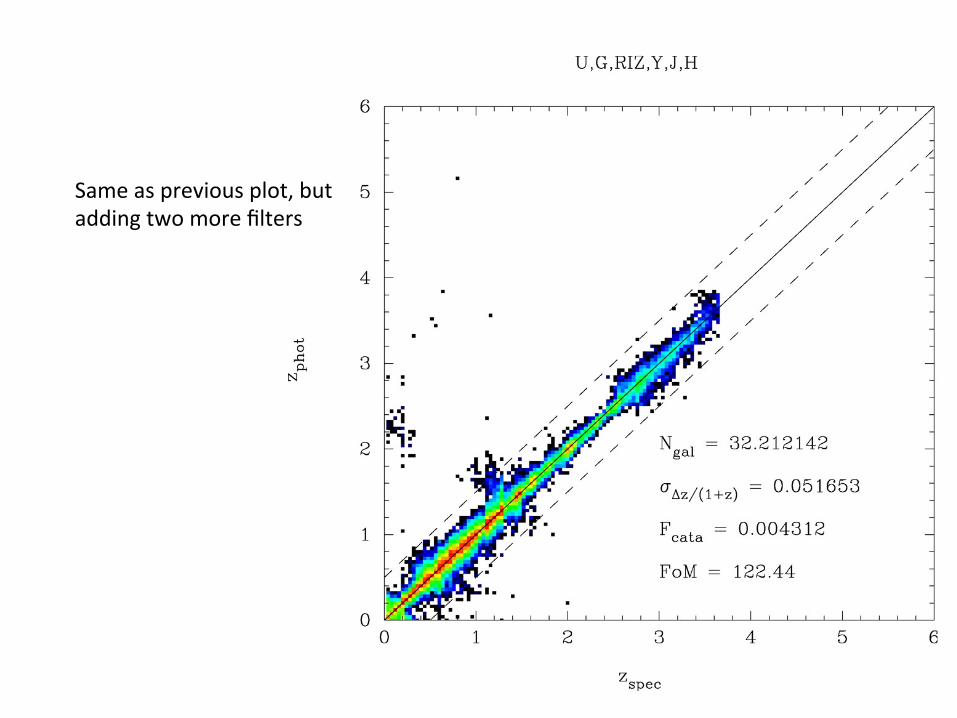
Same as previous plot, but adding two more filters