Embed Size (px)
Citation preview

http://repository.osakafu-u.ac.jp/dspace/
TitleAPPLICATION OF CFD TO OPTIMIZATION OF HYDRODYNAMI
C PERFORMANCES OF NON BALLAST SHIPS
Author(s) HE, NGO VAN
Editor(s)
Citation
Issue Date 2013
URL http://hdl.handle.net/10466/13857
Rights
1
APPLICATION OF CFD TO OPTIMIZATION
OF HYDRODYNAMIC PERFORMANCES OF
NON BALLAST SHIPS
NGO VAN HE
July, 2013
Doctoral Thesis at Osaka Prefecture University

2

3
Content of thesis
Abstract 5
Acknowledgements 7
List of figure 9
List of table 15
Chapter 1: Introduction 17
Chapter 2:
Validation of the CFD
2.1 Model ships using for validation 21
2.2 Boundary condition and meshing of fluid domain for calculation 23
2.3 Assessment of CFD results in calm water 24
2.4 Assessment of CFD results in regular waves 26
2.5 Conclusions of the chapter 2 28
Chapter 3:
Optimization of bow shape for non ballast water ships
3.1. Design parameters of optimum bulbous bow shape 29
3.1.1 Volume of bulbous bow 29
3.1.2 Height of volume center and angle of bow bottom 32
3.1.3 Length of bow 34
3.2. Assessment of Effect of Bulbous bow 38 3.2.1 Assessment of effect of bulbous bow on resistance acting on ship in calm
water 38
3.2.2 Assessment of effect of bulbous bow on added resistance acting on ship in waves
42
3.2.2.1 Pressure distribution and wave pattern 42
3.2.2.2 Added resistance acting on new ships in waves 47 3.3 Measurement of resistance at towing tank 48
3.3.1 Experimental results of resistance in calm water
49

4
3.3.2 Experimental results of resistance in regular head wave with moderate
wave
50
3.4 Conclusions of the chapter 3 52
Chapter 4:
Resistance acting on a hull of ship in high waves
4.1 Models and fluid domain for computation 53 4.2. Dynamic pressure and wave pattern 54
4.2.1 Wave pattern at free surface 54
4.2.2 Dynamic pressure distribution over hull surface of the ships 72
4.3. Velocity distribution in boundary layer 93
4.4. Measurement of resistance in high waves 95
4.5 Conclusions of the chapter 4 98
Chapter 5:
CFD calculation of air resistance
5.1. Air resistance acting on accommodations of ships 101
5.1.1 Box shape accommodation 101
5.1.2 Modified box shape accommodation 102
5.1.3 Streamlined accommodation 104
5.1.4 Optimum shape for accommodation of ship 105
5.2. Interaction effects between hull and accommodation of ships 111
5.2.1 Interaction effects of location of accommodation on deck 111
5.2.2 Interaction effects between hull and accommodation 116
5.3. Conclusions of the chapter 5 121
Chapter 6: Conclusion of thesis 123
List of Publications 127
Bibliography 129
Nomenclature 131

5
Abstract
In this thesis, the author studies on application of CFD to optimized hydrodynamic
performance of ships. Both hydrodynamic performances of ships in water and in air are
studied in the thesis.
At first, accuracy of the commercial CFD code “Fluent” version 14 which is developed by
ANSYS group in the present study is validated by comparing the CFD results with the
experimental results at Towing tank of Osaka Prefecture University.
Then, development of new bow shapes for ships with minimum resistance acting on the
hulls is discussed in the next chapter of the thesis. The targets of this chapter are to
investigate the applicability of the CFD to optimizations of bow shapes of ships in calm
water and in head waves. A new series of bow shapes with lower resistance is developed,
and the optimum shape is determined by using the CFD. The causes of reducing resistance
acting on ships are also clarified by using pressure distribution and wave pattern calculated
by the CFD.
In next chapter, added resistances due to high waves are successfully calculated.
Resistances acting on three kinds of bow shapes with and without bulbous bows are
investigated in high waves by the CFD, and an optimum bow shape is determined. Pressure
and wave pattern generated by the ships running in high waves are compared to find the
causes of reducing resistance due to bow shapes.
In the last chapter of the thesis, interaction effects between a hull and an accommodation of
a ship on its air resistance are investigated by the CFD. Air resistances acting on the whole
ship, on the hull part and on the accommodation part are computed to obtain the air
resistance acting on each part and the interaction effects. The results of this chapter
demonstrate that the interaction effects between the hull and its accommodation house
significantly depend on shape and location of accommodation houses. It is also shown how
to reduce the total air resistance by using an accommodation house.

6
7
Acknowledgements
This thesis would have been impossible without the supports, the guidance and the
encouragement of my supervisor Prof. Yoshiho Ikeda. At the 5th Asia-Pacific Workshop on
Marine Hydrodynamics – APHydro2010 at Osaka Prefecture University in Japan, I have
met him. It is so lucky to me and I could not believe that I could become his PhD student.
That is a great time in my life, so I have never forgot it.
First and foremost I would like to sincerely thank my supervisor Prof. Yoshiho Ikeda. That
of all I must be talking, that is my great honor to be his student.
And then, I would like to warmly thank Assistant Professor Yasunori Nihei for his kind
help and advice during my PhD research at Osaka Prefecture University. Also, I would like
to thank you so much to Assistant Satowa Ibata and her students who helped me in my
experiment at Towing tank of Osaka Prefecture University.
My gratitude goes to Professors of Department of Marine System Engineering, Officers at
Ikeda Laboratory, at Marine System Engineering, International student office of Osaka
Prefecture University who helped me during my PhD course.
My special gratitude goes to my fellow lab mates, at Ikeda Laboratory and my friend in
Osaka Prefecture University.
I would like to thank you very much to Prof. Toichi Fukasawa and Prof. Nobuhiro Baba
who kindly review my thesis and give me valuable comments.
The most important in my life is my family who is always on my side to help and
encourage me. It is not enough to say thank you also in my deep gratitude, I warmly thank
you so much my parents, my wife and my family I love them so much.
And finally, I would like to thank a lot to all other people in Osaka Prefecture University
and outside, ship building companies who helped me in my life, supported to me, touch me
Japanese and Japanese culture during my PhD course in Osaka Prefecture University.

8
9
List of Figure
Fig. 1 Body plan of the simple hull form, named as NBS -original, without
bulbous bow
22
Fig. 2 Body plan of improved hull form, NBK-N6 with developed bulbous
bow to reduce the wave resistance in calm water
22
Fig. 3 Fluid domain and meshing 23
Fig. 4 Frictional resistance calculated by Schoenherr`s formula and CFD 24
Fig. 5 Comparison of total resistance between CFD and experimental results 25
Fig. 6 Velocity distribution in boundary layer at centerline of x/Lpp=-0.325, Fn= 0.163 in calm water
25
Fig. 7 Velocity distribution in boundary layer at centerline of AP; x/Lpp=-0.5 at Fn=0.163 in calm water
26
Fig. 8 Fig. 7 Ratio of added resistances due to waves of two ships in wave,
Hw =0.02m at Fn=0.163
27
Fig. 9 Fig. 8 Total coefficient resistance of two ships in waves, Hw=0.02m
at Fn=0.163
27
Fig. 10 Body plans of new ships with developed bulbous bow shapes;
NBK-N1~3
30
Fig. 11 Calculated total resistance of new ship in calm water 31
Fig. 12 Calculated results of total resistance in wave at Fn= 0.163; Hw=0.02m 32
Fig. 13 Side profiles of newly developed ships with different height of volume center and angle of bow bottom line
32
Fig. 14 Calculated total resistances of new ships in calm water 33
Fig. 15 Calculated results of total resistances in wave at Fn=0.163; Hw=0.02m 33
Fig. 16 Profiles of bow developed ships; NBK-N5M1~M5 34
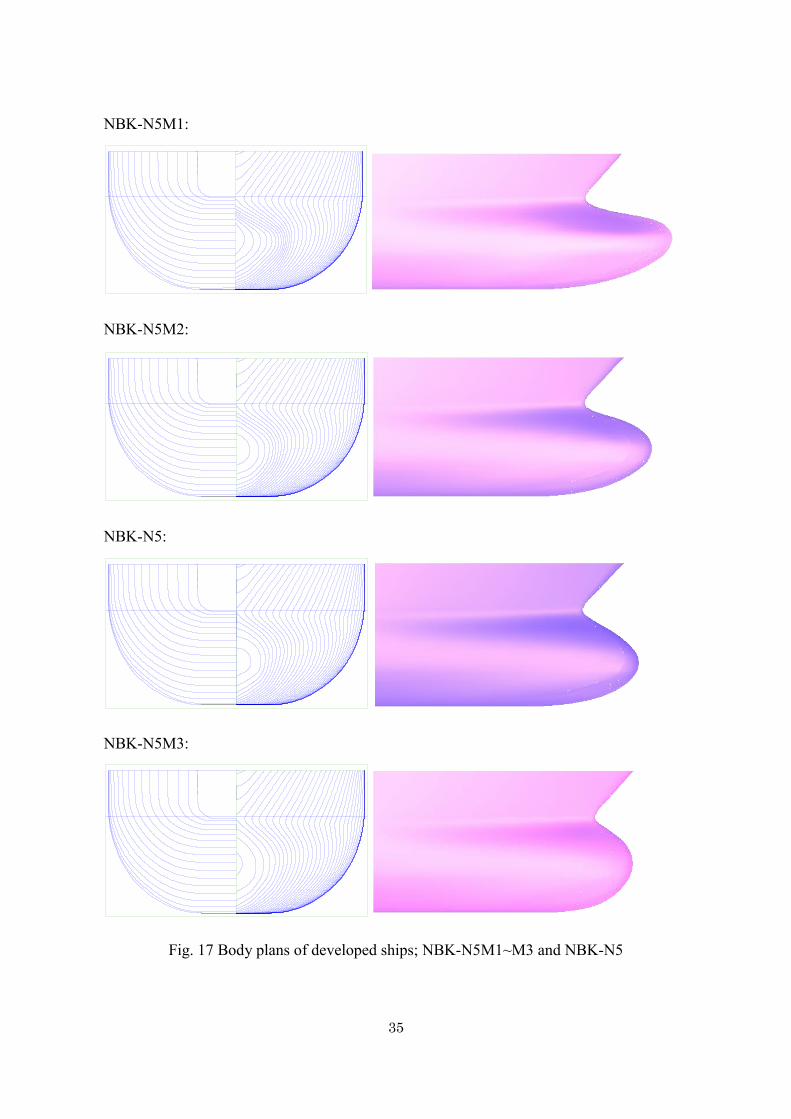
Fig. 17 Body plans of developed ships; NBK-N5M1~M3 and NBK-N5 35
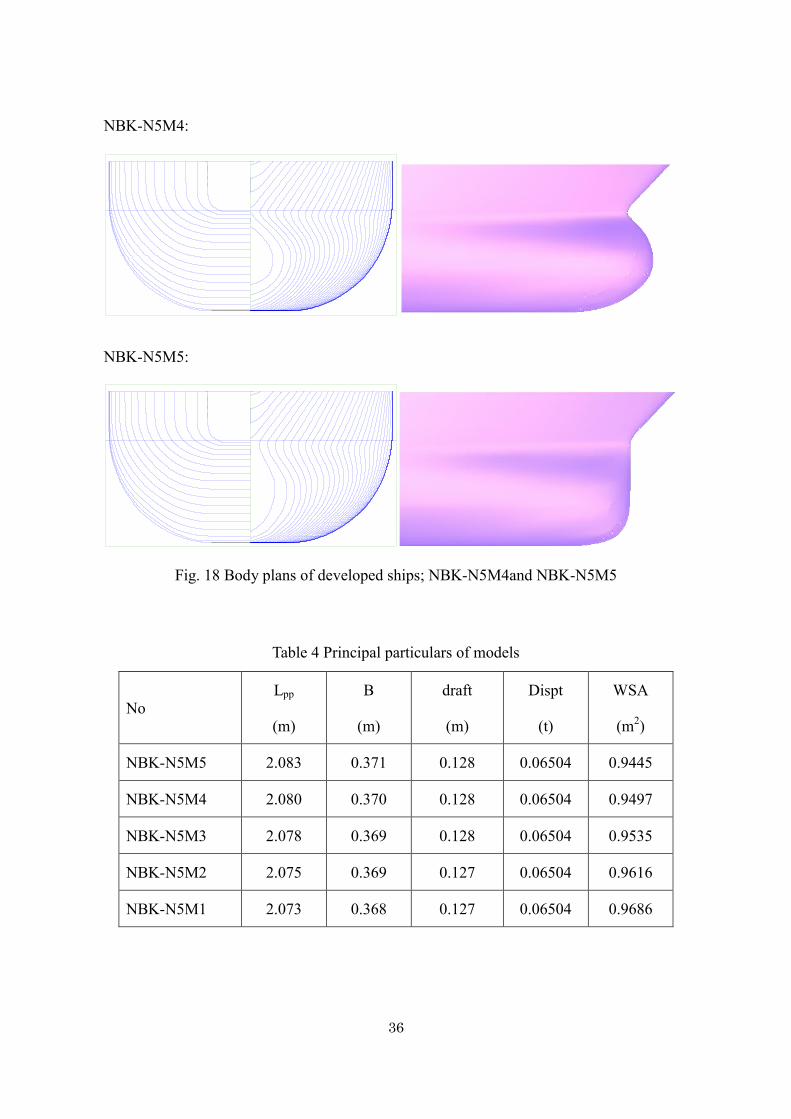
Fig. 18 Body plans of developed ships; NBK-N5M4and NBK-N5M5 36
Fig. 19 Calculated total resistances of new ships in calm water; NBK-N5M1,
NBK-N5M2
37
Fig. 20 Calculated total resistances of new ships in calm water; NBK-N5M3,
NBK-N5M4 and NBK-N5M5
37

10
Fig. 21 Calculated results of total resistances in waves at Fn=0.163;
Hw=0.02m; NBS-original, NBK-N5M1, NBK-N5M2 and NBK-N5
37
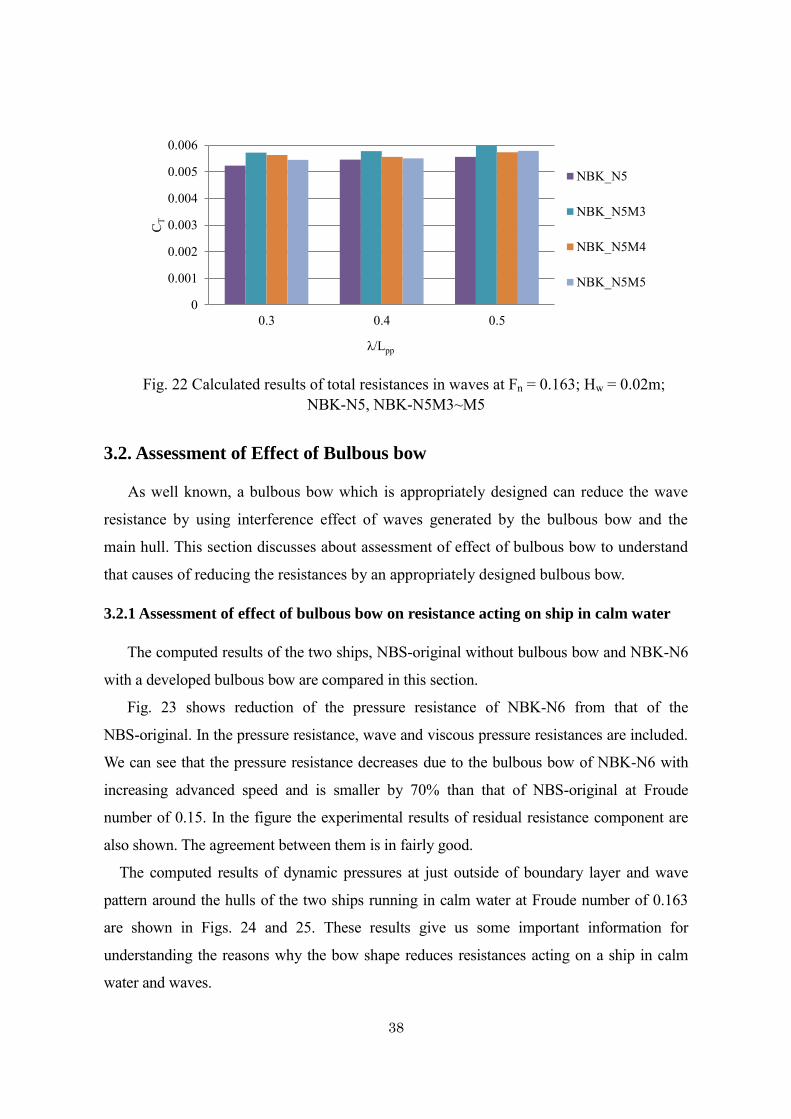
Fig. 22 Calculated results of total resistances in waves at Fn=0.163; Hw=0.02m; NBK-N5, NBK-N5M3~M5
38
Fig. 23 Ratio of pressure resistances coefficients for NBK-N6 and
NBS-original in calm water
39
Fig. 24 Dynamic pressure distributions over half-front hulls surface of the
ships at Fn = 0.163 in calm water.
39
Fig. 25 Calculated wave patterns at free surface of ships at Fn=0.163 in calm
water
40
Fig. 26 Experiment of wave patterns near bow of ships at Fn=0.163 in calm
water
40
Fig. 27 Profiles of wave generated by ships at y/Lpp=0; Fn=0.163 in calm
water
41
Fig. 28 Profiles of wave generated by ships at y/Lpp=0.09; Fn =0.163 in calm
water
41
Fig. 29 Dynamic pressure distributions on half-front hulls surface the ships 42
Fig. 30 Waves patterns on free surface in regular head waves, Hw =0.02m,
λ/Lpp= 0.3 at Fn= 0.163
44
Fig. 31 Wave profiles at free surface near bow at y/B = 0, in regular head
waves, Hw =0.02m, λ/Lpp = 0.3 at Fn = 0.163
45
Fig. 32 Wave profiles at free surface near bow at y/B=0.5 in waves,
Hw =0.02m, λ/Lpp = 0.3 at Fn =0.163
46
Fig. 33 Calculated results of added resistances in regular head waves with Hw = 0.02m, λ/Lpp<0.6 at Fn=0.163
47
Fig. 34 Experimental models of the ships 49
Fig. 35 Comparison between experimental results and CFD results of total
resistances acting on hull of NBK-N5 in calm water
50
Fig. 36 Comparison in total resistances acting on hulls between NBK-N5 and
NBS-original in calm water
50
Fig. 37 Comparison in total resistances acting on hull of NBK-N5 between
CFD results and experimental one, in regular head waves
51
Fig. 38 Comparison in added resistances acting on hulls of NBK-N5 and 51
11
NBS-original between CFD and experimental results in waves
Fig. 39 Comparison in total resistances acting on hulls of NBK-N5 and
NBS-original between CFD results and experimental one, in regular
head waves
52
Fig. 40 Profiles of bow shapes of the ships, NBS-original, NBK-6 and
NBK-N5
55
Fig. 41 Bow shapes of the ships, NBS-original, NBK-N6 and NBK-N5 55
Fig. 42 Wave patterns at free surfaces at the moment time 0 in waves,
Hw=0.04m, λ/Lpp=0.3, Fn=0.163
56
Fig. 43 Wave patterns at free surfaces at the moment time 0.25τw in waves,
Hw=0.04m, λ/Lpp=0.3, Fn=0.163
57
Fig. 44 Wave patterns at free surfaces at the moment time 0.5τw in waves,
Hw=0.04m, λ/Lpp=0.3, Fn=0.163
58
Fig. 45 Wave patterns at free surfaces at the moment time 0.75τw in waves,
Hw=0.04m, λ/Lpp=0.3, Fn=0.163
59
Fig. 46 Wave patterns at free surfaces at the moment time τw in waves,
Hw=0.04m, λ/Lpp=0.3, Fn=0.163
60
Fig. 47 Wave patterns at free surfaces at the moment time 0 in waves,
Hw=0.04m, λ/Lpp=0.6, Fn=0.163
61
Fig. 48 Wave patterns at free surfaces at the moment time 0.25τw in waves,
Hw=0.04m, λ/Lpp=0.6, Fn=0.163
62
Fig. 49 Wave patterns at free surfaces at the moment time 0.5τw in waves,
Hw=0.04m, λ/Lpp=0.6, Fn=0.163
63
Fig. 50 Wave patterns at free surfaces at the moment time 0.75τw in waves,
Hw=0.04m, λ/Lpp=0.6, Fn=0.163
64
Fig. 51 Wave patterns at free surfaces at the moment time τw in waves,
Hw=0.04m, λ/Lpp=0.6, Fn=0.163
65
Fig. 52 Profiles of wave around bow when wave crest is at the bow
(t=0.25τw), Hw=0.04m, λ/Lpp=0.3, Fn=0.163
66
Fig. 53 Profiles of wave around bow at time 0.75τw, Hw=0.04m, λ/Lpp=0.3,
Fn=0.163
67
Fig. 54 Profiles of wave around bow when wave crest is at the bow 68

12
(t=0.25τw), Hw=0.04m, λ/Lpp=0.4, Fn=0.163
Fig. 55 Profiles of wave around bow when wave trough is at the bow
(t=0.75τw), Hw=0.04m, λ/Lpp=0.4, Fn=0.163
69
Fig. 56 Profiles of wave around bow when wave crest is at the bow
(t=0.25τw), Hw=0.04m, λ/Lpp=0.6, Fn=0.163
70
Fig. 57 Profiles of wave around bow when wave trough is at the bow
(t=0.75τw), Hw=0.04m, λ/Lpp=0.6, Fn=0.163
71
Fig. 58 Dynamic pressure distributions at the moment time 0 in waves,
Hw=0.04m, λ/Lpp=0.3, Fn=0.163
73
Fig. 59 Dynamic pressure distributions at the moment time 0.25τw in waves,
Hw=0.04m, λ/Lpp=0.3, Fn=0.163
74
Fig. 60 Dynamic pressure distributions at the moment time 0.5τw in waves,
Hw=0.04m, λ/Lpp=0.3, Fn=0.163
75
Fig. 61 Dynamic pressure distributions at the moment time 0.75τw in waves,
Hw=0.04m, λ/Lpp=0.3, Fn=0.163
76
Fig. 62 Dynamic pressure distributions at the moment time τw in waves,
Hw=0.04m, λ/Lpp=0.3, Fn=0.163
77
Fig. 63 Dynamic pressure distributions at the moment time 0 in waves,
Hw=0.04m, λ/Lpp=0.6, Fn=0.163
78
Fig. 64 Dynamic pressure distributions at the moment time 0.25τw in waves,
Hw=0.04m, λ/Lpp=0.6, Fn=0.163
79
Fig. 65 Dynamic pressure distributions at the moment time 0.5τw in waves,
Hw=0.04m, λ/Lpp=0.6, Fn=0.163
80
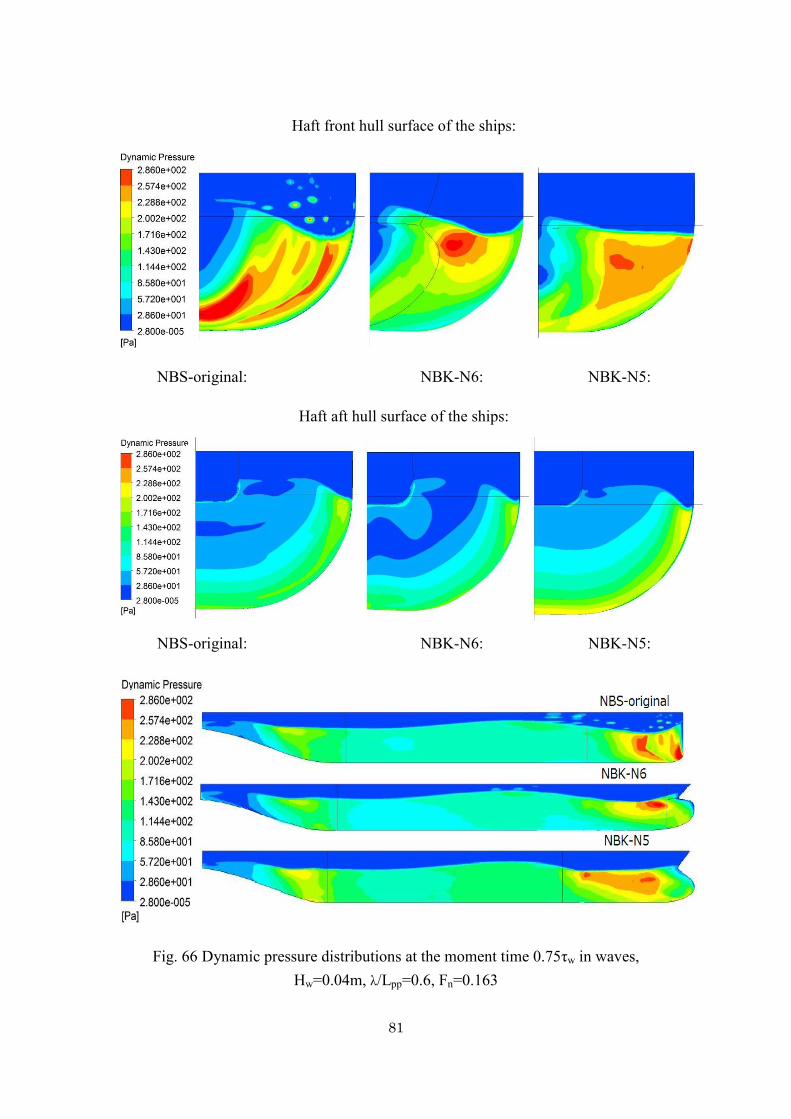
Fig. 66 Dynamic pressure distributions at the moment time 0.75τw in waves,
Hw=0.04m, λ/Lpp=0.6, Fn=0.163
81
Fig. 67 Dynamic pressure distributions at the moment time τw in waves,
Hw=0.04m, λ/Lpp=0.6, Fn=0.163
82
Fig. 68 Contours of dynamic pressure at the center planes of fluid domain, at
the moment time 0 in waves, Hw=0.04m, λ/Lpp=0.3, Fn=0.163
83
Fig. 69 Contours of dynamic pressure at the center planes of fluid domain, at
the moment time 0.25τw in waves, Hw=0.04m, λ/Lpp=0.3, Fn=0.163
84
Fig. 70 Contours of dynamic pressure at the center planes of fluid domain, at 85
13
the moment time 0.5τw in waves, Hw=0.04m, λ/Lpp=0.3, Fn=0.163
Fig. 71 Contours of dynamic pressure at the center planes of fluid domain, at
the moment time 0.75τw in waves, Hw=0.04m, λ/Lpp=0.3, Fn=0.163
86
Fig. 72 Contours of dynamic pressure at the center planes of fluid domain, at
the moment time τw in waves, Hw=0.04m, λ/Lpp=0.3, Fn=0.163
87
Fig. 73 Contours of dynamic pressure at the center planes of fluid domain, at
the moment time 0 in waves, Hw=0.04m, λ/Lpp=0.6, Fn=0.163
88
Fig. 74 Contours of dynamic pressure at the center planes of fluid domain, at
the moment time 0.25τw in waves, Hw=0.04m, λ/Lpp=0.6, Fn=0.163
89
Fig. 75 Contours of dynamic pressure at the center planes of fluid domain, at
the moment time 0.5τw in waves, Hw=0.04m, λ/Lpp=0.6, Fn=0.163
90
Fig. 76 Contours of dynamic pressure at the center planes of fluid domain, at
the moment time 0.75τw in waves, Hw=0.04m, λ/Lpp=0.6, Fn=0.163
91
Fig. 77 Contours of dynamic pressure at the center planes of fluid domain, at
the moment time τw in waves, Hw=0.04m, λ/Lpp=0.6, Fn=0.163
92
Fig. 78 Velocity distributions in boundary layer at centerline of AP of the
ships in calm water at Fn=0.163
93
Fig. 79 Velocity distributions in boundary layer at centerline of AP in one
circle wave of NBS-original running in regular head wave at
Fn=0.163, Hw=0.04m, λ/Lpp=0.6
94
Fig. 80 Velocity distributions in boundary layer at centerline of AP in one
circle wave of NBK-N6 running in regular head wave at Fn=0.163,
Hw=0.04m, λ/Lpp=0.6
94
Fig. 81 Velocity distributions in boundary layer at centerline of AP in one
circle wave of NBK-N5 running in regular head wave at Fn=0.163,
Hw=0.04m, λ/Lpp=0.6
95
Fig. 82 Computation and measurement of added wave resistances coefficient
acting on the ships in high waves, λ/Lpp=0.6 at Froude number 0.163
96
Fig. 83 Computation and measurement of added wave resistances coefficient
acting on the ships in high waves, λ/Lpp=0.6 at Froude number 0.163
97
Fig. 84 Computation and measurement of total resistances coefficient acting
on the ships in high waves, λ/Lpp=0.6 at Froude number 0.163
97
14
Fig. 85 Computation and measurement of ratio of total resistances coefficient
in waves by total resistance coefficient in calm water of the ships,
λ/Lpp=0.6 at Fn=0.163
98
Fig. 86 Box shapes accommodations, N1~7 101
Fig. 87 Contour of dynamic pressure at center plane of N1 102
Fig. 88 Streamlined accommodation NS 104
Fig. 89 Contour of dynamic pressure at center plane of streamlined
accommodation
105
Fig. 90 Modified box shape accommodation from N7 105
Fig. 91 Accommodation with horizontal step in the front 107
Fig. 92 Modification of rear part of accommodation 108
Fig. 93 Contour of dynamic pressure at center plane of N7-3 110
Fig. 94 Dynamic pressure distribution around N7-3.4.1.1.1 110
Fig. 95 Locations of an accommodation on deck 111
Fig. 96 Contour of dynamic pressure at center plane of the ship, P1~2 112
Fig. 97 Contour of dynamic pressure at center plane of the ship, P3~5 113
Fig. 98 Contour of dynamic pressure at center plane of the ship, P6~6 114
Fig. 99 Contour of dynamic pressure at center plane of the ship, P9~11 115
Fig. 100 Contour of velocity around hull of ship at center plane of domain 116
Fig. 101 Hull and accommodation model N7-3 117
Fig. 102 Hull and accommodation model N7-3.4.1.1.1 117
Fig. 103 Hull and streamline accommodation NS. 117
Fig. 104 Contour of dynamic pressure at center plane and at vertical plane
z=0.125m of ship with accommodation N7-3
118
Fig. 105 Contour of dynamic pressure at center plane and at vertical plane
z=0.125m of ship with accommodation N7-3.4.1.1.1 and NS
119
Fig. 106 Contour of velocity around hull of ship at center plane and at vertical
plane z=0.125m of ship with accommodation N7-3
120
Fig. 107 Contour of velocity around hull of ship at center plane and at vertical
plane z=0.125m of ship with accommodation N7-3.4.1.1.1
120
Fig. 106 Contour of velocity around hull of ship at center plane and at vertical
plane z=0.125m of ship with streamlined accommodation NS
121

15
List of Table
Table 1 Principal particular of two models 21
Table 2 Principal particulars of models 31
Table 3 Principal particulars of models 33
Table 4 Principal particulars of models 36
Table 5 Principal particulars of the experimental models of ships 49
Table 6 Dimensions of box shape accommodation, N1 101 Table 7 A comparison of air resistance between CFD result and
experimental one 102
Table 8 Dimensions of modified box shape accommodation 103
Table 9 Dimensions of modified box shape accommodation 103
Table 10 Calculated air resistances acting on new accommodations, N2~N7 103
Table 11 Dimensions of streamlined accommodation, NS 104
Table 12 Calculated air resistances acting on accommodations, N1 and NS 105
Table 13 Dimension of new box shapes accommodations 106
Table 14 Calculated air resistance acting on accommodation 106
Table 15 Dimensions of accommodations, N7-3.1~3.5 107
Table 16 Calculated air resistance 107
Table 17 Dimensions of new box shapes accommodations 108
Table 18 Calculated air resistance acting on accommodation 108
Table 19 Dimensions of models with different rear parts 109
Table 20 Calculated air resistance acting on accommodation 109
Table 21 Dimensions of models with different rear parts 109
Table 22 Calculated air resistance acting on accommodation 109 Table 23 Effect of location of accommodation on air resistance acting on
ships 111
Table 24 Interaction effects between accommodation and hull on air resistance
112
Table 25 Calculated air resistance 118
Table 26 Interaction effects between hull and accommodation 118

16

17
CHAPTER 1:
INTRODUCTION
For long time, model experiments in towing tanks have been playing important roles in
developing innovative ship shapes. Because ship hydrodynamics are very complex due to
waves generated on free surface between water and air, viscosity of water, vortex shedding
flow and so on, very sophisticated experimental methods to grasp hydrodynamic
performance of a ship have been established. The methods of model experiences, however,
are not suitable to optimize ship shapes because a lot of models and huge numbers of tests
are needed. To overcome the problem, for these thirty years, many researchers in Naval
Architecture field have worked on developing theoretical methods, called as Computation
of Fluid Dynamic (CFD), to solve the Navier Stokes Equation for a ship. In CFD, ship
shapes can be easily changed and the hydrodynamic forces acting on many ship shapes can
be calculated. Then optimization of ship shapes can be carried out faster and cheaper than
model experiments which are expensive and consume a lot of time. Now a day, CFD
becomes a popular and powerful tool for developing and designing ships. Many
commercial codes of CFD are distributed, and some of them can be applied to calculate
hydrodynamic forces acting on ships.
Previous works on application of CFD to hydrodynamic performance of ships in these
several years are as follows: Y. Ahmed et al, 2009 presented results of the incompressible
free surface flow around the VLCC hull form at Froude number 0.1285 by used CFD code
“ANSYS-CFX” and the potential flow code Kelvin. The authors concluded that predicted
results of wave pattern and resistance between two codes are good agreement for the
VLCC hull. Dc-cheng Wan et al, 2010 proposed a numerical simulation of viscous flows
around surface ship by a level set method. In the paper, numerical simulations of viscous
flows around a Wigley hull by coupling the 3D incompressible Reynolds Averaged Navier
Stokes Simulation (RANS) equations with a level set method had simulated, the authors
used turbulent viscous model k-ɷ with the Shear Stress Transport formulation (SST) and

18
concluded that the simulated results of viscous flows around a Wigley hull are in good
agreement with experimental results. Y.M. Ahmed, 2011, presented results of
incompressible turbulent free surface around the hull form of the DTMB 5415 at two
speeds by using CFD code “ANSYS-CFX” with RANS method, and used Volume of Fluid
(VOF) turbulent viscous model k-ɛ. The author concluded that turbulent free surface flow
around DTMB 5415 at two Froude number are in agreement with experimental data. C.
Ciortan et al, 2012, developed a free surface, turbulent flow code by using the slightly
compressible flow formulation, and tested flow around the hull of Wigley ship. The authors
concluded that simulated results are in good agreement with experimental one. Zhi-rong
Zhang et al, 2006, applied CFD code with RANS formulations for simulated viscous free
surface flow along the hull of Series 60 (Cb=0.6) at several Froude number and wake flow
of a complex surface hull with various appendages. The authors concluded that CFD
results of series 60 are good agreement with experimental results. Bing-jie Guo et al, 2011,
evaluated added resistance of KVLCC2 in short and head waves by CFD. Shukui Liu et al,
2011, used a established frequency domain 3D panel method and a new hybrid time
domain Rankine source Green function method to predict the added resistance of the ship
and tested on the hulls of Wigley ship, Series 60 (Cb=0.6) and S-175 container ship.
Haixuan Ye et al, 2012, presented results of the numerical prediction of added resistance
and vertical ship motions of the hull of S-175 container ship in regular head wave by used
RANS formulation. Bing-jie Guo et al, 2012, predicted the added resistance of KVLCC2
hull in regular head waves by using CFD with RANS. And, H.S. Hosseini et al, 2013,
applied CFD to predict added resistance, ship motion and wake flow of the KVLCC2 hull
in regular waves. Almost all of the papers concluded that CFD could predict the
performance of the ships (Wigley, KVLCC2, DTMB 5415 and Series 60) with high
accuracy. It was also concluded that pressure resistance dominates in the ship resistance in
waves, and the frictional resistance due to waves is small.
In the present study, a commercial CFD code “Fluent” is applied to calculations of
hydrodynamic performance of ships in calm water, in head waves and in head winds.
Model experiments are indispensable to validate the computed results by CFD. In CFD
simulations the simulated results must be regularly tested by the corresponding
experiments because CFD sometimes gives wrong results under inappropriate calculation
conditions. Therefore some experiments to measure resistances acting on ships in calm
19
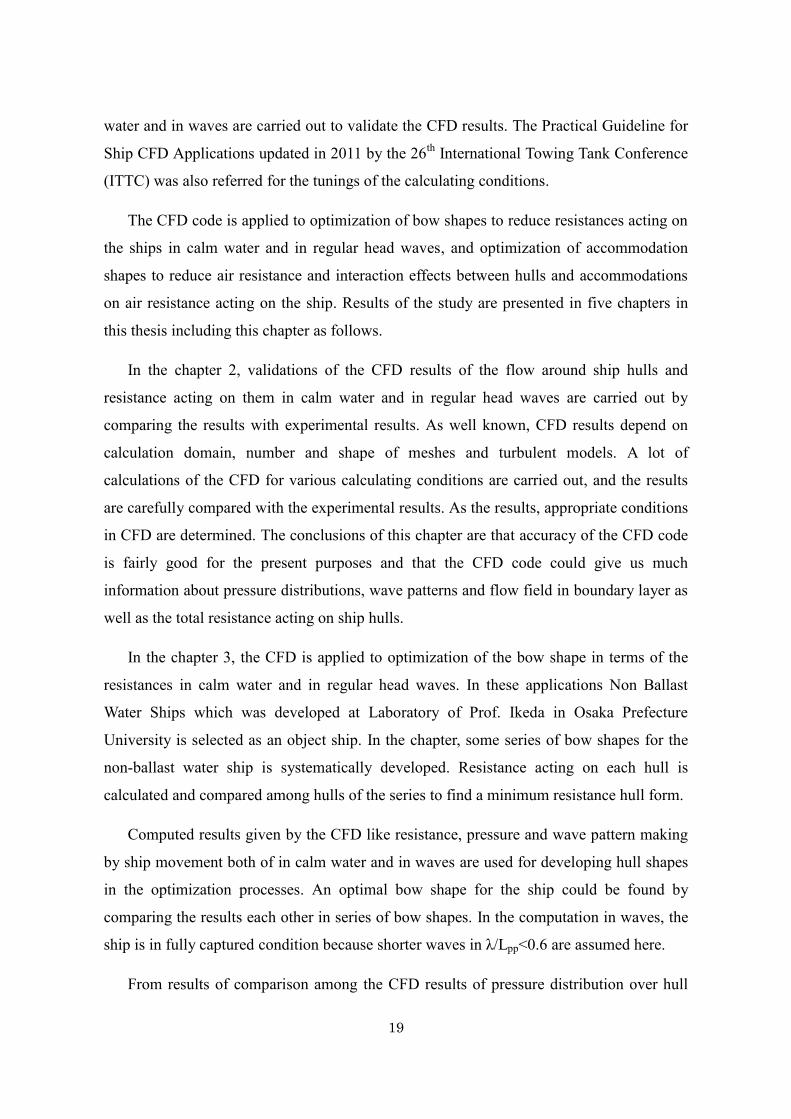
water and in waves are carried out to validate the CFD results. The Practical Guideline for
Ship CFD Applications updated in 2011 by the 26th International Towing Tank Conference
(ITTC) was also referred for the tunings of the calculating conditions.
The CFD code is applied to optimization of bow shapes to reduce resistances acting on
the ships in calm water and in regular head waves, and optimization of accommodation
shapes to reduce air resistance and interaction effects between hulls and accommodations
on air resistance acting on the ship. Results of the study are presented in five chapters in
this thesis including this chapter as follows.
In the chapter 2, validations of the CFD results of the flow around ship hulls and
resistance acting on them in calm water and in regular head waves are carried out by
comparing the results with experimental results. As well known, CFD results depend on
calculation domain, number and shape of meshes and turbulent models. A lot of
calculations of the CFD for various calculating conditions are carried out, and the results
are carefully compared with the experimental results. As the results, appropriate conditions
in CFD are determined. The conclusions of this chapter are that accuracy of the CFD code
is fairly good for the present purposes and that the CFD code could give us much
information about pressure distributions, wave patterns and flow field in boundary layer as
well as the total resistance acting on ship hulls.
In the chapter 3, the CFD is applied to optimization of the bow shape in terms of the
resistances in calm water and in regular head waves. In these applications Non Ballast
Water Ships which was developed at Laboratory of Prof. Ikeda in Osaka Prefecture
University is selected as an object ship. In the chapter, some series of bow shapes for the
non-ballast water ship is systematically developed. Resistance acting on each hull is
calculated and compared among hulls of the series to find a minimum resistance hull form.
Computed results given by the CFD like resistance, pressure and wave pattern making
by ship movement both of in calm water and in waves are used for developing hull shapes
in the optimization processes. An optimal bow shape for the ship could be found by
comparing the results each other in series of bow shapes. In the computation in waves, the
ship is in fully captured condition because shorter waves in λ/Lpp<0.6 are assumed here.
From results of comparison among the CFD results of pressure distribution over hull

20
surface, wave patterns making by the ships running in calm water and in regular head
waves, and added resistance acting on the ships, the assessments of effect of bulbous bow
on resistance acting on the ships in calm water and in regular head waves are carried out.
The calculated resistances acting on the hull with the optimum bulbous bow are compared
with the experimental results to show that the optimization method used by the commercial
CFD code in this thesis is valid.
In the chapter 4, the CFD is used to reveal the characteristics of the added resistance
due to high waves. The effect of wave height on the added resistance due to waves is
clarified. Three kinds of bow shapes of the ship which were developed at previous chapter,
NBS-original without bulbous bow, improved bulbous bow shape NBK-N6 and optimum
bow shape NBK-N5, added resistances acting on them are computed in higher regular head
waves. The range of waves height is in 0.02~0.07m for the 2m model, and the ratio of
wave length to ship length is smaller than 0.6 (λ/Lpp<0.6). By comparing the computed
results of pressure, wave pattern and resistance acting on hull among three ships, the best
bow shape for ships in high waves is found. Measurements of resistance acting on the three
ships in high waves are carried out and the experimental results are compared with those of
CFD results.
In the chapter 5, air resistance acting on ships is computed by the CFD to find the
optimum shape above water surface with minimum air resistance. At first, air resistances
acting on some kinds of accommodations shapes of ships are investigated. By comparison
among the calculated results of pressure distribution and air resistances acting on the
accommodations, an optimum accommodation shape is found. And then, air resistance
acting on a hull with an accommodation on its deck is computed. From the calculated
results of air resistances acting on the hull, the accommodation and the hull with the
accommodation on the deck, the interaction effects between hulls and accommodations are
clarified. By comparison among the calculated results of air resistance each other, the best
location of an accommodation on the deck and the best shape of accommodations with the
smallest air resistance are found. The computed results suggest that interaction effects
between the hull and the accommodation of a ship on its air resistance are important.
In the chapter 6, the conclusions obtained in the present study are summarized.

21
CHAPTER 2:
VALIDATION OF THE CFD
2.1 Model ships using for validation
In this chapter, accuracy of CFD results is validated by comparing the calculated results
with experimental results at towing tank of Osaka Prefecture University. Resistance acting
on a hull of a ship in calm water as well as in regular head waves, and velocity distribution
in boundary layer of ship are validated.
Figs. 1 and 2 show the models of Non Ballast Water ships using for validating the CFD
code. One is a simple bow shape without bulbous bow named as “NBS original”, and
another one is the improved one, named as “NBK-N6”, with large bulbous bow to reduce
the wave resistance in calm water. NBS means Non Ballast-water Ship and NBK means
Non Ballast Tankers and Bulkers which was developed at Ikeda’s Lab. These ships have
the same stern shape but different bow shapes. Table 1 shows the principal particulars of
them.
Table 1 Principal particular of two models
No NBS-original NBK-N6
Length, Lpp (m) 2.000 2.000
Breadth, B (m) 0.359 0.355
Draft (m) 0.131 0.131
Displacement, Dispt (ton) 0.06504 0.06388
Wetted surface area, WSA (m2) 0.921 0.925

22
Fig. 1 Body plan of the simple hull form, named as NBS -original, without bulbous bow
Fig. 2 Body plan of improved hull form, NBK-N6 with developed bulbous bow to reduce
the wave resistance in calm water

23
2.2 Boundary condition and meshing of fluid domain for calculation
For the CFD calculations, a larger domain of fluid is better but causes longer computing time. Therefore, an appropriate domain of fluid should be selected for matching the ability of processor. The practical guideline for ship CFD applications updated in 2011 by the 26th International Towing Tank Conference (ITTC) is referred for the tunings of calculating conditions. Since the experiments for the comparisons in this thesis were carried out for 2m models, the domain of fluid is determined in 10m of length, 2.6m of breadth and 1.5m of depth. Meshing of this domain is done in structure mesh with 1.6 million Hex- Grid, the value of y+ is about 50~250 and the smallest quality of mesh is about 0.4. Meshing and fluid domain are shown in Fig. 3.
In computations, a commercial CFD code “Fluent” is used. The Volume of Fluid model
(VOF) k- for unsteady flow is used. For VOF problem in calm water condition, the
conditional boundary is setup with the pressure inlet at the inlet, the pressure outlet at the
outlet. In computing condition with regular head waves, at the inlet is setup with velocity
inlet, and opening channel condition with regular head wave is setup at free surface of
calculating fluid domain. The problem is simulated in unsteady flow, and two phases of air
and water are set. The target of residual convergence is set at 105 for this problem.
Fig. 3 Fluid domain and meshing
24
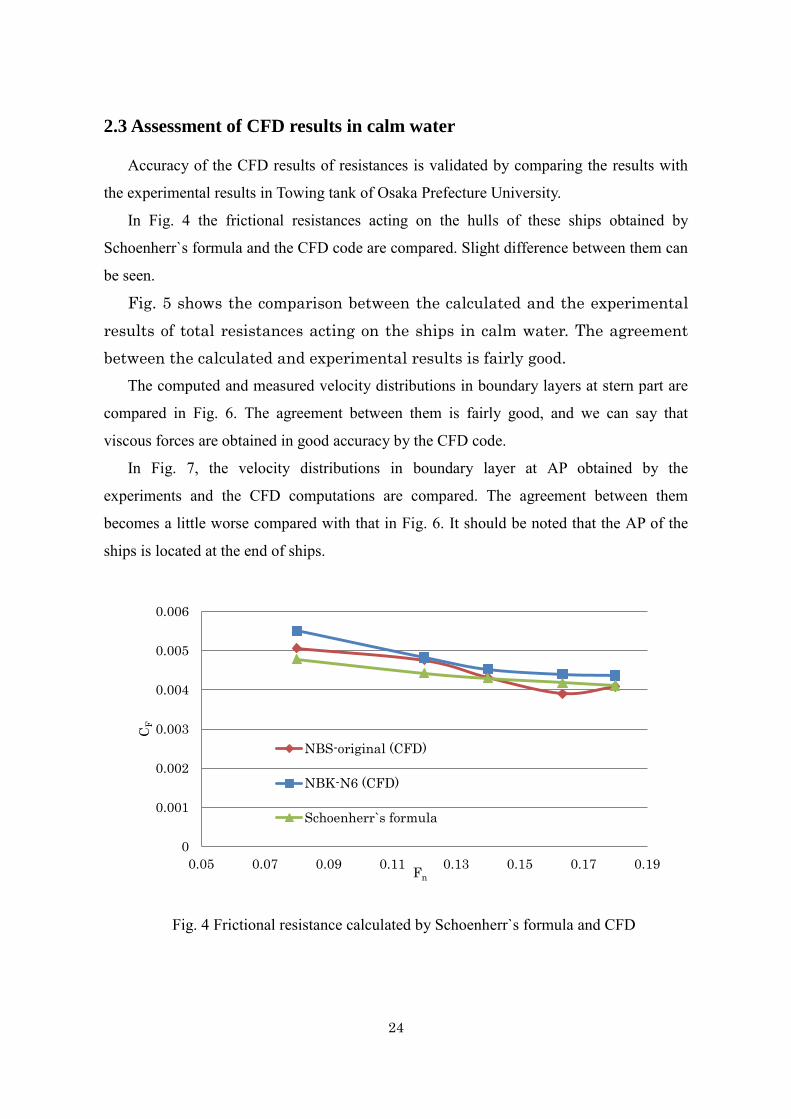
2.3 Assessment of CFD results in calm water
Accuracy of the CFD results of resistances is validated by comparing the results with
the experimental results in Towing tank of Osaka Prefecture University.
In Fig. 4 the frictional resistances acting on the hulls of these ships obtained by
Schoenherr`s formula and the CFD code are compared. Slight difference between them can
be seen.
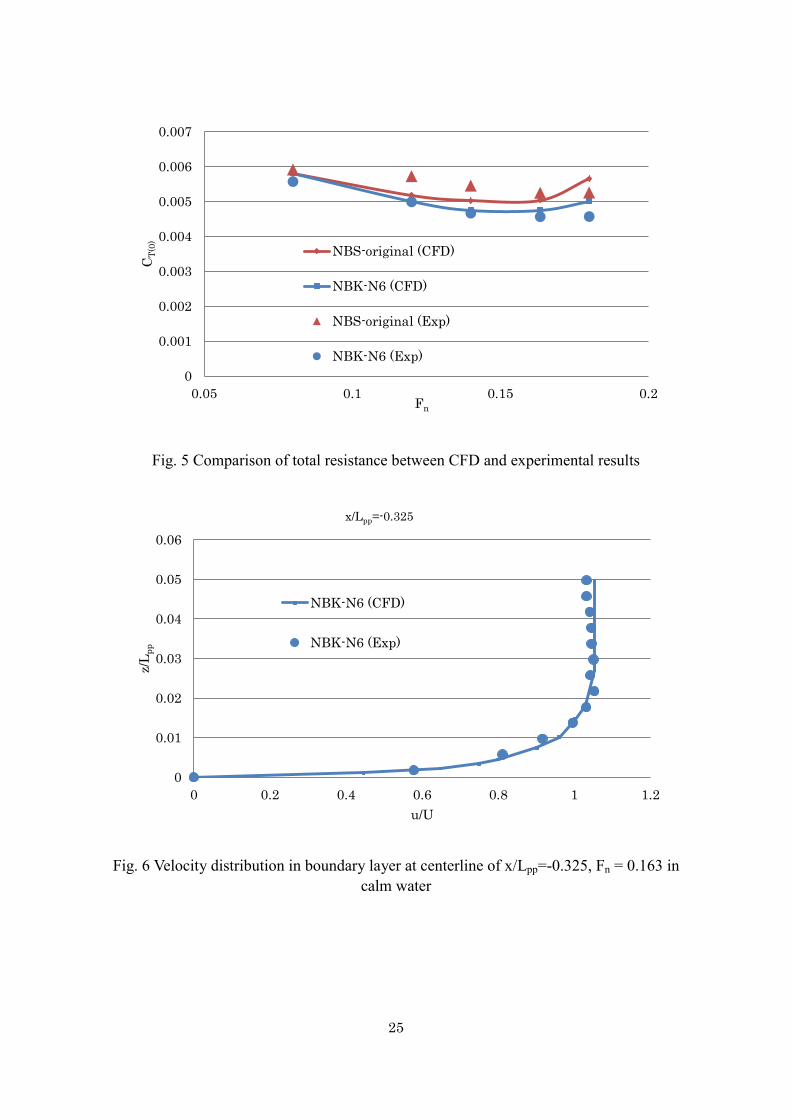
Fig. 5 shows the comparison between the calculated and the experimental
results of total resistances acting on the ships in calm water. The agreement
between the calculated and experimental results is fairly good.
The computed and measured velocity distributions in boundary layers at stern part are
compared in Fig. 6. The agreement between them is fairly good, and we can say that
viscous forces are obtained in good accuracy by the CFD code.
In Fig. 7, the velocity distributions in boundary layer at AP obtained by the
experiments and the CFD computations are compared. The agreement between them
becomes a little worse compared with that in Fig. 6. It should be noted that the AP of the
ships is located at the end of ships.
Fig. 4 Frictional resistance calculated by Schoenherr`s formula and CFD
0
0.001
0.002
0.003
0.004
0.005
0.006
0.05 0.07 0.09 0.11 0.13 0.15 0.17 0.19
CF
Fn
NBS-original (CFD)
NBK-N6 (CFD)
Schoenherr`s formula
25
Fig. 5 Comparison of total resistance between CFD and experimental results
Fig. 6 Velocity distribution in boundary layer at centerline of x/Lpp=-0.325, Fn = 0.163 in
calm water
0
0.001
0.002
0.003
0.004
0.005
0.006
0.007
0.05 0.1 0.15 0.2
CT
(0)
Fn
NBS-original (CFD)
NBK-N6 (CFD)
NBS-original (Exp)
NBK-N6 (Exp)
0
0.01
0.02
0.03
0.04
0.05
0.06
0 0.2 0.4 0.6 0.8 1 1.2
z/L
pp
u/U
x/Lpp=-0.325
NBK-N6 (CFD)
NBK-N6 (Exp)

26
Fig. 7 Velocity distribution in boundary layer at centerline of AP; x/Lpp=-0.5 at Fn=0.163
in calm water
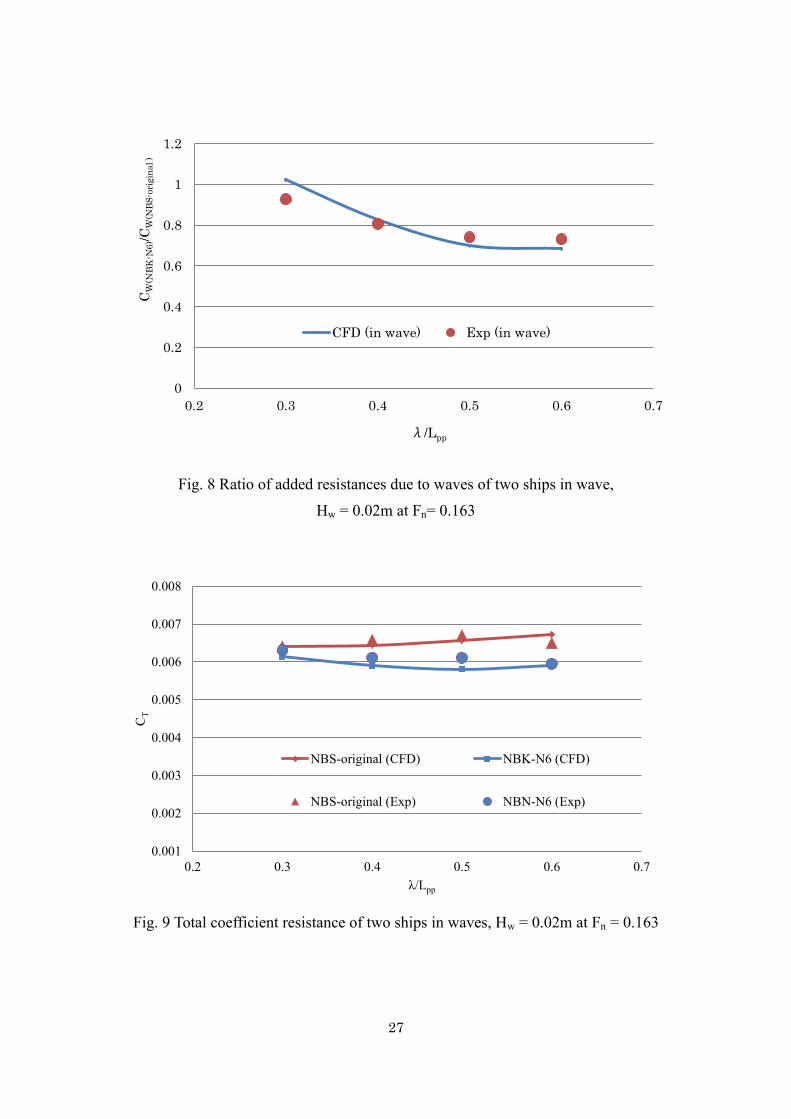
2.4 Assessment of CFD results in regular waves
In this section, accuracy of the calculated results by the CFD code in regular head
waves will be assessed by comparing the calculated results for the two models with
experimental results measured by the author. The incident waves are shorter and regular
head ones (λ/Lpp<0.6) and the wave height is Hw=0.02m for 2m models of them. Froude
number is 0.163.
In Figs 8 and 9, the calculated and experimental results of resistances are shown in
terms of a ratio of resistance coefficients of NBK-N6 to that of NBS-original model. The
results show that agreement between CFD results and experimental results of total
resistance of ship in regular head waves is fairly good. Added resistance acting on the ship
in regular waves could reduce about by 25% by the developed bulbous bow of NBK-N6.
0
0.01
0.02
0.03
0.04
0.05
0.06
0.07
0 0.2 0.4 0.6 0.8 1 1.2
z/L
pp
u/U
x/Lpp=-0.5
NBK-N6 (Exp)
NBK-N6 (CFD)
27
Fig. 8 Ratio of added resistances due to waves of two ships in wave,
Hw = 0.02m at Fn= 0.163
Fig. 9 Total coefficient resistance of two ships in waves, Hw = 0.02m at Fn = 0.163
0
0.2
0.4
0.6
0.8
1
1.2
0.2 0.3 0.4 0.5 0.6 0.7
CW
(NB
K-N
6)/C
W(N
BS
-ori
gin
al )
λ/Lpp
CFD (in wave) Exp (in wave)
0.001
0.002
0.003
0.004
0.005
0.006
0.007
0.008
0.2 0.3 0.4 0.5 0.6 0.7
CT
λ/Lpp
NBS-original (CFD) NBK-N6 (CFD)
NBS-original (Exp) NBN-N6 (Exp)

28
2.5 Conclusions of the chapter 2
- It is confirmed that a commercial CFD code “Fluent” gives us fairly good results of
the resistance acting on a ship hull both in calm water and in regular head waves,
viscous flow in boundary layer around it in calm water.
- The frictional resistances computed by the CFD code and Schoenherr’s formula are
slightly different.
- The calculated results of the ratio of added resistance due to wave of two ships are
in good agreement with the experimental results.
- The improved bulbous bow shape of NBK-N6 could reduce by 10% of total
resistance in calm water and by 17% of total resistance in regular head waves with
the wave height Hw=0.02m and relative wave length λ/Lpp<0.6, in compared with
that of NBS-original. The results are close with the calculated results given by the
CFD code.
29
CHAPTER 3:
OPTIMIZATION OF BOW SHAPE
FOR NON BALLAST WATER SHIPS
3.1. Design parameters of optimum bulbous bow shape
In this chapter, at first the commercial CFD ‘Fluent’ is applied to optimization of the
bulbous-bow shape of the Non Ballast Water ship. And then, assessment of effects of
bulbous bow shape on reduction of resistances acting on a ship is discussed. Lastly,
predicted results given by the CFD are validated by comparing them with experimental
results.
For this section, the resistance acting on the ship in calm water and in regular head
waves is defined as the object function in the optimization process. Following features of
bulbous bow shapes are considered as design parameters that are volume of bulbous bow,
height of volume center, angle of bow bottom and length of bulbous bow.
3.1.1 Volume of bulbous bow
In this optimizing process, the original ship with a blunt simple bow, NBS-original,
which was developed in the research project to develop a non-ballast water ships at Ikeda’s
Lab of Osaka prefecture University is selected as the initial model. NBS-original was
experimentally confirmed to have some wave resistance in low Froude number, 0.15, and a
bulbous bow is needed to reduce the wave resistance. An optimum bulbous bow shape for
the ship is developed in the optimizing process by using the CFD. The stern of the ship is
the same as that of NBS-original for all ships. The length, breadth and draft of the ships
keep to be the same. The volume of the ships is slightly changed from NBS-original.
30
NBK-N1:
NBK-N2:
NBK-N3:
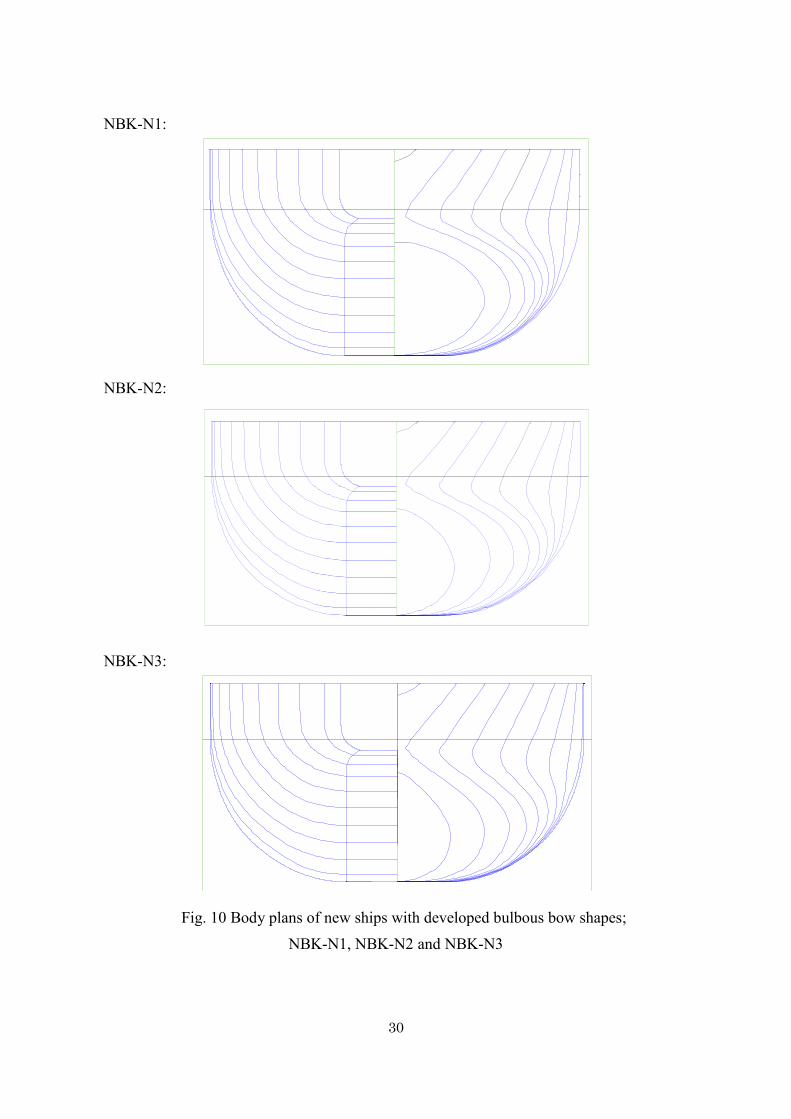
Fig. 10 Body plans of new ships with developed bulbous bow shapes;
NBK-N1, NBK-N2 and NBK-N3

31
Table 2 Principal particulars of models
No Lpp
(m)
B
(m)
draft
(m)
Dispt
(ton)
WSA
(m2)
NBK-N1 1.998 0.355 0.129 0.06445 0.9626
NBK-N2 1.998 0.355 0.130 0.06443 0.9539
NBK-N3 1.999 0.355 0.131 0.06469 0.9539
Fig. 10 shows the body plans of newly developed ships. The principal particulars of
them are shown in Table 2. The resistances acting on them are calculated by using the CFD
code. Total resistances acting on them running in calm water and in regular head waves are
shown in Figs. 11 and 12. In the calculation in waves, the ship is assumed to run in
constant speed in fully captured condition, or without any ship motions in waves because
the wave length is assumed to be short compared with the ship length.
The results shown in Fig. 11 demonstrate that the bulbous bow of NBK-N1 is too large
to decrease the wave resistance and NBK-N3 has minimum resistance in calm water.
The results in waves shown in Fig. 12 demonstrate that NBK-N3 has the minimum
resistance in shorter waves, λ/LPP=0.3 and 0.4, but NBK-N2 has smaller resistance than
NBK-N3 in λ/LPP=0.5 and 0.6. The results suggest that the optimum bulbous bow depends
on wave length of encounter waves.
Fig. 11 Calculated total resistance of new ship in calm water
0
0.001
0.002
0.003
0.004
0.005
0.006
0.007
0.14 0.163 0.18
CT(
0)
Fn
NBS-original
NBK-N1
NBK-N2
NBK-N3

32
Fig. 12 Calculated results of total resistance in wave at Fn = 0.163; Hw = 0.02m
3.1.2 Height of volume center and angle of bow bottom
In next step, the height of volume center of the bulbous bow and angle of bow bottom
line of the ships are changed from low to high as shown in Fig. 13. The NBK-N3 is the
best one in case of optimum volume of bow shape in calm water as shown in previous
section. Table 3 shows their principal particulars.
NBK-N3:
NBK-N4:
NBK-N5:
NBK-N6:
Fig. 13 Side profile of newly developed ships with different height of volume center and angle of bow bottom line
0
0.001
0.002
0.003
0.004
0.005
0.006
0.007
0.008
0.3 0.4 0.5 0.6
CT
λ/Lpp
NBS-original
NBK-N1
NBK-N2
NBK-N3

33
Table 3 Principal particulars of models
No Lpp
(m)
B
(m)
draft
(m)
Dispt
(ton)
WSA
(m2)
NBK-N4 1.999 0.355 0.131 0.06376 0.9383
NBK-N5 2.000 0.355 0.134 0.06455 0.9317
NBK-N6 2.000 0.355 0.131 0.06388 0.9250
Fig. 14 Calculated total resistance of new ship in calm water
Fig. 15 Calculated results of total resistance in wave at Fn = 0.163; Hw = 0.02m
0
0.001
0.002
0.003
0.004
0.005
0.006
0.14 0.163 0.18
CT(
0)
Fn
NBK-N3
NBK-N4
NBK-N5
NBK-N6
0
0.001
0.002
0.003
0.004
0.005
0.006
0.007
0.3 0.4 0.5 0.6
CT
λ/Lpp
NBK-N3
NBK-N4
NBK-N5
NBK-N6

34
Figs. 14 and 15 show the calculated results of resistance acting on them in calm water and in regular head waves. The calculated results of resistance in calm water shown in Fig.14 show that NBK-N6 is the best one at Froude number of 0.14 but that NBK-N5 is the best one at Froude number of 0.16 and 0.18. The optimum bow shape in waves depends on Froude number as well as in calm water.
In regular head waves, NBK-N5 has the minimum resistance in wave height, Hw, of 0.02m and in the wave length region of λ/Lpp<0.6 as shown in Fig. 15.
3.1.3 Length of bow
In next step, length of bow of NBK-N5, which has the minimum resistance hull form in previous optimum process, is changed. The volume of each newly developed ship keeps the same as that of NBK-N5. Figs 16~18 show the profiles on centerline of bows and body plans of them. Their principal particulars are shown in Table 4.
Figs 19~22 show the calculated results of resistance acting on newly developed ships in calm water and in regular head waves. The calculated results show that model named as NBK-N5 is the minimum resistance hull form in calm water and in regular head waves in this series.
Fig. 16 Profiles of bows developed ships; NBK-N5M1~M5
NBK
-N5M
5
NBK-N5M5NBK-N5M4NBK-N5M3
NBK-N5M1
NBK-N5M2NBK-N5
35
NBK-N5M1:
NBK-N5M2:
NBK-N5:
NBK-N5M3:
Fig. 17 Body plans of developed ships; NBK-N5M1~M3 and NBK-N5
36
NBK-N5M4:
NBK-N5M5:
Fig. 18 Body plans of developed ships; NBK-N5M4and NBK-N5M5
Table 4 Principal particulars of models
No Lpp
(m)
B
(m)
draft
(m)
Dispt
(t)
WSA
(m2)
NBK-N5M5 2.083 0.371 0.128 0.06504 0.9445
NBK-N5M4 2.080 0.370 0.128 0.06504 0.9497
NBK-N5M3 2.078 0.369 0.128 0.06504 0.9535
NBK-N5M2 2.075 0.369 0.127 0.06504 0.9616
NBK-N5M1 2.073 0.368 0.127 0.06504 0.9686

37
Fig. 19 Calculated total resistances of new ships in calm water; NBK-N5M1, NBK-N5M2
Fig. 20 Calculated total resistances of new ships in calm water; NBK-N5M3, NBK-N5M4
and NBK-N5M5
Fig. 21 Calculated results of total resistances in waves at Fn = 0.163; Hw = 0.02m; NBS-original, NBK-N5M1, NBK-N5M2 and NBK-N5
0
0.001
0.002
0.003
0.004
0.005
0.006
0.14 0.163 0.18
CT(
0)
Fn
NBS-original
NBK-N5M1
NBK-N5M2
NBK-N5
0
0.001
0.002
0.003
0.004
0.005
0.006
0.14 0.163 0.18
CT(
0)
Fn
NBK-N5
NBK-N5M3
NBK-N5M4
NBK-N5M5
0
0.001
0.002
0.003
0.004
0.005
0.006
0.007
0.008
0.3 0.4 0.5
CT
λ/Lpp
NBS-original
NBK_N5M1
NBK_N5M2
NBK_N5
38
Fig. 22 Calculated results of total resistances in waves at Fn = 0.163; Hw = 0.02m; NBK-N5, NBK-N5M3~M5
3.2. Assessment of Effect of Bulbous bow
As well known, a bulbous bow which is appropriately designed can reduce the wave
resistance by using interference effect of waves generated by the bulbous bow and the
main hull. This section discusses about assessment of effect of bulbous bow to understand
that causes of reducing the resistances by an appropriately designed bulbous bow.
3.2.1 Assessment of effect of bulbous bow on resistance acting on ship in calm water
The computed results of the two ships, NBS-original without bulbous bow and NBK-N6
with a developed bulbous bow are compared in this section.
Fig. 23 shows reduction of the pressure resistance of NBK-N6 from that of the
NBS-original. In the pressure resistance, wave and viscous pressure resistances are included.
We can see that the pressure resistance decreases due to the bulbous bow of NBK-N6 with
increasing advanced speed and is smaller by 70% than that of NBS-original at Froude
number of 0.15. In the figure the experimental results of residual resistance component are
also shown. The agreement between them is in fairly good.
The computed results of dynamic pressures at just outside of boundary layer and wave
pattern around the hulls of the two ships running in calm water at Froude number of 0.163
are shown in Figs. 24 and 25. These results give us some important information for
understanding the reasons why the bow shape reduces resistances acting on a ship in calm
water and waves.
0
0.001
0.002
0.003
0.004
0.005
0.006
0.3 0.4 0.5
CT
λ/Lpp
NBK_N5
NBK_N5M3
NBK_N5M4
NBK_N5M5
39
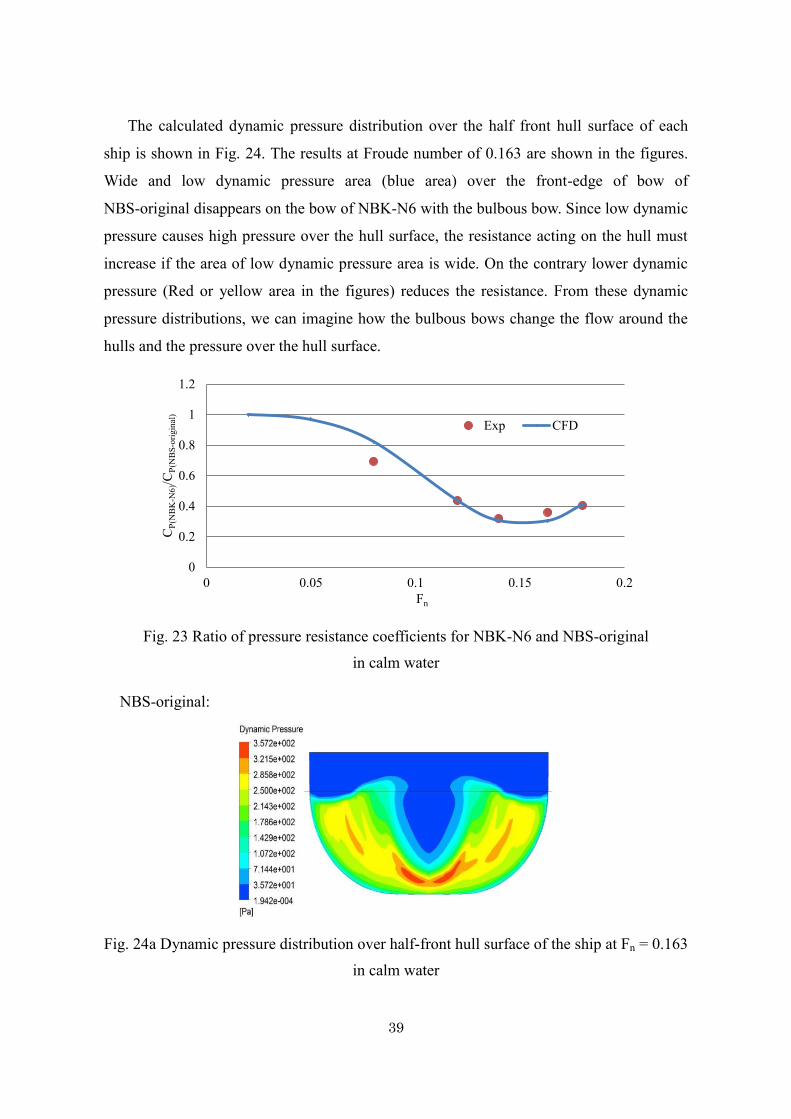
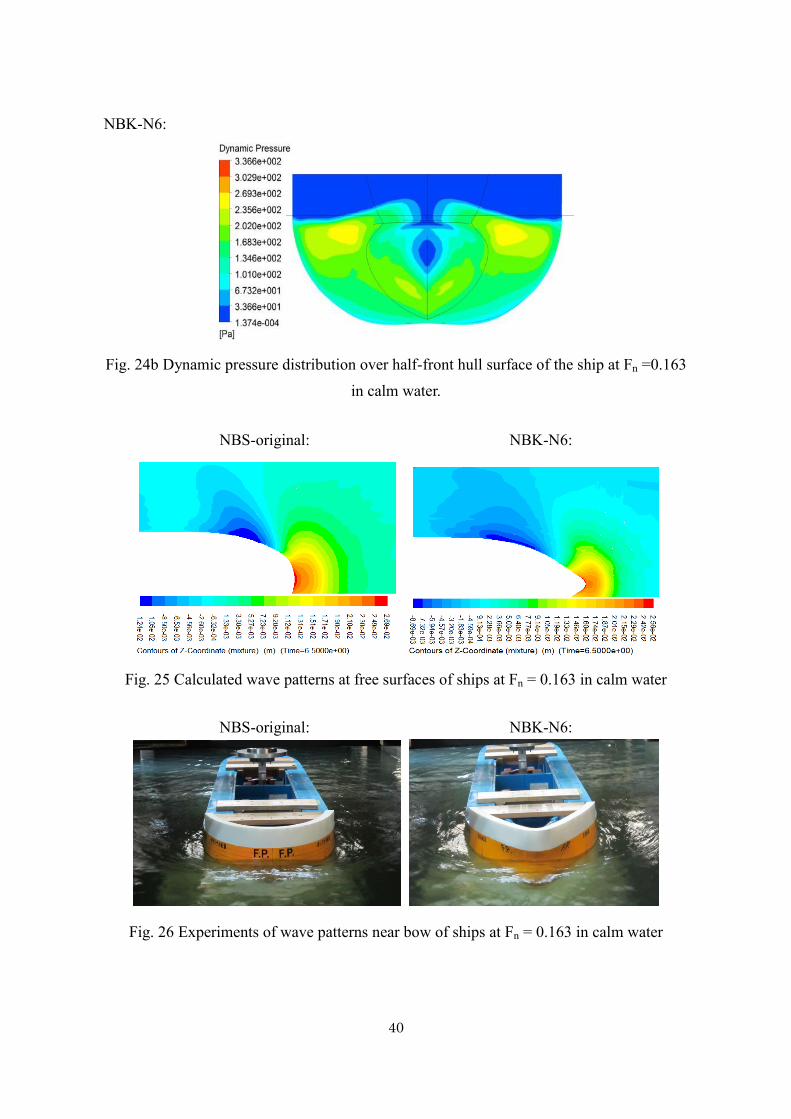
The calculated dynamic pressure distribution over the half front hull surface of each
ship is shown in Fig. 24. The results at Froude number of 0.163 are shown in the figures.
Wide and low dynamic pressure area (blue area) over the front-edge of bow of
NBS-original disappears on the bow of NBK-N6 with the bulbous bow. Since low dynamic
pressure causes high pressure over the hull surface, the resistance acting on the hull must
increase if the area of low dynamic pressure area is wide. On the contrary lower dynamic
pressure (Red or yellow area in the figures) reduces the resistance. From these dynamic
pressure distributions, we can imagine how the bulbous bows change the flow around the
hulls and the pressure over the hull surface.
Fig. 23 Ratio of pressure resistance coefficients for NBK-N6 and NBS-original
in calm water
NBS-original:
Fig. 24a Dynamic pressure distribution over half-front hull surface of the ship at Fn = 0.163
in calm water
0
0.2
0.4
0.6
0.8
1
1.2
0 0.05 0.1 0.15 0.2
CP(
NB
K-N
6)/C
P(N
BS-
orig
inal
)
Fn
Exp CFD
40
NBK-N6:
Fig. 24b Dynamic pressure distribution over half-front hull surface of the ship at Fn =0.163
in calm water.
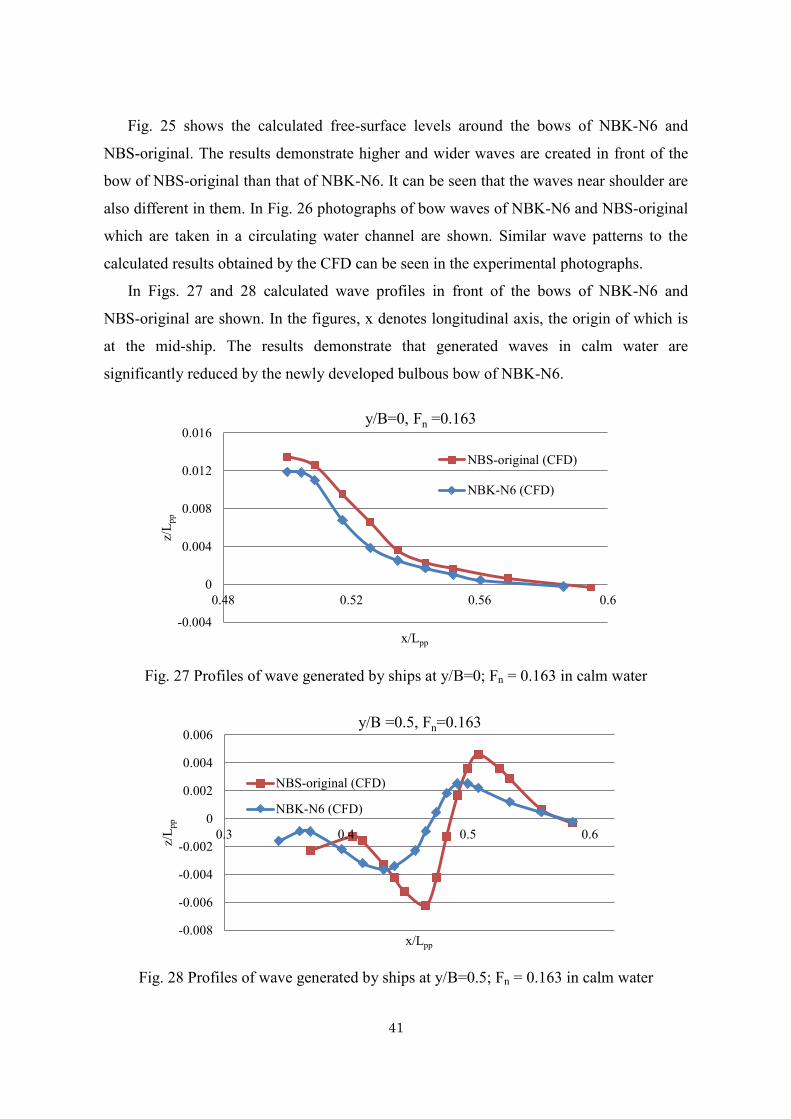
NBS-original: NBK-N6:
Fig. 25 Calculated wave patterns at free surfaces of ships at Fn = 0.163 in calm water
NBS-original: NBK-N6:
Fig. 26 Experiments of wave patterns near bow of ships at Fn = 0.163 in calm water
41
Fig. 25 shows the calculated free-surface levels around the bows of NBK-N6 and
NBS-original. The results demonstrate higher and wider waves are created in front of the
bow of NBS-original than that of NBK-N6. It can be seen that the waves near shoulder are
also different in them. In Fig. 26 photographs of bow waves of NBK-N6 and NBS-original
which are taken in a circulating water channel are shown. Similar wave patterns to the
calculated results obtained by the CFD can be seen in the experimental photographs.
In Figs. 27 and 28 calculated wave profiles in front of the bows of NBK-N6 and
NBS-original are shown. In the figures, x denotes longitudinal axis, the origin of which is
at the mid-ship. The results demonstrate that generated waves in calm water are
significantly reduced by the newly developed bulbous bow of NBK-N6.
Fig. 27 Profiles of wave generated by ships at y/B=0; Fn = 0.163 in calm water
Fig. 28 Profiles of wave generated by ships at y/B=0.5; Fn = 0.163 in calm water
-0.004
0
0.004
0.008
0.012
0.016
0.48 0.52 0.56 0.6
z/L p
p
x/Lpp
y/B=0, Fn =0.163
NBS-original (CFD)
NBK-N6 (CFD)
-0.008
-0.006
-0.004
-0.002
0
0.002
0.004
0.006
0.3 0.4 0.5 0.6z/L p
p
x/Lpp
y/B =0.5, Fn=0.163
NBS-original (CFD)
NBK-N6 (CFD)
42
3.2.2 Assessment of effect of bulbous bow on added resistance acting on ship in waves
In this section, assessment of effect of bulbous bow on added resistance acting on a hull in regular head waves is discussed to find reasons why the added resistance due to waves depends on bow shapes. Pressure distribution over hull surface of ships and wave pattern at free surface generated by ships moving in waves are computed by the CFD. From the comparison among the computed results of pressure and wave pattern of ships in waves may be found the reasons of reduction of added resistance by bow shape of ships.
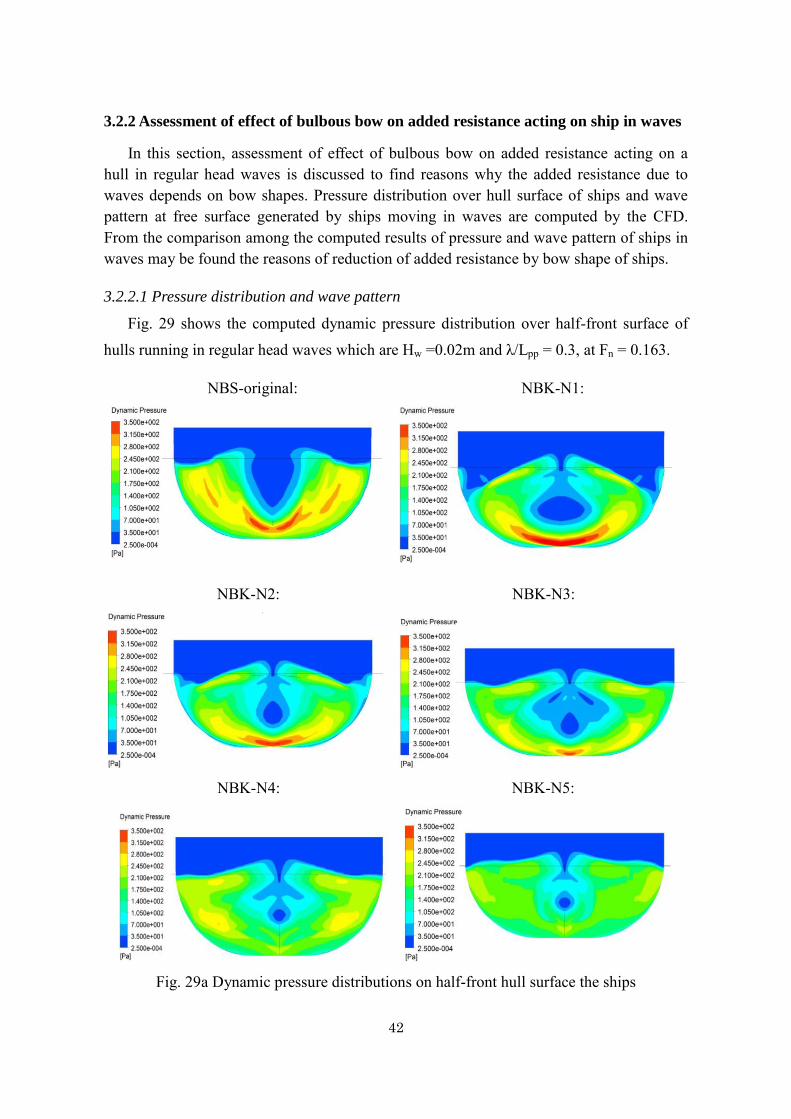
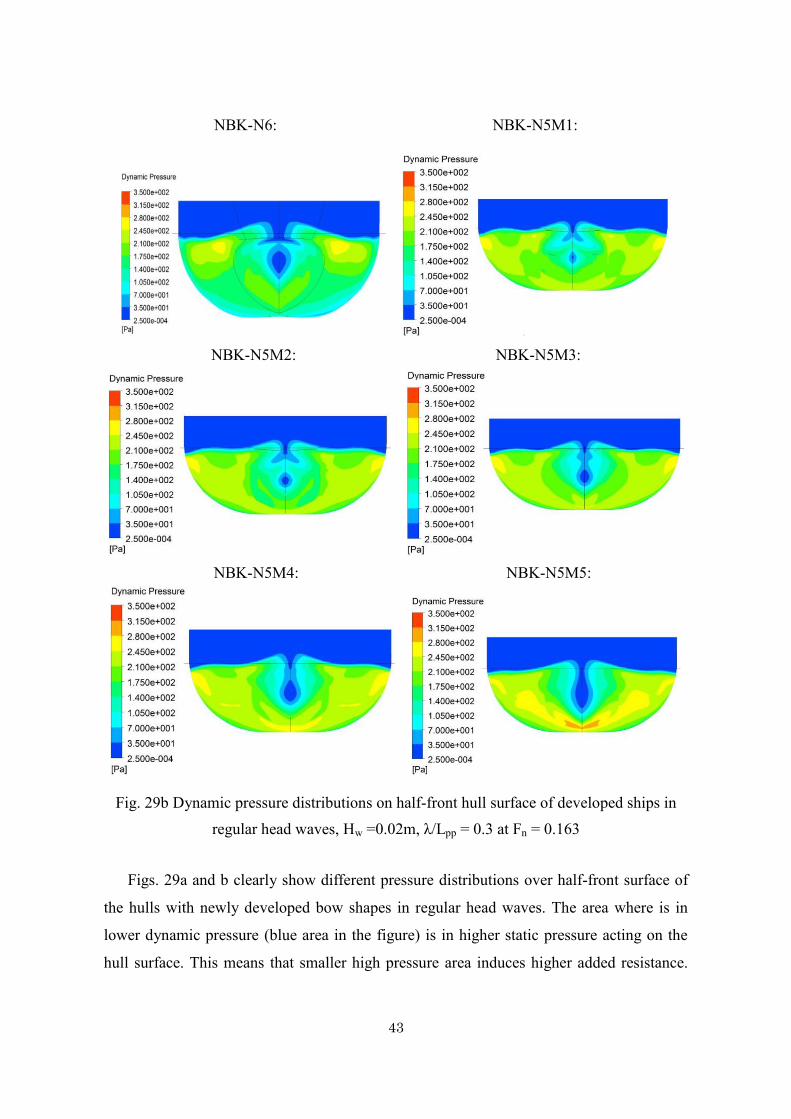
3.2.2.1 Pressure distribution and wave pattern
Fig. 29 shows the computed dynamic pressure distribution over half-front surface of
hulls running in regular head waves which are Hw =0.02m and λ/Lpp = 0.3, at Fn = 0.163.
NBS-original: NBK-N1:
NBK-N2: NBK-N3:
NBK-N4: NBK-N5:
Fig. 29a Dynamic pressure distributions on half-front hull surface the ships
43
NBK-N6: NBK-N5M1:
NBK-N5M2: NBK-N5M3:
NBK-N5M4: NBK-N5M5:
Fig. 29b Dynamic pressure distributions on half-front hull surface of developed ships in
regular head waves, Hw =0.02m, λ/Lpp = 0.3 at Fn = 0.163
Figs. 29a and b clearly show different pressure distributions over half-front surface of
the hulls with newly developed bow shapes in regular head waves. The area where is in
lower dynamic pressure (blue area in the figure) is in higher static pressure acting on the
hull surface. This means that smaller high pressure area induces higher added resistance.
44
The results demonstrate that the newly developed bow shapes may reduce the resistance in
waves.
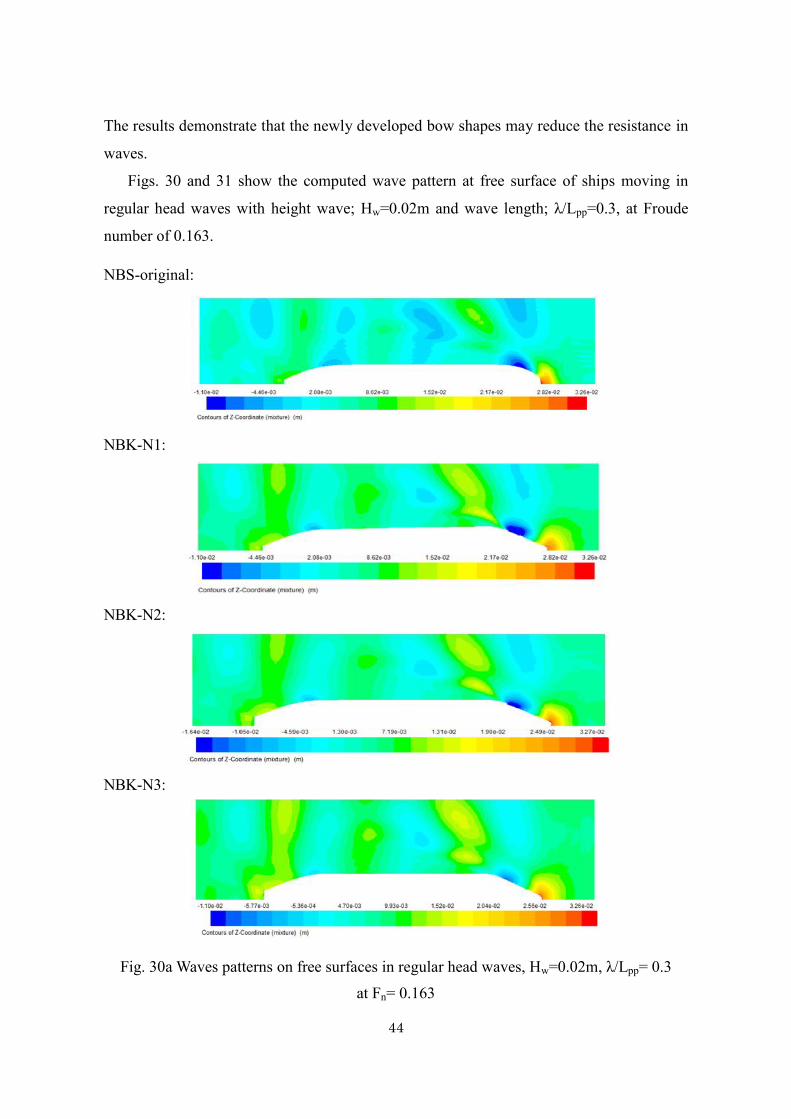
Figs. 30 and 31 show the computed wave pattern at free surface of ships moving in
regular head waves with height wave; Hw=0.02m and wave length; λ/Lpp=0.3, at Froude
number of 0.163.
NBS-original:
NBK-N1:
NBK-N2:
NBK-N3:
Fig. 30a Waves patterns on free surfaces in regular head waves, Hw=0.02m, λ/Lpp= 0.3
at Fn= 0.163

45
NBK-N4:
NBK-N5
NBK-N6:
Fig. 30b Waves patterns on free surfaces in regular head waves, Hw=0.02m, λ/Lpp= 0.3
at Fn= 0.163
Fig. 31a Wave profiles at free surfaces near bow at y/B = 0, in regular head waves,
Hw=0.02m, λ/Lpp= 0.3 at Fn= 0.163
0
0.004
0.008
0.012
0.016
0.48 0.56 0.64 0.72
z/L p
p
x/Lpp
y/B = 0
NBS-original
NBK-N1
NBK-N2
NBK-N3

46
Fig. 31b Wave profiles at free surfaces near bow at y/B = 0, in regular head waves,
Hw=0.02m, λ/Lpp= 0.3 at Fn = 0.163.
Fig. 32 Wave profiles at free surfaces near bow at y/B = 0.5 in waves,
Hw=0.02m, λ/Lpp= 0.3 at Fn = 0.163
0
0.004
0.008
0.012
0.016
0.48 0.56 0.64 0.72
z/L p
p
x/Lpp
y/B = 0
NBS-original
NBK-N4
NBK-N5
NBK-N6
-0.008
-0.004
0.000
0.004
0.008
0.2 0.3 0.4 0.5 0.6 0.7z/L p
p
x/Lpp
y/B = 0.5
NBS-originalNBK-N1NBK-N2NBK-N3
-0.008
-0.004
0.000
0.004
0.008
0.2 0.3 0.4 0.5 0.6 0.7z/L p
p
x/Lpp
y/B = 0.5
NBS-originalNBK-N4NBK-N5NBK-N6

47
Figs. 31 and 32 show the calculated profiles of waves at free surface near the bow of
the ships. x is longitudinal axis, the origin of which is located at the mid-ship and y is
transverse axis, the origin of which is located in the centerline of the ship.
Figs. 30~32 clearly show that generated waves by the ships in waves on free surface
depend on the developed bow shapes and decrease with bulbous bow compared with those
of the original model. The results may suggest that wave resistance of newly developed
hull forms decrease in regular head waves.
3.2.2.2 Added resistance acting on new ships in waves
In this section, added resistances acting on the new ships in waves are computed. The
results are compared with each other to find the minimum added resistance hull form.
Fig. 33 shows the computed added resistance of the ships in waves with wave height;
Hw= 0.02m and at Fn = 0.163. The added resistance coefficient is defined as follows:
CW = CT(W) – CT(O) (1)
where CT(W) and CT(O) are the coefficients of total resistance acting on ship in waves and in
calm water, respectively.
Fig. 33a Calculated results of added resistance in regular head waves with Hw= 0.02m, λ/Lpp<0.6 at Fn=0.163
0.0000
0.0004
0.0008
0.0012
0.0016
0.3 0.4 0.5 0.6
CW
λ/Lpp
NBS-original
NBK-N1
NBK-N2
NBK-N3
48
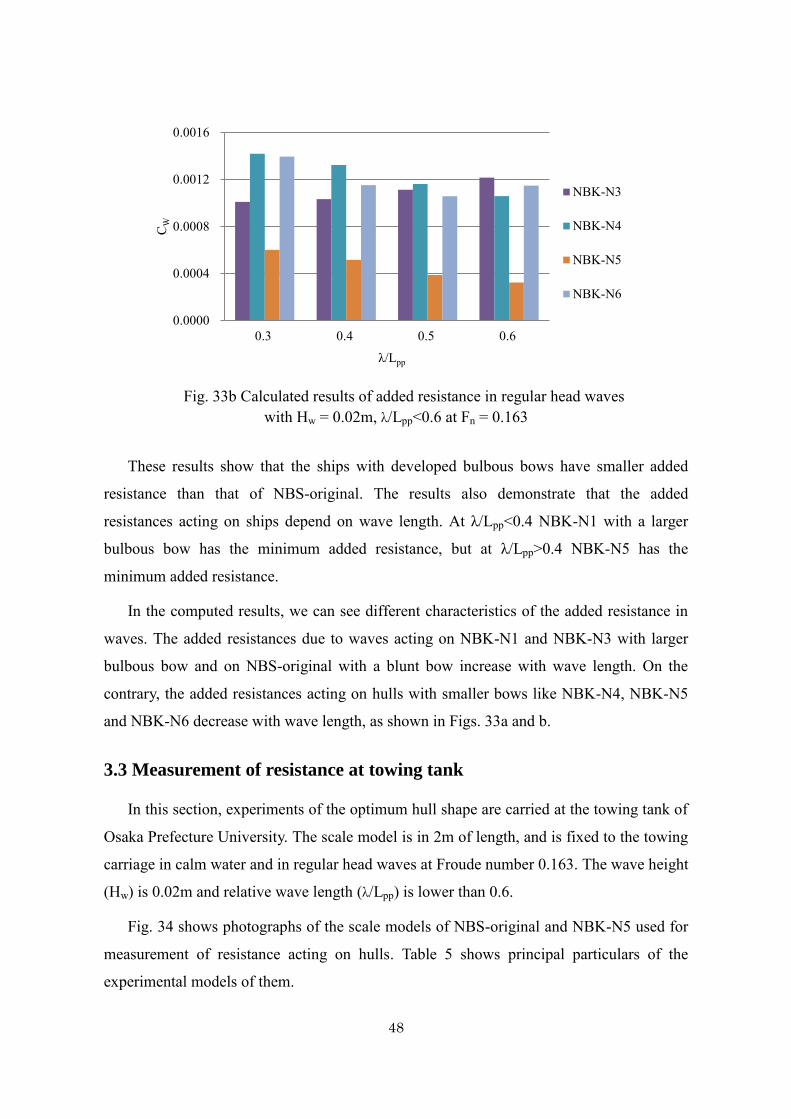
Fig. 33b Calculated results of added resistance in regular head waves with Hw = 0.02m, λ/Lpp<0.6 at Fn = 0.163
These results show that the ships with developed bulbous bows have smaller added
resistance than that of NBS-original. The results also demonstrate that the added
resistances acting on ships depend on wave length. At λ/Lpp<0.4 NBK-N1 with a larger
bulbous bow has the minimum added resistance, but at λ/Lpp>0.4 NBK-N5 has the
minimum added resistance.
In the computed results, we can see different characteristics of the added resistance in
waves. The added resistances due to waves acting on NBK-N1 and NBK-N3 with larger
bulbous bow and on NBS-original with a blunt bow increase with wave length. On the
contrary, the added resistances acting on hulls with smaller bows like NBK-N4, NBK-N5
and NBK-N6 decrease with wave length, as shown in Figs. 33a and b.
3.3 Measurement of resistance at towing tank
In this section, experiments of the optimum hull shape are carried at the towing tank of
Osaka Prefecture University. The scale model is in 2m of length, and is fixed to the towing
carriage in calm water and in regular head waves at Froude number 0.163. The wave height
(Hw) is 0.02m and relative wave length (λ/Lpp) is lower than 0.6.
Fig. 34 shows photographs of the scale models of NBS-original and NBK-N5 used for
measurement of resistance acting on hulls. Table 5 shows principal particulars of the
experimental models of them.
0.0000
0.0004
0.0008
0.0012
0.0016
0.3 0.4 0.5 0.6
CW
λ/Lpp
NBK-N3
NBK-N4
NBK-N5
NBK-N6

49
NBS-original:
NBK-N5:
Fig. 34 Experimental models of the ships
Table 5 Principal particulars of the experimental models of ships
No Lpp (m)
B (m)
draft (m)
Dispt (t)
WSA (m2)
NBS-original 2.000 0.360 0.131 0.0667 0.8980
NBK-N5 2.077 0.360 0.131 0.0668 0.9701
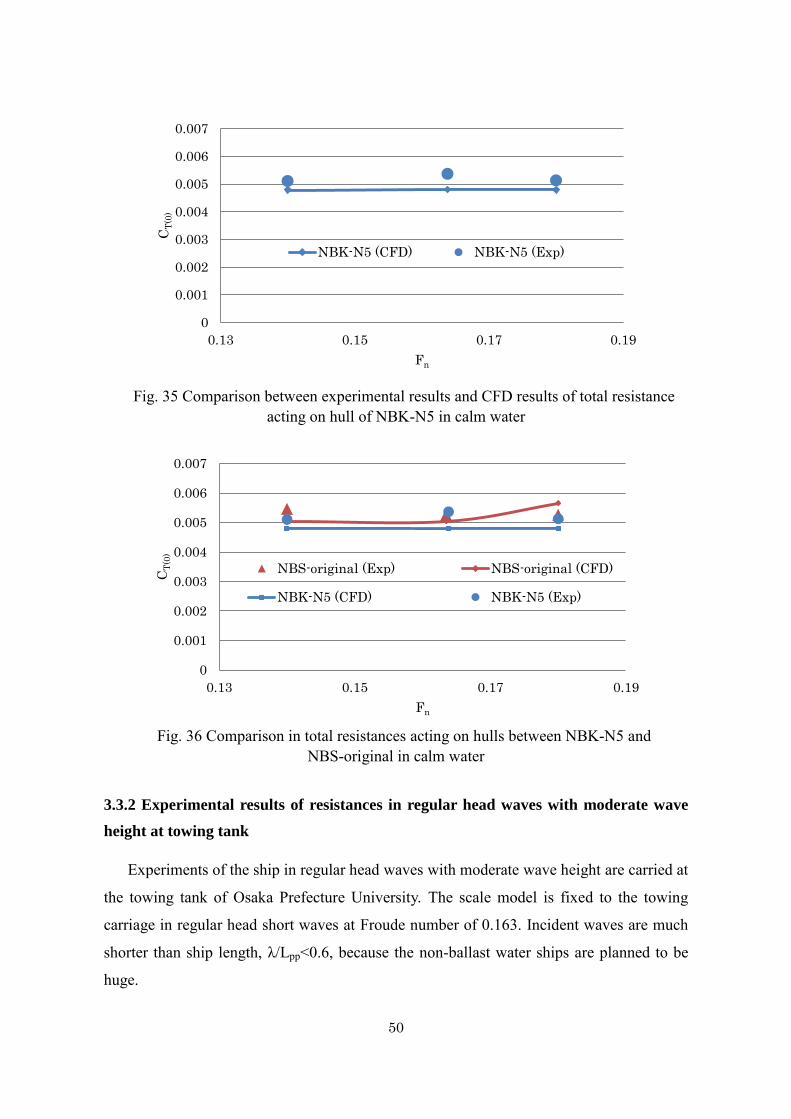
3.3.1 Experimental results of resistance in calm water
Fig. 35 shows the comparison between the experimental results and the CFD results of
total resistance coefficient of NBK-N5 in calm water. The results show that the agreement
between them is fairly good. Fig. 36 shows the comparison in the total resistance between
NBS-original and NBK-N5 in calm water. The resistances acting on the ships are closed
each other in low Froude number region. It is difficult from the experimental results to find
differences between the two models, but slight difference between them can be clearly seen
in the CFD results. It may demonstrate that CFD is an appropriate tool to identify such
small differences of resistances.
50
Fig. 35 Comparison between experimental results and CFD results of total resistance acting on hull of NBK-N5 in calm water
Fig. 36 Comparison in total resistances acting on hulls between NBK-N5 and
NBS-original in calm water
3.3.2 Experimental results of resistances in regular head waves with moderate wave
height at towing tank
Experiments of the ship in regular head waves with moderate wave height are carried at
the towing tank of Osaka Prefecture University. The scale model is fixed to the towing
carriage in regular head short waves at Froude number of 0.163. Incident waves are much
shorter than ship length, λ/Lpp<0.6, because the non-ballast water ships are planned to be
huge.
0
0.001
0.002
0.003
0.004
0.005
0.006
0.007
0.13 0.15 0.17 0.19
CT
(0)
Fn
NBK-N5 (CFD) NBK-N5 (Exp)
0
0.001
0.002
0.003
0.004
0.005
0.006
0.007
0.13 0.15 0.17 0.19
CT
(0)
Fn
NBS-original (Exp) NBS-original (CFD)
NBK-N5 (CFD) NBK-N5 (Exp)

51
Fig. 37 shows the comparison of the total resistance coefficient of NBK-N5 between
calculated by the CFD and experimental results. Fairly good agreement between them can
be seen in the figure.
Figs. 38 and 39 show clearly reduction of resistance acting on NBK-N5 in comparison
with those of NBS-original.
The results show that the CFD results are in good agreement with the experimental
results. The experimental results demonstrate that the resistance acting on NBK-N5 is
smaller than that on NBS-original at region of λ/Lpp<0.6. It can be said that the bow of
NBK-N5 could reduce added resistance due to waves by 60% and total resistance in waves
by 15% from those of NBS-original.
Fig. 37 Comparison in total resistances acting on hull of NBK-N5 between CFD results
and experimental one, in regular head waves, Hw=0.02m at Fn=0.163
Fig. 38 Comparison in added resistances acting on hulls of NBK-N5 and NBS-original
between CFD and experimental results, in regular head waves, Hw=0.02m at Fn=0.163
0
0.001
0.002
0.003
0.004
0.005
0.006
0.007
0.008
0.2 0.3 0.4 0.5 0.6 0.7
CT
λ/Lpp
NBK-N5 (Exp) NBK-N5 (CFD)
0
0.0003
0.0006
0.0009
0.0012
0.0015
0.0018
0.2 0.3 0.4 0.5 0.6 0.7
CW
λ/Lpp NBS-original (Exp) NBK-N5 (Exp)
NBS-original (CFD) NBK-N5 (CFD)

52
Fig. 39 Comparison in total resistances acting on hulls of NBK-N5 and NBS-original between CFD and experimental results, in regular head waves, Hw=0.02m at Fn=0.163
3.4 Conclusions of the chapter 3
In this chapter, by using a commercial CFD code “Fluent” an optimum bulbous bow for a Non Ballast Water ship in calm water and in regular head waves is developed, and following conclusions are obtained:
- Series of bow shapes to reduce the resistance in waves as well as in calm water are developed and the resistances of the series of hulls are calculated by the CFD code to find an optimum bow shape. The optimum bow shapes among the developed hulls are determined by comparing the calculated resistances for the hulls.
- The CFD results show that the optimum hull shape in calm water depends on Froude number although this is already common in the ship hydrodynamic field.
- The CFD code gives us a lot of important information like pressure distributions on the hull surface, wave patterns at free surface, and so on. The information plays an important role for understanding the phenomenon which causes the added resistance due to waves.
- The calculated results are in good agreement with the experimental one. The optimum hull shape NBK-N5 can decrease the added resistance in regular head waves by 60% and total resistance by 15% in moderate short head waves (Hw=0.02m and λ/Lpp<0.6) at Froude number of 0.163.
0
0.001
0.002
0.003
0.004
0.005
0.006
0.007
0.008
0.2 0.3 0.4 0.5 0.6 0.7
CT
λ/Lpp
NBK-N5 (Exp) NBS-original (Exp)
NBK-N5 (CFD) NBS-original (CFD)

53
CHAPTER 4:
RESISTANCE ACTING ON A HULL
OF SHIP IN HIGH WAVES
4.1 Models and fluid domain for computation
In this chapter, added resistances acting on a ship in high waves are theoretically and
experimentally investigated. In previous chapters, incident waves are assumed to be
moderate. For a 2m model for experiments and calculations, the wave height is 0.02m.
This means that the wave height is 15% of draft of the ship in full load condition. In this
chapter, added resistances in high waves up to 0.07m for a 2m model or 53% of the full
load draft are investigated. In such high waves linear wave theories which have been using
in design stage of a ship for a long time may not work well anymore, and experiments are
only tool to predict the added resistance in high waves.
Some newest CFD codes have an ability to calculate the nonlinear hydrodynamic
forces. Only serious problem for calculations of hydrodynamic forces may be numbers of
memories of the computers and long computing times because huge numbers of meshes
must be arranged near free surfaces oscillating in large amplitudes. In calculations of added
resistance in high waves, only half symmetry domain is used. Then double numbers of
meshes can be used and small meshes can be distributed near free surfaces.
Three ship models are selected as the object ones, NBS-original, NBK-N5 and
NBK-N6. NBS-original was the original hull shape developed in the research project of
non-ballast water ships, and NBK-N6 has the improved bulbous bow, NBK-N5 is the
optimum hull in moderate regular head waves developed in Chapter 3. Figs. 40 and 41
show the bow shapes of them. Their stern shapes are same.

54
4.2. Dynamic pressure and wave pattern
4.2.1 Wave pattern at free surface
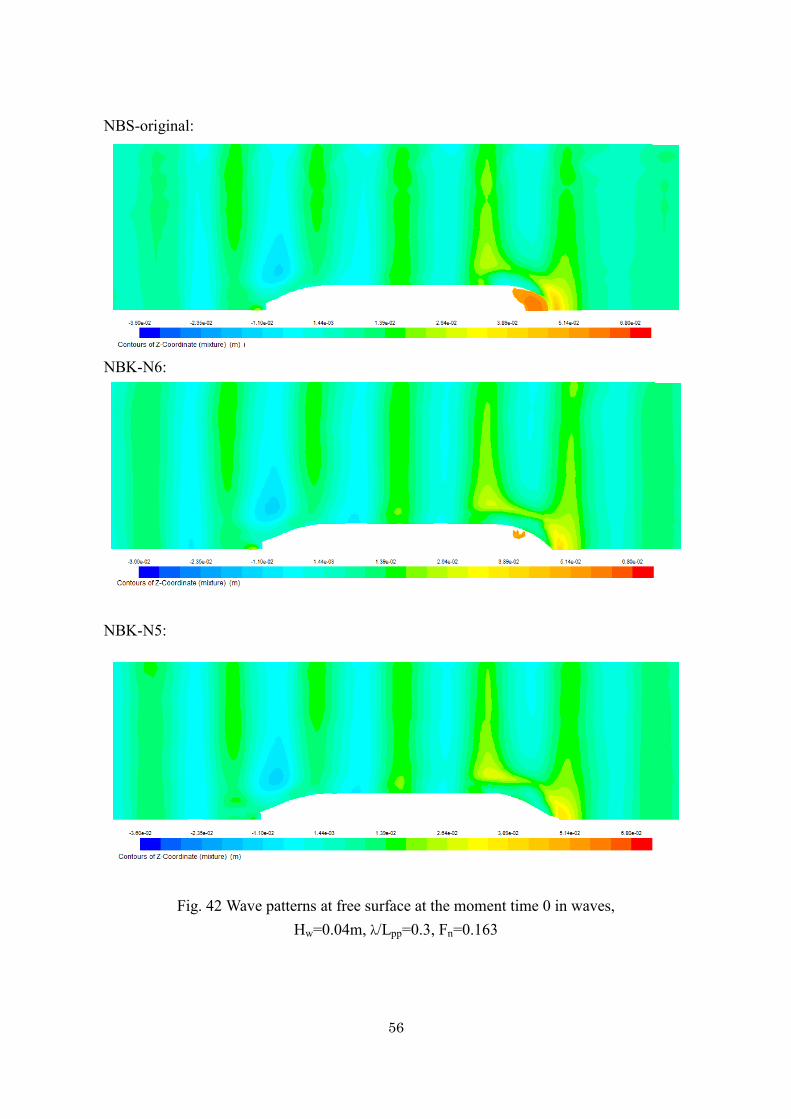
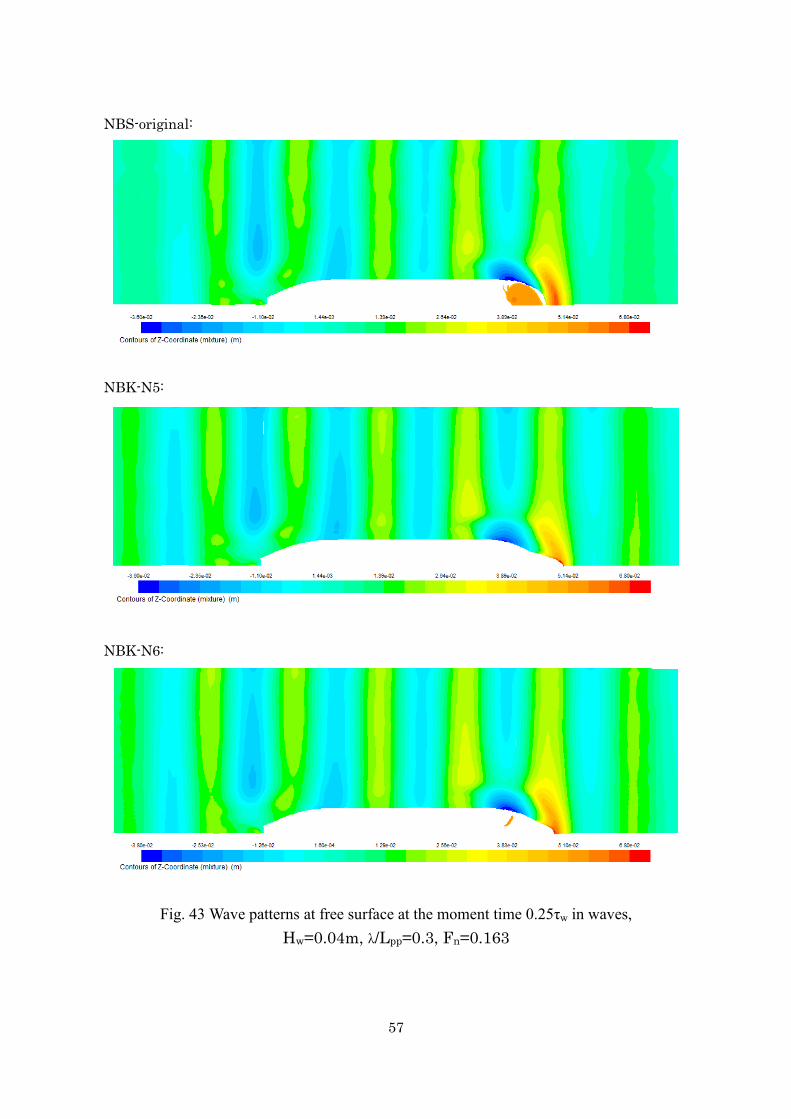
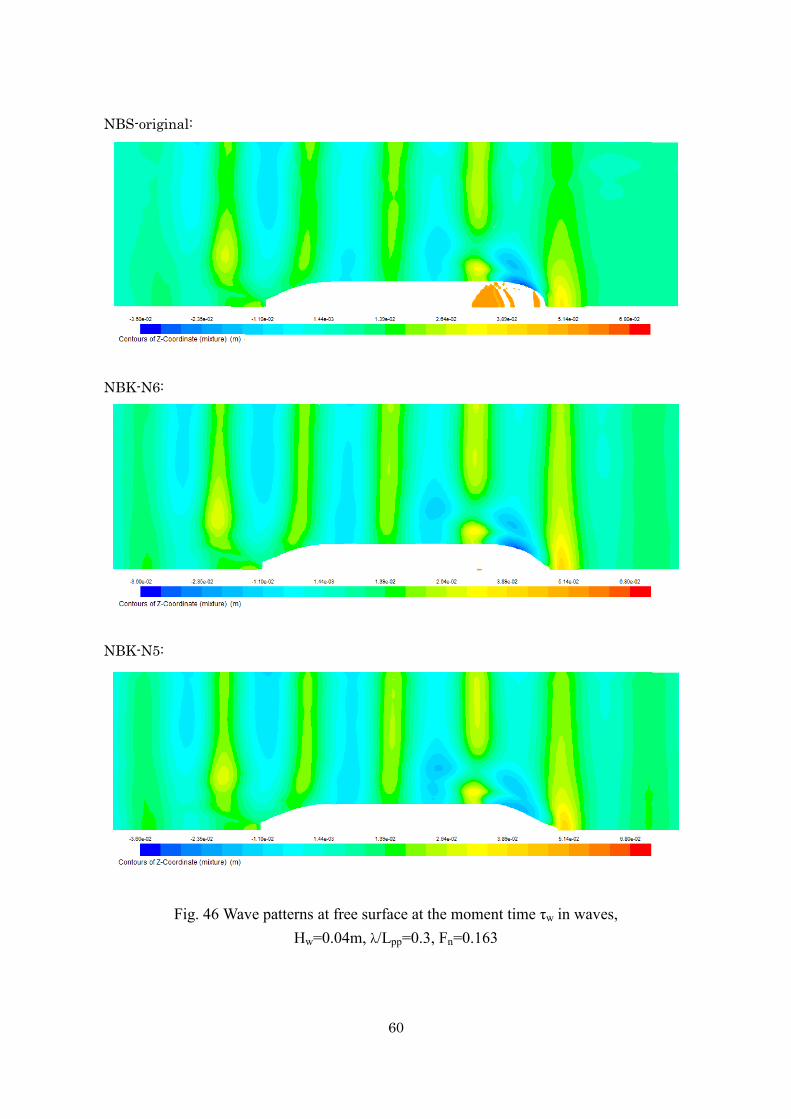
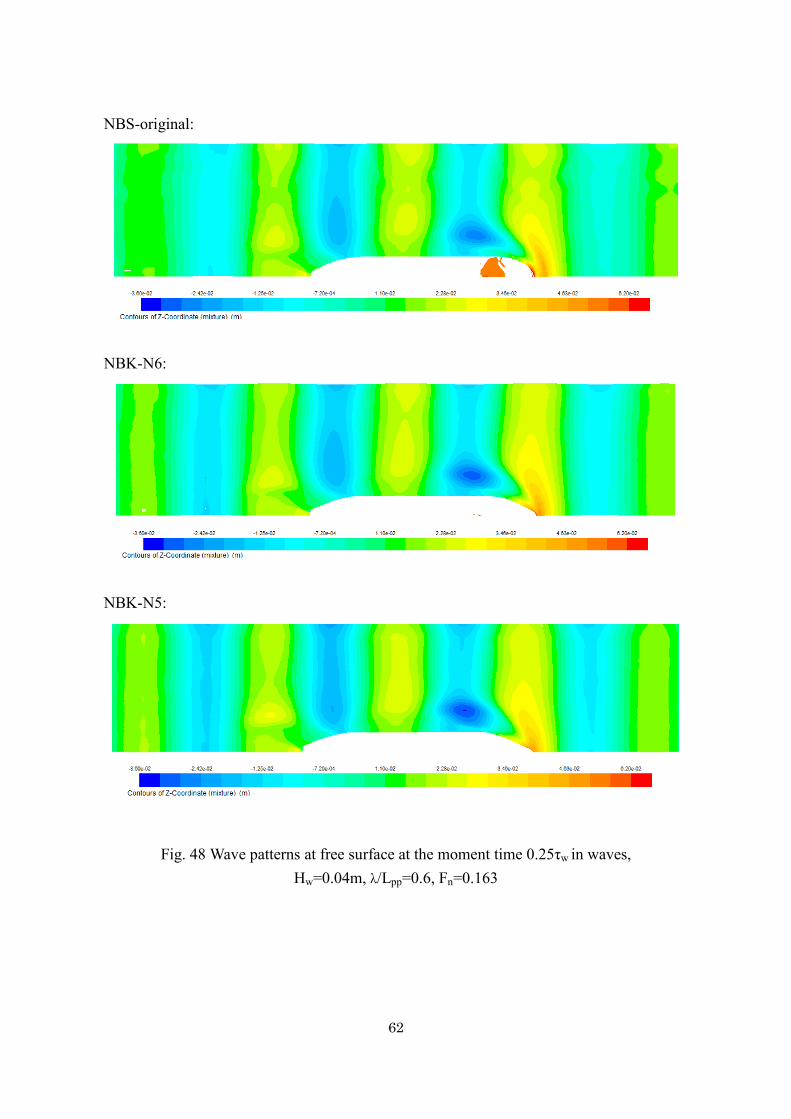
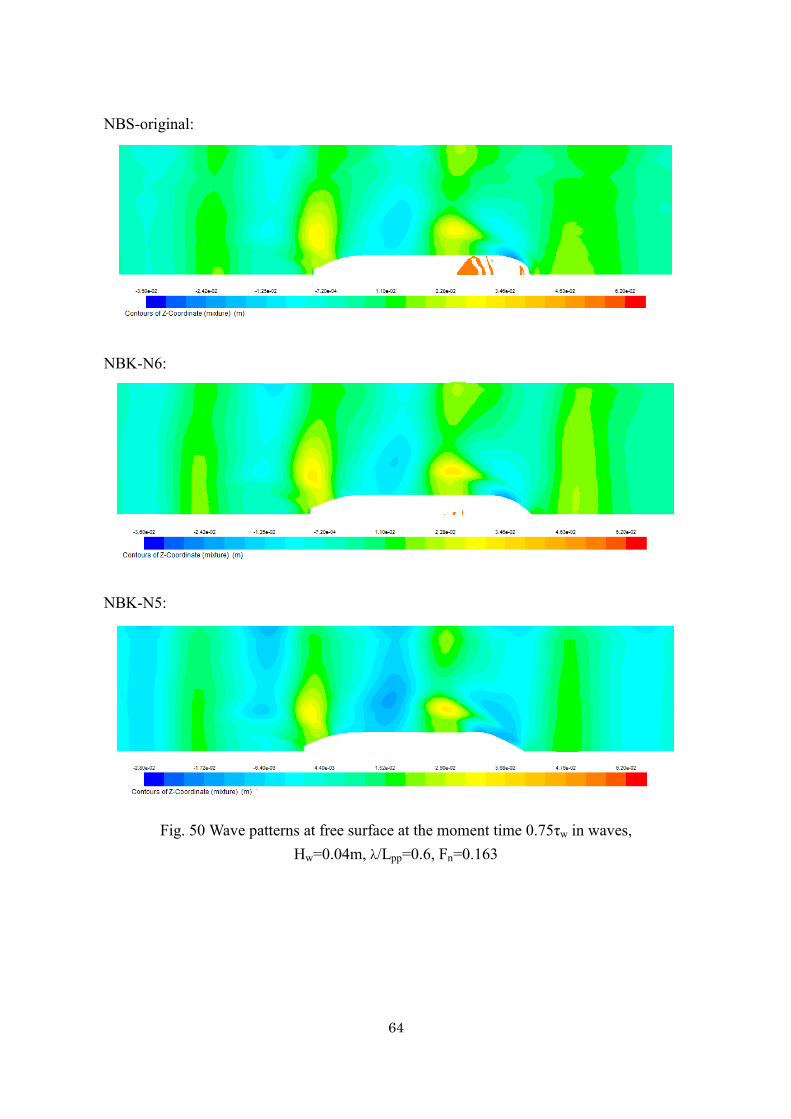
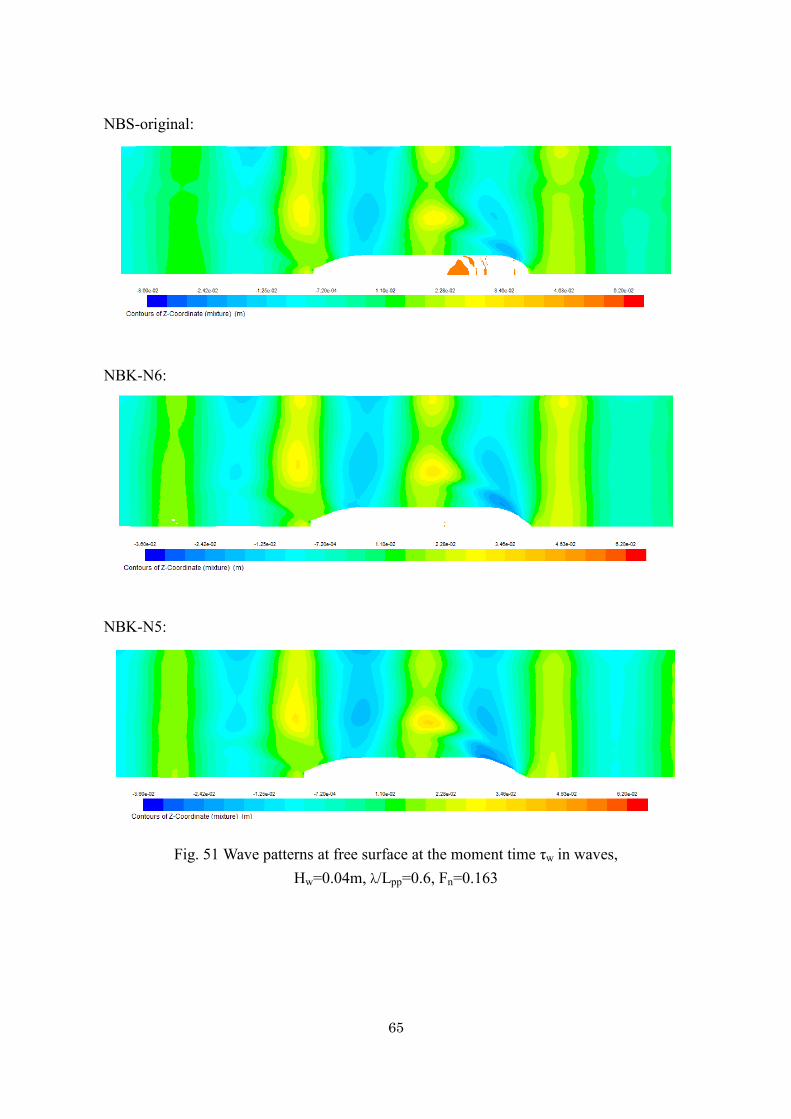
In this section, calculated waves by the CFD in the conditions; Hw=0.04m, λ/Lpp=0.3,
0.6 and Fn=0.163, are shown. The computed wave patterns in a wave cycle for λ/Lpp=0.3
and 0.6 are shown in birds-eye view in Figs. 42~51. We can see that incident waves are
disturbed at the bows of the ships, and waves rise in front of the bows and fall at the side
shoulders. The rise of the front waves of NBS-original is higher than those of NBK-N6 and
NBK-N5. It should be noted that incident waves shown in these figures look like not to be
in a steady oscillating condition because the scales of expressions of free-surface elevation
are too rough.
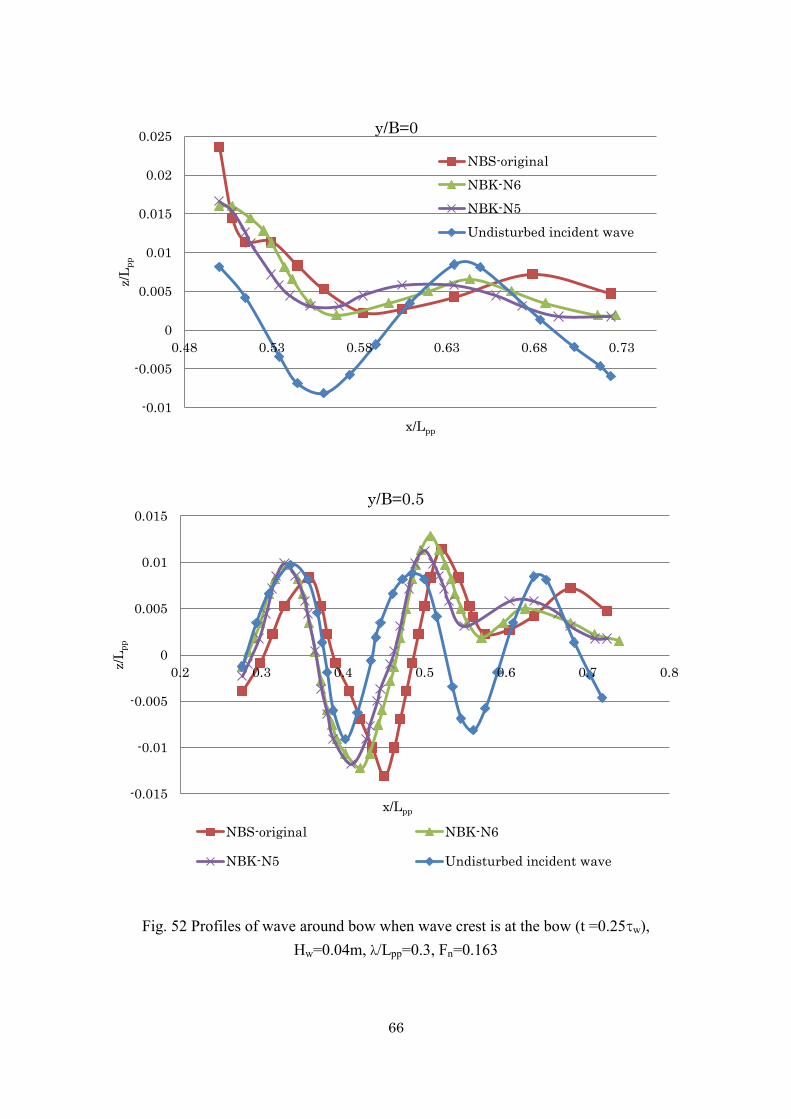
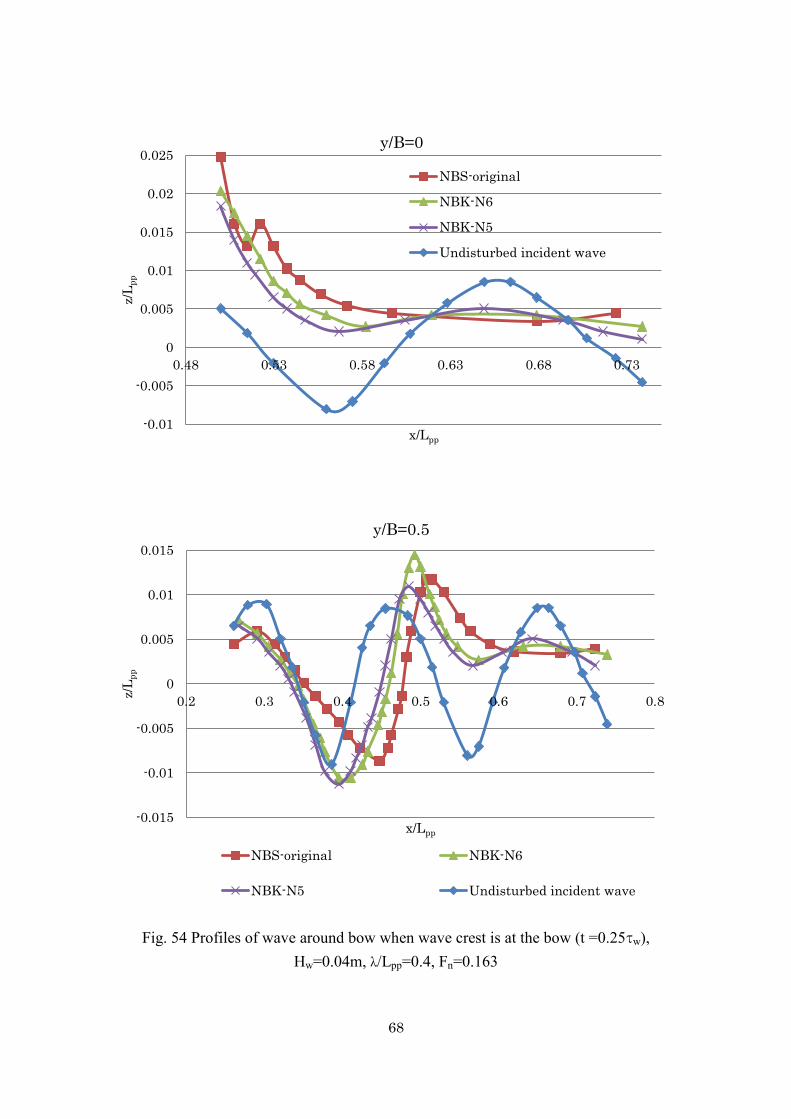
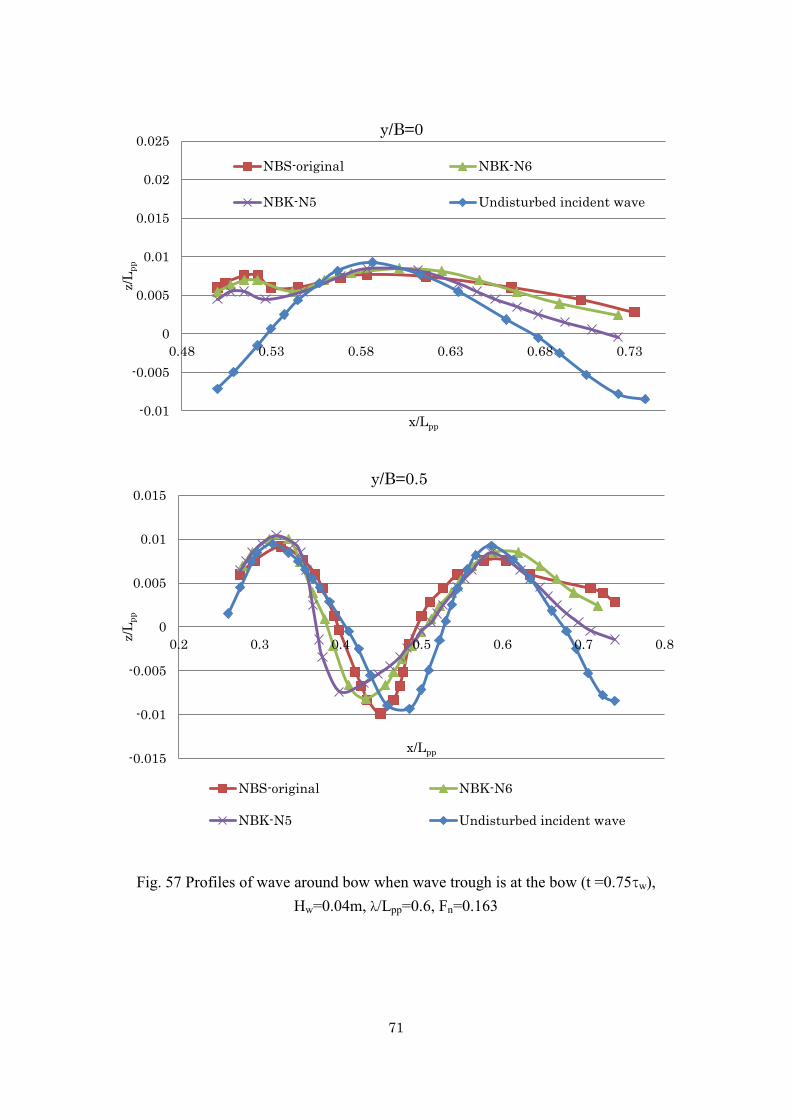
Wave profiles on a center plane (y/B=0) and a side plane (y/B=0.5) near the bows (the
bow is located at x/Lpp=0.5) are shown in Figs. 52~57. In the calculations, relative wave
lengths (λ/Lpp) are 0.3, 0.4 and 0.6, and corresponding wave periods (τw) are 0.4sec,
0.45sec and 0.6sec, respectively. Wave height (Hw) is 0.04m. Wave profiles shown in these
figures are those at the moments when wave crest locates near the bow (t=0.25τw) and
when wave trough locates near the bow (t=0.75τw).
The results of λ/Lpp=0.3 shown in upper figures of Fig. 52 show that when the wave
crest locates near the bow edge, wave runs up on the bow of NBS-original up to about 2.5
times of the wave amplitude of the incident waves and that those of NBK-N6 and NBK-N5
run up to about 1.5 times. We can also see that large sinusoidal oscillations of incident
waves disappear on the center plane in front of the bows and only small amplitude
oscillations remain in front of the bows. The results of Fig. 53 at the moment when the
wave trough locates near the bows show that higher water level above the calm water
surface is kept in front of the bows in a wave length.
Similar tendency of the wave profiles can be seen in the calculated results for longer
waves, λ/Lpp= 0.4 and 0.6, as shown in the upper figures in Figs. 54~57.

55
Fig. 40 Profiles of bow shapes of the ships
Fig. 41 Bow shapes of the ships, NBS-original, NBK-N6 and NBK-N5
NBS-original
NBK-N5
NBK-N6
56
NBS-original:
NBK-N6:
NBK-N5:
Fig. 42 Wave patterns at free surface at the moment time 0 in waves, Hw=0.04m, λ/Lpp=0.3, Fn=0.163
57
NBS-original:
NBK-N5:
NBK-N6:
Fig. 43 Wave patterns at free surface at the moment time 0.25τw in waves,
Hw=0.04m, λ/Lpp=0.3, Fn=0.163

58
NBS-original:
NBK-N6:
NBK-N5:
Fig. 44 Wave patterns at free surface at the moment time 0.5τw in waves, Hw=0.04m, λ/Lpp=0.3, Fn=0.163

59
NBS-original:
NBK-N6:
NBK-N5:
Fig. 45 Wave patterns at free surface at the moment time 0.75τw in waves, Hw=0.04m, λ/Lpp=0.3, Fn=0.163
60
NBS-original:
NBK-N6:
NBK-N5:
Fig. 46 Wave patterns at free surface at the moment time τw in waves, Hw=0.04m, λ/Lpp=0.3, Fn=0.163

61
NBS-original:
NBK-N6:
NBK-N5:
Fig. 47 Wave patterns at free surface at the moment time 0 in waves,
Hw=0.04m, λ/Lpp=0.6, Fn=0.163
62
NBS-original:
NBK-N6:
NBK-N5:
Fig. 48 Wave patterns at free surface at the moment time 0.25τw in waves, Hw=0.04m, λ/Lpp=0.6, Fn=0.163

63
NBS-original:
NBK-N6:
NBK-N5:
Fig. 49 Wave patterns at free surface at the moment time 0.5τw in waves, Hw=0.04m, λ/Lpp=0.6, Fn=0.163
64
NBS-original:
NBK-N6:
NBK-N5:
Fig. 50 Wave patterns at free surface at the moment time 0.75τw in waves, Hw=0.04m, λ/Lpp=0.6, Fn=0.163
65
NBS-original:
NBK-N6:
NBK-N5:
Fig. 51 Wave patterns at free surface at the moment time τw in waves, Hw=0.04m, λ/Lpp=0.6, Fn=0.163
66
Fig. 52 Profiles of wave around bow when wave crest is at the bow (t =0.25τw), Hw=0.04m, λ/Lpp=0.3, Fn=0.163
-0.01
-0.005
0
0.005
0.01
0.015
0.02
0.025
0.48 0.53 0.58 0.63 0.68 0.73
z/L
pp
x/Lpp
y/B=0
NBS-original
NBK-N6
NBK-N5
Undisturbed incident wave
-0.015
-0.01
-0.005
0
0.005
0.01
0.015
0.2 0.3 0.4 0.5 0.6 0.7 0.8
z/L
pp
x/Lpp
y/B=0.5
NBS-original NBK-N6
NBK-N5 Undisturbed incident wave

67
Fig. 53 Profiles of wave around bow at time 0.75τw, Hw=0.04m, λ/Lpp=0.3, Fn=0.163
-0.01
-0.005
0
0.005
0.01
0.015
0.02
0.025
0.48 0.53 0.58 0.63 0.68 0.73
z/L
pp
x/Lpp
y/B=0
NBS-original
NBK-N6
NBK-N5
Undisturbed incident wave
-0.015
-0.01
-0.005
0
0.005
0.01
0.015
0.2 0.3 0.4 0.5 0.6 0.7 0.8
z/L
pp
x/Lpp
y/B=0.5
NBS-original NBK-N6
NBK-N5 Undisturbed incident wave
68
Fig. 54 Profiles of wave around bow when wave crest is at the bow (t =0.25τw), Hw=0.04m, λ/Lpp=0.4, Fn=0.163
-0.01
-0.005
0
0.005
0.01
0.015
0.02
0.025
0.48 0.53 0.58 0.63 0.68 0.73
z/L
pp
x/Lpp
y/B=0
NBS-original
NBK-N6
NBK-N5
Undisturbed incident wave
-0.015
-0.01
-0.005
0
0.005
0.01
0.015
0.2 0.3 0.4 0.5 0.6 0.7 0.8
z/L
pp
x/Lpp
y/B=0.5
NBS-original NBK-N6
NBK-N5 Undisturbed incident wave

69
Fig. 55 Profiles of wave around bow when wave trough is at the bow (t =0.75τw), Hw=0.04m, λ/Lpp=0.4, Fn=0.163
-0.01
-0.005
0
0.005
0.01
0.015
0.02
0.025
0.48 0.53 0.58 0.63 0.68 0.73
z/L
pp
x/Lpp
y/B=0
NBS-original
NBK-N6
NBK-N5
Undisturbed incident wave
-0.015
-0.01
-0.005
0
0.005
0.01
0.015
0.2 0.3 0.4 0.5 0.6 0.7 0.8
z/L
pp
x/Lpp
y/B=0.5
NBS-original NBK-N6
NBK-N5 Undisturbed incident wave

70
Fig. 56 Profiles of wave around bow when wave crest is at the bow (t =0.25τw), Hw=0.04m, λ/Lpp=0.6, Fn=0.163
-0.01
-0.005
0
0.005
0.01
0.015
0.02
0.025
0.03
0.035
0.48 0.53 0.58 0.63 0.68 0.73
z/L
pp
x/Lpp
y/B=0
NBS-original
NBK-N6
NBK-N5
Undisturbed incident wave
-0.015
-0.01
-0.005
0
0.005
0.01
0.015
0.02
0.2 0.3 0.4 0.5 0.6 0.7 0.8
z/L
pp
x/Lpp
y/B=0.5
NBS-original NBK-N6
NBK-N5 Undisturbed incident wave
71
Fig. 57 Profiles of wave around bow when wave trough is at the bow (t =0.75τw), Hw=0.04m, λ/Lpp=0.6, Fn=0.163
-0.01
-0.005
0
0.005
0.01
0.015
0.02
0.025
0.48 0.53 0.58 0.63 0.68 0.73
z/L
pp
x/Lpp
y/B=0
NBS-original NBK-N6
NBK-N5 Undisturbed incident wave
-0.015
-0.01
-0.005
0
0.005
0.01
0.015
0.2 0.3 0.4 0.5 0.6 0.7 0.8
z/L
pp
x/Lpp
y/B=0.5
NBS-original NBK-N6
NBK-N5 Undisturbed incident wave

72
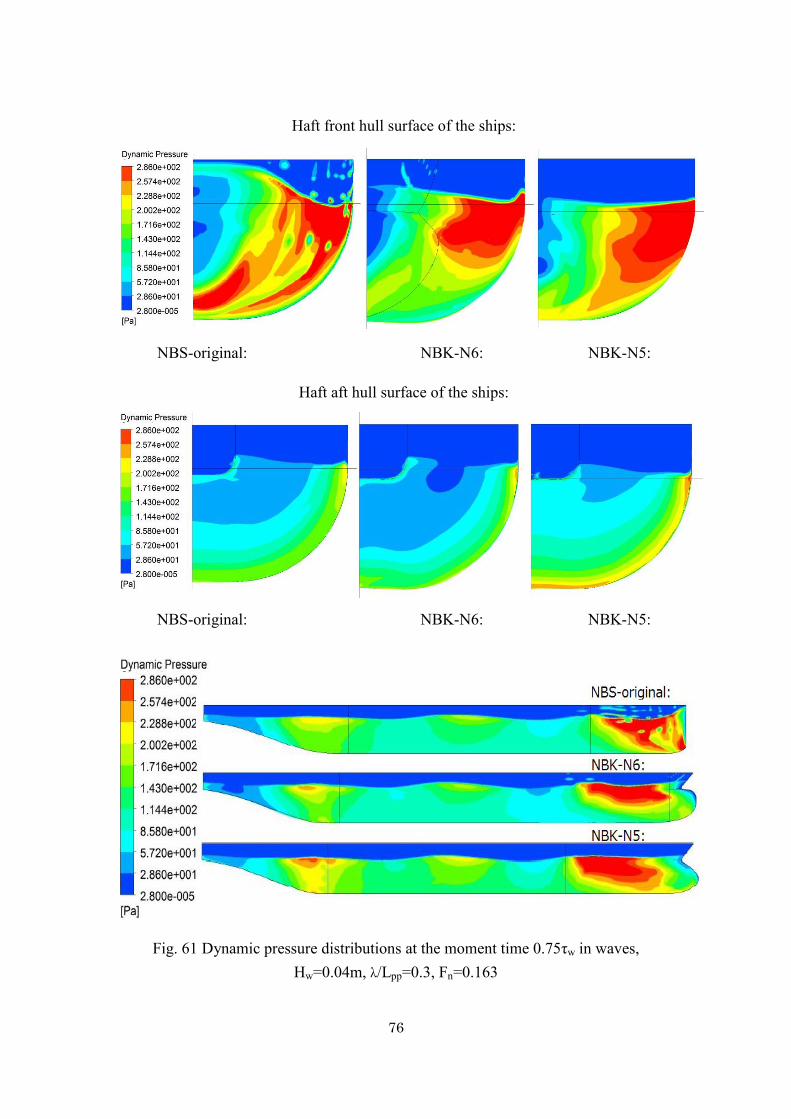
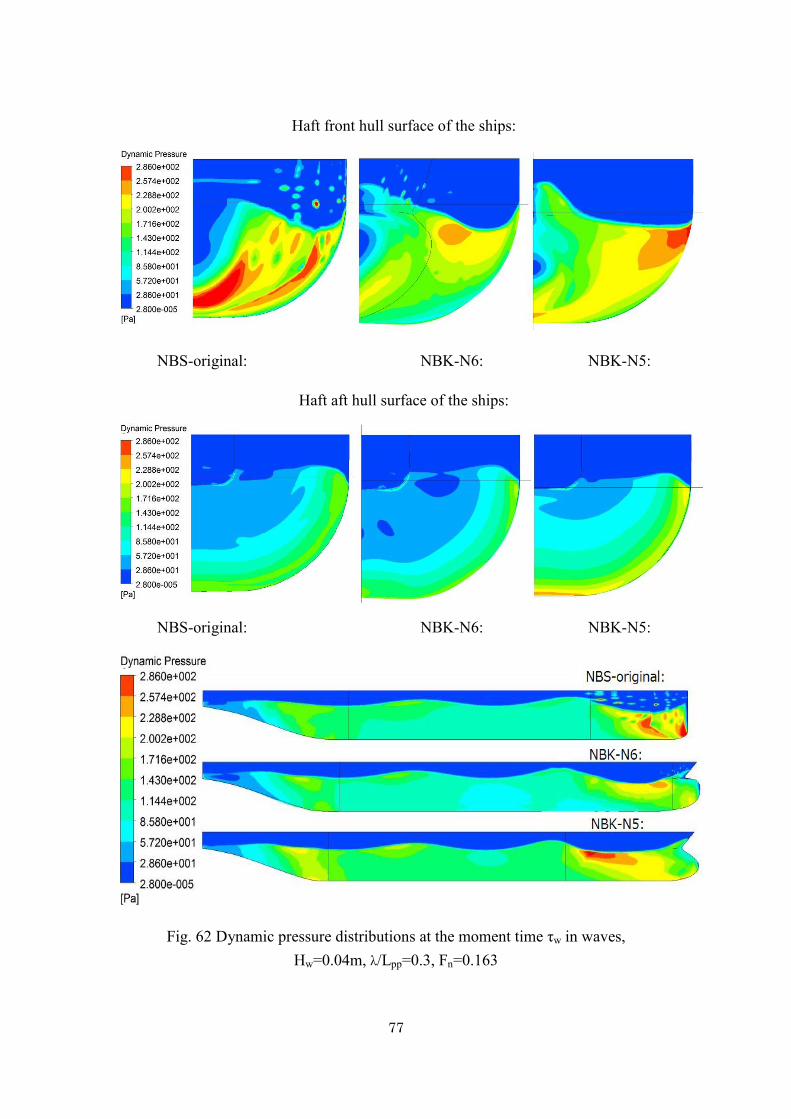
4.2.2 Dynamic pressure distribution over hull surface of the ships
Calculated dynamic pressure distributions over hull surface of the ships running in high
waves are shown in Figs. 58~67. The dynamic pressures just outside of boundary layers
are shown in these figures. In the figures, lower dynamic pressure area is shown in blue
area, where higher static pressure acts on the hull surface. Upper figures show pressure
distributions on half front hull surfaces of the three ships, middle ones show those on half
aft hull surfaces and bottom ones show those on side surfaces.
The pressure distributions for λ/Lpp=0.3 in a wave cycle are shown in Figs. 58~62
demonstrate that low dynamic pressure widely spread on the bow of NBS-original and
these pressure may cause larger added resistance due to head waves. We can see some
disturbed pressure distributions on the bow of NBS-original due to spray. The pressure
distributions on the half aft surface are slightly different among the three ships. This may
suggest that viscous resistances are different among them.
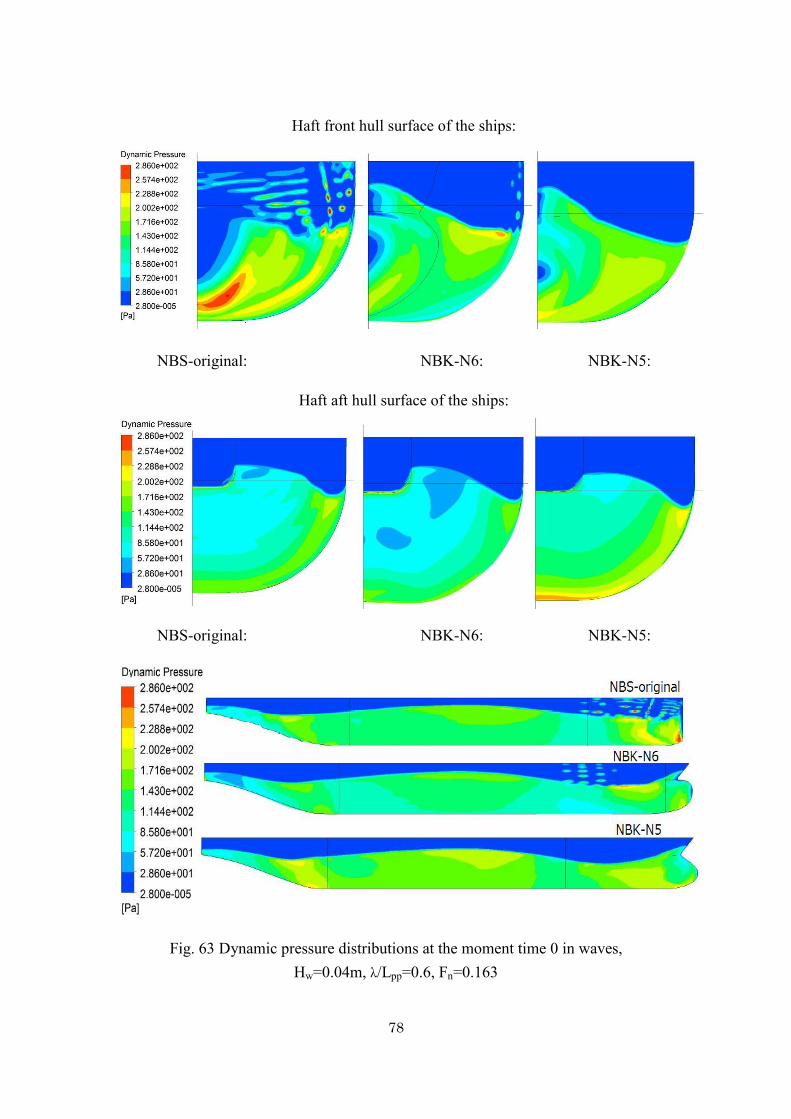
The results for λ/Lpp=0.6 are shown in Figs. 63~67. Larger differences of dynamic
pressure distributions among them can be seen.
In Figs. 68~77 dynamic pressure distribution on the center plane of the calculating
fluid domain in a circle wave are shown for λ/Lpp=0.3 and 0.6. We can see the change of
dynamic pressure distribution around the three ships in a wave cycle and differences of
wave profiles in front of the bows and behind the sterns in a wave cycle. In the upper
figures in Fig. 68 water on deck due to waves can be seen.
The added resistance acting on the hull must increase if the area of low dynamic
pressure on the half front hull surfaces is wide. On the contrary, higher dynamic pressure
(red or yellow area) on the surface reduces the resistance. From the results of dynamic
pressure distributions, we can know how the bow shapes change the flow around the hulls
and pressure over the hulls surfaces.
The results shown in this section suggest that the bulbous bow of NBK-N5 reduces area
of low dynamic pressure and increases high dynamic pressure area on the half front hull
surface at the moment when the crest and the trough of incident waves hit the bow.

73
Haft front hull surface of the ships:
NBS-original: NBK-N6: NBK-N5:
Haft aft hull surface of the ships:
NBS-original: NBK-N6: NBK-N5:
Fig. 58 Dynamic pressure distributions at the moment time 0 in waves, Hw=0.04m, λ/Lpp=0.3, Fn=0.163

74
Haft front hull surface of the ships:
NBS-original: NBK-N6: NBK-N5:
Haft aft hull surface of the ships:
NBS-original: NBK-N6: NBK-N5:
Fig. 59 Dynamic pressure distributions at the moment time 0.25τw in waves, Hw=0.04m, λ/Lpp=0.3, Fn=0.163

75
Haft front hull surface of the ships:
NBS-original: NBK-N6: NBK-N5:
Haft aft hull surface of the ships:
NBS-original: NBK-N6: NBK-N5:
Fig. 60 Dynamic pressure distributions at the moment time 0.5τw in waves, Hw=0.04m, λ/Lpp=0.3, Fn=0.163
76
Haft front hull surface of the ships:
NBS-original: NBK-N6: NBK-N5:
Haft aft hull surface of the ships:
NBS-original: NBK-N6: NBK-N5:
Fig. 61 Dynamic pressure distributions at the moment time 0.75τw in waves, Hw=0.04m, λ/Lpp=0.3, Fn=0.163
77
Haft front hull surface of the ships:
NBS-original: NBK-N6: NBK-N5:
Haft aft hull surface of the ships:
NBS-original: NBK-N6: NBK-N5:
Fig. 62 Dynamic pressure distributions at the moment time τw in waves, Hw=0.04m, λ/Lpp=0.3, Fn=0.163
78
Haft front hull surface of the ships:
NBS-original: NBK-N6: NBK-N5:
Haft aft hull surface of the ships:
NBS-original: NBK-N6: NBK-N5:
Fig. 63 Dynamic pressure distributions at the moment time 0 in waves, Hw=0.04m, λ/Lpp=0.6, Fn=0.163

79
Haft front hull surface of the ships:
NBS-original: NBK-N6: NBK-N5:
Haft aft hull surface of the ships:
NBS-original: NBK-N6: NBK-N5:
Fig. 64 Dynamic pressure distributions at the moment time 0.25τw in waves, Hw=0.04m, λ/Lpp=0.6, Fn=0.163

80
Haft front hull surface of the ships:
NBS-original: NBK-N6: NBK-N5:
Haft aft hull surface of the ships:
NBS-original: NBK-N6: NBK-N5:
Fig. 65 Dynamic pressure distributions at the moment time 0.5τw in waves, Hw=0.04m, λ/Lpp=0.6, Fn=0.163
81
Haft front hull surface of the ships:
NBS-original: NBK-N6: NBK-N5:
Haft aft hull surface of the ships:
NBS-original: NBK-N6: NBK-N5:
Fig. 66 Dynamic pressure distributions at the moment time 0.75τw in waves, Hw=0.04m, λ/Lpp=0.6, Fn=0.163

82
Haft front hull surface of the ships:
NBS-original: NBK-N6: NBK-N5:
Haft aft hull surface of the ships:
NBS-original: NBK-N6: NBK-N5:
Fig. 67 Dynamic pressure distributions at the moment time τw in waves, Hw=0.04m, λ/Lpp=0.6, Fn=0.163
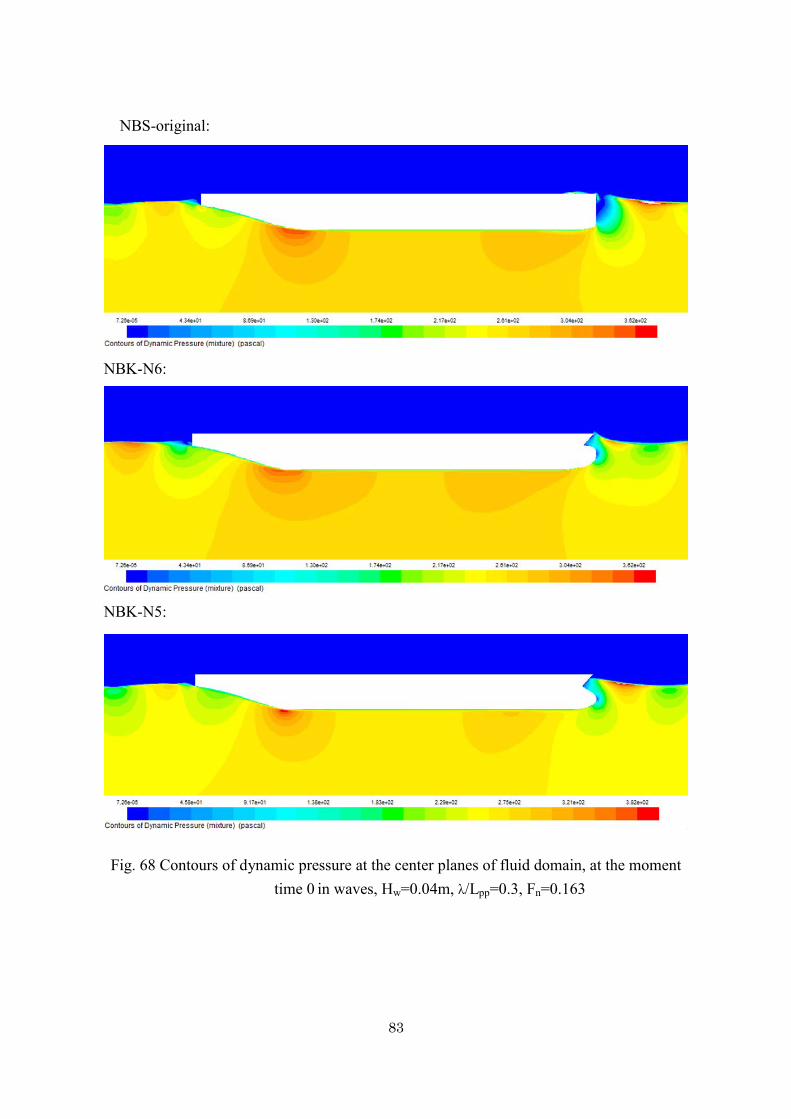
83
NBS-original:
NBK-N6:
NBK-N5:
Fig. 68 Contours of dynamic pressure at the center planes of fluid domain, at the moment time 0 in waves, Hw=0.04m, λ/Lpp=0.3, Fn=0.163
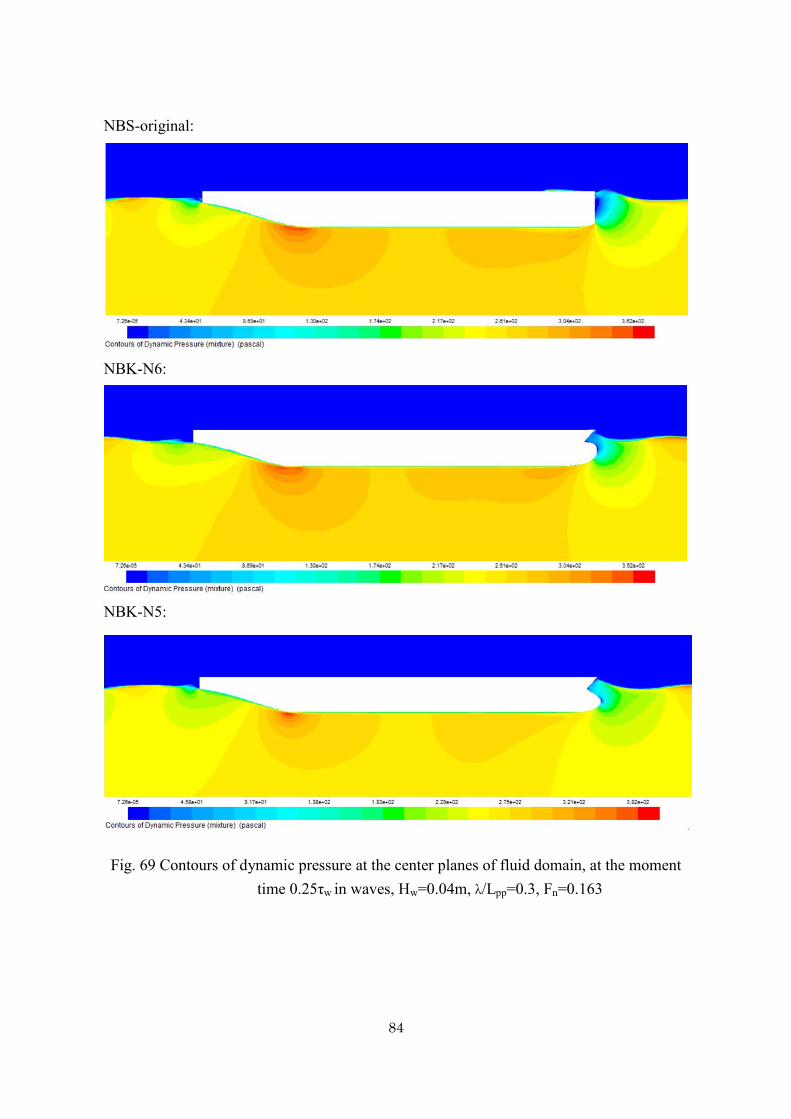
84
NBS-original:
NBK-N6:
NBK-N5:
Fig. 69 Contours of dynamic pressure at the center planes of fluid domain, at the moment time 0.25τw in waves, Hw=0.04m, λ/Lpp=0.3, Fn=0.163

85
NBS-original:
NBK-N6:
NBK-N5:
Fig. 70 Contours of dynamic pressure at the center planes of fluid domain, at the moment time 0.5τw in waves, Hw=0.04m, λ/Lpp=0.3, Fn=0.163

86
NBS-original:
NBK-N6:
NBK-N5:
Fig. 71 Contours of dynamic pressure at the center planes of fluid domain, at the moment time 0.75τw in waves, Hw=0.04m, λ/Lpp=0.3, Fn=0.163
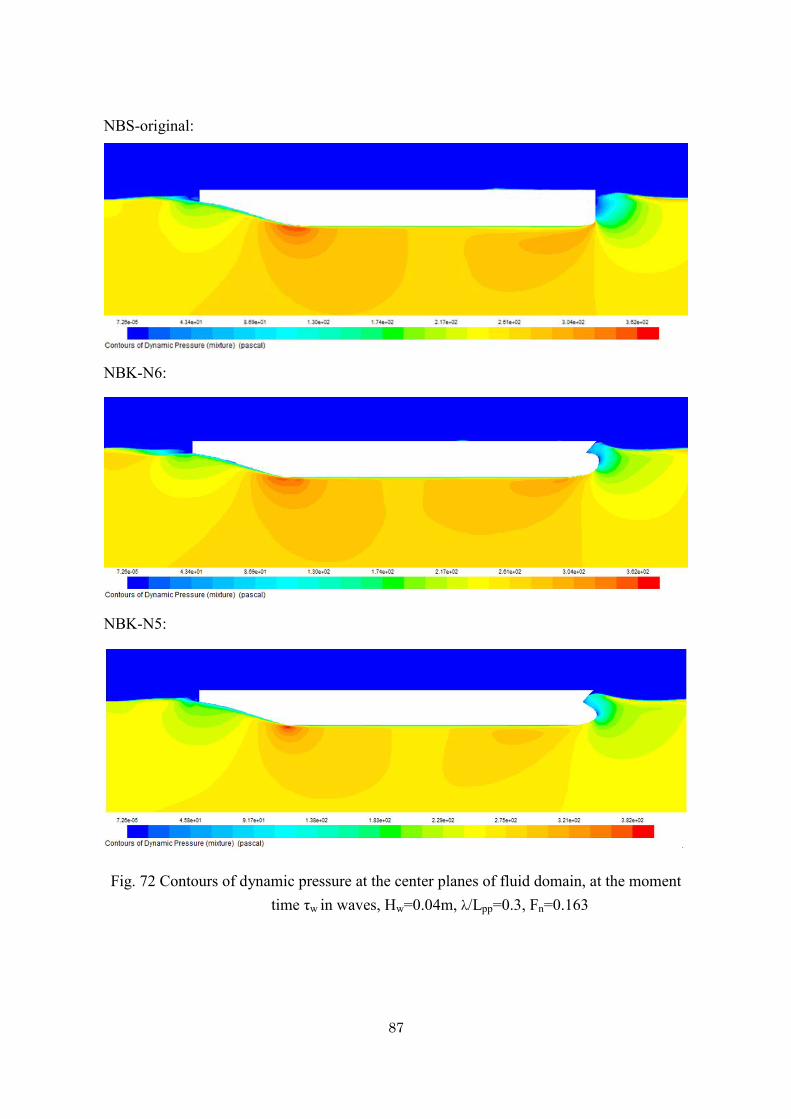
87
NBS-original:
NBK-N6:
NBK-N5:
Fig. 72 Contours of dynamic pressure at the center planes of fluid domain, at the moment time τw in waves, Hw=0.04m, λ/Lpp=0.3, Fn=0.163
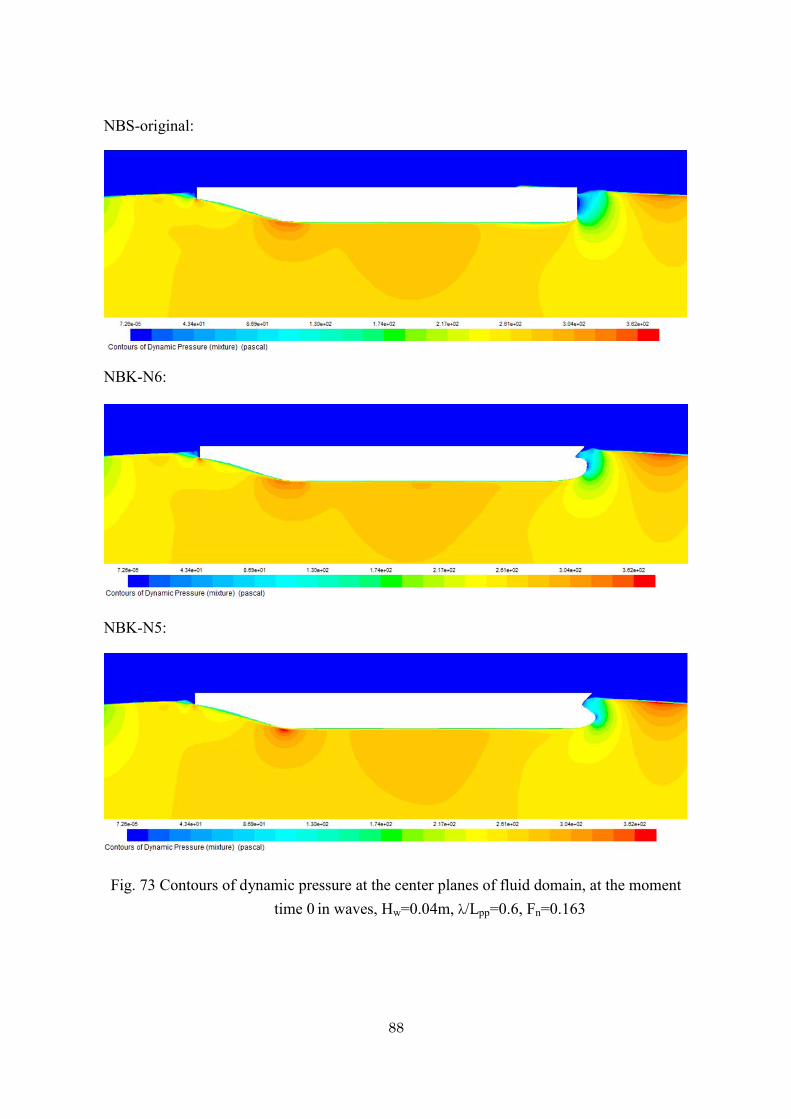
88
NBS-original:
NBK-N6:
NBK-N5:
Fig. 73 Contours of dynamic pressure at the center planes of fluid domain, at the moment time 0 in waves, Hw=0.04m, λ/Lpp=0.6, Fn=0.163

89
NBS-original:
NBK-N6:
NBK-N5:
Fig. 74 Contours of dynamic pressure at the center planes of fluid domain, at the moment time 0.25τw in waves, Hw=0.04m, λ/Lpp=0.6, Fn=0.163
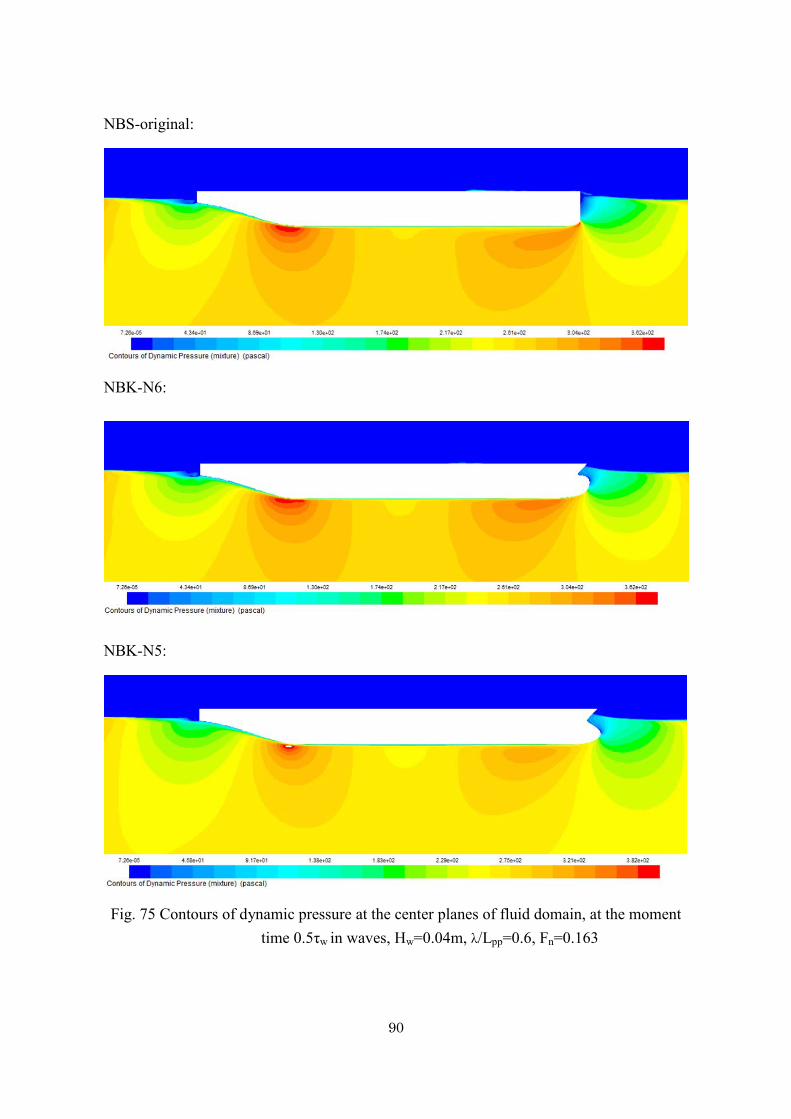
90
NBS-original:
NBK-N6:
NBK-N5:
Fig. 75 Contours of dynamic pressure at the center planes of fluid domain, at the moment time 0.5τw in waves, Hw=0.04m, λ/Lpp=0.6, Fn=0.163

91
NBS-original:
NBK-N6:
NBK-N5:
Fig. 76 Contours of dynamic pressure at the center planes of fluid domain, at the moment time 0.75τw in waves, Hw=0.04m, λ/Lpp=0.6, Fn=0.163

92
NBS-original:
NBK-N6:
NBK-N5:
Fig. 77 Contours of dynamic pressure at the center planes of fluid domain, at the moment time τw in waves, Hw=0.04m, λ/Lpp=0.6, Fn=0.163

93
4.3. Velocity distribution in boundary layer
In this section velocity distribution in boundary layer at centerline of aft perpendicular
(AP) of the ships running in high waves and in calm water are investigated by the CFD. It
should be noted that AP is located at the end of stern. Incident wave is head wave, its wave
height (Hw) is 0.04m, and its ratio of wave length to ship length (λ/Lpp) is 0.3.
In Fig. 78 the calculate velocity distributions of the three ships in calm water are shown.
Slight differences between NBS-original and other two ships with bulbous bow can be seen.
It can be said that wakes at the stern end of NBK-N6 and NBK-N5 are slightly weaker than
that of NBS-original.
In Figs. 79~81 the calculated velocity distributions of them in high waves are shown
in a wave cycle. The results show that velocities in boundary layers in waves are faster
than those in calm water. This fact means that wakes of ships weaken due to head waves
and suggest that propulsive efficiency of a ship is declined by head waves.
Fig. 78 Velocity distributions in boundary layer at centerline of AP of the ships in calm
water at Fn=0.163
0
0.005
0.01
0.015
0.02
0.025
0 0.2 0.4 0.6 0.8 1
z/L
pp
u/U
NBK-N6 (in calm water)
NBK-N5 (in calm water)
NBS-original (in calm water)

94
Fig. 79 Velocity distributions in boundary layer at centerline of AP in one circle wave of
NBS-original running in regular head wave at Fn=0.163, Hw=0.04m, λ/Lpp=0.3
Fig. 80 Velocity distributions in boundary layer at centerline of AP in one circle wave of
NBK-N6 running in regular head wave at Fn=0.163, Hw=0.04m, λ/Lpp=0.3
0
0.005
0.01
0.015
0.02
0.025
0 0.2 0.4 0.6 0.8 1
z/L
pp
u/U
NBS-original (time 0)
NBS-original (time 0.25τw)
NBS-original (time 0.5τw)
NBS-original (time 0.75τw)
NBS-original (time τw)
NBS-original (in calm water)
0
0.005
0.01
0.015
0.02
0.025
0 0.2 0.4 0.6 0.8 1
z/L
pp
u/U
NBK-N6 (time 0)
NBK-N6 (time 0.25τw)
NBK-N6 (time 0.5τw)
NBK-N6 (time 0.75τw)
NBK-N6 (time τw)
NBK-N6 (in calm water)
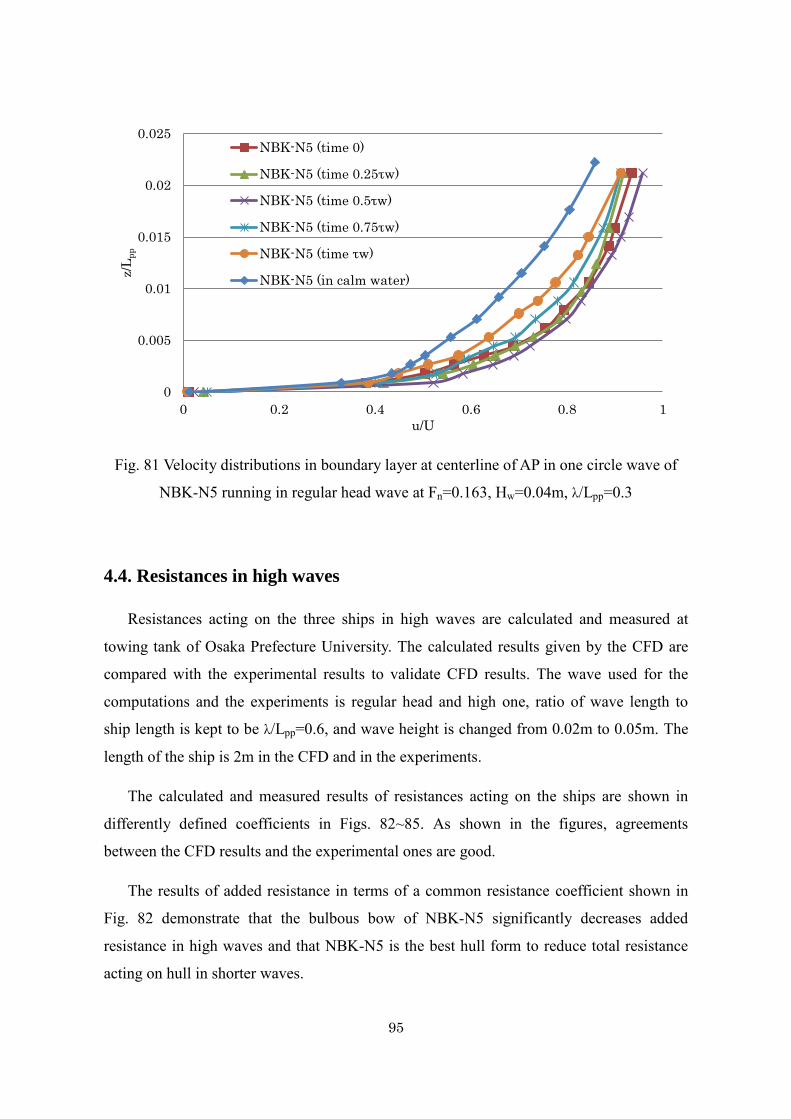
95
Fig. 81 Velocity distributions in boundary layer at centerline of AP in one circle wave of
NBK-N5 running in regular head wave at Fn=0.163, Hw=0.04m, λ/Lpp=0.3
4.4. Resistances in high waves
Resistances acting on the three ships in high waves are calculated and measured at
towing tank of Osaka Prefecture University. The calculated results given by the CFD are
compared with the experimental results to validate CFD results. The wave used for the
computations and the experiments is regular head and high one, ratio of wave length to
ship length is kept to be λ/Lpp=0.6, and wave height is changed from 0.02m to 0.05m. The
length of the ship is 2m in the CFD and in the experiments.
The calculated and measured results of resistances acting on the ships are shown in
differently defined coefficients in Figs. 82~85. As shown in the figures, agreements
between the CFD results and the experimental ones are good.
The results of added resistance in terms of a common resistance coefficient shown in
Fig. 82 demonstrate that the bulbous bow of NBK-N5 significantly decreases added
resistance in high waves and that NBK-N5 is the best hull form to reduce total resistance
acting on hull in shorter waves.
0
0.005
0.01
0.015
0.02
0.025
0 0.2 0.4 0.6 0.8 1
z/L
pp
u/U
NBK-N5 (time 0)
NBK-N5 (time 0.25τw)
NBK-N5 (time 0.5τw)
NBK-N5 (time 0.75τw)
NBK-N5 (time τw)
NBK-N5 (in calm water)
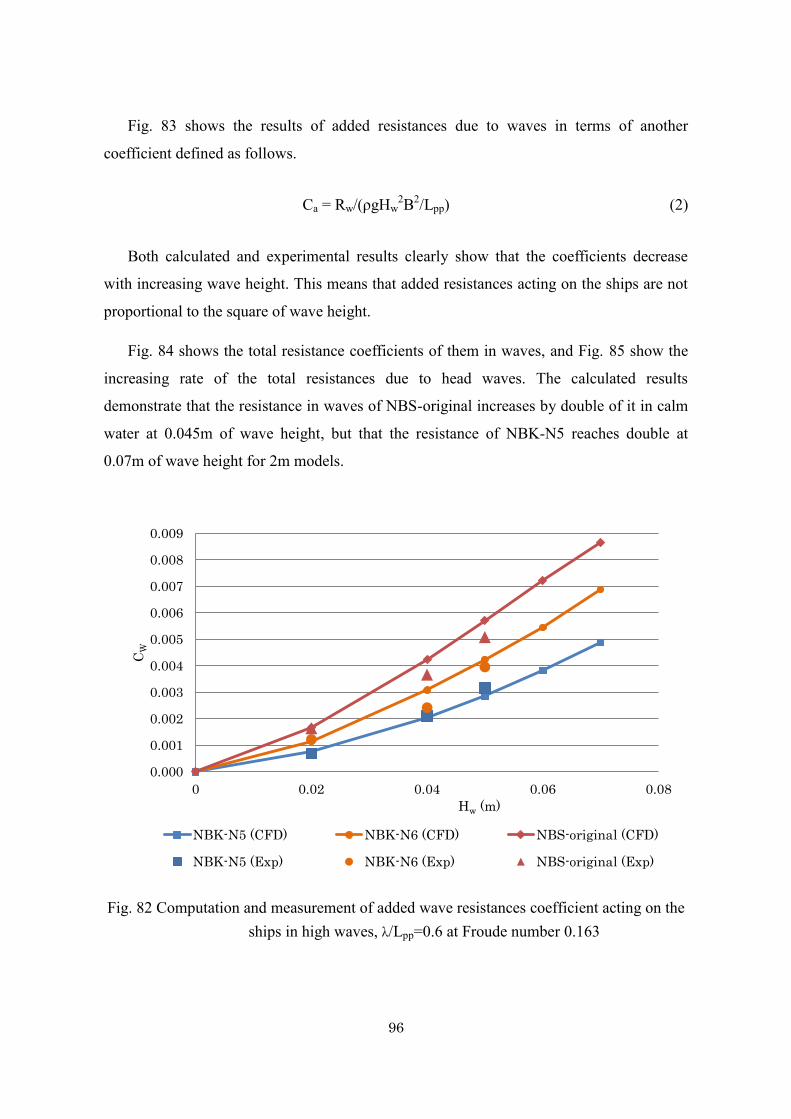
96
Fig. 83 shows the results of added resistances due to waves in terms of another
coefficient defined as follows.
Ca = Rw/(ρgHw2B2/Lpp) (2)
Both calculated and experimental results clearly show that the coefficients decrease
with increasing wave height. This means that added resistances acting on the ships are not
proportional to the square of wave height.
Fig. 84 shows the total resistance coefficients of them in waves, and Fig. 85 show the
increasing rate of the total resistances due to head waves. The calculated results
demonstrate that the resistance in waves of NBS-original increases by double of it in calm
water at 0.045m of wave height, but that the resistance of NBK-N5 reaches double at
0.07m of wave height for 2m models.
Fig. 82 Computation and measurement of added wave resistances coefficient acting on the ships in high waves, λ/Lpp=0.6 at Froude number 0.163
0.000
0.001
0.002
0.003
0.004
0.005
0.006
0.007
0.008
0.009
0 0.02 0.04 0.06 0.08
CW
Hw (m)
NBK-N5 (CFD) NBK-N6 (CFD) NBS-original (CFD)
NBK-N5 (Exp) NBK-N6 (Exp) NBS-original (Exp)

97
Fig. 83 Computation and measurement of added wave resistances coefficient acting on the ships in high waves, λ/Lpp=0.6 at Froude number 0.163
Fig. 84 Computation and measurement of total resistances coefficient acting on the ships in high waves, λ/Lpp=0.6 at Froude number 0.163
0
0.2
0.4
0.6
0.8
1
1.2
1.4
1.6
1.8
0.01 0.02 0.03 0.04 0.05 0.06 0.07 0.08
RW
/(ρgH
W2B
2/L
pp)
Hw (m)
NBS-origial (Exp) NBK-N6 (Exp) NBK-N5 (Exp)
NBS-original (CFD) NBK-N6 (CFD) NBK-N5 (CFD)
0.000
0.002
0.004
0.006
0.008
0.010
0.012
0.014
0.016
0 0.02 0.04 0.06 0.08
CT
Hw (m)
NBK-N5 (CFD) NBK-N6 (CFD) NBS-original (CFD)
NBK-N5 (Exp) NBK-N6 (Exp) NBS-original (Exp)
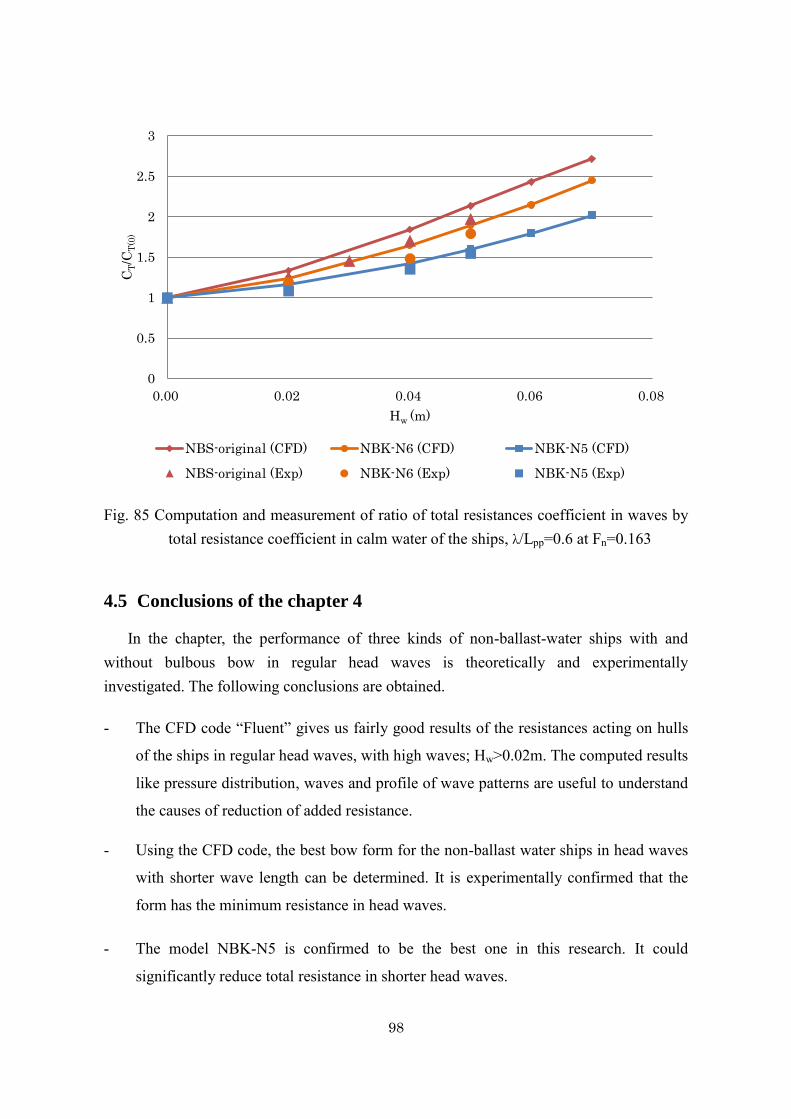
98
Fig. 85 Computation and measurement of ratio of total resistances coefficient in waves by total resistance coefficient in calm water of the ships, λ/Lpp=0.6 at Fn=0.163
4.5 Conclusions of the chapter 4
In the chapter, the performance of three kinds of non-ballast-water ships with and without bulbous bow in regular head waves is theoretically and experimentally investigated. The following conclusions are obtained.
- The CFD code “Fluent” gives us fairly good results of the resistances acting on hulls
of the ships in regular head waves, with high waves; Hw>0.02m. The computed results
like pressure distribution, waves and profile of wave patterns are useful to understand
the causes of reduction of added resistance.
- Using the CFD code, the best bow form for the non-ballast water ships in head waves
with shorter wave length can be determined. It is experimentally confirmed that the
form has the minimum resistance in head waves.
- The model NBK-N5 is confirmed to be the best one in this research. It could
significantly reduce total resistance in shorter head waves.
0
0.5
1
1.5
2
2.5
3
0.00 0.02 0.04 0.06 0.08
CT/C
T(0
)
Hw (m)
NBS-original (CFD) NBK-N6 (CFD) NBK-N5 (CFD)
NBS-original (Exp) NBK-N6 (Exp) NBK-N5 (Exp)

99
- Reduction of the total resistance of NBK-N5 in head waves is kept even high wave.
- It was theoretically and experimentally confirmed that added resistance due to waves
is not proportional to the square of wave height. The CFD can correctly show the
dependency of the added resistance on wave height.

100

101
CHAPTER 5:
CFD CALCULATION
OF AIR RESISTANCE
5.1. Air resistance acting on accommodations of ships
5.1.1 Box shape accommodation
Air resistance acting on a box shape as shown in Fig. 86 is computed. The
accommodation is named as N1, and used as reference shape in the present chapter. The
dimensions of the accommodation are shown in Table 6.
N1: N2: N3: N4:
N4: N5: N6: N7:
Fig. 86 Box shapes accommodations, N1~7
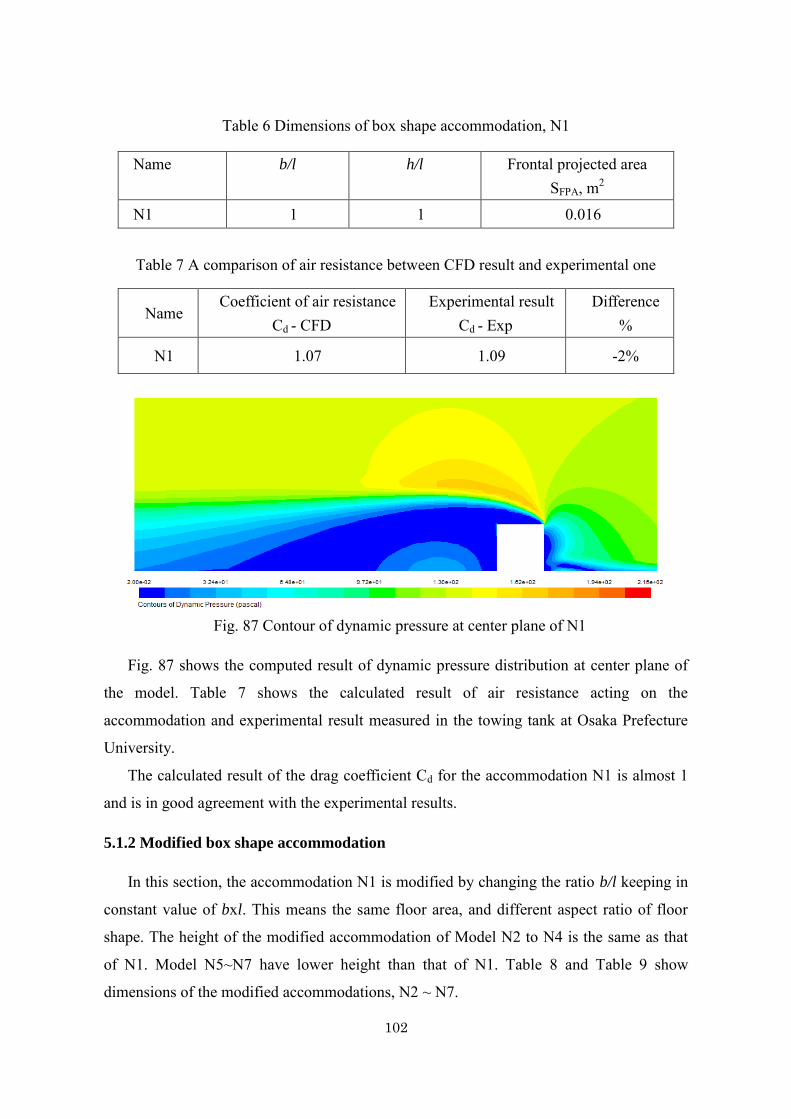
102
Table 6 Dimensions of box shape accommodation, N1
Name b/l h/l Frontal projected area SFPA, m2
N1 1 1 0.016
Table 7 A comparison of air resistance between CFD result and experimental one
Name Coefficient of air resistance
Cd - CFD Experimental result
Cd - Exp Difference
%
N1 1.07 1.09 -2%
Fig. 87 Contour of dynamic pressure at center plane of N1
Fig. 87 shows the computed result of dynamic pressure distribution at center plane of
the model. Table 7 shows the calculated result of air resistance acting on the
accommodation and experimental result measured in the towing tank at Osaka Prefecture
University.
The calculated result of the drag coefficient Cd for the accommodation N1 is almost 1
and is in good agreement with the experimental results.
5.1.2 Modified box shape accommodation
In this section, the accommodation N1 is modified by changing the ratio b/l keeping in
constant value of bxl. This means the same floor area, and different aspect ratio of floor
shape. The height of the modified accommodation of Model N2 to N4 is the same as that
of N1. Model N5~N7 have lower height than that of N1. Table 8 and Table 9 show
dimensions of the modified accommodations, N2 ~ N7.
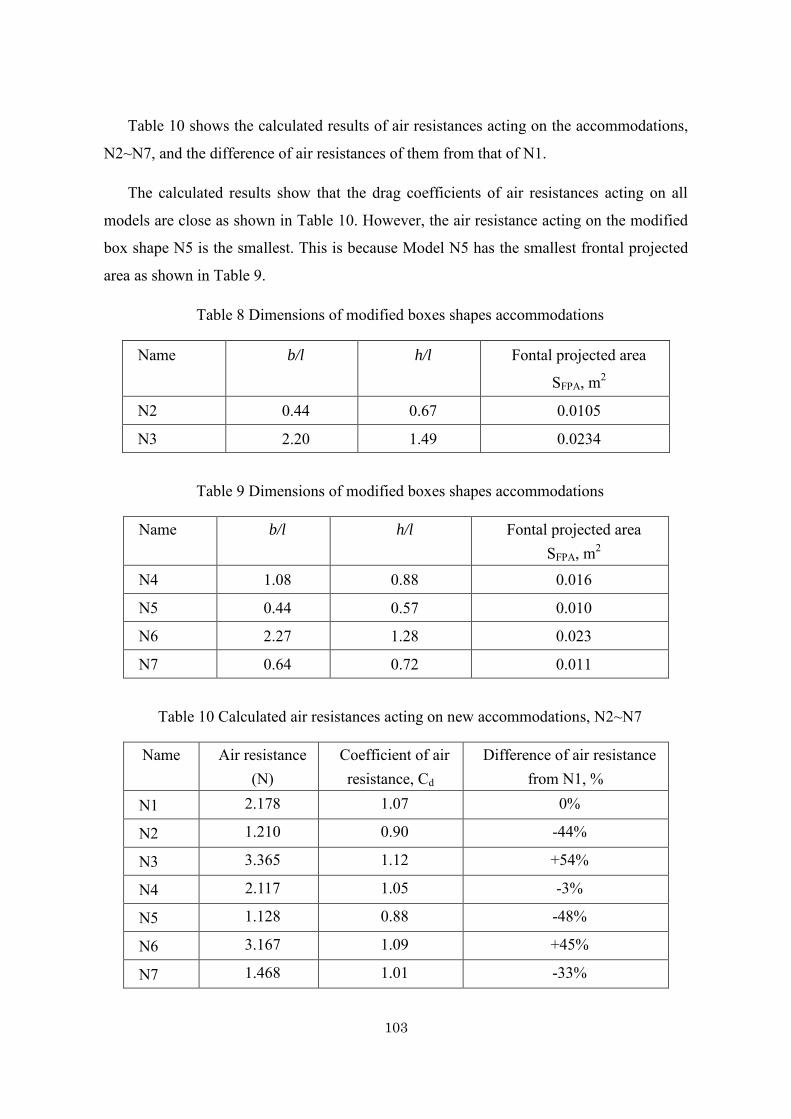
103
Table 10 shows the calculated results of air resistances acting on the accommodations,
N2~N7, and the difference of air resistances of them from that of N1.
The calculated results show that the drag coefficients of air resistances acting on all
models are close as shown in Table 10. However, the air resistance acting on the modified
box shape N5 is the smallest. This is because Model N5 has the smallest frontal projected
area as shown in Table 9.
Table 8 Dimensions of modified boxes shapes accommodations
Name b/l h/l Fontal projected area
SFPA, m2
N2 0.44 0.67 0.0105
N3 2.20 1.49 0.0234
Table 9 Dimensions of modified boxes shapes accommodations
Name b/l h/l Fontal projected area SFPA, m2
N4 1.08 0.88 0.016
N5 0.44 0.57 0.010
N6 2.27 1.28 0.023
N7 0.64 0.72 0.011
Table 10 Calculated air resistances acting on new accommodations, N2~N7
Name Air resistance (N)
Coefficient of air resistance, Cd
Difference of air resistance from N1, %
N1 2.178 1.07 0%
N2 1.210 0.90 -44%
N3 3.365 1.12 +54%
N4 2.117 1.05 -3%
N5 1.128 0.88 -48%
N6 3.167 1.09 +45%
N7 1.468 1.01 -33%
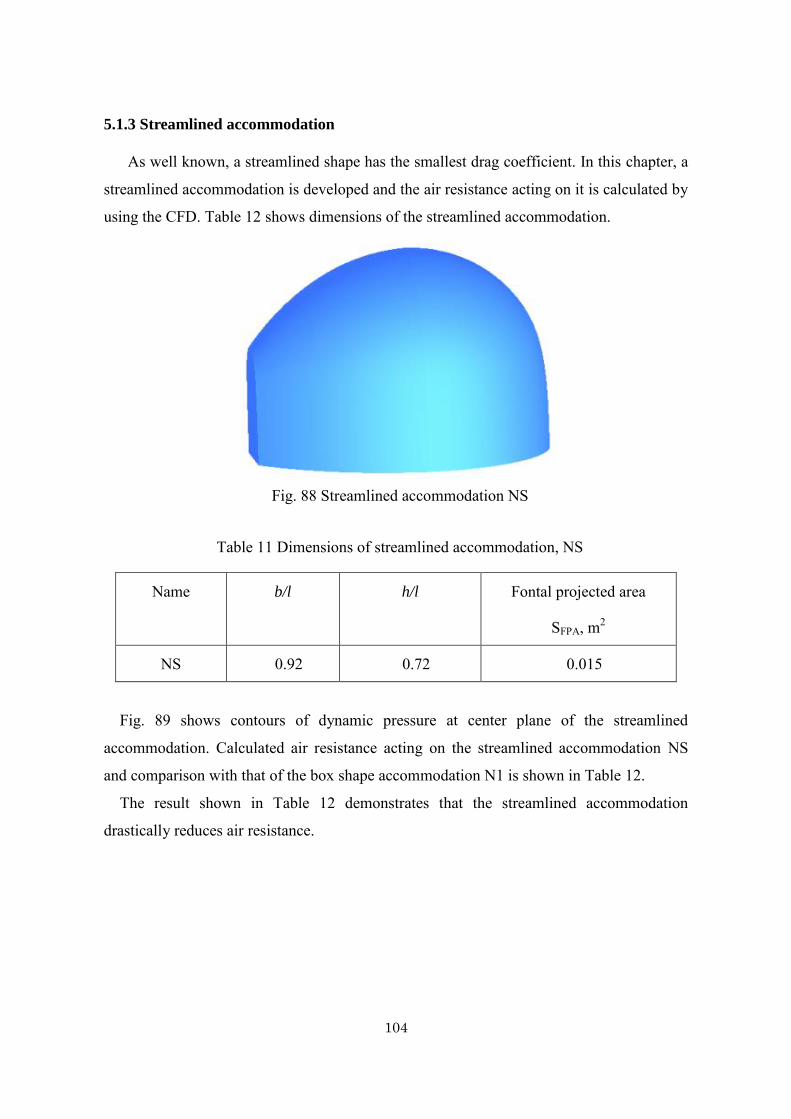
104
5.1.3 Streamlined accommodation
As well known, a streamlined shape has the smallest drag coefficient. In this chapter, a
streamlined accommodation is developed and the air resistance acting on it is calculated by
using the CFD. Table 12 shows dimensions of the streamlined accommodation.
Fig. 88 Streamlined accommodation NS
Table 11 Dimensions of streamlined accommodation, NS
Name b/l h/l Fontal projected area
SFPA, m2
NS 0.92 0.72 0.015
Fig. 89 shows contours of dynamic pressure at center plane of the streamlined
accommodation. Calculated air resistance acting on the streamlined accommodation NS
and comparison with that of the box shape accommodation N1 is shown in Table 12.
The result shown in Table 12 demonstrates that the streamlined accommodation
drastically reduces air resistance.

105
Fig. 89 Contour of dynamic pressure at center plane of streamlined accommodation
Table 12 Calculated air resistances acting on accommodations, N1 and NS
Name Air resistance
(N)
Coefficient of
air resistance, Cd
Difference of air
resistance from N1, %
N1 2.178 1.07 0%
NS 0.603 0.31 -72%
5.1.4 Optimum shape for accommodation of ship
A streamlined accommodation is an optimum one. In this section an accommodation
whose air resistance is close to a streamlined one but which could be built easily is
developed. Fig. 90 shows a shape modified from the box shape N7 by systematically
changing the front shapes. The dimensions of them are the same as those of N7. Table 14
shows dimensions of them.
Fig. 90 Modified box shape accommodation from N7
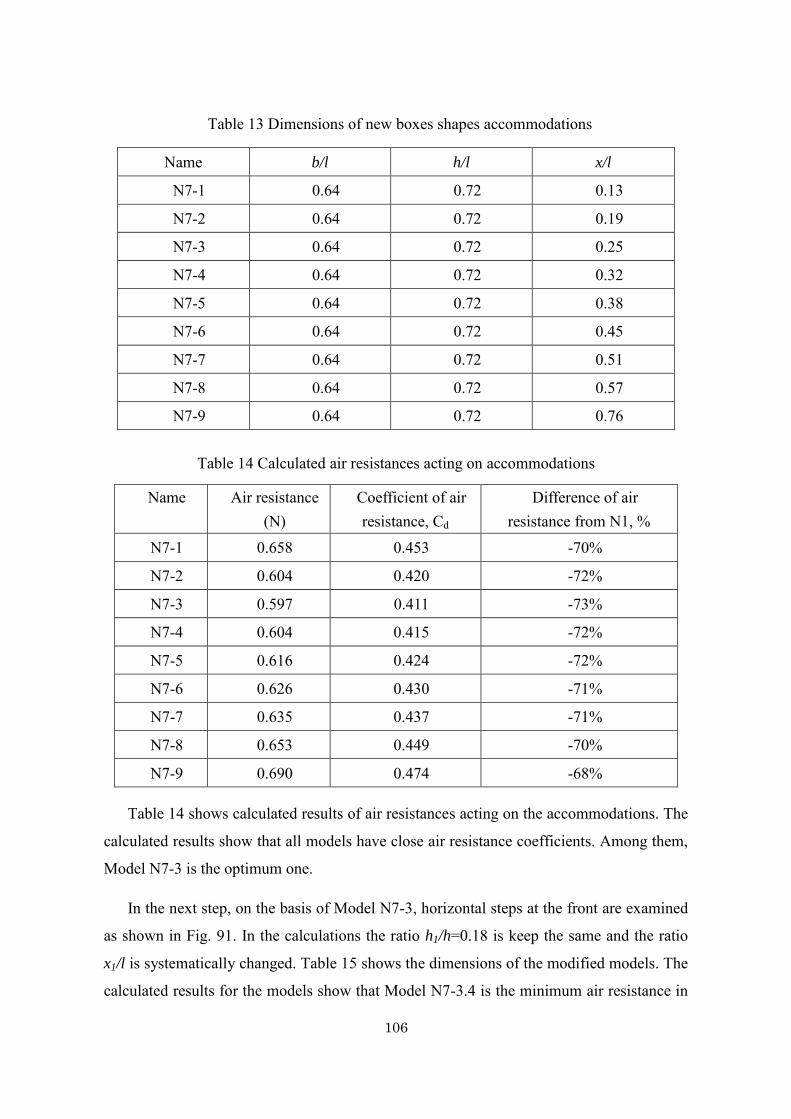
106
Table 13 Dimensions of new boxes shapes accommodations
Name b/l h/l x/l
N7-1 0.64 0.72 0.13
N7-2 0.64 0.72 0.19
N7-3 0.64 0.72 0.25
N7-4 0.64 0.72 0.32
N7-5 0.64 0.72 0.38
N7-6 0.64 0.72 0.45
N7-7 0.64 0.72 0.51
N7-8 0.64 0.72 0.57
N7-9 0.64 0.72 0.76
Table 14 Calculated air resistances acting on accommodations
Name Air resistance (N)
Coefficient of air resistance, Cd
Difference of air resistance from N1, %
N7-1 0.658 0.453 -70%
N7-2 0.604 0.420 -72%
N7-3 0.597 0.411 -73%
N7-4 0.604 0.415 -72%
N7-5 0.616 0.424 -72%
N7-6 0.626 0.430 -71%
N7-7 0.635 0.437 -71%
N7-8 0.653 0.449 -70%
N7-9 0.690 0.474 -68%
Table 14 shows calculated results of air resistances acting on the accommodations. The
calculated results show that all models have close air resistance coefficients. Among them,
Model N7-3 is the optimum one.
In the next step, on the basis of Model N7-3, horizontal steps at the front are examined
as shown in Fig. 91. In the calculations the ratio h1/h=0.18 is keep the same and the ratio
x1/l is systematically changed. Table 15 shows the dimensions of the modified models. The
calculated results for the models show that Model N7-3.4 is the minimum air resistance in

107
this case and its resistance coefficient Cd reaches 0.395 which is larger than that of the
streamlined one, 0.31.
On the basis of Model N7-3.4, some models by changing ratio h1/h are developed as
shown in Table 17. Calculated results are shown in Table 18. The calculated results show
at h1/h=0.09 the air resistance acting on Model N7-3.4.1 is minimum, and its resistance
coefficient reaches 0.39.
Fig. 91 Accommodation with horizontal step in the front
Table 15 Dimensions of accommodations, N7-3.1~3.5
Name b/l h/l h1/h x1/l
N7-3.1 0.64 0.72 0.18 0.32
N7-3.2 0.64 0.72 0.18 0.25
N7-3.3 0.64 0.72 0.18 0.19
N7-3.4 0.64 0.72 0.18 0.13
N7-3.5 0.64 0.72 0.18 0.06
Table 16 Calculated air resistance
Name Air resistance
(N)
Coefficient of air
resistance, Cd
Difference of air
resistance from N1, %
N7-3.1 0.585 0.403 -73%
N7-3.2 0.604 0.416 -72%
N7-3.3 0.578 0.398 -73%
N7-3.4 0.575 0.395 -74%
N7-3.5 0.600 0.413 -72%
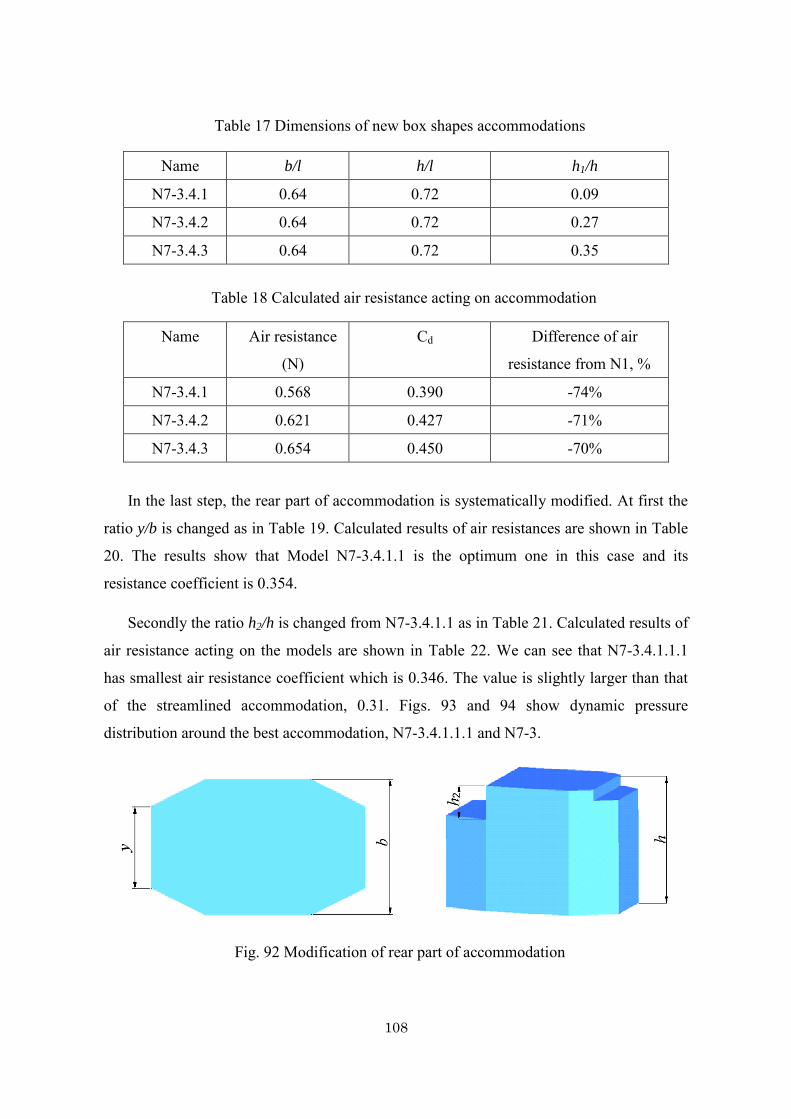
108
Table 17 Dimensions of new box shapes accommodations
Name b/l h/l h1/h
N7-3.4.1 0.64 0.72 0.09
N7-3.4.2 0.64 0.72 0.27
N7-3.4.3 0.64 0.72 0.35
Table 18 Calculated air resistance acting on accommodation
Name Air resistance
(N)
Cd Difference of air
resistance from N1, %
N7-3.4.1 0.568 0.390 -74%
N7-3.4.2 0.621 0.427 -71%
N7-3.4.3 0.654 0.450 -70%
In the last step, the rear part of accommodation is systematically modified. At first the
ratio y/b is changed as in Table 19. Calculated results of air resistances are shown in Table
20. The results show that Model N7-3.4.1.1 is the optimum one in this case and its
resistance coefficient is 0.354.
Secondly the ratio h2/h is changed from N7-3.4.1.1 as in Table 21. Calculated results of
air resistance acting on the models are shown in Table 22. We can see that N7-3.4.1.1.1
has smallest air resistance coefficient which is 0.346. The value is slightly larger than that
of the streamlined accommodation, 0.31. Figs. 93 and 94 show dynamic pressure
distribution around the best accommodation, N7-3.4.1.1.1 and N7-3.
Fig. 92 Modification of rear part of accommodation

109
Table 19 Dimensions of models with different rear parts
Name b/l h/l y/b
N7-3.4.1.1 0.64 0.72 0.8
N7-3.4.1.2 0.64 0.72 0.6
N7-3.4.1.3 0.64 0.72 0.4
Table 20 Calculated air resistance acting on accommodation
Name Air resistance
(N)
Cd Difference of air
resistance from N1, %
N7-3.4.1.1 0.515 0.354 -76%
N7-3.4.1.2 0.548 0.377 -75%
N7-3.4.1.3 0.555 0.382 -75%
Table 21 Dimensions of models with different rear parts
Name b/l h/l h2/h
N7-3.4.1.1.1 0.64 0.72 0.09
N7-3.4.1.1.2 0.64 0.72 0.18
N7-3.4.1.1.3 0.64 0.72 0.27
N7-3.4.1.1.4 0.64 0.72 0.36
Table 22 Calculated air resistance acting on accommodation
Name Air resistance
(N)
Cd Difference of air
resistance from N1, %
N7-3.4.1.1.1 0.503 0.346 -77%
N7-3.4.1.1.2 0.509 0.350 -77%
N7-3.4.1.1.3 0.522 0.359 -76%
N7-3.4.1.1.3 0.551 0.379 -75%

110
Fig. 93 Contour of dynamic pressure around N7-3
Fig. 94 Dynamic pressure distribution around N7-3.4.1.1.1

111
5.2. Interaction effects between hull and accommodation of ships
5.2.1 Interaction effects of location of accommodation on deck
In this section, interaction effects between a hull and an accommodation are investigated by changing location of an accommodation on deck as shown in Fig. 95.
Fig. 95 Locations of an accommodation on deck
Tables 23&24 show calculated air resistance and interaction effects on air resistance between a hull and a box shape accommodation. The results show that location of an accommodation of a ship on deck has significant effects on air resistance acting on a ship. The results shown in Table 24 demonstrate that accommodation located at the front deck of a ship decreases the interaction effects but accommodation located at the aft deck increases the interaction effects. Figs. 96~100 show computed results of dynamic pressure around hulls at the locations P1~P11.
Table 23 Effects of located accommodation on air resistance acting on ships
No Air resistance (N)
Difference from P1, %
Cd Difference from P1, %
P1 4.794 0% 0.736 0% P2 4.372 -9% 0.672 -9% P3 4.041 -16% 0.621 -16% P4 4.027 -16% 0.619 -16% P5 4.043 -16% 0.621 -16% P6 4.089 -15% 0.628 -15% P7 4.103 -14% 0.630 -14% P8 4.034 -16% 0.620 -16% P9 3.900 -19% 0.599 -19% P10 3.745 -22% 0.575 -22% P11 3.664 -24% 0.563 -24%
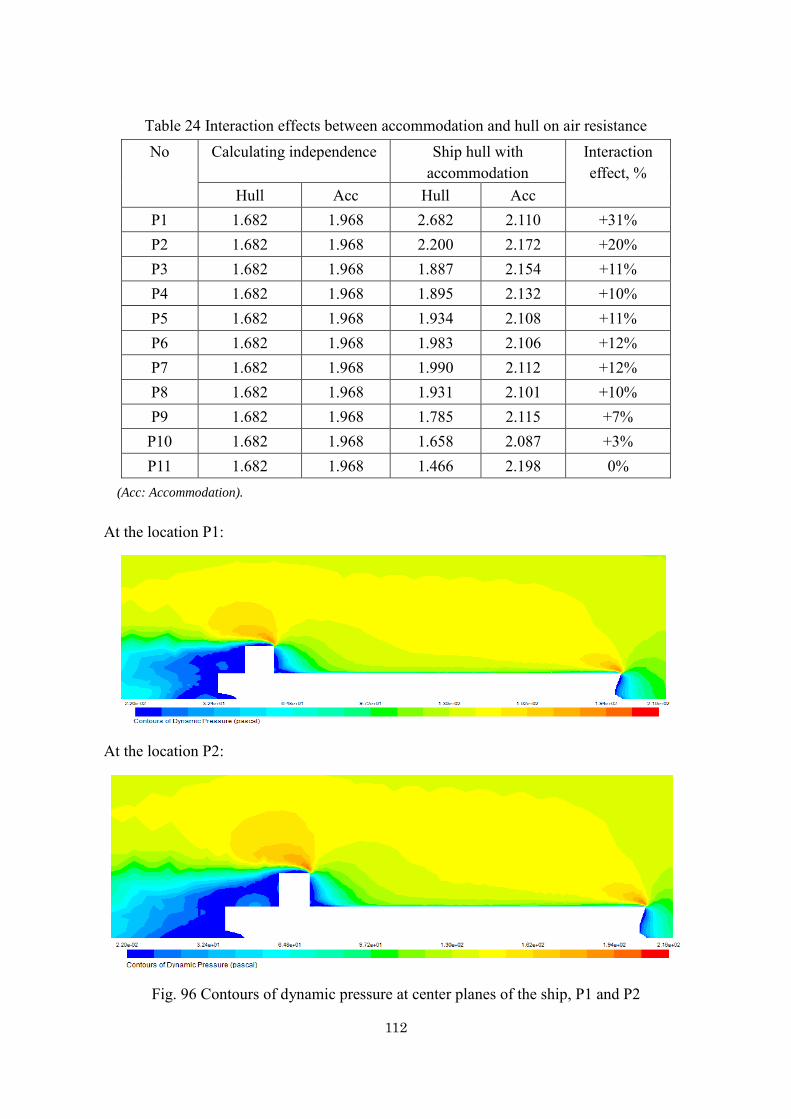
112
Table 24 Interaction effects between accommodation and hull on air resistance No Calculating independence Ship hull with
accommodation Interaction effect, %
Hull Acc Hull Acc P1 1.682 1.968 2.682 2.110 +31% P2 1.682 1.968 2.200 2.172 +20% P3 1.682 1.968 1.887 2.154 +11% P4 1.682 1.968 1.895 2.132 +10% P5 1.682 1.968 1.934 2.108 +11% P6 1.682 1.968 1.983 2.106 +12% P7 1.682 1.968 1.990 2.112 +12% P8 1.682 1.968 1.931 2.101 +10% P9 1.682 1.968 1.785 2.115 +7% P10 1.682 1.968 1.658 2.087 +3% P11 1.682 1.968 1.466 2.198 0%
(Acc: Accommodation).
At the location P1:
At the location P2:
Fig. 96 Contours of dynamic pressure at center planes of the ship, P1 and P2
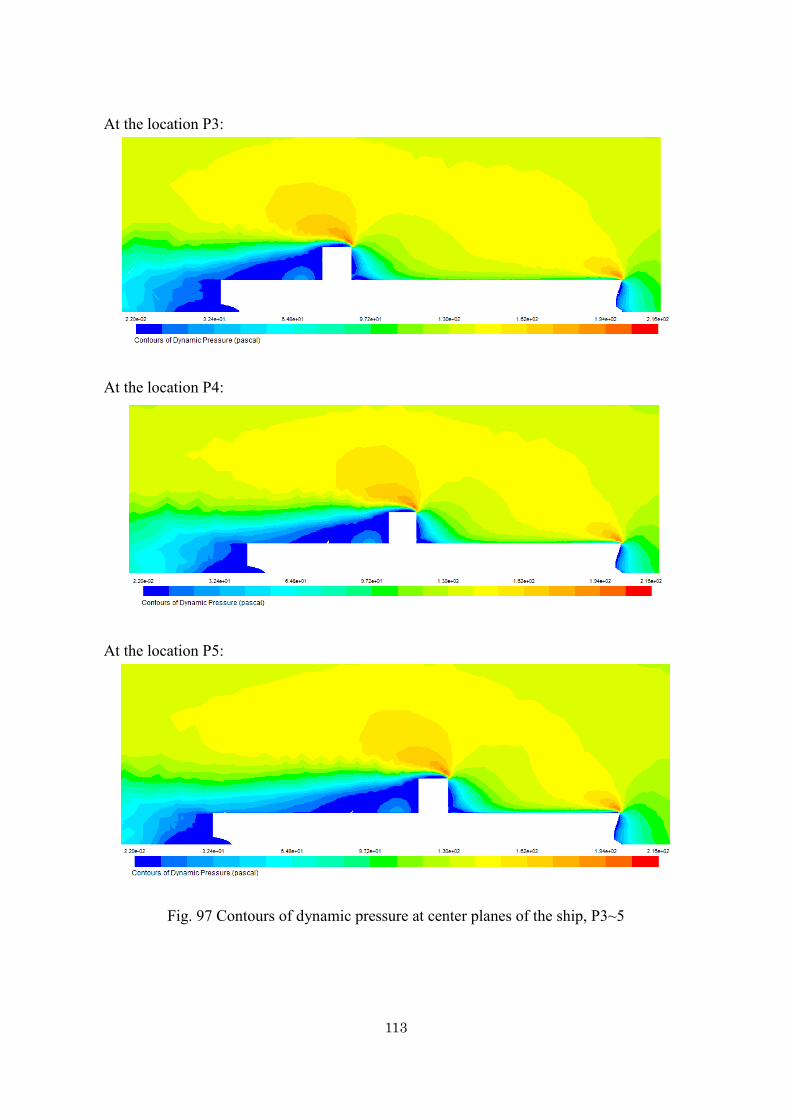
113
At the location P3:
At the location P4:
At the location P5:
Fig. 97 Contours of dynamic pressure at center planes of the ship, P3~5
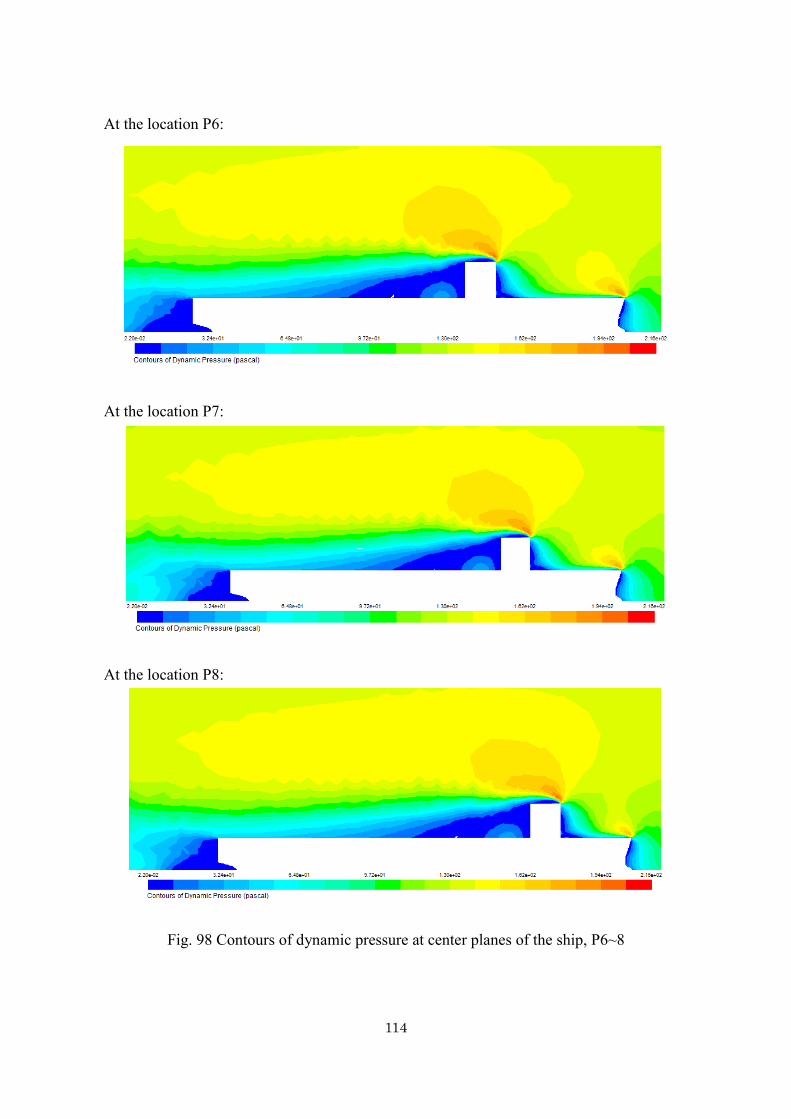
114
At the location P6:
At the location P7:
At the location P8:
Fig. 98 Contours of dynamic pressure at center planes of the ship, P6~8

115
At the location P9:
At the location P10:
At the location P11:
Fig. 99 Contours of dynamic pressure at center planes of the ship, P9~11

116
Fig. 100 Contours of velocity around hull of ship at center planes of calculated domain.
5.2.2 Interaction effects between hull and accommodation
In this section, effects of shape of accommodation on the interaction effects are
investigated. Three kinds of accommodations; N7-3, N7-3.4.1.1.1 and the streamlined
model NS, are located on deck of a ship as shown in Figs 101~103. Calculated air
resistance and interaction effects on it are shown in Table 25 and Table 26. The results
demonstrate that the ships with different three accommodations reduce air resistance by
31%~52% compared a conventional ship with a aft and box shape accommodation. As
shown in Table 26 the interaction effects play an important role on air resistance.
Computed dynamic pressure distributions and velocity flow at the center planes of
calculating domain are shown in Figs. 104~108. The results show clearly differences
among three kinds of the accommodations located on the deck of ship. It can be seen that
the streamlined accommodation clearly reduces separation behind it.

117
Fig. 101 Hull and accommodation model N7-3
Fig. 102 Hull and accommodation model N7-3.4.1.1.1
Fig. 103 Hull and streamline accommodation NS.
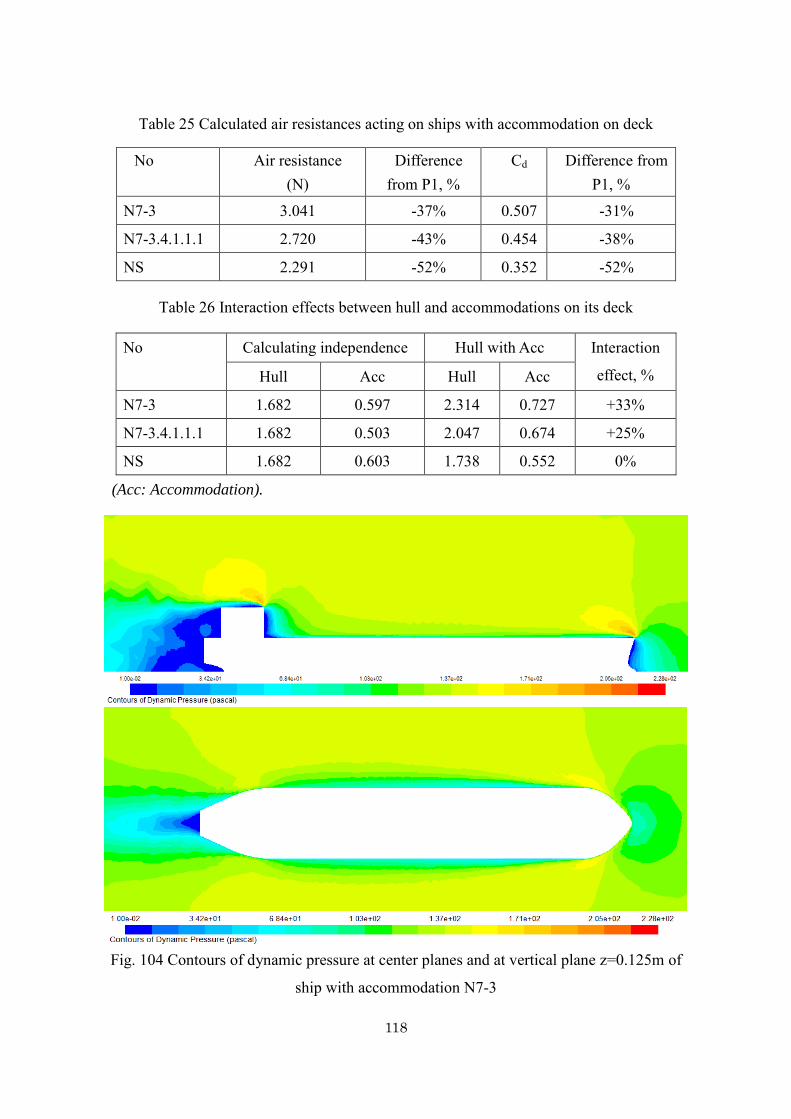
118
Table 25 Calculated air resistances acting on ships with accommodation on deck
No Air resistance (N)
Difference from P1, %
Cd Difference from P1, %
N7-3 3.041 -37% 0.507 -31%
N7-3.4.1.1.1 2.720 -43% 0.454 -38%
NS 2.291 -52% 0.352 -52%
Table 26 Interaction effects between hull and accommodations on its deck
No Calculating independence Hull with Acc Interaction
effect, % Hull Acc Hull Acc
N7-3 1.682 0.597 2.314 0.727 +33%
N7-3.4.1.1.1 1.682 0.503 2.047 0.674 +25%
NS 1.682 0.603 1.738 0.552 0%
(Acc: Accommodation).
Fig. 104 Contours of dynamic pressure at center planes and at vertical plane z=0.125m of
ship with accommodation N7-3

119
Hull with accommodation N7-3.4.1.1.1:
Hull with streamlined accommodation NS:
Fig. 105 Contours of dynamic pressure at center planes and at vertical plane z=0.125m of
ship with accommodation N7-3.4.1.1.1 and streamlined accommodation NS

120
Fig. 106 Contours of velocity around hull of ship at center plane and at vertical plane
z=0.125m of ship with accommodation N7-3
Fig. 107 Contours of velocity around hull of ship at center plane and at vertical plane
z=0.125m of ship with accommodation N7-3.4.1.1.1

121
Fig. 108 Contours of velocity around hull of ship at center planes and at vertical plane
z=0.125m of ship with streamlined accommodation NS
5.3. Conclusions of the chapter 5
The conclusions of this chapter are summarized as follows:
- It is confirmed that air resistance acting on a box shape accommodation can be
accurately calculated by CFD code, “Fluent”.
- Air resistance acting on a box shape accommodation decreases with its slenderness
because smaller frontal projected area of slender ones when floor area in the
accommodation is assumed to be constant.
- The streamlined accommodation developed in this study can drastically reduce the air
resistance because of weaker separation of flow.
- Accommodations constructed by only flat plates with almost the same air resistance
as that of the streamlined accommodation are developed by using the CFD code.
- It is confirmed that interaction effects between a hull and an accommodation on air

122
resistance increase the air resistance acting the whole ship by up to 30% compared
with that of a ship with a box shape accommodation.
- The hydrodynamic interaction effect depends on location and shape of an
accommodation. The accommodation located at bow makes the air resistance smaller.
For the box shape accommodation the interaction effect increases the air resistance,
but for the streamlined accommodation the effect decreases the air resistance.
123
CHAPTER 6:
CONCLUSION OF THESIS
The thesis studies on application of a CFD to calculations of resistances acting on ships
and optimization of their hydrodynamic performances. Some problems which was
introduced in the chapter 1 as well as the validation of the used CFD in the chapter 2,
optimization of bulbous bow shape for ships in the chapter 3, resistance acting on a hull of
ships in high waves in the chapter 4 and CFD calculation of air resistance acting on ships
in the chapter 5, are treated and following conclusions were obtained:
In the chapter 2, validations of a commercial CFD code “Fluent” are carried out. The
validations of the CFD results in computation of the velocity in boundary layer and
resistance acting on ship both of in calm water and in regular head waves are carried out by
comparing the CFD results with the experimental results. The conclusions are that the
accuracy of the CFD code is fairly good for the practical purposes and that the CFD code
could give us much information about pressure distributions, velocity distribution in
boundary layer and wave pattern around ships as well as the resistance acting on their
hulls. The obtained conclusions of the chapter 2 are as follows:
- It is confirmed that a commercial CFD code “FLUENT” gives us fairly good results of
the resistance acting on a ship hull both in calm water and in regular head wave,
viscous flow in boundary layer around it in calm water.
- The frictional resistances computed by the code and Schoenherr’s formula are slightly
different.
- The calculated results of the ratio of added resistance due to wave of two ships are in
good agreement with the experimental results.
- The improved bulbous bow shape of NBK-N6 could reduce by 10% of total resistance
in calm water and by 17% of total resistance in regular head waves with the wave
124
height Hw=0.02m, λ/Lpp <0.6, compared with that of the NBS-original. The results are
close with the calculated results given by the CFD code.
In the chapter 3, optimizations of bulbous bow shapes for ships are treated. The series
of newly developed bulbous bow shapes with smaller resistance than that of the original
ship were developed in the optimizing process. The optimum bow shape for the Non
Ballast Water Ships was determined, and it was experimentally confirmed that the bulbous
bow shape obtained by the optimization has minimum resistance. The conclusions of the
chapter 3 are detailed as follows:
- Series of bow shapes to reduce the resistance in waves as well as in calm water are
developed and the resistances of the series of hulls are calculated by the CFD code to
find an optimum hull shape. The optimum bow shapes among the developed hulls are
determined by comparing the calculated resistances for the series of hulls.
- In the evaluation of the total resistance, the optimum hull shape in calm water depends
on Froude number.
- The CFD code gives us a lot of important results like pressure distributions on the hull
surface, wave patterns at free surface, and so on. The information plays an important
role for understanding the phenomenon which causes the added resistance due to
waves and for developing less resistance hull shapes in an optimization process.
- The calculated results are in good agreement with the experimental ones. The optimum
hull shape NBK-N5 can decrease the added resistance in regular head waves (wave
height (Hw) = 0.02m and λ/Lpp<0.6) by 60% and total resistance by 15% at Froude
number 0.163.
In the chapter 4, the characteristics of added resistance in high waves were revealed by
using the CFD. The computed results of pressure, profiles of bow waves and wave pattern
generated by ships running in high waves, velocity distributions in boundary layer at the
aft-end of the ships and resistances acting on hulls of three ships were compared each other
to understand the causes of increase of the resistance due to high waves. The conclusions
obtained in the chapter 4 are as follows:
- The CFD code “Fluent” gives us fairly good results of the resistances acting on hulls

125
of the ships in regular head waves, with high waves; Hw>0.02m. The computed results
like pressure distribution, waves and profile of wave patterns are useful to understand
the causes of reduction of added resistance.
- Using the CFD code, the best bow form for the non-ballast water ships in head waves
with shorter wave length can be determined. It is experimentally confirmed that the
form has the minimum resistance in head waves.
- The model NBK-N5 is confirmed to be the best one in this research. It could
significantly reduce total resistance in shorter head waves.
- Reduction of the total resistance of NBK-N5 in head waves is kept even high wave.
- It was theoretically and experimentally confirmed that added resistance due to waves
is not proportional to the square of wave height. The CFD can correctly show the
dependency of the added resistance on wave height.
In the chapter 5, air resistances acting on ships are discussed. The air resistance acting
on ship was computed by the CFD to find the shape above water surface with minimum air
resistance. Effects of shapes of accommodations and interaction effects between an
accommodation and a hull are investigated. Following conclusions are obtained.
- It is confirmed that air resistance acting on a box shape accommodation can be
accurately calculated by CFD code, “Fluent”.
- Air resistance acting on a box shape accommodation decreases with its slenderness
because of smaller frontal projected area of slender ones when floor area in the
accommodation is assumed to be constant.
- The streamlined accommodation can drastically reduce the air resistance because of
weaker separation of flow.
- Accommodations constructed by only flat plates with almost the same air resistance as
that of the streamlined accommodation are developed by using the CFD code.
- It is confirmed that interaction effects between a hull and an accommodation increase
the air resistance acting the ship by up to 30%.

126
- The hydrodynamic interaction effect depends on location and shape of an
accommodation on deck of a hull. The accommodation located at bow makes the air
resistance smaller. For the box shape accommodation the interaction effect increases
the air resistance, but for the streamlined accommodation the effect decreases it.

127
List of Publications
No Title of the article Author(s)
Journal`s Name,
Vol., Pages, and
Year
Corresponding
chapter
1
A Study on Application of a Commercial CFD Code to Reduce Resistance Acting on a Non Ballast Tanker - Part 1
N.V. He Y. Nihei Y. Ikeda
Proceedings of the JASNAOE 2012,
Vol. 14, pp.415-418.
Chapter 2 2.1 2.2
Chapter 3 3.2.1
2
A Study on Application of a Commercial CFD Code to Reduce Resistance Acting on a Non Ballast Tanker - Part 2
N.V. He Y. Nihei Y. Ikeda
Proceedings of the 6th APHydro2012,
pp.264-269.
Chapter 3 3.1.1 3.1.2
3
A study on developing the hull of Non Ballast Tankers with minimum fuel consumption in waves
N.V. He Y. Ikeda
Proceedings of the 5th AUN/SEED
-Net RCNRE 2012, pp.253-258.
Chapter 2 2.3
Chapter 3 3.1.1; 3.1.2
4
A Study on an Optimum hull form in waves for Non-Ballast Tankers and Bulkers
N.V. He Y. Nihei Y. Ikeda
Proceedings of the 5th PAAMES
and AMEC2012, CD, No. NCS-01.
(6 pages)
Chapter 3 3.1.1 3.1.2 3.2.2
5
A Study on Application of a Commercial CFD Code to Reduce Resistance Acting on a Non Ballast Tanker - Part 3
N.V. He Y. Ikeda
Proceedings of the JASNAOE 2012,
Vol.15, pp.223-226.
Chapter 3 3.1.3 3.2.2
6
Development of a Minimum Resistance Hull Form of Non Ballast Tankers and Bulkers in Waves by Using CFD
N.V. He Y. Ikeda
Proceedings of the PRADS2013 on 20th - 25th
October, 2013 (Accepted)
Chapter 3 3.3
Chapter 4 4.1 4.2
7 Optimization of bow shape for Non Ballast Water Ships
N.V. He Y. Ikeda
Journal of Marine Science and
Application, 2013 (Accepted)
Chapter 2 2.1; 2.2
Chapter 3 3.1; 3.2
8
A Study on Interaction Effects between Hull and Accommodation on Air Resistance of a Ship
N.V. He Y. Ikeda
Proceedings of the JASNAOE 2013,
Vol. 16, pp.278-281.
Chapter 5 5.1~5.3

128
129
Bibliography
1. T. Tatsumi,Y. Nihei and Y. Ikeda: Development of a New Energy Saving Tanker with
Non Ballast water and Podded Propulsors, the 5th APHydro2010, pp. 25-28.
2. K. Sugata, Y. Iwamoto, Y. Ikeda and Y. Nihei: Reduction of Wind Force Acting on
Non-Ballast Ship, the 5th APHydro2010.
3. T. Tatsumi, Y. Nihei and Y. Ikeda, 2011: Development of a New Energy Saving Tanker
with Non Ballast water - Part 1, Japan, the JASNAOE, pp. 215-218 (in Japanese).
4. A. Tomita, Y. Nihei and Y. Ikeda, 2011: Development of a New Energy Saving Tanker
with Non Ballast water - Part 2, Japan, the JASNAOE, pp. 219-222 (in Japanese).
5. Zhi-rong Zhang et al, 2006: Application of CFD in ship engineering design practice and
ship hydrodynamic, Journal of Hydrodynamic, Vol. 18, pp. 315-322.
6. Y. Ahmed et al, 2009: Simulation of free surface flow around a VLCC hull using
viscous and potential flow methods, Ocean Engineering Vol. 36, pp. 691-696.
7. Dc-cheng Wan et al, 2010: Numerical simulation of viscous flows around surface ship
by level set method, Journal of Hydrodynamic, pp. 271-277.
8. Y.M. Ahmed, 2011: Numerical simulation for the free surface flow around a complex
ship hull form at different Froude numbers, Alexandria Engineering Journal, Vol. 50,
pp. 229-235.
9. C. Ciortan et al, 2012: Free surface flow around a ship model using an
interface-capturing method, Ocean Engineering, Vol. 44, pp. 57-67.
10. Bing-jie Guo et al, 2011: Evaluation of added resistance of KVLCC2 in short waves,
Journal of Hydrodynamic, Vol. 23, pp. 709-722.
11. Shukui Liu et al, 2011: Prediction of added resistance of ships in wave, Ocean
Engineering, Vol. 38, pp. 641-650.
130
12. Haixuan Ye et al, 2012: Numerical prediction of added resistance and vertical ship
motions in regular head waves, Journal of Marine Science and Application, pp.
410-416.
13. Bing-jie Guo et al, 2012: Sea-keeping prediction of KVLCC2 in head waves with
RANS, Applied Ocean Research, Vol. 35, pp. 56-67.
14. Hamid Sadat-Hosseini et al, 2013: CFD verification and validation of added resistance
and motions of KVLCC2 with fixed and free surge in short and long head wave,
Ocean Engineering, Vol. 59, pp. 240-273.
15. Sh. Mahmood and D. Huang: Computational Fluid Dynamic Based Bulbous bow
Optimization Using a Genetic Algorithm, Journal of Marine Science and Application,
2012, pp. 286-294.
16. Bertram, Volker: Practical ship hydrodynamic, Butterworth-Heinemann, Linacre
House, Jordan Hill, Oxford OX2 8DP.
17. ANSYS - Fluent V14.0 User`s Guide.
18. ITTC, 1999, CFD User’s Guide, No. 7.5-03-01-03.
19. ITTC, 2011, Practical Guideline for Ship CFD Application, No. 7.5-03-01-03.
20. http://www.cfd-online.com/Wiki/Best_practise_guidelines
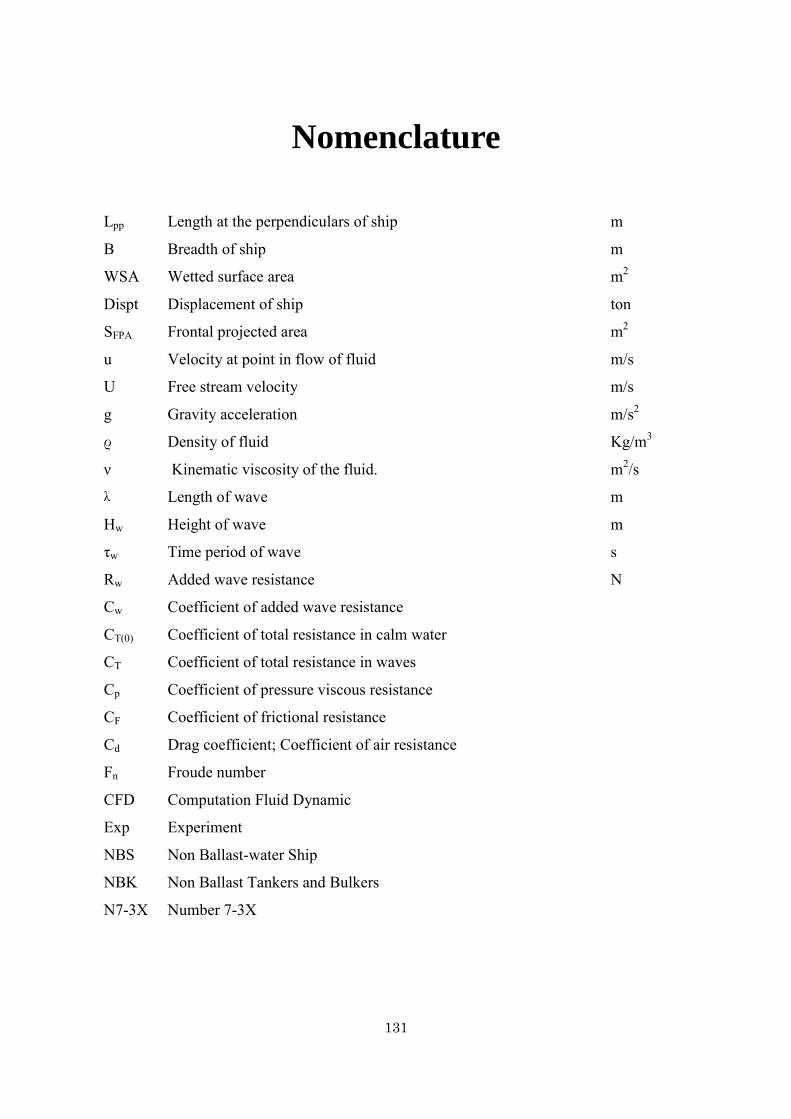
131
Nomenclature
Lpp Length at the perpendiculars of ship m
B Breadth of ship m
WSA Wetted surface area m2
Dispt Displacement of ship ton
SFPA Frontal projected area m2
u Velocity at point in flow of fluid m/s
U Free stream velocity m/s
g Gravity acceleration m/s2
ρ Density of fluid Kg/m3
ν Kinematic viscosity of the fluid. m2/s
λ Length of wave m
Hw Height of wave m
τw Time period of wave s
Rw Added wave resistance N
Cw Coefficient of added wave resistance
CT(0) Coefficient of total resistance in calm water
CT Coefficient of total resistance in waves
Cp Coefficient of pressure viscous resistance
CF Coefficient of frictional resistance
Cd Drag coefficient; Coefficient of air resistance
Fn Froude number
CFD Computation Fluid Dynamic
Exp Experiment
NBS Non Ballast-water Ship
NBK Non Ballast Tankers and Bulkers
N7-3X Number 7-3X