Embed Size (px)
Citation preview
8/8/2019 Beyond BER
http://slidepdf.com/reader/full/beyond-ber 1/18
SR-TN015
C213: BIT ERROR A NALYSIS A ND BEYOND
In the past, bit error rate testing meant transmitting a pseudo-random sequence of bitsthrough a channel under test and counting the number of incorrectly received bits at thereceiving end. This technique was adequate because the basic question to be answeredwas, "is it working?" Today's communications systems are pushing the envelope furtherand further, trying to squeeze as much bandwidth out of a channel as possible, and the
question has now become, "How can I make it work better?" Forward error correction,data compression, and sophisticated modulation codes are some examples of thesetechniques. In these systems, knowing the position of an error relative to the data beingtransmitted or relative to other errors, is crucial in order to optimize the efficiency of agiven technique. This class discusses many techniques for bit-accurate analysis, anddiscusses the concept of an overall system error budget.
J IM W ASCHURA S YNTHES YS R ESEARCH, I NC.
Jim Waschura received a BA degree in math and computer science from Hiram College innortheast Ohio. He is a co-founder of SyntheSys Research Inc., which provides testequipment for digital channel development in the communications, tape recording, disk recording, and television industries.
T E C H
N O T E S
www.synthesysresearch.com650 364-1853
8/8/2019 Beyond BER
http://slidepdf.com/reader/full/beyond-ber 2/18
SR-TN015 1
INTRODUCTION
More and more innovative applications of digital communications are being engineeredeveryday, including digital cellular telephones, cellular TCP/IP, infrared desktop networks, digitalcordless telephones, and direct satellite television broadcasts. Our existing communicationsinfrastructure—made up of copper and optical land lines and terrestrial and satellite radio links—isconstantly being pushed to provide higher bandwidth in support of the three big data applications:television, telephone, and computer networking. Thanks to CD players, modems, DAT recorders,modern cellular telephones, and direct satellite television broadcasts, “digital” is a now a household
word.
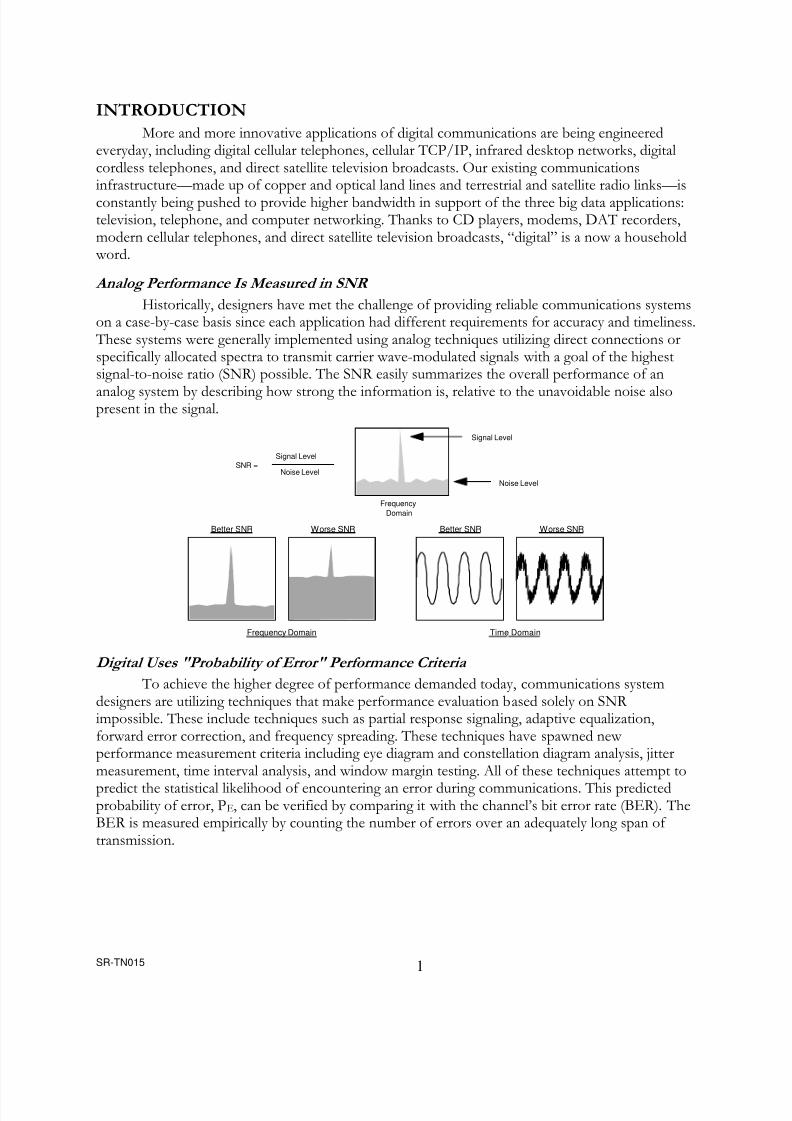
Analog Performance Is Measured in SNR Historically, designers have met the challenge of providing reliable communications systems
on a case-by-case basis since each application had different requirements for accuracy and timeliness. These systems were generally implemented using analog techniques utilizing direct connections orspecifically allocated spectra to transmit carrier wave-modulated signals with a goal of the highestsignal-to-noise ratio (SNR) possible. The SNR easily summarizes the overall performance of an
analog system by describing how strong the information is, relative to the unavoidable noise alsopresent in the signal.
Signal Level
Noise Level
FrequencyDomain
SNR =Signal Level
Noise Level
Time Domain
Better SNR Worse SNRBetter SNR Worse SNR
Frequency Domain
Digital Uses "Probability of Error" Performance Criteria To achieve the higher degree of performance demanded today, communications system
designers are utilizing techniques that make performance evaluation based solely on SNR impossible. These include techniques such as partial response signaling, adaptive equalization,forward error correction, and frequency spreading. These techniques have spawned new performance measurement criteria including eye diagram and constellation diagram analysis, jittermeasurement, time interval analysis, and window margin testing. All of these techniques attempt topredict the statistical likelihood of encountering an error during communications. This predictedprobability of error, P E, can be verified by comparing it with the channel’s bit error rate (BER). TheBER is measured empirically by counting the number of errors over an adequately long span of transmission.
8/8/2019 Beyond BER
http://slidepdf.com/reader/full/beyond-ber 3/18
SR-TN015 2
Errors Are Related to Power and Noise In digital communications systems (DCS), each bit is transmitted with a certain amount of
energy, Eb, and the channel contains a certain amount of noise, N 0. In general, decreased Eb/N 0 values imply increased probability of error in the channel. The Eb/N 0 is often treated like the SNR of an analog channel—a single metric indicating performance.
Translating E b /N 0 to P E There are difficulties with direct translation from Eb/N0 to PE. First, the mathematical
models are becoming increasingly complex for sophisticated communications techniques. This hasled some researchers to make erroneous performance claims [1]. The formula for describing theprobability of error when transmitting NRZ bits along a piece of copper wire in the face of averagenoise level is very tractable. But systems with compression, forward error correction, adaptiveequalization, advanced multibit encoding, frequency spreading, and carrier wave modulation,transmitted in environments with space noise, system noise, co-channel interference, multipathinterference, and weather effects pose very challenging problems in modeling.
Secondly, the noise figure, N0, is generally modeled as a random process in mathematics,
and sophisticated communications techniques are increasingly being faced with less random errorsand more highly correlated errors. Accounting for these correlated errors, including error bursts anderrors caused by discrete frequency interferences like multipath, are becoming the difficult part of communications system design, and single-parameter measurements like SNR and Eb/N0, and evenBER for that matter, are not adequate for designing systems with instantaneous types of errorconditions.
For a communications system designer to meet today’s challenges head-on, a new performance measurement technique is required that can study precise error locations and report onerror correlations.
THE DCS AND NOISE
Unlike analog communication systems, noise in a DCS is not inextricably linked to thetransmitted signal. Selected analog waveforms are transmitted which represent symbols from arelatively small digital alphabet. Each waveform is transmitted for an amount of time equal to onesymbol period. In the case of binary signaling, the transmitter issues one of two analog waveforms,s1(t) or s2(t), depending on whether the symbol represents a one or a zero.
The job of the receiver is to recognize which of the waveforms was transmitted, and toassign either a one or a zero to the received symbol. To accomplish this, first the received signal isreduced to a single value function, z(t), which is evaluated at symbol period intervals. This is calledthe test statistic. For the case of unipolar baseband signaling, z(t) may be the voltage level at thecenter of the bit cell. For more sophisticated signaling, such as modulated carrier wave signaling, z(t)is the output of a correlator matching one of the two prototype waveforms.
8/8/2019 Beyond BER
http://slidepdf.com/reader/full/beyond-ber 4/18
SR-TN015 3
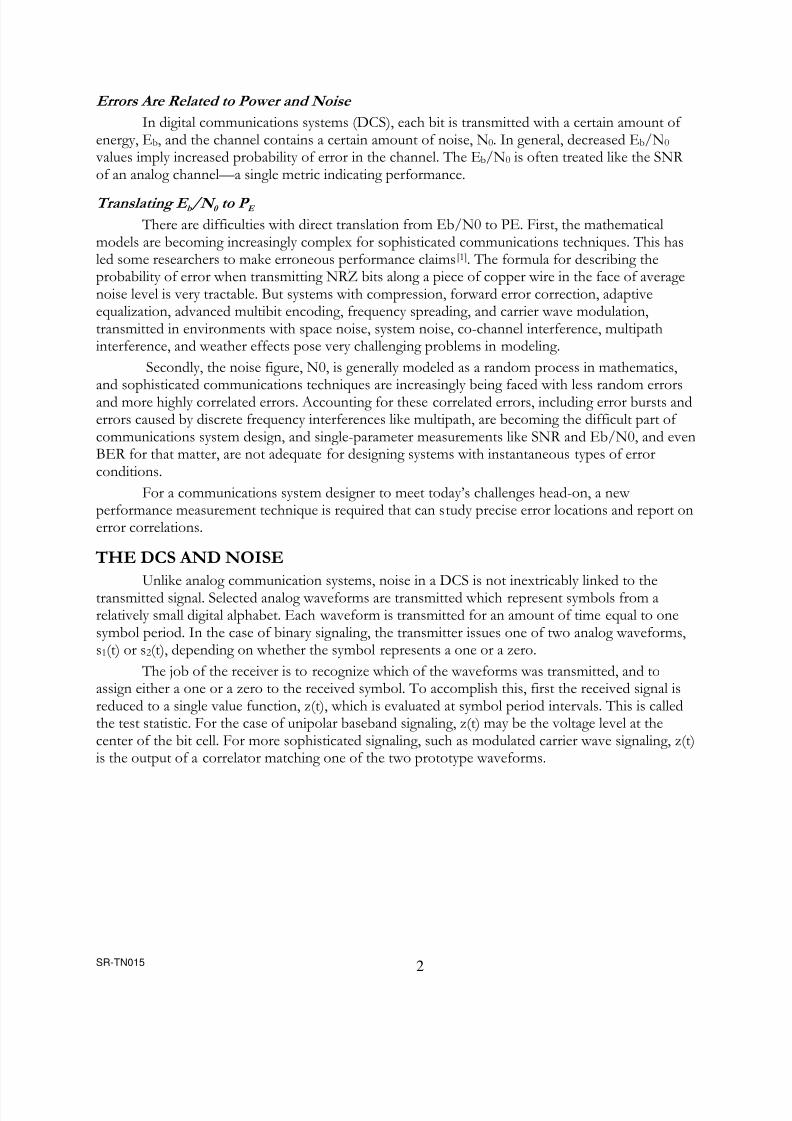
Without noise, a received s i(t) will translate to a specific test statistic value, ai. Transmitting an equally likely binary alphabet yields reception of similar quantities of a1 and a2 values. In thissituation, the probability density function (PDF) shows that half of the time a 1 is received and half of the time a2 is received.
a1
z(t)a 2
ProbabilityofOccurence
Noise Makes Recognition More Difficult
In the real world, noise is added to the transmitted signal. Man-made noise sources includesparkplug ignition noise, switching transients, and other radiating electromagnetic signals. Naturalnoise includes electrical circuit and component noise, atmospheric disturbances and galacticsources[2]. Natural noise is generally considered a Gaussian random process, and is modeled as azero-mean random variable, n(t), which adds to or subtracts from the original signal level. It doesnot have a multiplicative effect[4]. In the frequency domain, noise has equal amounts of all frequency components.
PDFFrequency Domain Time Domain
NoiseNoise Noise
The resulting signal that is received by the receiver is, therefore, the originally transmitted
waveform plus the added noise.
r(t) = s i (t) + n(t) i=1,2
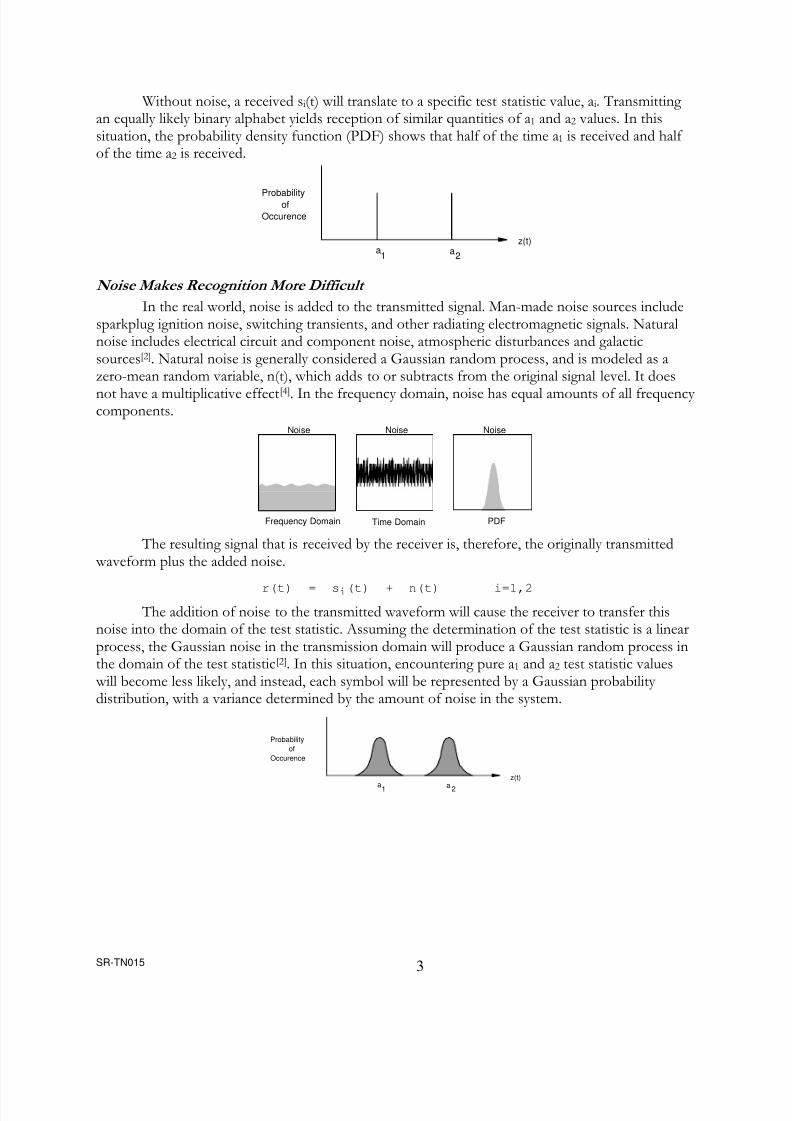
The addition of noise to the transmitted waveform will cause the receiver to transfer thisnoise into the domain of the test statistic. Assuming the determination of the test statistic is a linearprocess, the Gaussian noise in the transmission domain will produce a Gaussian random process inthe domain of the test statistic [2]. In this situation, encountering pure a 1 and a2 test statistic values
will become less likely, and instead, each symbol will be represented by a Gaussian probability distribution, with a variance determined by the amount of noise in the system.
a 1
z(t)a 2
Probabilityof
Occurence
8/8/2019 Beyond BER
http://slidepdf.com/reader/full/beyond-ber 5/18
SR-TN015 4
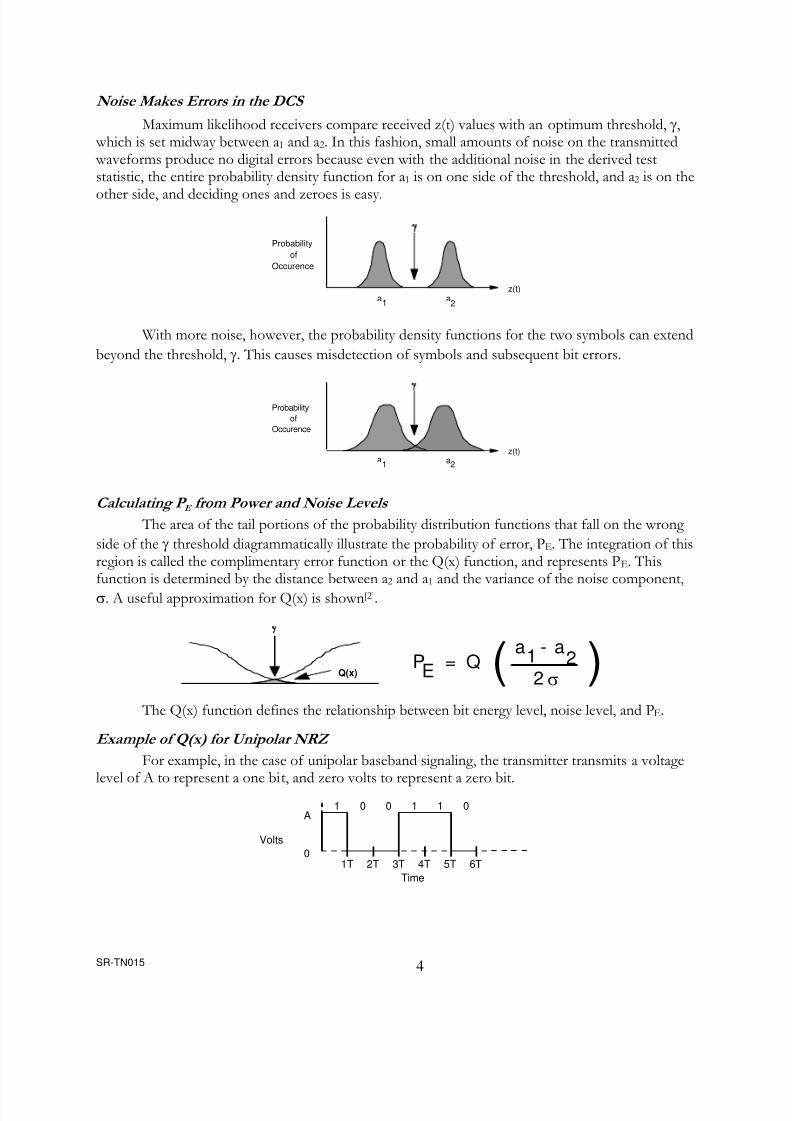
Noise Makes Errors in the DCS
Maximum likelihood receivers compare received z(t) values with an optimum threshold, γ , which is set midway between a1 and a2. In this fashion, small amounts of noise on the transmitted waveforms produce no digital errors because even with the additional noise in the derived teststatistic, the entire probability density function for a1 is on one side of the threshold, and a 2 is on the
other side, and deciding ones and zeroes is easy.
a 1
z(t)a2
Probabilityof
Occurence
γ
With more noise, however, the probability density functions for the two symbols can extend
beyond the threshold, γ . This causes misdetection of symbols and subsequent bit errors.
a 1
z(t)a2
Probabilityof
Occurence
γ
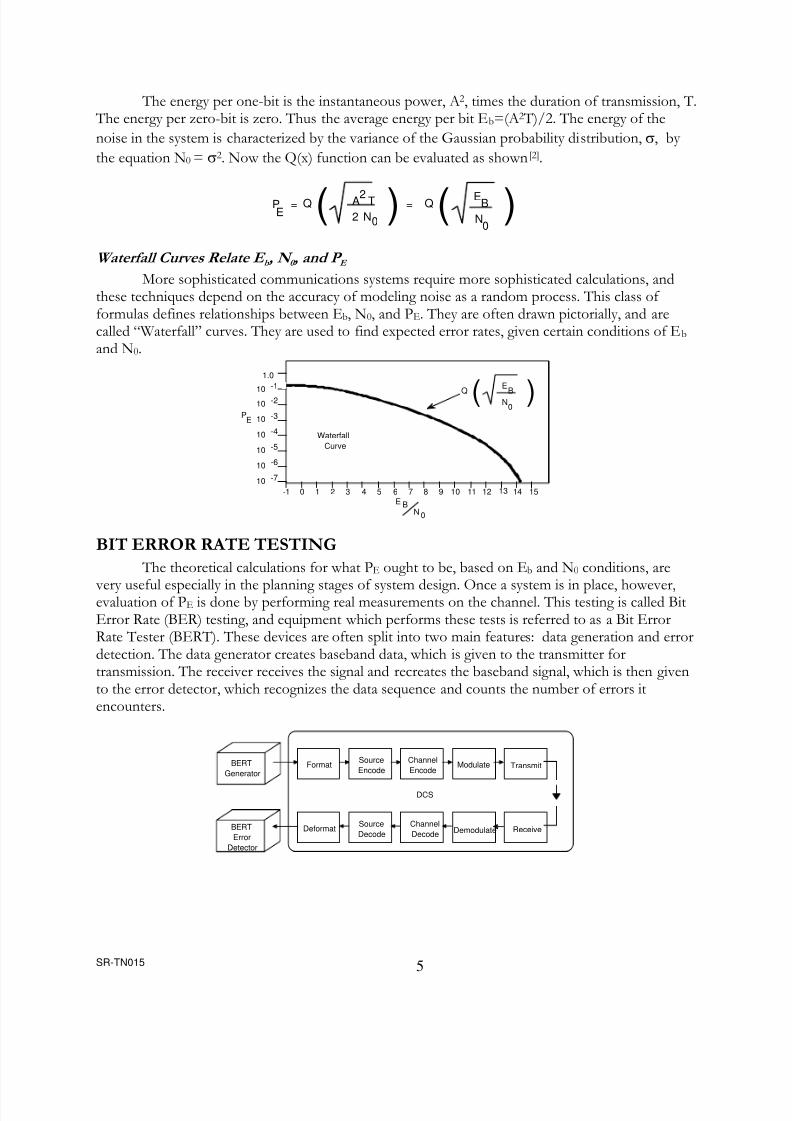
Calculating P E from Power and Noise Levels
The area of the tail portions of the probability distribution functions that fall on the wrong side of the γ threshold diagrammatically illustrate the probability of error, PE. The integration of thisregion is called the complimentary error function or the Q(x) function, and represents P E. Thisfunction is determined by the distance between a 2 and a1 and the variance of the noise component,σ . A useful approximation for Q(x) is shown [2].
Q(x)
γ
PE =a 1 a 2
2Q
σ
-( )
The Q(x) function defines the relationship between bit energy level, noise level, and PE.
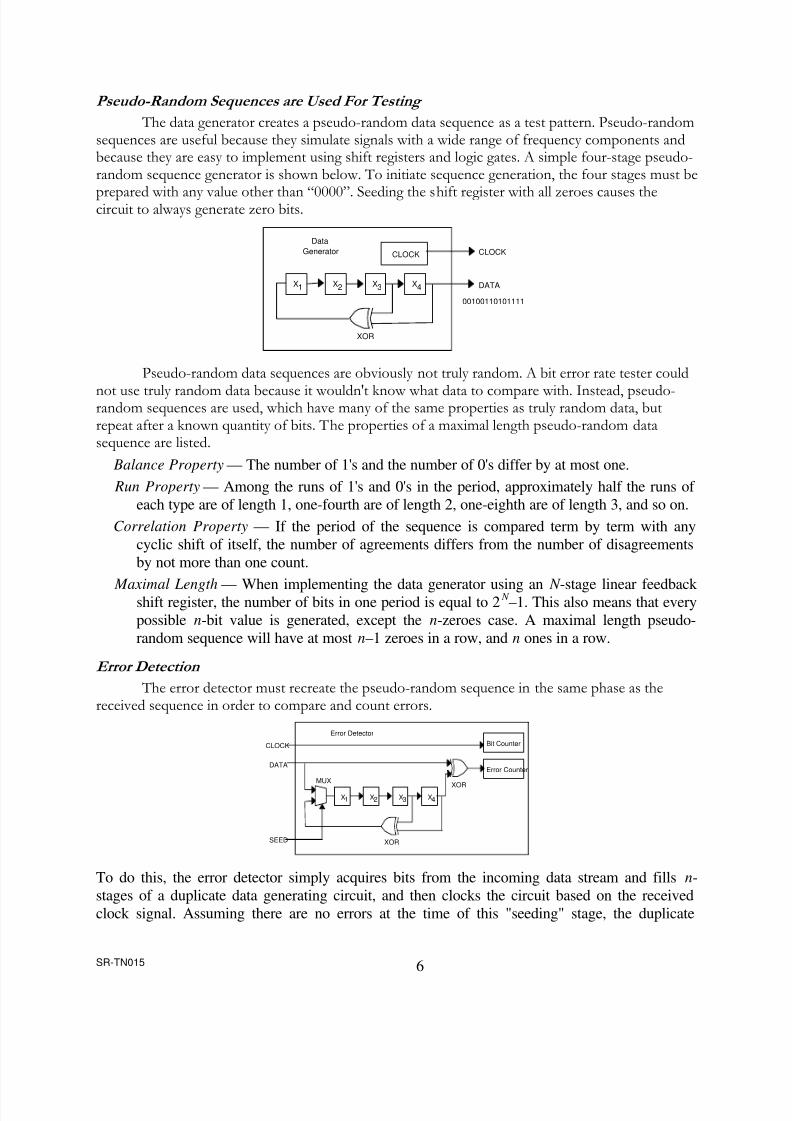
Example of Q(x) for Unipolar NRZ For example, in the case of unipolar baseband signaling, the transmitter transmits a voltage
level of A to represent a one bit, and zero volts to represent a zero bit.
0
A1 0 0 1 1 0
1T 2T 3T 4T 5T 6TTime
Volts
8/8/2019 Beyond BER
http://slidepdf.com/reader/full/beyond-ber 6/18
SR-TN015 5
The energy per one-bit is the instantaneous power, A 2, times the duration of transmission, T. The energy per zero-bit is zero. Thus the average energy per bit E b=(A2 T)/2. The energy of thenoise in the system is characterized by the variance of the Gaussian probability distribution, σ , by the equation N 0 = σ 2. Now the Q(x) function can be evaluated as shown [2].
PE
= Q ( )EBN0
=Q ( )A2 T2 N 0
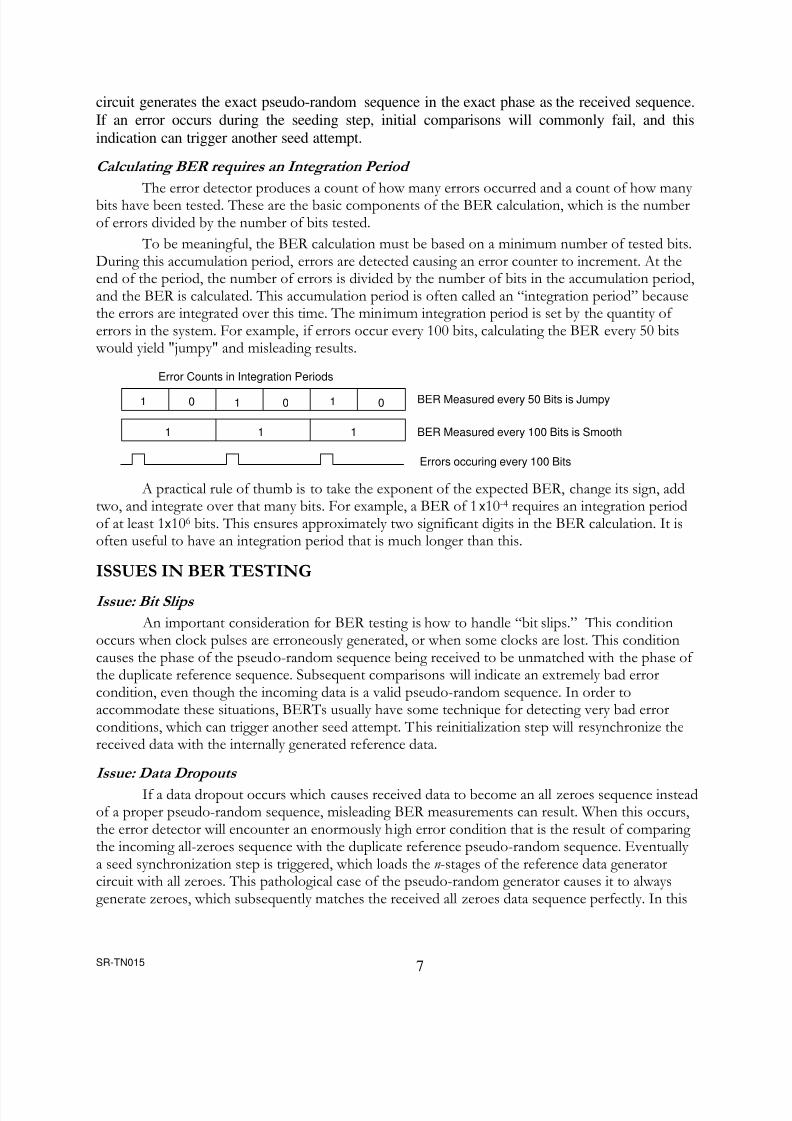
Waterfall Curves Relate E b , N 0 , and P E
More sophisticated communications systems require more sophisticated calculations, andthese techniques depend on the accuracy of modeling noise as a random process. This class of formulas defines relationships between E b, N0, and PE. They are often drawn pictorially, and arecalled “Waterfall” curves. They are used to find expected error rates, given certain conditions of E b and N 0.
1.0
10-1
10 -2
10 -3
10 -4
10 -5
10 -6
10 -7
-1 0 1 2 3 4 5 6 7 8 9 10 11 12 13 14 15E B
N 0
PE
Q ( )E
BN0
WaterfallCurve
BIT ERROR RATE TESTING
The theoretical calculations for what PE ought to be, based on E b and N 0 conditions, are
very useful especially in the planning stages of system design. Once a system is in place, however,evaluation of PE is done by performing real measurements on the channel. This testing is called BitError Rate (BER) testing, and equipment which performs these tests is referred to as a Bit ErrorRate Tester (BERT). These devices are often split into two main features: data generation and errordetection. The data generator creates baseband data, which is given to the transmitter fortransmission. The receiver receives the signal and recreates the baseband signal, which is then givento the error detector, which recognizes the data sequence and counts the number of errors itencounters.
BERTGenerator
Format SourceEncode
ChannelEncode
Modulate Transmit
Deformat SourceDecode
ChannelDecode Demodulate ReceiveBERT
ErrorDetector
DCS
8/8/2019 Beyond BER
http://slidepdf.com/reader/full/beyond-ber 7/18
SR-TN015 6
Pseudo-Random Sequences are Used For Testing The data generator creates a pseudo-random data sequence as a test pattern. Pseudo-random
sequences are useful because they simulate signals with a wide range of frequency components andbecause they are easy to implement using shift registers and logic gates. A simple four-stage pseudo-random sequence generator is shown below. To initiate sequence generation, the four stages must be
prepared with any value other than “0000”. Seeding the shift register with all zeroes causes thecircuit to always generate zero bits.
DataGenerator CLOCK
DATA
XOR
X3X1 X2 X4
CLOCK
00100110101111
Pseudo-random data sequences are obviously not truly random. A bit error rate tester could
not use truly random data because it wouldn't know what data to compare with. Instead, pseudo-random sequences are used, which have many of the same properties as truly random data, butrepeat after a known quantity of bits. The properties of a maximal length pseudo-random datasequence are listed.
Balance Property — The number of 1's and the number of 0's differ by at most one. Run Property — Among the runs of 1's and 0's in the period, approximately half the runs of
each type are of length 1, one-fourth are of length 2, one-eighth are of length 3, and so on.Correlation Property — If the period of the sequence is compared term by term with any
cyclic shift of itself, the number of agreements differs from the number of disagreementsby not more than one count.
Maximal Length — When implementing the data generator using an N -stage linear feedback shift register, the number of bits in one period is equal to 2 N –1. This also means that everypossible n-bit value is generated, except the n-zeroes case. A maximal length pseudo-random sequence will have at most n–1 zeroes in a row, and n ones in a row.
Error Detection The error detector must recreate the pseudo-random sequence in the same phase as the
received sequence in order to compare and count errors.
CLOCK
DATA
XOR
X3X1 X2 X4
Bit Counter
Error Counter
MUXXOR
SEED
Error Detector
To do this, the error detector simply acquires bits from the incoming data stream and fills n-stages of a duplicate data generating circuit, and then clocks the circuit based on the receivedclock signal. Assuming there are no errors at the time of this "seeding" stage, the duplicate
8/8/2019 Beyond BER
http://slidepdf.com/reader/full/beyond-ber 8/18
SR-TN015 7
circuit generates the exact pseudo-random sequence in the exact phase as the received sequence.If an error occurs during the seeding step, initial comparisons will commonly fail, and thisindication can trigger another seed attempt.
Calculating BER requires an Integration Period
The error detector produces a count of how many errors occurred and a count of how many bits have been tested. These are the basic components of the BER calculation, which is the numberof errors divided by the number of bits tested.
To be meaningful, the BER calculation must be based on a minimum number of tested bits.During this accumulation period, errors are detected causing an error counter to increment. At theend of the period, the number of errors is divided by the number of bits in the accumulation period,and the BER is calculated. This accumulation period is often called an “integration period” becausethe errors are integrated over this time. The minimum integration period is set by the quantity of errors in the system. For example, if errors occur every 100 bits, calculating the BER every 50 bits
would yield "jumpy" and misleading results.
BER Measured every 50 Bits is Jumpy
BER Measured every 100 Bits is Smooth
Error Counts in Integration Periods
Errors occuring every 100 Bits
01 1 1
111
0 0
A practical rule of thumb is to take the exponent of the expected BER, change its sign, add
two, and integrate over that many bits. For example, a BER of 1 x10⁻⁴ requires an integration periodof at least 1x106 bits. This ensures approximately two significant digits in the BER calculation. It isoften useful to have an integration period that is much longer than this.
ISSUES IN BER TESTING
Issue: Bit Slips An important consideration for BER testing is how to handle “bit slips.” This condition
occurs when clock pulses are erroneously generated, or when some clocks are lost. This conditioncauses the phase of the pseudo-random sequence being received to be unmatched with the phase of the duplicate reference sequence. Subsequent comparisons will indicate an extremely bad errorcondition, even though the incoming data is a valid pseudo-random sequence. In order toaccommodate these situations, BERTs usually have some technique for detecting very bad errorconditions, which can trigger another seed attempt. This reinitialization step will resynchronize thereceived data with the internally generated reference data.
Issue: Data Dropouts If a data dropout occurs which causes received data to become an all zeroes sequence instead
of a proper pseudo-random sequence, misleading BER measurements can result. When this occurs,the error detector will encounter an enormously high error condition that is the result of comparing the incoming all-zeroes sequence with the duplicate reference pseudo-random sequence. Eventually a seed synchronization step is triggered, which loads the n -stages of the reference data generatorcircuit with all zeroes. This pathological case of the pseudo-random generator causes it to alwaysgenerate zeroes, which subsequently matches the received all zeroes data sequence perfectly. In this
8/8/2019 Beyond BER
http://slidepdf.com/reader/full/beyond-ber 9/18
SR-TN015 8
situation, the bit error rate tester will report no errors, even though the received data is all-zeroesand is not the pseudo-random sequence that was expected.
Issue: Symbol Error Rate -vs- Bit Error Rate When performing BER testing, it is important to consider whether bit-oriented or symbol-
oriented statistics are important. Usually during channel testing, bit-oriented statistics are useful. This determines the probability of error, P E. Many systems utilize M-ary signaling techniques, whichcommunicate multibit symbols. In these systems, it is possible that multiple bit errors occurring close to each other will create only one symbol error. In this situation, the Symbol Error Rate (SER)is a useful metric.
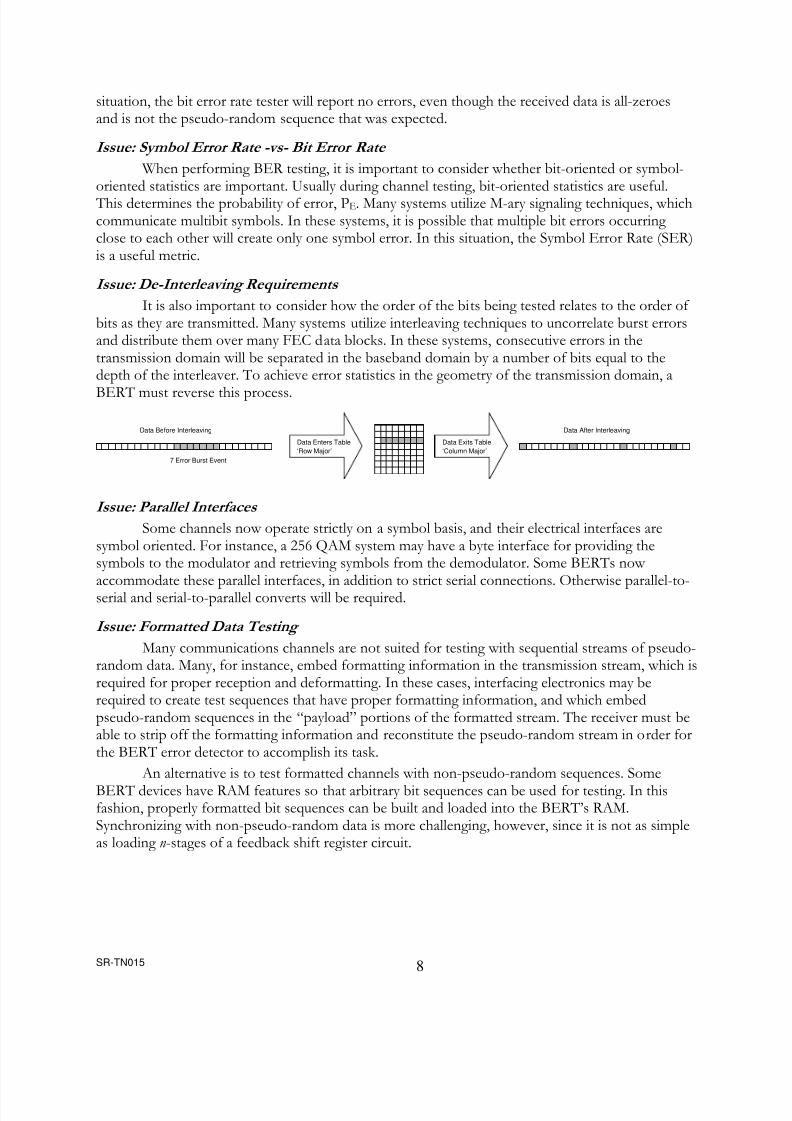
Issue: De-Interleaving Requirements It is also important to consider how the order of the bits being tested relates to the order of
bits as they are transmitted. Many systems utilize interleaving techniques to uncorrelate burst errorsand distribute them over many FEC data blocks. In these systems, consecutive errors in thetransmission domain will be separated in the baseband domain by a number of bits equal to thedepth of the interleaver. To achieve error statistics in the geometry of the transmission domain, a
BERT must reverse this process.
7 Error Burst Event
Data Enters Table‘Row Major’
Data Exits Table‘Column Major’
Data Before Interleaving Data After Interleaving
Issue: Parallel Interfaces Some channels now operate strictly on a symbol basis, and their electrical interfaces are
symbol oriented. For instance, a 256 QAM system may have a byte interface for providing thesymbols to the modulator and retrieving symbols from the demodulator. Some BERTs now accommodate these parallel interfaces, in addition to strict serial connections. Otherwise parallel-to-serial and serial-to-parallel converts will be required.
Issue: Formatted Data Testing Many communications channels are not suited for testing with sequential streams of pseudo-
random data. Many, for instance, embed formatting information in the transmission stream, which isrequired for proper reception and deformatting. In these cases, interfacing electronics may berequired to create test sequences that have proper formatting information, and which embedpseudo-random sequences in the “payload” portions of the formatted stream. The receiver must beable to strip off the formatting information and reconstitute the pseudo-random stream in order forthe BERT error detector to accomplish its task.
An alternative is to test formatted channels with non-pseudo-random sequences. SomeBERT devices have RAM features so that arbitrary bit sequences can be used for testing. In thisfashion, properly formatted bit sequences can be built and loaded into the BERT’s RAM.Synchronizing with non-pseudo-random data is more challenging, however, since it is not as simpleas loading n -stages of a feedback shift register circuit.
8/8/2019 Beyond BER
http://slidepdf.com/reader/full/beyond-ber 10/18
SR-TN015 9
ERRORS IN A DCS
In a DCS, certain components of the processing chain are more responsible for the BER of the channel. Some components may contribute errors, some may be specifically added to eliminateerrors, and still others may have the unfortunate side effect of multiplying existing errors into evenmore errors.
Source Encoding and Decoding Encoding source information refers to the process by which original information is
converted into an efficient digital representation for successful transmission. Some informationbegins as analog waveforms that are converted into digital values for transmission. This processstarts by first eliminating any frequencies from the analog waveform that would not be able to berepresented by the digital version of the waveform—given the sampling rate of the analog-to-digitalconversion. This filtering causes loss of high frequency information. Noise is also created by quantization error and quantizer saturation error, as well as by jitter in the sampling clock and in thereconstruction clock. All these effects cause distortions in the reconstructed analog waveforms, butthese problems are not evaluated using BER metrics.
Other types of source encoding and decoding operates on digital data. This includes datacompression techniques, which are used to minimize the essential information in a data set.Recreating the original data from the compressed stream can either be a “lossy” process or a“lossless” process. Lossy compression systems cannot be evaluated using bit error statistics, butlossless ones can.
Once a data set’s essential information is compressed down to a minimized bit stream, eachindividual bit becomes even more important to recreating the original information. One error in thecompressed stream generally causes many errors in the uncompressed data. In some cases, bit errorsin the compressed stream can make sections of the stream unrecoverable. This is one example of how a random error can be multiplied into a burst of correlated errors by the use of advanced digitalcommunication techniques.
Baseband Communication Once an information source is converted into a bit stream, it can be communicated by
simple means such as clock and data signaling. The spectrum of this signal generally goes from DCto some cutoff frequency, and is therefore referred to as baseband. Communicating digital basebandsignals even by simple means is prone to a number of error sources, including channel noise,clocking jitter, and intersymbol interference. Digital channels are resistant to small amounts of channel noise, but once a threshold of signal level noise is reached, errors will occur.
Errors from thermal noise will be random, but many other error sources will createcorrelated errors. Transient impulses will create error bursts. Errors from clock jitter will depend onthe nature of the jitter. Often jitter is the result of discrete frequency interferences, and in this case,errors will also be correlated to the interference frequency. Also, many forms of failing digitalcomponents will produce errors in a systematic way.
Carrier Wave Modulation and Demodulation Modulation is the process that transforms digital baseband symbols into waveforms that are
compatible with the transmission channel. Carrier wave modulation is used to propagate basebandinformation through band-limited channels, such as telephone lines, or through space using electromagnetic fields. Transmission is accomplished by coupling the information with a basefrequency called the “carrier.” The cosine waveform representing the carrier is modified in
8/8/2019 Beyond BER
http://slidepdf.com/reader/full/beyond-ber 11/18
SR-TN015 10
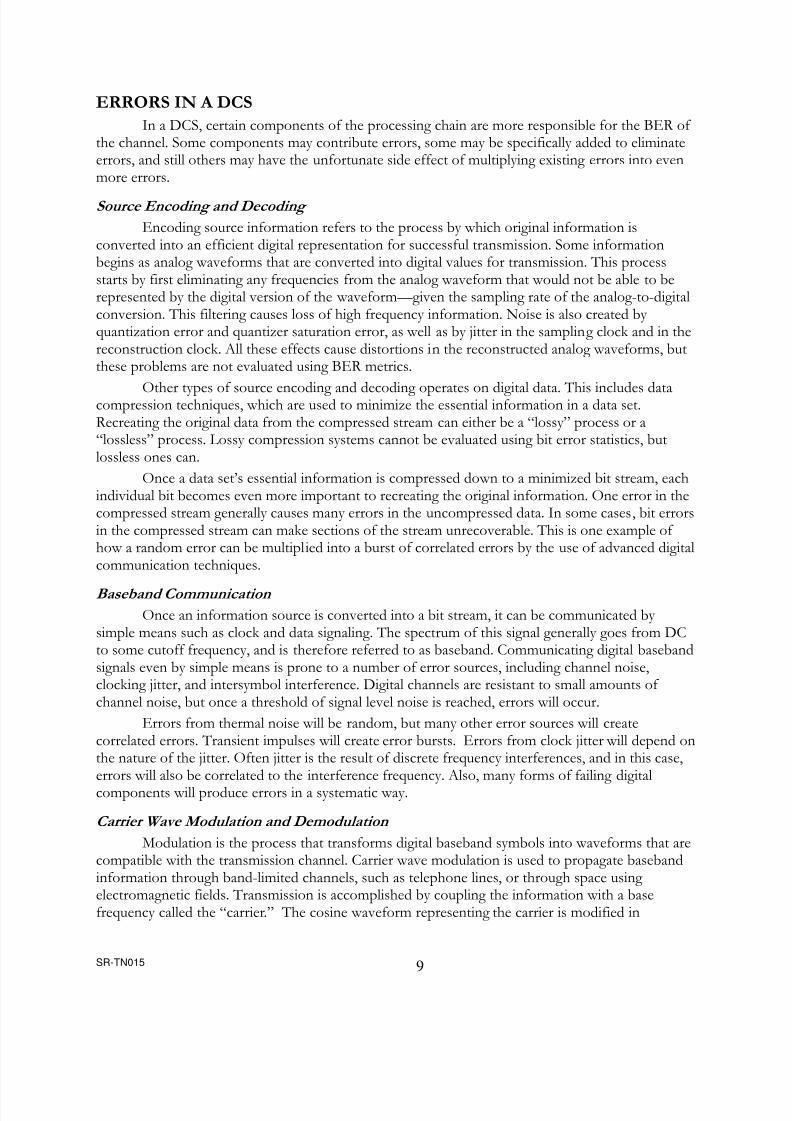
amplitude and phase by the transmitter. The receiver synchronizes with the received carrier cosine,and notices the amounts of variation in amplitude and phase. These amounts indicate the symbolsfrom the digital alphabet that are being communicated. Constellation diagrams display the symbolassignments for different phase angles and amplitude values. For instance, here are two ways todistribute symbols, radially and rectangularly.
Radial-16 Radial-64 Rectangular-16 Rectangular-64
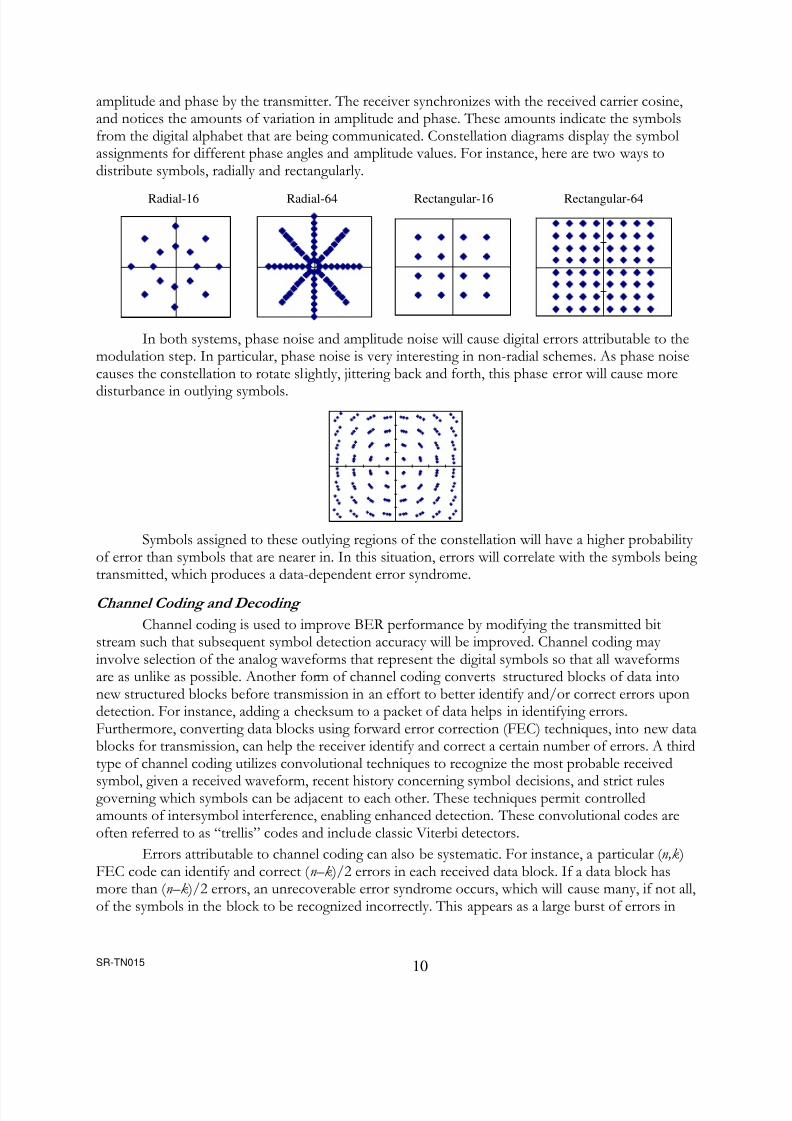
In both systems, phase noise and amplitude noise will cause digital errors attributable to themodulation step. In particular, phase noise is very interesting in non-radial schemes. As phase noisecauses the constellation to rotate slightly, jittering back and forth, this phase error will cause more
disturbance in outlying symbols.
Symbols assigned to these outlying regions of the constellation will have a higher probability of error than symbols that are nearer in. In this situation, errors will correlate with the symbols being transmitted, which produces a data-dependent error syndrome.
Channel Coding and Decoding Channel coding is used to improve BER performance by modifying the transmitted bit
stream such that subsequent symbol detection accuracy will be improved. Channel coding may involve selection of the analog waveforms that represent the digital symbols so that all waveformsare as unlike as possible. Another form of channel coding converts structured blocks of data intonew structured blocks before transmission in an effort to better identify and/or correct errors upondetection. For instance, adding a checksum to a packet of data helps in identifying errors.Furthermore, converting data blocks using forward error correction (FEC) techniques, into new datablocks for transmission, can help the receiver identify and correct a certain number of errors. A thirdtype of channel coding utilizes convolutional techniques to recognize the most probable received
symbol, given a received waveform, recent history concerning symbol decisions, and strict rulesgoverning which symbols can be adjacent to each other. These techniques permit controlledamounts of intersymbol interference, enabling enhanced detection. These convolutional codes areoften referred to as “trellis” codes and include classic Viterbi detectors.
Errors attributable to channel coding can also be systematic. For instance, a particular ( n,k )FEC code can identify and correct ( n–k )/2 errors in each received data block. If a data block hasmore than ( n–k )/2 errors, an unrecoverable error syndrome occurs, which will cause many, if not all,of the symbols in the block to be recognized incorrectly. This appears as a large burst of errors in
8/8/2019 Beyond BER
http://slidepdf.com/reader/full/beyond-ber 12/18
SR-TN015 11
the data stream. Convolutional codes utilize a memory of recent symbol decisions, which means thatone misdetected symbol can have a ripple effect and cause future symbols to be misdetected. Theamount of ripple effect is determined by the depth of the memory.
Multiplexing and Demultiplexing Both time division and frequency division multiplexing techniques are commonly employed
to allow multiple simultaneous subchannels to share the same transmission medium. In bothsituations, analyzing the combined stream BER may hide the fact that a particular subchannel withinthe stream is more responsible for the total errors in the channel than the others.
In frequency division multiplexing, errors may result from co-channel interference, adjacentchannel interference, inter modulation distortions, or interference from nearby narrow band noisesources. In time division multiplexing, errors may be correlated to the position that the time sliceoccupies in the overall multiplexing format. These situations represent correlated errors in thechannel.
RF Transmission and Reception Radio frequency (RF) transmission commonly consists of a frequency up-conversion stage, a
high power amplifier, and an antenna. Reception usually consists of an antenna, a low noiseamplifier (LNA) and a down-converter stage. Individual stages within the transmitter/receiver chaincontribute noise that may cause digital errors. Important sources of noise in RF communicationsinclude antenna loss, radome loss, pointing loss, polarization loss, space loss, and galactic, cosmic,star, and terrestrial noises. Atmospheric effects commonly cause channel fading and instantaneoustransients that produce burst error syndromes.
Synchroni z ation There are many types of synchronization effects that cause correlated errors in a DCS.Problems in clock recovery can cause phase error between clock and data signals. This jitter
may be the result of frequency-dependent variables like the tracking frequency of a PLL design, ordata-dependent variables like the number of signal transitions in the received bit stream.
Often times transmissions are formatted with a training pattern followed by a recognizablesync word, followed by a block of “payload” data. Problems recognizing the sync word may causethe entire block to be lost. Furthermore, clock recovery initiated by the training pattern may pick upadditional phase noise as a function of time since the last training pattern. This would cause moreerrors at the end of these blocks.
Synchronizing some types of channel demodulators will create increased errors. For instance,a demodulator that relies on receiver synchronization with the carrier frequency only willsynchronize faster than one that requires frequency and phase synchronization. Error bursts during resynchronization will be longer for the latter type.
Even with guard times, synchronization of time-division multiple access channels may interfere with one another if propagation times are not accurately accounted for. This situation willcause error bursts.
New technologies like code division multiple access (CDMA) techniques utilize frequency spreading to avoid narrow band interferences. These techniques multiply data by pseudo-randomdata streams upon transmission. Upon reception, the proper phase of the pseudo-random streammust be found in order to decode the original data. If synchronization is lost, resynchronizing cantake a long time.

8/8/2019 Beyond BER
http://slidepdf.com/reader/full/beyond-ber 13/18
SR-TN015 12
Error Control Many forms of error control mechanisms may be found in the modern DCS. Simple
techniques include adding a parity bit when transmitting RS-232 characters. More efficient errordetection can be accomplished by computing cyclic redundancy codes (CRC) on data blocks. Thisfacility is commonly included as part of any packet-oriented communications channel. Using CRC
codes, a receiver can identify packets that contain errors and automatically request a retransmissionof the errored packet. Of course this only works when there is a back-channel capable of informing the transmitter to resend a packet, and only if real time requirements for timeliness of data can stillbe met. In unidirectional, prerecorded, or real time applications, error control is either omitted or aform of forward error correction (FEC) coding is used which adds redundant information to thetransmitted signal enabling error identification and correction.
When FEC is used on channels with burst errors, interleaving is often used to distributeindividual errors across as many FEC data blocks as possible. This is necessary because FEC codesare best suited for correcting a few errors in any one data block. One large burst error could saturatethe correction ability in a particular data block while neighboring blocks could have no errors inthem at all. Interleaving effectively uncorrelates error bursts and distributes them amongst many
FEC blocks by transposing a two-dimensional matrix of symbols. All error control mechanisms have limitations. Parity bits can only detect an odd number of bit errors in a word. Likewise, CRC codes can miss errors. FEC codes correct errors successfully until their correcting strength is saturated, then error bursts occur.
BIT ERROR LOCATION ANALYSIS
Gaussian noise can be fully described by the variance of the Gaussian distribution. Likewise,to understand digital errors that are distributed based on a Gaussian distribution, one needs to know only the BER. However, many errors are correlated, and therefore not Gaussian, and to understandthese error syndromes, error location analysis is required.
Method for Locating Errors Error location can be identified using the same basic techniques as traditional BER testing
involving test transmission of pseudo-random sequences. It is required to modify the error detectorso as to communicate error locations for analysis. This is the subject of a patent held by SyntheSysResearch.
Modified Error Detector
DATA
CLOCK
DUPLICATESEQUENCE
DATAGENERATOR
COMPARE
ANALYSIS
ERRORLOCATIONS
In addition to locating errors, it is important to be able to correlate errors to other external
events, and so identifying locations of other input signals is also required.
Burst Error Identification When the modified error detector identifies a cluster of errors, analysis determines whether
this cluster constitutes an error burst or not. Specification of error burst criteria is application-dependent, and requires selection of two parameters:
8/8/2019 Beyond BER
http://slidepdf.com/reader/full/beyond-ber 14/18
SR-TN015 13
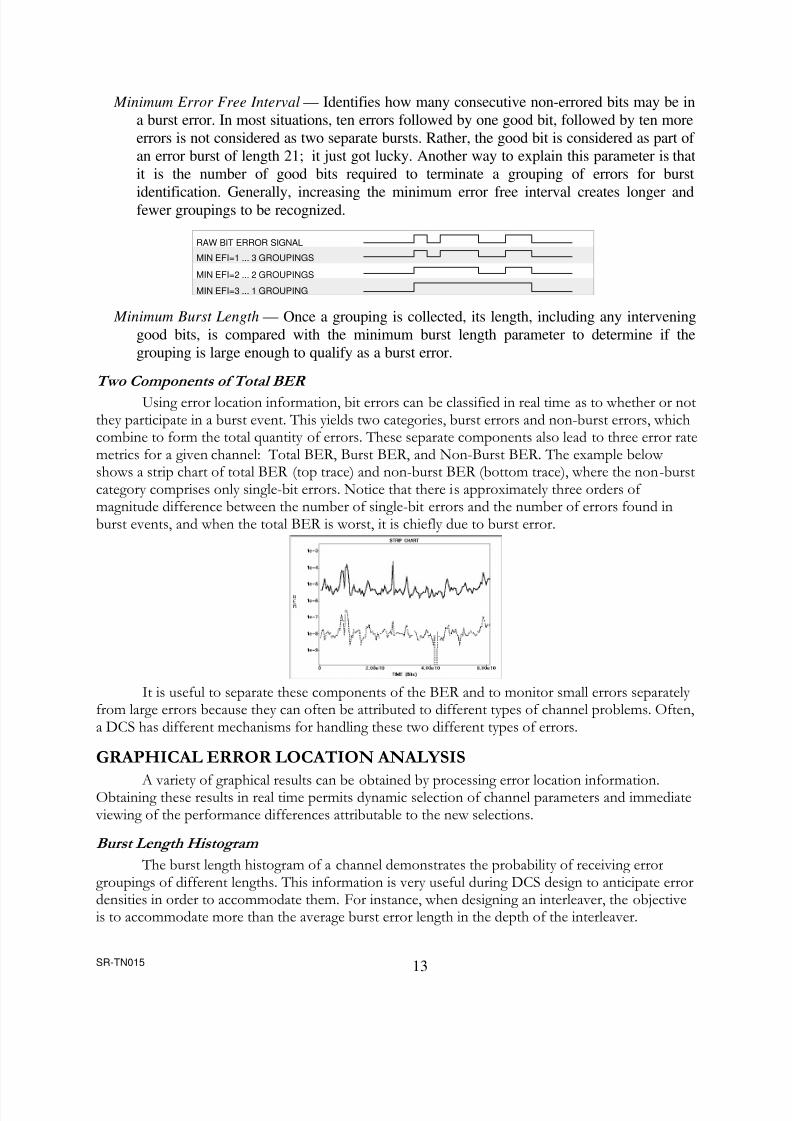
Minimum Error Free Interval — Identifies how many consecutive non-errored bits may be ina burst error. In most situations, ten errors followed by one good bit, followed by ten moreerrors is not considered as two separate bursts. Rather, the good bit is considered as part of an error burst of length 21; it just got lucky. Another way to explain this parameter is thatit is the number of good bits required to terminate a grouping of errors for burst
identification. Generally, increasing the minimum error free interval creates longer andfewer groupings to be recognized.
RAW BIT ERROR SIGNAL
MIN EFI=1 ... 3 GROUPINGS
MIN EFI=2 ... 2 GROUPINGS
MIN EFI=3 ... 1 GROUPING Minimum Burst Length — Once a grouping is collected, its length, including any intervening
good bits, is compared with the minimum burst length parameter to determine if thegrouping is large enough to qualify as a burst error.
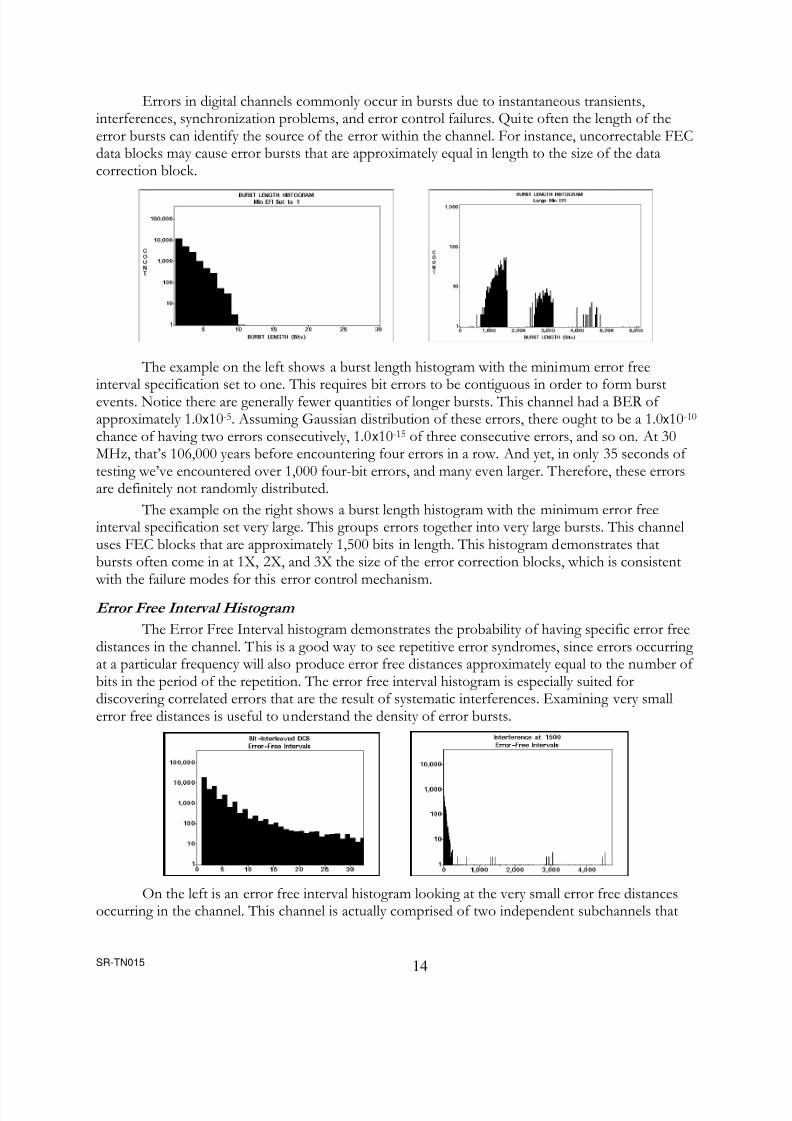
Two Components of Total BER Using error location information, bit errors can be classified in real time as to whether or not
they participate in a burst event. This yields two categories, burst errors and non-burst errors, whichcombine to form the total quantity of errors. These separate components also lead to three error ratemetrics for a given channel: Total BER, Burst BER, and Non-Burst BER. The example below shows a strip chart of total BER (top trace) and non-burst BER (bottom trace), where the non-burstcategory comprises only single-bit errors. Notice that there is approximately three orders of magnitude difference between the number of single-bit errors and the number of errors found inburst events, and when the total BER is worst, it is chiefly due to burst error.
It is useful to separate these components of the BER and to monitor small errors separately from large errors because they can often be attributed to different types of channel problems. Often,a DCS has different mechanisms for handling these two different types of errors.
GRAPHICAL ERROR LOCATION ANALYSIS
A variety of graphical results can be obtained by processing error location information.Obtaining these results in real time permits dynamic selection of channel parameters and immediate viewing of the performance differences attributable to the new selections.
Burst Length Histogram The burst length histogram of a channel demonstrates the probability of receiving error
groupings of different lengths. This information is very useful during DCS design to anticipate errordensities in order to accommodate them. For instance, when designing an interleaver, the objectiveis to accommodate more than the average burst error length in the depth of the interleaver.
8/8/2019 Beyond BER
http://slidepdf.com/reader/full/beyond-ber 15/18
SR-TN015 14
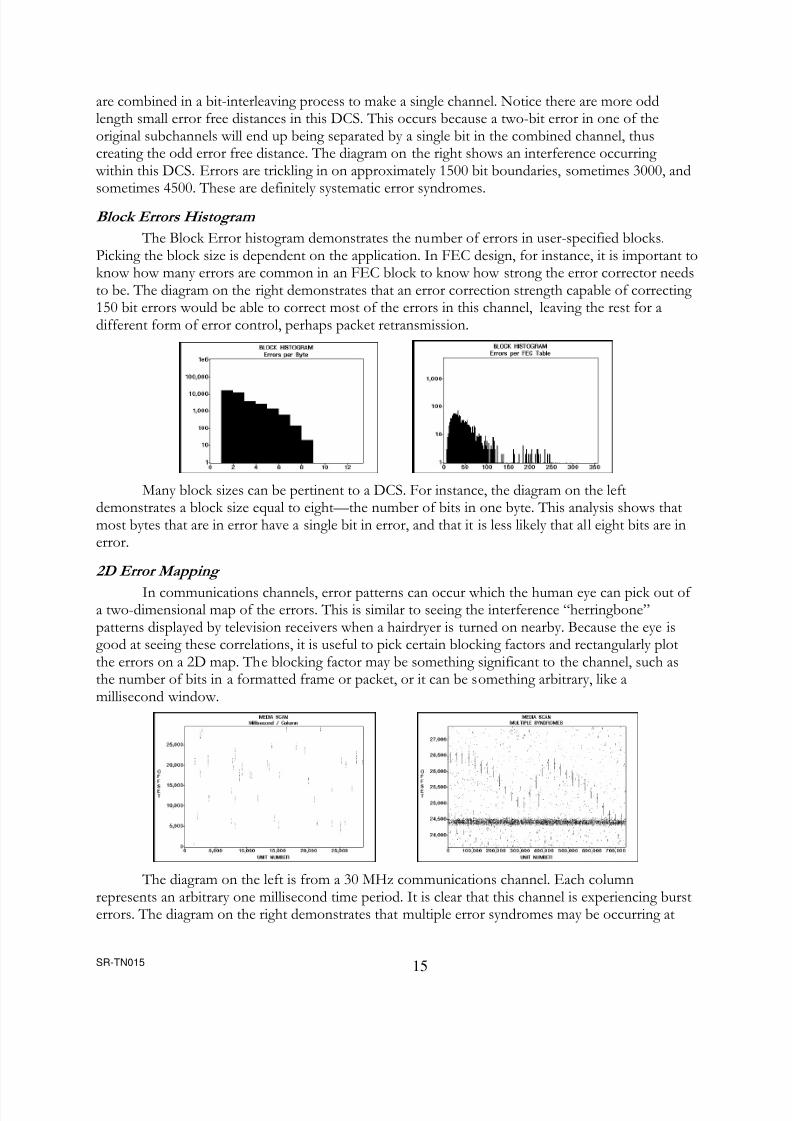
Errors in digital channels commonly occur in bursts due to instantaneous transients,interferences, synchronization problems, and error control failures. Quite often the length of theerror bursts can identify the source of the error within the channel. For instance, uncorrectable FECdata blocks may cause error bursts that are approximately equal in length to the size of the datacorrection block.
The example on the left shows a burst length histogram with the minimum error freeinterval specification set to one. This requires bit errors to be contiguous in order to form burstevents. Notice there are generally fewer quantities of longer bursts. This channel had a BER of approximately 1.0x10⁻⁵. Assuming Gaussian distribution of these errors, there ought to be a 1.0 x10⁻¹⁰ chance of having two errors consecutively, 1.0x10⁻¹⁵ of three consecutive errors, and so on. At 30MHz, that’s 106,000 years before encountering four errors in a row. And yet, in only 35 seconds of testing we’ve encountered over 1,000 four-bit errors, and many even larger. Therefore, these errorsare definitely not randomly distributed.
The example on the right shows a burst length histogram with the minimum error freeinterval specification set very large. This groups errors together into very large bursts. This channeluses FEC blocks that are approximately 1,500 bits in length. This histogram demonstrates thatbursts often come in at 1X, 2X, and 3X the size of the error correction blocks, which is consistent
with the failure modes for this error control mechanism.
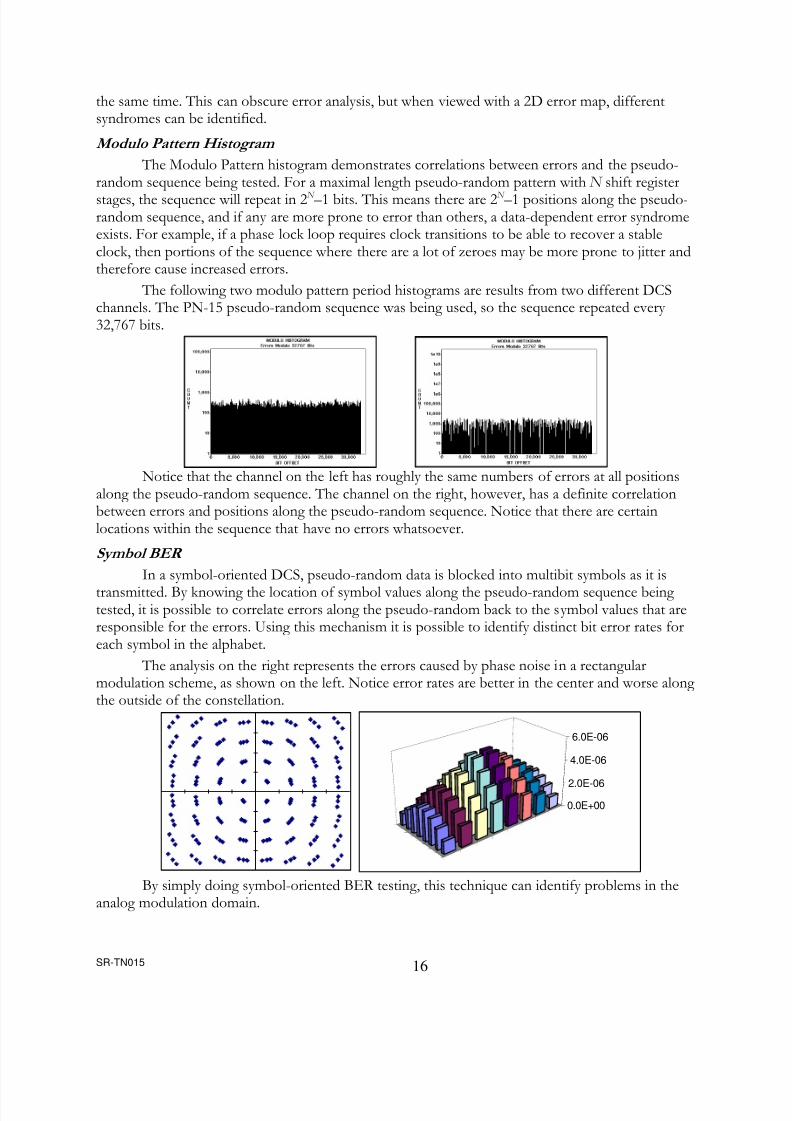
Error Free Interval Histogram The Error Free Interval histogram demonstrates the probability of having specific error free
distances in the channel. This is a good way to see repetitive error syndromes, since errors occurring at a particular frequency will also produce error free distances approximately equal to the number of bits in the period of the repetition. The error free interval histogram is especially suited fordiscovering correlated errors that are the result of systematic interferences. Examining very smallerror free distances is useful to understand the density of error bursts.
On the left is an error free interval histogram looking at the very small error free distancesoccurring in the channel. This channel is actually comprised of two independent subchannels that
8/8/2019 Beyond BER
http://slidepdf.com/reader/full/beyond-ber 16/18
SR-TN015 15
are combined in a bit-interleaving process to make a single channel. Notice there are more oddlength small error free distances in this DCS. This occurs because a two-bit error in one of theoriginal subchannels will end up being separated by a single bit in the combined channel, thuscreating the odd error free distance. The diagram on the right shows an interference occurring
within this DCS. Errors are trickling in on approximately 1500 bit boundaries, sometimes 3000, and
sometimes 4500. These are definitely systematic error syndromes.Block Errors Histogram
The Block Error histogram demonstrates the number of errors in user-specified blocks.Picking the block size is dependent on the application. In FEC design, for instance, it is important toknow how many errors are common in an FEC block to know how strong the error corrector needsto be. The diagram on the right demonstrates that an error correction strength capable of correcting 150 bit errors would be able to correct most of the errors in this channel, leaving the rest for adifferent form of error control, perhaps packet retransmission.
Many block sizes can be pertinent to a DCS. For instance, the diagram on the leftdemonstrates a block size equal to eight—the number of bits in one byte. This analysis shows thatmost bytes that are in error have a single bit in error, and that it is less likely that all eight bits are inerror.
2D Error Mapping
In communications channels, error patterns can occur which the human eye can pick out of a two-dimensional map of the errors. This is similar to seeing the interference “herringbone”patterns displayed by television receivers when a hairdryer is turned on nearby. Because the eye isgood at seeing these correlations, it is useful to pick certain blocking factors and rectangularly plotthe errors on a 2D map. The blocking factor may be something significant to the channel, such asthe number of bits in a formatted frame or packet, or it can be something arbitrary, like amillisecond window.
The diagram on the left is from a 30 MHz communications channel. Each columnrepresents an arbitrary one millisecond time period. It is clear that this channel is experiencing bursterrors. The diagram on the right demonstrates that multiple error syndromes may be occurring at
8/8/2019 Beyond BER
http://slidepdf.com/reader/full/beyond-ber 17/18
SR-TN015 16
the same time. This can obscure error analysis, but when viewed with a 2D error map, differentsyndromes can be identified.
Modulo Pattern Histogram The Modulo Pattern histogram demonstrates correlations between errors and the pseudo-
random sequence being tested. For a maximal length pseudo-random pattern with N shift registerstages, the sequence will repeat in 2 N –1 bits. This means there are 2 N –1 positions along the pseudo-random sequence, and if any are more prone to error than others, a data-dependent error syndromeexists. For example, if a phase lock loop requires clock transitions to be able to recover a stableclock, then portions of the sequence where there are a lot of zeroes may be more prone to jitter andtherefore cause increased errors.
The following two modulo pattern period histograms are results from two different DCSchannels. The PN-15 pseudo-random sequence was being used, so the sequence repeated every 32,767 bits.
Notice that the channel on the left has roughly the same numbers of errors at all positionsalong the pseudo-random sequence. The channel on the right, however, has a definite correlationbetween errors and positions along the pseudo-random sequence. Notice that there are certainlocations within the sequence that have no errors whatsoever.
Symbol BER In a symbol-oriented DCS, pseudo-random data is blocked into multibit symbols as it is
transmitted. By knowing the location of symbol values along the pseudo-random sequence being tested, it is possible to correlate errors along the pseudo-random back to the symbol values that areresponsible for the errors. Using this mechanism it is possible to identify distinct bit error rates foreach symbol in the alphabet.
The analysis on the right represents the errors caused by phase noise in a rectangularmodulation scheme, as shown on the left. Notice error rates are better in the center and worse along the outside of the constellation.
0.0E+002.0E-06
4.0E-06
6.0E-06
By simply doing symbol-oriented BER testing, this technique can identify problems in the
analog modulation domain.
8/8/2019 Beyond BER
http://slidepdf.com/reader/full/beyond-ber 18/18
SR-TN015 17
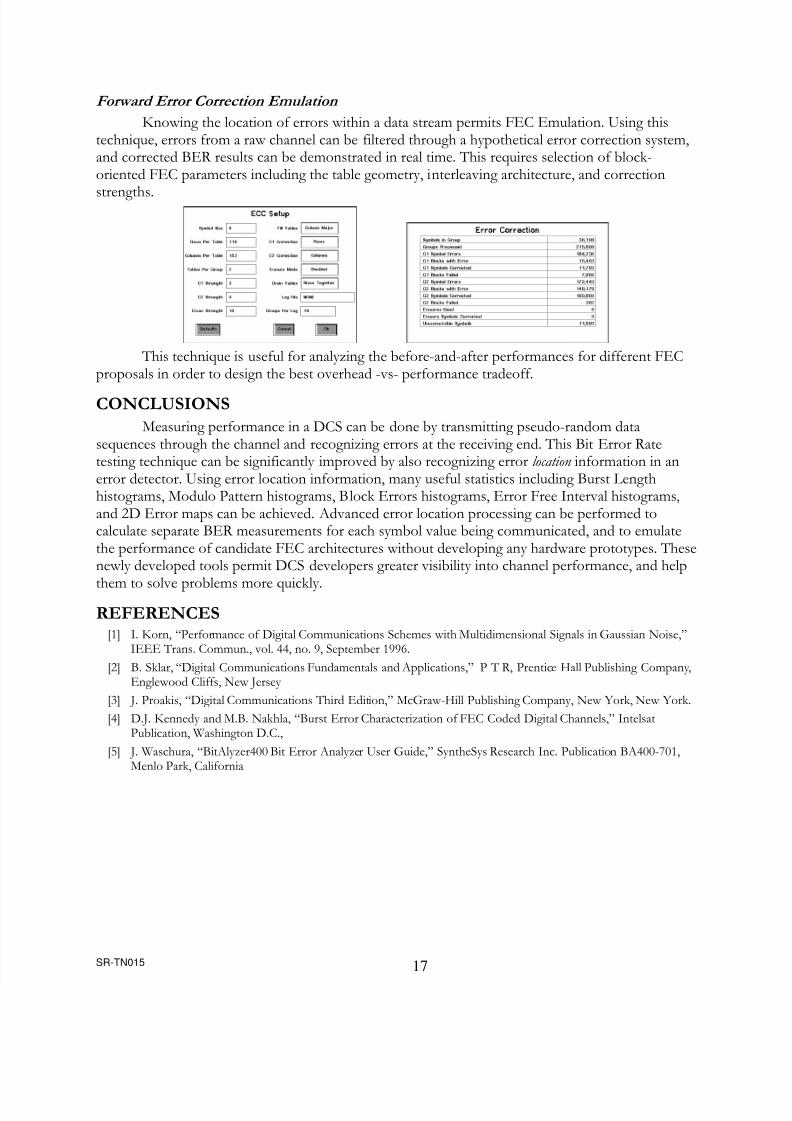
Forward Error Correction Emulation Knowing the location of errors within a data stream permits FEC Emulation. Using this
technique, errors from a raw channel can be filtered through a hypothetical error correction system,and corrected BER results can be demonstrated in real time. This requires selection of block-oriented FEC parameters including the table geometry, interleaving architecture, and correction
strengths.
This technique is useful for analyzing the before-and-after performances for different FECproposals in order to design the best overhead -vs- performance tradeoff.
CONCLUSIONS
Measuring performance in a DCS can be done by transmitting pseudo-random datasequences through the channel and recognizing errors at the receiving end. This Bit Error Ratetesting technique can be significantly improved by also recognizing error location information in anerror detector. Using error location information, many useful statistics including Burst Lengthhistograms, Modulo Pattern histograms, Block Errors histograms, Error Free Interval histograms,and 2D Error maps can be achieved. Advanced error location processing can be performed tocalculate separate BER measurements for each symbol value being communicated, and to emulatethe performance of candidate FEC architectures without developing any hardware prototypes. Thesenewly developed tools permit DCS developers greater visibility into channel performance, and help
them to solve problems more quickly.REFERENCES
[1] I. Korn, “Performance of Digital Communications Schemes with Multidimensional Signals in Gaussian Noise,”IEEE Trans. Commun., vol. 44, no. 9, September 1996.
[2] B. Sklar, “Digital Communications Fundamentals and Applications,” P T R, Prentice Hall Publishing Company,Englewood Cliffs, New Jersey
[3] J. Proakis, “Digital Communications Third Edition,” McGraw-Hill Publishing Company, New York, New York.[4] D.J. Kennedy and M.B. Nakhla, “Burst Error Characterization of FEC Coded Digital Channels,” Intelsat
Publication, Washington D.C.,[5] J. Waschura, “BitAlyzer400 Bit Error Analyzer User Guide,” SyntheSys Research Inc. Publication BA400-701,
Menlo Park, California