Embed Size (px)
Citation preview


New technologies and breakthrough trends lead to a new generation of opportunities, challenges, and points of view. The rebounding economy demands innovation and inventive ways to find, create, and measure value. It is time for a new perspective on business. Rausch Advisory Services LLC. is currently assisting clients in making significant advancements transforming their decision-‐making capabilities through the use of advanced data analytics, true Continuous Controls Monitoring (CCM) and process redesign. The following discussion will guide you through our PIVOT methodology, examples of how data analytics and CCM can improve the decision-‐making process and will highlight a few client case studies and their realization of significant Return on Investment (ROI).
In a recent survey titled “Internal Audit 2015 and Beyond” conducted by Rausch, we asked numerous Internal Audit leaders, what were the top concerns expressed by senior management and their audit committees? Without fail data analytics and automated controls was always in the top three, only surpassed by cyber security. When asked, what these audit leaders felt was the biggest challenge for the internal audit profession, they responded in great numbers by stating that audit has been focused almost exclusively on compliance control testing and has lost focus on showing the true value of Internal Audit through continued process improvement. Other respondents also stated that there is very little focus currently on the use of continuous controls monitoring and data analytics. With the updated COSO 2013 Internal Control Framework, management is realizing that auditors will need to take a closer look at the new principles. And this year and beyond, more than ever, there will be a greater emphasis on Information Technology, Data Analytics and Big Data. Additionally, the AICPA Emerging Assurance Technologies Task Force recently stated the Internal Audit profession needs to achieve a “quantum leap” to redesign audit processes using today’s technology, rather than using information technology to computerize legacy audit plans and procedures. Existing auditing standards that are the framework for audit procedures need to be modified to incorporate the concepts of Big Data and “continuous auditing” and encourage auditors to use technologies that increase assurance beyond minimum required levels. .
The ubiquity of big data provides the ability to turn data into analytics that drives decision-‐making. Analytics is not just obtaining information, but also finding the means to manage and make sense out of that information.

Big data is no longer just the responsibility of technologists or auditors for that matter; CFO’s need to embrace big data. Rausch is working with CFO and Internal Audit organizations, and together, are taking “quantum leaps” to address the power of data analytics by deploying our PIVOT Methodology. PIVOT, “Profitability Improvement Via Optimized Transactions”, is Rausch’s CCM Data Analytics Solution. PIVOT enables companies to implement real-‐time mechanisms that detect process aberrations that diminish quality and profitability, including fraud or simple honest mistakes by employees. PIVOT allows for these issues to be corrected in near real-‐time, before the business process is completed. The methodology and related infrastructure propels improved quality for key processes impacting profitability and performance. This is achieved by leveraging a company’s existing infrastructure, and typically, does not require the purchase or acquisition of any additional software.
PIVOT typically pays for itself in a matter of weeks through increased revenue and reduced costs, drives long term quality improvements in business processes, effectively creates a deterrence to fraud, improves compliance, and reduces work effort by personnel enhancing their ability to redeploy their efforts to more meaningful tasks. Below are the four pillars of profitability that have been achieved through the use of PIVOT:
• Increased Revenue – Eliminates missed fees, missing PODs, sales order/billing
errors, stop inventory theft, etc. • Improved Quality -‐ Reduced rebills, fewer
customer complaints, competitive advantage, etc.
• Reduced Costs -‐ Catch duplicate invoices, automation, fewer FTEs, reduced audit fees, etc.
• Improved Compliance/Fraud Deterrence -‐ Stop T&E/P-‐card frauds, procedural compliance, statutory penalties, etc.
“We use data analytics in every audit.” “Why, because there is data in everything” – Rausch Advisory Services “Internal Audit 2015 and Beyond” survey
“Due to the velocity of change and the volume of information, data analytics provides Emory the business intelligence to ensure data integrity and allows us the ability to make good business decisions with it.” -‐Scott Stevenson, Chief Audit Officer, Emory University

Optimizing your value chain – a company can be envisioned as a connected system of processes generating a value chain, creating value for the customer, and thus the shareholders. Every process has discrete transactions executed within the process. These transactions ultimately get captured within the records of the company’s systems. Hidden within this transactional data, is a tremendous amount of information that enables identification of errors, quality problems or failures within the process. By using statistical techniques and cross checking against various sources, it is possible to identify an aberration or failure as it occurs. A process failure is rarely catastrophic, and usually goes unnoticed by management. However, the resulting error(s) are identified by the customer and line level employees. By process failure, we simply mean that a specific transaction failed to accomplish the objective the process was designed to accomplish. These failures result in substantial rework and additional labor for the organization, as well as loss of brand image in the customer’s eyes. Below are just a few examples of transactions with a process failure:
Type of Failure Example(s) Potential Impact
A miss-‐keyed value
Transposed invoice number is keyed in by AP Allows duplicate payment of an invoice
Incorrectly selected value
Incorrect “Reason Code” on a return is selected
Defective item is re-‐stocked and/or continuous improvement analysis is later impacted
Illogical information
A discontinued product is allowed to be ordered
Damage to brand image in customer’s eyes; wasted labor correcting the mistake, and/or excessive cost trying to fulfill order
Inaccurate information
A customer ordered blue and green is recorded (validation step was skipped)
Damage to brand image in customer’s eyes; wasted labor correcting the mistake
Employee does not execute procedures as designed
Receiving Clerk failed to count quantity of received goods as called for by procedure, and assuming the count is correct, received the full PO quantity, thus closing the PO
When back ordered parts finally arrive, there is no open PO to receive against. Overpayment may occur and rework occurs to handle the back ordered units when they arrive.
Employee fails to comply with policy
POD which triggers billing is not turned in timely or is lost and never turned in
Revenue loss or delay
Intentional fraud T&E expense report fraud Theft losses (usually unrecognized) Absence of data or entire transaction
A doctor failed to record a procedure code, which flowed into billing Lost Revenue
Compliance failure
Required diagnostic procedures not completed before performing a certain procedure on a patient
RAC Audit Penalties

A well-‐run company typically has an error rate of around 0.5% to 1% due to mistakes and other human errors. A company in crisis will have process failures in over 5% of transactions. The objective of PIVOT is to reduce the error rate to zero and/or identify them in time to mitigate damage. The very act of monitoring the quality of process transactions with PIVOT has an immediate impact on personnel who realize that their mistakes will be quickly identified. It drives increased care, accountability, and deters fraud attempts. The PIVOT methodology and related infrastructure identifies the specific transactions with aberrations in a process, as well as people associated with the transactions. It is designed to capture the erroneous transactions quickly enough for correction, before the transaction cycle completes. It allows for either a top-‐down approach or a distributed approach to monitoring and remediation of the failed transactions. Simply put, the reports and/or responsibility for corrections can be pushed out to operational personnel, so they can self-‐police, or remain with managers or a quality group. The number of processes that can be monitored is unlimited once the PIVOT infrastructure is deployed, but the greatest “gains” are typically from the processes related to Disbursements and Revenue. Triple-‐digit ROI is generally obtained from using PIVOT to monitor accounts payable, T&E reimbursements, payroll, and revenue-‐related activity reflected in the Sales Order and associated tables within a financial system. In addition to the Disbursement and Sales related transactions, significant ROI, quality improvements, and compliance can be obtained from monitoring other processes and their transactions. For example, compliance failures outside of these areas can directly translate to statutory penalties in some industries. PIVOT can easily create 100% compliance, as well as provide documentation of compliance. In addition to Process Monitoring and Optimization, the PIVOT infrastructure can also enable: • Automation of certain account reconciliations, shaving time off of the Financial
Close Cycle • Automation of Provisioning and De-‐Provisioning activities
A broken process ultimately translates to revenue loss or unnecessary costs, hurting profitability -‐-‐ whereas optimized processes translate into competitive advantage and improved profitability.

PIVOT also provides tools for meta-‐reporting on the history of exceptions. Using Pareto charting, Rausch is able to usually see interesting patterns emerge, such as the same employees being associated with the majority of mistakes, or the same departments being associated with incorrect transactions. This data becomes invaluable in identifying where remedial action is needed. If a pattern emerges in a certain department or with an individual, you can print out the history of aberrations, and call a meeting with the appropriate personnel to review and identify the root cause. It points directly to broken processes in need of re-‐engineering, thereby supporting and even guiding Continuous Improvement initiatives. Below are some of the achieved benefits of PIVOT Direct Benefits: • Increased revenue • Cuts costs • Automates certain manual tasks • Stops fraud • Allows for 100% assurance of compliance • Reduces rework and other labor waste • Potentially allows reduced headcount or
redeployment of scarce resources • Potential reduced external auditor fees • Eliminates statutory penalties • Supports continuous improvement initiatives • 100% of transactions tested with sophisticated
analytics in near real-‐time (as opposed to a periodic sample long after occurrence)
• Results can be acted on rapidly, usually before the transaction cycle completes, improving quality
• Goes beyond just reporting to provide an actionable control framework and status tracking mechanism
• Drives increased accountability and care by employees
• Is low cost in relation to benefits, with no ongoing licensing costs
• Supports identification and documentation of problem employees and/or areas
• Expandable framework – supports unlimited process monitoring
Indirect Benefits: • Reduced Overtime • Quality Improvement • Improved Moral • Competitive Advantage • Improved Brand Image • Potential Higher Stock Price
PIVOT rapidly pays for itself in reduced costs and increased revenue, sometimes so dramatically -‐-‐ the cost of implementation is often recovered within a few weeks of go-‐live.
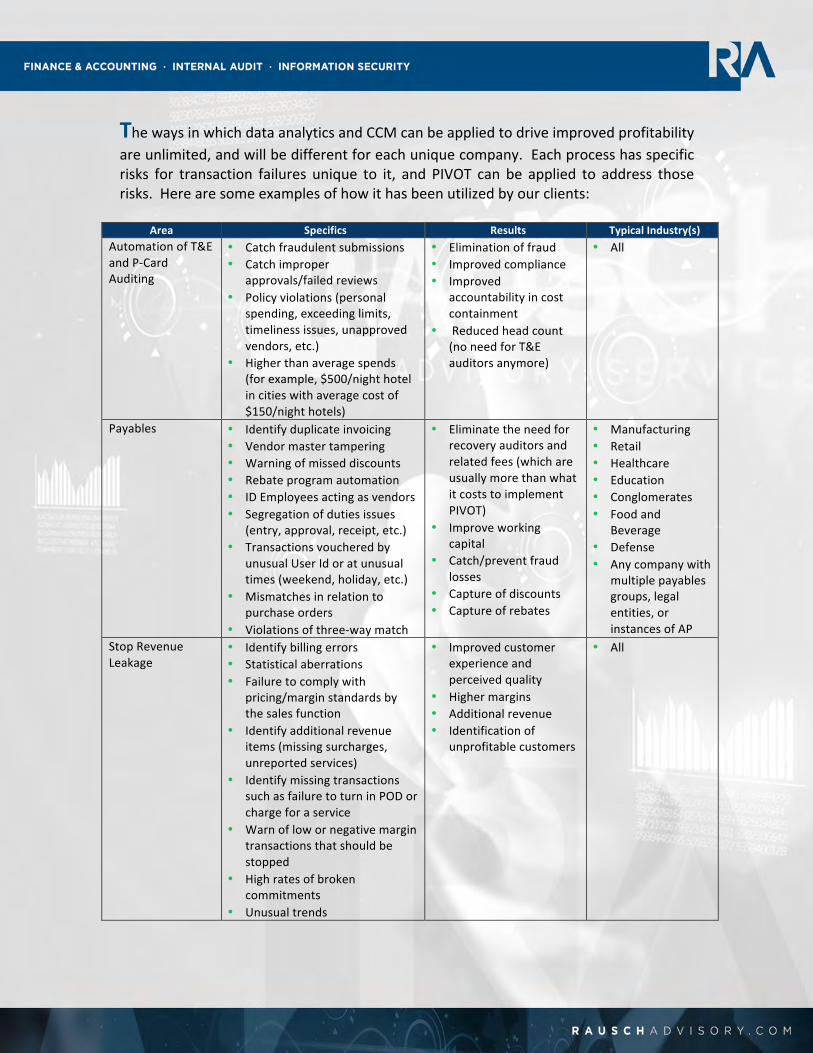
The ways in which data analytics and CCM can be applied to drive improved profitability are unlimited, and will be different for each unique company. Each process has specific risks for transaction failures unique to it, and PIVOT can be applied to address those risks. Here are some examples of how it has been utilized by our clients:
Area Specifics Results Typical Industry(s) Automation of T&E and P-‐Card Auditing
• Catch fraudulent submissions • Catch improper
approvals/failed reviews • Policy violations (personal
spending, exceeding limits, timeliness issues, unapproved vendors, etc.)
• Higher than average spends (for example, $500/night hotel in cities with average cost of $150/night hotels)
• Elimination of fraud • Improved compliance • Improved
accountability in cost containment
• Reduced head count (no need for T&E auditors anymore)
• All
Payables • Identify duplicate invoicing • Vendor master tampering • Warning of missed discounts • Rebate program automation • ID Employees acting as vendors • Segregation of duties issues
(entry, approval, receipt, etc.) • Transactions vouchered by
unusual User Id or at unusual times (weekend, holiday, etc.)
• Mismatches in relation to purchase orders
• Violations of three-‐way match
• Eliminate the need for recovery auditors and related fees (which are usually more than what it costs to implement PIVOT)
• Improve working capital
• Catch/prevent fraud losses
• Capture of discounts • Capture of rebates
• Manufacturing • Retail • Healthcare • Education • Conglomerates • Food and
Beverage • Defense • Any company with
multiple payables groups, legal entities, or instances of AP
Stop Revenue Leakage
• Identify billing errors • Statistical aberrations • Failure to comply with
pricing/margin standards by the sales function
• Identify additional revenue items (missing surcharges, unreported services)
• Identify missing transactions such as failure to turn in POD or charge for a service
• Warn of low or negative margin transactions that should be stopped
• High rates of broken commitments
• Unusual trends
• Improved customer experience and perceived quality
• Higher margins • Additional revenue • Identification of
unprofitable customers
• All
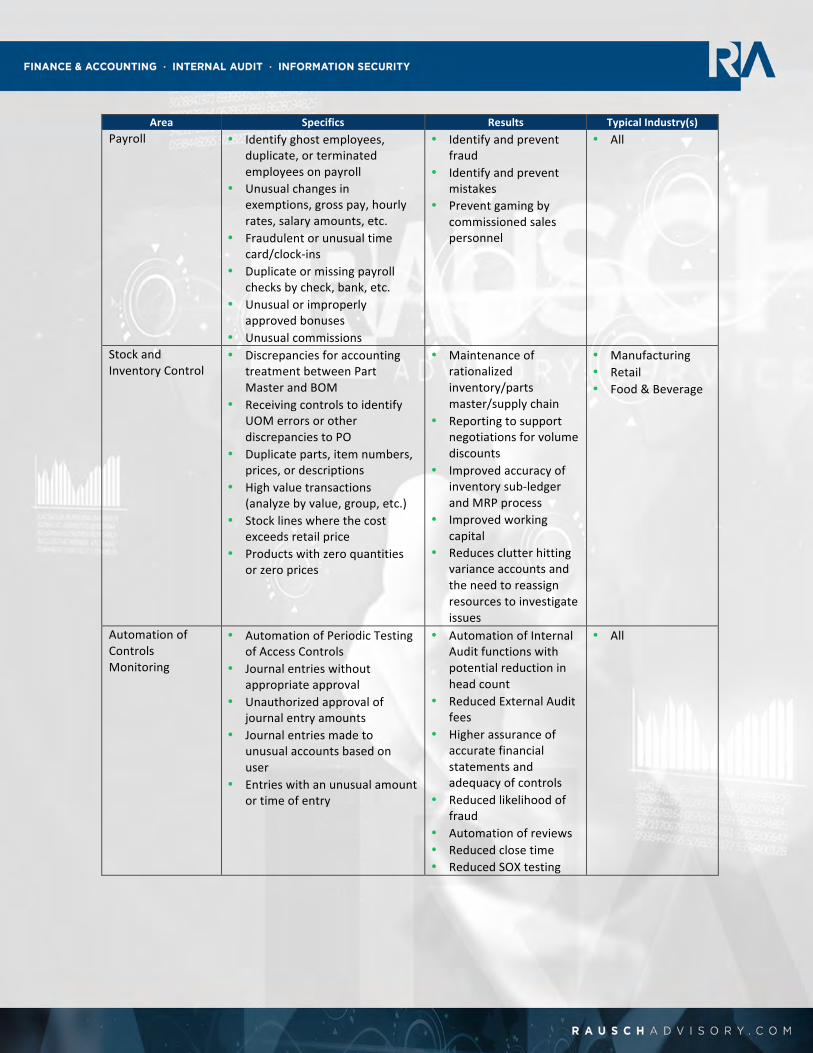
Area Specifics Results Typical Industry(s)
Payroll • Identify ghost employees, duplicate, or terminated employees on payroll
• Unusual changes in exemptions, gross pay, hourly rates, salary amounts, etc.
• Fraudulent or unusual time card/clock-‐ins
• Duplicate or missing payroll checks by check, bank, etc.
• Unusual or improperly approved bonuses
• Unusual commissions
• Identify and prevent fraud
• Identify and prevent mistakes
• Prevent gaming by commissioned sales personnel
• All
Stock and Inventory Control
• Discrepancies for accounting treatment between Part Master and BOM
• Receiving controls to identify UOM errors or other discrepancies to PO
• Duplicate parts, item numbers, prices, or descriptions
• High value transactions (analyze by value, group, etc.)
• Stock lines where the cost exceeds retail price
• Products with zero quantities or zero prices
• Maintenance of rationalized inventory/parts master/supply chain
• Reporting to support negotiations for volume discounts
• Improved accuracy of inventory sub-‐ledger and MRP process
• Improved working capital
• Reduces clutter hitting variance accounts and the need to reassign resources to investigate issues
• Manufacturing • Retail • Food & Beverage
Automation of Controls Monitoring
• Automation of Periodic Testing of Access Controls
• Journal entries without appropriate approval
• Unauthorized approval of journal entry amounts
• Journal entries made to unusual accounts based on user
• Entries with an unusual amount or time of entry
• Automation of Internal Audit functions with potential reduction in head count
• Reduced External Audit fees
• Higher assurance of accurate financial statements and adequacy of controls
• Reduced likelihood of fraud
• Automation of reviews • Reduced close time • Reduced SOX testing
• All
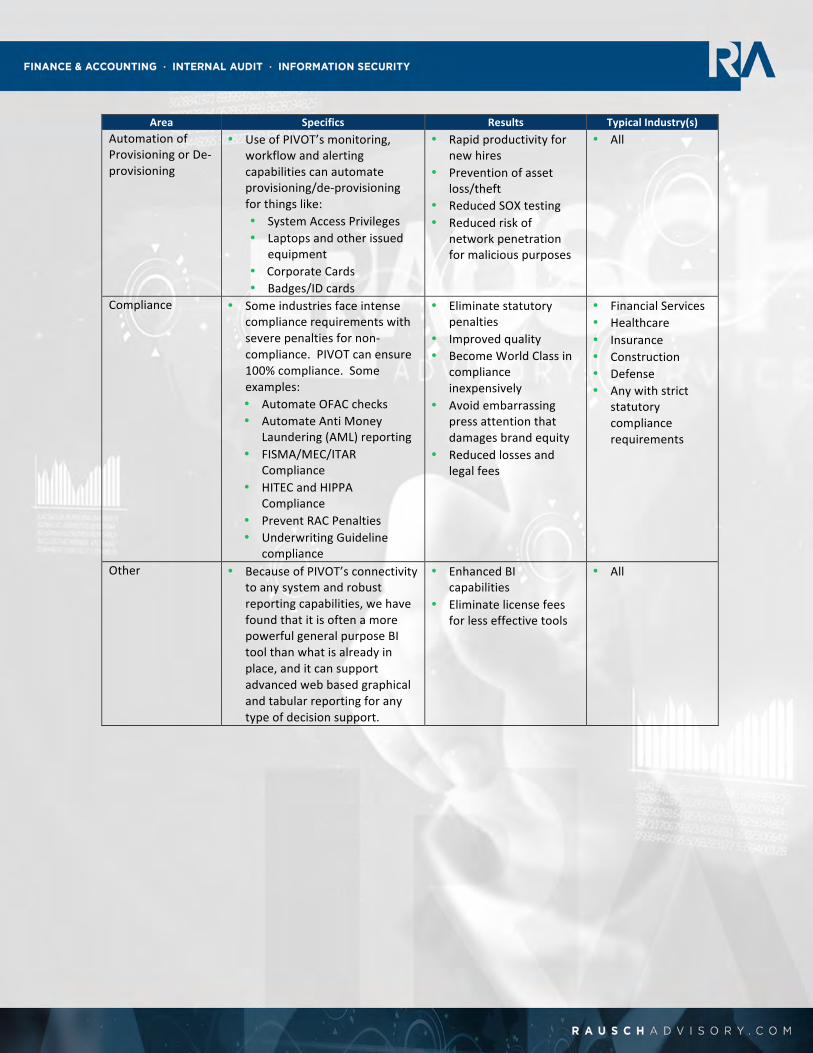
Area Specifics Results Typical Industry(s)
Automation of Provisioning or De-‐provisioning
• Use of PIVOT’s monitoring, workflow and alerting capabilities can automate provisioning/de-‐provisioning for things like: • System Access Privileges • Laptops and other issued
equipment • Corporate Cards • Badges/ID cards
• Rapid productivity for new hires
• Prevention of asset loss/theft
• Reduced SOX testing • Reduced risk of
network penetration for malicious purposes
• All
Compliance • Some industries face intense compliance requirements with severe penalties for non-‐compliance. PIVOT can ensure 100% compliance. Some examples: • Automate OFAC checks • Automate Anti Money
Laundering (AML) reporting • FISMA/MEC/ITAR
Compliance • HITEC and HIPPA
Compliance • Prevent RAC Penalties • Underwriting Guideline
compliance
• Eliminate statutory penalties
• Improved quality • Become World Class in
compliance inexpensively
• Avoid embarrassing press attention that damages brand equity
• Reduced losses and legal fees
• Financial Services • Healthcare • Insurance • Construction • Defense • Any with strict
statutory compliance requirements
Other • Because of PIVOT’s connectivity to any system and robust reporting capabilities, we have found that it is often a more powerful general purpose BI tool than what is already in place, and it can support advanced web based graphical and tabular reporting for any type of decision support.
• Enhanced BI capabilities
• Eliminate license fees for less effective tools
• All
A true CCM Infrastructure Realized -‐ The key is a combination of the infrastructure and the logic that we help our clients implement using algorithms and statistical techniques to identify the aberrations that indicate an incorrect transaction or broken process. We create this logic using tools they usually already own, combined with our extensive insight into key processes and how problems manifest in transactional data. The output from these algorithms ultimately shows up as email alerts and powerful web based reports that allow management to drill into process failures and correct them in near real-‐time before the transaction cycle completes. Our clients can know what went wrong, who was associated with it, and what needs to be done to fix it. If it is a likely case of fraud, they will be informed of that. The PIVOT Methodology has a specific architecture. It can be viewed as a type of advanced reporting combined with workflow features and the additional capability to track ownership and resolution actions for specific aberrations, a true business intelligence engine. However, the philosophy behind PIVOT is radically different from the traditional approach to business intelligence. What do we know about traditional business intelligence reporting? • It is a look in the rearview mirror – simply meaning that it is after-‐the-‐fact reporting
on events. There is no thought of or attempt to correct anything, only to prevent the same thing from happening again.
• It is a view with a telescope -‐ it may tell you generally where you are having problems with profitability or even in specific metrics, but never what exactly caused the result or why, in specific detail. In other words, it gives you the outcome, but never the cause.
If we PIVOT 180 degrees from that philosophy, we would be saying: • I want to know in real-‐time when problems occur that impact my profitability, not
after. I want to know as they occur, so I can fix them before it is too late. • I want a microscope that will tell me specifically what is causing the detrimental
effects. I want to be able to fix the specific cause before it generates the adverse outcome.
This is exactly what PIVOT does, hence the name. Most companies already own the tools that allow them to adhere to the PIVOT methodology and create the requisite infrastructure. The components of the infrastructure are: • An ETL tool that can connect to transactional source systems and retrieve data • A repository for the data (a database)
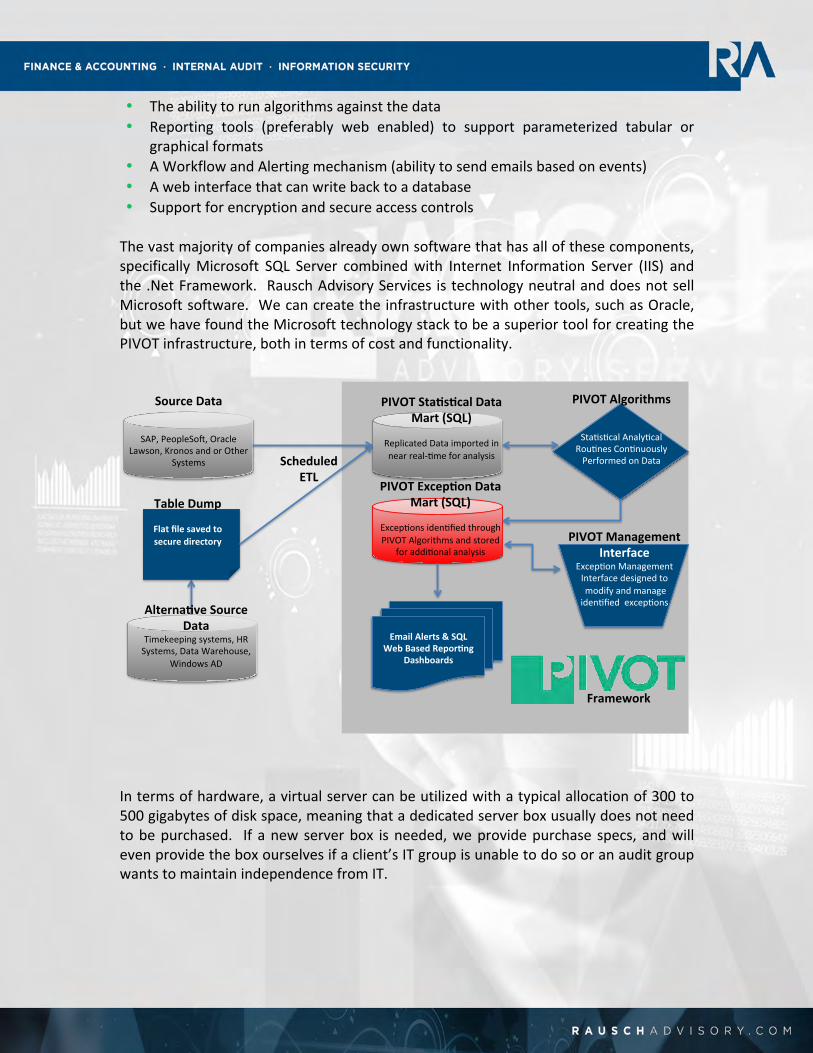
• The ability to run algorithms against the data • Reporting tools (preferably web enabled) to support parameterized tabular or
graphical formats • A Workflow and Alerting mechanism (ability to send emails based on events) • A web interface that can write back to a database • Support for encryption and secure access controls
The vast majority of companies already own software that has all of these components, specifically Microsoft SQL Server combined with Internet Information Server (IIS) and the .Net Framework. Rausch Advisory Services is technology neutral and does not sell Microsoft software. We can create the infrastructure with other tools, such as Oracle, but we have found the Microsoft technology stack to be a superior tool for creating the PIVOT infrastructure, both in terms of cost and functionality.
In terms of hardware, a virtual server can be utilized with a typical allocation of 300 to 500 gigabytes of disk space, meaning that a dedicated server box usually does not need to be purchased. If a new server box is needed, we provide purchase specs, and will even provide the box ourselves if a client’s IT group is unable to do so or an audit group wants to maintain independence from IT.
Source'Data''!
SAP,!PeopleSo*,!Oracle!Lawson,!Kronos!and!or!Other!
Systems !!
Email'Alerts'&'SQL'Web'Based'Repor:ng'
Dashboards'
Scheduled'ETL'!
PIVOT'Sta:s:cal'Data'Mart'(SQL)'
'Replicated!Data!imported!in!near!real<=me!for!analysis!
PIVOT'Algorithms'''!
Sta=s=cal!Analy=cal!!Rou=nes!Con=nuously!Performed!on!Data!!
PIVOT'Excep:on'Data'Mart'(SQL)'
!Excep=ons!iden=fied!through!PIVOT!Algorithms!and!stored!
for!addi=onal!analysis!PIVOT'Management'
Interface!Excep=on!Management!!Interface!designed!to!!modify!and!manage!!iden=fied!!excep=ons!Alterna:ve'Source'
Data'Timekeeping!systems,!HR!Systems,!Data!Warehouse,!
Windows!AD !!
Table'Dump'!
Flat'file'saved'to'secure'directory'
Framework'
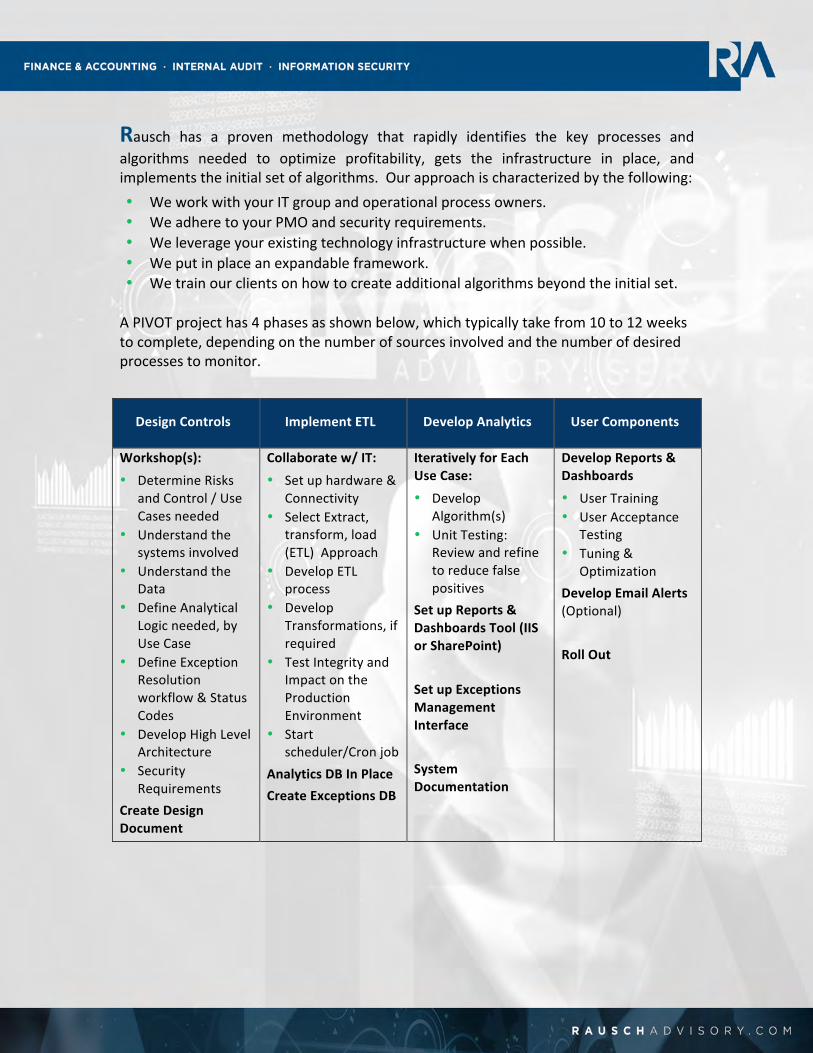
Rausch has a proven methodology that rapidly identifies the key processes and algorithms needed to optimize profitability, gets the infrastructure in place, and implements the initial set of algorithms. Our approach is characterized by the following: • We work with your IT group and operational process owners. • We adhere to your PMO and security requirements. • We leverage your existing technology infrastructure when possible. • We put in place an expandable framework. • We train our clients on how to create additional algorithms beyond the initial set. A PIVOT project has 4 phases as shown below, which typically take from 10 to 12 weeks to complete, depending on the number of sources involved and the number of desired processes to monitor.
Design Controls Implement ETL Develop Analytics User Components
Workshop(s): • Determine Risks
and Control / Use Cases needed
• Understand the systems involved
• Understand the Data
• Define Analytical Logic needed, by Use Case
• Define Exception Resolution workflow & Status Codes
• Develop High Level Architecture
• Security Requirements
Create Design Document
Collaborate w/ IT: • Set up hardware &
Connectivity • Select Extract,
transform, load (ETL) Approach
• Develop ETL process
• Develop Transformations, if required
• Test Integrity and Impact on the Production Environment
• Start scheduler/Cron job
Analytics DB In Place Create Exceptions DB
Iteratively for Each Use Case: • Develop
Algorithm(s) • Unit Testing:
Review and refine to reduce false positives
Set up Reports & Dashboards Tool (IIS or SharePoint) Set up Exceptions Management Interface System Documentation
Develop Reports & Dashboards • User Training • User Acceptance
Testing • Tuning &
Optimization Develop Email Alerts (Optional) Roll Out
Success Stories -‐ Every company has unique requirements and processes they want
monitored that impact their profitability. Here are just a few examples of how PIVOT was utilized and the related successes for our clients. See more client testimonials and hear additional detail at http://www.rauschadvisory.com/pivot/ Emory University Emory had issues with HR and Payroll processes that initially motivated them to take a look at how they addressed data analytics and CCM. Audit continued to find transactional errors and continued to find process control issues. Scott Stevenson, Chief Audit Officer for Emory stated, “We were bleeding from a thousand cuts”. Ultimately Emory decided to engage Rausch to implement the Rausch PIVOT methodology. One of the main issues that Emory faced, had to do with decentralized business units hiring employees who had been previously terminated for cause by another business unit. They asked if we could devise a way to identify previously terminated employees prior to their being rehired. The answer was an unqualified “Yes!” Rausch built logic to poll the HR system and compare a new hire’s social security number to records of terminated employees, and if that projected new hire employee had previously been terminated for cause, a request to investigate was sent to HR. They had a few other issues as well, including: • Hourly staff inappropriate clocking of hours worked • Inconsistent FLMA status for employees with multiple job records • Duplicate supplemental payments to employees • Payment of duplicate invoices to vendors • Again, based on prior audits, they knew the value of resolving these issues would
have an impact of hundreds of thousands of dollars. They referred to it as “bleeding from a thousand cuts” but had limited Internal Audit staff to attack these issues manually.
• Since we had already put in place the infrastructure and had capacity to expand the monitoring, we decided to test payables to see if there were quality issues there, with algorithms to detect potential duplicate invoice issues. While still in testing, we found a $50,000 invoice that was vouchered in to be paid by both the Healthcare group and the University group and were able to prevent it from being double paid.
• Within a few weeks of go-‐live, the implementation had already paid for itself. By the six-‐week point, the university had realized a 250% ROI, and was able to show documentation of the savings to senior management.
• As is typical, the number of aberrations began trending downward as personnel realized that their work was being closely monitored. People became more
concerned with being careful and taking ownership for their part in the processes, and quality began to improve. The first chart on the left shows this -‐-‐ the number of exceptions by month. The next chart shows financial impact (savings) for one of the monitoring algorithms, demonstrating a downward trend as process owners start to become more careful in their work.
National Trucking Company Our client is a national and publicly traded trucking company that had issues with revenue leakage that prompted their interest in PIVOT. Their trucks are equipped with satellite uplinks so whenever additional delivery services are performed (such as helping the customer unload the delivery), the driver can record the services and resulting fees, which feeds into their billing process. However, the truck drivers, who were on a tight schedule, often forgot to record the extra services they performed and wouldn’t always remember to turn in proofs of delivery (POD), which trigger billing. They asked if we could create an algorithm that would statistically analyze historical patterns for each customer and each shipping lane (a given origin and destination for a customer) to identify what ancillary fees should normally be billed for a customer and generate a notification when a delivery did not match the historical pattern. They also wanted an alert if a driver did not turn in a POD within 24 hours of a scheduled delivery. This is exactly the type of thing PIVOT was designed to do, and we implemented the requested monitoring algorithms and alerts. Because the infrastructure can support unlimited process monitoring, we also added logic to generate alerts for several other problems they were challenged with: • Issues with sales people not adhering to pricing standards (compromising margin to
get the sale) • Missing or insufficient fuel surcharges • Issues with discrepancies between the Sales Order and Billing (under-‐billing) • Assurance of compliance with the tariff master • Notification of unusual mileage patterns that could indicate personal use of vehicles • Notification of unbilled tickets (invoices had to be manually approved, making sure
none were missed) The results of the process monitoring that we put in place revealed several thousand dollars per day (or about $50K per month) of legitimate revenue that was being missed. Here again, we also saw a downward trend in the aberrations after PIVOT was implemented, as people became more careful. But nevertheless, the value of the identified revenue leakage paid for PIVOT within a few months.
5825 Glenridge Drive Building 3, Suite 101 Atlanta, Georgia 30328 [email protected]