Embed Size (px)
Citation preview
Biostatistics (2014), pp. 1–14doi:10.1093/biostatistics/kxt053
Differential expression analysis of RNA-seq data atsingle-base resolution
ALYSSA C. FRAZEE
Department of Biostatistics, The Johns Hopkins University Bloomberg School of Public Health, 615North Wolfe Street, Baltimore, MD 21205, USA
SARVEN SABUNCIYAN
Department of Pediatrics, The Johns Hopkins University School of Medicine, 600 North Wolfe Street,Baltimore, MD 21287, USA
KASPER D. HANSEN, RAFAEL A. IRIZARRY, JEFFREY T. LEEK∗
Department of Biostatistics, The Johns Hopkins University Bloomberg School of Public Health, 615North Wolfe Street, Baltimore, MD 21205, USA
SUMMARY
RNA-sequencing (RNA-seq) is a flexible technology for measuring genome-wide expression that is rapidlyreplacing microarrays as costs become comparable. Current differential expression analysis methods forRNA-seq data fall into two broad classes: (1) methods that quantify expression within the boundaries ofgenes previously published in databases and (2) methods that attempt to reconstruct full length RNA tran-scripts. The first class cannot discover differential expression outside of previously known genes. Whilethe second approach does possess discovery capabilities, statistical analysis of differential expression iscomplicated by the ambiguity and variability incurred while assembling transcripts and estimating theirabundances. Here, we propose a novel method that first identifies differentially expressed regions (DERs)of interest by assessing differential expression at each base of the genome. The method then segments thegenome into regions comprised of bases showing similar differential expression signal, and then assignsa measure of statistical significance to each region. Optionally, DERs can be annotated using a refer-ence database of genomic features. We compare our approach with leading competitors from both currentclasses of differential expression methods and highlight the strengths and weaknesses of each. A softwareimplementation of our method is available on github (https://github.com/alyssafrazee/derfinder).
Keywords: Bioinformatics; Differential expression; False discovery rate; Genomics; RNA sequencing.
1. INTRODUCTION
Microarrays revolutionized the way we measure gene expression by providing, for the first time, genome-wide transcript-level measurements, where transcript is used here to refer to the molecule associated
∗To whom correspondence should be addressed.c© The Author 2014. Published by Oxford University Press.
This is an Open Access article distributed under the terms of the Creative Commons Attribution License (http://creativecommons.org/licenses/by/3.0/), whichpermits unrestricted reuse, distribution, and reproduction in any medium, provided the original work is properly cited.
Biostatistics Advance Access published January 6, 2014 at U
NIV
ER
SIDA
D D
E C
HIL
E on M
ay 9, 2014http://biostatistics.oxfordjournals.org/
Dow
nloaded from
2 A. C. FRAZEE AND OTHERS
with expression at the RNA level. However, assigning only one measurement to each known gene hasgreatly over-simplified the biological process in two ways. The first is that we have not yet discoveredor annotated all regions of the genome capable of expressing transcripts. Secondly, most genes pro-duce not one but several transcripts through the process of alternative splicing (Mortazavi and others,2008; Trapnell and others, 2010; Katz and others, 2010). In principle, RNA-sequencing (RNA-seq)provides measurements of transcript expression from which we can obtain a more complete pictureof reality. While microarrays rely on hybridization to predefined probes, by explicitly sequencingtranscripts, RNA-seq is potentially capable of measuring expression in regions not previously anno-tated (Guttman and others, 2010; Clark and others, 2011), and to measure multiple transcripts for indi-vidual genes (Trapnell and others, 2010; Mortazavi and others, 2008). This flexibility, coupled withrapidly declining sequencing costs, has led to explosive growth in the use of RNA-seq technology(Stein and others, 2010).
The most common goal among investigators using either microarrays or RNA-seq is detecting differen-tial expression, for example: discovering transcripts showing different average expression levels across twopopulations. A major difference between the two technologies is that in microarrays, measurement unitsare fixed in advance: only the abundances of the specific RNA sequences that correspond to probes on themicroarrays are measured. With this approach, differential expression is relatively straightforward to quan-tify: measurements from the same probe are compared across samples. In contrast, RNA-seq reads out shortsequences of molecules produced by shearing and reading RNA transcripts (the measurements producedare referred to as reads). Unlike with a microarray, across-sample comparisons are not straightforward asmeasurement units are not defined in advance. Therefore, reads must be summarized into units of expres-sion before differential expression analysis can be performed. Different summarization approaches canlead to very different statistical inference.
Here, we group the most popular differential expression analysis approaches into two categories basedon the ways that the reads are summarized. We refer to these two categories as (1) annotate-then-identifyand (2) assemble-then-identify. The first category counts the number of reads that fall within previouslyidentified boundaries of known genes. The second class seeks to assemble full transcripts directly from thereads. In either case, differential expression analysis is then performed on the resulting measurements at thegene or transcript level. In Section 2, we describe the limitations with the existing approaches and proposea new intermediate class of differential expression methods which we refer to as identify-then-annotate. InSection 3, we propose a specific implementation of the identify-then-annotate class of methods, which wecall Differentially Expressed Region Finder (DER Finder). And in Section 4, using an example dataset, weshow that identify-then-annotate models provide a good compromise between current RNA-seq analysismethods.
2. DIFFERENTIAL EXPRESSION ANALYSIS REVIEW
In this section, we review existing approaches to differential expression analysis with RNA-seq data anddiscuss how the philosophy behind DER Finder fits into this context. RNA-seq generates millions or bil-lions of short sequences from individual mRNA molecules. Analyzing these sequence reads requires sev-eral steps: First, each read must be matched to the position it originates from in the genome in a processcalled alignment. Then, the number of reads aligned to specific regions must be summarized into quanti-tative measurements. The measurements are then normalized for the total number of reads measured fora particular sample and statistical models are applied to the summarized units. Oshlack and others (2010)describe this RNA-seq data analysis process in much more detail. Based on the summarization step, currentstatistical methods for the analysis of RNA-seq data can be grouped into two major classes. The methods inthe first class, which we call annotate-then-identify, summarize the reads by counting the number that fall
at UN
IVE
RSID
AD
DE
CH
ILE
on May 9, 2014
http://biostatistics.oxfordjournals.org/D
ownloaded from
Differential expression analysis of RNA-seq data 3
within pre-specified exons or genes. The exon and gene specifications, collectively called the annotation,are obtained from databases of previously identified genomic features.
Once the reads have been summarized at the exon or gene level, the statistical problem is very sim-ilar to statistical analysis of microarray data, with some deviations because the raw measurements takethe form of counts. Note that the results from this step can be naturally summarized into matrices likethose produced by microarray experiments, where rows are genes or exons and columns are samples.Therefore, many of the earliest statistical methods for analysis of RNA-seq data fall into this categorybecause they were natural extensions of methods developed for microarrays. Two of the most widely usedannotate-then-identify methods are EdgeR (Robinson and others, 2010; McCarthy and others, 2012) andDESeq (Anders and Huber, 2010); Alexa-seq (Griffith and others, 2010), DEXSeq (Anders and others,2012), and a method developed by Wang and others (2012) are further examples of annotate-then-identifypipelines focusing on differential expression analysis of genomic structures that may indicate splicing ortranscriptional differences between groups.
The annotate-then-identify approach provides a straightforward and interpretable analysis and thattested statistical methodology is available once raw read counts have been summarized into a gene-levelmatrix. However, one disadvantage is that it relies heavily on the accuracy of annotation databases of geneand exon boundaries, and current annotation may be unreliable or hard to interpret (Klimke and others,2011). As shown in Figure 1(a), the annotated transcript structure at individual genomic loci can be com-plex. Biologically, the distinct but overlapping regions in vertical columns represent a single exon usedslightly differently in multiple transcripts. This complexity requires the analyst to make important count-ing decisions in advance, since each distinct use of an exon (represented by a box in Figure 1(b)) repre-sents a distinct potential counting region for annotate-then-identify methods. It is well known that differentchoices in how to count (all regions, only non-overlapping regions, or other choices) may lead to dramat-ically different results (Oshlack and others, 2010; Bullard and others, 2010), especially for genes whosetranscripts have a low degree of similarity. In the case shown in Figure 1, using a union model might allowfor discovery of whole-gene differential expression, but it may mask a differential expression signal if,say, just one of the transcripts is overexpressed. Also, there is no “correct” gene model to use, so methodsrequiring this choice are at a disadvantage to those that do not. DER Finder does not require a gene model:if just a few transcripts or exons are differentially expressed, even in a complex scenario like Figure 1shows, the gene will simply be flagged as displaying a complicated differential expression pattern. Thistype of result is not possible in a gene-model-based approach. A second disadvantage of annotate-then-identify methods is that they do not allow for discovery of novel or previously uncharacterized exons orgenes, since they rely on previously constructed databases.
The methods in the second class, which we call assemble-then-identify, attempt to assemble the fullsequences of the mRNA molecules from which the short reads originated. These methods rely less heav-ily on annotation databases of exon or gene boundaries. Another advantage is that assemble-then-identifymethods aim to fully quantify all the potential isoforms of mRNA molecules emanating from each gene.However, the short length of typical sequencing reads leads to inevitable ambiguity when attempting toassemble and quantify abundances of individual mRNA molecules: it is virtually impossible to deter-mine which of many possible sets of assembled transcripts truly generated the observed RNA-seq data.This ambiguity also leads to varying and structured covariances between transcript measurements withingenes, which complicates statistical analysis. There is also an increased computational cost associatedwith assembling full transcripts, quantifying their abundances, and performing transcript-level statisti-cal tests, when compared with the more direct annotate-then-identify approach. The most widely usedalgorithm in this category is Cufflinks/Cuffdiff (Trapnell and others, 2010, 2012); others include Scrip-ture (Guttman and others, 2010), and IsoLasso (Li and others, 2011). In our experience, the computationalcost of transcriptome assembly is non-trivial: running Cufflinks (the transcript assembly step) took approx-imately 5 h on 4 standard cores for each sample, running Cuffmerge (merging 15 assemblies in preparation
at UN
IVE
RSID
AD
DE
CH
ILE
on May 9, 2014
http://biostatistics.oxfordjournals.org/D
ownloaded from

4 A. C. FRAZEE AND OTHERS
20936000 20938000 20940000 20942000
Genomic Position
(a) Annotated Transcripts: Ensembl 61,Chromosome 22
20941800 20941850 20941900 20941950
Genomic Position
(b) Close−up of Exon Annotation Differences
Fig. 1. (a) Structures of annotated transcripts in a 6 kb region of the human genome (corresponding gene ID:ENSG00000099917). A transcript structure this complex causes problems in annotate-then-identify pipelines, as thereis no clear way to determine which transcript or exon generated each read, especially if there is a high degree of overlapbetween unique features, as shown in (b): here, we zoom in on the exon on the right-hand side of (a) and see four over-lapping yet distinct regions. Biologically, this could indicate a single exon with a varying transcription end site, butanalytically, it introduces four potential counting regions and requires a critical counting decision to be made. Usinga method like DER Finder eliminates the need for these decisions: if just one transcript or one form of an exon isdifferentially expressed, the genomic regions that uniquely identify that transcript or exon form will be called differ-entially expressed, and further analysis can be done on the small region to determine the exact phenomenon causingthe observed pattern.
for DE analysis) took 1 h 39 min on 4 standard cores, and running Cuffdiff (assigning reads to transcriptsand identifying DE) took about 42 h on 4 standard cores, comparing a 9-sample group with a 6-samplegroup. For comparison, alignment with Tophat took about 30 h per sample on 4 standard cores. Otherresearchers (Patro and others, 2013) have confirmed that assembly with tools other than Cufflinks alsotook several hours, and Cufflinks is one of the fastest assembly algorithms. Many of these tools allow theuser to avoid the assembly problem by testing known transcripts for differential expression, but they thensuffer from the previously mentioned shortcomings of annotate-then-identify methods.
Here, we propose an intermediate class of methods which we call identify-then-annotate. These meth-ods first summarize the reads by counting the number of reads with alignments overlapping each indi-vidual base in the genome. Then we form a base-by-base statistic to identify bases that are differentiallyexpressed between groups. Consecutive bases showing a common differential expression signature aregrouped into DERs. The unit of statistical analysis is then the DER, which can be evaluated for statisti-cal significance using permutation or bootstrap approaches. DERs can then be compared with previousdatabases of exons and genes to identify: (1) regions of differential expression corresponding to knownexons or genes and (2) novel regions of differential expression. Currently, the closest analysis frame-work to an identify-then-annotate method is to combine pipelines: use an existing tool (e.g. rnaSeqMapLesniewska and Okoniewski, 2011 or an assembler like Cufflinks) to identify expressed genomic regions,then test those regions for differential expression using existing statistical methods (e.g. Anders and Huber,2010). Another identify-then-annotate pipeline has been proposed in the form of maximum mean discrep-
at UN
IVE
RSID
AD
DE
CH
ILE
on May 9, 2014
http://biostatistics.oxfordjournals.org/D
ownloaded from

Differential expression analysis of RNA-seq data 5
ancy (Stegle and others, 2010) but does not have a software implementation available and is designed totest known genes for differential transcript expression—not to be run on an entire genome. We propose anew identify-then-annotate model that builds on the ideas behind the combining-pipelines approach: wefeature a full statistical framework for expression detection and differential expression analysis.
The proposed identify-then-annotate model (1) allows for detection of differential expression in regionsoutside of known exons or genes, (2) allows for direct evaluation of differential expression of knowngenes and exons, (3) does not incur the added ambiguity and computational cost of assembly from shortreads, and (4) can nonetheless detect differential splicing patterns and other expression differences betweenpopulations. Also, an identify-then-annotate tool can be used to address several commonly posed researchquestions at once, including differential expression, splicing analysis, and detection of novel features. Forexample, we could analyze differential expression of known features with annotate-then-identify tools,then use an assembly tool to detect novel features, then re-run the annotate-then-identify tool to analyzedifferential expression of the novel features—but an identify-then-annotate tool would address all of theseissues at once. The primary disadvantage is that the proposed class of methods does not allow for directquantification of alternative transcription. However, regions of potential alternative transcription can beeasily identified where a subset of exons for a gene overlaps DERs but another subset does not, and thoseregions could be explored further with other tools.
3. DER FINDER METHODOLOGY
3.1 Base-level statistics
The first step in DER Finder is quantifying the evidence for differential expression at the nucleotide level.Since RNA-seq produces reads from mRNA transcripts, rather than directly from the genome, reads mustbe aligned using a strategy that accounts for reads that span intron-exon boundaries, called junction reads.In identify-then-annotate approaches like DER Finder, these junction reads are treated identically to readsthat map directly to the genome when computing coverage. Tophat (Trapnell and others, 2009) is an exam-ple of an aligner that appropriately handles junction reads. The user must make choices about mappingparameters to use during the alignment step: for example, some reads will map to more than one genomiclocation (due to, e.g. repetitive regions or pseudogenes). Non-unique read alignments can either be dis-carded, in which case repetitive regions would not appear to be expressed at all, or kept, which would allowall repetitive regions to appear expressed but would not allow those regions to be distinguished from eachother. Whatever alignment strategy and corresponding parameters are used, the result is ultimately a largematrix with rows corresponding to bases and columns corresponding to samples; entries of this matrix arethe number of aligned reads from a particular sample that overlap a particular nucleotide. We refer to thismatrix as the coverage matrix.
To quantify differential expression while accounting for biological variability and possible confounders,we fit a linear regression model to each row of the coverage matrix. Specifically, we let
g(Yi j ) = α(l j ) +P∑
p=2
βp(l j )X pi +K∑
k=1
γk(l j )Wik + εi j , (3.1)
where Yi j is coverage for sample i at location l j , g is a Box–Cox style transformation (e.g. a log transforma-tion) that makes the linear assumption acceptable, α(l j ) represents the baseline gene expression (coverage)level at location l j , X pi is an indicator as to whether sample i falls into category p with category 1 beingthe reference group (e.g. when P = 2, we have the case/control scenario, where X2i is a 0/1 indicator vari-able for whether sample i is a case or a control), βp(l j ) is the parameter of interest quantifying differentialexpression between category p and the reference category at location l j (e.g. in the case/control scenario, if
at UN
IVE
RSID
AD
DE
CH
ILE
on May 9, 2014
http://biostatistics.oxfordjournals.org/D
ownloaded from
6 A. C. FRAZEE AND OTHERS
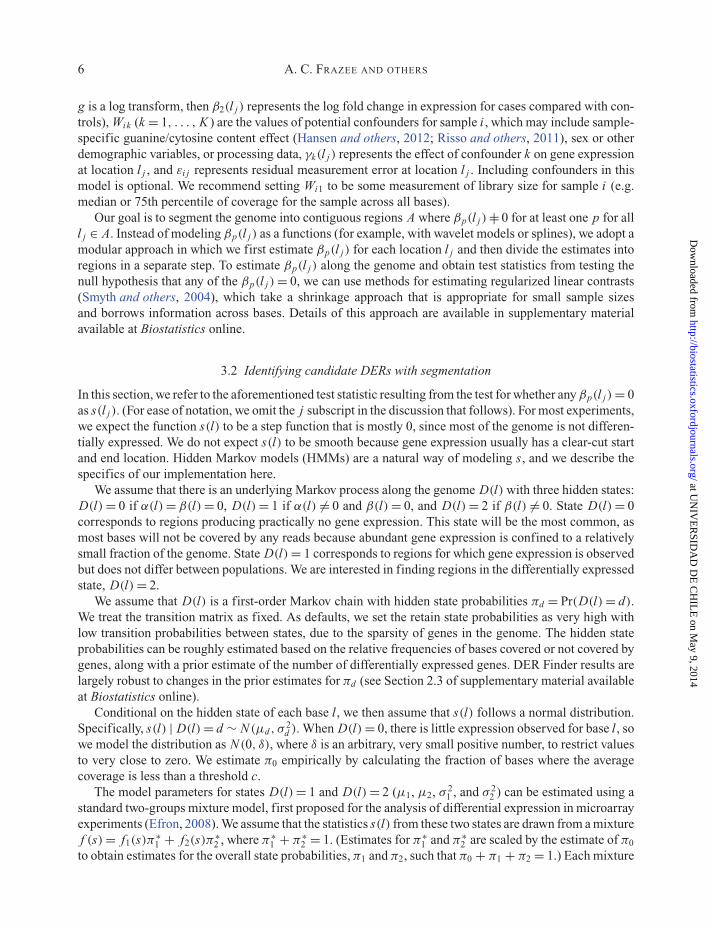
g is a log transform, then β2(l j ) represents the log fold change in expression for cases compared with con-trols), Wik (k = 1, . . . , K ) are the values of potential confounders for sample i , which may include sample-specific guanine/cytosine content effect (Hansen and others, 2012; Risso and others, 2011), sex or otherdemographic variables, or processing data, γk(l j ) represents the effect of confounder k on gene expressionat location l j , and εi j represents residual measurement error at location l j . Including confounders in thismodel is optional. We recommend setting Wi1 to be some measurement of library size for sample i (e.g.median or 75th percentile of coverage for the sample across all bases).
Our goal is to segment the genome into contiguous regions A where βp(l j ) |= 0 for at least one p for alll j ∈ A. Instead of modeling βp(l j ) as a functions (for example, with wavelet models or splines), we adopt amodular approach in which we first estimate βp(l j ) for each location l j and then divide the estimates intoregions in a separate step. To estimate βp(l j ) along the genome and obtain test statistics from testing thenull hypothesis that any of the βp(l j ) = 0, we can use methods for estimating regularized linear contrasts(Smyth and others, 2004), which take a shrinkage approach that is appropriate for small sample sizesand borrows information across bases. Details of this approach are available in supplementary materialavailable at Biostatistics online.
3.2 Identifying candidate DERs with segmentation
In this section, we refer to the aforementioned test statistic resulting from the test for whether any βp(l j ) = 0as s(l j ). (For ease of notation, we omit the j subscript in the discussion that follows). For most experiments,we expect the function s(l) to be a step function that is mostly 0, since most of the genome is not differen-tially expressed. We do not expect s(l) to be smooth because gene expression usually has a clear-cut startand end location. Hidden Markov models (HMMs) are a natural way of modeling s, and we describe thespecifics of our implementation here.
We assume that there is an underlying Markov process along the genome D(l) with three hidden states:D(l) = 0 if α(l) = β(l) = 0, D(l) = 1 if α(l) �= 0 and β(l) = 0, and D(l) = 2 if β(l) �= 0. State D(l) = 0corresponds to regions producing practically no gene expression. This state will be the most common, asmost bases will not be covered by any reads because abundant gene expression is confined to a relativelysmall fraction of the genome. State D(l) = 1 corresponds to regions for which gene expression is observedbut does not differ between populations. We are interested in finding regions in the differentially expressedstate, D(l) = 2.
We assume that D(l) is a first-order Markov chain with hidden state probabilities πd = Pr(D(l) = d).We treat the transition matrix as fixed. As defaults, we set the retain state probabilities as very high withlow transition probabilities between states, due to the sparsity of genes in the genome. The hidden stateprobabilities can be roughly estimated based on the relative frequencies of bases covered or not covered bygenes, along with a prior estimate of the number of differentially expressed genes. DER Finder results arelargely robust to changes in the prior estimates for πd (see Section 2.3 of supplementary material availableat Biostatistics online).
Conditional on the hidden state of each base l, we then assume that s(l) follows a normal distribution.Specifically, s(l) | D(l) = d ∼ N (μd , σ
2d ). When D(l) = 0, there is little expression observed for base l, so
we model the distribution as N (0, δ), where δ is an arbitrary, very small positive number, to restrict valuesto very close to zero. We estimate π0 empirically by calculating the fraction of bases where the averagecoverage is less than a threshold c.
The model parameters for states D(l) = 1 and D(l) = 2 (μ1, μ2, σ 21 , and σ 2
2 ) can be estimated using astandard two-groups mixture model, first proposed for the analysis of differential expression in microarrayexperiments (Efron, 2008). We assume that the statistics s(l) from these two states are drawn from a mixturef (s) = f1(s)π∗
1 + f2(s)π∗2 , where π∗
1 + π∗2 = 1. (Estimates for π∗
1 and π∗2 are scaled by the estimate of π0
to obtain estimates for the overall state probabilities, π1 and π2, such that π0 + π1 + π2 = 1.) Each mixture
at UN
IVE
RSID
AD
DE
CH
ILE
on May 9, 2014
http://biostatistics.oxfordjournals.org/D
ownloaded from

Differential expression analysis of RNA-seq data 7
component is again assumed to be normal and can be estimated using the empirical null distribution. Wecan then directly estimate the most likely path of unobserved states D(l) based on the observed statisticss(l) using standard estimation techniques for HMMs. Details on the specific form of the test statistics, theparameters of the HMM, and validity of HMM assumptions are available in Sections 1–2 of supplementarymaterial available at Biostatistics online.
3.3 Statistical significance
The HMM essentially segments the genome into regions, where a region is defined as a set of contiguousbases having the same predicted latent state. A region of bases with predicted latent state D(l) = 2 isreferred to as a candidate DER. Beyond the segmentation step in the DER Finder pipeline, all analysisis done on the region level rather than the base level. Region-level analysis ensures that the number ofstatistical tests is not unreasonably large (as it would be if we did a formal test at every base) and makes itsuch that variations in read coverage at individual bases that can arise due to technical artifacts in RNA-seqdata will not affect the final results.
After segmenting the genome into regions, we assign a p-value to each candidate DER using a permu-tation procedure. In calculating the p-values for each candidate DER, we consider the size of the individualstatistics within each region, since regions with very large test statistics are more likely to be truly differ-entially expressed. We apply an approach similar to Jaffe and others (2012): first, we calculate the averagebase-level test statistic within each potential DER r : sr = ∑
l∈DERr s(l). Note that sr is the region-level teststatistic for region r . In the simple case–control scenario with no confounders, we can assign p-values toDERs with the following permutation procedure:
1. Permute the values of the covariate of interest (Xi ) for all samples.2. Re-calculate the base-level statistics using (3.1). Denote these null statistics by s0(l).3. Re-run the HMM on the s0(l)s to identify a set of null DERs, indexed by ρ and denoted by DER0
ρ .4. To form region-level null test statistics, calculate the average base-level statistic within each null
DER s0ρ = ∑
l∈DER0ρ s0(l).
Steps 1–4 are repeated B times, and the empirical p-value for region r is pr =(1/
∑Bb=1 Pb)
∑Bb=1
∑Pbρ=1 1(s0
ρ > sr ), where Pb is the number of null DERs for permutation b. Thisquantity is the percent of null DERs with average statistic as or more extreme than the observed statisticfor candidate DER r calculated on the observed data. Standard false discovery rate calculations can thenbe applied to adjust these p-values for multiple testing.
In the case where confounders or additional covariates are included in model (3.1), a straightforwardbootstrap extension of this permutation approach can be derived. After assigning statistical significance toeach region, the DERs can be annotated using a reference database of known genomic features; an exampleof an annotation procedure can be found in supplementary material available at Biostatistics online.
4. RESULTS: COMPARISON ON REAL DATA
Our method is designed for differential expression with biological replicates, but many published experi-ments do not include such replicates (Hansen and others 2011). We therefore designed an analysis com-paring brain tissue between nine human males and six human females to assess the competing methods:the Y chromosome was tested for differential expression between sexes using DER Finder, Edge R, andDESeq (using previously annotated exons) and Cufflinks/Cuffdiff. Specific details of the experiment canbe found in Section 4 of supplementary material available at Biostatistics online.
at UN
IVE
RSID
AD
DE
CH
ILE
on May 9, 2014
http://biostatistics.oxfordjournals.org/D
ownloaded from

8 A. C. FRAZEE AND OTHERS
Two sets of results were obtained: one analysis compared males to females, and the other compared arandomly selected set of five of the males to the other four males. We expect virtually all genomic featuresof the Y chromosome (barring the pseudoautosomal region, pseudogenes, and other irregularities) to bedifferentially expressed between males and females, since females do not have a Y chromosome, and nogenomic features to be differentially expressed between control males.
4.1 DER Finder results
DER Finder identified 534 Y-chromosome regions as differentially expressed (q < 0.05) between malesand females. Six of these regions were classified as underexpressed in males, which we know to be anartifact, but the other 528 were identified as overexpressed in males as expected. Additionally, we found333 novel differentially transcribed regions (q < 0.05). These novel transcribed regions ranged in lengthfrom 1 to 3814 bases. These regions may indicate noise from the method, but they also may point toregions that should be examined further, either because they have interesting mapability characteristics orbecause they might truly be expressed and not yet annotated. The 534 DERs pointed to 411 differentiallyexpressed exons, using the criteria outlined in Table 1 of supplementary material available at Biostatis-tics online. These 411 exons came from 33 different genes, which means we found those 33 genes to bedifferentially expressed or indicate an event of interest. In comparing males with each other, we did notidentify any differential expression on the Y chromosome: the minimum q-value for the regions found tobe differentially expressed in the HMM step was 0.86.
4.2 Cufflinks/Cuffdiff results
Of 808 assembled transcripts tested for differential expression on the Y chromosome between males andfemales, the Tophat–Cufflinks–Cuffdiff pipeline found no differentially expressed transcripts. The mini-mum q-value for these assembled transcripts was 0.45. While 736 of these transcripts showed non-zeroabundance in males and zero abundance in females, these differences were not found to be statistically sig-nificant using the Cuffdiff methodology. Similar, too-conservative results were reported in supplementarymaterial available at Biostatistics online of the manuscript accompanying the release of Cuffdiff version2 (Trapnell and others 2012). In the comparison of normal males, none of the 818 assembled transcriptswere called differentially expressed: the minimum q-value was 0.63.
4.3 EdgeR and DESeq results
Both of these methods tested 433 exons on the Y chromosome for differential expression between malesand females. The other annotated exons on the Y chromosome did not have any reads mapping to them orthe counting model did not allow any reads to be counted for them. Of these 433 exons, EdgeR classified113 and DESeq classified 115 as differentially expressed between males and females (q < 0.05). Ninety-seven exons were found by both EdgeR and DESeq. When comparing the males with each other, neithermethod found any exons to be differentially expressed: all q-values were 1 except for 2 exons with q = 0.12in EdgeR.
4.4 Comparison of results across methods
DER Finder exhibits performance comparable with that of EdgeR and DESeq, while all three methods out-perform Cufflinks/Cuffdiff. DER Finder also has major advantages over EdgeR and DESeq: DER Finderis agnostic to annotation, which means it can identify differential expression signal in two important cases:(a) the case where a feature may be slightly mis-annotated or where the read mappings do not quite matchup with the feature’s annotation and (b) the case where differential expression exists in regions that do
at UN
IVE
RSID
AD
DE
CH
ILE
on May 9, 2014
http://biostatistics.oxfordjournals.org/D
ownloaded from
Differential expression analysis of RNA-seq data 9
5.0
6.0
7.0
8.0
log2
(cou
nt+
32)
(a) chrY: 22737611 − 22737773
femalemale
0
2
4
6
8
t−st
atis
ticex
ons
stat
es
22737545 22737645 22737745
5.0
5.5
6.0
6.5
7.0
log2
(cou
nt+
32)
(b) chrY: 20662506 − 20662937femalemale
0123456
t−st
atis
ticex
ons
stat
es
20662506 20662606 20662706 20662806 20662909genomic position genomic position
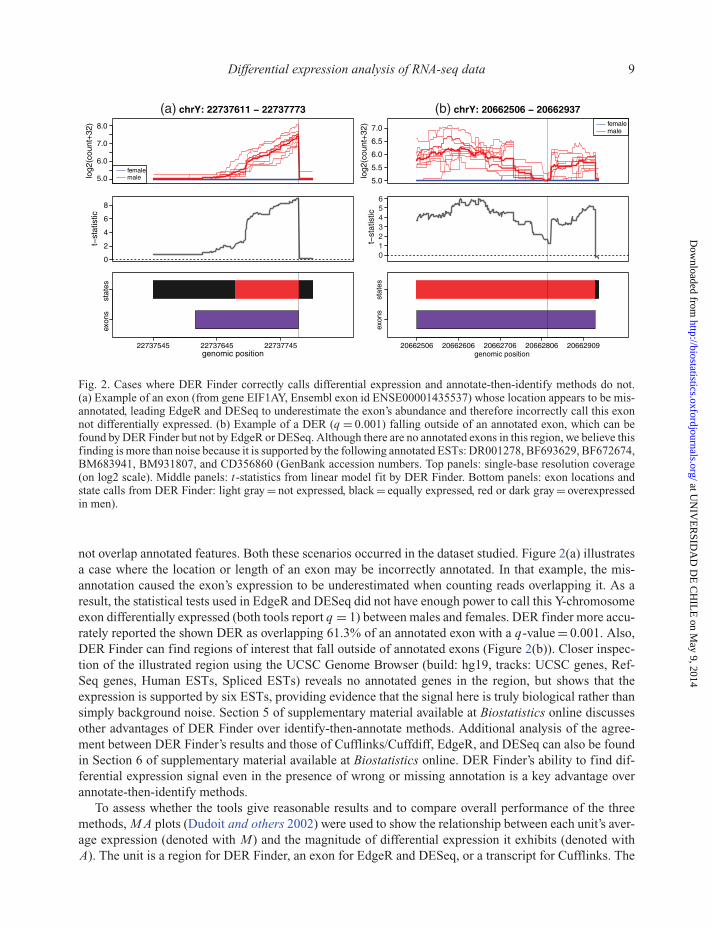
Fig. 2. Cases where DER Finder correctly calls differential expression and annotate-then-identify methods do not.(a) Example of an exon (from gene EIF1AY, Ensembl exon id ENSE00001435537) whose location appears to be mis-annotated, leading EdgeR and DESeq to underestimate the exon’s abundance and therefore incorrectly call this exonnot differentially expressed. (b) Example of a DER (q = 0.001) falling outside of an annotated exon, which can befound by DER Finder but not by EdgeR or DESeq. Although there are no annotated exons in this region, we believe thisfinding is more than noise because it is supported by the following annotated ESTs: DR001278, BF693629, BF672674,BM683941, BM931807, and CD356860 (GenBank accession numbers. Top panels: single-base resolution coverage(on log2 scale). Middle panels: t-statistics from linear model fit by DER Finder. Bottom panels: exon locations andstate calls from DER Finder: light gray = not expressed, black = equally expressed, red or dark gray = overexpressedin men).
not overlap annotated features. Both these scenarios occurred in the dataset studied. Figure 2(a) illustratesa case where the location or length of an exon may be incorrectly annotated. In that example, the mis-annotation caused the exon’s expression to be underestimated when counting reads overlapping it. As aresult, the statistical tests used in EdgeR and DESeq did not have enough power to call this Y-chromosomeexon differentially expressed (both tools report q = 1) between males and females. DER finder more accu-rately reported the shown DER as overlapping 61.3% of an annotated exon with a q-value = 0.001. Also,DER Finder can find regions of interest that fall outside of annotated exons (Figure 2(b)). Closer inspec-tion of the illustrated region using the UCSC Genome Browser (build: hg19, tracks: UCSC genes, Ref-Seq genes, Human ESTs, Spliced ESTs) reveals no annotated genes in the region, but shows that theexpression is supported by six ESTs, providing evidence that the signal here is truly biological rather thansimply background noise. Section 5 of supplementary material available at Biostatistics online discussesother advantages of DER Finder over identify-then-annotate methods. Additional analysis of the agree-ment between DER Finder’s results and those of Cufflinks/Cuffdiff, EdgeR, and DESeq can also be foundin Section 6 of supplementary material available at Biostatistics online. DER Finder’s ability to find dif-ferential expression signal even in the presence of wrong or missing annotation is a key advantage overannotate-then-identify methods.
To assess whether the tools give reasonable results and to compare overall performance of the threemethods, M A plots (Dudoit and others 2002) were used to show the relationship between each unit’s aver-age expression (denoted with M) and the magnitude of differential expression it exhibits (denoted withA). The unit is a region for DER Finder, an exon for EdgeR and DESeq, or a transcript for Cufflinks. The
at UN
IVE
RSID
AD
DE
CH
ILE
on May 9, 2014
http://biostatistics.oxfordjournals.org/D
ownloaded from

10 A. C. FRAZEE AND OTHERS
Fig. 3. M A plots for Y-chromosome regions, transcripts, or exons, for each method and for both male vs. female(red) and male vs. male (blue) comparisons. On each plot, the x-axis represents the average log (base 2) abun-dance for each unit (region for DER Finder, transcript for Cufflinks, exon for EdgeR and DESeq), and the y-axisrepresents the log (base 2) fold change between males and females (red points) or the two groups of males (bluepoints). We expect to see the red, positively sloped diagonal on all plots: this represents genomic regions expressed inmales but not in females. In DER Finder, EdgeR, and DESeq, this diagonal corresponds with differential expres-sion detected, however, no differential expression was detected in Cufflinks even though the red diagonal existsas expected. The displayed M and A values for EdgeR and DESeq are normalized. Specifically, the EdgeR plotis logCPM vs. logFC, where logCPM is log2 counts-per-million and logFC is the log2 fold change (male tofemale); both are normalized for library size and dispersion and are reported in the output of the exactTest func-tion. The DESeq plot is (log2(baseMeanA+0.5) + log2(baseMeanB+ 0.5))/2 vs log2(baseMeanA+0.5) −log2(baseMeanB+ 0.5), where baseMeanA and baseMeanB represent library-size-normalized counts for malesand females, respectively, and are reported in the output table from the function nbinomTest. Since baseMeanAand baseMeanB were sometimes 0, we added 0.5 as an offset to avoid calculating log2(0).
at UN
IVE
RSID
AD
DE
CH
ILE
on May 9, 2014
http://biostatistics.oxfordjournals.org/D
ownloaded from

Differential expression analysis of RNA-seq data 11
0.6
0.7
0.8
0.9
1.0
p−value percentile
Per
cent
from
Mal
e vs
. Fem
ale
Com
paris
ons
1 0.9 0.8 0.7 0.6
DER FinderCufflinksEdgeRDESeq
Fig. 4. Percentage of significantly DERs/transcripts/exons originating from male-to-female comparisons, using variouspercentiles of the p-value distribution as a significance cutoff. We find that most highly significant results are truepositives, i.e. results with low p-values and high test statistics stem from comparing males with females, for DERFinder, EdgeR, and DESeq, while Cufflinks exhibits problems in this area.
M A plots resulting from the Y-chromosome experiment (Figure 3) reveal that DER Finder, EdgeR, andDESeq all produce reasonable results, but the findings from Cufflinks are somewhat problematic. Whilethere does seem to be more overexpression of transcripts in males in the male/female differential expres-sion analysis done by Cufflinks, we observe several extreme fold changes in the opposite direction, and themale-to-male comparison also produced these extreme fold changes. These problems do not exist in theother methods, whose M A plots illustrate high fold changes found between males and females and verylittle change found between males, as expected.
Finally, to get a sense of each method’s accuracy, we evaluated the tables of DERs between sexes andbetween males produced by each method. We gathered all resulting regions—both negative results, fromthe male vs. male comparison, and positive results, from the male vs. female comparison—and orderedthem by the value of their test statistic. An algorithm ranking all positive results ahead of the negative onesis preferred. Figure 4 shows, at each percentile of the differential expression test statistic, the percent ofregions that are positive. This is analogous to finding the percentage of findings that were truly positive atdifferent significance cutoffs, assuming all tests in the sex comparison should be positives and tests in themale comparison should be negatives. We find that EdgeR, DESeq, and DER Finder perform comparably:all or most of the top 20% of regions, ranked by test statistic, came from comparisons between sexes.Cufflinks does much worse: only about 60% of the top 20% of their top transcripts came from the male-to-female comparison. DER Finder performs just slightly better than EdgeR and DESeq in addition tohaving other advantages over these methods, as discussed earlier.
at UN
IVE
RSID
AD
DE
CH
ILE
on May 9, 2014
http://biostatistics.oxfordjournals.org/D
ownloaded from

12 A. C. FRAZEE AND OTHERS
5. DISCUSSION
We propose DER Finder as a specific implementation of a new class of methods for differential expressionanalysis of RNA-seq data. The new class deals with identified challenges by (a) not relying on existingannotation when calling differential expression and (b) avoiding the immensely difficult problem of fulltranscript assembly by putting differential expression into a more straightforward framework. We have builton the ideas behind the approach of combining pipelines (e.g. rnaSeqMap combined with DESeq) to createa full pipeline for statistical analysis of differential expression. DER Finder outperforms Cufflinks/Cuffdiffand performs comparably with EdgeR and DESeq, while having the added advantages of sensitivity evenin the presence of incorrect annotation and transcript discovery capability. We have also considered DERFinder’s performance in other scenarios: a simulation study is presented in Section 7 of supplementarymaterial available at Biostatistics online that addresses experimental design questions and examines DERFinder’s accuracy. An identify-then-annotate method like DER Finder is an important step in developingnew ways to analyze RNA-seq data, so further properties of these types of methods are worth investigating.
6. SOFTWARE
All software and code used in this analysis is available on github (https://github.com/alyssafrazee/derfinder).
SUPPLEMENTARY MATERIAL
Supplementary material is available at http://biostatistics.oxfordjournals.org.
ACKNOWLEDGMENTS
We acknowledge helpful discussions with Geo Pertea and Steven Salzberg. Postmortem brain tissue wasdonated by The Stanley Medical Research Institute’s brain collection. We also thank Ms Ou Chen for hertechnical assistance with high throughput sequencing. Conflict of Interest: None declared.
FUNDING
R.A.I. was partially supported by NIH Ro1 HG005220. J.T.L. and K.D.H. were partially funded by NIHRo1 GM105705-01. J.T.L. was partially funded by NIH P50 MH-094268 Silvo O. Conte Center. S.S. wasprovided by the Stanley Brain Research Institute. Funding to pay the Open Access publication charges forthis article was provided by Jeffrey Leek’s discretionary fund.
REFERENCES
ANDERS, S. AND HUBER, W. (2010). Differential expression analysis for sequence count data. Genome Biology 11,R106.
ANDERS, S., REYES, A. AND HUBER, W. (2012). Detecting differential usage of exons from RNA-seq data. GenomeResearch 22(10), 2008–2017.
BULLARD, J., PURDOM, E., HANSEN, K. D. AND DUDOIT, S. (2010). Evaluation of statistical methods for normalizationand differential expression in mRNA-seq experiments. BMC Bioinformatics 11. R package version 1.8.0.
at UN
IVE
RSID
AD
DE
CH
ILE
on May 9, 2014
http://biostatistics.oxfordjournals.org/D
ownloaded from

Differential expression analysis of RNA-seq data 13
CLARK, M. B., AMARAL, P. P., SCHLESINGER, F. J., DINGER, M. E., TAFT, R. J., RINN, J. L., PONTING, C. P., STADLER,
P. F., MORRIS, K. V., MORILLON, A. and others. (2011). The reality of pervasive transcription. PLoS Biology 9(7),e1000625.
DUDOIT, S., YANG, Y. H., CALLOW, M. J. AND SPEED, T. P. (2002). Statistical methods for identifying differentiallyexpressed genes in replicated cDNA microarray experiments. Statistica Sinica 12(1), 111–140.
EFRON, B. (2008). Microarrays, empirical Bayes and the two-groups model. Statistical Science 23(1), 1–22.
GRIFFITH, M., GRIFFITH, O. L., MWENIFUMBO, J., GOYA, R., MORRISSY, A. S., MORIN, R. D., CORBETT, R., TANG,
M. J., HOU, Y., PUGH, T. J. and others. (2010). Alternative expression analysis by RNA sequencing. Nature Methods7(10), 843–847.
GUTTMAN, M., GARBER, M., LEVIN, J. Z., DONAGHEY, J., ROBINSON, J., ADICONIS, X., FAN, L., KOZIOL,
M. J., GNIRKE, A., NUSBAUM, C. and others. (2010). Ab initio reconstruction of transcriptomes of pluripo-tent and lineage committed cells reveals gene structures of thousands of lincRNAs. Nature Biotechnology 28(5),503–510.
HANSEN, K. D., IRIZARRY, R. A. AND ZHIJIN, WU. (2012). Removing technical variability in RNA-seq data usingconditional quantile normalization. Biostatistics 13(2), 204–216.
HANSEN, K. D., WU, Z., IRIZARRY, R. A. AND LEEK, J. T. (2011). Sequencing technology does not eliminate biologicalvariability. Nature Biotechnology 29(7), 572–573.
JAFFE, A. E., MURAKAMI, P., LEE, H., LEEK, J. T., FALLIN, M. D., FEINBERG, A. P. AND IRIZARRY, R. A. (2012). Bumphunting to identify differentially methylated regions in epigenetic epidemiology studies. International Journal ofEpidemiology 41(1), 200–209.
KATZ, Y., WANG, E. T., AIROLDI, E. M. AND BURGE, C. B. (2010). Analysis and design of RNA sequencing experi-ments for identifying isoform regulation. Nature Methods 7(12), 1009–1015.
KLIMKE, W., O’DONOVAN, C., WHITE, O., BRISTER, J. R., CLARK, K., FEDOROV, B., MIZRACHI, I., PRUITT, K. D.
AND TATUSOVA, T. (2011). Solving the problem: genome annotation standards before the data deluge. Standards inGenomic Sciences 5(1), 168.
LESNIEWSKA, A. AND OKONIEWSKI, M. J. (2011). rnaSeqMap: a Bioconductor package for RNA sequencing dataexploration. BMC Bioinformatics 12(1), 200.
LI, W., FENG, J. AND JIANG, T. (2011). Isolasso: a lasso regression approach to RNA-seq based transcriptome assembly.Journal of Computational Biology 18(11), 1693–1707.
MCCARTHY, D. J., CHEN, Y. AND SMYTH, G. K. (2012). Differential expression analysis of multifactor RNA-seqexperiments with respect to biological variation. Nucleic Acids Research 40(10), 4288–4297.
MORTAZAVI, A., WILLIAMS, B. A., MCCUE, K., SCHAEFFER, L. AND WOLD, B. (2008). Mapping and quantifyingmammalian transcriptomes by RNA-Seq. Nature Methods 5(7), 621–628.
OSHLACK, A., ROBINSON, M. D. AND YOUNG, M.D. (2010). From RNA-seq reads to differential expression results.Genome Biology 11(12), 220.
PATRO, R., MOUNT, S. M. AND KINGSFORD, C. (2013). Sailfish: alignment-free isoform quantification from RNA-seqreads using lightweight algorithms. Preprint, arXiv:1308.3700.
RISSO, D., SCHWARTZ, K., SHERLOCK, G. AND DUDOIT, S. (2011). GC-content normalization for RNA-seq data. BMCBioinformatics 12(1), 480.
ROBINSON, M. D., MCCARTHY, D. J. AND SMYTH, G. K. (2010). edgeR: a Bioconductor package for differentialexpression analysis of digital gene expression data. Bioinformatics 26(1), 139–140.
SMYTH, G. K. (2004). Linear models and empirical Bayes methods for assessing differential expression in microarrayexperiments. Statistical Applications in Genetics and Molecular Biology 3(1), 3.
at UN
IVE
RSID
AD
DE
CH
ILE
on May 9, 2014
http://biostatistics.oxfordjournals.org/D
ownloaded from
14 A. C. FRAZEE AND OTHERS
STEGLE, O., DREWE, P., BOHNERT, R., BORGWARDT, K. AND RATSCH, G. (2010). Statistical tests for detecting differ-ential RNA-transcript expression from read counts. Nature Precedings.
STEIN, L. D. (2010). The case for cloud computing in genome informatics. Genome Biology 11(5), 207.
TRAPNELL, C., HENDRICKSON, D. G., SAUVAGEAU, M., GOFF, L., RINN, J. L. AND PACHTER, L. (2012). Differentialanalysis of gene regulation at transcript resolution with RNA-seq. Nature Biotechnology 31(1), 46–53.
TRAPNELL, C., PACHTER, L. AND SALZBERG, S. L. (2009). TopHat: discovering splice junctions with RNA-Seq. Bioin-formatics 25(9), 1105–1111.
TRAPNELL, C., WILLIAMS, B. A., PERTEA, G., MORTAZAVI, A., KWAN, G., VAN BAREN, M. J., SALZBERG, S. L., WOLD,
B. J. AND PACHTER, L. (2010). Transcript assembly and quantification by RNA-Seq reveals unannotated transcriptsand isoform switching during cell differentiation. Nature Biotechnology 28(5), 511–515.
WANG, W., QIN, Z., FENG, Z., WANG, X. AND ZHANG, X. (2012). Identifying differentially spliced genes from twogroups of RNA-seq samples. Gene 518, 164–170.
[Received December 6, 2012; revised September 19, 2013; accepted for publication November 2, 2013]
at UN
IVE
RSID
AD
DE
CH
ILE
on May 9, 2014
http://biostatistics.oxfordjournals.org/D
ownloaded from