Embed Size (px)
Citation preview

Bùi Đặng Dũng Bùi Huy Tưởng Bùi Ngọc Hùng Bùi Phương Đình Bùi Tố Tâm Caitlin Wiesen
Đặng Hoàng Phong Cao Thị Hồng Vân Christophe Bahuet Đặng Hoàng Giang Đặng Hùng Võ
Đặng Thị Quế Lan Đặng Thu Giang Daniel Kaufman
Đào Mạnh Tân Đào Minh Châu Đào Thanh Thái
Đinh Duy Hòa Lê Hữu Dũng Nguyễn Sĩ Dũng
Đào Hoàng Bình Thiên Đoàn Thị Hoài Anh
Hoàng Xuân Long Hoàng Thị Hạnh Lý
Hoàng Xuân Hoà Jairo Acuna-Alfaro
Đinh Hải Âu Louise Chamberlain
Lại Nguyệt Nga Lại Thị Nguyệt Hằng
Lưu Trọng Quang Ngô Thị Thu Hà
Lê Thúy Hường Lê Quang Cảnh
Lương Thu Hiền Ngô Thị Thương
Lê Văn Chiến Nguyễn Đức Lam
Nuala O'Brien
Samuel Waelty
Sarah Dix
Paul Schuler Phạm Văn Thịnh
Nguyễn Quang Anh Nguyễn Quang Du
Nguyễn Thị Thu Hằng Nguyễn Thị Xuân Dung
Đinh Y Ly Nguyễn Thanh Phương
Phạm Anh Tuấn Phạm Chi Lan
Từ Thành Huế Nguyễn Văn Hiệu Nguyễn Văn Hùng
Nguyễn Thùy Dương Nguyễn Văn Phú Nguyễn Văn Quyền Nguyễn Vũ Hùng Nguyễn Văn Trà
Pierre F. Landry
Phùng Đức Tùng Nguyễn Xuân Thắng Phạm Thị Hạnh Nguyên
Phạm Thị Kim Cúc Phan Châu Thành Phan Hương Giang Phan Lạc Trung Nguyễn Vũ Quỳnh Anh
Sengthong Phothisane Setsuko Yamayaki Simon Drought Stanford Smith Steven Geiger
Tạ Ngọc Tấn Tạ Văn Sỹ Thang Văn Phúc Trần Phương Thảo Trần Công Chính Tô Ngọc Anh Sùng A Phềnh Tạ Kim Cúc Trần Anh Tài Trần Anh Tuấn Trần Bình Minh Trần Đình Trọng
Trần Sơn Tùng Trần Tất Nhật Trần Thị Bích Trần Thị Dung Trần Thị Phượng Trần Vân Anh
Nguyễn Thị Phương Vũ Chiến Thắng Vũ Ngọc Quý Vũ Quang Điệp W. G. Technology Solutions
Phạm Duy Nghĩa Phạm Văn TânPA P I
The Viet Nam Provincial Governance andPublic Administration Performance Index
2018
Measuring Citizens’ Experiences, 2018
Centre for Community Supportand Development Studies
Centre for Research and Training of the Vietnam Fatherland Front

Citation: CECODES, VFF-CRT, RTA & UNDP (2019). The 2018 Viet Nam Governance and Public Administration Performance Index (PAPI): Measuring Citizens’ Experiences. A Joint Policy Research Paper by the Centre for Community Support and Development Studies (CECODES), Centre for Research and Training of the Viet Nam Fatherland Front (VFF-CRT), Real-Time Analytics, and United Nations Development Programme (UNDP). Ha Noi, Viet Nam.
All rights reserved. No part of this publication may be reproduced, stored in a retrieval system or transmitted, in any form or by any means, electronic, mechanical, photocopying, recording or otherwise without prior permission.
For a list of any errors or omissions found subsequent to printing, please visit the PAPI website at www.papi.org.vn.
Disclaimer: The opinions, analyses and recommendations contained in this document do not necessarily reflect the official opinions of the partner organizations. The report is an independent publication.
Maps presented herein are intended for illustrative purposes only. For the United Nations Development Programme (UNDP), a co-implementing partner in this PAPI research, the designations employed and the presentation of material on the maps do not imply the expression of any opinion whatsoever on the part of the UN or UNDP concerning the legal status of any country, territory, city or area or its authorities, or concerning the delimitation of its frontiers or boundaries.
Cover design: Nguyen Thuy Duong
The cover design represents PAPI as an “open platform” for citizens to benchmark their local government’s performance and advocate for improvements in different aspects of governance and public administration that evolve over time as Viet Nam further develops.
Layout and design: Goldensky Co., Ltd. – www.goldenskyvn.com Publishing licence No: 252-2019/CXBIPH/67-06/TN and 322 /QĐ-NXBTN issued on 11 March 2019ISBN: 978-604-975-542-2

The Viet Nam Provincial Governance and Public Administration Performance Index
Measuring Citizens’ Experiences
10 Years of Listening to the Voices of Vietnamese Citizens
Centre for Community Support and Development Studies (CECODES)Centre for Research and Training of the Viet Nam Fatherland Front (VFF-CRT)
Real-Time Analytics (RTA)United Nations Development Programme (UNDP)

APPRECIATION TO ALL THOSE WHO HAVE CONTRIBUTED TO PAPI DEVELOPMENT OVER THE PAST 10 YEARS*Akiko Fujii Hà Việt Hùng Nguyễn Lan Anh Phạm Chi Lan Andrew Wells-Dang Hồ Ngọc Hải Nguyễn Lê Phương Phạm Duy Nghĩa Bạch Ngọc Thắng Hồ Như Nguyệt Nguyễn Lê Ti Ni Phạm Hải Bình Bakhodir Burkhanov Hoàng Hải^ Nguyễn Minh Mẫn Phạm Minh Trí Bùi Đặng Dũng Hoàng Mạnh Cường Nguyễn Ngọc Dinh^ Phạm Thị Hạnh Nguyên Bùi Huy Tưởng Hoàng Minh Nguyễn Ngọc Tùng Phạm Thị Hồng Bùi Ngọc Hùng Hoàng Vân Anh Nguyễn Nhật Linh Phạm Thị Kim CúcBùi Phương Đình Hoàng Xuân Hoà Nguyễn Phúc Quỳnh Phạm Thị Minh Nguyệt Bùi Thị Quế Dương Hoàng Xuân Long Nguyễn Phương Thảo Phạm Văn Tân Bùi Tố Tâm Hoàng Thị Hạnh Lý Nguyễn Quang Anh Phạm Văn Thịnh Caitlin Wiesen Jairo Acuna-Alfaro Nguyễn Quang Du Phan Châu Thành Cao Thị Hồng Vân John Hendra Nguyễn Quang Ngọc Phan Hương Giang Cao Thị Khanh Juan Ovejero Nguyễn Quang Thắng Phan Lạc Trung Cao Thu Anh Justin Baguley Nguyễn Quỳnh Hoa Phan Thị Thanh Trà Catherine Phuong Kamal Malhotra Nguyễn Sĩ Dũng Phùng Đức Tùng Châu Thị Hải Kim Thị Nhàn Nguyễn Thanh Bình Phùng Văn Chấn Christophe Bahuet Lại Nguyệt Nga Nguyễn Thanh Nhã Pierre F. Landry Cù Thị Đoài Lại Thanh Nga Nguyễn Thanh Phương Pratibha Mehta Đặng Hoàng Giang Lại Thị Nguyệt Hằng Nguyễn Thị Dung Samuel Waelty Đặng Hoàng Phong Lê Đặng Trung Nguyễn Thị Hồng Linh Sarah Dix Đặng Hồng Hà Lê Hải Hà Nguyễn Thị Lan Anh Sengthong Phothisane Đặng Hùng Võ Lê Hữu Dũng Nguyễn Thị Mai Lan Setsuko Yamayaki Đặng Hữu Phương Lê Kim Thái Nguyễn Thị Nga Simon Drought Đặng Minh Hoa Lê Mạnh Hùng Nguyễn Thị Nguyệt Stanford Smith Đặng Ngọc Dinh Lê Mậu Nhiệm Nguyễn Thị Phương Steven Geiger Đặng Ngọc Hải Lê Minh Tâm Nguyễn Thị Phương Thúy Sùng A Phềnh Đặng Ngọc Hân Lê Quang Cảnh Nguyễn Thị Quỳnh Tạ Kim Cúc Đặng Phương Giang Lê Thế Hùng Nguyễn Thị Quỳnh Trang Tạ Ngọc Tấn Đặng Quang Vinh Lê Thế Lĩnh Nguyễn Thị Thanh Nga Tạ Văn Sỹ Đặng Quốc Trung Lê Thị Nga Nguyễn Thị Hà Trang Thang Văn Phúc Đặng Thanh Phương Lê Thị Nghệ Nguyễn Thị Thu Trang The Vietnam Fatherland FrontĐặng Thị Ánh Tuyết Lê Thúy Hường Nguyễn Thị Tình Tô Ngọc Anh Đặng Thị Tuyết Lê Tú Mai Nguyễn Thị Xuân Dung Trần Anh Tài Đặng Thị Quế Lan Lê Văn Chiến Nguyễn Thị Thu Hằng Trần Anh Tuấn Đặng Thu Giang Lê Văn Hiệp Nguyễn Thu Hiền Trần Bình Minh Daniel Kaufman Lê Văn Lân Nguyễn Thuý Anh Trần Bội Văn Đào Hoàng Bình Thiên Lê Văn Lư Nguyễn Thùy Dương Trần Công Chính Đào Mạnh Tân Louise Chamberlain Nguyễn Trần Lâm Trần Đình Trọng Đào Minh Châu Lương Thu Hiền Nguyễn Tuấn Hải Trần Đức Lượng Đào Thanh Thái Lưu Trọng Quang Nguyễn Văn Công Trần Ngọc Anh Đào Thùy Linh Ngô Thị Thu Hà Nguyễn Văn Hiệu Trần Ngọc Nhẫn^ Đào Trung Chính Ngô Thị Thương Nguyễn Văn Hùng Trần Phương Thảo Dennis Curry Ngô Tự Nam Nguyễn Văn Phú Trần Sơn Tùng Đinh Duy Hòa Nguyễn Bá Hùng Nguyễn Văn Quyền Trần Tất Nhật Đinh Hải Âu Nguyễn Công Hiển Nguyễn Văn Thắng Trần Thị Bích Đinh Xuân Thảo Nguyễn Công Nguyên Nguyễn Văn Thắng Trần Thị Dung Đinh Y Ly Nguyễn Doãn Khánh Nguyễn Văn Trà Trần Thị Phượng Đỗ Duy Thường Nguyễn Duy Hữu Nguyễn Việt Cường Trần Thị Quốc Khánh Đỗ Thanh Huyền Nguyễn Đình Cung Nguyễn Việt Dũng Trần Vân Anh Đỗ Thùy Linh Nguyễn Đình Tuấn Nguyễn Việt Lan Trần Việt Hùng Đỗ Xuân Dương Nguyễn Đức Lam Nguyễn Vũ Giang Trịnh Thị Huyền Đoàn Thị Hà Nguyễn Đức Nam Nguyễn Vũ Hùng Trịnh Thị Trà My Đoàn Thị Hoài Anh Nguyễn Đức Thắng Nguyễn Vũ Quỳnh Anh Từ Thành Huế Edmund J. Malesky Nguyễn Đức Trị Nguyễn Xuân Thắng Vũ Chiến Thắng Elisa Cavacece Nguyễn Hoàng Long Nông Hữu Dương Vũ Ngọc Quý Giáp Văn Tấp Nguyễn Hữu Tuấn Nuala O'Brien Vũ Quang Điệp Golden Sky Nguyễn Hữu Tuyên Paul Schuler Vũ Thị Thu Giang Hà Công Long Nguyễn Huy Dũng Pernille Goodall W.G Technology Solutions Hà Đức Huy Nguyễn Huy Quang Phạm Anh Tuấn Etc.Hà Quang Phúc Nguyễn Kiêm Hiếu
(*) We also greatly appreciate the 117,363 citizens who provided their feedback through PAPI surveys, the hundreds of the Viet Nam Fatherland collaborators from provincial to village levels, and the thousands of enumerators who facilitated and conducted the face-to-face interviews over the past 10 years.
(^) In memory of those who passed away during the past 10 years.

TABLE OF CONTENTS
FOREWORD ...................................................................................................................................................................................... V
ACKNOWLEDGEMENTS ........................................................................................................................................................ VI
2018 PAPI NATIONAL ADVISORY BOARD ...........................................................................................................VIII
SNAPSHOT OF PAPI FROM 2009-2018 .................................................................................................................... IX
EXECUTIVE SUMMARY ..........................................................................................................................................................XI
INTRODUCTION ............................................................................................................................................................................ 1
CHAPTER 1: OVERVIEW OF GOVERNANCE AND PUBLIC ADMINISTRATION PERFORMANCE IN 2018 AND OVER TIME (2011-2018)
Overview .........................................................................................................................................................9
National Trends in the Core PAPI from 2011 to 2018 ...................................................................................9
Dimension 1: Participation at Local Levels ...........................................................................................................................12
Dimension 2: Transparency in Local Decision-making ....................................................................................................13
Dimension 3: Vertical Accountability .....................................................................................................................................16
Dimension 4: Control of Corruption in the Public Sector ...............................................................................................16
Dimension 5: Public Administrative Procedures ................................................................................................................20
Dimension 6: Public Service Delivery .....................................................................................................................................20
Overall 2018 Findings in the New PAPI Dimensions ..................................................................................22
Dimension 7: Environmental Governance............................................................................................................................22
Dimension 8: E-Governance ......................................................................................................................................................23
Conclusion and Implications .......................................................................................................................25
CHAPTER 2: IMPORTANT ISSUES IN VIET NAM IN 2018: ECONOMIC, ENVIRONMENTAL AND GENDER CONCERNSOverview ..............................................................................................................................................................................................27
Issues of Greatest Concern in 2018 .........................................................................................................................................28
Economic Inequality .......................................................................................................................................................................30
Environmental Trade-offs ............................................................................................................................................................35
Project Choice .................................................................................................................................................................................35
Power Plant Choice .......................................................................................................................................................................38
Gender Equality Perspective ......................................................................................................................................................40
Conclusions and Implications ....................................................................................................................................................44

II PAPI 2018THE VIET NAM PROVINCIAL GOVERNANCE AND PUBLIC ADMINISTRATION PERFORMANCE INDEX
CHAPTER 3: 2018 PROVINCIAL PERFORMANCE BY DIMENSIONS
Overview ..............................................................................................................................................................................................47
2018 Provincial Performance by Dimensions ....................................................................................................................49
Dimension 1: Participation at Local Levels .........................................................................................................................49
Dimension 2: Transparency in Local Decision-making ..................................................................................................54
Dimension 3: Vertical Accountability ...................................................................................................................................61
Dimension 4: Control of Corruption in the Public Sector .............................................................................................67
Dimension 5: Public Administrative Procedures ..............................................................................................................73
Dimension 6: Public Service Delivery ...................................................................................................................................79
Dimension 7: Environmental Governance .........................................................................................................................87
Dimension 8: E-Governance ....................................................................................................................................................92
Aggregate 2018 PAPI and Implications ................................................................................................................................97
BIBLIOGRAPHY .................................................................................................................................................................. 102
APPENDICES ......................................................................................................................................................................... 107
LIST OF FIGURES
Figure 1.1: National Trends from 2011 to 2018 in the Core PAPI .......................................................................................10Figure 1.2: Citizens’ Perception of Current Household Economic Situation, 2011-2018 ..........................................11Figure 1.3: Perceived Economic Situation in the Next Five Years, 2011-2018 ...............................................................11Figure 1.4: Trends in Participation at Local Levels in Comparable Sub-dimensions, 2011-2018 ...........................12Figure 1.5: Trends in Transparency in Local Decision-making in Comparable Sub-dimensions, 2011-2018 ....13Figure 1.6: Transparency of Local Land Use Plans, 2011-2018 ...........................................................................................14Figure 1.7: Percentage of Citizens Reporting Residential Land Seizures, 2011-2018 ................................................14Figure 1.8: Percentage of Respondents Reporting that Compensation for Residential Land Taken was Fair,
2014-2018 ........................................................................................................................................................................15Figure 1.9: Farming Land Seizures and Satisfaction with Compensation, 2018 ..........................................................16Figure 1.10: Trends in the Control of Corruption in the Public Sector Dimension, 2011-2018 ..............................17Figure 1.11: Trends in Corruption as Perceived by Citizens, 2011-2018 .........................................................................17Figure 1.12: Importance of Personal Connections to Access State Employment, 2011-2018 ................................18Figure 1.13: Perception of Corruption Change Compared to Three Years Ago by Level of Government, 2018 ....19Figure 1.14: Government’s Seriousness in Dealing with Corruption, 2018 ...................................................................19Figure 1.15: Trends in the Public Administrative Procedures Dimension, 2011-2018 ...............................................21Figure 1.16: Trends in the Public Service Delivery Dimension, 2011-2018 ....................................................................21Figure 1.17: Percentage of Respondents with Access to Health Insurance, 2011-2018 ...........................................22Figure 1.18: Perceived Local Air and Water Quality and Preference for Environmental Protection, 2016-2018 ....23Figure 1.19: Access to the Internet, 2016-2018........................................................................................................................24Figure 1.20: Accessibility to E-government Portals for Public Administrative Procedures, 2016-2018 ...............24Figure 2.1: Most Important Issue Facing the Country from Citizens’ Perspective, 2018 ...........................................28Figure 2.2: Change in Issues of Greatest Concern, 2016-2018 ...........................................................................................29Figure 2.3: Change in Issues of Greatest Concern, 2015-2018 ...........................................................................................29

www.papi.org.vn III
Figure 2.4: Gender Differences in Issues of Greatest Concern, 2018................................................................................30Figure 2.5: Income Distribution of PAPI Respondents, 2018 ..............................................................................................31Figure 2.6: Level of Concern About Poverty by Income Level, 2018 ................................................................................31Figure 2.7: Level of Concern About Poverty by Gender, 2018 ............................................................................................32Figure 2.8: Citizens’ Perception of Current Rich-Poor Gap in Viet Nam, 2016-2018 ...................................................32Figure 2.9: Citizens’ Perception of Current Economic Inequality in Viet Nam, 2016-2018 .......................................33Figure 2.10: Concern with Inequality by Income and Education Levels, 2018 .............................................................33Figure 2.11: Support for Paying More Tax for Provincial Wealth Transfers to Poorer Provinces by
Income Level, 2018 ....................................................................................................................................................34Figure 2.12: Effects of Investor Attributes on Citizens’ Willingness to Support Investor License Applications ......37Figure 2.13: Effects of Investor Attributes on Citizens’ Willingness to Support Investor License Applications
by Income Strata and Sector ..................................................................................................................................38Figure 2.14: Impact of Power Source on Willingness to Pay for New Plants .................................................................39Figure 2.15: Assessment of Governance and Public Administration Performance by Gender, 2018 ...................40Figure 2.16: Gender Gap in Land Registration, 2017-2018 ..................................................................................................41Figure 2.17: Preference for Men or Women in Political Positions, 2018 ..........................................................................43Figure 2.18: Proportion Preferring Men or Women in Political Positions by Gender, 2018 .....................................43Figure 3.2: Sources of Information about State Policy Commonly Used by Citizens .................................................59Figure 3.3: Reasons for not Using Courts and Preferred Alternatives in Resolutions to Civil Disputes ...............65Figure 3.4a: Citizen Perceptions of Corruption by Province, 2018 ....................................................................................72Figure 3.4b: Relationship Needed for State Employment by Province, 2018 ...............................................................72Figure 3.5a: Citizen Assessment of Administrative Services for LURCs, 2018 ...............................................................78Figure 3.5b: Assessment of Administrative Services at the Commune Level, 2018 ...................................................78Figure 3.6a: Citizens’ Assessment of Quality of Public Primary Schools, 2018 .............................................................85Figure 3.6b: Citizens’ Assessment of Quality of Public District Hospitals, 2018 ...........................................................85Figure 3.6c: Percentage of Respondents Who Were Victims of Crime, 2018 .................................................................86Figure 3.7: Dashboard of Provincial Performance in Environmental Governance, 2018 ..........................................91Figure 3.8: Dashboard of Provincial Performance in E-Governance, 2018 ....................................................................96Figure 3.9a: Dashboard of Provincial Performance by Dimension, 2018 .................................................................... 101Figure 3.9b: Correlation between the 2018 PAPI and 2018 Provincial Competitiveness Index (PCI) ................ 101
LIST OF BOXES
Box 1: A Timeline of Dong Nai’s Response to PAPI Findings ................................................................................................. 3
Box 3.1: Key Findings from Dimension 1: Participation at Local Levels ..........................................................................49
Box 3.2: Key Findings from Dimension 2: Transparency in Local Decision-making ...................................................49
Box 3.3: Key Findings from Dimension 3: Vertical Accountability ....................................................................................61
Box 3.4: Key Findings from Dimension 4: Control of Corruption in the Public Sector...............................................67
Box 3.5: Key Findings from Dimension 5: Public Administrative Procedures ...............................................................73
Box 3.6: Key Findings from Dimension 6: Public Service Delivery ....................................................................................79
Box 3.7: Key Findings from Dimension 7: Environmental Governance ...........................................................................87
Box 3.8: Key Findings from Dimension 8: E-Governance .....................................................................................................92
Box 3.9: Key Findings from the Aggregate 2018 PAPI ...........................................................................................................97

IV PAPI 2018THE VIET NAM PROVINCIAL GOVERNANCE AND PUBLIC ADMINISTRATION PERFORMANCE INDEX
Map 3.1: Provincial Performance in Citizen Participation at Local Levels by Quartiles, 2018 .................................50
Map 3.2: Provincial Performance in Transparency of Local Decision-making by Quartiles, 2018 .........................55
Map 3.3: Provincial Performance in Vertical Accountability by Quartiles, 2018 ..........................................................62
Map 3.4: Provincial Performance in Control of Corruption in the Public Sector by Quartiles, 2018 ....................68
Map 3.5: Provincial Performance in Public Administrative Procedures by Quartiles, 2018 .....................................74
Map 3.6: Provincial Performance in Public Service Delivery by Quartiles, 2018 ..........................................................80
Map 3.7: Provincial Performance in Environmental Governance by Quartiles, 2018 ................................................88
Map 3.8: Provincial Performance in E-Governance by Quartiles, 2018 ...........................................................................93
Map 3.9: Provincial Performance in Governance and Public Administration by Quartiles, 2018 ..........................98
LIST OF MAPS
Table 1.1: Trends in Corruption as Experienced by Citizens, 2012-2018 ........................................................................20
Table 2.1: Conjoint Investor Profile Options .............................................................................................................................36
Table 2.2: Choice of Potential Power Plants ..............................................................................................................................39
Table 2.3: Reasons for not Having Name on LURCs, 2016-2018 ........................................................................................42
Table 3.1a: Citizen Participation at Local Levels (Dimension 1): Results by Indicators in 2018 and from 2016 to 2018 ........................................................................................................................................................51
Table 3.1b: Dashboard of Provincial Performance in Participation at the Local Level, 2018 ..................................53
Table 3.2a: Transparency (Dimension 2): Results by Indicators in 2018 and from 2016 to 2018 ...........................56
Table 3.2b: Dashboard of Provincial Performance in Transparency of Local Decision-making, 2018 .................60
Table 3.3a: Vertical Accountability (Dimension 3): Results by Indicators in 2018, and from 2016 to 2018 ........63
Table 3.3b: Dashboard of Provincial Performance in Vertical Accountability by Sub-dimension, 2018 .............66
Table 3.4a: Control of Corruption in the Public Sector (Dimension 4): Results by Indicators in 2018, and from 2016 to 2018 ...............................................................................................................................................69
Table 3.4b: Dashboard of Provincial Performance in Control of Corruption, 2018.....................................................71
Table 3.5a: Public Administrative Procedures (Dimension 5): Results by Indicators in 2018, and from 2016 to 2018 ...............................................................................................................................................75
Table 3.5b: Dashboard of Provincial Performance in Public Administrative Procedures, 2018 .............................77
Table 3.6a: Public Service Delivery (Dimension 6): Results by Indicators in 2018, and from 2016 to 2018 .......81
Table 3.6b: Dashboard of Provincial Performance in Public Service Delivery, 2018 ..................................................84
Table 3.7a: Environmental Governance (Dimension 7): Results by Indicators in 2018..............................................89
Table 3.7b: Dashboard of Provincial Performance in Environmental Governance, 2018 .........................................90
Table 3.8a: E-Governance at the Local Level (Dimension 8): Results by Indicators in 2018 ....................................94
Table 3.8b: Dashboard of Provincial Performance in E-Governance at the Local Level, 2018 ................................95
Table 3.9: Dashboard of Aggregate Dimensional Performance by Province, 2018 ....................................................99
LIST OF TABLES

www.papi.org.vn V
FOREWORDThis year marks the 10th anniversary of the Viet Nam Provincial Governance and Public Administration Performance Index (PAPI). Since the first year of the research programme in 2009, we the implementing organisations and our individual partners have searched for measurable aspects of governance, experimented with new research approaches, and overcome a variety of challenges.
The aims of the 2018 PAPI Report are threefold. First, it presents key findings at the national and provincial levels, identifies strengths and weaknesses in policy implementation, and suggests actionable measures based on the 2018 PAPI survey research. Second, because 2018 marked the third year of the 2016-2021 Government of Viet Nam term, the report provides information on how provincial governments performed in their third year in office and suggests what they can do better in the coming years from a citizens’ perspective. Third, the report helps Viet Nam to identify areas that need greater attention as the country rolls out its national agenda for sustainable development towards 2030. In the same spirit as the 2030 Agenda for Sustainable Development that Viet Nam has committed to, PAPI puts citizens at the heart of the country’s development.
Over time, stakeholders have come to trust in PAPI as an important source of research data and have become increasingly convinced of the power of the PAPI approach. These users of the PAPI results have in turn helped to make PAPI better known and received in Viet Nam. After a decade of implementation involving nearly 120,000 respondents from 63 provinces nationwide, PAPI has become established in the public view as a source of objective and quality indicators that helps government agencies and decision-makers at different levels to reflect on their performance in governance, public administration and public service delivery for the interest of Vietnamese citizens. PAPI facts and figures have been mentioned by heads of the Party, Government, National Assembly, ministerial agencies and mass organizations.
At this 10th anniversary, we the implementing agencies want to take the opportunity to acknowledge the significant financial contributions from PAPI donors, including the Government of Spain (from 2009-2010), the Government of Switzerland (from 2011-2017), the Government of Australia (from 2017) and the Government of Ireland (from 2018). We also have received widespread support from various stakeholders from the central to grassroots level, from donors and civil society organisations, from the mass media and ordinary citizens. The use and reception of PAPI findings from these diverse groups have been the source of inspiration for us to further develop PAPI.
To better reflect governance and public administration performance in Viet Nam over time, PAPI continues to be refined and renewed. For instance, this year’s report introduces for the first time two new dimensions focused on e-governance and environmental governance—to gauge local governments’ performance in progress related to the Industrial Revolution 4.0 and in responding to citizens’ growing demands for environmental protection. In addition, the report provides baselines for citizens’ experiences in obtaining information from the government—to inform enforcement of the 2016 Law on Access to Information that became effective in July 2018. It also establishes several indicators to provide information about citizens’ access to justice services, to help government agencies at different levels review implementation of Resolution 49-NQ/TW of the Viet Nam Communist Party Politburo on judicial reforms towards 2020.
We will continue to make every effort to ensure that PAPI findings have an impact on the policy cycle—from policymaking to policy implementation. We are dedicated to creating a platform for citizens to leverage their active civic roles, and to bring to the fore citizens’ voices and expectations for different aspects of Viet Nam’s development and international integration. These strong commitments also mean that we have faced numerous challenges and opportunities from the first days of PAPI in May 2009. As we look back on this anniversary at the remarkable growth and impact of PAPI over the past decade, we also look forward with great expectations, knowing that the continued success of this unique monitoring tool is only possible with your continued constructive feedback and support.
Centre for Community Support
and Development Studies
Centre for Research and Training of
the Viet Nam Fatherland Front
United NationsDevelopment Programme
in Viet Nam

ACKNOWLEDGEMENTS
This 2018 PAPI Report is the result of the 10th iteration of the prolific partnership and great collaboration between the Centre for Community Support and Development Studies (CECODES), the Centre for Research and Training of the Viet Nam Fatherland Front (VFF-CRT), and the United Nations Development Programme (UNDP). In addition, since 2015 Real-Time Analytics has provided technical support to digitize PAPI’s data collection processes, and since 2012 the Ho Chi Minh National Academy of Politics has played a critical role in disseminating PAPI findings to provincial leaders through action-based research and policy advice.
The 2018 report is co-authored by Ms Đỗ Thanh Huyền from UNDP; Dr Đặng Hoàng Giang and Dr Trần Công Chính from CECODES; Associate Professor of Political Economy Dr Edmund J. Malesky from Duke University (UNDP international consultant on governance measurement); and Dr Paul Schuler from the University of Arizona (UNDP international consultant on research quality control). Dr Quynh Nguyen of Princeton University contributed to the analysis in Chapter 2 of the conjoint experiment on environmental preferences in new investment projects. In addition, Ms. Trang Anh Do of Duke University provided research support for the creation of the PAPI sub-dimensions.
The team wishes to thank UNDP Viet Nam, in particular Ms Caitlin Wiesen, Resident Representative, Ms. Akiko Fujii, Deputy Resident Representative, and Ms Catherine Phuong, Head of Governance and Participation Team, for their managerial advice throughout the 2018 PAPI implementation cycle.
PAPI surveys have been made possible thanks to diligent guidance from the Viet Nam Fatherland Front (VFF) and proactive VFF collaboration at the provincial to grassroots level. Special thanks also go to the 14,304 Vietnamese citizens who were randomly selected for the face-to-face interviews in 2018. They actively participated in the 2018 PAPI survey by sharing their valuable experiences of interactions with local authorities and their perspectives on governance, public administration performance, and public service delivery in their localities.
PAPI has been guided by the PAPI Advisory Board composed of both national and international members (see the list of board members herein) who have great insights into Vietnamese public policies and practices and knowledge of international standards in the areas of participatory governance and public administration. The advisors have consistently played an instrumental role in making PAPI relevant and accountable to different beneficiaries.
Great appreciation goes to the Ho Chi Minh National Academy of Politics (HCMA), including President Dr Nguyễn Xuân Thắng and other HCMA leaders and senior experts (especially Dr Bùi Phương Đình, Dr Đặng Ánh Tuyết, Dr Lê Văn Chiến and Dr Hà Việt Hùng), for their fruitful collaboration on PAPI action research in an increasing number of provinces, and for their use of PAPI findings in HCMA executive training programmes.
Much appreciation is extended to the National Assembly Library for its support in disseminating annual PAPI reports to National Assembly members in past years. This has helped PAPI findings to be shared and discussed at National Assembly meetings.
VI PAPI 2018THE VIET NAM PROVINCIAL GOVERNANCE AND PUBLIC ADMINISTRATION PERFORMANCE INDEX

For their work to successfully collect PAPI data in 2018 and in previous years, special thanks go to VFF-CRT Director Dr Tạ Văn Sĩ and other senior managers and colleagues, as well as to Mr Nguyễn Ngọc Dinh1, former director of the Department for Democracy and Law, the VFF Central Committee. VFF-CRT has been instrumental in facilitating engagement with 63 provincial VFF committees.
Field controllers played a critical role in the 2018 PAPI survey, including Nguyễn Thị Lan Anh, Tạ Kim Cúc, Đặng Phương Giang, Nguyễn Tuấn Hải, Nguyễn Thu Hiền, Nguyễn Công Hiển, Nguyễn Văn Hiệu, Nguyễn Văn Hùng, Lê Thế Lĩnh, Lê Văn Lư, Đinh Y Ly, Trịnh Thị Trà My, Hà Quang Phúc, Lê Minh Tâm, Vũ Chiến Thắng, Phạm Văn Thịnh, Trần Đình Trọng, Phan Lạc Trung, Nguyễn Hữu Tuyên, Trần Bội Văn, Nguyễn Lê Phương, Nguyễn Văn Thắng, Vũ Quang Điệp and Đặng Quốc Trung. These field controllers all deserve special mention as they ensured the data collection process was fully compliant with the strict PAPI procedures and standards throughout the survey period from 19 July to 6 November 2018 (see Figure D7 for villages the survey teams visited in 2018). Ms. Đỗ Thanh Huyền (UNDP), Dr Phạm Minh Trí and Dr Trần Công Chính (CECODES) conducted ad-hoc spot-checks of field surveys in a select number of provinces.
The tablet-based survey platform would not have been possible without the excellent technical support and services provided by Real-Time Analytics (RTA). Our appreciation in particular goes to RTA Director Dr Lê Đặng Trung and his associates, including Đào Hoàng Bình Thiên, Trần Thị Phượng, Nguyễn Thị Nguyệt, Phan Thị Thanh Trà, Nguyễn Lê Ti Ni, Nguyễn Phương Hà, Nguyễn Lê Diệu Linh and Nguyễn Thị Hồng Linh. The RTA team spent days and nights working to ensure that the 2018 PAPI tablet-based survey worked, the fieldwork monitoring website (https://papi.rta.vn) operated smoothly, real-time data collection functioned, and field support services were available every day.
In addition, thanks must go to the 280 enumerators who were selected from 1,184 university student and graduate applicants across Viet Nam. Without these young and enthusiastic interviewers, the data collection process could not have been completed. Special thanks go to CECODES collaborator Trần Vân Anh for her support in recruiting the enumerators following a rigorous process of enumerator selection and meeting strict PAPI research requirements.
The work of Nguyễn Thị Quỳnh Trang, Phạm Thị Minh Nguyệt and Trần Bội Văn from CECODES is recognized, particularly their pivotal role in facilitating implementation of the fieldwork, providing logistical support, and effectively coordinating with provincial VFF committees during the data collection process. Dr Phạm Minh Trí from CECODES followed up on the design of the 2018 tablet-based questionnaire and collaborated with the RTA team when required.
Mr Stanford Smith, UNDP editor and communication consultant, edited the English version of this report. W. G. Technology Solutions has supported the development of the interactive www.papi.org.vn website. Ms Nguyễn Thùy Dương helped with turning important findings into infographics.
In celebration of the 10th Anniversary of the PAPI initiative, implementing partners are appreciative of PAPI funding partners over the past decade. Special thanks go to the Government of Spain for their funding for PAPI in its initial stage between 2009 and 2010; to the Swiss Agency for Development and Cooperation (SDC) for their generous funding from 2011 to November 2017; to the Department of Foreign Affairs and Trade (DFAT) of Australia for stepping in to fund PAPI from December 2017 to June 2021; to the Embassy of Ireland for their additional funding for the 2018-2021 period; as well as to UNDP in Viet Nam for their funding support since 2009.
www.papi.org.vn VII
1 In memory of Mr. Nguyễn Ngọc Dinh, who passed away on 7 March 2019 after a brave fight against cancer. Mr. Dinh helped negotiate many of the challenges facing PAPI, especially in the initial years of its development, to ensure it became a reality. PAPI exists in part thanks to Mr. Dinh.

Mr Jairo Acuna-Alfaro, Policy Advisor, Responsive and Accountable Institutions Team, Governance and Peacebuilding, Bureau for Policy and Programme Support, United Nations Development Programme in New York
Mr Justin Baguley, Counsellor in Economic and Development Cooperation, Embassy of Australia in Viet Nam
Mr Bùi Đặng Dũng, Vice Chairman, Committee on Finance and Budget, National Assembly, Member of the Kien Giang Provincial National Assembly Delegation
Mr Bùi Phương Đình, Director, Viet Nam Institute for Sociology and Development, Ho Chi Minh National Academy of Politics
Mdm. Cao Thị Hồng Vân, Vice President cum General Secretary, Viet Nam Association for Women Businesspersons
Mr Đinh Xuân Thảo, Former President, Institute of Legislative Studies, National Assembly Steering Committee
Mr Đỗ Duy Thường, Vice Chairman of the Advisory Board on Democracy and Law, Viet Nam Fatherland Front Central Committee
Mdm. Akiko Fujii, Deputy Resident Representative, United Nations Development Programme in Viet Nam
Mr Hồ Ngọc Hải, Vice-chairperson of the Advisory Council for Science, Education and Environment of the Advisory Board, Viet Nam Fatherland Front Central Committee
Ms Hoàng Vân Anh, Director of the Legal Department, Land Administration Agency of Viet Nam, Ministry of Natural Resources and Environment
Mr Hoàng Xuân Hoà, Assistant to Deputy Prime Minister Vương Đình Huệ, Office of the Government
Mr Lê Văn Lân, Former Vice Commissioner, Central Commission of Internal Affairs
Mr Nguyễn Đình Cung, President of the Central Commission for Economic Management
Mr. Nguyễn Hữu Dũng, Standing Vice President, Viet Nam Fatherland Front Central Committee
Mr Nguyễn Sĩ Dũng, Vice President of Vietnam-Japan Friendship Association, Director of the Centre for Commercial Dispute Resolution in Viet Nam
Mdm. Nguyễn Thuý Anh, Former Division Head, Communist Party Magazine, Central Party Committee, Viet Nam Communist Party
Mr Nguyễn Văn Quyền, President of the Viet Nam Lawyers Association
Ms Elisa Cavacece, Deputy Head of Mission/Head of Development (Viet Nam, Lao PDR, Cambodia, Myanmar/Burma), Irish Aid, Embassy of Ireland
Mdm. Phạm Chi Lan, Senior Economist and former Vice President, Viet Nam Chamber of Commerce and Industry
Mr Phạm Duy Nghĩa, Director of the Masters in Public Policy Program, Fulbright University
Mr Phạm Văn Tân, Vice President and General Secretary, Viet Nam Union of Science and Technology
Mr Thang Văn Phúc, (Advisory Board lead), former Vice Minister of Home Affairs, President of the Viet Nam Institute of Development Studies
Ms. Trần Thị Quốc Khánh, Standing Member of the National Assembly’s Committee for Science, Technology and Environment
Note: The list is in alphabetical order by family name.
2018 PAPI NATIONAL ADVISORY BOARD
VIII PAPI 2018THE VIET NAM PROVINCIAL GOVERNANCE AND PUBLIC ADMINISTRATION PERFORMANCE INDEX

www.papi.org.vn
SNAPSHOT OF PAPI FROM 2009-2018PAPI: The Viet Nam Provincial Governance and Public Administration Performance Index
Aims: PAPI aims to generate information that can improve the performance of local governments in meeting their citizens’ needs by: (i) enabling citizens to benchmark their local government’s performance and advocate for improvement; and (ii) promoting self-reflections for improvement, creating constructive competition, and promoting learning among local authorities.
Approach: Citizens are at the heart of Viet Nam’s development. As “end users” of public administration and public services, they are fully capable of assessing the performance of central and local authorities and of supporting establishment of a state “of the people, by the people and for the people.”
Beneficiaries: • Vietnamese citizens• 63 provincial governments (including Provincial Party Committees, People’s Committees, and People’s
Councils) and their district and commune affiliates• Relevant central agencies (the Viet Nam Communist Party, the National Assembly, and the Government
and its ministries) • The media, mass organisations, and civil society organisations • The research community in Viet Nam and abroad• The international community
What PAPI measures:
Eight dimensions, 28 sub-dimensions, more than 120 indicators, and more than 550 substantive questions about Viet Nam’s policy matters covering:
1. Participation at Local levels2. Transparency in Local Decision-making3. Vertical Accountability Towards Citizens4. Control of corruption in the public sector
5. Public Administrative Procedures6. Public Service Delivery7. Environmental Governance8. E-Governance
Method: Face-to-face interviews with citizens Duration: 45-60 minutes per interview on average
Sampling and approach:
International state-of-the-art methodological standards with probability proportional to size (PPS), and random selection; real-time tablet-based interviews (since 2015)
Where: Across all 63 provinces and municipalities in Viet Nam since 2011, covering • 207 districts (including 64 capital districts and PPS-sampled districts)• 414 communes (including district-seated communes and PPS-sampled communes)• 828 villages (including commune-seated villages and PPS-sampled villages)
Who: 117,363 citizens from all demographic backgrounds (since 2009)
• 2018: 14,304 (52.95% women) • 2017: 14,097 (52.6% women)• 2016: 14,063 (54.8% women)• 2015: 13,955 (54.1% women)• 2014: 13,552 (52.9% women)• 2013: 13,892 (52.7% women)• 2012: 13,747 (52.6% women)• 2011: 13,642 (52.9% women)• 2010: 5,568 (30 provinces; 47.5% women)• 2009: 543 (3 provinces; 40.3% women)
Samples representative of all ethnicities in Viet Nam (since 2010)
• 2018: Kinh 84.54%; non-Kinh 15.46%• 2017: Kinh 83.5%; non-Kinh 16.5%• 2016: Kinh 83.7%; non-Kinh 16.3%• 2015: Kinh 83.9%; non-Kinh 16.1%• 2014: Kinh 83.9%; non-Kinh 16.1%• 2013: Kinh 84.6%; non-Kinh 15.4%• 2012: Kinh 84.4%; non-Kinh 15.6%• 2011: Kinh 84.5%; non-Kinh 15.5%• 2010: Kinh 85.0%; non-Kinh 15.0%
Implementing partners:
- United Nations Development Programme (UNDP)- Centre for Community Support and Development Studies (CECODES)- Centre for Research and Training of the Viet Nam Fatherland Front (VFF-CRT)- Real-Time Analytics (RTA)- Ho Chi Minh National Academy of Politics (HCMA) (qualitative action research using PAPI)
Funding partners:
- The Government of Spain (2009-2010)- The Government of Switzerland (2011-2017)- The Government of Australia (2018-2021)- The Government of Ireland (2018-2021)- United Nations Development Programme in Viet Nam (2009-2021)
Information gateway:
Website: www.papi.org.vnTwitter: @PAPI_Vietnam
Facebook: www.facebook.com/papivnYouTube: www.youtube.com/user/PAPIVietNam
IX


EXECUTIVE SUMMARY
This 2018 PAPI report presents findings from the eighth edition of the annual nationwide survey of the Viet Nam Provincial Governance and Public Administration Performance Index (PAPI)—a quantitative measurement tool that offers a comprehensive picture of how the government at the central and local levels have performed on an annual basis. It also marks the 10th year of the PAPI initiative since its introduction in 2009. This report captures experiences and perceptions related to the performance of local governments in governance and public administration in 2018 based on a survey of 14,304 citizens with different demographic characteristics, randomly selected from all 63 provinces. It also sums up the statements of 117,363 citizens who have participated in rigorous face-to-face surveys since 2009 to share their experiences and assessments of the performance by the State apparatus from the central to commune levels.
Over the years, PAPI has provided data and evidence that reflect six core dimensions (areas) of government performance: (i) participation in elections and policymaking at the local level, (ii) transparency in decision-making, (iii) vertical accountability, (iv) control of corruption in the public sector, (v) public administrative procedures, and (vi) public service delivery. The index is revised as needed in response to policy changes and reforms, providing updated reviews of government performance that match citizens’ needs and expectations in these dimensions. As a result, each of the core dimensions was refined in 2018, with some old indicators removed and some new indicators introduced to reflect policy changes.
Furthermore, as Viet Nam develops, new governance challenges have emerged, such as the need for environmental protection and the implementation of e-governance (using information and communication technology for delivering government services). Therefore, from 2018 onwards PAPI includes two new dimensions: (vii) environmental governance, and (viii) e-governance. These two dimensions focus on emerging areas of governance and public administration, and emphasize the participatory nature of governance, one that involves citizens at large (in addition to the State or other providers of public services). This includes citizen participation in every process of decision-making to protect the environment as a public good, and to develop e-government tools for public use.
The 2018 PAPI Report summarizes what national and provincial governments have done to improve their performance in governance and public administration and provides suggestions about how they can better serve their citizens over time. The report also highlights key changes made to the 2018 PAPI to respond to policy reforms at the national government level and concrete actions at the local government level. Provinces can refer to the “Core PAPI”—which refers to the six dimensions that have remained mostly the same since the first national survey in 2011—for progress and results over time, and to the 2018 PAPI for new aspects of governance that citizens provided feedback on in 2018. Below are highlights of the national trends and main findings from the 2018 PAPI Report, as well as implications for policy changes and practical actions
that national and provincial authorities can take to improve performance in governance and public administration.
Overview of Governance and Public Administration Performance in 2018 and from 2011 to 2018
As Viet Nam develops, a wide range of new governance challenges in areas such as environmental protection and e-governance have emerged. Although these new challenges require new solutions, other long-standing issues persist. Anti-corruption efforts, public service delivery, administrative procedures simplification, transparency, and government responsiveness remain as important as ever. In short, governance and public administration challenges in Viet Nam exhibit both continuity and change. These evolving trends create challenges and opportunities for PAPI, which must be flexible and adapt to new conditions. At the same time, to provide insights about improvements over time, the index must provide continuity. The first chapter of the report, therefore, provides information and analysis about both longer-term trends and emerging dimensions of governance.
Continued positive trends in the performance of governments in the third year of the 2016-2021 term. Results for the “Core PAPI” show that there was improvement, although at different rates, in all of these six dimensions in 2018. Three of the dimensions—Participation at Local Levels, Transparency, and Vertical Accountability—showed significant progress, while the other three—Control of Corruption in the Public Sector, Public Administrative Procedures, and Public Service Delivery—exhibited steady improvement.
Coerced participation in local projects decreased. The most significant improvement over time in the Core PAPI dimension of Participation at Local Levels involves decreased use of pressure to force citizens to contribute to local projects either financially, in-kind or with their labour. Findings from the report show that there has been a consistent decrease in the number of citizens reporting that they were forced by local officials to contribute to a project; about 50% of those contributing said they did so voluntarily in 2017 and 2018, up from an average of about 45% prior to
2017. This suggests that citizens have more freedom to decide if they wish to contribute to local projects.
Progress was made in transparency of poverty lists and commune budgets and expenditures, but not in transparency in land use plans. What stands out for the dimension Transparency in Local Decision-making (which includes the three core sub-dimensions of transparency in poverty lists, transparency in commune budgets and expenditures, and transparency in land use plans and price frames) is that there was a higher level of citizen satisfaction with transparency in how poverty lists were formulated in 2018, and in transparency of commune budgets and expenditures. However, transparency in land use plans remains an important issue for local governments to improve. One critical issue pertaining to transparency in land use plans is that over time, less than one-fourth of the population was able to access information about local land use plans and less than one-third had opportunities to provide comments.
There were more direct interactions between citizens and local government officials. The third dimension, Vertical Accountability, underwent the most change in 2018. Only one sub-dimension—Interaction with Local Authorities—remains constant. Findings from this sub-dimension shows that more citizens reported that they had interactions with village leaders and commune officials in 2018 than in 2017.
There was less corruption in the provision of health care and education services, but levels of bribery remain constant in state employment, use of public funds, and land titling. Key findings from the Control of Corruption in the Public Sector dimension, which remains constant over time, show that citizens were less likely to observe corruption in provision of health care and education services, and in hiring for local government positions. The data also indicate that the percentage of respondents agreeing or somewhat agreeing with the statement that they had to pay a bribe in 2018 for state employment, public health care services, primary education, or construction permits maintained its decline since 2017. However, concerns about bribery for land use rights certificates (LURCs) and public officials’ diversion of public funds remained constant over the two years.
XII PAPI 2018THE VIET NAM PROVINCIAL GOVERNANCE AND PUBLIC ADMINISTRATION PERFORMANCE INDEX

Citizens perceived a greater decrease in corruption at the commune level than at higher levels of government. While citizens across all groups of citizens were more likely to say that corruption had decreased than increased, there are large differences by administrative level. While nearly 60 percent of citizens said that corruption at the commune level had decreased in the past three years, the proportion dropped to less than 50 percent when citizens responded to the same question about corruption at the national level. Also, corruption emerged as one of the top three issues of greatest concern in 2018.
Noticeable improvements were made to land titling services. Quality of services related to Public Administrative Procedures is another dimension that PAPI has tracked since 2011. Findings from this dimension reflect slight improvements in 2018, particularly regarding the administrative services for LURCs. This, combined with some improvement in land transparency, suggests that while much work remains to be done to enhance land governance performance, noticeable gains have been made.
Performance improved in provision of basic public services, except for primary education. The sixth core PAPI dimension—Public Service Delivery—reveals a significant divergence between different basic services. The Public Health sub-dimension, for example, saw continued improvement in 2018, largely thanks to the increased number of respondents accessing health insurance; the rate rose from 80 percent in 2017 to 87 percent in 2018. Scores in the Basic Infrastructure sub-dimension, which includes garbage collection, road quality, electrification, and drinking water quality, also improved dramatically in 2018. Compared to the other public services, public primary education saw some decline, which was mainly due to lower satisfaction with the quality of primary schools and of primary education.
More citizens were concerned about water quality than air quality, with citizens showing strong support overall for environmental protection. Concrete findings from the new Environmental Governance dimension suggest that more citizens were concerned about water quality than air quality in 2018 compared to prior years. More than half of the respondents said water quality had worsened in the past three years, while about 36 percent said air quality had declined over the
same period. Also, the percentage of respondents preferring environmental protection to economic development at all costs increased from 69 percent in 2016 to 74 percent in 2018.
A large gap remains between the number of citizens using the Internet and those accessing e-government portals. Findings from the new E-Governance dimension show that the percentage of respondents who access news on the Internet surged from 28 percent in 2017 to 38 percent in 2018. Fifty-three percent of respondents said they had Internet access at home, an increase of more than 15 percent from 2017. However, the percentages of respondents using government e-portals for administrative procedures and services remained extremely low, ranging from about 1 percent (for construction permit procedures) to 4 percent (for certification procedures), although some increase could be seen from the 2017 figures.
Overall, despite progress in some areas, significant room for improvement remains. As findings from the six Core PAPI dimensions show, governance and public administration performance in 2018 improved across a wide range of aspects, while challenges remain in important areas such as voluntary participation, land transparency, corruption in state employment, land use rights certification and public primary education. Similarly, findings from the new dimensions of Environmental Governance and E-Governance show that there are opportunities for increased efforts in these areas. Because air, water and environmental pollutants are both endogenous and heterogeneous in nature, provincial governments can partner with neighbouring provinces to find common solutions besides simply implementing local measures to prevent environmental pollution in their provinces. Lastly, the more citizens receive access to the Internet, the higher their expectations are for strengthened e-governance and better access to online facilities for administrative procedures to reduce transaction costs, including informal costs.
Issues of Greatest Concern in 2018 from the Perspective of Citizens
The second chapter provides findings about issues of great importance for Vietnamese citizens and the Government. While noting that the sharpest increases in 2018 compared to previous years were
EXECUTIVE SUMMARY XIII

in concerns about corruption, economic growth, law and order, and education, Chapter 2 focuses on analysing economic inequality, environmental trade-offs and gender equality—to better understand citizens’ expectations for the State in these areas.
Poverty was the greatest concern in 2018. While Viet Nam’s economic growth rate in 2018 was reported to reach 7 percent, respondents continued to cite poverty as the top matter requiring additional efforts by the State. Poverty ranked first in the list of issues of greatest concern for the fourth year in a row (since 2015). Fears about falling back into poverty and concerns about the impact of poverty on overall national development were still the main reasons given for the continued importance of poverty reduction. Deeper analysis shows that income inequality was a key economic driver for poverty concerns. In terms of solutions, wealthier respondents are more likely to support paying taxes for redistribution of resources to poorer provinces.
Strong preference for environmental protection, “clean” investors and greener energy. In-depth analysis in this report shows that negative environmental impacts have a consistent effect on respondents’ preferences for environmental protection across different societal groups. In general, Vietnamese citizens said they were willing to contribute to improved environmental conditions. Citizens also prefer environmentally “clean” investors over those that contribute comparatively more to job growth and local tax revenues but less to protecting the environment. In terms of willingness to pay for greener energy, reduced local air pollution and the ability to improve power generation were more important factors in citizens’ support than mitigating climate change. Overall, the findings in this area suggest that environmental issues are critically important for Vietnamese citizens of all types.
No strong preference regarding which gender should be in leadership roles, although some, especially women, showed biases towards men. As gender equality is a high priority in Viet Nam’s sustainable development agenda, the 2018 report examines public views regarding gender and leadership positions. Findings from the research show that a majority of voters have no preference for either male or female candidates. Among the minority who do have a preference, more are likely to prefer
men than women. This bias is most pronounced for political leadership positions, and, interestingly, is most pronounced among women.
Implications. Chapter 2 has important but nuanced policy implications for Viet Nam: poverty reduction, environmental protection and gender equality are important priorities within the agenda of continued support for high economic growth. Therefore, as the Government continues searching for solutions to poverty reduction and for higher economic growth, it should consider the types of policy options citizens would support.
Despite rapid declines in poverty and improvements in economic conditions, many Vietnamese—particularly those in lower income strata—remain concerned about poverty and the environment. As the government continues searching for solutions to poverty reduction and for higher economic growth, they should consider the types of policy options citizens would support. The option of taxation for redistribution to poorer areas tends to receive a high level of support among the wealthier and more educated respondents. With 90 percent of the population earning less than 20 million Viet Nam dong (VND) (equivalent to 862 US dollars (USD) per person per month, and a much smaller group of wealthier people, policy on tax-based redistribution should be well articulated and well designed so as to not to upset low-income earners.
Findings on environmental trade-offs also hint at the need for continued difficult juggling acts by the Government: citizens consistently prioritize environmental protection, even at the expense of economic growth. The desire for a secure power supply amidst the quest for cleaner energy to replace coal power plants poses another development challenge. This suggests that any decision-making processes for new investment projects and energy development need to incorporate deliberative consultation with the public to ensure that citizens’ opinions regarding the trade-offs are fully and openly considered, and to avoid potential conflicts when the projects are carried out.
On the issue of gender equality, while some progress has been made toward equal rights to LURCs, much work remains to increase equal opportunities for both women and men in leadership positions. While the 2018 data show that a majority of citizens do not
XIV PAPI 2018THE VIET NAM PROVINCIAL GOVERNANCE AND PUBLIC ADMINISTRATION PERFORMANCE INDEX

EXECUTIVE SUMMARY
have a gender preference when electing candidates to political leadership positions, a substantial minority express a preference for male candidates, and the greatest bias appears to be among female rather than male respondents. These findings highlight a great opportunity for more women to be elected to political positions, while also suggesting that more work needs to be done to end societal stigma against women, especially among female voters.
Provincial Performance in 2018
Overview of Provincial Performance in 2018
The third chapter analyses provincial performance in eight dimensions of governance and public administration. Of the eight dimensions, the six conventional (core) ones are Participation at Local Levels, Transparency in Local Decision-making, Vertical Accountability, Control of Corruption in the Public Sector, Public Administrative Procedures, and Public Service Delivery, and two new dimensions are Environmental Governance and E-Governance.
It is worth noting that major changes to the 2018 PAPI include three new sub-dimensions and several new indicators added to the composition of the index. Access to Information is a new sub-dimension in Dimension 2: Transparency in Local Decision-making. It provides baseline indicators to gauge the enforcement of the 2016 Law on Access to Information, which became officially effective from 1 July 2018. Another new sub-dimension is Local Governments’ Response to Citizens’ Appeals, part of Dimension 3: Vertical Accountability. This sub-dimension aims to measure the performance of local governments in responding to citizens when they express concerns about local government-related affairs. Access to Justice Services is also a new sub-dimension in Dimension 3. It provides baseline indicators to measure the performance of judicial services at the local level. Lastly, a few minor additions and removals were made to the composition of Dimension 1 on Participation at Local Levels, Dimension 4 on Control of Corruption in the Public Sector, and Dimension 6 on Public Service Delivery. As a result, comparison over time from 2016 to 2018—the first three years of the 2016-2021 Government term—is encouraged only for the indicators that were kept intact.
Findings from the 2018 PAPI survey presented in Chapter 3 indicate that provincial governments need to do a lot more to satisfy their citizens’ expectations. There remains a significant disparity between the highest aggregated provincial score of 47.05 points and the potential maximum aggregated score of 80 points (on the scale of 10-80 points for all eight dimensions). This gap suggests that opportunities exist for further reforms and better implementation of policy by local governments as they strive to be more open, transparent, accountable, and responsive, and to act with integrity.
Dimensional results also show that each province has its own strengths and weaknesses; none of the 63 provinces excelled in all eight dimensions. For instance, Lang Son and Bac Giang were in the best performing groups in six out of the eight dimensions. Still, Bac Giang remained in the low-average performing group for the Vertical Accountability dimension. This suggests that no solution is best all provinces; local governments need to review each indicator to understand where they have performed well and where they need to improve, and then identify relevant solutions for each policy area included in PAPI.
Interestingly, regional patterns have been consistent over time in some dimensions, despite the changes made to the index in 2018. Northern provinces tend to do better in the areas of Participation at Local Levels, Transparency in Local Decision-making, and Vertical Accountability compared to southern provinces. On the contrary, more southern provinces perform better in the dimension Control of Corruption in the Public Sector. However, in the two new dimensions, northern provinces tended to perform better in E-Governance but do more poorly in Environmental Governance than their southern peers. Regional differences may suggest areas of focus for government agencies in charge of regional development, such as encouraging provinces within each region to focus on weak areas and/or to exchange information or experiences with provinces in other regions.
Highlights of Provincial Performance by Dimension, 2018
Citizen Participation at Local Levels. Overall, scores for participation at local levels remained at the average level in 2018, as in previous years. Provincial
XV

XVI PAPI 2018THE VIET NAM PROVINCIAL GOVERNANCE AND PUBLIC ADMINISTRATION PERFORMANCE INDEX
performance scores fall within a relatively narrow range, with the difference between the highest (6.16 points) and lowest (4.41 points) dimensional scores only 1.75 points. This implies that all provinces performed at the average level in engaging citizens in local government affairs. Northeastern and North Central provinces tend to perform better in enabling citizen participation at local levels than southern provinces.
Thai Binh was the best performer and Khanh Hoa the poorest in engaging citizens at the local level, based on the aggregated dimensional score. At the sub-dimensional level, Thai Binh was in the best performing group in all four sub-dimensions (i.e., Civic Knowledge, Participation Opportunities, Quality of Local Elections, and Voluntary Contribution).
Transparency in Local Decision-making. Overall, scores for this dimension were in the average range in 2018, with the provincial scores ranging from 4.55 to 6 points. There is only a small gap between the best performing and the worst performing provinces, implying that all provinces performed fairly similarly in transparency in local decision-making. The aggregate sub-dimensional score for the new Access to Information sub-dimension was only 0.81 points on the scale from 0.25 to 2.5 points, and as a result it contributed the least to the overall dimensional score. Data for this sub-dimension reveals interesting findings: very few respondents across all provinces said they searched for information about state policies (14 percent), while nearly 12 percent indicated they obtained what they looked for, and of those, only 12.5 percent found the information useful. Almost no respondents in Ha Giang found the information they obtained useful, while this proportion in Thai Nguyen was 27.5 percent.
Another low-scoring sub-dimension is Land Use Plans and Price Frames; the aggregate score was only 1.34 points. At the dimensional level, Thai Nguyen was the best performer. At the sub-dimensional level, Da Nang did best in the Access to Information sub-dimension, Nam Dinh in the Poverty List Transparency sub-dimension, Lang Son in the Commune Budgets and Expenditures’ sub-dimension, and Thai Binh in the Land Use Plan and Price Frames Transparency sub-dimension.
Vertical Accountability Towards Citizens. Overall, Vertical Accountability dimensional scores remained at a low-average level in 2018, with provincial scores ranging from
4.31 to 5.6 points on the 1 to 10-point scale. The range between the best performing and the worst performing provinces is small, implying that provinces across the country performed similarly in vertical accountability. Northern provinces tend to perform better in this dimension than southern provinces, with 10 out 16 of best performers from the North.
At the dimensional level, Thai Nguyen was the best performer. It was also the best performer in the sub-dimension Access to Justice Services. For this new sub-dimension, the proportion of citizens saying they would use local courts for resolving civil disputes ranged from 77 percent (in Ho Chi Minh City) to 96 percent (in Hai Duong). Meanwhile, only about 4 percent said they would use non-court mechanisms, and more respondents in Quang Nam (10.5 percent) said they would opt for non-court solutions than elsewhere. In the Local Governments’ Response to Citizens’ Appeals sub-dimension, Ha Tinh and Quang Binh were the best performers, while their Central region peers, Thua Thien-Hue and Khanh Hoa, were the poorest performers.
Control of Corruption in the Public Sector. Overall, Control of Corruption in the Public Sector dimensional scores were at the above-average level in 2018, with provincial scores ranging from 5.52 to 7.61 points on the scale of 1 to 10. There is a large gap between the best performing and worst performing provinces, implying that provinces across the country performed at varying levels in controlling corruption in the public sector. Regional patterns in this dimension have been consistent over time; southern provinces tend to perform better than northern ones, with 10 of the 16 best performers in the South.
At the sub-dimensional level, Ben Tre, Vinh Long and Tay Ninh, all southern provinces, performed well in all four sub-dimensions. In particular, Ben Tre was the top performer in limits on corruption in public service delivery and willingness to fight corruption.
Public Administrative Procedures. Overall, dimensional scores in this area were at the high-average level in 2018, with the provincial scores ranging from 6.9 to 7.95 points on the scale of 1 to 10. The gap between provinces in this dimension is also narrow, implying that provinces across the country performed equally well in provision of public administrative procedures. Consistent improvement over time is evident for all four public administrative services, especially in land procedures,

EXECUTIVE SUMMARY XVII
though this area remained the weakest service in 2018 and over time. There are no clear regional patterns in this dimension, unlike in the first four dimensions, with the best performers more evenly distributed across the country.
At the sub-dimensional level, the gaps between the highest provincial scores and the maximum possible score of 2.5 points were narrower than they are in previous dimensions. Lang Son was the top performer in Government Certification Services with 2.04 points; Quang Ninh was the top performer in the Construction Permits and Land Procedures sub-dimensions, with scores of 2.01 and 1.98 points, respectively; and Tra Vinh was the top performer in Commune-Level Administrative Services for Personal Procedures.
Public Service Delivery. Overall, Public Service Delivery dimensional scores were at the high-average level, with the provincial scores ranging from 6.58 to 7.68 points on the 1 to 10-point scale. The gap between provinces in this dimension is also narrow, implying that provinces across the country performed equally well in provision of public services in primary education, health care, basic infrastructure, and law and order. In particular, there has been consistent improvement in public health care since 2016, reflected in better provincial scores in almost every indicator of this sub-dimension.
Results for some indicators of provincial performance in quality of public services are worth highlighting. For total quality of public district hospitals, Vinh Long scored highest at 7.85 points on the 1 to 10-point scale. On total quality of primary schools, Bac Ninh scored highest at 6.25 points, about double the score for Dak Lak on the same indicator. On victims of crime, Quang Binh, Binh Thuan and Binh Duong tend to be the most problematic provinces.
Environmental Governance. Overall, Environmental Governance dimensional scores were well below the average level in 2018, with provincial scores ranging from 3.54 to 6.74 points on the 1 to 10-point scale. The gap between provinces in this dimension is large, implying that citizens in different provinces enjoy quite varied environmental quality. Citizens in the Mekong Delta region and mountainous areas in the North tend to rate air and water quality better, and firms’ seriousness with regards to environmental protection higher, than in other regions. The three centrally
governed municipalities of Hai Phong, Ho Chi Minh City and Ha Noi were in the poorest performing group for all sub-dimensions. So were Central Highlands provinces and industrial provinces like Binh Duong, Dong Nai, Vinh Phuc and Thai Nguyen.
At the sub-dimensional level, there were large differences between the highest and lowest scoring provinces, and also a significant gap between the scores of the best performing provinces and the maximum possible scores of 3.33 points for each sub-dimension. For instance, in the Quality of Water sub-dimension, Dong Thap received 1.83 points while Bac Ninh only received 0.34 points.
E-Governance. Overall, the E-Governance dimensional score was at a very low level, with the provincial scores ranging from 1.93 to 4.24 points on the scale of 1 to 10. The gap between provinces in this dimension is also narrow. This implies that e-governance remains a huge challenge, but also, therefore, represents an opportunity for provinces and users alike to improve implementation of e-governance policy. Regional patterns in this dimension are clear: better performing provinces were mostly in the North, with the geographic concentration greatest in the Access to E-government Portals sub-dimension.
At the sub-dimensional level, the gaps between the highest and lowest provincial scores were narrow, implying that provinces do not differ much in their performance. Among the five centrally governed municipalities, Da Nang and Ho Chi Minh City were the better performers. Da Nang scored the highest in both sub-dimensions, although the scores were very low at 0.77 points in the Access to Government Portals sub-dimension, and 3.47 points in the Access to the Internet sub-dimension.
Implications
Local governments should pay attention to each of the PAPI indicators when seeking ways to respond to citizens’ rising expectations. As shown in this report, citizens desire: more opportunities for increased participation in local decision-making; enhanced transparency and accountability; continued efforts to control corruption in the public sector; greater attention paid to managing the environment (the most problematic issue); and improved e-governance so that governments and citizens can interact virtually

XVIII PAPI 2018THE VIET NAM PROVINCIAL GOVERNANCE AND PUBLIC ADMINISTRATION PERFORMANCE INDEX
to obtain basic information about public policy and public services.
Achieving all this requires both holistic and context-based policies and practical measures to help local governments in responding to citizens’ desires for more participatory and inclusive governance. These measures may include, among others, regular and ad-hoc monitoring of local governments’ performance (by both government and non-government entities), openness and responsiveness to feedback from citizens, and deliberative participatory processes to engage citizens in decision-making and policy implementation. Open government at all levels may be the next reform endeavour to meet the rising demand from Vietnamese citizens.
At the national level, State and government agencies at the central level should also consider what citizens are most concerned about (in addition to paying attention to specific citizen expectations for local government actions, which can inform central-level policy responses). As this report shows, while citizens are very optimistic about the economic situation of the country and their own households, they are (somewhat paradoxically) most concerned about poverty reduction, economic growth, corruption and the environment—all of which call for attention and action by the State.
Delving into the reasons for these views, there are several key conclusions that can be drawn based on the 2018 PAPI survey responses: citizens are concerned about rising income inequality, about embedded gender disparity within the State apparatus (a majority of citizens support both men and women filling positions of political power), and about systemic large-scale corruption and petty corruption as experienced by citizens. They also have a strong preference for environmental protection and
“clean” investment (as opposed to economic growth at all costs). The desire for greater participatory, transparent, accountable, clean, responsive, and environmentally friendly public institutions and policies is clear from citizens’ feedback. In this context, PAPI acts as a rigorous and objective “open platform,” enabling citizens to benchmark their governments’ performance and advocate for improvement while creating constructive competition and promoting learning among local authorities in different aspects of governance and public administration. With the time series data, the PAPI partners have produced the annual reports providing multidimensional and comparative perspectives for central and local governments to review their performance at both the comprehensive and sector-specific levels.
The PAPI findings have contributed to a variety of impacts over the years, and greater impacts are expected in the future. All 63 provinces have hosted local PAPI diagnostic workshops, and 59 of them have issued action plans, directives, official letters or resolutions to request that local government agencies respond to the citizen feedback generated by PAPI. In 2018 alone, at least 38 provinces issued new or renewed provincial responses with a one-year or three-year perspective, aiming at attaining higher citizen satisfaction with their performance. PAPI serves as a means of verification for better governance and public administration at the local level and also informs the policy cycle at the central level in Viet Nam. The data also provide necessary baselines for Viet Nam to review the implementation of the national 2011-2020 Socio-Economic Development Strategy and the Sustainable Development Goals towards 2030 and to plan for the 2021-2030 Socio-Economic Development Strategy.

?


What is PAPI?
The Viet Nam Provincial Governance and Public Administration Performance Index (PAPI) is the country’s largest annual citizen-centric, nationwide policy monitoring tool. Over the years PAPI has collected the views of 117,363 randomly selected citizens about the country’s performance in governance and public administration in various sectors, based on their direct interactions with local governments. In 2018 alone, 14,304 respondents shared their reflections based on interactions with public authorities over the prior year.
PAPI generates information about the actual performance of local authorities in meeting the expanding needs and expectations of citizens. By doing so, PAPI promotes self-reflection for improvement, creates constructive competition, and promotes learning among local authorities. In addition, PAPI acts as a rigorous and objective “open platform” that allows citizens to benchmark their local government’s performance and advocate for improvements in different aspects of governance and public administration; aspects that are evolving as Viet Nam further develops economically and socially. PAPI also contributes to expectations that the governments at all levels will be more open and responsive to the feedback and expectations of citizens.
What Does PAPI Measure? PAPI is a quantitative measurement tool that offers a comprehensive picture of how central and provincial governments have performed on an annual basis. Over the years, PAPI has provided data and evidence that reflect six key dimensions of government performance in an evolving manner: (i) participation in elections and policymaking at the local level, (ii) transparency in decision-making, (iii) vertical accountability, (iv) control of corruption in the public sector, (v) public administrative procedures, and (vi) public service delivery. The index is revised in response to policy changes and reforms in order to provide up-to-date reviews and analysis of government performance and to “catch up” with society’s needs and expectations in these areas. As a result, each of the dimensions was refined in 2018, with some old indicators removed and some new indicators added to reflect changes in policy and citizens’ expectations.
As Viet Nam develops, a wide range of new governance challenges and opportunities, such as environmental degradation and leveraging technology for e-governance, have emerged. Therefore, from 2018 PAPI includes the two additional dimensions of (vii)
INTRODUCTION

2 PAPI 2018THE VIET NAM PROVINCIAL GOVERNANCE AND PUBLIC ADMINISTRATION PERFORMANCE INDEX
Environmental Governance,2 and (viii) E-Governance.3 These two evolving dimensions emphasize the participatory nature of governance that involves citizens at large (in addition to State/public service providers) in every process of decision-making to protect the environment as a source of public goods, and to develop e-government tools for public use.
PAPI is intended to serve as a means of verification for better governance and public administration at the local level, while also informing the policy cycle for the central level in Viet Nam. Ultimately, PAPI aims to assist different stakeholders to understand how governance and public administration performance changes over time at different levels, and suggests ways to address remaining bottlenecks and challenges that affect the sustainable development of Viet Nam.
What are the Key Outputs of PAPI?
PAPI has contributed to large and increasing impacts, and this has inspired the continuation of this important project. To date, every province has hosted or convened a PAPI diagnostic workshop. Of the nation’s 63 provinces, 59 have issued action plans, directives, official letters and/or resolutions to request that local government agencies respond to citizen feedback obtained through PAPI (see Appendix A). The latest to do this were Kiên Giang, Hải Phòng, Tuyên Quang, Tiền Giang, Hòa Bình, Hà Nam, Điện Biên, Hưng Yên and Nam Định. In 2018 alone, 38 of these 59 provinces issued new or renewed provincial responses to PAPI findings with a one- or three-year perspective, aiming at attain higher citizen satisfaction with their performance. Four provinces—Cao Bằng, Long An, Sóc Trăng and Tây Ninh—have not issued action plans but have convened discussions and given direction to government agencies at the grassroots level to improve their performance. In some provinces,
2 See Asia-Pacific Institute of Management and United Nations Development Programme (2018) for insights into the importance of participatory environmental governance in settlement of environmental disputes in Viet Nam.
3 In the United Nation’s E-Government Index 2018 (United Nations Department for Economic and Social Affairs, 2018), Viet Nam was 88th in the E-Government rankings. One of the factors that makes up this index is the e-participation rate, which takes into consideration the availability of online information, online public consultation, and online involvement of citizens in decision processes. Viet Nam was grouped in the second quartile, or the “High-EPI” performing group.
localization of PAPI tools is taking place. For instance, Quảng Ninh Province has developed a district-level PAPI monitoring tool to measure the whole province. Đồng Nai has followed up on PAPI findings with a local initiative to measure users’ satisfaction with public administrative services, using the PAPI approach to use of real-time surveys (see Box 1). These are some examples of how PAPI has served as a means of verification for better governance and public administration at the local level, while also informing the policy cycle for the central level in Viet Nam.
The PAPI reports and data have been used extensively by government agencies, development partners, civil society organisations, the media and researchers. The 2017 PAPI Report national launch attracted more than 600 participants from government and donor agencies, non-governmental organisations and the media, including representatives from 59 out of 63 provinces. Over the year, PAPI findings and data have been cited as evidence by ministers of key ministries/agencies like the Government Inspectorate, the Ministry of Natural Resources and Environment,4 and the Ministry of Health,5 as well as by National Assembly delegates in different query sessions.6 More importantly, PAPI has been mentioned by high-level officials from the Communist Party of Viet Nam, Government of Viet Nam, and National Assembly. For instance, Prime Minister Nguyễn Xuân Phúc, during his missions to different provinces and cities (including Ha Noi, Soc Trang, Ninh Binh, Phu Yen, Thua Thien-Hue, Bac Ninh, Thanh Hoa, and Hau Giang), requested that the provincial governments maintain and/or improve their performance, and thus achieve higher PAPI scores. In addition, the National Assembly Library has been sharing PAPI reports with parliament members over the past several years to bring PAPI findings to the table for discussions related to the May
4 See MONRE’s focus for 2018 as presented in the minister’s statement (available at https://bnews.vn/bo-truong-tran-hong-ha-trong-tam-2018-la-doi-moi-hoan-thien-chinh-sach-phap-luat/76461.html) and in the ministry’s half-year review (available at http://moitruongachau.com/vn/bo-tai-nguyen-va-moi-truong-trien-khai-nhiem-vu-6-thang-cuoi-nam-2018.html).
5 Minister of Health Nguyen Thi Kim Tien referred to PAPI findings in her testimony on the quality of health insurance and health services at the National Assembly Committee for Social Affairs.
6 For instance, National Delegate Nguyen Thanh Hai quoted PAPI findings as evidence for some progress made in anti-corruption in 2017 at the National Assembly Standing Committee meeting on 15 May 2018.

INTRODUCTION
new applications will add to the effects of PAPI on prospective central policymakers and provincial leaders before the 2021 national election.
In addition, PAPI has provided data on how Viet Nam has done in implementing the 2030 Agenda for the Sustainable Development Goals (through indicators that PAPI measures), not only for reporting by the UN but also for the Government’s report to the UN.7 Recently, PAPI was highlighted by the World Bank as a tool to assess how citizens view access to information in Viet Nam,8 and at the International Conference on Sustainability and Development 2018 at the University of Michigan in the United States.9
7 See Viet Nam’s Voluntary National Review on the Implementation of the Sustainable Development Goals, 2018, and Government of Viet Nam (2018).
8 See James Anderson (28 September 2018).
9 See https://umsustdev.org/wp-content/uploads/2018/11/SDC-Program-Final.pdf
3
2018 National Assembly session. Also, the media, mass organisations and non-governmental organisations have used the wealth of PAPI data to demand more accountability from the government, and to inform their development and business strategies.
Additionally, the Ho Chi Minh National Academy of Politics (HCMA) have been proactively using PAPI in its public policy trainings for public officials at the national and provincial levels. A PAPI module has been added to HCMA high-level trainings focused on preparing public officials for the 2021-2016 Administration (scheduled to start from 2019), and a PAPI methodology curriculum has been introduced into its regular research methodology training. These
Box 1: Timeline of Dong Nai’s Responses to PAPI Findings
2010 – 2013 PAPI not mentioned in any public communication of the province
20 March 2014 Report capturing Provincial Competitiveness Index (PCI) and PAPI findings submitted to the Chairperson of the Provincial People’s Committee by the Department of Home Affairs to call for actions in response to poor performance as reported by citizens in the province.
26 May 2016 Provincial leaders met to discuss ways to improve performance, thus gaining higher PAPI, PCI and Public Administration Reform (PAR) Index scores.
13 July 2017 Dong Nai convened the first ever PAPI diagnostic workshop, with UNDP providing analysis of 2016 PAPI findings for the province and HCMA sharing experiences of other provinces. During this period, Dong Nai was calling for innovative ideas from businesses and the public on how to further reform administrative procedures.
24 July 2017 The Dong Nai Provincial People’s Committee issued Directive No. 7213/UB-HC on implementation of measures to improve provincial and public administration performance, in order to achieve higher PAPI scores. Provincial and district agencies followed up with their sectoral and local action plans to roll out the measures. See the action plan by the Department of Science and Technology, dated 15 August 2017, as an example.
6 August 2017 Dong Nai convened its advisory meeting to hear from UNDP and HCMA on how to improve their performance from commune to provincial levels. At the meeting, Dong Nai provincial leaders requested heads of agencies in the province to hear and act upon citizen feedback to improve their performance.
4 April 2018 Dong Nai provincial leaders attended the launch of the 2017 PAPI Report and reported immediately to citizens about how the province performed in 2017 via the province’s own public administration reform website.
17 September 2018 Dong Nai Province launched its first-ever real-time surveys to obtain citizen feedback, based on the PAPI model. The surveys, which asked about the quality and performance of one-stop shops from provincial to commune level, were developed with substantive advice from UNDP and assistance from Real-Time Analytics, a PAPI partner.
September – December 2018
Dong Nai kept track of the findings from its real-time survey tool, and informed the public about how the PAPI-like survey on one-stop shop performance works.
28 December 2018 Dong Nai launched the 2018 Report No. 14443/BC-UBND on Citizens’ Satisfaction with Administrative Services from Provincial to Commune Levels.

4 PAPI 2018THE VIET NAM PROVINCIAL GOVERNANCE AND PUBLIC ADMINISTRATION PERFORMANCE INDEX
What Informs PAPI and the 2018 PAPI Report?
As observed in the 2017 PAPI Report, data-driven policymaking continues to develop in Viet Nam. Feedback from businesses and citizens has gained much greater attention from the State and government agencies at the central and local levels.10 More importantly, the State and central government agencies have responded better to non-government sources of governance data. The impact of the two largest annual nationwide surveys—PAPI by UNDP and its implementing partners, and the Provincial Competitiveness Index (PCI) by the Viet Nam Chamber of Commerce and Industry (VCCI)11—is increasing.
The core principal of using external tools to provide data and evidence for assessment of the performance of State and public agencies has been officially recognised in important national policies and reports. In the Conclusions of the Viet Nam Communist Party Committee’s National Congress in October 2017,12 independent monitoring was emphasized as a mechanism to review the performance of public service providers, in addition to the emphasis on strengthening transparency and vertical accountability of authorities. This shows that evidence-based policymaking and efforts to improve performance through mechanisms to collect and reference feedback from citizens and businesses have been placed at the core of Viet Nam’s efforts to attain better governance and improve the Government’s performance. In addition, PAPI and PCI have been recognized by the Government of Viet Nam as sources of evidence to monitor Viet Nam’s progress in implementation of the Sustainable Development
10 A number of large and small-scale businesses and citizen satisfaction surveys have been conducted since the mid-2000s in a few provinces (e.g., Ho Chi Minh City, Da Nang) with support from international donors. Since 2014, more monitoring and evaluation tools have emerged at the central level. The Public Administration Performance Index (PAR-Index) was initiated by the Ministry of Home Affairs in 2014, the Provincial Anti-corruption Assessment Index (PACA) was initiated by the Government Inspectorate in 2016, and the Patient Satisfaction Survey was launched for the first time in 2018 by the Ministry of Health. Some provinces (e.g., Quang Tri, Quang Binh, Đồng Nai) started assessing public service quality through mobile telephone-based citizen feedback mechanisms (e.g., the M-Scores tools).
11 See PCI reports at http://eng.pcivietnam.org/.
12 See Voice of Viet Nam (11 October 2017).
Goals, especially Goal 16 to “promote a peaceful, fair, just, equitable, and equal society for sustainable development, provide access to justice for all and build effective, accountable, and inclusive institutions at all levels.”13
Furthermore, 2018 is the third year of the current Government term (2016-2021), a period that has seen important institutional shifts in response to continued internal Government rearrangements and ad-hoc changes in the leadership. Resolution No. 19-TW of the XII Central Communist Party Committee’ Plenum in October 2017 calls for continued reforms to the personnel of State agencies and to the organisational system to make them leaner, more effective and self-sustaining.14 In the last quarter of 2018 there was an ad-hoc change to the position of the President: the General Secretary would take on the role from October 2018, following the eulogy to the late President in September. Public speculation about the recentralisation of power was widespread, to the point that the General Secretary had to make a statement indicating that the dual role was “situational.”15 These developments may have had an impact on citizens’ responses to the 2018 PAPI survey.
In addition, access to information as a right has been strengthened thanks to the issuance of the 2016 Law on Access to Information, which came into effect on 1 July 2018. The law mandates that public agencies and public institutions disclose information that are not state secrets. It sets the foundation for a systematic approach to transparency, vertical accountability and access to information in Viet Nam. This law informed development of the new sub-dimension on access to information (in Dimension 2: Transparency in Local Decision-making) first used in 2018, and the findings on this sub-dimension are expected to create baselines for monitoring the law’s implementation over time.
The year 2018 also witnessed scaled-up efforts—in policy and practice—to combat grand corruption at the national level, as well as calls for controlling petty corruption in everyday operations of the public sector.
13 See the Government of Viet Nam (2018), p. 80.
14 See the full text of Resolution No. 49-TW on the Ministry of Home Affairs website (accessed 21 December 2018).
15 See Voice of Viet Nam (8 October 2018).

INTRODUCTION 5
Trials of influential high-level public officials involved in major corruption cases were widely covered by the media in 2018. The National Steering Committee on Anti-corruption reached the conclusion in 2018 that efforts to curb petty corruption at local and grassroots levels must go hand-in-hand with those targeting grand corruption at the central level.16 In addition, discussions and conclusions regarding the amendments to the 2005 Law on Anti-corruption, which were approved by the National Assembly on 20 October 2018 (new provisions to the law will be effective from July 2019), were widely covered in the media. These may have shaped public awareness about high-level political will to address the systemic corruption problems facing both the public and private sectors in Viet Nam.
Another important governance matter that has constituted one of PAPI’s sub-dimensions is the accessibility and quality of justice services provided at the local level. This is a continuation of the 2015 Viet Nam Justice Index17 that UNDP, the Viet Nam Lawyers Association and other national partners developed in 2012 and conducted nationwide in 2014. The addition to PAPI of this new sub-dimension is expected to provide inputs for the review of the implementation of Resolution No. 49-NQ/TW on the National Strategy on Judicial Reforms in Viet Nam by 2020.18 It will also provide information for the central and local governments on how judicial services work in their provinces from a citizens’ perspective.
In addition, the 2018 PAPI includes the new E-Governance dimension. The development of e-governance has been recently confirmed as a national development priority in Viet Nam following 10 years of determination by the Government to invest in and develop information and technology to enable the operation of State agencies, as described in Decree No. 102/2009/ND-CP.19 E-governance is
16 See Lao Dong (16 August 2018).
17 See VLA and UNDP (2016).
18 See Viet Nam Lawyers Association’s link to the resolution: http://hoiluatgiavn.org.vn/nghi-quyet-so-49-nqtw-ngay-02-thang-06-nam-2005-cua-bo-chinh-tri-ve-chien-luoc-cai-cach-tu-phap-den-nam-2020-d563.html (accessed 21 December 2018).
19 See the full version of the decree at the Ministry of Information and Technology’s website: https://mic.gov.vn/Pages/VanBan/9831/102_2009_N%C3%90-CP.html
increasingly important given the technological progress globally and in Viet Nam, particularly the digitization of manufacturing often referred to as the Industrial Revolution 4.0. As reported by the National Assembly Committee on Justice, State expenditure on e-governance development was as high as 6 trillion VND per year over the period 2015-2017.20 In the meantime, concern about cybersecurity has been growing. This is clear in the adoption of the 2018 Cybersecurity Law, and shows that cybersecurity is another national priority. This law may, in return, affect what information citizens can access using e-government tools. Indicators for the E-Governance dimension—which provide information on the experience of users with access to the Internet and e-government services—will help inform policymakers of the practical implications of these new policy priorities over time.
Finally, the 2018 PAPI for the first time incorporates a dimension on Environmental Governance. Environmental pollution and the quality of the environment citizens live in has become a significant public concern, as PAPI reports since 2015 have shown. This new dimension looks into how citizens experience air and water quality in their residential areas, and asks for their views on levels of compliance by investment projects with environmental protection requirements. The dimension sets some baselines to assist local governments in understanding citizens’ environmental concerns over time. It also informs local governments about “hotspots” of environmental concern so that they can work towards addressing them. Because air, water and environmental pollutants are not constrained by administrative boundaries, provincial governments can consider partnering with neighbouring provinces to find common solutions to the challenges identified by this dimension, in addition to measures to prevent environmental pollution in their own provinces.
20 See Tien Phong (17 November 2017).

6 PAPI 2018THE VIET NAM PROVINCIAL GOVERNANCE AND PUBLIC ADMINISTRATION PERFORMANCE INDEX
How is the 2018 PAPI Report Structured?
The 2018 PAPI Report contains three chapters. Chapter 1 covers overall national performance in the areas of governance and public administration in 2018, and includes a comparison with national trends in previous years (2016-2018). Chapter 2 takes a close look at what citizens viewed as important issues in 2018 and the policy implications of these views. Chapter 3 presents disaggregated findings for provinces in 2018 at the dimensional, sub-dimensional, and indicator levels, as well as time series comparisons for 2011-2018 for indicators that have remained the same over time. Chapter 3 closes with a dashboard summarizing provincial performance in all dimensions, providing provincial leaders and practitioners with a clear overview of what they have achieved and areas where they can improve more to further satisfy their citizens’ expectations in the short and medium terms.
The report also includes four appendices. Appendix A provides an update of provincial responses to PAPI findings through the end of 2018. Appendix B provides data on how Viet Nam has done in terms of implementation of the 2030 Agenda for the Sustainable Development Goals, based on indicators that PAPI measured from 2016-2018. Appendix C presents the Basic Asset Index to capture household living conditions of the PAPI respondents from 2011-2018. Lastly, as in previous annual reports, Appendix D provides demographic characteristics of the 2018 PAPI sample, including data on gender, ethnicity, age, occupation, education level and disability, as well as a map of the 2018 PAPI field survey locations.
The report is accompanied by the website www.papi.org.vn, which includes up-to-date and detailed provincial profiles, case studies, and policy responses.
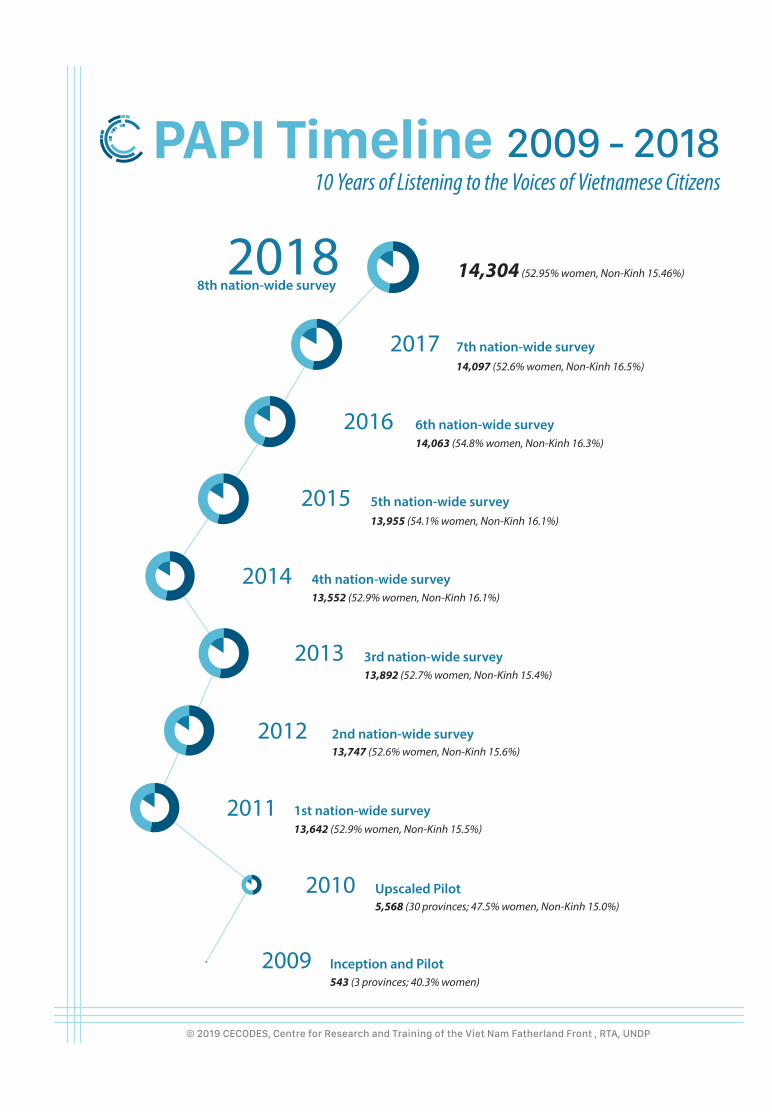
2018
2009 Inception and Pilot543 (3 provinces; 40.3% women)
2010 Upscaled Pilot5,568 (30 provinces; 47.5% women, Non-Kinh 15.0%)
2011 1st nation-wide survey13,642 (52.9% women, Non-Kinh 15.5%)
2012 2nd nation-wide survey13,747 (52.6% women, Non-Kinh 15.6%)
2013 3rd nation-wide survey13,892 (52.7% women, Non-Kinh 15.4% )
2014 4th nation-wide survey13,552 (52.9% women, Non-Kinh 16.1% )
2015 5th nation-wide survey13,955 (54.1% women, Non-Kinh 16.1%)
2016 6th nation-wide survey14,063 (54.8% women, Non-Kinh 16.3% )
2017 7th nation-wide survey14,097 (52.6% women, Non-Kinh 16.5% )
8th nation-wide survey14,304 (52.95% women, Non-Kinh 15.46%)
10 Years of Listening to the Voices of Vietnamese Citizens
© 2019 CECODES, Centre for Research and Training of the Viet Nam Fatherland Front , RTA, UNDP


CHAPTER 1
Overview
As Viet Nam develops, a wide range of new governance challenges have emerged, such as the growing need for environmental protection and leveraging technology for e-governance. However, while new challenges require new solutions, other long-standing issues persist. Anti-corruption work, public service delivery, administrative procedures simplification, and efforts towards greater transparency and government responsiveness remain as important as ever.
This evolving context of governance and public administration in Viet Nam creates challenges and opportunities for PAPI, which aims to reflect citizen concerns and track changes over time. PAPI must be flexible and adapt to new conditions, but at the same time the index must provide continuity in order to generate insights about longer -term trends and areas of governance that are improving (or deteriorating). This chapter addresses both areas of continuity and areas of change.
First, this chapter introduces and provides findings for the “Core PAPI,” which contains the indicators that make up the six PAPI dimensions that have stayed the same since the first national survey in 2011. This core index provides an assessment of how governance and public administration performance has changed over time in the areas measured by
the indicators comprising these six dimensions. As the Core PAPI shows, improvement was noticeable in 2018 in all six of these governance and public administration dimensions. An important trend in the context of recent national anti-corruption efforts is the increasingly positive evaluations by citizens of government performance in control of corruption in the public sector.
Alongside the Core PAPI, this chapter also assesses the two new dimensions—Environmental Governance and E-Governance—and provides a national overview of citizen views on these issues. Findings on environmental governance trends over the past three years shows that citizens are consistently concerned about environmental protection. Regarding e-governance, a dramatic increase in Internet access in Viet Nam in recent years suggests that the Government is wise to invest in e-governance resources.
National Trends in the Core PAPI from 2011 to 2018
Figure 1.1 shows national trends for the six dimensions of the Core PAPI since 2011. As noted above, the Core PAPI includes only indicators that have been used to construct sub-dimensions and dimensions every year since 2011. (See Chapter 3 for lists of indicators that are included in the Core PAPI dimensions). The results
OVERVIEW OF GOVERNANCE AND PUBLIC ADMINISTRATION PERFORMANCE IN 2018 AND OVER TIME (2011-2018)

10 PAPI 2018THE VIET NAM PROVINCIAL GOVERNANCE AND PUBLIC ADMINISTRATION PERFORMANCE INDEX
show that there was improvement, although at different rates, in 2018 in all six dimensions. Significant increases were seen in the three dimensions of Participation at Local Levels, Transparency, and
Figure 1.1: National Trends from 2011 to 2018 in the Core PAPI
5.455.345.32
5.134.91
5.415.44
5.69 5.615.78
5.915.88
5.315.525.61
5.88
5.08
5.54
4.995.28
5.04
5.475.595.83
5.565.81
6.146.03
5.755.72
6.136.21
6.016.02
6.035.945.93
5.905.916.01
6.887.057.05
7.117.09
7.147.23
7.31
0
2
4
6
8
Dim
ensi
onal
Sco
res (
Scal
e: 1
-10
Poin
ts)
1: Participation atLocal Levels
2: Transparencyin Local
Decision-Making
3: VerticalAccountability
4: Control ofCorruption in the
Public Sector
5: PublicAdministrative
Procedures
6: PublicService Delivery
2011 2012 2013 2014 2015 2016 2017 2018
Notes: PAPI indicators were revised and refined every year; the Core PAPI presented above consolidates indicators that were maintained over time from 2011 to 2018. The exact numbers in this Figure 1.1 may differ from aggregate national figures presented in PAPI reports from 2011 to 2017.
To understand some of the reasons for these changes, this chapter provides an analysis of the data for each of the dimensions. However, at the outset, it is important to note that some of the changes may be due to Viet Nam’s improved economic performance. In 2018, Viet Nam’s gross domestic product (GDP) growth rate was 7.08 percent, reported to be the highest since 2008, according to a recent report by the Government Statistics Office.21
This improvement in national economic conditions is reflected in the data about citizens’ perceptions of their household economic condition. Figure 1.2 shows a higher level of citizen optimism about their current household economic conditions. Although the vast majority continued to say that their household
21 See Government Statistics Office’s report at https://www.gso.gov.vn/default.aspx?tabid=621&ItemID=19037
economic situation was neither good nor bad, there was a decrease in the percentage saying their situation was poor, and there was a clear increase in the percentage saying their situation was good. This matches the responses for this question over the past five years, with an increasing number of citizens saying their household economic situation had improved. It is also in line with the trends observed in the 2011-2018 Basic Asset Index presented in Appendix C. As Figure 1.3 shows, the year 2018 witnessed a clear jump in the percentage of citizens saying that they expected their household economic situation to improve in the next five years, alongside a remarkable drop in the number of those saying they expected their situation to deteriorate.
Vertical Accountability, while steady progress is reflected in the other three dimensions—Control of Corruption in the Public Sector, Public Administrative Procedures, and Public Service Delivery.

NATIONAL TRENDS IN GOVERNANCE AND PUBLIC ADMINISTRATION PERFORMANCE CHAPTER 1 11
Figure 1.2: Citizens’ Perception of Current Household Economic Situation, 2011-2018
19.6820.8119.31
16.6619.70
14.7915.15
10.77
68.7568.8170.6072.98
69.7172.67
71.4973.05
11.57 10.3810.09
10.3610.5912.54
13.3616.18
0
20
40
60
80
Perc
enta
ge o
f Res
pond
ents
(%)
Bad Neither Good Nor Bad Good
2011 2012 2013 2014 2015 2016 2017 2018
5.64 6.527.17 6.829.56 9.00
10.879.49
24.3526.15
24.3424.0623.4723.1421.81
24.61
57.0655.68
57.71 57.32
52.0953.63
52.76
55.38
12.9511.65
10.7911.80
14.8814.2214.55
10.51
0
20
40
60
Perc
enta
ge o
f Res
pond
ents
(%)
Worse Same Better Don't Know
2011 2012 2013 2014 2015 2016 2017 2018
Figure 1.3: Perceived Economic Situation in the Next Five Years, 2011-2018
In short, Vietnamese citizens across the board are optimistic about their household economic conditions. Importantly for the PAPI, this also correlates with citizens’ assessment of government performance at different levels in governance and public administration. Additional analysis shows that
citizen satisfaction with the economy also correlates with their overall satisfaction with government, suggesting that citizen perceptions of governance heavily influenced by the state of the economy.22
22 Statistical regressions show a correlation between citizens’ evaluation of the economy and their views on governance in 2018.

12 PAPI 2018THE VIET NAM PROVINCIAL GOVERNANCE AND PUBLIC ADMINISTRATION PERFORMANCE INDEX
Although optimism about the economic situation of households may impact citizens’ assessment of different aspects in PAPI, to understand the specific areas where citizens expressed the most satisfaction requires looking deeper into the data. This suggests that there is important information contained within the indices that may provide additional insight as to areas where Viet Nam has improved, and areas where more work needs to be done. To address this, the following sections looks into each dimension more deeply.
Dimension 1: Participation at Local Levels
The composition of Dimension 1 has changed substantially from previous years, so the core version of this dimension is based on a limited set of questions. The Opportunities for Participation sub-dimension looks at whether citizens were invited to vote in National Assembly, People’s Council and village elections. Because elections occur every five years for People’s Councils and every 2.5 years for village heads, this dimension tends to improve during national election years, when citizens are more likely to remember or recall their participation. This is clearly evident in Figure 1.4, which shows an increase in the Opportunities for Participation sub-dimension
in the election years of 2011 and 2016 compared to other years’ scores. The sub-dimension Voluntary Contributions asks whether citizens were invited to make a voluntary contribution to a local infrastructure project, and whether they were invited to participate in the design and supervision of the project. This sub-dimension also reveals whether or not local officials use pressure to force citizens to contribute to a local infrastructure project financially, with in-kind contributions, or through their labour. As can be seen in Figure 1.4, this sub-dimension saw some improvement in 2017, which continued to 2018. In particular, deeper analysis of the 2018 PAPI data shows that there was a consistent decrease in the number of citizens reporting that they were asked by a village chief or local official to contribute to a project. About 50 percent of those contributing said they did so voluntarily in 2017 and 2018, which was up from an average of about 45 percent prior to 2017. This suggests some decreased use of pressure to force citizens to contribute. Overall, voluntary participation remains stable, while there has been a decrease in coerced participation.
2.502.43
2.322.17
2.39 2.392.25
2.31
1.79 1.81 1.85 1.83 1.74 1.741.78
1.87
1.15 1.09 1.15 1.12
1.28 1.28
1.411.51
0
.5
1
1.5
2
2.5
Sub-
Dim
ensi
onal
Sco
res (
Scal
e: 0
.33-
3.33
Poi
nts)
Opportunities for Participation Quality of Elections Voluntary Contributions
2011 2012 2013 2014 2015 2016 2017 2018
Figure 1.4: Trends in Participation at Local Levels in Comparable Sub-Dimensions, 2011-2018

NATIONAL TRENDS IN GOVERNANCE AND PUBLIC ADMINISTRATION PERFORMANCE CHAPTER 1 13
2.26 2.31 2.36 2.31
2.032.12 2.14
2.29
1.79 1.821.89
1.82
1.66 1.68 1.701.80
1.561.66 1.66
1.751.63
1.72 1.76 1.79
0
1
1.5
2
2.5
0.5
Sub-
Dim
ensi
onal
Sco
res (
Scal
e: 0
.33-
3.3
Poin
ts)
Transparency inPoor Household Lists
Transparency inCommune Budget and Expenditure
Transparency inLand Use Plans/Price Frames
2011 2012 2013 2014 2015 2016 2017 2018
Dimension 2: Transparency in Local Decision-making
This dimension was updated in 2018, most notably with the new sub-dimension Access to Information. The remaining three sub-dimensions measure Transparency in Poverty Lists, Commune Budget and Expenditures, and Transparency in Land Use Plans and Price Frames; these remained unchanged and thus can be compared over time. As Figure 1.5 shows, there was a higher level of transparency in how
poverty lists were formulated in 2018, indicating that citizens could get more information about the lists and that there was less intentional manipulation of the lists than in 2016 and 2017. Additionally, citizens noted improvements in commune budget and expenditure transparency. This means citizens were more aware of local budgets and expenditures. At the same time, the information was more readable and trustworthy. These are important improvements that speak to increasing openness at local levels.
Figure 1.5: Trends in Transparency in Local Decision-making in Comparable Sub-Dimensions, 2011-2018
With the exception of 2015, there has been a general trend of rising scores in the transparency of land use plans and land price frames over the past five years since the 2013 amendments to the Land Law took effect. The consistently low aggregate score in this sub-dimension, however, signifies that land transparency remains an important area where local governments should improve. One critical and
pertinent issue with land transparency is that since 2011 less than one-fourth of the population has been able to access information about local land use plans and less than one-third have had opportunities to provide comments. The trend over the past few years, which continued in 2018, seems promising but the rate of annual improvement is modest. Figure 1.6 provides more details about this situation.

14 PAPI 2018THE VIET NAM PROVINCIAL GOVERNANCE AND PUBLIC ADMINISTRATION PERFORMANCE INDEX
Figure 1.6: Transparency in Local Land Use Plans, 2011-2018
of respondents saying they had their residential land taken fell to its lowest levels since PAPI first asked questions on this topic in 2011. Also, in cases where residential land has been taken, the degree of satisfaction with the compensation has slightly increased (see Figure 1.8).
20.8022.37 22.64 23.48
17.86 18.37 19.3021.61
33.85 34.88 34.45 34.20
24.71
35.28
29.82 29.53
10
20
30
40
50
Perc
enta
ge o
f Res
pond
ents
(%)
Informed About Land Use Plan Opportunity to Comment
2011 2012 2013 2014 2015 2016 2017 2018 2011 2012 2013 2014 2015 2016 2017 2018
9.4610.71
9.07 8.72 9.3510.12
5.72 5.41
7.43
4.976.82
3.58
6.65
3.02
7.28
3.04
0
5
10
15
20
25
30
Perc
enta
ge o
f Res
pond
ents
(%)
2011 2012 2013 2014 2015 2016 2017 2018
Neighbour Respondent Household
On a more positive note, the trends in scores for this sub-dimension are consistent with the noticeable decrease in the level of residential land seizures reflected in PAPI since the passage of the 2013 Land Law. As Figure 1.7 shows, this trend persisted in 2018. In fact, over the past two years the number
Figure 1.7: Percentage of Citizens Reporting Residential Land Seizures, 2011-2018

NATIONAL TRENDS IN GOVERNANCE AND PUBLIC ADMINISTRATION PERFORMANCE CHAPTER 1 15
However, one consistent reason for the low land transparency scores since 2011, as presented in Figure 1.6, is the fact that many citizens who had land seized were not satisfied with the compensation price. Although the percentage of satisfied citizens improved in 2018 relative to 2017, the vast majority
were not satisfied with land compensation levels (see Figure 1.8). In fact, dissatisfaction with land compensation has been a source of land conflicts in Viet Nam.23 This implies the need for the government at the central and local levels to address land compensation policy.
23 See the National Economic University and United Nations Development Programme (2017), and John, Gillespie, Thang, N. V. et al. (2019) for case studies based on an examination of PAPI findings over time.
Figure 1.8: Percentage of Respondents Reporting that Compensation for Residential Land Taken was Fair, 2014-2018
36.54
28.83 27.0921.17
31.60
49.47 47.2941.59
37.90 38.45
10
20
30
40
50
60
70
80
90
100
Perc
enta
ge o
f Res
pond
ents
(%)
Myself/My Family Neighbor
2014 2015 2016 2017 2018 2014 2015 2016 2017 20180
The previous section focused on residential land seizures by local governments for other uses. Because agricultural land is often the subject of the most intense disputes, the 2018 PAPI survey also asked citizens whether they had farmland seized in the previous year. This is an important issue as the percentage of respondents in the PAPI sample working in the agricultural sector in 2018 was 37.5 percent. Although this question was not used in the PAPI index, it does provide additional information for local governments to examine how citizens experience farmland seizures. Figure 1.9 shows that the number of citizens responding that they had farmland taken was higher than for residential land. In
total, 5.6 percent said they had farmland taken in 2018. Regarding compensation, perhaps surprisingly, the percentage of those satisfied with the compensation provided was relatively high; more than 63 percent of those who had farmland seized in 2018 were satisfied with the compensation they received.
In sum, there were notable improvements across all aspects of transparency in local decision-making in 2018. Importantly, given the sensitivity of the issue, citizens show increasing satisfaction with land compensation, although much work remains to be done in this area.

16 PAPI 2018THE VIET NAM PROVINCIAL GOVERNANCE AND PUBLIC ADMINISTRATION PERFORMANCE INDEX
Figure 1.9: Farmland Seizures and Satisfaction with Compensation, 2018
Dimension 4: Control of Corruption in the Public Sector
Each year, the most important determinant of overall satisfaction with governance and public administration performance is Dimension 4: Control of Corruption in the Public Sector (as Figure 1.10 shows). Most aspects of this dimension remain constant, meaning that the indicators used in its composition are comparable over time.24
24 The exceptions are the addition of the denunciation price to the index in 2014, and moving the indicator on Knowledge of the Anti-corruption Law to Dimension 1. Therefore, the Willingness to Fight Corruption sub-dimension no longer includes these indicators.
Dimension 3: Vertical Accountability
Of the six dimensions, Vertical Accountability underwent the most change in 2018, apart from changes made in 2017 to its composition. Only one sub-dimension—Interaction with Local Authorities—remains constant. The core of Dimension 3, therefore, simply measures citizens’ interactions with local authorities. As Figure 1.1 above shows, more citizens reported that they had interactions with village and commune authorities in 2018 than in 2017. However, citizens also reported that they had few chances to meet with leaders at the district, provincial and higher levels (see Chapter 3 for further details).
13.97
5.63
0
5
10
15
20
25
30
Perc
enta
ge o
f Res
pond
ents
(%)
2018
Neighbour Respondent
67.0663.39
10
20
30
40
50
60
70
80
90
100
Perc
enta
ge o
f Res
pond
ents
Myself/My Family Neighbor
2018 2018
Farmland Seized Satisfaction with Compensation

NATIONAL TRENDS IN GOVERNANCE AND PUBLIC ADMINISTRATION PERFORMANCE CHAPTER 1 17
Figure 1.10: Trends in the Control of Corruption in the Public Sector, 2011-2018
Delving further into these sub-dimensions, Figure 1.11 shows that the percentage of respondents agreeing or somewhat agreeing with the statements that they need to pay a bribe for state employment, public health care, primary education, or construction permits in 2018 maintained the steady decline seen in 2017. The decline is particularly pronounced in the indicator about bribes for teacher favouritism at public primary schools. However, concerns about bribery for land use rights certificates (LURCs) and public officials’ diversion of public funds remained constant over the past two years.
2011 2012 2013 2014 2015 2016 2017 2018
1.381.43
1.571.521.401.40
1.561.57
1.741.75
1.821.781.751.77
1.851.89
0.910.950.990.940.890.88
1.001.05
1.54
1.681.75
1.781.721.671.721.70
0
.5
1
1.5
2
Dim
ensi
onal
Sco
res (
Scal
e: 0
.25-
2.5
Poin
ts)
Limits on PublicSector Corruption
Limits on CorruptionPublic Services
Equity inState Employment
Willingness toFight Corruption
14
46
14
47
14
47
15
49
14
51
16
54
17
48
18
46
13
30
13
28
13
29
14
33
15
36
17
38
15
33
16
32
12
25
9
22
11
25
11
26
11
33
14
35
14
32
15
32
16
42
14
43
15
42.5
16
43
15
43
14
39
16
36
14
32
11
25
11
26
11
28
13
30
12
31
12
31
12
28
13
26
12
22
12
21
11
20
12
23
12
25
16
28
12
22
13
22
0
20
40
60
Perc
enta
ge o
f Res
pond
ents
(%)
StateEmployement
PublicHealthcare
Service
Land Use RightsCerti�cate
Procedures
TeacherFavoritism
ConstructionPermit
Procedures
Diversion ofState Funds
20112012
20132014
20152016
20172018
20112012
20132014
20152016
20172018
20112012
20132014
20152016
20172018
20112012
20132014
20152016
20172018
20112012
20132014
20152016
20172018
20112012
20132014
20152016
20172018
Somewhat Agree Agree
As Figure 1.10 indicates, the results for 2018 show good progress in control of corruption in the public sector, in public service delivery, and in hiring for government positions (equity in state employment). One possible explanation is that the perceptions of reduced corruption are more related to the continued efforts at the central level since 2017 in handling high-profile corruption cases rather than to the work of local-level governments in controlling everyday corruption.
Figure 1.11: Trends in Corruption as Perceived by Citizens, 2011-2018
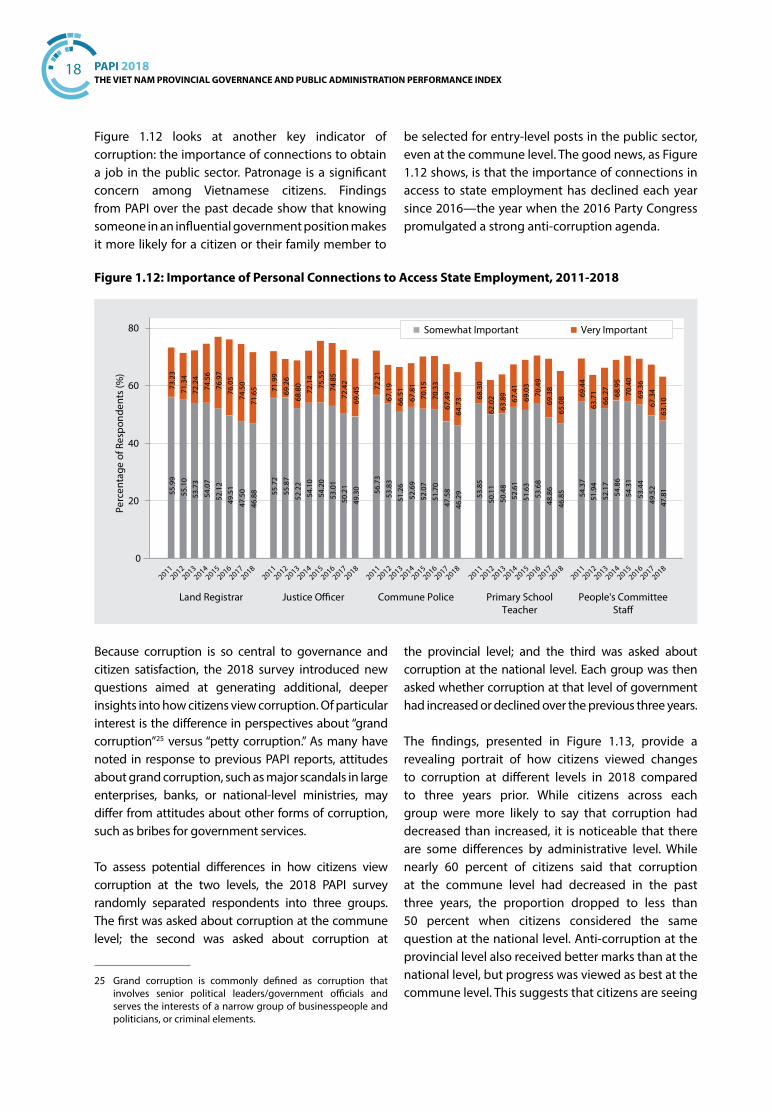
18 PAPI 2018THE VIET NAM PROVINCIAL GOVERNANCE AND PUBLIC ADMINISTRATION PERFORMANCE INDEX
Figure 1.12 looks at another key indicator of corruption: the importance of connections to obtain a job in the public sector. Patronage is a significant concern among Vietnamese citizens. Findings from PAPI over the past decade show that knowing someone in an influential government position makes it more likely for a citizen or their family member to
be selected for entry-level posts in the public sector, even at the commune level. The good news, as Figure 1.12 shows, is that the importance of connections in access to state employment has declined each year since 2016—the year when the 2016 Party Congress promulgated a strong anti-corruption agenda.
Figure 1.12: Importance of Personal Connections to Access State Employment, 2011-2018
55.9
973
.23
55.1
071
.34
53.7
372
.24
54.0
774
.56
52.1
276
.97
49.5
176
.05
47.5
074
.50
46.8
871
.65
55.7
271
.99
55.8
769
.26
52.2
268
.80
54.1
072
.14
54.2
075
.55
53.0
174
.85
50.2
172
.42
49.3
069
.45
56.7
372
.21
53.8
367
.19
51.2
666
.51
52.6
967
.81
52.0
770
.15
51.7
070
.33
47.5
867
.49
46.2
964
.73
53.8
568
.30
50.1
162
.02
50.4
863
.89
52.6
167
.41
51.6
369
.03
53.6
870
.49
48.8
669
.38
46.8
565
.08
54.3
769
.44
51.9
463
.71
52.1
766
.27
54.8
668
.95
54.3
170
.40
53.4
469
.36
49.5
267
.34
47.8
163
.10
0
20
40
60
80
Perc
enta
ge o
f Res
pond
ents
(%)
Land Registrar Justice O�cer Commune Police Primary SchoolTeacher
People's CommitteeSta�
20112012
20132014
20152016
20172018
20112012
20132014
20152016
20172018
20112012
20132014
20152016
20172018
20112012
20132014
20152016
20172018
20112012
20132014
20152016
20172018
Somewhat Important Very Important
Because corruption is so central to governance and citizen satisfaction, the 2018 survey introduced new questions aimed at generating additional, deeper insights into how citizens view corruption. Of particular interest is the difference in perspectives about “grand corruption”25 versus “petty corruption.” As many have noted in response to previous PAPI reports, attitudes about grand corruption, such as major scandals in large enterprises, banks, or national-level ministries, may differ from attitudes about other forms of corruption, such as bribes for government services.
To assess potential differences in how citizens view corruption at the two levels, the 2018 PAPI survey randomly separated respondents into three groups. The first was asked about corruption at the commune level; the second was asked about corruption at
25 Grand corruption is commonly defined as corruption that involves senior political leaders/government officials and serves the interests of a narrow group of businesspeople and politicians, or criminal elements.
the provincial level; and the third was asked about corruption at the national level. Each group was then asked whether corruption at that level of government had increased or declined over the previous three years.
The findings, presented in Figure 1.13, provide a revealing portrait of how citizens viewed changes to corruption at different levels in 2018 compared to three years prior. While citizens across each group were more likely to say that corruption had decreased than increased, it is noticeable that there are some differences by administrative level. While nearly 60 percent of citizens said that corruption at the commune level had decreased in the past three years, the proportion dropped to less than 50 percent when citizens considered the same question at the national level. Anti-corruption at the provincial level also received better marks than at the national level, but progress was viewed as best at the commune level. This suggests that citizens are seeing

NATIONAL TRENDS IN GOVERNANCE AND PUBLIC ADMINISTRATION PERFORMANCE CHAPTER 1 19
improvements in efforts to curb petty corruption, which they are able to witness directly. However, they remain suspicious about grand corruption, which has continued to get the most media attention during
the ongoing anti-corruption campaign. While anti-corruption performance improved, more citizens were concerned with corruption in 2018 than in 2016 and 2017, as noted in Chapter 2.
Figure 1.13: Perception of Change in Corruption Compared to Three Years Ago by Level of Government, 2018
49.32
11.52
39.16
55.68
15.59
28.73
59.78
20.04
20.18
0
20
40
60
80
100
National Level Provincial Level Commune Level
Decreased Stable Increased
44.90
55.10
31.88
68.12
0
20
40
60
80
Provincial Level National Level
Not Serious About Corruption Serious About Corruption
Figure 1.14 shows responses to the question of whether or not citizens feel that the national and provincial governments are serious about dealing with corruption when it arises. As seen in the figure, in a reverse of findings shown in Figure 1.13, more citizens thought the national government and party were
serious about dealing with corruption at the national level than at the provincial level. This indicates that at least part of the perception of heightened corruption at the national level reflects citizens also appreciating that the central government has been paying more attention to corruption when it arises.
Figure 1.14: Government’s Seriousness in Dealing with Corruption, 2018

20 PAPI 2018THE VIET NAM PROVINCIAL GOVERNANCE AND PUBLIC ADMINISTRATION PERFORMANCE INDEX
In addition, Table 1.1 summarizes experiences with actual corruption from 2012 to 2018. It shows the results from an experimental survey measuring the number of citizens that have paid bribes for land use right certificates (LURCs) or hospital services—without them actually having to admit to doing
Table 1.1: Trends in Corruption as Experienced by Citizens, 2012-2018
Analysis Technique Year Land Use Rights Certificates
Public Health Care at District Level
Frequency estimated from size (1) 2018 15% 0.4%
2017 17% 9%
2016 23% 17%
2015 44% 12%
2014 24% 12%
2013 33% 20%
2012 17% 10%
(1) Reports the share of respondents in the treatment group who said that they paid more for items than those in the control group.
so. The results are positive news for the health care sector; almost no one in 2018 had to pay bribes in person to get health care at district public hospitals. For LURCs, the situation changed only marginally in 2018; 15 percent of users said they paid bribes for LURCs—only a slight decline from 2017.
In summary, the findings presented above tell a positive story about efforts to root out corruption since 2016. The anti-corruption campaigns over the past two years seem to have had a measurable effect on citizens’ evaluation of corruption in the public sector. At the same time, it is important to note that while there have been improvements since 2016, the level of concern about corruption remains high (see also Chapter 2 for results on issues of greatest concern in 2018). Therefore, while progress has been made, more work remains to be done, especially at the local levels and in achieving greater equity in access to state employment.
Dimension 5: Public Administrative Procedures
Quality of Services for Public Administrative Procedures is another area that PAPI has tracked since 2011. This dimension has also undergone some changes, but the overall concepts measured remain unchanged.26 The results presented in Figure 1.15 show slight improvements in 2018, particularly with regards to land use rights certification. This, combined with the improvements in the land transparency scores, suggests that while much work remains to be done to improve land governance performance, noticeable improvements have been made.
26 There were modest changes to how satisfaction was measured in this dimension in 2016. The Core Index indicators in Figure 1.12 show only those indicators that remain unchanged.

NATIONAL TRENDS IN GOVERNANCE AND PUBLIC ADMINISTRATION PERFORMANCE CHAPTER 1 21
Dimension 6: Public Service Delivery
This dimension changed minimally in 2018, with the broad categories consistent over time.27 The sub-dimensions reveal a striking divergence (see Figure 1.16). The Public Health sub-dimension, for example,
27 There were modest changes to the Basic Infrastructure and Law and Order sub-dimensions in 2018.
Figure 1.15: Trends in the Public Administrative Procedures Dimension, 2011-2018
1.161.17
1.161.17
1.011.021.051.08
1.671.65
1.701.66 1.66
1.641.66
1.68
1.521.48
1.521.44
1.551.54
1.52 1.571.66
1.721.65 1.66
1.711.70 1.671.69
0
1
1.5
2
0.5
Sub-
Dim
ensi
onal
Sco
res (
Scal
e: 0
.25-
2.5
Poin
ts)
Certi�cationProcedures
ConstructionPermits
Land Use RightsCerti�cate Procedures
Personal Proceduresat Commune Level
2011 2012 2013 2014 2015 2016 2017 2018
saw continued improvement in 2018. This is due to the increased numbers of respondents saying that they had access to health insurance over time (see Figure 1.17); while 80 percent of respondents reported that they had access to health insurance in 2017, the number increased to 87 percent in 2018.
Figure 1.16: Trends in the Public Service Delivery Dimension, 2011-2018
1.841.851.861.851.84
1.911.921.96
1.681.721.691.691.68
1.731.77
1.641.75
1.881.881.941.93
1.861.89
2.04
1.60 1.601.621.631.641.641.64
1.66
0
1
1.5
2
0.5
Sub-
Dim
ensi
onal
Sco
res (
Scal
e: 0
.25-
2.5
Poin
ts)
Public Health Public Education Basic Infrastructure Law and Order
2011 2012 2013 2014 2015 2016 2017 2018

22 PAPI 2018THE VIET NAM PROVINCIAL GOVERNANCE AND PUBLIC ADMINISTRATION PERFORMANCE INDEX
Figure 1.17: Percentage of Respondents with Access to Health Insurance, 2011-2018
in Chapter 3, sets baselines to assist central and local governments in understanding citizens’ environmental concerns over time. It also informs governments at different levels about “hotspots” of environmental concern so that they can work on addressing these issues. Some of the questions used in this dimension have remained unchanged since 2016. Therefore, a basic assessment of how environmental attitudes have changed over the period 2016-2018 can be provided.
Figure 1.18 shows that on a range of indicators, more citizens were concerned about water quality than air quality over the past three years. On water quality, one-fourth of respondents said water coming from waterways near their homes was unsafe to swim in. Furthermore, more than half said water quality had worsened over the past three years. On air quality, 15 percent of citizens in 2018 believed it was bad or very bad. However, in terms of the trend over time, about 36 percent said air quality had declined over the past three years. The increasing concern among citizens about water and air quality requires prompt government attention and action, including engaging citizens in protecting their living environment.
57.28 56.96 57.2360.89 62.85
73.66
80.68
87.84
0
20
40
60
80
Perc
enta
ge o
f Res
pond
ents
(%)
2011 2012 2013 2014 2015 2016 2017 2018
Scores for basic infrastructure, which includes garbage collection, road quality, electrification, and drinking water quality, also improved dramatically in 2018. This increase is largely due to the increased number of respondents saying that their local roads are made of concrete rather than dirt. This suggests that work to improve basic infrastructure has been advancing in rural areas.
Despite the broad improvements in this dimension, it is important to note that the one public service bucking the trend of improvement in 2018 was quality of primary education. As opposed to the other sub-dimensions, satisfaction with public education declined. The decline was mainly because of lower citizen satisfaction with the quality of primary schools and education (see Chapter 3 for further details).
Overall 2018 Findings in the New PAPI Dimensions
Dimension 7: Environmental Governance
As noted above, the 2018 PAPI adds a new Environmental Governance dimension. This dimension, which is introduced in greater detail

NATIONAL TRENDS IN GOVERNANCE AND PUBLIC ADMINISTRATION PERFORMANCE CHAPTER 1 23
Figure 1.18: Perceived Local Air and Water Quality, and Preferences Related to Environmental Protection, 2016-2018
for provincial governments so that they can better understand local conditions as they develop the infrastructure and supporting systems for e-government. The dimension also aims to facilitate development of local governments that can interact with citizens effectively via online platforms in every stage of the policy cycle—from policymaking and policy implementation to policy monitoring and evaluation.
While the E-Governance dimension is evolving, PAPI has tracked the number of Internet uses since 2016. Figure 1.19 clearly shows why PAPI now includes the new E-Governance dimension: between 2017 and 2018, the number of respondents with access to the Internet surged. In 2018, 38 percent of respondents said they accessed news primarily online compared to 28 percent in 2017. Furthermore, 53 percent of respondents said they had Internet access at home, an increase of more than 15 percent from 2017. This shows that Internet access in Viet Nam is becoming ubiquitous, thus justifying the quest for more participatory e-governance.
17.73 18.61 15.50
35.74 37.28 36.49
27.51 27.49 25.91
65.74 64.34 63.9969.33 70.66 73.70
0
20
40
60
80
0
20
40
60
80
2016 2017 2018 2016 2017 2018 2016 2017 2018
2016 2017 2018 2016 2017 2018
Air Quality: Bad Air Quality: Getting Worse Water: Unsafe
Water: Getting Worse Prefer Environment over Economic Growth
Perc
enta
ge o
f Res
pond
ents
(%)
In terms of attitudes towards the environment, the next chapter contains more details regarding how citizens view trade-offs between environmental protection and economic development, providing some feedback to the central and local governments for them to consider when reviewing investment projects. The bottom right graph in Figure 1.18 shows responses on this basic indicator of environmental preference: whether a citizen prefers environmental protection or economic development. The numbers have remained relatively stable. In 2016, 69 percent said they preferred environmental protection. That number increased to 74 percent in 2018.
Dimension 8: E-Governance
The new E-Governance dimension, which is discussed in greater detail in Chapter 3, reflects the growing importance of the provision of documents online to ease the completion of administrative procedures. This is particularly relevant given the increasing number of Internet users across the country, as shown in this year’s PAPI and other relevant global reports.28 This new dimension creates some baselines
28 According to the Digital 2019 Report for Viet Nam, there were 64 million active Internet users as of 2019 (see https://datareportal.com/reports/digital-2019-vietnam).

24 PAPI 2018THE VIET NAM PROVINCIAL GOVERNANCE AND PUBLIC ADMINISTRATION PERFORMANCE INDEX
The use of government e-portals, however, has not matched the rate of increased access to the Internet, despite major state investments in information and technology in the public sector. As Figure 1.20 shows, the percentage of respondents using such portals for administrative procedures remained extremely low, although some increase is seen in the 2018 figures.
23.24
28.00
38.29
31.31
37.93
52.69
0
10
20
30
40
50
2016 2017 2018 2016 2017 2018
Access to News Online Internet at Home
Perc
enta
ge o
f Res
pond
ents
(%)
2.10
2.56
3.97
0.590.79 0.93
0.50 0.56
1.53
0
1
2
3
4
0
1
2
3
4
2016 2017 2018 2016 2017 2018
2016 2017 2018
Access to Certi�cation Procedures Online Access to Construction Procedures Online
Access to Land Titling Procedures Online
Perc
enta
ge o
f Res
pond
ents
(%)
In other words, far fewer citizens have utilized government portals compared to those using the Internet. It appears the e-governance infrastructure needs to be streamlined and more integrated across government agencies and municipalities to better meet the needs of citizens.29
29 Viet Nam ranks the 54th on the 2019 Inclusive Internet Index in the dimension on Availability, largely because of poor e-government infrastructure (see the report at https://theinclusiveinternet.eiu.com/explore/countries/VN/)
Figure 1.19: Access to the Internet, 2016-2018
Figure 1.20: Use of E-Government Portals for Public Administrative Procedures, 2016-2018

NATIONAL TRENDS IN GOVERNANCE AND PUBLIC ADMINISTRATION PERFORMANCE CHAPTER 1 25
Conclusion and Implications
This chapter has reviewed the Core PAPI to provide details on national trends in governance and public administration performance over time, based on indicators, sub-dimensions and dimensions that have remained unchanged. This information helps different stakeholders to have an overview of where government performance has improved and where it has lagged since 2011. The chapter also introduced key 2018 findings for the two new dimensions of Environmental Governance and E-Governance.
Based on analysis of the data, several conclusions are in order. For indicators, sub-dimensions and dimensions in the Core PAPI that can be compared over time from 2011 through 2018, some progress was seen in 2018, although at varying rates across dimensions. The Participation at Local Levels and Transparency dimensions witnessed dramatic jumps. Meanwhile, the Control of Corruption in the Public Sector, Public Administrative Procedures, and Public Service Delivery dimensions showed steady increases. More details about trends over time at national and provincial levels are provided in Chapter 3. As noted, the progress in citizens’ satisfaction with governance and public administration performance in general may be attributed to greater public optimism about household and national economic performance in 2018. That said, it is worth noting that the 2018 PAPI survey was completed in November, before news about the promising national economic growth rate, as reported by the central government, was broadcast publicly at the end of 2018.
Findings from the Core PAPI also show that while challenges remain in important areas such as voluntary participation, land transparency, corruption in state employment, land use rights certification and public primary education, governance and public administration in 2018 showed improvements across a wide range of indicators. Anti-corruption efforts appear to influence citizens’ (improved) evaluations of corruption monitoring. Citizens were also more satisfied with public administrative procedures, and with public services such as health care and basic infrastructure. In all, the results show an improving governance environment, though with room for further progress.
Similarly, findings from new dimensions imply opportunities for improvement. This is one reason the new features were introduced into the PAPI—which aims to gauge evolving public policy implementation to inform policymakers and practitioners. As Chapter 1 indicates, more diligent work can be done in the areas of environmental governance so that citizens are able to enjoy better living conditions in their localities. Among other things, provincial governments can partner with neighbouring provinces to find common solutions to managing air, water and other environmental pollutants that often cross administrative boundaries. Furthermore, the more citizens receive access to the Internet, the higher their expectations are for strengthened e-governance and better access to online facilities for administrative procedures, to reduce transaction costs, including informal costs, for citizens.

26 PAPI 2018THE VIET NAM PROVINCIAL GOVERNANCE AND PUBLIC ADMINISTRATION PERFORMANCE INDEX
Overview
While Chapter 1 paints a positive picture of improving governance in Viet Nam, citizens continue to have pressing concerns related to the economy, the environment, and gender equality. In particular, citizens’ concerns about economic and environmental issues continued to play an important role in 2018, while there are persistent differences in how gender shapes citizens’ views on governance and public administration. To probe deeper, the 2018 PAPI survey added several questions to capture citizens’ perspectives on economic, environmental and gender issues. This chapter presents findings from the analysis around those issues, and provides food for thought for policymakers and practitioners on where there are pressing needs that call for prompt responses.
To that end, this chapter first assesses the issues of greatest concern to citizens in Viet Nam. Given that poverty continues to be a dominant concern, the analysis looks at economic issues relevant to citizens’ perspectives and experiences, in particular inequality and how citizens’ views vary by income level. In addition, because the environment has become an issue of great concern, the chapter examines citizens’ willingness to support potentially costly environmental initiatives. Finally, the chapter looks into citizens’ perspectives on gender and leadership.
Several findings are evident from the analysis. First, regarding economic concerns, poorer respondents were more concerned with poverty and economic growth in 2018 than other groups, which is consistent with findings in the 2017 PAPI Report. However, in terms of solutions, wealthier respondents were the most likely to support paying taxes for redistribution to poorer provinces. Furthermore, poorer respondents were no more likely to support poverty assistance efforts than wealthier ones.30
Regarding environmental trade-offs, the analysis shows a consistent effect from environmental impacts on respondents’ preferences for environmental protection across different societal groups. In general, Vietnamese citizens were willing to contribute to improved environmental conditions. Citizens also prefer “clean” investment projects—those that comply with environmental regulations—over ones that contribute more to jobs and tax revenue for the local economy but cause significant pollution. Among the respondents willing to pay for greener energy, reduced local air pollution and the ability to improve power generation were more important factors than mitigating climate change.
30 This aligns with some research from Western countries. See Lupu, Noam and Jonas Pontusson (2011).
CHAPTER 2IMPORTANT ISSUES IN VIET NAM IN 2018: ECONOMIC, ENVIRONMENTAL AND GENDER CONCERNS

28 PAPI 2018THE VIET NAM PROVINCIAL GOVERNANCE AND PUBLIC ADMINISTRATION PERFORMANCE INDEX
Finally, on gender issues, while most respondents said they had no preference for men or women in leadership positions, those who did have a preference were more likely to prefer men. Furthermore, this bias is most pronounced for political leadership positions. Finally, and perhaps most surprisingly, women were more biased against female leaders than men. Issues of Greatest Concern in 2018
One of the most important questions on the PAPI survey is an open-ended question asking citizens to identify the most important issue the government
should tackle. This question allows citizens to provide input as to where they feel the government should devote its energy. As Figure 2.1 shows, poverty reduction remains the issue citizens are most concerned about, as in previous years. Because this has been a puzzling finding to many observers (given the rapid reduction in poverty in Viet Nam), the 2017 PAPI Report probed the issue more deeply and found that many citizens were concerned about falling back into poverty. However, an even greater proportion of citizens said that poverty is an overall drag on the national economy and reduces Viet Nam’s prestige. Citizens had the same views in 2018.
Figure 2.1: Most Important Issue Facing the Country from Citizens’ Perspective, 2018
24.87
9.07
7.39 6.94 6.64
4.27 4.03 3.682.88 2.77 2.55 2.49 2.24 1.96
0
5
10
15
20
25
Perc
enta
ge o
f Res
pond
ents
(%)
Poverty/H
unger
Econ G
rowth
/GDP
Corruptio
n
Jobs/E
mployment
Environment
Law and Ord
er
Road Issues
Educatio
n
Other S
ocial Is
sues
Other E
con Iss
ues
Income
East Sea D
ispute
Land Issues
National D
efense
Looking more deeply within the data, while poverty remains the issue of overwhelming concern for 25 percent of respondents, changes in the issues of concern over time reveal some important trends that bear watching. International public opinion experts suggest that as countries develop, citizens are more likely to shift from micro-level economic concerns to non-economic concerns.31 The analysis of changes
31 Inglehart and Welzel (2005) call these “post-materialist values.” See Inglehart, Ronald and Chirstian Welzel (2005).
over time, presented in Figure 2.2, shows that this may be taking place in Viet Nam. The sharpest increases in 2018 were in concerns about corruption and economic growth. Concern about law and order, education and land compensation also arose significantly. These correspond to national- and provincial-level findings presented in Chapters 1 and 3.

IMPORTANT ISSUES IN VIET NAM IN 2018: ECONOMIC, INVIRONMENTAL AND GENDER CONCERNSCHAPTER 2 29
Figure 2.2: Change in Issues of Greatest Concern, 2016-2018
2.11 2.10
1.541.44
1.211.12 1.07
0
1
1.5
2
0.5
Perc
enta
ge o
f Cha
nge
in R
espo
nses
(%)
Corruptio
n
Economic
Growth
/GDP
Law and Ord
er
Educatio
n
Other E
conomic
Issues
Land Compensatio
n
Other L
and Issues
2016 to 2018
It is also worth noting that although concern for the environment has declined somewhat since 2016, when 12 percent of the respondents suggested it was a top concern, it remains a salient issue for about 7 percent of respondents who cited it as the most important issue in 2018. As Figure 2.3 shows, while concern for
the environment in 2018 fell compared to 2016, when a widely publicized environmental disaster took place along the central coast of Viet Nam, it did not drop to pre-2016 levels. Rather, it has settled at a relatively high level and has become a permanent concern among a subset of the Vietnamese population.
Figure 2.3: Change in Issues of Greatest Concern, 2015-2018
18.04
24.53
28.47
24.87
4.57
6.977.78
9.07
2.16
12.53
7.356.64
0
20
10
30
Perc
enta
ge o
f Citi
zens
2015 2016 2017 2018Year
Poverty Economic Growth Environment

30 PAPI 2018THE VIET NAM PROVINCIAL GOVERNANCE AND PUBLIC ADMINISTRATION PERFORMANCE INDEX
Finally, there are clear gender differences in the results to this question. Figure 2.4 reveals that women were far more concerned with poverty reduction and education than men. Men, on the other hand, were more likely to view economic growth, corruption,
and national security issues as primary concerns. As the next section explains, the differences in priorities highlights the need for equitable representation in government leadership positions.
Figure 2.4: Gender Differences in Issues of Greatest Concern, 2018
10.17
5.01
3.192.61 2.33
-3.63 -3.83-4.59
-6.88
-11.05
-10
-5
0
5
10
Perc
enta
ge D
i�er
ence
bet
wee
n M
ale
and
Fem
ale
Resp
onse
s
Poverty/H
unger
Educatio
n
Drug Abuse
Health/In
surance
Environment
Other E
con Is
sues
East Sea D
ispute
National D
efense
Corruptio
n
Econ G
rowth
/GDP
Economic Inequality
As the previous section makes clear, many Vietnamese citizens have concerns about poverty and economic growth. An important question is how these concerns relate to income distribution, perceptions of economic inequality, and attitudes towards wealth redistribution. This section explores these correlations.
Figure 2.5 presents the income distribution of PAPI respondents in 2018. The right panel shows the entire distribution, while the left panel shows more detail for the lower end of the distribution. As can be seen, about 90 percent of respondents earned less than 20 million VND (approximately 862 USD) per month. About 8 percent made between 20 and 40 million VND per month. The remainder of the distribution features a marginal number of respondents. The bulk of the respondents (more than 50 percent) made less than 12 million VND (approximately 520 USD) per month.
To assess the role that income plays in citizens’ attitudes towards poverty, economic inequality and redistribution policy, this section introduces the results of regression analysis undertaken to examine how income is linked to these attitudes. Consistent with expectations, poorer respondents were more concerned about poverty than those with higher incomes in 2018. As Figure 2.6 shows, nearly 40 percent of those at the lowest income levels felt poverty reduction should be a national priority. However, despite the relationship, the effect is not as strong as one might presume. For instance, an estimated 31 percent of those earning 40-42 million VND per month still expressed concern about poverty reduction. However, gender is far more correlated with a concern about poverty; as Figure 2.7 shows, women were almost 10 percent more likely than men to view poverty as an important concern.

IMPORTANT ISSUES IN VIET NAM IN 2018: ECONOMIC, INVIRONMENTAL AND GENDER CONCERNSCHAPTER 2 31
Figure 2.5: Monthly Income Distribution of PAPI Respondents, 2018
10.4
13.4
15.2
11.512.0
10.3
3.6
7.6
1.8
4.2
10.0
0
5
10
15
Perc
enta
ge (%
)
0 2 4 6 8 10 12 14 16 18 20+
Individual Monthly Income Level (Million VND)
Lower Income Distribution
90.0
8.3
1.1 0.2 0.1 0.1 0.10
20
40
60
80
100
Perc
enta
ge (%
)
0 20 40 60 80 100 150 200+
Individual Monthly Income Level (Million VND)
Entire Distribution
Figure 2.6: Level of Concern About Poverty by Income Level, 2018
1
3
2
4
Prop
ortio
n of
Res
pond
etns
Con
cern
ed A
bout
Pov
erty
(%)
0-2 20-22 40-42 60-62 80-82 100-150
Individual Monthly Income (Millions of VND)
Notes: This graph shows the estimated percentage of respondents in a given monthly income bracket who said poverty is an important concern that the government should address. The estimates control for other factors that might correlate with income such as region, province, economic sector, gender, or education.

32 PAPI 2018THE VIET NAM PROVINCIAL GOVERNANCE AND PUBLIC ADMINISTRATION PERFORMANCE INDEX
Figure 2.7: Level of Concern About Poverty by Gender, 2018
Notes: This graph shows the estimated percentage of male and female respondents who feel poverty is an important concern that the government should address. The estimates control for other factors that might correlate with income such as region, province, economic sector, income, or education.
45
40
35
30
Prop
ortio
n of
Res
pond
ents
. Female Male .
Respondent Concern for Poverty
Figure 2.8: Citizens’ Perception of Current Rich-Poor Gap in Viet Nam, 2016-2018
21.81
37.40
40.79
22.61
39.5637.83
20.34
45.80
33.87
0
10
20
30
40
50
Perc
enta
ge o
f Res
pond
ents
(%)
2016 2017 2018
Very Narrow/Narrow Neither Large/Very Large
Building on the information presented in Chapter 1 on attitudes towards the economic situation of households and the country, this section assesses attitudes about inequality. In general, as Figure 2.8 shows, a large proportion of respondents did not feel that the current rich-poor gap in Viet Nam is a significant problem. In 2018, there were more respondents who said that the gap was either very narrow or narrow, or neither narrow nor large, than those who said that the gap was large or very large. Furthermore, as Figure 2.9 shows, since 2016 less than 30 percent of respondents have said that current economic inequality is too high. As economic conditions have improved, a declining number of respondents have expressed concern with inequality evels.

IMPORTANT ISSUES IN VIET NAM IN 2018: ECONOMIC, INVIRONMENTAL AND GENDER CONCERNSCHAPTER 2 33
Figure 2.9: Citizens’ Perception of Current Economic Inequality in Viet Nam, 2016-2018
14.73
58.24
27.03
15.34
59.36
25.30
12.71
65.72
21.57
0
20
40
60
80
2016 2017 2018
Current level of economic inequality too low Current level of economic inequality about right
Current level of economic inequality too high
Another important question is how concern about inequality corresponds to income levels. In short, are poorer respondents left behind during the economic growth of recent years more likely to express concern about inequality? Figure 2.10 shows that this is not the case. The relationship between income and concern about inequality is quite weak, and if anything, positively correlated with income. That is,
wealthier respondents seem to be more concerned with inequality than lower-income respondents. Further analysis shows that the factor with the strongest impact on a respondent’s concern with inequality is education; more educated respondents are more likely to express concern than less educated respondents.
Figure 2.10: Concern with Inequality by Income and Education Levels, 2018
10
20
30
40
50
Prop
ortio
n of
Res
pond
ents
(%)
Primary Secondary IncompleteHigh School
CompleteHigh School
SomeCollege
Education Level
10
20
30
40
50
Prop
ortio
n of
Res
pond
ents
(%)
0-2020-40
40-6060-80
80-100
100-150
150-200200+
Individual Monthly Income (Millions of VND)
Notes: This graph shows the estimated percentage of respondents in a given income bracket who feel that the rich-poor gap in Viet Nam is too large, based on question a001d1. The estimates control for other factors that might correlate with income such as region, province, economic sector, gender, or education.

34 PAPI 2018THE VIET NAM PROVINCIAL GOVERNANCE AND PUBLIC ADMINISTRATION PERFORMANCE INDEX
The analysis reveals that although poverty remains the issue of greatest concern, particularly among the poor, the rich-poor gap is less important, even among poorer respondents. This leads to the next question about willingness to pay taxes for wealth redistribution to poorer areas. Provincial transfers help provide increased resources for poorer areas. One might presume that richer respondents, who stand
to gain less from individual or provincial transfers, would be less likely to support the policy of collecting taxes for redistribution through provincial transfers. However, as Figure 2.11 shows, this is decidedly not the case. It is not the poorest respondents who are more supportive of paying more taxes for wealth redistribution from their province to poorer provinces, but rather the wealthier respondents.
Figure 2.11: Support for Paying More Tax for Provincial Wealth Transfers to Poorer Provinces by Income Level, 2018
80
90
100
85
105
95
Supp
ort f
or P
ayin
g M
ore
Taxe
s fo
r Pro
vinc
ial T
rans
fers
(%)
0-2 20-22 40-42 60-62 80-82 100-150
Individual Monthly Income (Millions of VND)
Notes: Graph shows the estimated percentage of respondents in a given income bracket who support transfers of government resources from richer provinces to poorer provinces. The estimates control for other factors that might correlate with income such as region, province, economic sector, gender, or education.
This analysis suggests a complex relationship between concerns about poverty, attitudes towards economic inequality, and wealth redistribution. In short, while those at the lower end of the income scale are more likely to see poverty as an important concern, this does not necessarily translate into similar attitudes about inequality or support for redistributive policies. As the findings show, poorer respondents are no more likely than richer respondents to view inequality as an important concern, nor are they more likely to
see wealth redistribution as a desirable policy. One possible explanation is that poorer respondents are sceptical that increased resources from their taxes to local governments will actually reach poor people in other provinces. Alternatively, poorer respondents might feel that it is unlikely that richer respondents will be targeted to pay for poverty reduction programs, thus lowering the redistributive effects. These potential explanations demand further exploration.

IMPORTANT ISSUES IN VIET NAM IN 2018: ECONOMIC, INVIRONMENTAL AND GENDER CONCERNSCHAPTER 2 35
Environmental Trade-offs
Project Choice
Although there is no conclusive evidence regarding the environmental impacts of business investment, some have argued that the strong salience of environmental problems in Viet Nam today may have prompted citizens to be highly sensitive to the environmental consequences of large investment projects, including both domestic and foreign projects.32 As noted above, the environment remains one of the top five issues of greatest concern for Vietnamese citizens. The damage caused by pollution and climate change are more obvious today than they were four decades ago, when the impacts were seen as more speculative and debatable. This visibility of environmental problems has also risen thanks to increased access to the Internet and use of social media, which allow for the more rapid spread of information about environmental degradation and disasters. In addition, Vietnamese citizens have become more directly exposed to environmental pollution and other environmental problems. Consequently, threats to the environment are increasingly perceived as a fundamental threat to human welfare and health.
To study the salience of environmental consequences in individuals’ economic decision-making in Viet Nam, a conjoint survey experiment, borrowed from marketing research on consumer choice, was employed. Respondents were asked to compare the profiles of two businesses and indicate to which they would rather see their provincial government grant an
32 Despite the large body of scholarship investigating the relationship between FDI and the environment (for a review, see Cole et al. 2017), there is a lack of research on the impact of environmental considerations on mass attitudes towards FDI. Even in the richer literature on individual trade policy preferences, very few studies have examined the impact of environmental aspects on public opinion. There are a few exceptions. Studying Swiss voters’ preferences, Bechtel et al. (2012) detect a negative relationship between citizens’ green preferences and their support for trade liberalization. In contrast, using survey data from Vietnam, Bernauer and Nguyen (2015) find respondents’ reported concern for the environment and individuals’ support for trade liberalization to be positively correlated. In their conjoint analysis of the factors that determine individuals’ evaluation of potential trade partner countries, Spilker et al. (2016) demonstrate that individuals prefer to enter into preferential trade agreements with countries that have strong environmental standards.
investment license. By varying the economic benefits and the environmental costs of the hypothetical businesses, it is possible to observe the influence on individuals’ investment choices of i) economic and environmental considerations, and ii) the particular characteristics of the prospective investors.
A key challenge for policymakers is to understand citizens’ multidimensional preferences that influence their view on a single policy choice. In this case, when a respondent selects a certain investor over another, what are the aspects of the investment project that are important to her choice? Does she care about the nationality of the investor, the industry, the size of the project, or some combination of these? The conjoint framework has proven to be a helpful tool to tease out the underlying multidimensionality of individuals’ policy preferences. In addition, the conjoint survey can help address concerns about social desirability bias in standard surveys, because it provides shielding for respondents. In other words, respondents are less likely to give the answer they think their interviewer wants to hear. This is because instead of simply asking whether respondents think that environmental protection should be prioritized over economic growth, in the conjoint respondents can make a choice (i.e., to select an investor) without having to reveal the motivation behind their choice. The design of the conjoint is summarized in Table 2.1. (A similar but simpler conjoint study was undertaken in 2017.) Nine features of a prospective investment in the respondent’s locality were randomised. These included whether the investing firm: 1) will bring a small (100), medium (1,000), or large (10,000) number of jobs to the respondent’s province; 2) will contribute a small (2 billion VND), medium (20 billion VND), or large (200 billion VND) amount in tax revenues; 3) will generate local income through local sourcing; 4) comes from Viet Nam, a developed, or developing country; 5) is involved in tourism, electronics, or mining; 6) is owned by a private investor or the State; 7) will generate waste equivalent to 100 tons, 300 tons or 1,000 tons; 8) is voluntarily following environmental standards in its operations; and 9) has ever been cited for violating environmental regulations. After being presented with the profiles of two investors, respondents are asked: “Which of these businesses would you most like to see your province grant approval to commence their investment project?”

36 PAPI 2018THE VIET NAM PROVINCIAL GOVERNANCE AND PUBLIC ADMINISTRATION PERFORMANCE INDEX
Table 2.1: Conjoint Investor Profile Options
Attribute Random option 1 Random option 2 Random option 3
National origin Viet Nam Developed foreign investor
Developing foreign investor
Ownership Private State-owned ---
Sector Tourism Electronics Mining
Employment 100 1,000 10,000
Tax Revenue Contribution 2 Billion VND 20 Billion VND 200 Billion VND
Local Sourcing 2 Billion VND 20 Billion VND 200 Billion VND
Past environmental violation
Never been cited Cited for damage to 100 households
Cited for damage to 1,000 households
Waste equivalent to 100 Tons 300 Tons 1,000 Tons
Green certification Possesses a “green certificate,” indicating it is now employing operations that minimize environmental damage
Does not possess a “green certificate,” indicating it has not employed operations that minimize environmental damage
Is applying for a “green certificate,” indicating it will employ operations that minimize environmental damage
To evaluate the effect of the economic and the environmental factors, two additional indexes were generated. The index of economic benefit consists of all the characteristics that refer to the economic benefits the investor will bring to the respondent’s local area, including the number of jobs, and in the 2018 conjoint, the amount of tax revenue as well as the income generated through local sourcing. A value of 0 indicates the lowest economic contribution (i.e., 100 jobs), while 2 is assigned to the highest economic benefit (i.e., 10,000 jobs). Since only one economic attribute was included in the 2017 conjoint (number of jobs), this index is identical to the levels of the jobs dimension. In the 2018 conjoint, the economic benefit index ranges from 0 to 6, where higher values indicate greater economic benefits generated by the investment.
Following the same procedure, an additional index of environmental impact was generated consisting of all the attributes describing the business’ characteristics related to the environment. These include the business’ environmental history, its green certification commitments, and in the 2018 conjoint, the amount of waste the investment project is going to generate annually. Each attribute level is weighted and ranges from 0 to 2—with 0 assigned to the lowest environmental impact level (e.g., business has not violated against environmental regulations in the past) and 2 to the highest impact (e.g., business’ past
violation against environmental regulations caused damage to 1,000 households). The index generated in this way ranges from 0 to 4 in the 2017 conjoint and 0 to 6 in the 2018 conjoint. Lower values on the index indicate lower environmental costs incurred by the investment.
Figure 2.12 presents the regression-based estimates of the influence of the investors’ characteristics on respondents’ willingness to grant an investor license to the applying business. The graph plots the estimated effect of a given value for each investor characteristic on the probability of supporting the allocation of an investor license. The interpretation of each estimate is relative to the reference category for that dimension.
Consistent with the predictions from the economic models, the analysis results show that economic considerations such as job creation or the amount of tax revenues the investment will generate have a significant effect on respondents’ evaluation of an investment project. In particular, the greater the economic benefits that can be expected from the investment, the more likely people are to endorse the business’ investor license application. An investment with the highest economic benefits (i.e., the investment creates 10,000 jobs, 200 billion VND in tax, and local sourcing contributions) is almost 10 percent more likely to receive support than an investment with the lowest level of economic benefit (i.e., the

IMPORTANT ISSUES IN VIET NAM IN 2018: ECONOMIC, INVIRONMENTAL AND GENDER CONCERNSCHAPTER 2 37
investment creates 100 jobs, 2 billion VND in tax, and local sourcing contributions). However, there are no statistically significant differences between each level of economic benefit. In other words, beyond a certain level of economic gains, additional gains resulting from the investment are not likely to significantly increase public support.
However, the results also reveal that environmental considerations have an even stronger effect on people’s evaluation of the attractiveness of an investor’s project, as shown in Figure 2.12. The sizable effect of the environmental aspects is striking. There is a significant stepwise decline in respondents’ willingness to support a business’ investor license application as the environmental impact of the investment increases. With each increase in the
degree of the environmental costs incurred by the investment, there is a statistically significant decrease in citizens’ support for the investment.
To illustrate, an investment project that has the highest level of environmental impact on the respondent’s local area (i.e., the investment generates 1,000 tons of waste, the business is not applying any environmental standards in its operations and has not done so in the past, and has violated environmental regulations causing harm to 1,000 households) has a 56 percent lower chance of receiving support than an investment that has the lowest environmental impact (i.e., the investment generates 100 tons of waste, the business is already applying environmental standards in its operations, and has never violated environmental regulations in the past).
Figure 2.12: Effects of Investor Attributes on Citizens’ Willingness to Support Investor License Applications, 2018
Economic bene�t=0Economic bene�t=1Economic bene�t=2Economic bene�t=3Economic bene�t=4Economic bene�t=5Economic bene�t=6
Environmental impact=0Environmental impact=1Environmental impact=2Environmental impact=3Environmental impact=4Environmental impact=5Environmental impact=6
Vietnamese �rmDeveloped FIE
Developing FIE
PrivateSOE
Vacation resortElectronics
Mining
Economic bene�ts
Environmental impact
National origin
Ownership
Sector
-.7 -.6 -.5 -.4 -.3 -.2 -.1 0 .1 .2 .3
Coe�cient
In sum, the results demonstrate that individuals’ investment policy preferences are more heavily influenced by environmental aspects associated with an investment project than by the economic returns; the larger the environmental costs generated by project, the less likely the respondent is to support
the business’ investor license application. In fact, the environmental impact of the investment has a far stronger effect than the economic benefits associated with the investment, the national origins, or any of the other characteristics of the investor.

38 PAPI 2018THE VIET NAM PROVINCIAL GOVERNANCE AND PUBLIC ADMINISTRATION PERFORMANCE INDEX
Further analysis shows that the preference for investor projects with low environmental impact—even at the expense of economic benefits—cuts across differences in gender, age, education, income, employment sector, and place of residence. Figure
2.13, for example, shows how the stepwise pattern repeats itself among poor, middle-class, and rich respondents, and for respondents working in different economic sectors.
The consistent effect of environmental impact on respondents’ investor preferences across different social groups suggests the critical importance of environmental issues for Vietnamese citizens from all socio-economic groups. It also implies that proper and deliberately participatory environmental planning and impact analysis must become a critical component of the country’s development agenda.
Power Plant Choice
In addition to project choice, another important question is the choice of energy. Energy production impacts both local air pollution and global greenhouse gas emissions. Both environmental issues have important implications for Viet Nam. As a country that produces and consumes coal, local air pollution is a critical concern for citizens in many regions. In addition, Viet Nam is also one of the countries predicted to be most impacted by climate change. According to the 2018 PAPI survey, citizens
were aware of climate change as an important concern. In the survey, 77 percent said they believed the climate is changing, 11 percent said the climate was not changing, and 12 percent said that they did not know if it was changing.
Given these concerns, an important question is the degree to which citizens are willing to pay for renewable energy, which reduces emissions of greenhouse gases compared to use of fossil-fuel sources. Of course, the degree to which citizens are willing to pay for renewables must be balanced by the degree to which citizens want more reliable energy, as renewable sources of energy are often more variable. To answer this question, the 2018 PAPI asked citizens a series of questions designed to estimate how much citizens are willing to pay for energy from coal versus energy from renewables. In order to assess this, the survey first randomly chose an amount of increase in a citizen’s energy bill to fund additional coal plants that would improve the reliability of energy in their area.
Economic bene�t=0Economic bene�t=1Economic bene�t=2Economic bene�t=3Economic bene�t=4Economic bene�t=5Economic bene�t=6
Environmental impact=0Environmental impact=1Environmental impact=2Environmental impact=3Environmental impact=4Environmental impact=5Environmental impact=6
Vietnamese �rmDeveloped FIE
Developing FIE
PrivateSOE
Vacation resortElectronics
Mining
Economic bene�ts
Environmental impact
National origin
Ownership
Sector
-.6 -.55 -.5 -.45 -.4 -.35 -.3 -.25 -.2 -.15 -.1 -.05 0
.05 .1 .15 .2 .25 .3 .35 .4
Low MiddleHigh
-.8 -.75 -.7 -.65 -.6 -.55 -.5 -.45 -.4 -.35 -.3 -.25 -.2 -.15 -.1 -.05 0
.05 .1 .15 .2 .25 .3 .35 .4 .45 .5 .55 .6
Agriculture IndustryServices State
Figure 2.13: Effects of Investor Attributes on Citizens’ Willingness to Support Investor License Applications by Income Strata and Sector, 2018

IMPORTANT ISSUES IN VIET NAM IN 2018: ECONOMIC, INVIRONMENTAL AND GENDER CONCERNSCHAPTER 2 39
Then, to calculate the degree to which citizens value cleaner sources of energy, the survey asked a second question which varied the types of energy and the benefits the energy source would deliver. The question also varied the amount of money the respondent would have to pay through their energy bill.
Table 2.2 shows the different options respondents were presented with. To assess the relative
importance of the power plant type, the type of power generation, and the impact of the environment, four features of the project were varied. First, the power plant types were varied between coal, clean coal, and renewable energy sources. The next aspect that varied was whether the project would reduce power cuts, reduce local air pollution, or reduce greenhouse gas emissions.
Table 2.2: Potential Power Plant Choices
Option Power Type Reduce Power Cuts? Reduce Local Air Pollution?
Reduce Greenhouse Gas Emissions?
1 Coal Yes No No
2 Clean Coal Yes Yes No
3 Renewable Yes Yes No
4 Renewable Yes No Yes
5 Renewable Yes Yes Yes
6 Renewable No Yes Yes
power generation: option 6 would result in reduced greenhouse gas emissions and less local air pollution, but would not reduce power cuts. Respondents were only willing to pay an average of 460,250 VND per month extra for this option. This figure was even lower than clean coal plants (option 2), which would not reduce global greenhouse gas emissions. Citizens were willing to pay 472,120 VND for this option. This suggests that support for renewable energy is contingent on citizen expectations that the renewable energy will also increase energy production.
Figure 2.14 reveals some important findings. First, citizens preferences vary significantly depending on the type of plant. Respondents were far less willing to pay for coal plants, regardless of the purported benefits; the least popular option was clearly coal plants, which might reduce power cuts but would have deleterious impacts on local and global air pollution. For the coal project, respondents were only willing to pay, on average, 294,420 VND per month extra. What is more fascinating is that the next least popular option was renewable plants that did not improve
Figure 2.14: Impact of Power Source on Willingness to Pay for New Power Plants
294.42
460.25 472.12
516.75544.76
562.01
0
200
400
600
Am
ount
in E
xper
imen
tal Q
uest
ion:
1,0
00 V
ND
s
Option 1 Option 6 Option 2 Option 5 Option 4 Option 3

40 PAPI 2018THE VIET NAM PROVINCIAL GOVERNANCE AND PUBLIC ADMINISTRATION PERFORMANCE INDEX
At the upper end, options 3, 4, and 5 were clearly the most popular. Each of these options were for renewable energy plants, though they varied with regards to whether they would improve local pollution, greenhouse gas emissions, or both. Perhaps surprisingly, the option that provided both of the environmental benefits—option 5—was the least popular among the top three, with respondents only willing to pay an average of 516,750 VND for this plant. The most popular was option 3: a renewable energy power plant that would reduce local air pollution and reduce power cuts, but with no mention of a reduction in greenhouse gas emissions. Consistent with the 2017 PAPI report, this seems to indicate that respondents were more sensitive to local air pollution in terms of their support for environmental policies in 2018.
There are several clear takeaways from this analysis. First, Vietnamese citizens are clearly responsive to environmental concerns. They are far more likely to be willing to pay a higher amount for renewable power plants than for either coal or clean coal plants. Second, local air pollution rather than greenhouse gas emissions appears to be the strongest motivating factor. Despite the fact that most Vietnamese accept that climate change is occurring (77 percent), local air pollution impacts decision-making more than concerns about global climate change. Finally, and
perhaps most importantly for policymakers, is the finding that any renewable energy program needs to also address concerns about power reliability. One of the reasons for the need for coal power plants is to meet Viet Nam’s growing energy demand. Citizens are willing to pay for clean alternatives, but those alternatives need to improve reliability in order to win the support of citizens.
Gender Equality Perspective
One additional special topic this report considers is societal support for gender equality, in particular whether citizens are willing to support female leaders. Having women in positions of authority is important for a number of reasons. First, women may have different priorities and attitudes towards governance than men. The previous sections in this chapter show that women are more likely than men to view poverty as an important concern. Men, on the other hand, are more likely to view corruption as an important concern.
Beyond that, annual PAPI reports reveal that female respondents are, in general, more critical of the government than men. Figure 2.15 shows that in 2018, as in previous years, women expressed lower levels of satisfaction with the performance of local governments than men.
Figure 2.15: Assessment of Governance and Public Administration Performance by Gender, 2018
1: P
artic
ipat
ion
at L
ocal
Lev
els
2: T
rans
pare
ncy
in L
ocal
Dec
isio
n-M
akin
g
4: C
ontr
ol o
fCo
rrup
tion
in th
e Pu
blic
Sec
tor
5: P
ublic
Adm
inis
trat
ive
Proc
edur
es
6: P
ublic
Serv
ice
Del
iver
y
7: E
nviro
nmen
tal
Gov
erna
nce
8: E
-Gov
erna
nce
5.64
4.965.41
5.14 5.24
4.60
6.56 6.44
7.45 7.337.10 7.05
4.53 4.38
3.342.96
0
2
4
6
8
Dim
ensi
onal
Sco
res (
Scal
e 1-
10 P
oint
s)
3: V
ertic
alA
ccou
ntab
ility
Male Female

IMPORTANT ISSUES IN VIET NAM IN 2018: ECONOMIC, INVIRONMENTAL AND GENDER CONCERNSCHAPTER 2 41
Land Law encourages both men and women, when they share a household, to have their names on the certificates.
Figure 2.16 shows the change in 2018 from 2017. As the figure indicates, the gap has expanded since 2017, with men nearly 10 percent more likely to have their names on certificates than women nationwide. The difference is particularly pronounced in rural areas, growing from 9 percent to 13 percent. Looking more deeply at the data reveals that an increasing number of women have their names on the certificates, but the higher rate among women has not kept up with the increase among men.
Perhaps as worryingly, women are also less likely to participate in grassroots political institutions. For example, as indicated in Dimension 1, women were less likely to vote in general elections than men. This is consistent with research that shows women are less likely than men to use non-electoral forms of communication with local leaders.33
Finally, women are often in a more vulnerable position with respect to protecting their interests than men. One issue that PAPI tracks is registration of LURCs. Land registration provides individuals with greater protection against land seizures in the event of a dispute or death in the family. In previous years, the PAPI survey uncovered disparities in the degree to which women have their names on LURCs. The 2013
33 See Tsai, Lily and Yiqing Xu (2017).
Figure 2.16: Gender Gap in Land Registration, 2017-2018
77.4
69.8
78.2
72.4
79.5
70.2
7.6 % Di�erence
5.8 % Di�erence9.3 % Di�erence
60
65
70
75
80
Perc
enta
ge o
f Res
pond
ents
(%)
Mal
e
Fem
ale
Urb
anM
ale
Urb
anFe
mal
e
Rura
lM
ale
Rura
lFe
mal
e
2017
82.9
73.4
82.6
75.8
84.3
70.6
9.6 % Di�erence
6.8 % Di�erence
13.7 % Di�erence
60
65
70
75
80
Perc
enta
ge o
f Res
pond
ents
(%)
Mal
e
Fem
ale
Urb
anM
ale
Urb
anFe
mal
e
Rura
lM
ale
Rura
lFe
mal
e
2018
Table 2.3 presents the reasons given by respondents for not having their names on LURCs. In 2018, more women than men said that their names are not registered on LURCs because their spouse’s name is registered, though the proportion of women selecting this answer has been declining. Findings presented in
this table are consistent with an overall increase in the number of women having their names on LURCs, as the rate of women saying that their spouse’s name is registered on LURCs declined over the past three years, from 12.6 percent to 9.3 percent.

42 PAPI 2018THE VIET NAM PROVINCIAL GOVERNANCE AND PUBLIC ADMINISTRATION PERFORMANCE INDEX
Table 2.3: Reasons for Not Having Name on Land Use Rights Certificates (LURCs), 2016-2018
ReasonsMale Female
2016 2017 2018 2016 2017 2018
Parent’s name on LURCs 15.04% 13.21% 10.09% 8.91% 8.23% 7.04%
Not head of household 5.46% 5.76% 3.40% 11.14% 7.93% 8.07%
Spouse’s name on LURCs 1.99% 1.74% 2.23% 12.58% 11.30% 9.34%
Other reasons 1.18% 1.76% 1.11% 3.11% 1.94% 1.81%
Total without name on LURCs 26.67% 22.47% 16.83% 35.74% 29.49% 26.26%
Given these differences in preferences and governance concerns among women compared to men, an important question is the degree to which women are represented in government positions. Although Viet Nam has made strides in achieving gender equality, as this report shows, much work remains to be done.34 Representation in leadership positions can both impact policy and have a role model effect in terms of encouraging more women to become involved in politics.
Most reports on gender equality in leadership positions focus on bias within the Party and the Government. However, there has been less focus on bias within society. To assess the degree to which citizens themselves want female leaders, the 2018 PAPI survey asked whether respondents preferred men, women, or had no preference regarding who should occupy a wide range of positions. The positions listed ranged from village to national level, and included legislative and leadership positions.
Figure 2.17 shows citizens’ preferences for male or female political figures. A large majority of respondents did not express a preference based on gender. However, to the extent that respondents did have a preference, they were more likely to prefer male to female leaders. For instance, 26 percent of
34 See Schuler, Paul (2014).
respondents said they preferred a male village leader to only two percent who preferred a female village leader. What is also clear is that respondents were more biased against women for leadership positions than they are for legislative positions. For instance, respondents were less biased when considering the gender of National Assembly delegates and People’s Council delegates than they were for village leaders, the General Secretary, the Prime Minister, or provincial party chiefs.
Further examination of the data shows additional surprising findings. In particular, in assessing whether men or women express greater bias, it is not men but rather women who were more likely to prefer male leaders to female, as Figure 2.18 shows. As seen in the figure, in 2018 women were more than 30 percent more likely to prefer a male village leader to a woman, while men were only 20 percent more likely. The trend is consistent across different positions.
The analysis above suggests that progress is being made, and that a majority of citizens do not have any preference for male or female leaders. At the same time, the findings also show that a societal bias remains against women in leadership positions, and that (among those who express a preference) this bias is stronger among women than men.

IMPORTANT ISSUES IN VIET NAM IN 2018: ECONOMIC, INVIRONMENTAL AND GENDER CONCERNSCHAPTER 2 43
Figure 2.17: Preference for Men or Women in Political Positions, 2018
Figure 2.18: Proportion Preferring Men in Political Positions by Gender, 2018
0.890.02
0.090.87
0.030.10
0.840.03
0.130.83
0.040.13
0.830.02
0.140.84
0.010.15
0.840.01
0.150.83
0.020.15
0.790.02
0.190.79
0.020.20
0.720.02
0.26
0 .2 .4 .6 .8
National AssemblyDelegate
Provincial People'sCouncil Delegate
CommuneParty Chief
Commune People'sCouncil Delegate
Central CommitteeMember
Commune People'sCommittee Chairperson
Provincial People'sCommittee Chairperson
ProvincialParty Chief
ThePrime Minister
TheGeneral Secretary
Village Chief
Male Better Female Better No Di�erence
10
20
30
40
Line
ar P
redi
ctio
n
Commune People'sCouncil Delegate
VillageHead
CommuneParty Chief
ProvincialParty Chief
PrimeMinister
Male Female

44 PAPI 2018THE VIET NAM PROVINCIAL GOVERNANCE AND PUBLIC ADMINISTRATION PERFORMANCE INDEX
Conclusions and Implications
This chapter has offered a close look at issues of great concern among Vietnamese citizens in 2018 (in addition to their feedback on local governments’ performance in governance and public administration as presented in Chapter 1). It is hoped that the findings provide useful inputs for follow-up policy interventions in each of the areas assessed. The data show that poverty reduction, economic growth, corruption, environmental protection and gender equality remain topical issues for the State and the Government to address in order to maintain progress toward the governance, social and economic development targets the country has set out in its 2011-2020 Socio-Economic Development Strategy and 2030 Sustainable Development Goals, and the aims of its 2021-2030 Socio-Economic Development Strategy.
Findings from this chapter show that despite rapid declines in poverty and improvements in economic conditions, many Vietnamese—particularly those in lower income strata—remain concerned about poverty. As the government continues searching for solutions to poverty reduction and higher economic growth, they should consider the types of policy options citizens would support. The PAPI data show that while there is a high level of support for paying taxes for redistribution of wealth for poverty assistance in poorer provinces, the support is greatest among wealthier and more educated respondents who have more resources and willingness to contribute to further poverty reduction. With 90 percent of the population earning less than 20 million VND per person per month, and a much smaller group of wealthier people, policy on tax-based redistribution should be well articulated and well designed so as to not upset low-income earners.
While poverty remains the issue of greatest concern for many, as this chapter reveals, environmental and gender issues are also of great importance in Viet Nam’s development agendas. Consistent with previous PAPI reports, the findings show that citizens consistently prioritize environmental protection, even at the expense of economic growth. Perhaps due to the increased severity and salience of environmental damage caused by various domestic and foreign investment projects in past years, citizens place a higher priority on the environmental impacts than on the economic benefits of investment projects in their localities. This is also true for citizens’ preferences for renewable energy, as they would support any energy project that reduces air pollution in their locality. However, when asked about their choice of power plants to replace coal power plants, it is clear that citizens are also concerned about the reliability of their power supply. This suggests that while citizens support renewable energy, this must be coupled with secure supply capacity.
Regarding gender equality, while some improvements have been made in more equitable registration of LURCs, more efforts are needed to increase equal opportunities for both women and men to obtain leadership positions. One overlooked aspect of gender equality in political leadership positions concerns potential gender bias amongst citizens. This chapter shows that a majority of citizens do not express a preference for men or women when electing candidates to political leadership positions. Still, a substantial minority express a preference for male candidates, and the greatest bias appears to be on the part of female rather than male respondents. The findings suggest that more work needs to be done to end societal stigma against women occupying certain leadership positions, especially among female voters.

IMPORTANT ISSUES IN VIET NAM IN 2018: ECONOMIC, INVIRONMENTAL AND GENDER CONCERNSCHAPTER 2 45


Overview
This chapter presents an analysis of provincial performance in eight dimensions (areas) of governance and public administration, and in the aggregate 2018 PAPI. Of the eight dimensions, the six core ones are: Participation at Local Levels, Transparency in Local Decision-making, Vertical Accountability, Control of Corruption in the Public Sector, Public Administrative Procedures, and Public Service Delivery. The two new, evolving dimensions are E-Governance and Environmental Governance.
Specifically, this chapter presents provincial performance by indicators, showing how provinces in general performed in 2018. This is followed by a series of maps and dashboards summarizing 2018 performance by dimensions and sub-dimensions, allowing provincial governments to see how they fared compared to their peers with similar socio-economic, geographic and demographic backgrounds. Since major changes were made to the composition of the PAPI in 2018, comparison over time from 2016 to 2018—the first three years of the 2016-2021 government term—is encouraged only for indicators that were kept intact.
Major changes to the 2018 PAPI include three new sub-dimensions added to the composition of the index. Access to Information is a new sub-dimension
in Dimension 2: Transparency in Local Decision-making. The questions used to compose this sub-dimension were tested and validated in the 2017 PAPI survey. The data collected from the 2018 survey now serve as baseline indicators to gauge enforcement of the 2016 Law on Access to Information, which became officially effective from 1 July 2018.
Another new sub-dimension is Local Governments’ Response to Citizens’ Appeals in Dimension 3: Vertical Accountability. The questions used to compose this sub-dimension were tested and validated over time in PAPI starting in 2016, but were constructed differently in 2016 and 2017. In the revised 2018 PAPI, the sub-dimension was reconstructed by pooling together questions about different forms of citizen actions into one major indicator, and by consolidating all questions about usefulness of citizens’ actions into another major indicator. These two indicators now serve as baseline indicators to measure the proactiveness of citizens in calling local governments to account when citizens have concerns about local government-related affairs.
The last new sub-dimension, Access to Justice Services, was also added to Dimension 3. The questions used to compose this sub-dimension were tested and validated in the 2015 Viet Nam Justice Index survey. The data collected from the 2018 PAPI survey now serve as baseline indicators to measure
CHAPTER 32018 PROVINCIAL PERFORMANCE BY DIMENSIONS

48 PAPI 2018THE VIET NAM PROVINCIAL GOVERNANCE AND PUBLIC ADMINISTRATION PERFORMANCE INDEX
the performance of judicial services at the local level. The aim is to inform central and local authorities about how these services work, and to serve as means of verification in the measurement of Sustainable Development Goal 16 on Peace, Justice and Strong Institutions for Viet Nam.
A few minor additions and removals were also made to the composition of the 2018 PAPI. For instance, in Dimension 1 on Participation at Local Levels, questions about terms of offices of some elected representatives were removed and replaced by questions about knowledge of important policies and government leaders in office. In Dimension 4 on Control of Corruption in the Public Sector, the question about knowledge of the Anti-corruption Law is now part of the Dimension 1 indicators. Finally, in Dimension 6 on Public Service Delivery, three new indicators have been added to examine the consistency of electrical supply in homes, and citizens’ assessment of safety when walking alone during the day and night. As the results from the 2018 PAPI surveys reveal, provincial governments need to do much more to satisfy their citizens’ expectations. As Table 3.9 shows, there is a significant disparity between the highest aggregated provincial score of 47.05 points and the potential maximum aggregated score of 80 points (on the scale of 10-80 points for all eight dimensions). This gap suggests that opportunities exist for further reforms and better implementation of policy by local governments as they strive to be more open, transparent, accountable, and responsive, and to act with integrity.
Dimensional results also show that each province has its own strengths and weaknesses; none of the
63 provinces excelled in all eight dimensions. For instance, Lang Son and Bac Giang were in the best performing groups in six out of the eight dimensions. Still, Bac Giang remained in the low-average performing group for the Vertical Accountability dimension. This suggests that no solution is best for all provinces; local governments need to review each indicator to understand where they have performed well and where they need to improve, and then identify relevant solutions for each policy area included in PAPI.
Interestingly, regional patterns have been consistent over time in some dimensions, despite the changes made to the index in 2018. As Maps 3.1-3.8 on dimensional performance in 2018 show, northern provinces tend to do better in the areas of Participation at Local Levels, Transparency in Local Decision-making and Vertical Accountability compared to southern provinces. On the other hand, more southern provinces perform better in the dimension Control of Corruption in the Public Sector. Unlike previous years’ findings, in 2018 there was a more even regional distribution of good performers in the dimensions of Public Administrative Procedures and Public Service Delivery. However, in the two new dimensions, northern provinces tended to perform better in E-Governance but do more poorly in Environmental Governance than their southern peers. Regional differences may suggest areas of focus for government agencies in charge of regional development, such as encouraging provinces within each region to focus on weak areas and/or to exchange information or experiences with provinces in other regions.

2018 PROVINCIAL PERFORMANCE BY DIMENSIONSCHAPTER 3 49
2018 Provincial Performance by Dimensions
Dimension 1: Participation at Local Levels
Participation in political, social, and economic life is the constitutional right of all Vietnamese citizens from the age of 18. Such participation is important for citizens to exercise their democratic rights and to do their part to help improve local governance. The PAPI dimension Participation at Local Levels measures the awareness of citizens about their right to political participation, how they participate in elections and local decision-making, and how local governments facilitate the exercise of citizens’ right to participate.
Below are snapshots of key findings related to provincial performance in engaging citizens at local levels. First, Box 3.1 highlights key findings at the provincial level. Map 3.1 then presents aggregate dimensional scores for all 63 provinces by the four quartiles of best, high-average, low-average, and poor performers. Table 3.1a provides sub-dimensional and indicator results for 2018, and changes over the three years of 2016 to 2018 in indicators that were kept unchanged—so that provinces can understand their scores (position) relative to other provinces. In addition, Table 3.1b presents a dashboard summarizing 2018 provincial performance by four quartiles at both dimensional and sub-dimensional levels.
Box 3.1: Key Findings from Dimension 1: Participation at Local Levels
y Overall, scores for Participation at Local Levels remained at the average level in 2018, as in previous years. There is not a large range in provincial performance scores, with the difference between the highest (6.16 points) and lowest (4.41 points) dimensional scores only 1.75 points (on the 1 to 10-point scale). This implies that all provinces performed at the average level in engaging citizens in local government affairs.
y Northeastern and North Central provinces tend to perform better than southern provinces in enabling citizens’ participation at local levels. In the Voluntary Contribution sub-dimension, there is a more even distribution across the country of good performing provinces compared to the other three sub-dimensions (Civic Knowledge, Participation Opportunities, and Quality of Local Elections).
y Thai Binh was the best performer and Khanh Hoa the poorest in engaging citizens at the local level, based on the aggregated dimensional scores. At the sub-dimensional level, Thai Binh was in the best performing group in all four sub-dimensions (Civic Knowledge, Participation Opportunities, Quality of Local Elections, and Voluntary Contribution). Meanwhile, Hau Giang was in the poorest performing group in all four sub-dimensions.
y The largest differences in provincial performance are found in the Voluntary Contribution sub-dimension; a wide variety of provinces received maximum and minimum scores in almost every indicator measuring the voluntary participation of citizens in local infrastructure projects, including in decision-making, monitoring of project implementation, and through financial and knowledge contributions.
y In a nutshell, priority areas for provinces to address to better engage citizens include providing grassroots election opportunities; improving communication of election results; more frequent direct meetings between elected representatives and citizens; and providing more opportunities for citizens to discuss, design and oversee grassroots infrastructure development projects.

50 PAPI 2018THE VIET NAM PROVINCIAL GOVERNANCE AND PUBLIC ADMINISTRATION PERFORMANCE INDEX
Map 3.1: Provincial Performance in Citizen Participation at Local Levels by Quartiles, 2018
Citizen Participation at Local Levels
Best Performers
High Average
Low Average
Poor Performers

2018 PROVINCIAL PERFORMANCE BY DIMENSIONSCHAPTER 3 51
Tabl
e 3.
1a: C
itiz
en P
arti
cipa
tion
at L
ocal
Lev
els
(Dim
ensi
on 1
): Re
sult
s by
Indi
cato
rs in
201
8 an
d fr
om 2
016
to 2
018
Dim
ensi
on a
nd
Sub-
Dim
ensi
ons
Nam
e of
Indi
cato
rSc
ale
Nat
iona
l Mea
n O
ver T
ime
Prov
inci
al 2
018
PAPI
Sco
re R
ange
on 1
-10
Poin
t Sca
leM
inM
axPA
PI 2
016
PAPI
201
7PA
PI 2
018*
Stat
usSc
ores
Tota
l Dim
ensi
onD
imen
sion
1: P
arti
cipa
tion
at L
ocal
Le
vels
110
5.15
5.18
5.19
Min
imum
4.41
Med
ian
5.36
Max
imum
6.16
Sub-
Dim
ensi
on 1
Civi
c Kn
owle
dge*
0.25
2.5
1.01
0.96
1.04
Min
imum
0.77
Med
ian
1.10
Max
imum
1.41
Sub-
Dim
ensi
on 2
Part
icip
atio
n O
ppor
tuni
ties*
0.25
2.5
1.80
1.70
1.52
Min
imum
1.32
Med
ian
1.58
Max
imum
1.78
Sub-
Dim
ensi
on 3
Qua
lity
of Lo
cal E
lect
ions
2.5
1.43
1.50
1.53
Min
imum
1.17
0.25
Med
ian
1.60
Max
imum
1.86
Sub-
Dim
ensi
on 4
Volu
ntar
y Co
ntrib
utio
ns2.
50.
891.
021.
11M
inim
um0.
610.
25M
edia
n1.
10M
axim
um1.
50
S1. C
ivic
Kno
wle
dge
Know
ledg
e of
Pol
icy*
0%10
0%58
.46%
Min
imum
33.3
3%M
edia
n62
.28%
Max
imum
85.0
9%
Know
ledg
e of
Lea
ders
(%)*
40.7
3%M
inim
um22
.30%
Med
ian
44.5
1%M
axim
um68
.77%
S2. O
ppor
tuni
ties
for
Part
icip
atio
n
Part
icip
ated
in F
orm
al A
ssoc
iatio
ns*
52.5
4%M
inim
um29
.53%
0%10
0%M
edia
n62
.42%
Max
imum
82.0
3%
Part
icip
ated
in In
form
al A
ssoc
iatio
ns*
16.7
6%M
inim
um8.
05%
0%10
0%M
edia
n17
.90%
Max
imum
47.6
0%
Vote
d in
Las
t Com
mun
e Pe
ople
’s Co
unci
l El
ectio
n (%
)0%
100%
65.1
0%57
.62%
58.8
0%M
inim
um39
.51%
Med
ian
62.3
4%M
axim
um78
.74%
Vote
d in
Las
t Nat
iona
l Ass
embl
y El
ectio
n (%
)0%
100%
67.0
2%53
.98%
54.3
7%M
inim
um37
.22%
Med
ian
55.8
3%M
axim
um73
.04%
Villa
ge H
ead
Elec
ted
(%)
0%10
0%77
.87%
77.9
6%86
.25%
Min
imum
72.9
4%M
edia
n88
.46%
Max
imum
97.2
8%
Part
icip
ated
in V
illag
e H
ead
Elec
tion
(%)
0%10
0%60
.15%
62%
67.5
5%M
inim
um48
.30%
Med
ian
66.7
4%M
axim
um87
.94%
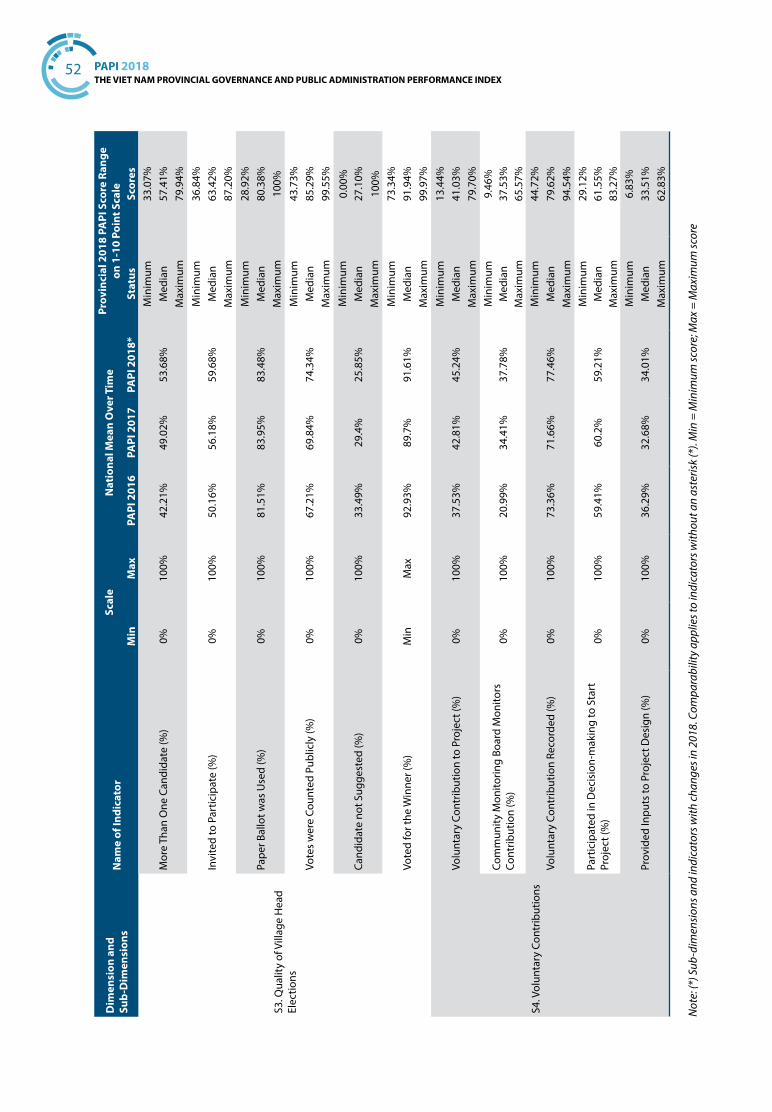
52 PAPI 2018THE VIET NAM PROVINCIAL GOVERNANCE AND PUBLIC ADMINISTRATION PERFORMANCE INDEX
Dim
ensi
on a
nd
Sub-
Dim
ensi
ons
Nam
e of
Indi
cato
rSc
ale
Nat
iona
l Mea
n O
ver T
ime
Prov
inci
al 2
018
PAPI
Sco
re R
ange
on 1
-10
Poin
t Sca
leM
inM
axPA
PI 2
016
PAPI
201
7PA
PI 2
018*
Stat
usSc
ores
S3. Q
ualit
y of
Vill
age
Hea
d El
ectio
ns
Mor
e Th
an O
ne C
andi
date
(%)
42.2
1%49
.02%
53.6
8%M
inim
um33
.07%
0%10
0%M
edia
n57
.41%
Max
imum
79.9
4%
Invi
ted
to P
artic
ipat
e (%
)50
.16%
56.1
8%59
.68%
Min
imum
36.8
4%0%
100%
Med
ian
63.4
2%M
axim
um87
.20%
Pape
r Bal
lot w
as U
sed
(%)
81.5
1%83
.95%
83.4
8%M
inim
um28
.92%
0%10
0%M
edia
n80
.38%
Max
imum
100%
Vote
s w
ere
Coun
ted
Publ
icly
(%)
67.2
1%69
.84%
74.3
4%M
inim
um43
.73%
0%10
0%M
edia
n85
.29%
Max
imum
99.5
5%
Cand
idat
e no
t Sug
gest
ed (%
)33
.49%
29.4
%25
.85%
Min
imum
0.00
%0%
100%
Med
ian
27.1
0%M
axim
um10
0%
Vote
d fo
r the
Win
ner (
%)
92.9
3%89
.7%
91.6
1%M
inim
um73
.34%
Min
Max
Med
ian
91.9
4%M
axim
um99
.97%
S4. V
olun
tary
Con
trib
utio
ns
Volu
ntar
y Co
ntrib
utio
n to
Pro
ject
(%)
37.5
3%42
.81%
45.2
4%M
inim
um13
.44%
0%10
0%M
edia
n41
.03%
Max
imum
79.7
0%
Com
mun
ity M
onito
ring
Boar
d M
onito
rs
Cont
ribut
ion
(%)
0%10
0%20
.99%
34.4
1%37
.78%
Min
imum
9.46
%M
edia
n37
.53%
Max
imum
65.5
7%
Volu
ntar
y Co
ntrib
utio
n Re
cord
ed (%
)73
.36%
71.6
6%77
.46%
Min
imum
44.7
2%0%
100%
Med
ian
79.6
2%M
axim
um94
.54%
Part
icip
ated
in D
ecis
ion-
mak
ing
to S
tart
Pr
ojec
t (%
)0%
100%
59.4
1%60
.2%
59.2
1%M
inim
um29
.12%
Med
ian
61.5
5%M
axim
um83
.27%
Prov
ided
Inpu
ts to
Pro
ject
Des
ign
(%)
36.2
9%32
.68%
34.0
1%M
inim
um6.
83%
0%10
0%M
edia
n33
.51%
Max
imum
62.8
3%
Not
e: (*
) Sub
-dim
ensi
ons a
nd in
dica
tors
with
cha
nges
in 2
018.
Com
para
bilit
y ap
plie
s to
indi
cato
rs w
ithou
t an
aste
risk
(*).
Min
= M
inim
um sc
ore;
Max
= M
axim
um sc
ore
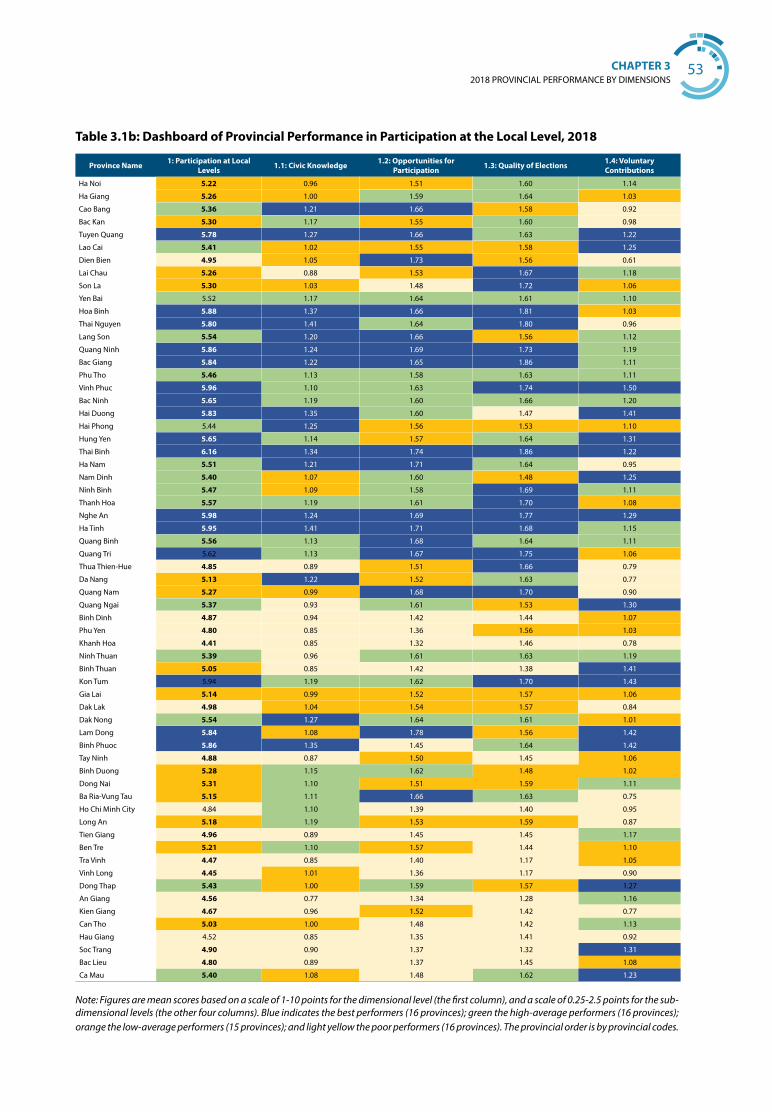
2018 PROVINCIAL PERFORMANCE BY DIMENSIONSCHAPTER 3 53
Table 3.1b: Dashboard of Provincial Performance in Participation at the Local Level, 2018
Province Name 1: Participation at Local Levels 1.1: Civic Knowledge 1.2: Opportunities for
Participation 1.3: Quality of Elections 1.4: Voluntary Contributions
Ha Noi 5.22 0.96 1.51 1.60 1.14
Ha Giang 5.26 1.00 1.59 1.64 1.03
Cao Bang 5.36 1.21 1.66 1.58 0.92
Bac Kan 5.30 1.17 1.55 1.60 0.98
Tuyen Quang 5.78 1.27 1.66 1.63 1.22
Lao Cai 5.41 1.02 1.55 1.58 1.25
Dien Bien 4.95 1.05 1.73 1.56 0.61
Lai Chau 5.26 0.88 1.53 1.67 1.18
Son La 5.30 1.03 1.48 1.72 1.06
Yen Bai 5.52 1.17 1.64 1.61 1.10
Hoa Binh 5.88 1.37 1.66 1.81 1.03
Thai Nguyen 5.80 1.41 1.64 1.80 0.96
Lang Son 5.54 1.20 1.66 1.56 1.12
Quang Ninh 5.86 1.24 1.69 1.73 1.19
Bac Giang 5.84 1.22 1.65 1.86 1.11
Phu Tho 5.46 1.13 1.58 1.63 1.11
Vinh Phuc 5.96 1.10 1.63 1.74 1.50
Bac Ninh 5.65 1.19 1.60 1.66 1.20
Hai Duong 5.83 1.35 1.60 1.47 1.41
Hai Phong 5.44 1.25 1.56 1.53 1.10
Hung Yen 5.65 1.14 1.57 1.64 1.31
Thai Binh 6.16 1.34 1.74 1.86 1.22
Ha Nam 5.51 1.21 1.71 1.64 0.95
Nam Dinh 5.40 1.07 1.60 1.48 1.25
Ninh Binh 5.47 1.09 1.58 1.69 1.11
Thanh Hoa 5.57 1.19 1.61 1.70 1.08
Nghe An 5.98 1.24 1.69 1.77 1.29
Ha Tinh 5.95 1.41 1.71 1.68 1.15
Quang Binh 5.56 1.13 1.68 1.64 1.11
Quang Tri 5.62 1.13 1.67 1.75 1.06
Thua Thien-Hue 4.85 0.89 1.51 1.66 0.79
Da Nang 5.13 1.22 1.52 1.63 0.77
Quang Nam 5.27 0.99 1.68 1.70 0.90
Quang Ngai 5.37 0.93 1.61 1.53 1.30
Binh Dinh 4.87 0.94 1.42 1.44 1.07
Phu Yen 4.80 0.85 1.36 1.56 1.03
Khanh Hoa 4.41 0.85 1.32 1.46 0.78
Ninh Thuan 5.39 0.96 1.61 1.63 1.19
Binh Thuan 5.05 0.85 1.42 1.38 1.41
Kon Tum 5.94 1.19 1.62 1.70 1.43
Gia Lai 5.14 0.99 1.52 1.57 1.06
Dak Lak 4.98 1.04 1.54 1.57 0.84
Dak Nong 5.54 1.27 1.64 1.61 1.01
Lam Dong 5.84 1.08 1.78 1.56 1.42
Binh Phuoc 5.86 1.35 1.45 1.64 1.42
Tay Ninh 4.88 0.87 1.50 1.45 1.06
Binh Duong 5.28 1.15 1.62 1.48 1.02
Dong Nai 5.31 1.10 1.51 1.59 1.11
Ba Ria-Vung Tau 5.15 1.11 1.66 1.63 0.75
Ho Chi Minh City 4.84 1.10 1.39 1.40 0.95
Long An 5.18 1.19 1.53 1.59 0.87
Tien Giang 4.96 0.89 1.45 1.45 1.17
Ben Tre 5.21 1.10 1.57 1.44 1.10
Tra Vinh 4.47 0.85 1.40 1.17 1.05
Vinh Long 4.45 1.01 1.36 1.17 0.90
Dong Thap 5.43 1.00 1.59 1.57 1.27
An Giang 4.56 0.77 1.34 1.28 1.16
Kien Giang 4.67 0.96 1.52 1.42 0.77
Can Tho 5.03 1.00 1.48 1.42 1.13
Hau Giang 4.52 0.85 1.35 1.41 0.92
Soc Trang 4.90 0.90 1.37 1.32 1.31
Bac Lieu 4.80 0.89 1.37 1.45 1.08
Ca Mau 5.40 1.08 1.48 1.62 1.23
Note: Figures are mean scores based on a scale of 1-10 points for the dimensional level (the first column), and a scale of 0.25-2.5 points for the sub-dimensional levels (the other four columns). Blue indicates the best performers (16 provinces); green the high-average performers (16 provinces); orange the low-average performers (15 provinces); and light yellow the poor performers (16 provinces). The provincial order is by provincial codes.

54 PAPI 2018THE VIET NAM PROVINCIAL GOVERNANCE AND PUBLIC ADMINISTRATION PERFORMANCE INDEX
Dimension 2: Transparency in Local Decision-making
PAPI measures how local governments facilitate access to government information and respond to civic rights, in order to better understand how public policies affect citizens’ lives and livelihoods. The focus of the second dimension of PAPI is Transparency of Local Decision-making, as measured in the four sub-dimensional areas of Access to Information, Poverty Lists (listings of poor households), Commune Budget and Expenditure Lists, and Local Land Use Planning and Pricing. Information about government policy and any matter relating to poverty, budgets and land is required to be transparent and made publicly available so that citizens across the country can exercise their legitimate rights to know, to discuss, to do, and to verify—as stipulated by the 2007 Grassroots Democracy Ordinance and legislation like the 2013 Land Law, the 2015 State Budget Law, and the 2016 Law on Access to Information.
Below are snapshots of key findings about provincial performance related to transparency in local decision-making for all citizens. First, Box 3.2 highlights key findings at the provincial level. Map 3.2 then presents aggregate dimensional scores for provinces with validated data35 by the four quartiles. Table 3.2a provides sub-dimensional and indicator results for 2018 and changes over the three years from 2016 to 2018 in indicators that were kept unchanged. In addition, Table 3.2b presents a dashboard of 2018 provincial performance by four quartiles at both the dimensional and sub-dimensional levels. Comparing aggregate sub-dimensional scores in this dimension over time is not advised. This is because the dimension has been restructured and rescaled to accommodate the new sub-dimension Access to Information from 2018, which provides baselines to measure the effectiveness of the 2016 Law on Access to Information that came into effect from 1 July 2018. Additionally, Figure 3.2 presents findings for the sources of information on state policy most commonly used by citizens.
35 Data from two provinces in this dimension were not used due to significant biases as a result of priming effects.
Box 3.2: Key Findings from Dimension 2: Transparency in Local Decision-making
y Overall, dimensional scores for transparency in local decision-making were sửa thành at an average level in 2018, with provincial scores ranging from 4.55 to 6 points (on the 1 to 10-point scale). The gap is small between the best performing and the worst performing provinces, implying that all provinces performed at the average level in transparency in local decision-making. In particular, the aggregate sub-dimensional score for the new Access to Information sub-dimension was only 0.81 points on the scale of 0.25 to 2.5 points, and therefore it contributed the least to the overall dimension score. The next lowest score was in the sub-dimension Land Use Plans and Price Frames with an aggregate score of 1.34 points on the same scale.
y Northern provinces tend to perform better than southern provinces in subD-dimensions of Access to Information, Poverty Lists, and Commune Budgets and Expenditures. In the Transparency in Land Use Planning/Pricing sub-dimension, there was a more even distribution in 2018 of good performing provinces across the country.
y At the dimensional level, Thai Nguyen was the best performer while Hau Giang was the poorest performer. At the sub-dimensional level, Da Nang scored highest in the Access to Information sub-dimension, Nam Dinh in the Poverty List Transparency sub-dimension, Lang Son in the Commune Budgets and Expenditures sub-dimension, and Thai Binh in the Land Use Plan and Price Frames Transparency sub-dimension.
y The new sub-dimension Access to Information reveals several findings that are worth highlighting. Very few respondents across all provinces said that they search for information about state policy (14 percent). Nearly 12 percent of those who did search said they found what they looked for, and of these, 12.5 percent found the information useful. Almost no respondents in Ha Giang found the information they found useful, while the proportion in Thai Nguyen was 27.5 percent.
y Priority areas for all provinces to address to improve transparency include all four sub-dimensions, but more focus should be placed on providing access to reliable and useful information about government policy in a timely manner. Also, further disclosure of local land plans to the public, adequate consultation with citizens about land planning, and ensuring fair compensation for land seizure through regular reviews and public consultation of land compensation prices will help provinces better meet citizens’ rising expectations for transparency.
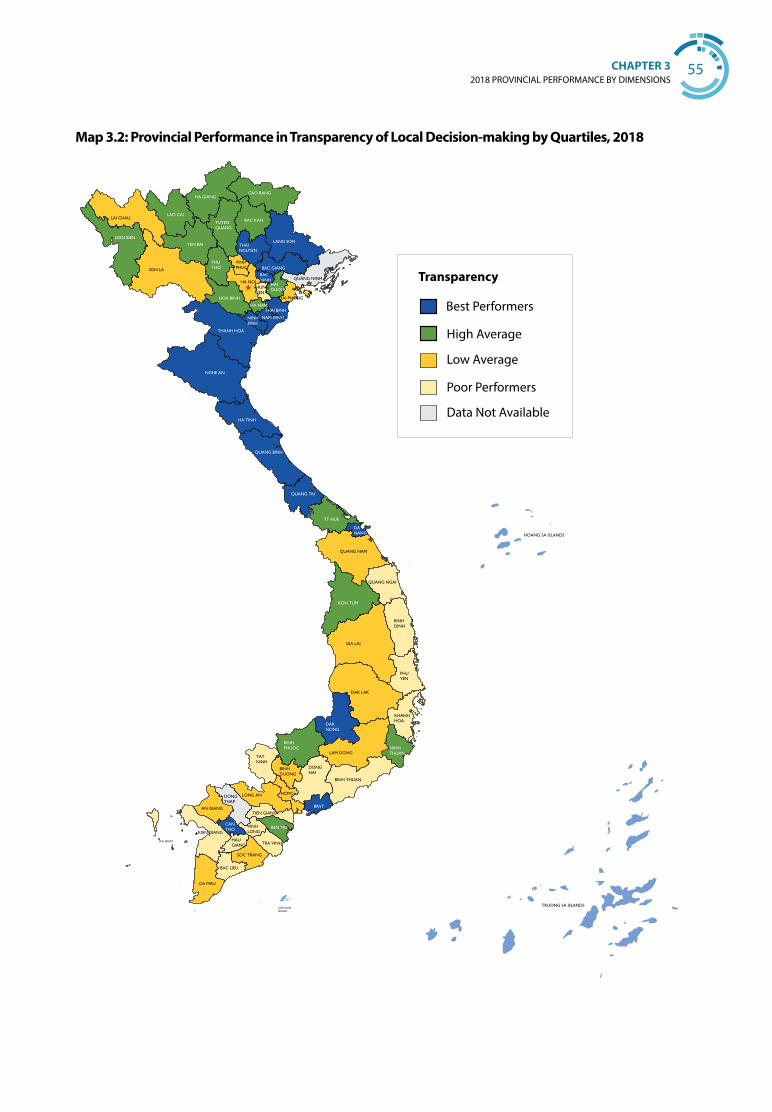
2018 PROVINCIAL PERFORMANCE BY DIMENSIONSCHAPTER 3 55
Transparency
Best Performers
High Average
Low Average
Poor Performers
Data Not Available
Map 3.2: Provincial Performance in Transparency of Local Decision-making by Quartiles, 2018

56 PAPI 2018THE VIET NAM PROVINCIAL GOVERNANCE AND PUBLIC ADMINISTRATION PERFORMANCE INDEX
Tabl
e 3.
2a: T
rans
pare
ncy
(Dim
ensi
on 2
): Re
sult
s by
Indi
cato
rs in
201
8 an
d fr
om 2
016
to 2
018
Dim
ensi
on a
nd S
ub-
Dim
ensi
ons
Nam
e of
Indi
cato
rSc
ale
Nat
iona
l Mea
ns O
ver T
ime
(201
6-20
18)
Prov
inci
al P
API
201
8 Sc
ore
Rang
eon
1-1
0 Po
int S
cale
Min
Max
PAPI
201
6PA
PI 2
017
PAPI
201
8*St
atus
Scor
es
Tota
l Dim
ensi
onD
imen
sion
2: T
rans
pare
ncy
of L
ocal
D
ecis
ion-
mak
ing
110
5.55
5.68
5.19
Min
imum
4.55
Med
ian
5.26
Max
imum
6.00
Sub-
Dim
ensi
on 1
Acce
ss to
Info
rmat
ion
0.25
2.5
0.81
Min
imum
0.67
Med
ian
0.81
Max
imum
1.05
Sub-
Dim
ensi
on 2
Pove
rty
List
s^2.
142.
171.
70
Min
imum
1.41
0.25
2.5
Med
ian
1.74
Max
imum
1.99
Sub-
Dim
ensi
on 3
Com
mun
e Bu
dget
s^1.
681.
741.
35
Min
imum
1.16
0.25
2.5
Med
ian
1.37
Max
imum
1.67
Sub-
Dim
ensi
on 4
Land
Use
Pla
nnin
g/Pr
icin
g^1.
721.
771.
34
Min
imum
1.11
0.25
2.5
Med
ian
1.34
Max
imum
1.48
S1. A
cces
s to
In
form
atio
n
Sear
ched
for I
nfor
mat
ion
abou
t Sta
te
Polic
y an
d Le
gisl
atio
n (%
)0%
100%
14.0
5%
Min
imum
5.58
%
Med
ian
15.6
7%
Max
imum
28.9
3%
Rece
ived
Info
rmat
ion
Nee
ded
abou
t Sta
te
Polic
y an
d Le
gisl
atio
n (%
)0%
100%
11.8
3%
Min
imum
3.05
%
Med
ian
12.4
7%
Max
imum
27.7
2%
Info
rmat
ion
Rece
ived
Use
ful (
%)
0%10
0%12
.64%
Min
imum
5.46
%
Med
ian
14.1
7%
Max
imum
27.5
1%
Info
rmat
ion
Rece
ived
Rel
iabl
e (%
)0%
100%
12.5
9%
Min
imum
4.46
%
Med
ian
13.4
3%
Max
imum
28.9
3%

2018 PROVINCIAL PERFORMANCE BY DIMENSIONSCHAPTER 3 57
Dim
ensi
on a
nd S
ub-
Dim
ensi
ons
Nam
e of
Indi
cato
rSc
ale
Nat
iona
l Mea
ns O
ver T
ime
(201
6-20
18)
Prov
inci
al P
API
201
8 Sc
ore
Rang
eon
1-1
0 Po
int S
cale
Min
Max
PAPI
201
6PA
PI 2
017
PAPI
201
8*St
atus
Scor
es
Did
not
Pay
a B
ribe
for t
he In
form
atio
n (%
)0%
100%
97.1
8%
Min
imum
82.2
9%
Med
ian
100%
Max
imum
100%
Long
Wai
ting
Tim
e fo
r Inf
orm
atio
n (%
D
isag
reem
ent)
0%10
0%99
.73%
Min
imum
97.4
9%
Med
ian
99.9
0%
Max
imum
100.
00%
S2. P
over
ty L
ists
Pove
rty
List
Pub
lishe
d in
Las
t 12
Mon
ths
0%10
0%53
.63%
54.1
4%61
.52%
Min
imum
35.9
0%
Med
ian
65.8
3%
Max
imum
90.8
9%
Type
1 E
rror
s on
Pov
erty
Lis
t (%
Dis
agre
e)0%
38
.92%
36.2
7%35
.12%
Min
imum
17.5
1%
100%
Med
ian
35.3
1%
Max
imum
55.8
2%
Type
2 E
rror
s on
Pov
erty
Lis
t (%
Dis
agre
e)0%
38
.90%
38.6
7%35
.25%
Min
imum
19.5
6%
100%
Med
ian
36.3
4%
Max
imum
61.0
1%
S3. C
omm
une
Budg
ets
Com
mun
e Bu
dget
is M
ade
Avai
labl
e (%
)0%
32.1
7%36
.04%
40.9
8%
Min
imum
20.9
7%
100%
Med
ian
44.4
5%
Max
imum
83.3
4%
Resp
onde
nt R
ead
Com
mun
e Bu
dget
(%)
0%10
0%32
.18%
31.2
9%27
.65%
Min
imum
12.1
3%
Med
ian
28.4
9%
Max
imum
46.8
8%
Belie
ve in
Acc
urac
y of
Bud
get (
%)
0%69
.08%
70.6
6%75
.88%
Min
imum
55.8
2%
100%
Med
ian
74.2
7%
Max
imum
92.0
1%

58 PAPI 2018THE VIET NAM PROVINCIAL GOVERNANCE AND PUBLIC ADMINISTRATION PERFORMANCE INDEX
Dim
ensi
on a
nd S
ub-
Dim
ensi
ons
Nam
e of
Indi
cato
rSc
ale
Nat
iona
l Mea
ns O
ver T
ime
(201
6-20
18)
Prov
inci
al P
API
201
8 Sc
ore
Rang
eon
1-1
0 Po
int S
cale
Min
Max
PAPI
201
6PA
PI 2
017
PAPI
201
8*St
atus
Scor
es
S4. L
and-
Use
Pl
anni
ng/P
ricin
g
Awar
e of
Loc
al L
and
Plan
s (%
)0%
13.6
2%15
.19%
18.3
9%M
inim
um4.
59%
100%
Med
ian
18.6
0%
Max
imum
37.6
5%
Com
men
t on
Loca
l Lan
d Pl
ans
(%)
0%4.
20%
4.49
%5.
44%
Min
imum
0.19
%
100%
Med
ian
4.96
%
Max
imum
12.8
4%
Land
Pla
n Ac
know
ledg
es C
itize
n Co
ncer
ns
(%)
0%88
.86%
85.8
4%88
.07%
Min
imum
45.5
1%
100%
Med
ian
88.9
8%
Max
imum
100%
Impa
ct o
f Lan
d Pl
an o
n Yo
ur F
amily
(1
=no
impa
ct; 2
=hur
t my
fam
ily/v
illag
ers;
3=
Bene
ficia
l)1
32.
092.
222.
17
Min
imum
1.87
Med
ian
2.14
Max
imum
2.45
Did
not
Los
e La
nd a
s a
Resu
lt of
Lan
d Pl
an0%
83.4
4%86
.36%
86.3
0%
Min
imum
64.3
8%
100%
Med
ian
85.8
2%
Max
imum
96.3
0%
Com
pens
atio
n Cl
ose
to M
arke
t Val
ue (%
)0%
29.2
9%35
.66%
32.6
6%
Min
imum
0%
100%
Med
ian
28.7
4%
Max
imum
68.0
3%
Info
rmed
of L
and
Usa
ge (%
)0%
100%
78.2
6%73
.67%
82.8
7%
Min
imum
0%
Med
ian
87.3
0%
Max
imum
100%
Land
Use
d fo
r Orig
inal
Pur
pose
(%)
0%10
0%85
.18%
85.7
7%85
.04%
Min
imum
0%
Med
ian
90.1
6%
Max
imum
100%
Know
Whe
re to
go
to G
et L
and
Pric
e In
form
atio
n (%
)0%
100%
47.7
8%51
.9%
54.0
1%
Min
imum
37.3
9%
Med
ian
55.1
5%
Max
imum
76.0
6%
Not
e: (*
) Sub
-dim
ensi
ons a
nd in
dica
tors
with
cha
nges
in 2
018.
Com
para
bilit
y ap
plie
s for
indi
cato
rs w
ithou
t an
aste
risk
(*).
Min
= M
inim
um sc
ore;
Max
= M
axim
um sc
ore.
(^
) Cha
nges
mad
e to
scal
ing
stru
ctur
es fr
om 0
.33-
3.33
to 0
.25-
2.5
per d
imen
sion
.
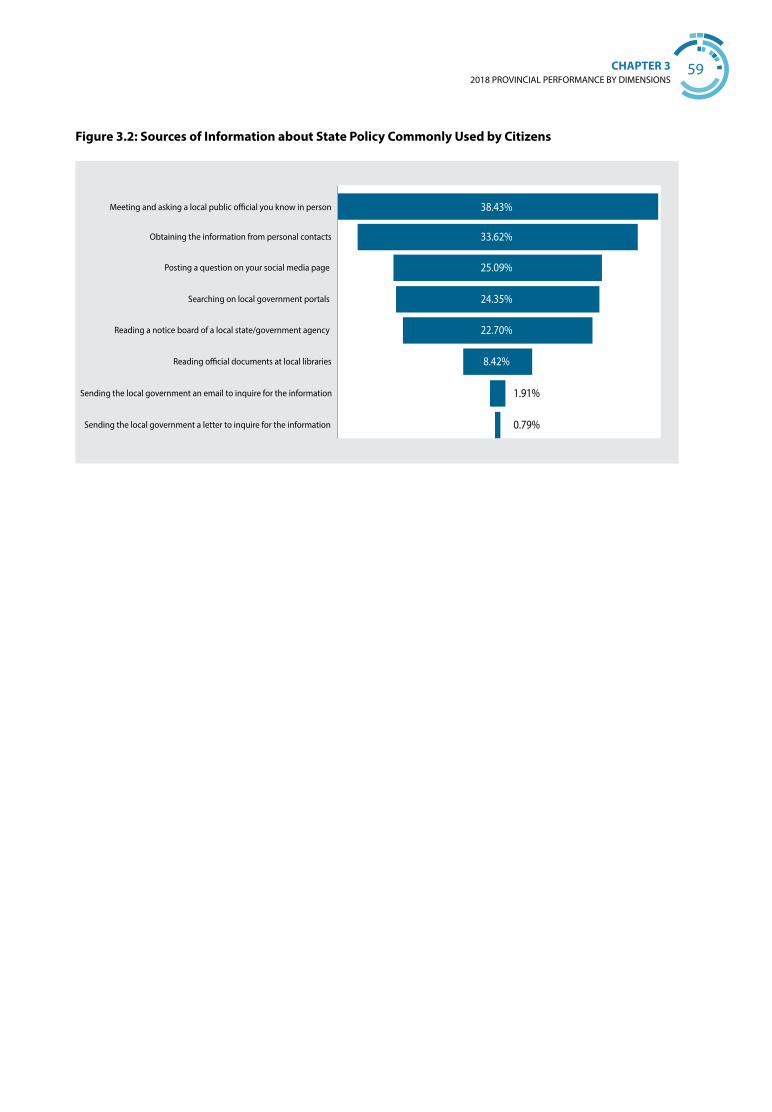
2018 PROVINCIAL PERFORMANCE BY DIMENSIONSCHAPTER 3 59
38.43%
33.62%
25.09%
24.35%
22.70%
8.42%
1.91%
0.79%
Meeting and asking a local public o�cial you know in person
Obtaining the information from personal contacts
Posting a question on your social media page
Searching on local government portals
Reading a notice board of a local state/government agency
Reading o�cial documents at local libraries
Sending the local government an email to inquire for the information
Sending the local government a letter to inquire for the information
Figure 3.2: Sources of Information about State Policy Commonly Used by Citizens

60 PAPI 2018THE VIET NAM PROVINCIAL GOVERNANCE AND PUBLIC ADMINISTRATION PERFORMANCE INDEX
Table 3.2b: Dashboard of Provincial Performance in Transparency of Local Decision-making, 2018
Province Name 2: Transparency of Local Decision-making
2.1: Access to Information
2.2: Transparency in Poverty Lists
2.3: Transparency in Communal Budgets
2.4: Transparency in Land Use Plan/Pricing
Ha Noi 5.09 0.78 1.72 1.29 1.29
Ha Giang 5.35 0.93 1.70 1.41 1.30
Cao Bang 5.29 0.85 1.73 1.40 1.31
Bac Kan 5.37 0.82 1.78 1.36 1.40
Tuyen Quang 5.37 0.91 1.73 1.41 1.33
Lao Cai 5.45 0.87 1.87 1.41 1.30
Dien Bien 5.40 0.88 1.85 1.42 1.24
Lai Chau 5.23 0.99 1.55 1.45 1.24
Son La 5.16 0.85 1.74 1.31 1.27
Yen Bai 5.26 0.94 1.66 1.27 1.38
Hoa Binh 5.42 0.94 1.86 1.32 1.30
Thai Nguyen 6.00 1.02 1.97 1.61 1.39
Lang Son 5.85 0.98 1.83 1.67 1.38
Quang Ninh n.a n.a n.a n.a n.a
Bac Giang 5.76 0.95 1.85 1.57 1.39
Phu Tho 5.41 0.81 1.92 1.34 1.35
Vinh Phuc 5.16 0.77 1.75 1.30 1.34
Bac Ninh 5.52 0.90 1.85 1.39 1.37
Hai Duong 5.34 0.79 1.87 1.34 1.34
Hai Phong 5.08 0.85 1.70 1.36 1.17
Hung Yen 4.97 0.71 1.60 1.33 1.33
Thai Binh 5.74 0.93 1.75 1.57 1.48
Ha Nam 5.35 0.89 1.76 1.35 1.36
Nam Dinh 5.63 0.81 1.99 1.46 1.38
Ninh Binh 5.55 0.78 1.92 1.49 1.37
Thanh Hoa 5.70 0.89 1.95 1.48 1.39
Nghe An 5.67 0.96 1.82 1.44 1.45
Ha Tinh 5.68 1.01 1.82 1.40 1.44
Quang Binh 5.71 0.92 1.89 1.47 1.42
Quang Tri 5.53 0.91 1.77 1.46 1.39
Thua Thien-Hue 5.40 0.81 1.83 1.48 1.28
Da Nang 5.65 1.05 1.79 1.42 1.39
Quang Nam 5.05 0.81 1.54 1.30 1.40
Quang Ngai 4.82 0.72 1.70 1.18 1.22
Binh Dinh 4.83 0.72 1.67 1.20 1.24
Phu Yen 4.93 0.74 1.58 1.22 1.40
Khanh Hoa 4.59 0.75 1.52 1.21 1.11
Ninh Thuan 5.36 0.80 1.74 1.37 1.45
Binh Thuan 4.64 0.75 1.43 1.22 1.24
Kon Tum 5.26 0.79 1.63 1.42 1.41
Gia Lai 5.20 0.89 1.60 1.37 1.33
Dak Lak 5.10 0.81 1.62 1.35 1.33
Dak Nong 5.53 0.92 1.78 1.50 1.33
Lam Dong 5.04 0.88 1.50 1.45 1.21
Binh Phuoc 5.38 0.88 1.76 1.47 1.27
Tay Ninh 4.79 0.71 1.60 1.24 1.24
Binh Duong 5.23 0.78 1.84 1.43 1.19
Dong Nai 4.88 0.80 1.53 1.27 1.27
Ba Ria-Vung Tau 5.63 0.88 1.91 1.40 1.43
Ho Chi Minh City 5.23 0.77 1.76 1.40 1.29
Long An 5.11 0.73 1.75 1.28 1.35
Tien Giang 4.80 0.71 1.50 1.18 1.41
Ben Tre 5.50 0.76 1.93 1.48 1.33
Tra Vinh 4.65 0.77 1.41 1.16 1.31
Vinh Long 5.02 0.81 1.67 1.23 1.30
Dong Thap n.a n.a n.a n.a n.a
An Giang 5.15 0.75 1.68 1.32 1.40
Kien Giang 4.87 0.81 1.46 1.26 1.34
Can Tho 5.53 0.85 1.79 1.42 1.47
Hau Giang 4.55 0.67 1.47 1.16 1.25
Soc Trang 5.02 0.80 1.52 1.35 1.36
Bac Lieu 4.66 0.72 1.46 1.20 1.28
Ca Mau 5.07 0.91 1.58 1.25 1.34
Note: Figures are mean scores based on a scale of 1-10 points for the dimensional level (the first column), and a scale of 0.25-2.5 points for the sub-dimensional levels (the other four columns). Blue is for the best performers (16 provinces); green for high-average performers (16 provinces); orange colour for low-average performers (15 provinces); and light yellow for poor performers (16 provinces). The provincial order is by provincial codes. n.a. = findings not available.

2018 PROVINCIAL PERFORMANCE BY DIMENSIONSCHAPTER 3 61
Dimension 3: Vertical Accountability
Apart from the traditional sub-dimension Interaction with Local Authorities that measures the frequency and effectiveness of citizen interactions with local authorities (as required in the 2014 Law on Citizen Reception), in 2018 the dimension on Vertical Accountability was reconstructed to include two new and revised sub-dimensions: (ii) Local Governments’ Response to Citizens’ Appeals, and (iii) Access to Justice Services. The indicators about how local governments respond to citizen proposals, denunciations, complaints, and/or petitions help to gauge the effectiveness of the 2011 Law on Denunciations and the 2011 Law on Complaints.
In addition, the indicators in the Access to Justice sub-dimension examine levels of trust in courts and
judicial agencies, and access to local courts and non-court mechanisms when citizens have civil disputes.36 Below are snapshots of key findings on provincial performance in ensuring vertical accountability to citizens. First, Box 3.3 highlights key findings at the provincial level. Map 3.3 then presents aggregate dimensional scores for the 63 provinces by four quartiles. Table 3.3a shows sub-dimensional and indicator results for 2018 and changes over the three years from 2016 to 2018 in indicators that were kept unchanged. In addition, Table 3.3b presents a dashboard of 2018 provincial performance by four quartiles at both dimensional and sub-dimensional levels. Lastly, Figure 3.3 presents a summary of reasons why courts are not preferred and the most common alternatives used by citizens who opt for non-court resolutions to civil disputes.
36 The sub-dimension Access to Justice Services is adapted from the 2015 Viet Nam Justice Index that UNDP, CECODES and the Vietnam Lawyers Association collaboratively commissioned in 2015 following piloting in 2013 and 2014. For further information about the 2015 Viet Nam Justice Index, visit https://chisocongly.vn/en/.
Box 3.3: Key Findings from Dimension 3: Vertical Accountability
y Overall, dimensional scores for Vertical Accountability remained at a low-average level in 2018, with provincial scores ranging from 4.31 to 5.6 points (on the scale from 1 to 10 points). The range between the best performing and the worst performing provinces is small, implying that provinces across the country performed similarly in this governance area.
y The best scores were in the sub-dimension Interactions with Local Authorities, with an aggregate sub-dimensional score of 1.94 points (on the scale from 0.33 to 3.3 points). The sub-dimension Local Governments’ Response to Citizens’ Appeals contributed the least to the aggregate score, implying that appeals in different forms (i.e., complaints, denunciations, proposals and petitions) have not yet been effective; citizens have not counted on these forms of appeals, and when they have, local governments have not responded effectively enough.
y Northern provinces tend to perform better in this dimension than southern provinces, with 10 out 16 best performers from the North, while for the sub-dimension Interaction with Local Authorities, the better performers are concentrated in the South. For the Access to Justice Services sub-dimension, there is a more even distribution of good performing provinces across the country.
y At the dimensional level, Thai Nguyen was the best performing province. It was also the best performer in the sub-dimension Access to Justice Services. In the Local Governments’ Response to Citizens’ Appeals sub-dimension, Ha Tinh and Quang Binh were the best performers, while their Central peers, Thua Thien-Hue and Khanh Hoa, were the poorest performers.
y The aggregate score for the new sub-dimension Access to Justice Services was 1.91 points on the 0.33 to 3.3-point scale. The proportion of citizens saying they would use local courts for resolving civil disputes ranged from 77 percent (in Ho Chi Minh City) to 96 percent (in Hai Duong). Meanwhile, only about 4 percent said they would use non-court mechanisms, and more respondents in Quang Nam (10.5 percent) said they would opt for non-court solutions than elsewhere.
y In sum, provinces need to improve vertical accountability in all three areas. Regular and ad-hoc meetings between local authorities with random, rather than selected, citizens should be carried out in order to hear and better understand public concerns. Also, efforts should be made to make official appeals mechanisms more citizen-friendly and effective—to increase public trust in these mechanisms. In terms of the use of justice services, local civil courts should build on the high level of trust among citizens to improve their performance in resolving civil disputes.

62 PAPI 2018THE VIET NAM PROVINCIAL GOVERNANCE AND PUBLIC ADMINISTRATION PERFORMANCE INDEX
Vetical Accountability
Best Performers
High Average
Low Average
Poor Performers
Map 3.3: Provincial Performance in Vertical Accountability by Quartiles, 2018

2018 PROVINCIAL PERFORMANCE BY DIMENSIONSCHAPTER 3 63
Tabl
e 3.
3a: V
erti
cal A
ccou
ntab
ility
(Dim
ensi
on 3
): Re
sult
s by
Indi
cato
rs in
201
8, a
nd fr
om 2
016
to 2
018
Dim
ensi
on a
nd S
ub-D
imen
sion
sN
ame
of In
dica
tor
Scal
eN
atio
nal M
ean
Ove
rtim
ePr
ovin
cial
201
8 PA
PI S
core
Ran
geon
1-1
0 Po
int S
cale
Min
Max
PAPI
201
6PA
PI 2
017
PAPI
201
8*St
atus
Scor
es
Tota
l Dim
ensi
onD
imen
sion
3: V
erti
cal
Acc
ount
abili
ty4.
855.
024.
89M
inim
um4.
311
10M
edia
n4.
95M
axim
um5.
60
Sub-
Dim
ensi
on 1
Inte
ract
ions
with
Loca
l Au
thor
ities
0.33
3.3
2.18
2.23
1.94
Min
imum
1.61
Med
ian
1.93
Max
imum
2.15
Sub-
Dim
ensi
on 2
Loca
l Gov
ernm
ent’s
Res
pons
e to
Ci
tizen
s’ Ap
peal
s*0.
333.
31.
04M
inim
um0.
69M
edia
n1.
08M
axim
um1.
69
Sub-
Dim
ensi
on 3
Acce
ss to
Just
ice
Serv
ices
*0.
343.
41.
91M
inim
um1.
69M
edia
n1.
92M
axim
um2.
10
S1. I
nter
actio
ns w
ith L
ocal
Au
thor
ities
Cont
acte
d Vi
llage
Hea
d (%
)0%
100%
21.9
9%24
.76%
24.7
7%M
inim
um11
.90%
Med
ian
24.4
6%M
axim
um47
.04%
Cont
act w
ith V
illag
e H
ead
Succ
essf
ul (%
)0%
100%
85.4
3%82
.97%
88.8
9%M
inim
um73
.48%
Med
ian
89.8
3%M
axim
um10
0%
Cont
acte
d Co
mm
une
Peop
le’s
Com
mitt
ee (%
)0%
100%
14.0
6%16
.96%
17.1
4%M
inim
um6.
17%
Med
ian
16.8
0%M
axim
um32
.69%
Cont
act w
ith C
omm
une
Succ
essf
ul (%
)0%
100%
83.5
0%81
.01%
88.2
1%M
inim
um63
.87%
Med
ian
87.2
4%M
axim
um99
.48%
Cont
acte
d M
ass
Org
aniz
atio
n (%
)0%
100%
9.32
%9.
77%
10.9
1%M
inim
um2.
55%
Med
ian
10.9
3%M
axim
um19
.59%
Cont
act w
ith M
ass
Org
aniz
atio
n Su
cces
sful
0%10
0%88
.18%
91.0
4%92
.08%
Min
imum
59.9
4%M
edia
n95
.21%
Max
imum
100%
Cont
acte
d Pe
ople
’s Co
unci
l (%
)0%
100%
4.71
%5.
07%
5.32
%M
inim
um0.
81%
Med
ian
4.54
%M
axim
um11
.53%
Cont
act w
ith P
eopl
e’s
Coun
cil
Succ
essf
ul (%
)0%
100%
86.0
2%85
.93%
87.3
2%M
inim
um41
.48%
Med
ian
92.2
9%M
axim
um10
0%

64 PAPI 2018THE VIET NAM PROVINCIAL GOVERNANCE AND PUBLIC ADMINISTRATION PERFORMANCE INDEX
Dim
ensi
on a
nd S
ub-D
imen
sion
sN
ame
of In
dica
tor
Scal
eN
atio
nal M
ean
Ove
rtim
ePr
ovin
cial
201
8 PA
PI S
core
Ran
geon
1-1
0 Po
int S
cale
Min
Max
PAPI
201
6PA
PI 2
017
PAPI
201
8*St
atus
Scor
es
S2. R
espo
nse
to C
itize
ns’ A
ppea
ls
Actio
ns T
aken
by
Citiz
ens
(%)
0%10
0%25
.9%
Min
imum
13.2
5%M
edia
n27
.31%
Max
imum
50.3
7%
Succ
essf
ul A
ctio
ns o
f Citi
zens
(%
)0%
100%
21.8
9%
Min
imum
10.9
7%M
edia
n23
.30%
Max
imum
41.4
5%
S3. A
cces
s to
Just
ice
Serv
ices
Trus
t in
Cour
ts a
nd Ju
dici
al
Agen
cies
(%)
0%10
0%87
.62%
Min
imum
77.3
6%M
edia
n88
.71%
Max
imum
96.0
6%
Use
of L
ocal
Cou
rts
whe
n in
Ci
vil D
ispu
tes
(%)
0%10
0%83
.36%
Min
imum
66.4
2%M
edia
n82
.60%
Max
imum
94.5
5%
Use
of N
on-c
ourt
Mec
hani
sms
whe
n in
Civ
il D
ispu
tes
(%)
0%10
0%3.
62%
Min
imum
0.13
%M
edia
n3.
30%
Max
imum
10.5
7%
Not
e: (*
) Sub
-dim
ensi
ons a
nd in
dica
tors
with
cha
nges
in 2
018.
Com
para
bilit
y ap
plie
s for
indi
cato
rs w
ithou
t an
aste
risk
(*).
Min
= M
inim
um sc
ore;
Max
= M
axim
um sc
ore

2018 PROVINCIAL PERFORMANCE BY DIMENSIONSCHAPTER 3 65
Figure 3.3: Reasons for not Using Courts and Preferred Alternatives in Resolutions to Civil Disputes
Use of arbitration centres/artibitrator(s)
Bringing media attention to the case
Use of criminal gangs/’black market’ forces
Others
Asking an in�uential person I know in the government to help handle
Request mediation from prestigious person in my community
More appropriate methods (n=1011)
Reasons for not appealing to local courts when in civil disputes (n=2346)
Use of mediator centres/mediator(s)
Don't know/Refuse to answer
Other methods are more appropriate
Costly dispute resolution expenses
It takes too long for the dispute to be resolved
Insu�cient capacity of court o�cials
O�ering bribes to solicit favorable judgment is common
Di�cult to keep my secrets con�dential
1.10%
0.79%
0.40%
45.41%
23.62%
20.76%
7.92%
4.46%
5.49%
11.83%
13.15%
17.67%
40.60%
46.93%
Note: This data is for the approximately 4% of respondents who said they would not use courts for civil disputes.

66 PAPI 2018THE VIET NAM PROVINCIAL GOVERNANCE AND PUBLIC ADMINISTRATION PERFORMANCE INDEX
Table 3.3b: Dashboard of Provincial Performance in Vertical Accountability by Sub-dimension, 2018Province Name 3: Vertical Accountability 3.1: Interactions with Local
Authorities3.2: Citizen Appeals to Local
Government 3.3: Access to Justice Services
Ha Noi 4.61 1.85 0.81 1.96
Ha Giang 4.82 1.73 1.06 2.02
Cao Bang 5.15 1.92 1.46 1.78
Bac Kan 5.05 1.90 1.19 1.95
Tuyen Quang 5.14 1.95 1.24 1.95
Lao Cai 4.89 1.87 1.00 2.02
Dien Bien 4.77 1.90 1.07 1.81
Lai Chau 4.87 1.97 1.09 1.81
Son La 5.11 1.91 1.26 1.94
Yen Bai 5.02 2.03 1.08 1.91
Hoa Binh 4.85 1.80 1.20 1.85
Thai Nguyen 5.60 1.93 1.57 2.10
Lang Son 5.16 2.08 1.22 1.86
Quang Ninh 5.10 1.89 1.27 1.94
Bac Giang 4.91 1.85 1.13 1.93
Phu Tho 4.95 1.96 1.11 1.88
Vinh Phuc 5.05 1.97 1.16 1.92
Bac Ninh 5.15 1.87 1.34 1.95
Hai Duong 4.72 1.85 0.96 1.91
Hai Phong 4.87 2.01 0.95 1.91
Hung Yen 4.94 1.93 1.06 1.94
Thai Binh 4.96 1.79 1.26 1.91
Ha Nam 4.83 1.96 1.08 1.80
Nam Dinh 4.74 1.81 0.94 1.99
Ninh Binh 5.09 1.81 1.26 2.03
Thanh Hoa 5.32 1.84 1.45 2.02
Nghe An 5.48 2.02 1.41 2.05
Ha Tinh 5.54 1.88 1.69 1.97
Quang Binh 5.57 1.92 1.58 2.07
Quang Tri 5.51 2.07 1.44 2.00
Thua Thien-Hue 4.38 1.77 0.69 1.92
Da Nang 4.55 1.95 0.80 1.80
Quang Nam 4.99 1.93 1.26 1.79
Quang Ngai 5.02 1.89 1.24 1.90
Binh Dinh 4.52 1.61 1.06 1.85
Phu Yen 4.95 2.00 0.94 2.02
Khanh Hoa 4.70 1.89 0.75 2.06
Ninh Thuan 5.02 2.03 1.00 1.98
Binh Thuan 4.48 1.72 0.86 1.90
Kon Tum 4.95 1.87 1.10 1.98
Gia Lai 4.91 2.02 0.91 1.98
Dak Lak 4.98 1.94 1.23 1.81
Dak Nong 5.33 1.93 1.49 1.91
Lam Dong 5.14 2.07 1.22 1.85
Binh Phuoc 5.22 1.99 1.22 2.01
Tay Ninh 4.76 1.92 0.82 2.01
Binh Duong 4.86 1.72 1.26 1.89
Dong Nai 4.98 1.92 1.08 1.99
Ba Ria-Vung Tau 5.20 2.01 1.23 1.97
Ho Chi Minh City 4.66 1.96 0.89 1.80
Long An 4.71 2.00 0.90 1.81
Tien Giang 4.31 1.80 0.82 1.69
Ben Tre 5.20 1.99 1.13 2.08
Tra Vinh 4.75 1.99 0.82 1.95
Vinh Long 4.70 1.95 0.94 1.81
Dong Thap 4.99 2.13 0.91 1.95
An Giang 4.72 1.99 0.80 1.93
Kien Giang 4.65 1.96 0.85 1.84
Can Tho 4.81 2.15 0.94 1.72
Hau Giang 4.84 2.02 1.08 1.74
Soc Trang 4.83 2.02 0.97 1.84
Bac Lieu 4.84 1.99 1.05 1.80
Ca Mau 5.13 2.08 1.25 1.80
Note: Figures are mean scores based on a scale of 1-10 points for the dimensional level (the first left column), and a scale of 0.33-3.33 points for sub-dimensional levels (the other three columns). Blue is for best performers (16 provinces); green for high-average performers (16 provinces); orange for low-average performers (15 provinces); and light yellow for poor performers (16 provinces). The provincial order is by provincial codes.

2018 PROVINCIAL PERFORMANCE BY DIMENSIONSCHAPTER 3 67
Dimension 4: Control of Corruption in the Public Sector
The Control of Corruption in the Public Sector dimension is comprised of four sub-dimensions: (i) Limits on Public Sector Corruption, (ii) Limits on Corruption in Public Service Delivery, (iii) Equity in State Employment, and (iv) Willingness to Fight Corruption. This dimension measures the performance of public institutions and local governments in controlling corruption in the public sector. It also reflects citizens’ tolerance of corrupt practices, and willingness to curb corruption by both local governments and citizens.
Below are snapshots of key findings on provincial performance in control of corruption in the public
sector. First, Box 3.4 highlights key findings at the provincial level. Map 3.4 then presents aggregate dimensional scores for provinces with validated data37 by the four quartiles. Table 3.4a shows sub-dimensional and indicator results for 2018 and changes over the three years from 2016 to 2018 in indicators that were kept unchanged. From 2018, the indicator Knowledge of the Anti-corruption Law has been removed from this dimension; therefore, over time comparison in the aggregated sub-dimension Willingness to Fight Corruption is not advisable. In addition, Table 3.4b presents a dashboard of 2018 provincial performance by four quartiles at both dimensional and sub-dimensional levels. Lastly, Figures 3.4a and 3.4b reveal citizens’ assessment of levels of corruption and nepotism by province.
37 Data from two provinces in this dimension were not used due to significant biases as a result of priming effects.
Box 3.4: Key Findings from Dimension 4: Control of Corruption in the Public Sector
y Overall, Control of Corruption in the Public Sector dimensional scores were at the above-average level in 2018, with provincial scores ranging from 5.52 to 7.61 points (on the scale of 1 to 10). There is a relatively significant gap between the best performing and worst performing provinces, implying that provinces across the country performed with some variation in controlling corruption in the public sector.
y Among the four sub-dimensions, the best scores were in Limits on Corruption in Public Service Delivery, with an aggregate sub-dimensional score of 1.94 point (on the scale from 0.25 to 2.5 points). Other unchanged sub-dimensions that saw significant increases in scores over time include Limits on Public Sector Corruption and Equity in State Employment, although the latter sub-dimension remained at a very modest level of 1.11 points, hinting at problems with fair opportunities for all in state employment.
y Regional patterns in this dimension have been consistent over time; southern provinces tend to perform better than northern ones, with 10 of the 16 best performers in the South. Also, southern provinces did much better in ensuring fair state employment. For the Limits on Corruption in Public Service Delivery sub-dimension, there is a more even distribution of good performers across the country than in the other three sub-dimensions.
y At the sub-dimensional level, Ben Tre, Vinh Long and Tay Ninh, all southern provinces, performed well in all four sub-dimensions. In particular, Ben Tre was the top performer in limits on corruption in public service delivery and willingness to fight corruption. On the other hand, Dak Lak performed poorly in all four sub-dimensions, while Hai Phong, Ha Noi, Hoa Binh, Ha Nam, and Kon Tum performed poorly in three sub-dimensions. Hai Phong was the poorest performer in the three sub-dimensions of Limits on Public Sector Corruption, Limits on Corruption in Public Service Delivery and Equity in State Employment.
y Overall, the two areas where provinces need to do more to control corruption better are (i) corruption involving public administrative services and state budgets, and, more importantly, (ii) corruption in state employment (i.e., addressing nepotism and bribery when recruiting civil servants and public employees). The progress in all four sub-dimensions over time provides hope for more effective control of corruption in the public sector at the provincial level in the years to come, if the willingness to fight corruption remains.

68 PAPI 2018THE VIET NAM PROVINCIAL GOVERNANCE AND PUBLIC ADMINISTRATION PERFORMANCE INDEX
Map 3.4: Provincial Performance in Control of Corruption in the Public Sector by Quartiles, 2018
Control of Corruptionin the Public Sector
Best Performers
High Average
Low Average
Poor Performers
Data Not Available

2018 PROVINCIAL PERFORMANCE BY DIMENSIONSCHAPTER 3 69
Tabl
e 3.
4a: C
ontr
ol o
f Cor
rupt
ion
in th
e Pu
blic
Sec
tor (
Dim
ensi
on 4
): Re
sult
s by
Indi
cato
rs in
201
8, a
nd fr
om 2
016
to 2
018
Dim
ensi
on a
nd S
ub-
Dim
ensi
ons
Nam
e of
Indi
cato
rSc
ale
Nat
iona
l Mea
n O
ver T
ime
Prov
inci
al 2
018
PAPI
Sco
re R
ange
on 1
-10
Poin
t Sca
le
Min
Max
PAPI
201
6PA
PI 2
017
PAPI
201
8*St
atus
Scor
es
Tota
l Dim
ensi
onD
imen
sion
4: C
ontr
ol o
f Co
rrup
tion
5.69
6.09
6.57
Min
imum
5.52
110
Med
ian
6.51
Max
imum
7.61
Sub-
Dim
ensi
on 1
Lim
its o
n Pu
blic
Sec
tor
Corr
uptio
n1.
361.
561.
64M
inim
um1.
100.
252.
5M
edia
n1.
64M
axim
um2.
01
Sub-
Dim
ensi
on 2
Lim
its o
n Co
rrup
tion
in P
ublic
Se
rvic
e D
eliv
ery
1.76
1.85
1.94
Min
imum
1.70
0.25
2.5
Med
ian
1.95
Max
imum
2.19
Sub-
Dim
ensi
on 3
Equi
ty in
Sta
te E
mpl
oym
ent
0.91
1.01
1.11
Min
imum
0.80
0.25
2.5
Med
ian
1.08
Max
imum
1.41
Sub-
Dim
ensi
on 4
Will
ingn
ess t
o Fi
ght
Corr
uptio
n*1.
661.
671.
88M
inim
um1.
520.
252.
5M
edia
n1.
90M
axim
um2.
11
S1. L
imits
on
Publ
ic S
ecto
r Co
rrup
tion
No
Div
ertin
g of
Pub
lic F
unds
(%
agr
ee)
54.0
4%64
.17%
66.2
5%M
inim
um47
.84%
0%10
0%M
edia
n65
.64%
Max
imum
82.4
4%
No
Brib
es fo
r Lan
d Ti
tle (%
ag
ree)
45.9
9%55
.39%
59.3
9%M
inim
um34
.05%
0%10
0%M
edia
n59
.33%
Max
imum
79.3
3%
No
Kick
back
s fo
r Con
stru
ctio
n Pe
rmit
(% a
gree
)48
.52%
54.9
3%59
.43%
Min
imum
32.0
4%0%
100%
Med
ian
60.1
9%M
axim
um74
.87%
Brib
es to
Get
Cer
tifica
tion
NO
T Co
mm
on (%
)0%
100%
29.9
3%28
.54%
31.6
%M
inim
um16
.17%
Med
ian
34.4
2%M
axim
um60
.69%
Brib
es to
Get
Per
sona
l Pr
oced
ures
NO
T Co
mm
on (%
)0%
100%
28.4
7%25
.89%
30.4
1%M
inim
um20
.76%
Med
ian
30.9
7%M
axim
um45
.6%
S2. L
imits
on
Corr
uptio
n in
Se
rvic
e D
eliv
ery
No
Brib
es a
t Pub
lic D
istr
ict
Hos
pita
l (%
agr
ee)
0%10
0%50
.93%
56.7
4%62
.51%
Min
imum
42.6
4%M
edia
n62
.40%
Max
imum
83.2
0%
No
Brib
es fo
r Tea
cher
s’ Fa
vour
itism
(% a
gree
)0%
100%
54.9
4%61
.38%
66.9
5%M
inim
um49
.55%
Med
ian
68.8
2%M
axim
um83
.97%

70 PAPI 2018THE VIET NAM PROVINCIAL GOVERNANCE AND PUBLIC ADMINISTRATION PERFORMANCE INDEX
Dim
ensi
on a
nd S
ub-
Dim
ensi
ons
Nam
e of
Indi
cato
rSc
ale
Nat
iona
l Mea
n O
ver T
ime
Prov
inci
al 2
018
PAPI
Sco
re R
ange
on 1
-10
Poin
t Sca
le
Min
Max
PAPI
201
6PA
PI 2
017
PAPI
201
8*St
atus
Scor
es
S3. E
quity
in S
tate
Em
ploy
men
t
No
Brib
es fo
r Sta
te
Empl
oym
ent (
% a
gree
)0%
100%
37.0
3%43
.11%
48.6
9%M
inim
um22
.61%
Med
ian
46.5
0%M
axim
um68
.41%
No
Rela
tions
hip
for S
tate
Em
ploy
men
t0
51.
101.
231.
40M
inim
um0.
84M
edia
n1.
37M
axim
um2.
02
S4. W
illin
gnes
s to
Fig
ht
Corr
uptio
n
Corr
uptio
n H
ad N
o Eff
ect o
n Re
spon
dent
(%)
0%10
0%95
.20%
95.4
3%96
.03%
Min
imum
86.2
2%M
edia
n96
.11%
Max
imum
99.8
8%
Know
Ant
i-Cor
rupt
ion
Law
(%
)*0%
100%
44.5
9%39
.78%
Min
imum
Med
ian
Max
imum
Prov
inci
al A
utho
ritie
s Se
rious
ab
out C
omba
ting
Corr
uptio
n (%
) 0%
100%
32.6
5%34
.71%
39.9
0%M
inim
um24
.24%
Med
ian
38.8
5%M
axim
um61
.21%
Den
unci
atio
n Pr
ice
(‘000
s VN
D) (
Impu
ted)
015
0,00
025
,598
27,5
7322
,669
M
inim
um10
,354
Med
ian
24,3
86M
axim
um40
,464
Vict
ims
Den
unci
ate
Brib
e Re
ques
t (%
)10
0%0%
2.81
%2.
88%
7.36
%M
inim
um0.
00%
Med
ian
0.00
%M
axim
um62
.22%
Not
e: (*
) Sub
-dim
ensi
ons a
nd in
dica
tors
with
cha
nges
in 2
018.
Com
para
bilit
y ap
plie
s for
indi
cato
rs w
ithou
t an
aste
risk
(*).
Min
= M
inim
um sc
ore;
Max
= M
axim
um sc
ore.

2018 PROVINCIAL PERFORMANCE BY DIMENSIONSCHAPTER 3 71
Table 3.4b: Dashboard of Provincial Performance in Control of Corruption, 2018
Province Name 4: Control of Corruption in the Public Sector
4.1: Limits on Public Sector Corruption
4.2: Limits on Corruption in Service Delivery 4.3: Equity in Employment 4.4: Willingness to Fight
Corruption
Ha Noi 6.08 1.49 1.79 0.90 1.90
Ha Giang 6.16 1.44 1.90 0.99 1.83
Cao Bang 6.49 1.60 2.03 0.96 1.90
Bac Kan 6.45 1.72 1.95 0.92 1.85
Tuyen Quang 6.25 1.53 1.88 0.99 1.86
Lao Cai 6.38 1.56 2.02 0.93 1.87
Dien Bien 6.46 1.58 2.01 0.93 1.93
Lai Chau 6.69 1.69 2.05 1.10 1.85
Son La 6.52 1.52 1.94 1.13 1.92
Yen Bai 6.26 1.52 1.94 1.01 1.79
Hoa Binh 6.13 1.61 1.75 0.86 1.92
Thai Nguyen 6.21 1.58 1.87 0.91 1.84
Lang Son 7.07 1.83 2.03 1.19 2.01
Quang Ninh n.a n.a n.a n.a n.a
Bac Giang 6.57 1.53 2.01 1.15 1.88
Phu Tho 7.08 1.89 2.03 1.20 1.96
Vinh Phuc 7.06 1.77 2.12 1.20 1.97
Bac Ninh 6.62 1.71 2.01 1.06 1.84
Hai Duong 6.23 1.65 1.81 0.88 1.88
Hai Phong 5.52 1.10 1.70 0.80 1.92
Hung Yen 6.53 1.71 1.90 0.95 1.97
Thai Binh 6.49 1.73 1.86 1.00 1.90
Ha Nam 5.98 1.48 1.73 0.82 1.95
Nam Dinh 6.58 1.68 1.84 1.11 1.95
Ninh Binh 6.94 1.79 2.03 1.19 1.93
Thanh Hoa 6.36 1.56 1.85 0.99 1.96
Nghe An 6.53 1.66 1.91 1.06 1.90
Ha Tinh 6.60 1.69 2.04 1.25 1.62
Quang Binh 6.79 1.76 1.98 1.08 1.97
Quang Tri 7.37 2.01 2.13 1.18 2.05
Thua Thien-Hue 6.76 1.80 2.03 1.08 1.85
Da Nang 6.51 1.51 1.87 1.08 2.04
Quang Nam 6.64 1.67 1.96 1.02 2.00
Quang Ngai 6.08 1.64 1.75 1.03 1.66
Binh Dinh 6.23 1.53 1.77 1.02 1.91
Phu Yen 6.56 1.65 1.95 1.07 1.88
Khanh Hoa 6.49 1.53 1.93 1.15 1.87
Ninh Thuan 6.91 1.69 2.11 1.17 1.94
Binh Thuan 6.49 1.54 2.00 1.06 1.89
Kon Tum 6.03 1.47 1.85 0.84 1.87
Gia Lai 6.35 1.63 1.99 0.99 1.73
Dak Lak 5.81 1.39 1.76 0.81 1.85
Dak Nong 6.68 1.73 1.99 1.09 1.87
Lam Dong 6.25 1.48 1.90 0.98 1.88
Binh Phuoc 6.30 1.49 1.91 1.08 1.82
Tay Ninh 7.24 1.83 2.03 1.41 1.98
Binh Duong 6.82 1.69 1.91 1.27 1.95
Dong Nai 6.28 1.51 1.91 1.10 1.77
Ba Ria-Vung Tau 6.25 1.53 1.85 1.16 1.72
Ho Chi Minh City 5.95 1.30 1.77 0.99 1.88
Long An 6.90 1.71 1.99 1.26 1.95
Tien Giang 7.09 1.83 2.08 1.30 1.88
Ben Tre 7.61 1.92 2.19 1.39 2.11
Tra Vinh 6.84 1.64 2.01 1.21 1.97
Vinh Long 7.01 1.77 2.04 1.23 1.97
Dong Thap n.a n.a n.a n.a n.a
An Giang 6.93 1.73 2.06 1.22 1.93
Kien Giang 6.35 1.66 1.94 1.22 1.52
Can Tho 6.98 1.86 2.02 1.17 1.94
Hau Giang 6.21 1.57 1.80 1.05 1.79
Soc Trang 6.80 1.62 2.02 1.20 1.96
Bac Lieu 6.30 1.58 1.86 1.07 1.79
Ca Mau 6.73 1.62 1.98 1.14 1.99
Note: Figures are mean scores based on a scale of 1-10 points for the dimensional level (the first left column), and a scale of 0.25-2.5 points for sub-dimensional levels (the other four columns). Blue is for best performers (16 provinces); green for high-average performers (16 provinces); orange for low-average performers (15 provinces); and light yellow for poor performers (16 provinces). The provincial order is by provincial codes. n.a. = findings not available.

72 PAPI 2018THE VIET NAM PROVINCIAL GOVERNANCE AND PUBLIC ADMINISTRATION PERFORMANCE INDEX
Figure 3.4c: Citizen Perceptions of Corruption by Province, 2018(Branch size = percentage of respondents agreeing to provided positive statements; Perfect = 100% agreement)
No Diverting of Public Funds
No Bribes for Land Title
No Bribes at Hospital
No Bribes for Teachers' Favors
No Kickbacks on Construction
No Bribes for State Employment
Zero Hai Phong HCMC Dak Lak Ha Nam Kon Tum Ha Noi Hoa Binh
Thai Nguyen Binh Dinh Lam Dong Ha Giang Da Nang Thanh Hoa Binh Phuoc Quang Ngai
Tuyen Quang BRVT Hai Duong Yen Bai Dong Nai Hau Giang Lao Cai Bac Lieu
Binh Thuan Khanh Hoa Nghe An Hung Yen Dien Bien Son La Thai Binh Bac Giang
Nam Dinh Cao Bang Quang Nam Gia Lai Bac Kan Phu Yen Bac Ninh Binh Duong
Ca Mau Tra Vinh Kien Giang Soc Trang Quang Binh Dak Nong Ha Tinh Long An
Lai Chau Ninh Thuan Ninh Binh Vinh Long TT-Hue An Giang Lang Son Vinh Phuc
Can Tho Phu Tho Tay Ninh Tien Giang Quang Tri Ben Tre Perfect
Figure 3.4d: Relationship Needed for State Employment by Province, 2018(Branch size = percentage of respondents agreeing that relationships are not important or not important at all; Perfect = 100% agreement)
Zero Hau Giang Bac Lieu Hai Duong Ha Nam TT-Hue Ca Mau Dak Lak
Can Tho Kon Tum Binh Dinh Kien Giang Bac Kan Quang Tri Quang Ngai Ha Noi
Phu Yen Soc Trang Quang Nam Cao Bang An Giang Hoa Binh Tuyen Quang Quang Binh
Lao Cai Hai Phong Ha Giang HCMC Dak Nong Gia Lai Khanh Hoa Yen Bai
Dien Bien Tra Vinh Nam Dinh Thai Binh Lai Chau Tien Giang Lam Dong Hung Yen
Thanh Hoa Son La Da Nang BRVT Binh Thuan Dong Nai Ninh Thuan Thai Nguyen
Nghe An Binh Phuoc Vinh Long Tay Ninh Phu Tho Long An Ninh Binh Lang Son
Vinh Phuc Ben Tre Bac Ninh Bac Giang Ha Tinh Binh Duong Perfect
Application for the position of
Land Registry O�cer
Commune Justice O�cer
Policeman
Public Primary School Teacher
People's Committee Sta�

2018 PROVINCIAL PERFORMANCE BY DIMENSIONSCHAPTER 3 73
Dimension 5: Public Administrative Procedures
This dimension reflects the quality of public administrative services in areas important to citizens. It includes certification services as well as application procedures for construction permits, land use rights certificates (LURCs), and personal documents. In particular, it examines how professional and responsive government staff are in providing public administrative services.
Below are snapshots of key findings about provincial performance in the provision of administrative procedures and services for citizens. This is the only dimension without any changes made in 2018. First,
Box 3.5 highlights key findings at the provincial level. Map 3.5 then presents aggregate dimensional scores for 63 provinces by four quartiles. Table 3.5a shows sub-dimensional and indicator results for 2018 and changes over the three years from 2016 to 2018. In addition, Table 3.5b presents a dashboard of 2018 provincial performance by four quartiles at both dimensional and sub-dimensional levels. Figures 3.5a and 3.5b summarize provincial performance for two out of four administrative services (LURCs and personal documents) by four criteria used since 2016: (i) publicity of application fees, (ii) competence of civil servants, (iii) behaviour of civil servants, and (iv) receipt of results within the set deadline.
Box 3.5: Key Findings from Dimension 5: Public Administrative Procedures
y Overall, Public Administrative Procedures dimensional scores were at the high-average level in 2018, with the provincial scores ranging from 6.9 to 7.95 points (on the scale of 1 to 10). The gap between provinces in this dimension is also narrow, implying that provinces across the country performed equally well in provision of public administrative procedures. Consistent improvement over time is evident for all four public administrative services, especially in land procedures, though this area remained the weakest service in 2018 and over time.
y Among the four sub-dimensions, the best scoring was Commune-level Administrative Services for Personal Procedures, with an aggregate sub-dimensional score of 1.93 point (on the scale from 0.25 to 2.5 points). The next highest scoring were the two sub-dimensions Construction Permit Procedures and Government Certification Services.
y There are no clear regional patterns in this dimension, unlike in the first four dimensions; the best performers are more evenly distributed across the country. Among the seven sub-regions, the South Central, Central Highlands and Southeastern sub-regions fell behind. For instance, all five Central Highlands provinces were in the poor-performing group in terms of commune-level administrative service provision.
y At the sub-dimensional level, the gaps between the highest provincial scores and the maximum possible score of 2.5 points were narrower than in previous years. Lang Son was the top performer in Government Certification Services with 2.04 points; Quang Ninh was the top performer in the Construction Permits and Land Procedures sub-dimensions, with scores of 2.01 and 1.98 points, respectively; and Tra Vinh was the top performer in Commune-level Administrative Services for Personal Procedures. For quality of one-stop shops for LURCs, Tra Vinh scored highest, while Dak Lak fell far behind on all four criteria: (i) publicity of application fees, (ii) competence of civil servants, (iii) behaviour of civil servants, and (iv) receipt of results within the set deadline.
y Overall, performance in this dimension shows constant improvement in public administrative services. The increasing scores in all four sub-dimensions over time reflect efforts by local governments in public administrative reforms. However, considering the gap between the 2018 scores and the maximum possible scores, there is room for provinces to enhance their services. In particular, departments of environment and natural resources and their district affiliates should improve the performance of one-stop shops for LURCs.

74 PAPI 2018THE VIET NAM PROVINCIAL GOVERNANCE AND PUBLIC ADMINISTRATION PERFORMANCE INDEX
Map 3.5: Provincial Performance in Public Administrative Procedures by Quartiles, 2018
Public AdministrativeProcedures
Best Performers
High Average
Low Average
Poor Perfomers

2018 PROVINCIAL PERFORMANCE BY DIMENSIONSCHAPTER 3 75
Tabl
e 3.
5a: P
ublic
Adm
inis
trat
ive
Proc
edur
es (D
imen
sion
5):
Resu
lts
by In
dica
tors
in 2
018,
and
from
201
6 to
201
8
Dim
ensi
on a
nd S
ub-
Dim
ensi
ons
Nam
e of
Indi
cato
rSc
ale
Nat
iona
l Mea
n O
ver T
ime
Prov
inci
al 2
018
PAPI
Sco
re R
ange
on 1
-10
Poin
t Sca
le
Min
Max
PAPI
201
6PA
PI 2
017
PAPI
201
8St
atus
Scor
es
Tota
l Dim
ensi
onD
imen
sion
5: P
ublic
Adm
inis
trat
ive
Proc
edur
es1
107.
107.
177.
39
Min
imum
6.90
Med
ian
7.40
Max
imum
7.95
Sub-
Dim
ensi
on 1
Cert
ifica
tion
Proc
edur
es0.
252.
51.
751.
771.
82
Min
imum
1.65
Med
ian
1.85
Max
imum
2.04
Sub-
Dim
ensi
on 2
Cons
truc
tion
Perm
its0.
252.
51.
821.
841.
88
Min
imum
1.70
Med
ian
1.89
Max
imum
2.01
Sub-
Dim
ensi
on 3
Land
Pro
cedu
res
0.25
2.5
1.65
1.67
1.76
Min
imum
1.54
Med
ian
1.76
Max
imum
1.98
Sub-
Dim
ensi
on 4
Pers
onal
Pro
cedu
res a
t Com
mun
e Le
vel
0.25
2.5
1.88
1.89
1.93
Min
imum
1.82
Med
ian
1.94
Max
imum
2.05
S1. C
ertifi
catio
n Pr
oced
ures
Tota
l Qua
lity
of C
ertifi
catio
n Pr
oced
ures
(4
crite
ria) (
2016
)0
43.
673.
743.
81
Min
imum
3.46
Med
ian
3.81
Max
imum
3.99
Satis
fact
ion
with
Ser
vice
on
Cert
ifica
tion
Proc
edur
es (5
-poi
nt s
cale
)1
54.
074.
054.
18
Min
imum
3.54
Med
ian
4.16
Max
imum
4.63
S2. C
onst
ruct
ion
Perm
its
Did
not
Use
Man
y W
indo
ws
for
Cons
truc
tion
Perm
it (%
)0%
100%
93.3
0%92
.35%
89.9
4%
Min
imum
63.4
8%
Med
ian
91.8
7%
Max
imum
100%
Rece
ived
Con
stru
ctio
n Pe
rmit
(%)
0%10
0%83
.58%
92.1
0%92
.64%
Min
imum
48.1
6%
Med
ian
99.2
2%
Max
imum
100%

76 PAPI 2018THE VIET NAM PROVINCIAL GOVERNANCE AND PUBLIC ADMINISTRATION PERFORMANCE INDEX
Dim
ensi
on a
nd S
ub-
Dim
ensi
ons
Nam
e of
Indi
cato
rSc
ale
Nat
iona
l Mea
n O
ver T
ime
Prov
inci
al 2
018
PAPI
Sco
re R
ange
on 1
-10
Poin
t Sca
le
Min
Max
PAPI
201
6PA
PI 2
017
PAPI
201
8St
atus
Scor
es
Tota
l Qua
lity
of C
onst
ruct
ion
Proc
edur
es
(4 c
riter
ia)
03.
553.
783.
84
Min
imum
2.93
Med
ian
3.86
Max
imum
4.00
Satis
fact
ion
with
Ser
vice
on
Cons
truc
tion
Perm
its (5
-poi
nt s
cale
)1
53.
734.
054.
08
Min
imum
3.28
Med
ian
4.05
Max
imum
4.72
S3. L
and
Use
Rig
hts
Cert
ifica
tes
Proc
edur
es
Did
not
Use
Man
y W
indo
ws
for L
and
Use
Ri
ghts
Cer
tifica
tes
(%)
0%10
0%79
.66%
86.0
1%79
.48%
Min
imum
47.3
0%
Med
ian
80.7
4%
Max
imum
100%
Rece
ived
Lan
d Ti
tle (%
)0%
100%
78.5
4%81
.64%
83.0
4%
Min
imum
49.6
8%
Med
ian
81.5
7%
Max
imum
98.2
2%
Tota
l Qua
lity
of L
and
Use
Rig
hts
Cert
ifica
tes
Proc
edur
es (4
crit
eria
)0
42.
642.
553.
49
Min
imum
2.86
Med
ian
3.50
Max
imum
3.88
Satis
fact
ion
with
Lan
d U
se R
ight
s Ce
rtifi
cate
Pro
cedu
res
(5-p
oint
sca
le)
15
3.70
3.89
3.91
Min
imum
3.19
Med
ian
3.80
Max
imum
4.64
S4. P
erso
nal P
roce
dure
s
Did
not
Use
Man
y W
indo
ws
for P
erso
nal
Proc
edur
es (%
)0%
100%
94.7
9%95
.21%
94.6
3%
Min
imum
86.3
3%
Med
ian
95.3
3%
Max
imum
100%
Tota
l Qua
lity
of P
erso
nal P
roce
dure
s (4
cr
iteria
)0
43.
343.
443.
57
Min
imum
3.10
Med
ian
3.57
Max
imum
3.87
Satis
fact
ion
with
Ser
vice
s on
Per
sona
l Pr
oced
ures
(5-p
oint
sca
le)
15
4.04
4.10
4.22
Min
imum
3.90
Med
ian
4.19
Max
imum
4.59
Not
e: M
in =
Min
imum
scor
e; M
ax =
Max
imum
scor
e

2018 PROVINCIAL PERFORMANCE BY DIMENSIONSCHAPTER 3 77
Table 3.5b: Dashboard of Provincial Performance in Public Administrative Procedures, 2018
Province Name 5: Administrative Procedures
5.1: Certification Procedures 5.2: Construction Permit 5.3: Land Use Rights
Procedures5.4: Procedures at
Commune Level
Ha Noi 7.50 1.81 1.94 1.81 1.93
Ha Giang 7.30 1.91 1.81 1.75 1.82
Cao Bang 6.95 1.79 1.70 1.56 1.90
Bac Kan 7.40 1.88 1.94 1.71 1.86
Tuyen Quang 7.34 1.90 1.73 1.75 1.97
Lao Cai 7.33 1.93 1.78 1.66 1.95
Dien Bien 7.20 1.92 1.80 1.64 1.84
Lai Chau 7.54 1.85 1.89 1.89 1.90
Son La 7.49 1.87 1.92 1.79 1.91
Yen Bai 7.66 1.99 1.97 1.69 2.01
Hoa Binh 7.32 1.85 1.91 1.67 1.90
Thai Nguyen 7.60 1.88 1.91 1.87 1.94
Lang Son 7.66 2.04 1.92 1.76 1.94
Quang Ninh 7.95 1.97 2.01 1.98 2.00
Bac Giang 7.70 1.84 1.97 1.92 1.97
Phu Tho 7.46 1.83 1.90 1.76 1.97
Vinh Phuc 7.46 1.91 1.78 1.76 2.02
Bac Ninh 7.36 1.80 1.80 1.80 1.96
Hai Duong 7.26 1.88 1.92 1.58 1.88
Hai Phong 7.40 1.92 1.82 1.75 1.91
Hung Yen 7.35 1.76 1.87 1.78 1.94
Thai Binh 7.28 1.84 1.83 1.64 1.97
Ha Nam 7.59 1.87 1.92 1.85 1.95
Nam Dinh 7.49 1.83 1.94 1.75 1.97
Ninh Binh 7.57 1.87 1.91 1.77 2.02
Thanh Hoa 7.49 1.78 1.90 1.83 1.99
Nghe An 7.53 1.93 1.92 1.72 1.96
Ha Tinh 7.63 1.93 1.85 1.89 1.96
Quang Binh 7.65 1.99 1.87 1.76 2.03
Quang Tri 7.19 1.82 1.73 1.68 1.98
Thua Thien-Hue 7.37 1.76 1.87 1.84 1.90
Da Nang 7.49 1.89 1.84 1.86 1.90
Quang Nam 7.02 1.74 1.76 1.58 1.94
Quang Ngai 7.05 1.70 1.87 1.62 1.86
Binh Dinh 6.90 1.77 1.71 1.54 1.88
Phu Yen 7.14 1.68 1.89 1.67 1.89
Khanh Hoa 7.29 1.67 1.96 1.75 1.91
Ninh Thuan 7.53 1.86 1.94 1.77 1.95
Binh Thuan 7.37 1.83 1.91 1.75 1.89
Kon Tum 7.25 1.85 1.85 1.68 1.87
Gia Lai 7.14 1.65 1.91 1.70 1.87
Dak Lak 7.34 1.86 1.96 1.67 1.86
Dak Nong 7.39 1.87 1.86 1.83 1.84
Lam Dong 6.91 1.79 1.70 1.59 1.83
Binh Phuoc 7.42 1.74 1.95 1.81 1.92
Tay Ninh 7.51 1.82 1.95 1.76 1.97
Binh Duong 7.44 1.78 1.87 1.86 1.93
Dong Nai 7.37 1.88 1.90 1.73 1.87
Ba Ria-Vung Tau 7.36 1.81 1.83 1.76 1.97
Ho Chi Minh City 7.14 1.80 1.85 1.66 1.83
Long An 7.14 1.82 1.76 1.67 1.89
Tien Giang 7.21 1.71 1.88 1.75 1.88
Ben Tre 7.74 1.89 2.00 1.88 1.97
Tra Vinh 7.77 1.88 1.90 1.93 2.05
Vinh Long 7.48 1.76 1.88 1.84 2.00
Dong Thap 7.55 1.85 1.86 1.85 1.99
An Giang 7.33 1.78 1.86 1.81 1.88
Kien Giang 7.60 1.84 1.93 1.87 1.96
Can Tho 7.56 1.85 1.91 1.78 2.02
Hau Giang 7.28 1.76 1.73 1.78 2.01
Soc Trang 7.44 1.77 1.92 1.84 1.92
Bac Lieu 7.40 1.89 1.90 1.68 1.93
Ca Mau 7.52 1.85 1.91 1.77 1.99
Note: Figures are scores based on a scale of 1-10 points for the dimensional level (the first left column), and a scale of 0.25-2.5 points for the sub-dimensional levels (the other four columns). Blue is for best performers (16 provinces); green for high-average performers (16 provinces); orange for low-average performers (15 provinces); and light yellow for poor performers (16 provinces). The provincial order is by provincial codes.

78 PAPI 2018THE VIET NAM PROVINCIAL GOVERNANCE AND PUBLIC ADMINISTRATION PERFORMANCE INDEX
Figure 3.5a: Citizen Assessment of Administrative Services for Land Use Rights Certificates (LURCs), 2018(Branch size = percentage of respondents agreeing to provided positive statements; Perfect = 100% agreement)
Fees Displayed
O�cials Competent
Treated with Respect
Deadline Met
Zero Dak Lak Hai Duong Binh Dinh Ha Noi Ha Giang Yen Bai Gia Lai
Ha Nam Quang Nam Cao Bang Hung Yen Lao Cai Binh Phuoc Lam Dong Ninh Binh
Thai Binh Tien Giang Phu Tho Hoa Binh Binh Thuan Kon Tum Quang Ngai Phu Yen
HCMC Long An Dong Nai TT-Hue Tay Ninh Nam Dinh Nghe An Khanh Hoa
Thai Nguyen Thanh Hoa Vinh Phuc BRVT Dien Bien Bac Ninh Lang Son Da Nang
Bac Kan Tuyen Quang Ha Tinh An Giang Binh Duong Can Tho Ca Mau Dong Thap
Lai Chau Soc Trang Son La Ben Tre Quang Tri Dak Nong Kien Giang Quang Binh
Quang Ninh Bac Giang Vinh Long Tra Vinh Perfect
Figure 3.5b: Assessment of Administrative Services at the Commune Level, 2018(Branch size = percentage of respondents agreeing to provided positive statements; Perfect = 100% agreement)
Fees Displayed
O�cials Competent
Treated with Respect
Deadline Met
Zero Dak Lak Dien Bien Tien Giang Lam Dong Da Nang TT-Hue Cao Bang Quang Nam
Tra Vinh Kien Giang Quang Ngai Soc Trang Khanh Hoa Hoa Binh Ha Giang HCMC Hai Duong
Hau Giang Phu Yen Bac Giang Ha Noi Son La Lai Chau Binh Phuoc Quang Tri Bac Lieu
Ha Nam Gia Lai Ca Mau Binh Thuan Dak Nong Lao Cai Dong Nai Nghe An Binh Dinh
Binh Duong Lang Son Can Tho Yen Bai An Giang Bac Ninh Phu Tho Quang Binh Dong Thap
Thanh Hoa Hai Phong Ha Tinh Long An Thai Nguyen Bac Kan BRVT Kon Tum Thai Binh
Tay Ninh Nam Dinh Vinh Long Ninh Thuan Hung Yen Tuyen Quang Ben Tre Ninh Binh Quang Ninh
Vinh Phuc Perfect

2018 PROVINCIAL PERFORMANCE BY DIMENSIONSCHAPTER 3 79
Dimension 6: Public Service Delivery
The Public Service Delivery dimension looks at four public services: public health care, primary public education, basic infrastructure, and residential law and order. To inform this dimension, citizens are asked about their direct experiences with the accessibility, quality, and availability of these services. In 2018, three indicators were added to this dimension: one new indicator on stable power supply to households was added to the Basic Infrastructure sub-dimension, and two new indicators tracking if citizens feel safe walking alone outside during the day and night were added to the Law and Order sub-dimension. These indicators help inform Viet Nam’s progress in these specific areas that are also part of the Sustainable Development Goals.
Below are snapshots of key findings about provincial performance in provision of public services to citizens. First, Box 3.6 highlights key findings at the local level. Map 3.6 then presents the aggregate dimensional scores of 63 provinces by four quartiles. Table 3.6a shows sub-dimensional and indicator results for 2018 and changes over the three years from 2016 to 2018. In addition, Table 3.6b presents a dashboard of 2018 provincial performance by four quartiles at both dimensional and sub-dimensional levels. Figures 3.6a and 3.6b summarize citizens’ assessment of the quality of public primary education and health care services by province, based on national standards, while Figure 3.6c presents a snapshot of residential safety in each province.
Box 3.6: Key Findings from Dimension 6: Public Service Delivery
y Scores for the Public Service Delivery dimension were at the high-average level in 2018, with provincial scores ranging from 6.58 to 7.68 points (on the 1 to 10-point scale). The gap between provinces in this dimension is also narrow, implying that provinces across the country performed equally well in provision of public services in primary education, health care, basic infrastructure, and law and order. In particular, there has been consistent improvement in public health care since 2016, reflected in better provincial scores in almost every indicator of this sub-dimension.
y Among the four sub-dimensions, the best scoring in 2018 was Basic Infrastructure with an aggregate sub-dimensional score of 2.05 point (on the scale from 0.25 to 2.5 points). Next is the sub-dimension of Public Health Care with 1.98 points. The Law and Order sub-dimensional score was relatively lower in 2018 than in 2017; fewer respondents said they felt their localities were safer compared to three years ago.
y Regional patterns in this dimension were similar to previous years. Northern Mountainous, Central Highlands and Central provinces scored relatively low in 2018; four out of five Central Highlands provinces were in the poorest-performing group in this dimension. Industrial and rich provinces like Dong Nai and Binh Duong were also rated as poor performers in public health, public education and law and order.
y Provincial performance in several indicators measuring quality of public services is worth highlighting. In total quality of public district hospitals, Vinh Long scored highest at 7.85 points (on the 1 to 10-point scale). On total quality of primary schools, Bac Ninh received the highest score with 6.25 points, about double the score of Dak Lak for the same indicator. For the indicator measuring residential crime rates, Quang Binh, Binh Thuan and Binh Duong were the lowest scoring provinces.
y Overall, the results for this dimension show that provinces performed at the above-average level in 2018. The aggregated score of 7.10 points from a maximum of 10, however, suggests that provinces have room to enhance the quality of public services. Based on citizens’ responses, local authorities should focus on addressing law and order issues. Cities and industrial provinces, in particular, should pay attention to public service quality and accessibility given citizens’ rising expectations.
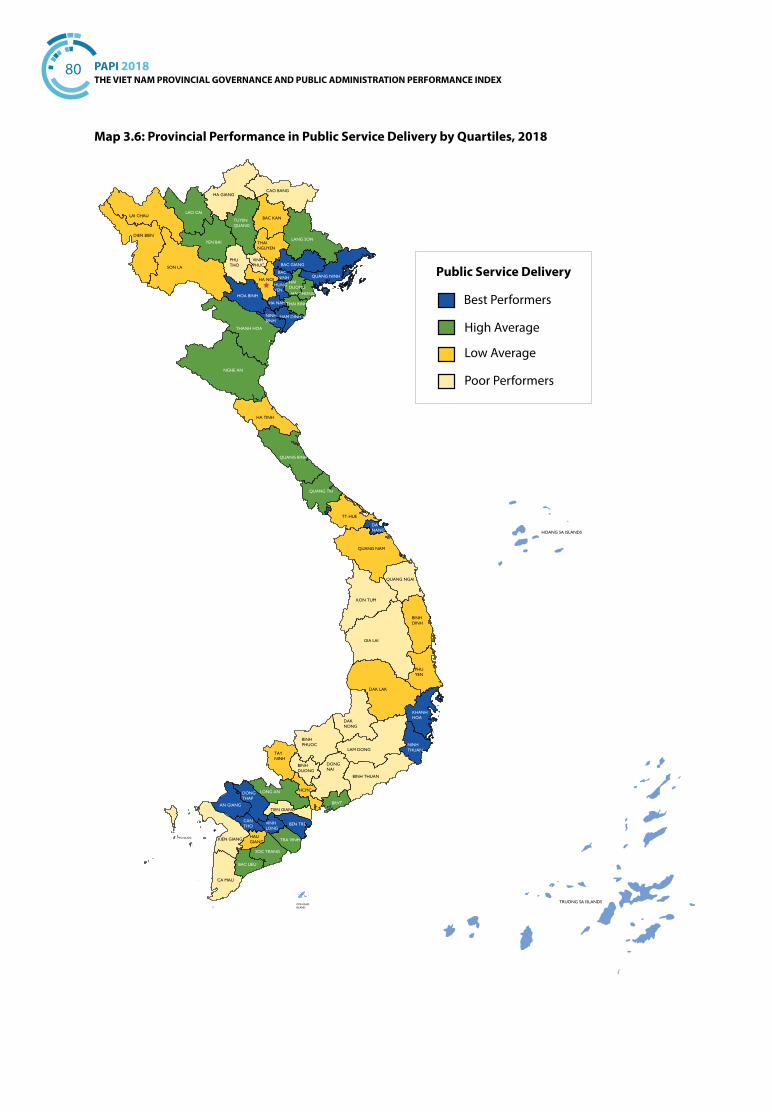
80 PAPI 2018THE VIET NAM PROVINCIAL GOVERNANCE AND PUBLIC ADMINISTRATION PERFORMANCE INDEX
Map 3.6: Provincial Performance in Public Service Delivery by Quartiles, 2018
Public Service Delivery
Best Performers
High Average
Low Average
Poor Performers

2018 PROVINCIAL PERFORMANCE BY DIMENSIONSCHAPTER 3 81
Tabl
e 3.
6a: P
ublic
Ser
vice
Del
iver
y (D
imen
sion
6):
Resu
lts
by In
dica
tors
in 2
018,
and
from
201
6 to
201
8
Dim
ensi
on a
nd
Sub-
Dim
ensi
ons
Nam
e of
Indi
cato
rSc
ale
Nat
iona
l Mea
n O
ver T
ime
Prov
inci
al 2
018
PAPI
Sco
re R
ange
on
1-1
0 Po
int S
cale
Min
Max
PAPI
201
6PA
PI 2
017
PAPI
201
8*St
atus
Scor
es
Tota
l Dim
ensi
onD
imen
sion
6: P
ublic
Ser
vice
D
eliv
ery
110
7.10
7.15
7.10
Min
imum
6.58
Med
ian
7.03
Max
imum
7.68
Sub-
Dim
ensi
on 1
Publ
ic H
ealth
0.25
2.5
1.85
1.9
1.98
Min
imum
1.60
Med
ian
2.00
Max
imum
2.20
Sub-
Dim
ensi
on 2
Publ
ic E
duca
tion*
0.25
2.5
1.70
1.65
1.63
Min
imum
1.20
Med
ian
1.65
Max
imum
2.13
Sub-
Dim
ensi
on 3
Basi
c In
frast
ruct
ure*
0.25
2.5
1.89
1.93
2.05
Min
imum
1.66
Med
ian
2.00
Max
imum
2.33
Sub-
Dim
ensi
on 4
Law
and
Ord
er*
0.25
2.5
1.65
1.65
1.45
Min
imum
1.26
Med
ian
1.45
Max
imum
1.55
S1. P
ublic
Hea
lth
Popu
latio
n w
ith H
ealth
Insu
ranc
e (%
)0%
100%
72.3
1%79
.42%
86.6
5%
Min
imum
75.3
5%
Med
ian
88.3
7%
Max
imum
97.7
9%
Qua
lity
of H
ealth
Insu
ranc
e (4
pt
scal
e)0
3.48
3.48
3.53
Min
imum
3.07
4M
edia
n3.
52
Max
imum
3.74
Qua
lity
of F
ree
Med
ical
Car
e fo
r Ch
ildre
n (5
pt s
cale
)0
54.
184.
094.
15
Min
imum
3.62
Med
ian
4.14
Max
imum
4.74
Poor
Hou
seho
lds
are
Subs
idiz
ed w
ith
Hea
lth In
sura
nce
(%)
0%10
0%72
.99%
75.7
%79
.65%
Min
imum
54.5
3%
Med
ian
81.7
2%
Max
imum
94.2
3%

82 PAPI 2018THE VIET NAM PROVINCIAL GOVERNANCE AND PUBLIC ADMINISTRATION PERFORMANCE INDEX
Dim
ensi
on a
nd
Sub-
Dim
ensi
ons
Nam
e of
Indi
cato
rSc
ale
Nat
iona
l Mea
n O
ver T
ime
Prov
inci
al 2
018
PAPI
Sco
re R
ange
on
1-1
0 Po
int S
cale
Min
Max
PAPI
201
6PA
PI 2
017
PAPI
201
8*St
atus
Scor
es
Chec
ks fo
r Chi
ldre
n ar
e Fr
ee (%
)70
.05%
71.9
6%78
.22%
Min
imum
52.3
3%
0%10
0%M
edia
n80
.10%
Max
imum
97.7
9%
Tota
l Hos
pita
l Qua
lity
(10
crite
ria)
5.22
5.12
5.97
Min
imum
3.13
010
Med
ian
6.42
Max
imum
7.85
S2. P
ublic
Edu
catio
n
Kilo
met
re W
alk
to S
choo
l1.
021.
111.
07
Min
imum
0.50
Min
Max
Med
ian
1
Max
imum
2
Num
ber o
f Min
utes
Tra
velli
ng to
Sc
hool
8.97
8.91
9.86
Min
imum
5
Min
Max
Med
ian
10
Max
imum
15
Ove
rall
Ratin
g of
Prim
ary
Scho
ol (5
pt
sca
le)
3.99
4.02
4.13
Min
imum
3.75
05
Med
ian
4.08
Max
imum
4.79
Tota
l Sch
ool Q
ualit
y (8
Crit
eria
)*4.
994.
664.
88
Min
imum
3.54
08
Med
ian
4.91
Max
imum
6.25
S3. I
nfra
stru
ctur
e
Hou
seho
lds
with
Ele
ctric
ity (%
)98
.48%
98.4
%99
.39%
Min
imum
88.5
2%
0%10
0%M
edia
n99
.83%
Max
imum
100%
No
Pow
er C
ut o
ver t
he P
ast 1
2 M
onth
s (%
)*0%
100%
14.9
8%
Min
imum
1.06
%
Med
ian
11.9
2%
Max
imum
49.8
0%
Qua
lity
of R
oad
(1=A
ll D
irt; 4
=All
Asp
halt)
3.05
3.04
3.26
Min
imum
2.54
14
Med
ian
3.26
Max
imum
3.58

2018 PROVINCIAL PERFORMANCE BY DIMENSIONSCHAPTER 3 83
Dim
ensi
on a
nd
Sub-
Dim
ensi
ons
Nam
e of
Indi
cato
rSc
ale
Nat
iona
l Mea
n O
ver T
ime
Prov
inci
al 2
018
PAPI
Sco
re R
ange
on
1-1
0 Po
int S
cale
Min
Max
PAPI
201
6PA
PI 2
017
PAPI
201
8*St
atus
Scor
es
Freq
uenc
y of
Gar
bage
Pic
k-up
(0
=Nev
er; 4
=Eve
ry D
ay)
04
2.18
2.3
2.54
Min
imum
0.92
Med
ian
2.34
Max
imum
3.91
Shar
e D
rinki
ng T
ap W
ater
(%)
49.4
2%54
.58%
60.0
7%
Min
imum
6.45
%
0%10
0%M
edia
n52
.07%
Max
imum
99.3
9%
Shar
e D
rinki
ng U
ncle
an W
ater
(%)
6.11
%6.
14%
4.41
%
Min
imum
0.00
%
0%10
0%M
edia
n0.
66%
Max
imum
58.8
2%
S4. L
aw a
nd O
rder
How
Saf
e is
Loc
ality
(3=V
ery
Safe
)2.
142.
142.
21
Min
imum
1.76
13
Med
ian
2.22
Max
imum
2.39
Chan
ge in
Saf
ety
Ove
r Tim
e11
.42%
12.0
1%11
.72%
Min
imum
-14.
67%
Min
Max
Med
ian
10.6
0%
Max
imum
26.3
5%
Crim
e Ra
te in
Loc
ality
(% V
ictim
s of
Cr
ime)
14.6
2%15
.44%
12.3
7%
Min
imum
1.27
%
0%10
0%M
edia
n10
.86%
Max
imum
25.7
7%
Feel
ing
Safe
Wal
king
in th
e D
ay T
ime
(3=V
ery
Safe
)*1
32.
33
Min
imum
2.04
Med
ian
2.35
Max
imum
2.53
Feel
ing
Safe
Wal
king
in th
e N
ight
Ti
me
(3=V
ery
Safe
)*1
31.
97
Min
imum
1.53
Med
ian
2.01
Max
imum
2.28
Not
e: (*
) Sub
-dim
ensi
ons a
nd in
dica
tors
with
cha
nges
in 2
018.
Com
para
bilit
y ap
plie
s for
indi
cato
rs w
ithou
t an
aste
risk
(*).
Min
= M
inim
um sc
ore;
Max
= M
axim
um sc
ore.

84 PAPI 2018THE VIET NAM PROVINCIAL GOVERNANCE AND PUBLIC ADMINISTRATION PERFORMANCE INDEX
Table 3.6b: Dashboard of Provincial Performance in Public Service Delivery, 2018
Province Name 6: Public Service Delivery 6.1: Public Health 6.2: Public Education 6.3: Basic Infrastructure 6.4: Law and Order
Ha Noi 6.93 1.87 1.62 2.00 1.44
Ha Giang 6.86 2.01 1.69 1.79 1.37
Cao Bang 6.73 1.99 1.64 1.83 1.26
Bac Kan 7.00 1.99 1.61 1.96 1.44
Tuyen Quang 7.18 2.01 1.68 2.01 1.49
Lao Cai 7.17 1.98 1.65 2.04 1.51
Dien Bien 6.96 2.00 1.59 1.94 1.43
Lai Chau 7.01 1.85 1.71 1.98 1.47
Son La 6.95 2.05 1.67 1.76 1.47
Yen Bai 7.16 2.05 1.66 1.97 1.48
Hoa Binh 7.31 1.95 1.81 2.08 1.48
Thai Nguyen 7.03 1.93 1.66 1.96 1.47
Lang Son 7.14 2.05 1.65 1.92 1.52
Quang Ninh 7.44 2.11 1.65 2.13 1.54
Bac Giang 7.37 1.98 1.67 2.16 1.55
Phu Tho 6.87 1.94 1.60 1.88 1.44
Vinh Phuc 6.92 1.93 1.59 1.94 1.45
Bac Ninh 7.36 2.06 1.72 2.14 1.45
Hai Duong 7.17 2.00 1.67 2.10 1.40
Hai Phong 7.14 1.60 1.78 2.31 1.44
Hung Yen 7.34 1.98 1.88 2.02 1.46
Thai Binh 7.22 2.08 1.68 2.02 1.44
Ha Nam 7.53 1.99 2.12 2.01 1.41
Nam Dinh 7.45 2.04 1.87 2.02 1.51
Ninh Binh 7.35 2.04 1.73 2.05 1.53
Thanh Hoa 7.17 1.98 1.66 2.08 1.45
Nghe An 7.20 2.02 1.75 2.00 1.44
Ha Tinh 6.97 2.07 1.62 1.84 1.44
Quang Binh 7.28 2.10 1.90 1.88 1.40
Quang Tri 7.06 2.02 1.64 1.99 1.42
Thua Thien-Hue 7.00 2.05 1.28 2.16 1.52
Da Nang 7.68 1.95 1.92 2.30 1.50
Quang Nam 7.02 1.99 1.64 1.89 1.51
Quang Ngai 6.72 2.10 1.44 1.66 1.53
Binh Dinh 6.94 1.88 1.67 1.95 1.44
Phu Yen 6.95 2.11 1.61 1.74 1.49
Khanh Hoa 7.48 1.97 2.13 2.00 1.39
Ninh Thuan 7.68 2.10 1.94 2.11 1.53
Binh Thuan 6.87 1.95 1.57 2.00 1.36
Kon Tum 6.74 2.02 1.62 1.83 1.28
Gia Lai 6.72 1.87 1.63 1.82 1.40
Dak Lak 6.98 1.90 1.70 1.93 1.45
Dak Nong 6.58 2.08 1.24 1.89 1.37
Lam Dong 6.83 1.86 1.52 2.00 1.45
Binh Phuoc 6.72 1.84 1.39 2.02 1.47
Tay Ninh 7.01 2.03 1.49 2.02 1.48
Binh Duong 6.58 1.86 1.20 2.07 1.44
Dong Nai 6.81 1.86 1.60 2.00 1.35
Ba Ria-Vung Tau 7.29 1.92 1.60 2.31 1.45
Ho Chi Minh City 6.93 1.79 1.57 2.25 1.32
Long An 7.12 1.90 1.67 2.06 1.50
Tien Giang 6.82 2.09 1.65 1.67 1.42
Ben Tre 7.31 2.05 1.75 2.09 1.43
Tra Vinh 7.06 1.85 1.67 2.04 1.51
Vinh Long 7.32 2.09 1.52 2.24 1.47
Dong Thap 7.36 2.20 1.70 1.95 1.50
An Giang 7.49 2.02 1.70 2.33 1.44
Kien Giang 6.88 1.99 1.28 2.13 1.48
Can Tho 7.40 2.07 1.68 2.11 1.54
Hau Giang 6.95 2.03 1.36 2.08 1.48
Soc Trang 7.03 2.02 1.65 1.89 1.48
Bac Lieu 7.27 2.05 1.64 2.15 1.44
Ca Mau 6.79 2.04 1.46 1.84 1.45
Note: Figures are mean scores based on a scale of 1-10 points for the dimensional level (the first left column), and a scale of 0.25-2.5 points for the sub-dimensional levels (the other four columns). Blue is for best performers (16 provinces); green for high-average performers (16 provinces); orange for low-average performers (15 provinces); and light yellow for poor performers (16 provinces). The provincial order is by provincial codes.

2018 PROVINCIAL PERFORMANCE BY DIMENSIONSCHAPTER 3 85
Figure 3.6a: Citizens’ Assessment of Quality of Public Primary Schools, 2018(Branch size = percentage of respondents agreeing to provided positive statements; Perfect = 100% agreement)
Brick walls
Clean toilets
Free drinking water
Less than 36 students
Less than 3 shifts
No favoritism from teachers
Regular feedback
Informed of school revenue
Zero Dak Lak Hai Phong Binh Duong HCMC Binh Thuan Dong Nai Kon Tum Dien Bien
Binh Phuoc Bac Kan Vinh Phuc Soc Trang Kien Giang Quang Binh Gia Lai Ha Nam Hau Giang
Ha Noi Khanh Hoa Lao Cai Dak Nong Ca Mau Phu Tho Phu Yen BRVT Lai Chau
Nam Dinh Quang Nam Bac Giang Ninh Thuan Bac Lieu Tra Vinh Long An Tien Giang Da Nang
Nghe An Can Tho Tuyen Quang Quang Ninh Lang Son TT-Hue Quang Ngai Thai Binh Thanh Hoa
Quang Tri Cao Bang Ha Tinh Binh Dinh Hoa Binh Son La Dong Thap Thai Nguyen An Giang
Yen Bai Hai Duong Vinh Long Lam Dong Hung Yen Ben Tre Tay Ninh Ha Giang Ninh Binh
Bac Ninh Perfect
Figure 3.6b: Citizens’ Assessment of Quality of Public District Hospitals, 2018(Branch size = percentage of respondents agreeing to provided positive statements; Perfect = 100% agreement)
Electric fan
Clean restroom
Regular visits by sta�
Treated with respect
Reasonable expenses
Reasonable waiting period
Disease/Injury cured
Private pharmacy
Satisfaction with service
Zero Gia Lai Lai Chau Binh Dinh HCMC Hai Phong Binh Duong Dong Nai Ha Noi
Nghe An TT-Hue Bac Giang Quang Tri Bac Kan Vinh Phuc Long An Dak Lak Hai Duong
Nam Dinh Thanh Hoa Ca Mau Ben Tre Thai Nguyen Hung Yen Binh Phuoc Hau Giang Da Nang
Khanh Hoa Lao Cai Quang Nam Lam Dong BRVT Soc Trang Phu Tho Kon Tum Tien Giang
An Giang Ha Tinh Tra Vinh Ninh Thuan Tay Ninh Ha Giang Hoa Binh Can Tho Quang Binh
Ha Nam Tuyen Quang Quang Ninh Binh Thuan Quang Ngai Son La Phu Yen Dak Nong Kien Giang
Cao Bang Dien Bien Ninh Binh Bac Lieu Thai Binh Lang Son Yen Bai Dong Thap Bac Ninh
Vinh Long Perfect
No shared beds

86 PAPI 2018THE VIET NAM PROVINCIAL GOVERNANCE AND PUBLIC ADMINISTRATION PERFORMANCE INDEX
Figure 3.6c: Percentage of Respondents Who Were Victims of Crime, 2018
0 5 10 15 20 25
0 5 10 15 20 25 0 5 10 15 20 25 0 5 10 15 20 25 0 5 10 15 20 25 0 5 10 15 20 25 0 5 10 15 20 25 0 5 10 15 20 25
Ha Noi Ha Giang Cao Bang Bac Kan Tuyen Quang Lao Cai Dien Bien Lai Chau
Son La Yen Bai Hoa Binh Thai Nguyen Lang Son Quang Ninh Bac Giang Phu Tho
Vinh Phuc Bac Ninh Hai Duong Hai Phong Hung Yen Thai Binh Ha Nam Nam Dinh
Ninh Binh Thanh Hoa Nghe An Ha Tinh Quang Binh Quang Tri TT-Hue Da Nang
Quang Nam Quang Ngai Binh Dinh Phu Yen Khanh Hoa Ninh Thuan Binh Thuan Kon Tum
Gia Lai Dak Lak Dak Nong Lam Dong Binh Phuoc Tay Ninh Binh Duong Dong Nai
BRVT HCMC Long An Tien Giang Ben Tre Tra Vinh Vinh Long Dong Thap
An Giang Kien Giang Can Tho Hau Giang Soc Trang Bac Lieu Ca Mau
Vehicle Theft Robbery
Break-in Physcial Violence

2018 PROVINCIAL PERFORMANCE BY DIMENSIONSCHAPTER 3 87
Box 3.7: Key Findings from Dimension 7: Environmental Governance
y Overall, the dimensional scores for Environmental Governance were well below the average level; provincial scores ranged from 3.54 to 6.74 points (on the 1 to 10-point scale). The gap between the highest and lowest scoring provinces in this dimension is large, implying that citizens in different provinces experience quite varied environmental quality.
y Among the three sub-dimensions, the highest scoring was Quality of Air, with an aggregate sub-dimensional score of 1.99 points (on the scale of 0.33 to 3.33 points). The next highest was the sub-dimension Sincerity in Environmental Protection with a score of 1.97 points. The greatest environmental concern for citizens in this dimension was quality of water, as the mean national score for the Quality of Water sub-dimension was just 0.67 points, far below the maximum possible score of 3.33 points.
y Citizens in the Mekong Delta region and the mountainous areas in the North tend to rate air quality, water quality, and firms’ seriousness with environmental protection higher than in other regions. The three centrally governed municipalities of Hai Phong, Ho Chi Minh City and Ha Noi were in the poorest performing group for all sub-dimensions. So were Central Highlands provinces and industrial provinces like Binh Duong, Dong Nai, Vinh Phuc and Thai Nguyen.
y At the sub-dimensional level, there were large differences between the highest and lowest scoring provinces, and also a significant gap between the scores of the best performing provinces and the maximum possible score of 3.33 points for each sub-dimension. For instance, in the Quality of Water sub-dimension, Dong Thap received 1.83 points while Bac Ninh only received 0.34 points. Dong Thap also scored highest in the sub-dimension Seriousness in Environmental Protection, with 2.77 points, meaning a higher proportion of citizens there believe that firms have not paid bribes to avoid compliance with environmental standards. Hai Phong received only 1.44 points in this sub-dimension. On the Quality of Air sub-dimension, Quang Ninh scored highest score with 2.44 points, while Ha Nam received only 1.44 points.
y The findings indicate that citizens in all provinces were not happy with environmental governance performance in 2018. Scores in the available measurable indicators provide worrying signs for air quality, water quality and firms’ seriousness in complying with environmental protection standards. Scores in 2018 for this dimension represent a starting point for local governments, helping them to understand citizen perceptions in this area, and where provinces should focus their energies in order to address environmental challenges in their provinces. Indeed, given that air, water and some other types of environmental pollutants can move across provincial boundaries, provincial leaders need to collaborate with neighbouring provinces to find common solutions that go beyond applying strict measures to prevent environmental pollution within their provinces.
Dimension 7: Environmental Governance
The new dimension of Environmental Governance reflects citizens’ assessment of two environmental aspects critical to their health: air and water quality. To inform this dimension, citizens are asked about the quality of air they breathe daily and the quality of water coming from waterways nearest to their home. In addition, citizens are asked if owners of investment projects in their localities would pay bribes to avoid compliance with environmental standards, a key reason for environmental disputes in Viet Nam in recent years.38
The dimension sets some baselines to assist local governments in understanding citizens’ environmental
38 See National Economics University and United Nations Development Programme (2018).
concerns over time. It also informs local governments about hotspots of environmental concern so that they can work towards addressing them.
Below are snapshots of key findings for citizens’ concerns about environmental conditions in their localities. First, Box 3.7 highlights key findings at the provincial levels. Map 3.7 then presents the aggregate dimensional scores of 63 provinces by four quartiles. Table 3.7a shows sub-dimensional and indicator results for 2018, while Table 3.7b and Figure 3.7 present a dashboard of 2018 provincial performance by four quartiles at both dimensional and sub-dimensional levels.

88 PAPI 2018THE VIET NAM PROVINCIAL GOVERNANCE AND PUBLIC ADMINISTRATION PERFORMANCE INDEX
Map 3.7: Provincial Performance in Environmental Governance by Quartiles, 2018
Environmental Governance
Best Performers
High Average
Low Average
Poor Performers

2018 PROVINCIAL PERFORMANCE BY DIMENSIONSCHAPTER 3 89
Table 3.7a: Environmental Governance (Dimension 7): Results by Indicators in 2018
Dimension and Sub-Dimensions
Name of IndicatorScale National
Mean Provincial 2018 PAPI Score Range
on 1-10 Point Scale
Min Max PAPI 2018 Status Scores
Total Dimension
Dimension 7: Environmental Governance
1 10 4.63
Minimum 3.54
Median 4.51
Maximum 6.74
Sub-Dimension 1 Seriousness in Environment Protection 0.33 3.33 1.97
Minimum 1.44
Median 1.94
Maximum 2.77
Sub-Dimension 2 Quality of Air 0.33 3.33 1.99
Minimum 1.50
Median 1.99
Maximum 2.44
Sub-Dimension 3 Quality of Water 0.34 3.34 0.67
Minimum 0.34
Median 0.57
Maximum 1.83
S1: Seriousness in Environment Protection
Firms in Locality Not Giving Bribes to Avoid Environmental Responsibility (% in agreement)
0% 100% 54.54%
Minimum 36.84%
Median 53.4%
Maximum 81.32%
S2: Quality of Air
Not Wearing Masks to Avoid Polluted Air (%) 0% 100% 42.98%
Minimum 22.77%
Median 42.82%
Maximum 68.51%
Rating of Air Quality as Good (%) 0% 100% 83.86%
Minimum 57.20%
Median 86.51%
Maximum 95.22%
Better Air Quality than 3 Years ago (%) 0% 100% 38.44%
Minimum 12.82%
Median 36.37%
Maximum 57.77%
S3: Quality of Water
Water from Nearby Waterways Good Enough to Drink (%)
0% 100% 3.74%
Minimum 0.00%
Median 2.33%
Maximum 20.44%
Water from Nearby Waterways Good Enough to Wash Clothes (%)
14.01%
Minimum 0.22%
0% 100% Median 9.46%
Maximum 64.69%
Water from Nearby Waterways Good Enough to Swim (%)
15.95%
Minimum 0.45%
0% 100% Median 10.72%
Maximum 64.59%
Note: (*) Min = Sample Minimum; Max = Sample Maximum.

90 PAPI 2018THE VIET NAM PROVINCIAL GOVERNANCE AND PUBLIC ADMINISTRATION PERFORMANCE INDEX
Table 3.7b: Dashboard of Provincial Performance in Environmental Governance, 2018
Province Name 7: Environmental Governance 7.1: Sincerity of Environmental Protection 7.2: Quality of Air 7.3: Quality of Water
Ha Noi 3.58 1.49 1.69 0.40
Ha Giang 4.57 1.76 2.07 0.74
Cao Bang 4.92 1.73 1.96 1.22
Bac Kan 4.89 1.96 2.17 0.76
Tuyen Quang 4.37 1.94 1.94 0.49
Lao Cai 4.30 1.61 2.08 0.61
Dien Bien 4.85 1.81 2.33 0.70
Lai Chau 4.72 1.97 2.07 0.68
Son La 4.49 1.93 2.07 0.49
Yen Bai 4.51 1.84 2.12 0.55
Hoa Binh 3.89 1.57 1.77 0.55
Thai Nguyen 3.66 1.62 1.67 0.37
Lang Son 5.19 2.38 2.09 0.73
Quang Ninh 5.93 2.47 2.44 1.02
Bac Giang 4.88 2.01 2.16 0.71
Phu Tho 4.64 2.09 2.03 0.52
Vinh Phuc 4.08 1.94 1.71 0.44
Bac Ninh 4.50 2.01 2.15 0.34
Hai Duong 4.20 1.66 1.94 0.60
Hai Phong 3.70 1.44 1.88 0.38
Hung Yen 3.54 1.62 1.51 0.40
Thai Binh 4.22 1.72 2.07 0.43
Ha Nam 3.59 1.45 1.50 0.65
Nam Dinh 4.47 1.87 2.08 0.51
Ninh Binh 4.63 1.98 2.04 0.60
Thanh Hoa 4.62 1.83 2.12 0.67
Nghe An 4.48 1.98 1.93 0.57
Ha Tinh 4.39 1.86 1.84 0.68
Quang Binh 4.76 2.03 1.89 0.84
Quang Tri 4.76 2.33 1.93 0.49
Thua Thien-Hue 4.79 2.10 1.91 0.78
Da Nang 4.10 1.85 1.90 0.35
Quang Nam 4.68 2.06 1.90 0.72
Quang Ngai 4.34 1.85 1.95 0.54
Binh Dinh 4.02 1.77 1.72 0.52
Phu Yen 4.93 2.05 2.04 0.84
Khanh Hoa 4.43 1.93 1.90 0.60
Ninh Thuan 4.87 2.12 2.11 0.64
Binh Thuan 4.07 1.81 1.91 0.35
Kon Tum 3.98 1.61 1.93 0.44
Gia Lai 4.20 1.81 2.00 0.39
Dak Lak 4.06 1.67 1.97 0.42
Dak Nong 4.36 2.01 1.94 0.41
Lam Dong 3.85 1.52 1.87 0.46
Binh Phuoc 4.03 1.74 1.86 0.43
Tay Ninh 4.94 2.51 2.08 0.35
Binh Duong 4.22 1.91 1.93 0.38
Dong Nai 4.26 1.85 1.99 0.42
Ba Ria-Vung Tau 4.22 1.78 2.07 0.37
Ho Chi Minh City 3.67 1.59 1.73 0.35
Long An 4.63 2.12 2.01 0.49
Tien Giang 4.80 2.16 1.90 0.75
Ben Tre 5.41 2.45 1.96 1.00
Tra Vinh 4.83 2.14 2.07 0.63
Vinh Long 5.75 2.09 2.20 1.46
Dong Thap 6.74 2.77 2.14 1.83
An Giang 5.67 2.25 2.19 1.23
Kien Giang 4.99 2.33 2.16 0.50
Can Tho 5.83 2.25 2.21 1.37
Hau Giang 5.64 2.10 2.16 1.38
Soc Trang 5.02 2.07 2.13 0.82
Bac Lieu 4.58 2.00 1.99 0.59
Ca Mau 5.09 2.19 2.21 0.69
Note: Figures are mean scores based on a scale of 1-10 points for the dimensional level (the first left column), and a scale of 0.33-3.33 points for sub-dimensional levels (the other three columns). Blue is for best performers (16 provinces); green for high-average performers (16 provinces); orange for low-average performers (15 provinces); and light yellow for poor performers (16 provinces). The provincial order is by provincial codes.

2018 PROVINCIAL PERFORMANCE BY DIMENSIONSCHAPTER 3 91
Figure 3.7: Dashboard of Provincial Performance in Environmental Governance, 2018 (Branch size = scores of provinces by sub-dimensions; Perfect = 10 points in total, or 3.33 for each sub-dimension)
Sincerity of Environmental Protection
Quality of Air
Quality of Water
Zero Hung Yen Ha Noi Ha Nam Thai Nguyen HCMC Hai Phong Lam Dong Hoa Binh
Kon Tum Binh Dinh Binh Phuoc Dak Lak Binh Thuan Vinh Phuc Da Nang Hai Duong Gia Lai
Binh Duong Thai Binh BRVT Dong Nai Lao Cai Quang Ngai Dak Nong Tuyen Quang Ha Tinh
Khanh Hoa Nam Dinh Nghe An Son La Bac Ninh Yen Bai Ha Giang Bac Lieu Thanh Hoa
Ninh Binh Long An Phu Tho Quang Nam Lai Chau Quang Binh Quang Tri TT-Hue Tien Giang
Tra Vinh Dien Bien Ninh Thuan Bac Giang Bac Kan Cao Bang Phu Yen Tay Ninh Kien Giang
Soc Trang Ca Mau Lang Son Ben Tre Hau Giang An Giang Vinh Long Can Tho Quang Ninh
Dong Thap Perfect

92 PAPI 2018THE VIET NAM PROVINCIAL GOVERNANCE AND PUBLIC ADMINISTRATION PERFORMANCE INDEX
Dimension 8: E-Governance
This new E-Governance dimension presents citizens’ assessments of two overlapping aspects of e-government: availability and accessibility of online public services. This dimension provides information about the availability of local government online portals for citizens to use; the accessibility of government policies on these portals; and whether citizens have Internet access—the enabling environment for citizens to participate in e-government. This new dimension aims at i) creating baselines so that provincial governments can better understand the conditions for e-government in their localities, and ii) assisting local governments so that they can more effectively interact with citizens via
Box 3.8: Key Findings from Dimension 8: E-Governance
y Provincial scores in the E-Governance dimension were very low, ranging from 1.93 to 4.24 points (on the scale of 1 to 10 points). The gap between provinces is significant, implying that implementation of e-governance policy remains a huge challenge, but is also, therefore, an opportunity for provinces and users alike. Regional patterns in this dimension are clear: better performing provinces were mostly in the North, with the geographic concentration greatest in the Access to E-government Portals sub-dimension.
y Of the two sub-dimensions, Access to the Internet by citizens was the highest scoring, with a modest aggregate sub-dimensional score of 2.4 points (on the scale from 0.5 to 5 points). The sub-dimension of Access to E-Government Portals remains very weak, with a very low score of 0.59 points. This suggests that the usage of online government portals for government information and administrative procedures was very limited in 2018, even though e-government portals have been in existence for almost a decade (since the 2011-2020 Public Administration Reforms agenda was enacted in 2011).
y At the sub-dimensional level, the gaps between the highest and lowest provincial scores were narrow, implying that provinces do not differ much in their performance. Among the five centrally governed municipalities, Da Nang and Ho Chi Minh City were the better performers. Da Nang scored the highest in both sub-dimensions, although the scores were very low at 0.77 points in the Access to Government Portals sub-dimension, and 3.47 points in the Access to the Internet sub-dimension.
y In sum, this dimension provides for the first time some baselines on e-governance at the provincial level (following the promotion and development of e-government at the national policy level). The 2018 findings reveal a large gap between what is expected and what is available for citizens and governments in terms of interaction online, especially when the number of Vietnamese Internet users is increasing significantly. The extremely low scores in both sub-dimensions in 2018 imply that local governments should invest much more in improving and promoting e-government portals so that citizens can access and use them to avail of various public services. In particular, local governments should focus on improving the usefulness and user-friendliness of e-government portals and e-services. They should also promote these new mechanisms more effectively so that more citizens become aware of them and use them more often.
online platforms in every stage of the policy cycle—from policymaking and policy implementation to policy monitoring and evaluation.
Below are snapshots of key findings about these aspects of e-governance. Box 3.8 highlights key findings at the provincial level. Map 3.8 presents the aggregate dimensional scores of 63 provinces by four quartiles. Table 3.8a shows sub-dimensional and indicator results for 2018, while Table 3.8b presents a dashboard of 2018 provincial performance by four quartiles at both dimensional and sub-dimensional levels. Lastly, Figure 3.8 shows results of provinces in a dashboard of six indicators, providing information to assist provinces regarding where efforts for e-governance should be focused.

2018 PROVINCIAL PERFORMANCE BY DIMENSIONSCHAPTER 3 93
Map 3.8: Provincial Performance in E-Governance by Quartiles, 2018
E-Governance
Best Performers
High Average
Low Average
Poor Performers

94 PAPI 2018THE VIET NAM PROVINCIAL GOVERNANCE AND PUBLIC ADMINISTRATION PERFORMANCE INDEX
Table 3.8a: E-Governance at the Local Level (Dimension 8): Results by Indicators in 2018
Dimension and Sub-Dimensions
Name of IndicatorScale National
Mean
Provincial 2018 PAPI Score Range
on 1-10 Point Scale
Min Max PAPI 2018 Status Scores
Total Dimension
Dimension 8: E-Governance 1 10 2.99
Minimum 1.93
Median 3.07
Maximum 4.24
Sub-Dimension 1 Access to E-government Portals 0.5 5 0.59
Minimum 0.51
Median 0.59
Maximum 0.77
Sub-Dimension 2 Access to the Internet 0.5 5 2.40
Minimum 1.42
Median 2.45
Maximum 3.47
S1: Access to E-government Portals
Access to Adequate Information about Certification Procedures from Local E-Government Portal (%)
0% 100% 3.48%
Minimum 0%
Median 3.19%
Maximum 9.60%
Access to Adequate Information about Construction Permit Procedures from Local E- government Portal (%)
0% 100% 0.84%
Minimum 0%
Median 0.69%
Maximum 6.60%
Access to Adequate Information about Land Use Rights Certification Procedures from Local E-government Portal (%)
0% 100% 1.35%
Minimum 0%
Median 1.32%
Maximum 4.64%
S2: Access to the Internet
Get Access to Government Information from the Internet (%)
0% 100% 34.79%
Minimum 14.12%
Median 37.80%
Maximum 57.65%
Get Access to the Internet at Home (%) 0% 100% 49.82%
Minimum 26.95%
Median 48.89%
Maximum 79.54%
Note: (*) Min = Sample Minimum; Max = Sample Maximum

2018 PROVINCIAL PERFORMANCE BY DIMENSIONSCHAPTER 3 95
Table 3.8b: Dashboard of Provincial Performance in E-Governance at the Local Level, 2018
Province Name 8: E-Governance 8.1: Access to E-government Portals 8.2: Access to the Internet
Ha Noi 3.32 0.60 2.72
Ha Giang 3.42 0.65 2.77
Cao Bang 3.17 0.72 2.45
Bac Kan 2.92 0.62 2.30
Tuyen Quang 3.47 0.61 2.87
Lao Cai 3.44 0.58 2.86
Dien Bien 2.81 0.62 2.19
Lai Chau 3.10 0.68 2.42
Son La 2.74 0.59 2.15
Yen Bai 3.40 0.67 2.73
Hoa Binh 3.66 0.63 3.02
Thai Nguyen 3.76 0.69 3.08
Lang Son 3.43 0.73 2.70
Quang Ninh 3.70 0.68 3.03
Bac Giang 3.80 0.64 3.16
Phu Tho 2.85 0.55 2.30
Vinh Phuc 3.37 0.63 2.74
Bac Ninh 3.59 0.56 3.03
Hai Duong 3.02 0.58 2.44
Hai Phong 3.65 0.56 3.09
Hung Yen 3.26 0.57 2.70
Thai Binh 3.05 0.60 2.44
Ha Nam 3.14 0.60 2.54
Nam Dinh 2.88 0.59 2.28
Ninh Binh 3.21 0.62 2.60
Thanh Hoa 3.45 0.56 2.89
Nghe An 3.70 0.69 3.01
Ha Tinh 3.32 0.64 2.68
Quang Binh 2.95 0.65 2.30
Quang Tri 3.05 0.55 2.50
Thua Thien-Hue 2.65 0.56 2.09
Da Nang 4.24 0.77 3.47
Quang Nam 2.47 0.54 1.93
Quang Ngai 1.93 0.51 1.42
Binh Dinh 2.73 0.58 2.16
Phu Yen 2.16 0.52 1.63
Khanh Hoa 2.78 0.54 2.24
Ninh Thuan 2.67 0.53 2.14
Binh Thuan 2.63 0.57 2.06
Kon Tum 3.06 0.60 2.46
Gia Lai 3.29 0.59 2.70
Dak Lak 3.07 0.58 2.49
Dak Nong 3.18 0.65 2.53
Lam Dong 3.03 0.60 2.43
Binh Phuoc 3.48 0.58 2.90
Tay Ninh 2.45 0.55 1.90
Binh Duong 3.08 0.61 2.47
Dong Nai 3.19 0.58 2.61
Ba Ria-Vung Tau 3.19 0.56 2.64
Ho Chi Minh City 3.99 0.62 3.37
Long An 2.79 0.56 2.23
Tien Giang 2.10 0.54 1.56
Ben Tre 3.08 0.54 2.54
Tra Vinh 2.68 0.58 2.10
Vinh Long 2.92 0.56 2.35
Dong Thap 2.79 0.60 2.19
An Giang 2.58 0.57 2.01
Kien Giang 2.77 0.56 2.21
Can Tho 2.91 0.57 2.34
Hau Giang 2.07 0.52 1.55
Soc Trang 2.33 0.58 1.75
Bac Lieu 2.40 0.65 1.75
Ca Mau 3.07 0.65 2.43
Note: Figures are mean scores based on a scale of 1-10 points for the dimensional level (the first left column), and a scale of 0.5-5 points for sub-dimensional levels (the other three columns). Blue is for best performers (16 provinces); green for high-average performers (16 provinces); orange for low-average performers (15 provinces); and light yellow for poor performers (16 provinces). The provincial order is by provincial codes.

96 PAPI 2018THE VIET NAM PROVINCIAL GOVERNANCE AND PUBLIC ADMINISTRATION PERFORMANCE INDEX
Figure 3.8: Dashboard of Provincial Performance in E-Governance, 2018 (Branch size = percentage of respondents agreeing to have access to online services and the Internet by province; Zero = 0% in agreement; Perfect = 100% in agreement)
Certi�cation Procedures
Construction Permit Procedures
Land Use Rights Certi�cates Procedures
Information from the Internet
Internet Access at Home
Zero Quang Ngai Hau Giang Tien Giang Phu Yen Soc Trang Bac Lieu Tay Ninh Quang Nam
An Giang Binh Thuan TT-Hue Ninh Thuan Tra Vinh Binh Dinh Son La Kien Giang Khanh Hoa
Dong Thap Long An Dien Bien Phu Tho Nam Dinh Can Tho Vinh Long Bac Kan Quang Binh
Hai Duong Lam Dong Thai Binh Quang Tri Kon Tum Dak Lak Ca Mau Binh Duong Ben Tre
Lai Chau Ha Nam Cao Bang Dak Nong Dong Nai BRVT Ninh Binh Hung Yen Gia Lai
Ha Noi Ha Tinh Vinh Phuc Yen Bai Ha Giang Lang Son Lao Cai Thanh Hoa Tuyen Quang
Binh Phuoc Bac Ninh Hai Phong Hoa Binh Nghe An Quang Ninh Thai Nguyen Bac Giang HCMC
Da Nang Perfect

2018 PROVINCIAL PERFORMANCE BY DIMENSIONSCHAPTER 3 97
Aggregate 2018 PAPI and Implications
This section presents 2018 provincial aggregate performance by quartiles, calculated by adding up each province’s scores in the eight PAPI dimensions. With the aggregate scores, provinces can assess how they perform relative to other provinces with similar socio-economic and geographic endowments. It also suggests a few measures that can help provinces to improve their performance in the years to come.
It is important to reiterate that provincial ranking and comparison is not emphasised in PAPI reports because each of the 63 provinces has unique socio-economic, demographic, and geographic circumstances. As an aggregate index, PAPI serves as a dashboard showing
a province’s performance in a certain year in a holistic manner. To understand what can be done to improve provincial performance, provincial leaders are advised to examine the findings for all indicators of the PAPI dimensions and sub-dimensions for their province.
Below are snapshots of key aggregate findings about provincial performance in governance and public administration in 2018. Box 3.9 highlights key aggregate findings at the provincial level. Map 3.9 presents aggregated provincial PAPI scores by four quartiles. Table 3.9 summarises dimensional scores by province, as does Figure 3.9a which visualises provincial performance in star graphs. Figure 3.9b shows the correlation between the 2018 PAPI and the 2018 Provincial Competitiveness Index (PCI).
Box 3.9: Key Findings from the Aggregate 2018 PAPI
y The 2018 PAPI results imply that provincial governments need to do a lot more to satisfy their citizens’ expectations in all eight dimensions. There was a significant disparity between the highest aggregated provincial score (47.05 points) and the maximum possible aggregated score of 80 points (on the scale of 10-80 points for all eight dimensions). Overall, the governance dimensions continued to reflect lower scores than those on public administrative procedures and public services.
y Each province has its own strengths and weaknesses. None of the 63 provinces excelled in all eight dimensions. For instance, Lang Son and Bac Giang were in the best performing groups in six of the eight dimensions. Still, Bac Giang remained in the low-average performing group for the Vertical Accountability dimension.
y Interestingly, regional patterns have been consistent over time in some dimensions, despite the changes made to the index in 2018. Northern provinces tend to do better in the areas of Participation at Local Levels, Transparency in Local Decision-making, and Vertical Accountability compared to southern provinces. On the contrary, more southern provinces perform better in the dimension Control of Corruption in the Public Sector. However, in the two new dimensions, northern provinces tended to perform better in E-Governance but do more poorly in Environmental Governance than their southern peers.
y A review of the aggregate scores indicate that local governments need to pay attention to each of the PAPI indicators when seeking ways to address citizens’ higher expectations. As the 2018 PAPI findings presented in this chapter show, citizens have demanded more opportunities for increased participation in local decision-making; enhanced transparency and accountability; continued efforts to control corruption in the public sector; greater attention paid to managing the environment (the most problematic issue); and improved e-governance so that governments and citizens can interact virtually to provide/obtain basic information about public policy and public services. Meeting such legitimate citizen demands requires both holistic and context-based policies and practical measures to assist and incentivise local governments to function for the interests of all citizens. These measures may include, among others, regular and ad-hoc monitoring of local governments’ functioning (by both government and non-government entities), openness and responsiveness to feedback from citizens, and deliberative participatory processes to engage citizens in decision-making and policy implementation. Open government at all level may be the next reform endeavour to meet the rising expectations of Vietnamese citizens.

98 PAPI 2018THE VIET NAM PROVINCIAL GOVERNANCE AND PUBLIC ADMINISTRATION PERFORMANCE INDEX
Map 3.9: Provincial Performance in Governance and Public Administration by Quartiles, 2018
Unweighted 2018 PAPI
Best Performers
High Average
Low Average
Poor Performers
Data Not Available
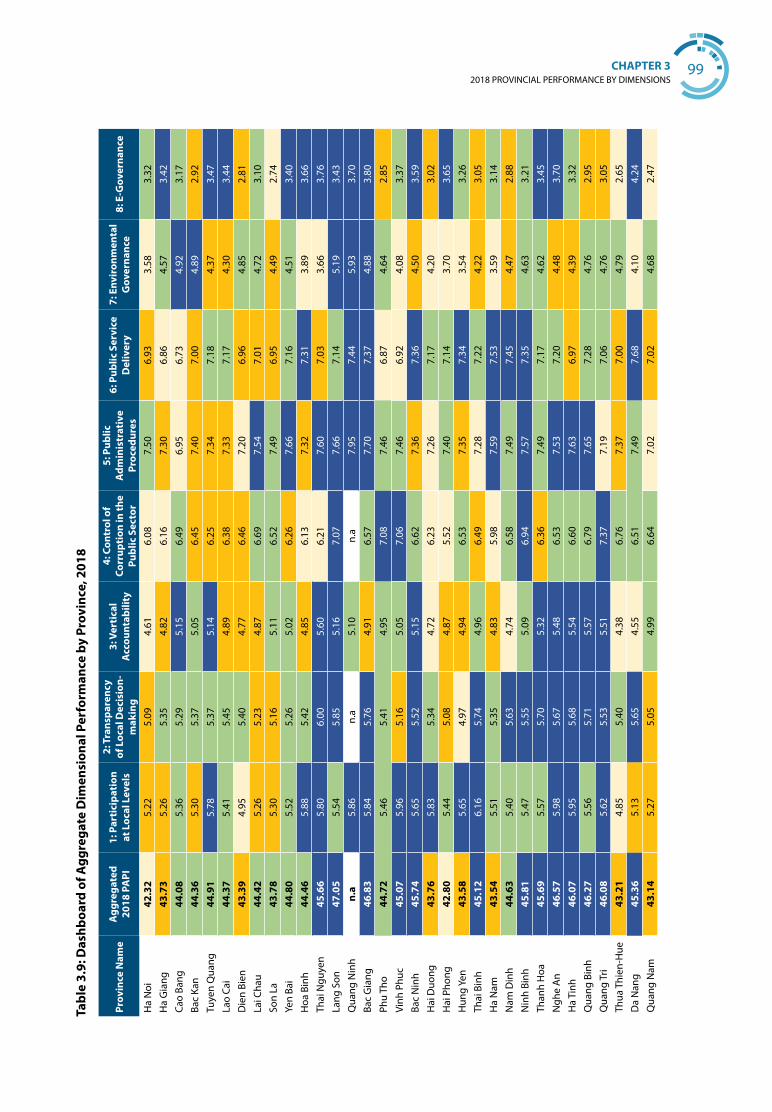
2018 PROVINCIAL PERFORMANCE BY DIMENSIONSCHAPTER 3 99
Tabl
e 3.
9: D
ashb
oard
of A
ggre
gate
Dim
ensi
onal
Per
form
ance
by
Prov
ince
, 201
8
Prov
ince
Nam
eA
ggre
gate
d 20
18 P
API
1: P
arti
cipa
tion
at
Loc
al L
evel
s
2: T
rans
pare
ncy
of L
ocal
Dec
isio
n-m
akin
g
3: V
erti
cal
Acc
ount
abili
ty
4: C
ontr
ol o
f Co
rrup
tion
in th
e Pu
blic
Sec
tor
5: P
ublic
A
dmin
istr
ativ
e Pr
oced
ures
6: P
ublic
Ser
vice
D
eliv
ery
7: E
nvir
onm
enta
l G
over
nanc
e8:
E-G
over
nanc
e
Ha
Noi
42.3
25.
225.
094.
616.
087.
506.
933.
583.
32H
a G
iang
43.7
35.
265.
354.
826.
167.
306.
864.
573.
42Ca
o Ba
ng44
.08
5.36
5.29
5.15
6.49
6.95
6.73
4.92
3.17
Bac
Kan
44.3
65.
305.
375.
056.
457.
407.
004.
892.
92Tu
yen
Qua
ng44
.91
5.78
5.37
5.14
6.25
7.34
7.18
4.37
3.47
Lao
Cai
44.3
75.
415.
454.
896.
387.
337.
174.
303.
44D
ien
Bien
43.3
94.
955.
404.
776.
467.
206.
964.
852.
81La
i Cha
u44
.42
5.26
5.23
4.87
6.69
7.54
7.01
4.72
3.10
Son
La43
.78
5.30
5.16
5.11
6.52
7.49
6.95
4.49
2.74
Yen
Bai
44.8
05.
525.
265.
026.
267.
667.
164.
513.
40H
oa B
inh
44.4
65.
885.
424.
856.
137.
327.
313.
893.
66Th
ai N
guye
n45
.66
5.80
6.00
5.60
6.21
7.60
7.03
3.66
3.76
Lang
Son
47.0
55.
545.
855.
167.
077.
667.
145.
193.
43Q
uang
Nin
hn.
a5.
86n.
a5.
10n.
a7.
957.
445.
933.
70Ba
c G
iang
46.8
35.
845.
764.
916.
577.
707.
374.
883.
80
Phu
Tho
44.7
25.
465.
414.
957.
087.
466.
874.
642.
85
Vinh
Phu
c45
.07
5.96
5.16
5.05
7.06
7.46
6.92
4.08
3.37
Bac
Nin
h45
.74
5.65
5.52
5.15
6.62
7.36
7.36
4.50
3.59
Hai
Duo
ng43
.76
5.83
5.34
4.72
6.23
7.26
7.17
4.20
3.02
Hai
Pho
ng42
.80
5.44
5.08
4.87
5.52
7.40
7.14
3.70
3.65
Hun
g Ye
n43
.58
5.65
4.97
4.94
6.53
7.35
7.34
3.54
3.26
Thai
Bin
h45
.12
6.16
5.74
4.96
6.49
7.28
7.22
4.22
3.05
Ha
Nam
43.5
45.
515.
354.
835.
987.
597.
533.
593.
14N
am D
inh
44.6
35.
405.
634.
746.
587.
497.
454.
472.
88N
inh
Binh
45.8
15.
475.
555.
096.
947.
577.
354.
633.
21Th
anh
Hoa
45.6
95.
575.
705.
326.
367.
497.
174.
623.
45N
ghe
An
46.5
75.
985.
675.
486.
537.
537.
204.
483.
70H
a Ti
nh46
.07
5.95
5.68
5.54
6.60
7.63
6.97
4.39
3.32
Qua
ng B
inh
46.2
75.
565.
715.
576.
797.
657.
284.
762.
95Q
uang
Tri
46.0
85.
625.
535.
517.
377.
197.
064.
763.
05Th
ua T
hien
-Hue
43.2
14.
855.
404.
386.
767.
377.
004.
792.
65D
a N
ang
45.3
65.
135.
654.
556.
517.
497.
684.
104.
24Q
uang
Nam
43.1
45.
275.
054.
996.
647.
027.
024.
682.
47

100 PAPI 2018THE VIET NAM PROVINCIAL GOVERNANCE AND PUBLIC ADMINISTRATION PERFORMANCE INDEX
Prov
ince
Nam
eA
ggre
gate
d 20
18 P
API
1: P
arti
cipa
tion
at
Loc
al L
evel
s
2: T
rans
pare
ncy
of L
ocal
Dec
isio
n-m
akin
g
3: V
erti
cal
Acc
ount
abili
ty
4: C
ontr
ol o
f Co
rrup
tion
in th
e Pu
blic
Sec
tor
5: P
ublic
A
dmin
istr
ativ
e Pr
oced
ures
6: P
ublic
Ser
vice
D
eliv
ery
7: E
nvir
onm
enta
l G
over
nanc
e8:
E-G
over
nanc
e
Qua
ng N
gai
41.3
35.
374.
825.
026.
087.
056.
724.
341.
93Bi
nh D
inh
41.0
44.
874.
834.
526.
236.
906.
944.
022.
73Ph
u Ye
n42
.43
4.80
4.93
4.95
6.56
7.14
6.95
4.93
2.16
Khan
h H
oa42
.17
4.41
4.59
4.70
6.49
7.29
7.48
4.43
2.78
Nin
h Th
uan
45.4
25.
395.
365.
026.
917.
537.
684.
872.
67Bi
nh T
huan
41.6
05.
054.
644.
486.
497.
376.
874.
072.
63Ko
n Tu
m43
.22
5.94
5.26
4.95
6.03
7.25
6.74
3.98
3.06
Gia
Lai
42.9
55.
145.
204.
916.
357.
146.
724.
203.
29D
ak L
ak42
.33
4.98
5.10
4.98
5.81
7.34
6.98
4.06
3.07
Dak
Non
g44
.59
5.54
5.53
5.33
6.68
7.39
6.58
4.36
3.18
Lam
Don
g42
.88
5.84
5.04
5.14
6.25
6.91
6.83
3.85
3.03
Binh
Phu
oc44
.40
5.86
5.38
5.22
6.30
7.42
6.72
4.03
3.48
Tay
Nin
h43
.58
4.88
4.79
4.76
7.24
7.51
7.01
4.94
2.45
Binh
Duo
ng43
.50
5.28
5.23
4.86
6.82
7.44
6.58
4.22
3.08
Don
g N
ai43
.09
5.31
4.88
4.98
6.28
7.37
6.81
4.26
3.19
Ba R
ia-V
ung
Tau
44.3
05.
155.
635.
206.
257.
367.
294.
223.
19H
o Ch
i Min
h Ci
ty42
.40
4.84
5.23
4.66
5.95
7.14
6.93
3.67
3.99
Long
An
43.5
95.
185.
114.
716.
907.
147.
124.
632.
79Ti
en G
iang
42.1
04.
964.
804.
317.
097.
216.
824.
802.
10Be
n Tr
e47
.05
5.21
5.50
5.20
7.61
7.74
7.31
5.41
3.08
Tra
Vinh
43.0
64.
474.
654.
756.
847.
777.
064.
832.
68Vi
nh L
ong
44.6
54.
455.
024.
707.
017.
487.
325.
752.
92D
ong
Thap
n.a
5.43
n.a
4.99
n.a
7.55
7.36
6.74
2.79
An
Gia
ng44
.43
4.56
5.15
4.72
6.93
7.33
7.49
5.67
2.58
Kien
Gia
ng42
.77
4.67
4.87
4.65
6.35
7.60
6.88
4.99
2.77
Can
Tho
46.0
65.
035.
534.
816.
987.
567.
405.
832.
91H
au G
iang
42.0
64.
524.
554.
846.
217.
286.
955.
642.
07So
c Tr
ang
43.3
74.
905.
024.
836.
807.
447.
035.
022.
33Ba
c Li
eu42
.25
4.80
4.66
4.84
6.30
7.40
7.27
4.58
2.40
Ca M
au44
.81
5.40
5.07
5.13
6.73
7.52
6.79
5.09
3.07
Not
e: F
igur
es a
re m
ean
scor
es b
ased
on
a sc
ale
of 1
-10
poin
ts fo
r the
dim
ensi
onal
leve
l (th
e fir
st le
ft c
olum
ns w
ith n
umbe
rs),
and
a sc
ale
of 1
0-80
poi
nts f
or th
e ag
greg
ate
PAPI
scor
e (th
e la
st ri
ght c
olum
n). B
lue
is
for b
est p
erfo
rmer
s (16
pro
vinc
es);
gree
n fo
r hig
h-av
erag
e pe
rfor
mer
s (16
pro
vinc
es);
oran
ge fo
r low
-ave
rage
per
form
ers (
15 p
rovi
nces
); an
d lig
ht ye
llow
for p
oor p
erfo
rmer
s (16
pro
vinc
es).
The
prov
inci
al o
rder
is b
y pr
ovin
cial
code
s. n.
a. =
not
ava
ilabl
e. D
ata
from
the
two
prov
ince
s with
the
“n.a
.” no
tes w
ere
not u
sed
due
to si
gnifi
cant
bia
ses r
esul
ting
from
det
ecte
d pr
imin
g eff
ects
.

2018 PROVINCIAL PERFORMANCE BY DIMENSIONSCHAPTER 3 101
Figure 3.9a: Dashboard of Provincial Performance by Dimension, 2018(Branch size = scores of provinces by dimension; Perfect = 10 points per dimension)
Participation at Local Levels
Transparency in Local Decision-making
Vertical Accountability
Control of Corruptionin the Public Sector
Public Administrative Procedures
Public Service Delivery
Environmental Governance
E-Governance
Zero Binh Dinh Quang Ngai Binh Thuan Hau Giang Tien Giang Khanh Hoa Bac Lieu
Ha Noi Dak Lak HCMC Phu Yen Kien Giang Hai Phong Lam Dong Gia Lai
Tra Vinh Dong Nai Quang Nam TT-Hue Kon Tum Soc Trang Dien Bien Binh Duong
Ha Nam Hung Yen Tay Ninh Long An Ha Giang Hai Duong Son La Cao Bang
BRVT Bac Kan Lao Cai Binh Phuoc Lai Chau An Giang Hoa Binh Dak Nong
Nam Dinh Vinh Long Phu Tho Yen Bai Ca Mau Tuyen Quang Vinh Phuc Thai Binh
Da Nang Ninh Thuan Thai Nguyen Thanh Hoa Bac Ninh Ninh Binh Can Tho Ha Tinh
Quang Tri Quang Binh Nghe An Bac Giang Ben Tre Lang Son Perfect
Figure 3.9b: Correlation between the 2018 PAPI and 2018 Provincial Competitiveness Index (PCI)
Ha Noi
Hai Phong
Da Nang
HCMC
Can Tho
Thanh Hoa
Nghe AnHa Tinh
Quang BinhQuang Tri
TT-Hue
Quang Nam
Quang NgaiBinh Dinh
Phu Yen
Khanh Hoa
An Giang
Tien Giang
Vinh Long
Ben Tre
Kien Giang
Tra Vinh
Soc Trang
Bac Lieu
Ca Mau
Binh Phuoc
Tay Ninh
Ninh Thuan
Long An
Hau Giang
BRVT
Bac Ninh
Binh Duong
Binh Thuan
Dong Nai
Ha Nam
Hai Duong
Hung Yen
Nam Dinh
Ninh Binh
Thai BinhVinh Phuc
Bac Kan
Bac Giang
Cao Bang
Dak Lak
Dak Nong
Dien Bien
Gia Lai
Hoa Binh
Kon Tum
Lai Chau
Lam Dong
Lang Son
Lao Cai
Phu Tho
Son La
Thai Nguyen
Tuyen QuangYen Bai
Ha Giang
0
20
40
60
58 60 62 64 66 68
r=.40*
Wei
ghte
d 20
18 P
API
Weighted 2018 PCI
95% CI
Fitted Values
Note: The correlation between the 2018 PAPI and 2018 PCI (weighted indexes) is relatively significant, with an r value of 0.4 points. The figure shows that Ben Tre seems to be performing well for both citizens and businesses. On the other hand, the governance performance of Binh Phuoc and Kon Tum provinces are viewed less favourably by citizens and businesses. Note that the PAPI score band is from 10 to 80, and the PCI score band is from 10 to 100 points.
102 PAPI 2018THE VIET NAM PROVINCIAL GOVERNANCE AND PUBLIC ADMINISTRATION PERFORMANCE INDEX
BibliographyUpdated List of Key Publications and Articles Using/Referencing PAPI Data and Information
Asia-Pacific Institute of Management and United Nations Development Programme (2018). Environmental disputes, social changes, and distributive justice in Viet Nam: Case studies, comparative analysis, and policy implications. A Joint Policy Research Paper on Governance and Participation commissioned by Asia-Pacific Institute of Management (the National Economics University) and the United Nations Development Programme (UNDP) in Viet Nam. Ha Noi, Viet Nam: January 2018.
Bui, Phuong Dinh et al. (2018). Strengthening PAPI Scores: Achieved Results and Lessons Learnt in Lai Chau, Hai Phong and Kien Giang. Series of policy research briefs for select provinces by Bui Phuong Dinh, Le Van Chien, Dang Anh Tuyet and Ha Viet Hung. Hanoi, 2017: HCMA.
Bui Phuong Dinh, Le Van Chien, Dang Anh Tuyet et al., (2018). Research on Participation, Transparency and Trust in Viet Nam. As part of the NoPoor Project with Ho Chi Minh National Academy of Politics.
CECODES, VFF-CRT & UNDP (2018). The Viet Nam Provincial Governance and Public Administration Performance Index (PAPI) 2017: Measuring Citizens’ Experience. Ha Noi. Available at www.papi.org.vn
CECODES, VFF-CRT & UNDP (2017). The Viet Nam Provincial Governance and Public Administration Performance Index (PAPI) 2016: Measuring Citizens’ Experience. Ha Noi. Available at www.papi.org.vn
CECODES, VFF-CRT & UNDP (2016). The Viet Nam Provincial Governance and Public Administration Performance Index (PAPI) 2015: Measuring Citizens’ Experience. Ha Noi. Available at www.papi.org.vn
CECODES, VLA & UNDP (2013 & 2015). The Viet Nam Justice Index (VJI). Available at https://chisocongly.vn/chi-so-cong-ly/ and http://www.vn.undp.org/content/vietnam/vi/home/library/democratic_governance/2015-justice-index.html
CECODES, VFF-CRT & UNDP (2015). The Viet Nam Provincial Governance and Public Administration Performance Index (PAPI) 2014: Measuring Citizens’ Experience. Ha Noi. Available at www.papi.org.vn
CECODES, VFF-CRT & UNDP (2014). The Viet Nam Provincial Governance and Public Administration Performance Index (PAPI) 2013: Measuring Citizens’ Experience. Ha Noi. Available at www.papi.org.vn
CECODES, VFF-CRT & UNDP (2013). The Viet Nam Provincial Governance and Public Administration Performance Index (PAPI) 2012: Measuring Citizens’ Experience. Ha Noi. Available at www.papi.org.vn
CECODES, FR, CPP & UNDP (2012). The Viet Nam Provincial Governance and Public Administration Performance Index (PAPI) 2011: Measuring Citizens’ Experience. Ha Noi. Available at www.papi.org.vn
Croissant A., Lorenz P. (2018) Vietnam: The Socialist Party State. In: Comparative Politics of Southeast Asia. Springer, Cham. Available at https://link.springer.com/chapter/10.1007/978-3-319-68182-5_12
Cuong Viet Nguyen, Nga Thu Nguyen and Tung Duc Phung (2018). Do Survey Spot-Check and Threat Improve Data Quality? Evidence from a Field Experiment. The Journal of Development Studies, DOI: 10.1080/00220388.2018.1539474. Available at https://www.tandfonline.com/doi/abs/10.1080/00220388.2018.1539474
Cuong Viet Nguyen, Thanh Long Giang, Ngoc Anh Tran and Do Thanh Huyen (forthcoming). Do Good Governance and Public Administration Improve Economic Growth and Poverty Reduction? The Case of Vietnam. International Public Management Journal.

BIBLIOGRAPHY 103
Dang Hoang Giang, Edmund J. Malesky, Paul Schuler and Do Thanh Huyen (2018). Governance weaker than public service delivery: The 2017 PAPI shows. Vietnam Law and Legal Forum, 4 May 2018. Available at http://vietnamlawmagazine.vn/governance-weaker-than-public-service-delivery-the-2017-papi-shows-6221.html
Dennis Curry (10/01/2018). Accountability in a one-party system: the task of gauging public opinion in Vietnam. On Democratic Audit UK, 10 January 2018. Available at http://www.democraticaudit.com/2018/01/10/accountability-in-a-one-party-system-the-task-of-gauging-public-opinion-in-vietnam/
Giles Lever (2 May 2018). On Freedom of Information. In Perspectives on VNExpress (2 May 2018). [Giles refers to PAPI findings of nearly 9% of respondents having heard about the Law on Access to Information]. Available at https://vnexpress.net/goc-nhin/tu-do-thong-tin-3744184.html
Gillespie, J., Van Nguyen, T., Nguyen, H.V. et al. (2019). Exploring a Public Interest Definition of Corruption: Public Private Partnerships in Socialist Asia. Journal of Business Ethics, Vol. 154, Issue 734, pp. 1-16. Available at https://doi.org/10.1007/s10551-018-04101-8
Government of Viet Nam (2018). Viet Nam’s Voluntary National Review on the Implementation of the Sustainable Development Goals, 2018. Available at: https://sustainabledevelopment.un.org/content/documents/19967VNR_of_Viet_Nam.pdf
James, Anderson (28 September 2018). Where to go for information on access to information. The World Bank Blog Series on Good Governance. Available at http://blogs.worldbank.org/governance/where-go-information-access-information
John Gillespie (2018). ‘Is Vietnam Transitioning Out of Socialism or Transforming Socialism? Searching for Answers in Commercial Regulation’ in Fu Hualing, J Gillespie, P Nicholson and W Partlett (eds.,) Socialist Law in Socialist Asia, Cambridge: Cambridge University Press 319-350). Available at https://papers.ssrn.com/sol3/papers.cfm?abstract_id=3200898
Linh Tong (14 July 2018). Vietnam’s Experiment with E-Government. On The Diplomat, issue 14 July 2018. Available at https://thediplomat.com/2018/07/vietnams-experiment-with-e-government/
Ly Chu, 2018. The Quest for Research on Social Class in Contemporary Vietnam: Overview of Current Approaches and Suggestions for Considering Pierre Bourdieu’s Theoretical Framework. Journal of Vietnamese Studies, Vol. 13 No. 1, Winter 2018; (pp. 42-79) DOI: 10.1525/jvs.2018.13.1.42.
Monika Bauhr and Ruth Carlitz, 2018. When Does Transparency Improve Public Goods Provision? Street-level Discretion, Targetability, and Local Public Service Delivery. Draft paper submitted and presented at European Political Science Association 8th Annual Conference, June 22, 2018. Available at https://www.epsanet.org/wp-content/uploads/2018/06/EPSA_2018_Programme_Final.pdf
National Economics University and United Nations Development Programme (2017). A Sectorial Study of Transparency and Corruption in Land Acquisition. A Joint Policy Research Paper on Governance and Participation commissioned by Asia-Pacific Institute of Management (the National Economics University) and the United Nations Development Programme (UNDP) in Viet Nam. Ha Noi, Viet Nam: January 2017. Available at http://www.vn.undp.org/content/vietnam/en/home/library/democratic_governance/a-sectorial-study-of-transparency-and-corruption-in-land-acquisition-in-viet-nam.html
OECD Development Centre (2017). Youth-Well-being Policy Review of Viet Nam. EU-OECD Youth Inclusion Project, Paris. [which used PAPI data for analysis of youth inclusion in governance and public administration in Viet Nam]. Available at http://www.oecd.org/countries/vietnam/OECDYouthReportVietNam_ebook.pdf
Phan Thi Ngoc Minh (2018). Factors impact on the control of corruption, with a focus on the provincial level in Viet Nam. PhD Candidate at National Chi Nan University, Taiwan.

104 PAPI 2018THE VIET NAM PROVINCIAL GOVERNANCE AND PUBLIC ADMINISTRATION PERFORMANCE INDEX
Schuler, Paul (2014). Women Delegates in the Viet Nam National Assembly: From Participation to Representation. UNDP, Hanoi.
Schuler, Paul (forthcoming). Female Autocrats as Role Models? The Effect of Female Leaders on Political Knowledge and Engagement in Vietnam. To be published on the Journal of Politics in 2020.
Thang, Bach Ngoc, Nguyen Van Thang and Do Thanh Huyen (2015). Combating Corruption for Improved Quality of Public Services in Vietnam. In Focus, Vietnam Law and Legal Forum, pp. 15-18, 34, January 2016 issue. Viet Nam: 2016. Available at http://vietnamlawmagazine.vn/combating-corruption-for-improved-quality-of-public-services-in-vietnam-5203.html
Thang, Nguyen Van and Associates (2018). Environmental disputes in Vietnam: case studies from distributive and procedural justice perspectives. Vietnam Law and Legal Forum, 11 April 2018. Available at http://vietnamlawmagazine.vn/environmental-disputes-in-vietnam-case-studies-from-distributive-and-procedural-justice-perspectives-6204.html
Thang, Nguyen Van, Bach Ngoc Thang, Le Quang Thanh and Le Quang Canh (2015). Local Governance, Corruption and Public Service Quality: Evidence from a National Survey in Viet Nam. A joint policy research paper on governance and participation commissioned by the Asia-Pacific Institute for Management (the National Economics University) and the United Nations Development Programme (UNDP) in Viet Nam. Ha Noi, Viet Nam: December 2015. Available at http://www.vn.undp.org/content/vietnam/en/home/library/democratic_governance/local-governance-corruption-and-public-service-quality.html
Thang, Nguyen Van, Bach Ngoc Thang, Le Quang Thanh, and Le Quang Canh. (2017). Local governance, corruption, and public service quality: Evidence from a national survey in Vietnam. International Journal of Public Sector Management, Vol. 30(2). Available at http://dx.doi.org/10.1108/IJPSM-08-2016-0128
Thang, Nguyen Van, Do Thanh Huyen et al. (2017). Corruption in land-related projects and ways to address it from socially structured perspectives. Vietnam Law and Legal Forum, pp. 42-48, the January-February 2017 issue. Viet Nam: 2017. Available at http://vietnamlawmagazine.vn/corruption-in-land-related-projects-and-ways-to-address-it-from-socially-structured-perspectives-5745.html
Thanh, Nguyen Duc, Pham Van Long, Nguyen Khac Giang (2018). Access to Urban Services for Inclusive Development in Asia. Country Monograph: Vietnam. Swedish International Centre for Local Democracy. Available at https://icld.se/static/files/social-and-political-inclusion-in-asian-cities-vietnam-case-study.pdf
Thoi Bao Kinh Te Sai Gon (05/05/2014): Hiểu rõ về các chỉ số đo lường chất lượng điều hành của Việt Nam (Edmund Malesky, Jairo Acuña-Alfaro, Dau Anh Tuan). An article in response to the article “So sánh chỉ số PAPI và PCI: những câu hỏi còn đó” by Dr Le Dang Doanh, an independent senior economist with Thoi Bao Kinh Te Sai Gon (12/04/2014). Available at http://www.thesaigontimes.vn/114299/
Tran, Thi Bich (2014). The Cycle of Transparency, Accountability, Corruption, and Administrative Performance: Evidence from Viet Nam. Journal of Economics and Development, Vol.16, No.3, pp. 32-48, December 2014.
Tuyen Quang Tran, Tinh Thanh Doan, Huong Van Vu and Hien Thi Nguyen (2018). Heterogeneous impacts of provincial governance on household welfare in Vietnam. International Journal of Social Welfare. 2018;00:1–12. https://doi.org/10.1111/ijsw.12337. Available at https://onlinelibrary.wiley.com/doi/pdf/10.1111/ijsw.12337
UNDP (2018). Monitoring SDG Implementation in Viet Nam through the Viet Nam Provincial Governance and Public Administration Performance Index (PAPI)—a Citizen-centric measuring tool. Posted at SDG16 Hub at https://www.sdg16hub.org. Available at https://www.sdg16hub.org/node/169
United Nations Department for Economic and Social Affairs (2018). United Nations E-Government Survey 2018: Gearing E-government to support transformation towards sustainable and resilient societies.

BIBLIOGRAPHY 105
Available at https://publicadministration.un.org/egovkb/Portals/egovkb/Documents/un/2018-Survey/E-Government%20Survey%202018_FINAL%20for%20web.pdf
United Nations in Viet Nam, 2018. Viet Nam One UN Results Report 2017. [PAPI provides data as evidence for the report, especially in Outcome 4.1 on Participatory Decision-Making and Responsive Institutions]. Hanoi: 2018. Available at http://www.un.org.vn/en/publications/un-wide-publications/doc_details/566-viet-nam-one-un-results-report-2017.html
VFF, CECODES & UNDP (2011). The Viet Nam Governance and Public Administration Performance Index (PAPI) 2010: Measuring Citizens’ Experiences. Ha Noi. Available at www.papi.org.vn
Viet Nam Fatherland Front (VFF), Centre for Community Support and Development Studies (CECODES) and United Nations Development Programme (UNDP) (2010). Towards a Public Administration Performance Index (PAPI) at the Provincial Level in Viet Nam. Report on the pilot project. January. Ha Noi. Available at www.papi.vn
Vu Anh Dao, 2017. Tiền là Tiên là Phật: Investigating the Persistence of Corruption in Viet Nam. Submission as a Public Policy PhD Thesis at Victoria University of Wellington.
Wells-Dang, A., Le Kim Thai, Nguyen Tran Lam, and Do Thanh Huyen (October 2015). Increasing Citizen Participation in Governance in Vietnam. In Focus, Vietnam Law and Legal Forum, pp. 10-14, 34, the October 2015 issue. Viet Nam: 2015. Available at http://vietnamlawmagazine.vn/increasing-citizen-participation-in-governance-in-vietnam-5047.html
Wells-Dang, A., Le Kim Thai and Nguyen Tran Lam (2015). Between Trust and Structure: Citizen Participation and Local Elections in Viet Nam. A Joint Policy Research Paper on Governance and Participation commissioned by Oxfam in Viet Nam and the United Nations Development Programme (UNDP) in Viet Nam. Ha Noi, Viet Nam: August 2015. Available at http://www.vn.undp.org/content/vietnam/en/home/library/democratic_governance/citizen-participation-and-local-elections-in-viet-nam.html
References
Bechtel, Michael M, Thomas Bernauer, and Reto Meyer (2012). “The green side of protectionism: Environmental concerns and three facets of trade policy preferences”. Review of International Political Economy 19.5, pp. 837–866.
Bernauer, Thomas and Quynh Nguyen (2015). “Free trade and/or environmental protection?” Global Environmental Politics 15.4, pp. 105–129.
Cole, Matthew A, Robert JR Elliott, and Liyun Zhang (2017). “Foreign direct investment and the environment,” Annual Review of Environment and Resources 42, pp. 465–487.
Government of Viet Nam (2018). Report on anti-corruption work in 2018 (Report No. 481/BC-CP) to XIV National Assembly in October 2018 [in which PAPI data was cited to reflect local governments’ efforts to improve transparency improvement]. Available at http://quochoi.vn/hoatdongcuaquochoi/cackyhopquochoi/quochoikhoaXIV/kyhopthu6/Pages/van-kien-tai-lieu.aspx?ItemID=4183 [Access on 21 January 2019]
Government of Viet Nam (18/11/2016). Resolution 100/NQ-CP dated 18 November 2016 on the issuance of the Action Plan for the 2016-2021 Government. Available at http://www.chinhphu.vn/portal/page/portal/chinhphu/hethongvanban?class_id=509&_page=1&mode=detail&document_id=187221
Government of Viet Nam (06/11/2009). Decree No. 102/2009/NÐ-CP of the Government on Management of Public Investment in Information and Technology dated 6 November 2009 and effective from 1 January 2010. Available at the Ministry of Information and Technology’s website at https://mic.gov.vn/Pages/VanBan/9831/102_2009_N%C3%90-CP.html

106 PAPI 2018THE VIET NAM PROVINCIAL GOVERNANCE AND PUBLIC ADMINISTRATION PERFORMANCE INDEX
Government Statistics Office (2018). Tình hình kinh tế - xã hội năm 2018. [Viet Nam’s Socio-Economic Status 2018]. Available at https://www.gso.gov.vn/default.aspx?tabid=621&ItemID=19037
Inglehart, Ronald and Chirstian Welzel. (2005). Modernization, Cultural Change, and Democracy: The Human Development Sequence. Cambridge University Press: Cambridge, UK.
Lao Dong (16 August 2018). Conclusions of the National Steering Committee on Anti-corruption Meeting on 16 August 2018. Available at https://laodong.vn/thoi-su/thong-bao-phien-hop-thu-14-ban-chi-dao-trung-uong-ve-pctn-625528.ldo [Access on 21 January 2019]
Lupu, Noam and Jonas Pontusson (2011). “The Structure of Inequality and the Politics of Redistribution.” American Political Science Review. 105(2): 316-336.
Malesky, E. (2019). The Viet Nam Provincial Competitiveness Index: Measuring economic governance for private sector development 2018. Viet Nam Chamber of Commerce and Industry and United States Agency for International Development. Ha Noi, Viet Nam
Ministry of Health (2013). Decision No 4858/QĐ-BYT on issuance of monitoring and evaluation criteria on hospital quality dated 3 December 2013. Available at http://thuvienphapluat.vn/archive/Quyet-dinh-4858-QD-BYT-nam-2013-thi-diem-Bo-tieu-chi-danh-gia-chat-luong-benh-vien-vb217343.aspx
Ministry of Home Affairs (2018). Report on the Public Administration Reform (PAR) Index 2017. Ha Noi. Available at https://www.moha.gov.vn/danh-muc/par-index-2017-cua-cac-bo-co-quan-ngang-bo-uy-ban-nhan-dan-cac-tinh-thanh-pho-truc-thuoc-trung-uong-38044.html
Ministry of Natural Resources and Environment (2016). Decision No. 931/QĐ-BTNMT of the Minister of Natural Resources and Environment on setting up hotlines to collect citizen and business feedback on bribery in the areas of natural resources and environment, including land administration, dated 4 May 2016. Available at http://thuvienphapluat.vn/van-ban/Bo-may-hanh-chinh/Quyet-dinh-931-QD-BTNMT-thanh-lap-duong-day-nong-kien-nghi-tieu-cuc-quan-ly-tai-nguyen-moi-truong-2016-310110.aspx
National Assembly of Viet Nam XIII (2013). Land Law No. 45/2013/QH13.
National Assembly of Viet Nam XIII (2016). Land on Access to Information No. 104/2016/QH13.
Spilker, Gabriele, Thomas Bernauer, and Vıctor Umaña (2016). “Selecting partner countries for preferential trade agreements: Experimental evidence from Costa Rica, Nicaragua, and Vietnam”. International Studies Quarterly 60.4, pp. 706–718.
Tien Phong (11 November 2017). Mỗi năm đầu tư hơn 6.000 tỷ đồng, sao Chính phủ điện tử chưa hiệu quả? [Why does e-governance fail to be effective while it costs more than 6,000 billion VND per month?]. Available at https://www.tienphong.vn/xa-hoi/moi-nam-dau-tu-hon-6000-ty-dong-sao-chinh-phu-dien-tu-chua-hieu-qua-1209066.tpo [Access on 22 January 2019]
Tsai, Lily and Yiqing Xu (2017). “Outspoken Insiders.” Political Behavior. 1-29.
Voice of Viet Nam (8 October 2018). “Tổng bí thư làm Chủ tịch nước không phải là kiêm nhiệm nhất thể hóa” Available at https://vov.vn/chinh-tri/tong-bi-thu-lam-chu-tich-nuoc-khong-phai-la-kiem-nhiem-nhat-the-hoa-823326.vov [access on 22 January 2019]
Voice of Viet Nam (11 October 2017). Toàn văn phát biểu bế mạc hội nghị Trung ương 6 của Tổng bí thư. [Conclusions by the General Secretary of the Vietnam Communist Party at the closure of the 6th VCP Conference] by Available at http://vov.vn/chinh-tri/toan-van-phat-bieu-be-mac-hoi-nghi-trung-uong-6-cua-tong-bi-thu-681634.vov

APPENDICES 107
AppendicesAppendix A: Provincial Responses to PAPI through 2018
No. Provinces Actions in Response to PAPI
1 An Giang
- Action Plan No. 147/CTr-UBND dated 22 April 2015 - Decision No. 2498/QD-UBND on Establishment of Steering Board on Implementation of PAPI
Action Plan 2016-2020, dated 8 September 2016 - Decision No. 933/QĐ-UBND on 27 March 2017 on information and communication in an
effort to improve PAPI for the period from 2017-2020
2 Bà Rịa-Vũng Tàu
- Provincial Plan to organise diagnostic workshop on PAPI, PCI and PAR Index dated 28 September 2016 and provincial leaders’ discussion on PAPI findings in 2016
- Decision No. 2922/QĐ-UBND on issuance of the Action Plan on Improving PAPI for the period from 2017-2020 dated 16 October 2017
3 Bắc Giang - Action Plan No. 1492 KH-UBND dated 6 June 2014 on improving performance for higher provincial PAPI scores
4 Bắc Kạn
- Diagnostic workshop on PAPI findings on 7 September 2017, and local governments were advised on what should be done to improve provincial performance
- Debriefing of policy advice for local governments in Bac Kan on how to improve their performance in governance and public administration on 22 November 2017
5 Bạc Liêu - Diagnostic workshop on PAPI findings on 23 November 2016 - Provincial People’s Committee’s Decision on establishment of Working Groups on PAPI and
PCI, dated 26 April 2017
6 Bắc Ninh - Action Plan No. 05/CT-UBND on maintaining and sustaining provincial PAPI scores, dated 13 May 2016
7 Bến Tre - Action Plan No. 4129/KH-UBND on improving PAPI, dated 13 August 2015
8 Bình Định - Directive No. 13/CT-UBND on improving PAPI, dated 8 August 2013 - Directive No. 23/CT-UBND on strengthening responsibilities of heads of agencies in PAR,
with a focus on improving PAPI
9 Bình Dương
- Regional diagnostic workshop hosted in Binh Duong on 7 May 2015 with the participation of provincial leaders and key public officials
- Directive No. 13/CT-UBND on improving civil service performance so as to increase PAPI scores
10 Bình Phước - People’s Committee’s official letter requesting departments and districts to improve PAPI scores
11 Bình Thuận - Directive No. 28/CT-UBND dated 13/9/2013 on improving public administration reforms, including PAPI scores
12 Cà Mau - Directive No. 06/CT-UBND dated 17/9/2013 on improving PAPI
13 Cần Thơ - Decision No. 1552/QD-UBND dated 1 June 2015 on Action Plan to Improve PAPI score from 2015-2017
14 Cao Bằng
- Provincial diagnostic workshop with provincial leaders and key public officials on 18 September 2012
- Provincial workshop on PAPI and PAR-Index on 14 June 2018 to discuss PAPI findings and measures to improve local government performance
15 Đà Nẵng - Annual in-depth analysis of PAPI findings by Da Nang People’s Committee - People’s Committee’s leader shared Da Nang’s experience in maintaining high PAPI scores at
2015 PAPI launch event
16 Đắk Lắk
- Official Letter No. 2211/UBND-TH dated 3 May 2012 requesting provincial agencies to improve PAPI
- Provincial diagnostic workshop convened by Da Lak Provincial People’s Committee on 2014 PAPI findings on 20 July 2015

108 PAPI 2018THE VIET NAM PROVINCIAL GOVERNANCE AND PUBLIC ADMINISTRATION PERFORMANCE INDEX
No. Provinces Actions in Response to PAPI
17 Đắk Nông - Decision No. 276/QĐ-UBND/2013 dated 22 February 2013 with concrete action plan
18 Điện Biên
- Provincial diagnostics workshop and comparative analysis, 2012, with participation of provincial leaders and key public officials
- Dien Bien Provincial People’s Committee’s Official Letter No 05/CT-UBND dated 1 June 2018 on the province’s socio-economic development plan with PAPI being one of the goals to achieve
19 Đồng Nai
- Diagnostic workshop on PAPI findings on 13 July 2017, and local governments were advised on what should be done to improve provincial performance
- Dong Nai issued Official Letter No. 7213/UBND-HC on 31 July 2017 to request provincial departments, districts and communes to take actions to improve their performance and increase citizen satisfaction in PAPI
20 Đồng Tháp - Directive No. 13/CT-UBND on improving PAPI scores in Dong Thap dated 5 August 2013
21 Gia Lai - Action Plan No 3119/CTr-UBND on improving PAPI scores for the period 2016-2020
22 Hà Giang
- Resolution No. 118-NQ-HĐND dated 11 December 2013 stressing the importance to increase PAPI scores
- Action Plan No. 119/CTr-UBND on improving governance and public administration performance towards 2015, dated 21 July 2014
- Action Plan No. 153/CTr-UBND on improving governance and public administration performance in 2017, dated 30 May 2017
23 Hà Nam
- Directive No. 08/CT-UBND on strengthening responsibility of heads of agencies in public administrative procedure reforms, with an objective to improve PAPI scores
- Action Plan No. 1413/KH-UBND on improving provincial competitiveness, with PAPI being one of the goals for the province to achieve
24 Hà Nội
- Plan No. 171/KH-UBND on implementation of Directive 03 of Ha Noi Party Committee, with an objective to improve PAPI scores
- Action Plan No. 177/KH-UBND on 25 July 2017 of the People’s Committee on improving Ha Noi’s performance in governance and public administration performance
25 Hà Tĩnh - Decision No. 4114/QD-UBND on PAR Plan in 2015 with an aim to maintain and improve PAPI scores
26 Hải Dương - Provincial Resolution on Socio-economic Development of the province, with a focus on PAPI
with an aim to be ranked higher by 2020 - 2017 Provincial Report on use of PAPI and PCI
27 Hải Phòng
- PAPI defined as a means of verification for PAR monitoring and evaluation in Hai Phong in Provincial People’s Committee Decision No 617/QD-UBND on 17 March 2014
- Decision No. 3323/QĐ-UBND on issuance of the public administration reform work plan in 2017, with an objective to improve PAPI scores
- Hai Phong People’s Committee’s Directive No. 14/CT-UBND on improving PAPI, PAR-Index, SIPAS on 15 June 2018
28 Hậu Giang
- Regional diagnostic workshop hosted in Hau Giang on 4 June 2013 with the participation of provincial leaders and key public officials
- Action Plan No. 99/KH-UBND of Hau Giang People’s Committee dated 31 August 2017 to implement measures to improve provincial performance in governance and public administration
29 Hòa Bình
- Provincial leaders discussed taking PAPI as means of verification for development in the province
- Hoa Binh Provincial Party Committee’s Action Plan No. 12-CTrTU, in which PAPI is regarded as a measure for enhanced competitiveness of the province
30 Hưng Yên - Provincial People’s Committee set improving PAPI scores among top five objectives - Action Plan No. 80/KH-UBND on improving provincial performance and increasing PAPI
scores
31 Khánh Hòa - People’s Committee assigning relevant agencies to improve PAPI scores - Decision No. 942/QD-UBND on dissemination of PAR information, including PAPI findings

APPENDICES 109
No. Provinces Actions in Response to PAPI
32 Kiên Giang
- Directive No. 1453/CT-UBND on improving PAPI, in addition to other indexes (PCI, PAR-Index, SIPAS), dated 7 July 2017
- Action Plan No. 97/KH-UBND of Kien Giang People’s Committee on activities to improve provincial governance and public administration performance, dated 18 May 2018
33 Kon Tum
- Replicated PAPI survey for nine districts in 2011 - Decision No. 703/QĐ-UBND on improving PAPI scores, dated 3 August 2012 - Action Plan No. 497/KH-UBND of the Provincial People’s Committee on implementation of
activities to aim at higher PAPI and PAR-Index of Kon Tum
34 Lai Châu - Decision No. 1331/QD-UBND on Action Plan to Implement PAR, with reference to PAPI - Directive No. 11/CT-UBND on measures to improve PAPI scores, dated 11 November 2015 - First PAPI diagnostic workshop on provincial findings organised on 22 June 2018
35 Lâm Đồng
- Diagnostic workshop on PAPI findings on 4 August 2017, and local governments were advised on what should be done to improve provincial performance
- Action Plan No. 7641/KH-UBND of Lam Dong People’s Committee dated 10 November 2017 on improving provincial performance in governance and public administration
- Action Plan No. 3370/KH-UBND on addressing bottlenecks in public administration reforms, with higher PAPI as an integrated goal
36 Lạng Sơn - Action Plan No 108/KH-UBND on improving PAPI scores in 2016 and following years - Action Plan No. 131/KH-UBND on improving PAPI scores in 2017 and years to come
37 Lào Cai - Plan No 184/KH-UBND on 28 June 2016 on implementation of Government of Viet Nam resolution on improving national competitiveness, with a focus on improving PAPI scores
38 Long An
- Long An Peoples’ Committee leaders to ask for continued efforts to improve PAPI scores by enhancing transparency of administrative procedures and capacity of public sector human resources
- Regional diagnostic workshop hosted in Long An on 5 June 2013 with the participation of provincial leaders and key public officials; and Long An provincial leader attended 2012 PAPI launch to share the province’s experiences
- Report by DOHA that requests for an action plan with concrete activities by different departments to strengthen their performance (PAPI 2017 Report by Long An.doc)
39 Nam Định
- Nam Dinh Provincial People’s Committee shared the province’s experience in addressing citizen needs at 2012 PAPI launch
- Nam Dinh Provincial People’s Committee’s Action Plan No. 60/KH-UBND on accelerating implementation of measures to improve the province’s competitiveness, in which PAPI is a goal
40 Nghệ An
- Provincial diagnostic workshop convened by Nghe An Provincial People’s Committee to discuss 2014 PAPI findings on 11 August 2015
- Action Plan No. 52/KH-UBND on 6 February 2017 on dissemination of public administration reforms, with one of the objectives to disseminate monitoring results regarding PAPI scores improvement
41 Ninh Bình - Action Plan No. 97/KH-UBND on 28 December 2015 on Public Administration Reforms, with PAPI as an objective
42 Ninh Thuận
- Action Plan No. 302/CTr-UBND dated 15 April 2016 on improving PAPI scores for the period from 2016-2020
- Resolution of Ninh Thuan People’s Council No. 54/2016/NQ-HĐND on queries at 2nd Session of the People’s Council Meeting, with questions about PAPI
43 Phú Thọ - PAPI as a means of verification for overseeing Phu Tho’s Party Resolution for 2015-2020 - Regional workshop on 2015 PAPI findings dissemination hosted by Phu Tho Provincial
People’s Committee on 5 July 2016
44 Phú Yên - Action Plan No. 03/CTr-UBND dated 11 April 2014 - Plan No 84/KH-UBND dated 10 June 2016 on implementation of action plan on improving
PAPI scores, among others
45 Quảng Bình - Directive No 06/CT-UBND on strengthening public administrative reforms to improve
provincial PAPI scores - Provincial People Committee’s regular monitoring of the province’s performance in PAPI
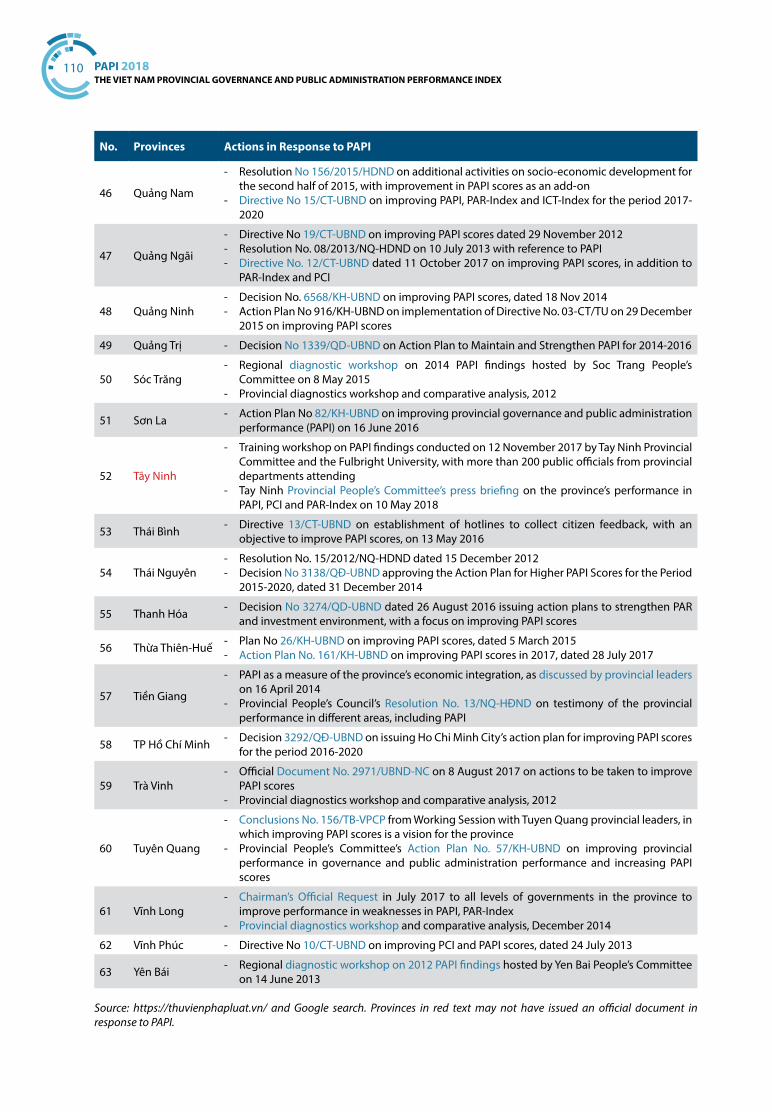
110 PAPI 2018THE VIET NAM PROVINCIAL GOVERNANCE AND PUBLIC ADMINISTRATION PERFORMANCE INDEX
No. Provinces Actions in Response to PAPI
46 Quảng Nam
- Resolution No 156/2015/HDND on additional activities on socio-economic development for the second half of 2015, with improvement in PAPI scores as an add-on
- Directive No 15/CT-UBND on improving PAPI, PAR-Index and ICT-Index for the period 2017-2020
47 Quảng Ngãi
- Directive No 19/CT-UBND on improving PAPI scores dated 29 November 2012 - Resolution No. 08/2013/NQ-HDND on 10 July 2013 with reference to PAPI - Directive No. 12/CT-UBND dated 11 October 2017 on improving PAPI scores, in addition to
PAR-Index and PCI
48 Quảng Ninh - Decision No. 6568/KH-UBND on improving PAPI scores, dated 18 Nov 2014 - Action Plan No 916/KH-UBND on implementation of Directive No. 03-CT/TU on 29 December
2015 on improving PAPI scores
49 Quảng Trị - Decision No 1339/QD-UBND on Action Plan to Maintain and Strengthen PAPI for 2014-2016
50 Sóc Trăng - Regional diagnostic workshop on 2014 PAPI findings hosted by Soc Trang People’s
Committee on 8 May 2015 - Provincial diagnostics workshop and comparative analysis, 2012
51 Sơn La - Action Plan No 82/KH-UBND on improving provincial governance and public administration performance (PAPI) on 16 June 2016
52 Tây Ninh
- Training workshop on PAPI findings conducted on 12 November 2017 by Tay Ninh Provincial Committee and the Fulbright University, with more than 200 public officials from provincial departments attending
- Tay Ninh Provincial People’s Committee’s press briefing on the province’s performance in PAPI, PCI and PAR-Index on 10 May 2018
53 Thái Bình - Directive 13/CT-UBND on establishment of hotlines to collect citizen feedback, with an objective to improve PAPI scores, on 13 May 2016
54 Thái Nguyên - Resolution No. 15/2012/NQ-HDND dated 15 December 2012 - Decision No 3138/QĐ-UBND approving the Action Plan for Higher PAPI Scores for the Period
2015-2020, dated 31 December 2014
55 Thanh Hóa - Decision No 3274/QD-UBND dated 26 August 2016 issuing action plans to strengthen PAR and investment environment, with a focus on improving PAPI scores
56 Thừa Thiên-Huế - Plan No 26/KH-UBND on improving PAPI scores, dated 5 March 2015 - Action Plan No. 161/KH-UBND on improving PAPI scores in 2017, dated 28 July 2017
57 Tiền Giang
- PAPI as a measure of the province’s economic integration, as discussed by provincial leaders on 16 April 2014
- Provincial People’s Council’s Resolution No. 13/NQ-HĐND on testimony of the provincial performance in different areas, including PAPI
58 TP Hồ Chí Minh - Decision 3292/QĐ-UBND on issuing Ho Chi Minh City’s action plan for improving PAPI scores for the period 2016-2020
59 Trà Vinh - Official Document No. 2971/UBND-NC on 8 August 2017 on actions to be taken to improve
PAPI scores - Provincial diagnostics workshop and comparative analysis, 2012
60 Tuyên Quang
- Conclusions No. 156/TB-VPCP from Working Session with Tuyen Quang provincial leaders, in which improving PAPI scores is a vision for the province
- Provincial People’s Committee’s Action Plan No. 57/KH-UBND on improving provincial performance in governance and public administration performance and increasing PAPI scores
61 Vĩnh Long - Chairman’s Official Request in July 2017 to all levels of governments in the province to
improve performance in weaknesses in PAPI, PAR-Index - Provincial diagnostics workshop and comparative analysis, December 2014
62 Vĩnh Phúc - Directive No 10/CT-UBND on improving PCI and PAPI scores, dated 24 July 2013
63 Yên Bái - Regional diagnostic workshop on 2012 PAPI findings hosted by Yen Bai People’s Committee on 14 June 2013
Source: https://thuvienphapluat.vn/ and Google search. Provinces in red text may not have issued an official document in response to PAPI.

APPENDICES 111A
ppen
dix
B: C
itiz
ens’
Pers
pect
ives
on
Prog
ress
Tow
ard
the
Sust
aina
ble
Dev
elop
men
t Goa
ls in
Vie
t Nam
(201
6-20
18)
B1. G
oal 1
6: P
rom
ote
peac
eful
and
incl
usiv
e so
ciet
ies
for s
usta
inab
le d
evel
opm
ent,
prov
ide
acce
ss to
just
ice
for a
ll an
d bu
ild e
ffec
tive
, acc
ount
able
and
in
clus
ive
inst
itut
ions
at a
ll le
vels
Goa
l 16
Indi
cato
rs re
leva
nt to
PA
PIFi
ndin
gs fr
om 2
016
PAPI
Fi
ndin
gs fr
om 2
017
PAPI
Fi
ndin
gs fr
om 2
018
PAPI
16.1
Sig
nific
antl
y re
duce
all
form
s of
vio
lenc
e an
dre
late
d de
ath
rate
s ev
eryw
here
16.1
.3 P
erce
ntag
e of
the
popu
latio
n su
bjec
ted
to p
hysi
cal,
psyc
holo
gica
l or s
exua
l vio
lenc
e in
the
prev
ious
12
mon
ths
1% o
f 14,
063
resp
onde
nts
said
th
ey w
ere
subj
ecte
d to
phy
sica
l vi
olen
ce b
y th
ieve
s or
str
ange
rs.
0.7%
of 1
4,09
7 re
spon
dent
s sa
id
they
wer
e su
bjec
ted
to p
hysi
cal
viol
ence
by
thie
ves
or s
tran
gers
.
0.6%
of 1
4,30
4 re
spon
dent
s sa
id
they
wer
e su
bjec
ted
to p
hysi
cal
viol
ence
by
thie
ves
or s
tran
gers
.
16.1
.4 P
ropo
rtio
n of
peo
ple
who
fe
el s
afe
wal
king
alo
ne a
roun
d th
e ar
ea w
here
they
live
97%
of 1
4,06
3 re
spon
dent
s sa
id
they
felt
saf
e w
alki
ng a
lone
ar
ound
the
area
whe
re th
ey li
ve
duri
ng th
e da
y.
72%
of t
he re
spon
dent
s sa
id
they
felt
saf
e w
alki
ng a
lone
ar
ound
the
area
whe
re th
ey li
ve
duri
ng th
e ni
ght.
96%
of 1
4,09
7 re
spon
dent
s sa
id
they
felt
saf
e w
alki
ng a
lone
ar
ound
the
area
whe
re th
ey li
ve
duri
ng th
e da
y.
75%
of t
he re
spon
dent
s sa
id
they
felt
saf
e w
alki
ng a
lone
ar
ound
the
area
whe
re th
ey li
ve
duri
ng th
e ni
ght.
97%
of 1
4,30
4 re
spon
dent
s sa
id
they
felt
saf
e w
alki
ng a
lone
ar
ound
the
area
they
live
dur
ing
the
day.
79%
of t
he re
spon
dent
s sa
id
they
felt
saf
e w
alki
ng a
lone
ar
ound
the
area
whe
re th
ey li
ve
duri
ng th
e ni
ght.
16.5
Sub
stan
tial
ly re
duce
co
rrup
tion
and
bri
bery
inal
l the
ir fo
rms
16.5
.1 P
erce
ntag
e of
per
sons
w
ho h
ad a
t lea
st o
ne c
onta
ct
with
a p
ublic
offi
cial
, who
pai
d a
brib
e to
a p
ublic
offi
cial
, or
wer
e as
ked
for a
brib
e by
thes
e pu
blic
offi
cial
s, in
the
prev
ious
12
mon
ths,
disa
ggre
gate
d by
ag
e gr
oup,
sex
, reg
ion
and
popu
latio
n gr
oup
5% o
f 14,
063
resp
onde
nts
adm
itted
they
wer
e as
ked
for
brib
es b
y a
publ
ic o
ffici
al in
the
prev
ious
12
mon
ths.
4.5%
of 1
4,09
7 re
spon
dent
s ad
mitt
ed th
ey w
ere
aske
d fo
r br
ibes
by
a pu
blic
offi
cial
in th
e pr
evio
us 1
2 m
onth
s.
4.8%
of 1
4,30
4 re
spon
dent
s ad
mitt
ed th
ey w
ere
aske
d fo
r br
ibes
by
a pu
blic
offi
cial
in th
e pr
evio
us 1
2 m
onth
s.
Am
ong
14,0
63 re
spon
dent
s:- 1
0% o
f tho
se w
ho u
sed
the
serv
ice
natio
nwid
e ad
mitt
ed
they
pai
d a
brib
e fo
r pub
lic
cert
ifica
tion
ser
vice
s;- 1
4.3%
pai
d a
brib
e fo
r co
nstr
ucti
on p
erm
its;
- 23%
pai
d a
brib
e fo
r lan
d us
e rig
ht c
ertifi
cate
s (L
URC
s), a
nd;
- 9.6
% p
aid
a br
ibe
for p
erso
nal
pape
rs a
t the
com
mun
e le
vel.
Am
ong
14,0
97 re
spon
dent
s:- 8
.4%
of t
hose
who
use
d th
e se
rvic
e na
tionw
ide
adm
itted
th
ey p
aid
a br
ibe
for p
ublic
ce
rtifi
cati
on s
ervi
ces;
- 11.
4% p
aid
a br
ibe
for
cons
truc
tion
per
mit
s;
- 17%
pai
d a
brib
e fo
r LU
RCs,
an
d;
- 10.
4% p
aid
a br
ibe
for
pers
onal
pap
ers
at th
e co
mm
une
leve
l.
Am
ong
14,3
04 re
spon
dent
s:- 6
.7%
of t
hose
who
use
d th
e se
rvic
e na
tionw
ide
adm
itted
th
ey p
aid
a br
ibe
for p
ublic
ce
rtifi
cati
on s
ervi
ces;
- 8.4
% p
aid
a br
ibe
for
cons
truc
tion
per
mit
s;
- 14%
pai
d a
brib
e fo
r LU
RCs,
an
d;
- 6.6
% p
aid
a br
ibe
for p
erso
nal
pape
rs a
t the
com
mun
e le
vel.

112 PAPI 2018THE VIET NAM PROVINCIAL GOVERNANCE AND PUBLIC ADMINISTRATION PERFORMANCE INDEX
Goa
l 16
Indi
cato
rs re
leva
nt to
PA
PIFi
ndin
gs fr
om 2
016
PAPI
Fi
ndin
gs fr
om 2
017
PAPI
Fi
ndin
gs fr
om 2
018
PAPI
- 11%
had
to p
ay a
brib
e fo
r the
ir ch
ildre
n to
be
bett
er a
tten
ded
at
publ
ic p
rim
ary
scho
ols;
- 17%
had
to p
ay a
brib
e to
ob
tain
bet
ter s
ervi
ce a
t pub
lic
dist
rict
hos
pita
ls.
- 9.9
% h
ad to
pay
a b
ribe
for
thei
r chi
ldre
n to
be
bett
er
atte
nded
at p
ublic
pri
mar
y sc
hool
s;
- 9%
had
to p
ay a
brib
e to
obt
ain
bett
er s
ervi
ce a
t pub
lic d
istr
ict
hosp
ital
s.
- 9.7
% h
ad to
pay
a b
ribe
for
thei
r chi
ldre
n to
be
bett
er
atte
nded
at p
ublic
pri
mar
y sc
hool
s;
- 0.4
% h
ad to
pay
a b
ribe
to
obta
in b
ette
r ser
vice
at p
ublic
di
stri
ct h
ospi
tals
.
16.6
Dev
elop
eff
ecti
ve,
acco
unta
ble
and
tran
spar
ent
inst
itut
ions
at a
ll le
vels
16.6
.2 P
ropo
rtio
n of
the
popu
latio
n sa
tisfie
d w
ithth
eir l
ast e
xper
ienc
e of
pub
lic
serv
ices
The
ratin
g of
use
r sat
isfa
ctio
n is
pre
sent
ed b
y ty
pes
of p
ublic
se
rvic
es u
nder
PA
PI 2
016
surv
ey
of 1
4,06
3 re
spon
dent
s:
a. P
ublic
Adm
inis
trat
ive
Serv
ices
(by
perc
enta
ge o
f use
rs
satis
fied
with
the
serv
ices
): - P
ublic
cer
tifica
tion
serv
ices
: 81
%- P
ublic
ser
vice
for c
onst
ruct
ion
perm
its: 7
1%- P
ublic
ser
vice
for L
URC
s: 6
1%- P
ublic
ser
vice
for p
erso
nal
pape
rs: 8
1%
b. P
ublic
Ser
vice
s (b
y to
tal
qual
ity ra
ting)
: - H
ealth
car
e se
rvic
e at
dis
tric
t pu
blic
hos
pita
ls: 5
.22
poin
ts o
n th
e 10
-poi
nt s
cale
- Pub
lic p
rimar
y sc
hool
s: 4
.99
poin
ts o
n th
e 8-
poin
t sca
le
The
ratin
g of
use
r sat
isfa
ctio
n is
pre
sent
ed b
y ty
pes
of p
ublic
se
rvic
es u
nder
PA
PI 2
017
surv
ey
of 1
4,09
7 re
spon
dent
s:
a. P
ublic
Adm
inis
trat
ive
Serv
ices
(by
perc
enta
ge o
f use
rs
satis
fied
with
the
serv
ices
): - P
ublic
cer
tifica
tion
serv
ices
: 80
%- P
ublic
ser
vice
for c
onst
ruct
ion
perm
its: 7
5.5%
- Pub
lic s
ervi
ce fo
r LU
RCs:
67.
6%- P
ublic
ser
vice
for p
erso
nal
pape
rs: 7
9%
b. P
ublic
Ser
vice
s (b
y to
tal
qual
ity ra
ting)
: - H
ealth
car
e se
rvic
e at
dis
tric
t pu
blic
hos
pita
ls: 5
.12
poin
ts o
n th
e 10
-poi
nt s
cale
- Pub
lic p
rimar
y sc
hool
s: 4
.66
poin
ts o
n th
e 8-
poin
t sca
le
The
ratin
g of
use
r sat
isfa
ctio
n is
pre
sent
ed b
y ty
pes
of p
ublic
se
rvic
es u
nder
PA
PI 2
018
surv
ey
of 1
4,30
4 re
spon
dent
s:
a. P
ublic
Adm
inis
trat
ive
Serv
ices
(by
perc
enta
ge o
f use
rs
satis
fied
with
the
serv
ices
): - P
ublic
cer
tifica
tion
serv
ices
: 84
%- P
ublic
ser
vice
for c
onst
ruct
ion
perm
its: 8
3%- P
ublic
ser
vice
for L
URC
s: 7
1%- P
ublic
ser
vice
for p
erso
nal
pape
rs: 8
5%
b. P
ublic
Ser
vice
s (b
y to
tal
qual
ity ra
ting)
: - H
ealth
car
e se
rvic
e at
dis
tric
t pu
blic
hos
pita
ls: 5
.5 p
oint
s on
th
e 10
-poi
nt s
cale
- Pub
lic p
rimar
y sc
hool
s: 4
.8
poin
ts o
n th
e 8-
poin
t sca
le

APPENDICES 113G
oal 1
6In
dica
tors
rele
vant
to P
API
Find
ings
from
201
6 PA
PI
Find
ings
from
201
7 PA
PI
Find
ings
from
201
8 PA
PI
16.7
Ens
ure
resp
onsi
ve,
incl
usiv
e, p
arti
cipa
tory
and
re
pres
enta
tive
dec
isio
n-m
akin
g at
all
leve
ls
16.7
.2 P
ropo
rtio
n of
pop
ulat
ion
who
bel
ieve
dec
isio
n-m
akin
g is
in
clus
ive
and
resp
onsi
ve,
by s
ex, a
ge, d
isab
ility
and
po
pula
tion
grou
p
Find
ings
from
the
2016
PA
PI
surv
ey o
n 14
,063
resp
onde
nts
show
that
:
- 71%
of c
ontr
ibut
ors
to
proj
ects
(34.
5% m
ale;
36.
5%
fem
ale)
sai
d th
ey p
arti
cipa
ted
in
mak
ing
a de
cisi
on o
n w
heth
er
the
infr
astr
uctu
re p
roje
ct
wou
ld b
e do
ne.
- 44%
of t
hose
(22.
6% m
ale;
21
.3%
fem
ale)
par
ticip
atin
g in
dis
cuss
ions
on
proj
ect
impl
emen
tatio
n sa
id th
ey
prov
ided
com
men
ts in
pro
ject
di
scus
sion
s.
Find
ings
from
the
2017
PA
PI
surv
ey o
n 14
,097
resp
onde
nts
show
that
:- 7
2% o
f con
trib
utor
s to
pr
ojec
ts (3
7.5%
mal
e; 3
4.5%
fe
mal
e) s
aid
they
par
tici
pate
d in
m
akin
g a
deci
sion
on
whe
ther
th
e in
fras
truc
ture
pro
ject
w
ould
be
done
.
- 40.
3% o
f tho
se (2
1.6%
mal
e;
18.6
% fe
mal
e) p
artic
ipat
ing
in d
iscu
ssio
ns o
n pr
ojec
t im
plem
enta
tion
said
they
pr
ovid
ed c
omm
ents
in p
roje
ct
disc
ussi
ons.
Find
ings
from
the
2018
PA
PI
surv
ey o
n 14
,304
resp
onde
nts
show
that
:- 6
9% o
f con
trib
utor
s to
pro
ject
s (3
5.7%
mal
e; 3
3.6%
fem
ale)
sai
d th
ey p
arti
cipa
ted
in m
akin
g a
deci
sion
on
whe
ther
the
infr
astr
uctu
re p
roje
ct w
ould
be
don
e.
- 39%
of t
hose
(21%
mal
e;
18%
fem
ale)
par
ticip
atin
g in
dis
cuss
ions
on
proj
ect
impl
emen
tatio
n sa
id th
ey
prov
ided
com
men
ts in
pro
ject
di
scus
sion
s.
- 18%
of t
he re
spon
dent
s (1
0%
mal
e, 8
% fe
mal
e) s
aid
they
wer
e in
form
ed a
bout
loca
l lan
d pl
anni
ng.
- 35%
(22%
mal
e, 1
3% fe
mal
e)
of th
ose
who
wer
e in
form
ed
said
they
had
an
oppo
rtun
ity
to c
omm
ent o
n th
e la
nd p
lans
, am
ong
who
m 9
1% (5
9% m
ale,
32
% fe
mal
e) s
aid
thei
r com
men
ts
wer
e ta
ken
into
acc
ount
.
- 19%
of t
he re
spon
dent
s (1
0%
mal
e, 9
% fe
mal
e) s
aid
they
wer
e in
form
ed a
bout
loca
l lan
d pl
anni
ng.
- 30%
(20%
mal
e, 1
0% fe
mal
e)
of th
ose
who
wer
e in
form
ed
said
they
had
an
oppo
rtun
ity
to c
omm
ent o
n th
e la
nd p
lans
, am
ong
who
m 8
9% (5
7% m
ale,
32
% fe
mal
e) s
aid
thei
r com
men
ts
wer
e ta
ken
into
acc
ount
.
- 19%
of t
he re
spon
dent
s (1
1%
mal
e, 8
% fe
mal
e) s
aid
they
wer
e in
form
ed a
bout
loca
l lan
d pl
anni
ng.
- 29%
(19%
mal
e, 1
0% fe
mal
e)
of th
ose
who
wer
e in
form
ed
said
they
had
an
oppo
rtun
ity
to c
omm
ent o
n th
e la
nd p
lans
, am
ong
who
m 8
9% (5
8% m
ale,
31
% fe
mal
e) s
aid
thei
r com
men
ts
wer
e ta
ken
into
acc
ount
.

114 PAPI 2018THE VIET NAM PROVINCIAL GOVERNANCE AND PUBLIC ADMINISTRATION PERFORMANCE INDEX
B2. Other Sustainable Development Goals Relevant to PAPI
Goals and Targets Indicators relevant to PAPI
Findings from PAPI 2016
Findings from PAPI 2017
Findings from PAPI 2018
Goal 1: End poverty in all its forms everywhere1.4 By 2030, ensure that all men and women, in particular the poor and the vulnerable, have equal rights to economic resources, as well as access to basic services, ownership and control over land and other forms of property, inheritance, natural resources, appropriate new technology and financial services,including microfinance
1.4.2 Proportion of total adult population with secure tenure rights to land, with legally recognized documentation and who perceive their rights to land as secure, by sex and type of tenure
On land ownership (which is state ownership in Viet Nam), about 83% of the 14,063 respondents said they did not lose land as a result of local land plans in 2016.
On land ownership (which is state ownership in Viet Nam), about 86% of the 14,097 respondents said they did not lose land as a result of local land plans in 2017.
On land ownership (which is state ownership in Viet Nam), about 86% of the 14,304 respondents said they did not lose land as a result of local land plans in 2018.
Goal 6: Ensure availability and sustainable management of water and sanitation for all6.1 By 2030, achieve universal and equitable access to safe and affordable drinking water for all
6.1.1 Percentage of population using safely managed drinking water services
About 49% of the 14,063 respondents said they had tap water for cooking and drinking.
Still, more than 6% still said they had to use unclean water for cooking and drinking.
About 54.6% of the 14,097 respondents said they had tap water for cooking and drinking.
Still, more than 6% still said they had to use unclean water for cooking and drinking.
About 58% of the 14,304 respondents said they had access to tap water for cooking and drinking.
Still, more than 4.7% still said they had to use unclean water for cooking and drinking.
Goal 7. Ensure access to affordable, reliable, sustainable and modern energy for all7.1 By 2030, ensure universal access to affordable, reliable and modern energy services
7.1.1 Percentage of population with access to electricity
About 98.5% of the 14,063 respondents had access to electricity through the national grid.
About 98.4% of the 14,097 respondents had access to electricity through the national grid.
About 99.4% of the 14,304 respondents had access to electricity through the national grid.

APPENDICES 115
Appendix C: 2011-2018 Household Asset Index from PAPI Surveys
4.0%
93.0%
20.1%
80.1%
41.3%
80.8%89.1%
9.1%
21.4%
58.0%
47.1%
7.7%
26.6%
12.5%
67.9%
22.2%
72.0%
20.6%
48.0%
10.2%
96.4%
61.5%
93.2%
13.8%
97.5% 97.0%
40.0%
17.1%
63.6%
87.3%
9.7%
39.5%
12.8%
63.3%
40.8%
85.1%
52.8%
63.9%
0%
10%
20%
30%
40%
50%
60%
70%
80%
90%
100%
Household Owned Assets (2011-2018)
2011 2012 2013 2014 2015 2016 2017 2018
Car/Tru
ck/V
an/
Farming vehicl
e
Cable/Digita
l TV/
K+ Connected TV
Scooter/M
otocy
lce/M
oped/
Motor b
oat/Fish
ing boat
Electric
Fan
Air conditio
ner
Pumping Set
Camera/video Record
er
Flush Toile
t
Internet A
ccess
at Home
Appendix D: Key Demographic Specifications of PAPI 2018 Sample
Figure D: Comparison of Key Demographic Variables Over Time and with 2009 Census (%, post-stratification weights [PSW])
Male Female Kinh Other
Census 2009 49.4 50.6 85.7 14.3
PAPI 2011 47.0 53.0 84.5 15.5
PAPI 2012 47.3 52.7 84.4 15.6
PAPI 2013 47.3 52.7 84.6 15.4
PAPI 2014 47.1 52.9 83.9 16.0
PAPI 2015 45.9 54.1 83.9 15.9
PAPI 2016 45.7 54.3 83.6 16.4
PAPI 2017 47.4 52.6 83.5 16.5
PAPI 2018 47.1 53.0 84.5 15.1
47.153.0
84.5
15.1
0
10
20
30
40
50
60
70
80
90
100
PERC
ENTA
GE

116 PAPI 2018THE VIET NAM PROVINCIAL GOVERNANCE AND PUBLIC ADMINISTRATION PERFORMANCE INDEX
Figure D1: Kinh Ethnicity by Province in 2018 PAPI vs. National Census 2009 (%, PSW)
0%
10%
20%
30%
40%
50%
60%
70%
80%
90%
100%
Bắc
Nin
hH
ưng
Yên
Thái
Bìn
hH
à N
amN
inh
Bình
Quả
ng B
ình
Quả
ng T
rịTh
ừa T
hiên
Huế
Đà
Nẵn
gH
ải D
ương
Nam
Địn
hVĩ
nh P
húc
Hải
Phò
ngH
à Tĩ
nhH
à N
ộiTâ
y N
inh
Bắc
Gia
ngBì
nh Đ
ịnh
Long
An
Gia
Lai
Bình
Thu
ậnBì
nh D
ương
Bà R
ịa -
Vũng
Tàu
Cà M
auVĩ
nh L
ong
Đồn
g Th
ápH
ậu G
iang
Tiền
Gia
ngBì
nh P
hước
Bến
Tre
Cần
Thơ
Ngh
ệ A
nTP
Hồ
Chí M
inh
Phú
Yên
Đắk
Lắk
Đồn
g N
aiĐ
ắk N
ông
Thái
Ngu
yên
Kiên
Gia
ngTu
yên
Qua
ngQ
uảng
Nam
An
Gia
ngBạ
c Li
êuKh
ánh
Hoà
Than
h H
oáYê
n Bá
iSó
c Tr
ăng
Quả
ng N
gãi
Phú
Thọ
Hoà
Bìn
hTr
à Vi
nhN
inh
Thuậ
nQ
uảng
Nin
hKo
n Tu
mLa
i Châ
uLà
o Ca
iĐ
iện
Biên
Lâm
Đồn
gSơ
n La
Lạng
Sơn
Bắc
Kạn
Hà
Gia
ng
% of Kinh Population in PAPI 2018 (PSW) % of Kinh Population in 2009 National Census
Figure D2: Age Distribution in 2018 PAPI Sample vs. National Census 2009(excluding respondents aged 70 or above in PAPI sample)
0% 2% 4% 6% 8% 10% 12% 14% 16% 18% 20%
18-19
20-24
25-29
30-34
35-39
40-44
45-49
50-54
55-59
60-64
65-69
70-75
75+
PAPI 2017 PSW PAPI 2018 PSW

APPENDICES 117
Figure D3: Occupation of 2018 PAPI Respondents (%, PSW)
0.20%
1.64%
1.72%
1.87%
1.95%
4.17%
6.92%
9.12%
9.57%
10.36%
14.96%
37.52%
0% 5% 10% 15% 20% 25% 30% 35% 40%
Student
Clerical
Unemployed
Other
Manager/Supervisor
Professional
Retired
Non-agricultural, skilled
Homemaker
Household entrepreneur
Non-agricultural, unskilled
Agricultural
Figure D4: Education Levels of 2018 PAPI Respondents (%, PSW)
4.95%
12.09%
8.14%
17.18%
22.69%
6.98%
19.43%
0.39%
7.53%
0.46%
0.14%
0.03%
0% 5% 10% 15% 20% 25%
No Formal Education
Incomplete Primary
Complete Primary
Incomplete Secondary
Complete Secondary
Incomplete High School
Complete High School
Some University Education
Complete University Education
Postgraduate Degree
Don't Know
Refused to Answer
Figure D5: 2018 PAPI Respondents by Difficulty in Performing Certain Functions
7.68%
3.04%
7.32%
7.95%
1.62%
20.99%
10.32%
15.72%
26.87%
7.78%
71.24%
86.61%
76.86%
65.05%
90.56%
0% 10% 20% 30% 40% 50% 60% 70% 80% 90% 100%
Di�culty in seeing, even if wearing glasses
Di�culty in hearing, even if using a hearing aid
Di�culty in walking or climbing steps
Di�culty in remembering or concentrating(^)
Di�culty in communicating/ understanding/being understood*
No di�culty at all Some di�culty A lot of di�culty Cannot do at all
Note: (*) not because of ethnic language; (^) may be attributable to old age. Caution in using the data is strongly suggested. Based on Question D611c, “Please let us know if you have any difficulty performing the following functions. Please indicate if you cannot do it at all, or you are having a lot of difficulty in doing it, or some difficulty doing it, or no difficulty at all.”

118 PAPI 2018THE VIET NAM PROVINCIAL GOVERNANCE AND PUBLIC ADMINISTRATION PERFORMANCE INDEX
Figure D6: Affiliation of 2018 PAPI Respondents with Associations/Organizations
39.1%
23.3%
16.1%
10.8%
9.4%
9.3%
7.2%
6.1%
5.8%
5.7%
3.3%
3.1%
2.8%
2.2%
2.2%
1.9%
1.8%
1.0%
0.9%
0.8%
0.6%
0.0% 5.0% 10.0% 15.0% 20.0% 25.0% 30.0% 35.0% 40.0%
NoneWomen’s Unions
Farmers' Unions/Agricultural AssociationsParent-Teacher Association
The Communist PartyVeterans Unions
OthersCharity Groups
Sports ClubsTrade UnionsYouth Unions
Religious GroupsCultural/Recreational Clubs
Producer CooperativesCommunity-based Organizations
Public Interest GroupsProfessional Associations
Alumni AssociationsVolunteers Groups
Consumers AssociationsBusiness Associations 0.6%
Figure D7: Map of 2018 PAPI Survey Locations


Akiko Fujii Andrew Wells-Dang Bạch Ngọc Thắng Bakhodir Burkhanov Bùi Thị Quế Dương
Cao Thị Khanh Cao Thu Anh Catherine Phuong Châu Thị Hải Cù Thị Đoài Đặng Hồng Hà
Đặng Hữu Phương Đặng Minh Hoa Đặng Ngọc Dinh Đặng Ngọc Hải Đặng Phương Giang
Đặng Ngọc Hân Đặng Quang Vinh Đặng Quốc Trung Đặng Thanh Phương Đặng Thị Tuyết
Đặng Thị Ánh Tuyết Đào Thùy Linh Đào Trung Chính Dennis Curry Đinh Xuân Thảo
Đỗ Duy Thường Đỗ Thanh Huyền Đỗ Thùy Linh Đỗ Xuân Dương Đoàn Thị Hà
Edmund J. Malesky Elisa Cavacece Giáp Văn Tấp Golden Sky Hà Công Long
Hà Đức Huy Hà Quang Phúc Hà Việt Hùng Hồ Ngọc Hải Hồ Như Nguyệt
Hoàng Hải* Hoàng Mạnh Cường Hoàng Minh Hoàng Vân Anh John Hendra
Juan Ovejero Justin Baguley Kamal Malhotra Kim Thị Nhàn Lại Thanh Nga
Lê Hải Hà Lê Tú Mai Lê Thế Hùng Lê Thế Lĩnh Lê Thị Nga Lê Thị Nghệ
Lê Đặng Trung Lê Kim Thái Lê Mạnh Hùng Lê Mậu Nhiệm Lê Minh Tâm
Ngô Tự Nam Nguyễn Bá Hùng Nguyễn Công Hiển Nguyễn Công Nguyên
Lê Văn Hiệp Lê Văn Lân Lê Văn Lư Nguyễn Đình Cung Nguyễn Đình Tuấn
Nguyễn Doãn Khánh Nguyễn Đức Thắng Nguyễn Đức Trị Nguyễn Duy Hữu
Nguyễn Minh Mẫn Nguyễn Ngọc Dinh Nguyễn Ngọc Tùng Nguyễn Nhật Linh
Nguyễn Huy Dũng Nguyễn Huy Quang Nguyễn Kiêm Hiếu Nguyễn Lan Anh
Nguyễn Hữu Tuấn Nguyễn Hữu Tuyên Nguyễn Lê Phương Nguyễn Lê Ti Ni
Nguyễn Thị Lan Anh Nguyễn Thị Mai Lan Nguyễn Thị Nga Nguyễn Thị Nguyệt
Nguyễn Quang Thắng Nguyễn Thị Quỳnh Trang Nguyễn Thị Tình Pernille Goodall
Nguyễn Thị Phương Thúy Nguyễn Hoàng Long Nguyễn Việt Lan Nguyễn Vũ Giang
Nguyễn Thanh Nhã Nguyễn Phúc Quỳnh Nguyễn Phương Thảo Nguyễn Quang Ngọc
Nguyễn Thị Thanh Nga Nguyễn Thị Thu Trang Nguyễn Thị Hà Trang Nguyễn Thị Hồng Linh
Nguyễn Quỳnh Hoa Nguyễn Thị Dung Nguyễn Thị Quỳnh Nguyễn Thu Hiền Nguyễn Thuý Anh
Nguyễn Trần Lâm Nguyễn Tuấn Hải Nguyễn Văn Công Nguyễn Thanh Bình Phạm Minh Trí
Nguyễn Thùy Dương Nguyễn Văn Phú Nguyễn Văn Quyền Nguyễn Vũ Hùng Nguyễn Văn Trà
Nguyễn Việt Cường Nguyễn Việt Dũng Nông Hữu Dương Nguyễn Văn Thắng Phạm Thị Hồng
Phùng Văn Chấn Phạm Hải Bình Pratibha Mehta Phan Thị Thanh Trà Phạm Thị Minh Nguyệt
Tạ Ngọc Tấn Tạ Văn Sỹ Thang Văn Phúc Trần Phương Thảo Trần Công Chính Tô Ngọc Anh
The Vietnam Fatherland Front Trần Bội Văn Trần Đức Lượng Trần Ngọc Anh Trần Ngọc Nhẫn*
Trần Thị Quốc Khánh Trần Việt Hùng Trịnh Thị Huyền Trịnh Thị Trà My Vũ Thị Thu Giang
www.papi.org.vn
United Nations Development Programme
304 Kim Ma, Ha Noi, Viet Nam Tel: (84 024) 38 500 100 Fax: (84 024) 37 265 520 Email: [email protected] www.vn.undp.org
Centre for Community Support and Development Studies
Room 904, Gelex Building, 52 Le Dai Hanh, Hai Ba Trung District, Ha Noi, Viet Nam Tel: (024) 66523846 / (024) 66523849Email: [email protected] www.cecodes.org


![[Ebook] UI Document - Tú Bùi](https://img.pdfslide.tips/doc/110x75/58a3d85a1a28ab7f0b8b4e25/ebook-ui-document-tu-bui.jpg)