Embed Size (px)
Citation preview
Bahia Brazilian Cuisine
Tom Snyder 511 E. Beckwith (406) 546-‐8007 Missoula, MT
Dated: April 26, 2011
TABLE OF CONTENTS Executive Summary The Company: Bahia. …………………………………………………………………………………1
Business Description………………….…………………………………………….………1 Management…….………………………………………………………………….……………1 Vision Statement……………..………………………………………………………….……2 Mission Statement……………………………………………………………………………2 Business Goals………………………………….………………………………………………2 Key Personnel and Responsibil it ies………….………………………………………3
Market Analysis………………………………………………………….………………………………3 Industry………………………………………………………….…………………………………3 The Customer……………………………………………………………………………………5
Competition………………………………………………………………………..………………………6 The Marketing Plan………………………………………………………………….…………………8
Target Market Strategy………………….…………………………………………………8 Product Strategy…………………………………………………………………………….…8 Pricing Strategy…………………………………………………………………………………8 Distribution Strategy………………………………………………………..………………8 Advertising and Promotion……………………………………………….………………9 Sales Strategy………………….………………………………………………………………10 Sales Forecast…………………………………………………………………………………11
Operations Plan…………………………………………………………………………….…………11 Operations Plan………………………………………………………………………………11 Ongoing Operations…….…………………….……………………………………………11 Development Plan…………………………………………………………………….………………12 Development Strategy………………………………….…………………………………13 Critical Risks……………………………………………………………………….……………………13
Market Interest and Growth Potential………….……………….………………13 New Entrance Into the Market………………….…….…………………….………14 Food Costs……………………………………..………………….…………..………………14
The Financial Plan……………………………………………………….……………………………14 Source and Uses of Funding………………………………………………..…………14 Cost and Gross Profit………………………………………….……………….…………15 Financial Assumptions………………………………………….……….………….……16 Income Statement………………………….…………………….……….………….……17 Cash Flow Statement…………………………………………………….………….……18 Balance Sheet……………………………………………………….……….………….……19
Appendix……………….………………………………………………………….………………………20 Exhibit 1, Maps of Brazi l .…………….……………………………….………….……20 Exhibit 2, Sample Menu.……………………………………………….………….……21 Exhibit 3, Equipment List.……………………………………….…….………….……22
Exhibit 4, Revenue Year 1………….………………………………….………….……24 Exhibit 5, COGS Year 1.…………….……………………….………….………….……24 Exhibit 6, Operating Expense Year 1.………………….………..………….……24 Exhibit 7, Hourly Wage Year 1.…………………………….……….………….……25 Exhibit 8, Revenue Year 2………….………………………………….………….……26 Exhibit 9, COGS Year 2.…………….………………………….……….………….……26 Exhibit 10, Operating Expense Year 2.……….…….………….………….……26 Exhibit 11, Hourly Wage Year 2.…………………….…………….………….……27 Exhibit 12, Revenue Year 3………….……………………….……….………….……28 Exhibit 13, COGS Year 3.……………………………………………….………….……28 Exhibit 14, Operating Expense Year 3.………………..……….………….……28 Exhibit 15, Hourly Wage Year 3.…………………….…………….………….……29 Exhibit 16, Income Statement Year 1.………………………….………….……30 Exhibit 17, Income Statement Year 2.………………………….………….……31 Exhibit 18, Income Statement Year 3.………………………….………….……32 Exhibit 19, Cash f low Statement Year 1.………………………….……………33 Exhibit 20, Cash f low Statement Year 2.………………………….……………34 Exhibit 21, Cash f low Statement Year 3.………………………….……………35 Exhibit 22, Balance Sheet Year 1.…………………………………….……………36 Exhibit 23, Owner, Founder, Tom Snyder’s Resume.……………….……37 Exhibit 24, References…………………………..………………………….……………38
Executive Summary Bahia (Buy-‐yah) is designed to take advantage of the exploding fast casual dining market. The restaurant industry is seeing a strong trend in customers wanting fresh ingredients prepared in a quick manner. Other fast casual dining options, such as Chipotle and Panda Express, cannot keep up with the growth in market demand. Bahia wil l f i l l this discrepancy by capturing the growing amount of customers that the industry cannot keep up with. Tom Snyder, a Finance student, came up with the idea after seeing a lack of fast casual dining options in Missoula, Montana. Over the last year and a half he has been experimenting with different cuisine options and surveying the Missoula population. He chose Brazi l ian cuisine because of the high desire for more “rice and bean” based dishes, as well as an inherent and indescribable fascination people have for the country of Brazi l . Brazi l ’s economy is exploding and they are starting to export their culture around the world. This interest people have in Brazi l wil l only continue to grow with the World Cup in 2014 and Olympic Games in 2016. Bahia wil l enter the market as one of the f irst fast casual Brazi l ian style food options in the nation and the f irst in the state. The combination of delicious, fast, cheap, and fresh food with the growing excitement of Brazi l wil l make it a prime eating destination. Bahia wil l be serving classic Brazi l ian favorites with an “Americanized” twist. Bahia wil l maintain the authenticity of the cuisine but give it a taste and feel that the American consumer wil l be more comfortable with. This wil l create a product at an affordable price, served incredibly fast, that is sure to delight your taste buds. The goal of the business is to have stable revenues of over $450,000 by the end of the third year. From that point, Bahia wil l look to starting other locations around the state and well-‐known test markets in the nation such as Columbus, Ohio. Bahia wil l then look to franchising their restaurants and to become a national player within the fast casual dining industry. Bahia plans to open in the spring of 2012.
P a g e | 1
The Company: Bahia Brazilian Cuisine Business Description Bahia is designed to address the current trend toward fast casual dining. Fast Casual Dining is up a staggering 17% due to a strong movement in dining habits of the American consumer in the direction of healthier and fresher food served at a relatively fast pace (McLynn 2011). Bahia wil l be serving popular Brazi l ian dishes in a convenient and commercial ized fashion. They wil l add value to the much-‐loved national cuisines by serving it quickly and at an affordable price. To see a sample of the menu refer to Exhibit 2. Bahia wil l be started in Missoula, Montana. It wil l be the f irst restaurant in Montana to introduce Brazi l ian style cuisine. Bahia wil l also be a leader in the nation in offering Brazi l ian food at a fast pace. It wil l differentiate itself from other Brazi l ian restaurants by offering simpler and faster dishes, rather then the classic sit-‐down Brazi l ian gri l ls. Bahia wil l be entering the market in the spring of 2012. It wil l be taking advantage of the exploding Brazi l ian economy and Brazi l ian culture that is starting to export itself. Brazi l is already starting to become the focus of people’s attention as its economy grows and wil l only continue to capture people’s imagination and interest with the upcoming World Cup in 2014 and Olympic Games in 2016. With this trend and recognition of Brazi l , people wil l see Bahia as an exciting and relevant option for their dining needs. Management Tom Snyder wil l be the owner and manager of Bahia and wil l receive his Bachelor of Science in Business Finance in May of 2011. Tom plans to take a year to work at local established fast casual dining restaurant in town to perfect his ski l ls in the industry. Tom wil l also travel to Brazi l in the fal l of 2011 to do extensive studying for his menu.
P a g e | 2
Vision Statement To be a national leader in serving fresh and delicious food to its customers Bahia wil l offer fast and convenient options that f it the l ifestyle of their customers. Mission Statement The Mission of Bahia is to give its customers the best and freshest food possible at a price and convenience that f its into their busy l ives. Bahia wil l have the highest dedication to customer satisfaction by providing a friendly, fun, creative, and warm dining environment. Bahia wil l strive to meet the demand of the customer and l isten to their wants and needs. Bahia wil l constantly attempt to make operations more efficient so it can keep prices reasonable and make service faster. Bahia wil l always keep employees its main priority, making sure they are treated with the utmost respect. This wil l in turn create employees who treat customers with the same respect and care. Business Goals Year 1 – Open the f irst restaurant in Missoula, Montana in the downtown area. Bahia plans to reach gross revenue of $230,000. For employees, training wil l emphasize efficiency and knowledge in the kitchen, quality service to customers, and helping to run the business. Year 2 – Bahia plans to continue operations in Missoula, Montana while aggressively trying to gain new customers and maintain current customers. By year two Bahia wil l grow revenue to almost $390,000. Year 3 – After two years of successfully operating at the f irst location, Bahia wil l look to open a second location outside of Missoula, Montana. This wil l be in a neighboring city where there wil l st i l l be some brand recognition. Sales at their f irst location wil l be stable at this point at over $450,000.
P a g e | 3
Key Personnel and Responsibilities Tom Snyder, Owner and Founder of Bahia wil l be responsible for:
⋅ Day to day operations, ⋅ Ordering inventory, ⋅ Scheduling, ⋅ Payroll , ⋅ Hire and train employees, ⋅ Public relations, ⋅ Advertising, ⋅ And managing the accounting books.
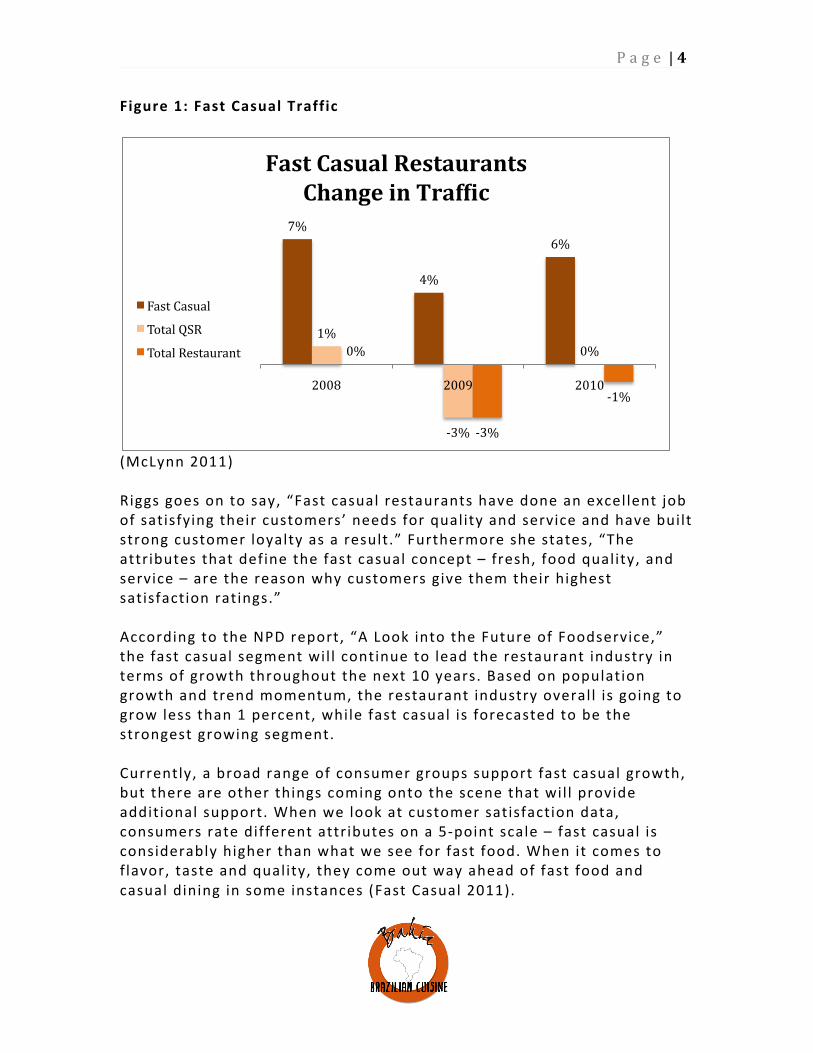
Market Analysis Industry People visit ing the leading fast casual restaurant chains over the last three years has grown around 17%, while the rest of the industry has dealt with the slowest traffic in nearly a decade (McLynn 2011). Not only has this segment been growing at a signif icant rate but also the consumer demand is exceeding the unit growth of the fast casual chains by almost 5% according to the NPD Group (McLynn 2011). NPD Crest, which continually tracks consumer usage of food service outlets, showed that the leading fast casual restaurant chains, l ike Chipotle, Five Guys Burgers and Fries, Noodles & Company, and Panera Bread Company, were up +6% from last year ended December 31st. When we compare this number to the -‐1 % decline in the total industry visits over the same period we see that this is a signif icant amount (NPD Group 2011). According to Bonnie Riggs, restaurant industry analyst at NPD, “If we were just looking at the last couple of years, in 2009, when fast casual was up 5 percent, fast food was down 2 percent, and casual dining was down 4 percent. Then in 2010, when fast casual was up 5 percent, fast food was sti l l down 1 percent and casual dining was down 2 percent. Fast casual growth slowed because they curtai led unit expansion somewhat.” We can see below the change in traffic over the last three years comparing fast casual restaurants with quick service restaurants (QSR), and total restaurants.
P a g e | 4
Figure 1: Fast Casual Traffic
(McLynn 2011) Riggs goes on to say, “Fast casual restaurants have done an excellent job of satisfying their customers’ needs for quality and service and have built strong customer loyalty as a result.” Furthermore she states, “The attributes that define the fast casual concept – fresh, food quality, and service – are the reason why customers give them their highest satisfaction ratings.” According to the NPD report, “A Look into the Future of Foodservice,” the fast casual segment wil l continue to lead the restaurant industry in terms of growth throughout the next 10 years. Based on population growth and trend momentum, the restaurant industry overall is going to grow less than 1 percent, while fast casual is forecasted to be the strongest growing segment. Currently, a broad range of consumer groups support fast casual growth, but there are other things coming onto the scene that wil l provide additional support. When we look at customer satisfaction data, consumers rate different attributes on a 5-‐point scale – fast casual is considerably higher than what we see for fast food. When it comes to f lavor, taste and quality, they come out way ahead of fast food and casual dining in some instances (Fast Casual 2011).
7%
4%
6%
1%
-‐3%
0% 0%
-‐3%
-‐1% 2008 2009 2010
Fast Casual Restaurants Change in Traf6ic
Fast Casual
Total QSR
Total Restaurant
P a g e | 5
Riggs said fast casual diners wil l continue to cross al l age groups, “it’s just that the older ones wil l hold a higher share of the market than they currently do,” she said. “Incremental traffic for fast casual wil l source to teens and young adults – particularly those 10 to 30 years of age (Generation Z), and to a lesser extent, those 55 years plus. By 2019, Generation Z wil l be the single largest population group at 90 mil l ion strong, and that wil l provide a lot of support for fast casual. As long as the segment stays relevant, which it has, there isn’t any reason that it shouldn’t continue on this strong growth path.” The Customer The immediate market wil l be the Missoula zip codes of 59801, 59802, and 59803. This comprises a population of 65,599 people, which is growing at a rate close to 1%. The median age of this population is 32.6 years old. The racial profi le is 91.6% white, 2.9% Native American, 1.5% Asian and the remaining 4% being other (ERSI 2011). Being a food service provider, Bahia wants to target these people who spend money on food away from home. In 2010, this population spent $67,734,242 on food away from home, an average spent of $2,471.15 per person, per year (ERSI 2011). With a per capita income of $21,905 we have the potential of capturing 11.28% of their income. More specif ical ly, the top f ive target segments (as compiled by esri .com) of this market are 31.2% “college towns”, 13.3% “metropolitans”, 6.5% “old and newcomers”, 5.9% “great expectations”, and 5.2% “midland crowd” (ERSI 2011). The top two segments compile 44.5% of the market and are the ones Bahia is going to key in on as their main target segments. The average age of a “college town” is 24.4 years old and the majority fal l between 18-‐34 years old, this captures Generation Z, which is the dominant fast causal customer (ERSI 2011). Convenience is what dictates their food choices and because of their busy l ifestyles they typical ly wil l go to a restaurant and take their food to go, or eat at fast food restaurants. The “metropolitan” is typical ly a l itt le older with an average age of 37.6 years (ERSI 2011). They are also involved in an active and busy l ifestyle and l ike to go out to eat for social and practical reasons. Both target segments are very involved in outdoor activit ies l ike ski ing, kayaking, backpacking, and hiking. They both actively volunteer for
P a g e | 6
community projects and polit ical parties. They l ike to l isten to music and go to concerts as much as possible. Both segments are connected to the world through their laptops and the Internet, doing much of their shopping and research online. Competition The fast casual dining segment is a fast growing portion of the food industry. There have been very successful new restaurants nationally and locally. However, there are sti l l a l imited number of dining opportunities for the growing market demand. The key to Bahia’s success is differentiating itself and its product based on a number of attributes, including quality of food, branding, originality, and atmosphere. Figure 2 shows three of Bahia’s primary competitors and highlights how Bahia compares to them. Figure 2: The Competitive Matrix Company El Diablo Staggering Ox Doc’s
Sandwiches Bahia
Product Burritos and Tacos
Sandwiches Sandwiches Brazi l ian Food
Product Price $2.75-‐9 $5.50-‐9.50 $6.95-‐795 $3.50-‐8
Product Quality
All fresh food Fresh and frozen
Fresh and frozen
All fresh food
Ordering Time
3min 6min 4min 2min
Originality No Yes No Yes
Packaging Tin foi l Plastic bag Tin foi l Box with logo
Marketing advertising
Valpack and Boga
Valpack N/A Valpack, radio, and guerri l la
Distribution Store Store Store Store
Atmosphere Clean and Simple
Eclectic Clean and Cottage
Clean and Modern/rustic
Location Beckwith & Higgins
39th & Russell Higgins & Front
N/A
P a g e | 7
The highlighted competitors have high quality products and high traffic locations. The factors in the matrix were chosen because they are the primary areas of competition within the fast casual dinning industry. These companies f irst compete on product quality but customers do differentiate based on price and name recognition. For the Missoula demographic these companies have become important players within the fast casual dining industry. El Diablo Mike Iasmen wanted a burrito shop in town that served al l fresh ingredients so he started El Diablo f ive years ago. It serves the community and is located near The University of Montana. They were voted best burrito shop in Missoula in 2010. They have not attempted to expand their locations and are not planning on aggressively growing. Staggering Ox Staggering Ox serves a deli style sandwich. The unique factor is that the bread is baked in a coffee can and then hallowed out in the middle, then the sandwich fi l l ings go inside. They have a large menu of sandwiches, soups, and salads. They don’t prepare al l of their food fresh and have not marketed their product aggressively (Staggering Ox 2011). Doc’s Sandwiches Doc's Gourmet Sandwich Shop is located in downtown Missoula on Higgins Street. It is the creation of Dave O. Conrad and his wife, who started the shop 18 years ago (Doc's Sandwich 2011). They serve gourmet sandwiches, homemade soups and salads. The sandwiches they serve are standard classics and do not have a lot of creativity or differentiation.
P a g e | 8
Marketing Plan Target Market Strategy Those who traditionally visit fast food restaurants are now eating at a “healthier” choice of fast casual and those who normally visit causal dining restaurants are now visit ing fast casual restaurants to save money and time. People are now going to a restaurant that serves fresher ingredients at a fast pace but sti l l offers it at a reasonable price. Bahia offers this meal and wil l capture this growing demographic. Product Strategy Bahia wil l offer al l fresh ingredients. It wil l have brand recognition re-‐enforced from the moment you walk into the door to the to-‐go containers that you carry out. It wil l offer food that wil l challenge the customer’s concept of fast food. The in house dining atmosphere wil l attract customers with a clean modern/rustic feel inspired by Brazi l ian l ife. Bahia wil l compete with other fast casual restaurants in town but wil l offer an originality and differentiation that is unsurpassed. Pricing Strategy Bahia wil l not only give customers a taste that they wil l come back for but a price they love. It is priced in l ine with the fast casual market, which averages an $8.50 ticket, but also offers simpler meals for a cheaper price (Fast Casual 2011). This is above the price of a fast food restaurant but is priced at a premium because of the fresh ingredients. A single dish wil l retai l at $7.50 with simpler dishes, of r ice and beans, set at a cheaper price of $3.50. Every meal wil l cost under $2.50 to produce so at least a 67% gross profit margin wil l be acquired on most meals. They are priced in l ine with the market demand approach of $8.50, which includes sides and a drink. Side orders wil l be an extra $1.00 that consists of traditional Brazi l ian coconut or coffee cookies. Distribution Strategy Bahia wil l enter the market through their retai l location. Customers wil l have to come to the brick and mortar location to receive their food. It wil l be located in a central location that is accessible to customers
P a g e | 9
working in the Missoula downtown locations as well as the University of Montana and surrounding high schools. This wil l provide a strong base of working class and student customers. Bahia wil l capture the market of ful l t ime workers on their lunch break as well as the lunch times provided by the educational institutions. Furthermore, when the full t ime workers get off work they wil l look to Bahia as a viable option for dinner instead of cooking for the family after a long day of work or stopping at the usual fast food restaurant l ike McDonalds. As Bahia grows it wil l provide more locations. These extended locations wil l provide an opportunity for customers that work and l ive in locations distant from the downtown location and are not wil l ing to make the commute. From there Bahia wil l enter test markets in the mid-‐west. If successful, Bahia wil l begin to franchise and create distribution nationwide. Advertising and Promotion Bahia wil l aggressively advertise and work to get their name out to the community in the f irst two years. Bahia wil l target customers in the fol lowing three ways:
1. Public relations efforts and donations, 2. Coupons, 3. Website and Internet.
Public Relations Efforts and Donations Bahia wil l take almost al l opportunities to donate food and services for special events and non-‐profit organizations. The target segment actively volunteers for community projects and polit ical parties. By donating to these events Bahia wil l be able to gain the customers support on a more emotional level. Not only wil l the volunteers, who are a large part of Bahia’s target customer, feel an appreciation for Bahia but also it wil l help create name recognition to everyone attending the event. Missoula is a very loyal community and appreciates and wil l reciprocate when people give to them. In order to reach its target customer Bahia wil l donate to musical events, polit ical parties, and outdoor activit ies. They wil l also have a donation day every Tuesday were 5% of sales go toward a local charity or cause. This wil l sti l l al low for high profit
P a g e | 10
margins but wil l increase sales signif icantly by bringing the community in for a cause they support. Coupons In the f irst year of business, when gaining new customers is very important, Bahia wil l participate in coupon options and other similar incentives. Bahia wil l have a coupon in Valpak , Boga, and others. This wil l provide advertising to a new audience and help introduce people to Bahia. It wil l not be making the 67% gross margin on these coupons but wil l sti l l be sell ing at a markup well above cost. Therefore, Bahia wil l st i l l be making small margins on the coupons but wil l in turn be gaining a large new audience that wil l then become recurring customers. After one year Bahia wil l no longer participate in coupons because at that point it wil l have introduced their product to a large customer base and wil l not need to lower profit margins in order to gain new customers. Website and Internet Many of Bahia’s target customer segments spend time surfing the web or using social media. Specif ical ly social media wil l be the cheapest (free) way of connecting with the customer. Bahia wil l uti l ize al l social media sites and constantly try to attract new customers or stay connected with current ones. Bahia wil l uti l ize a simple website with location and contact information, hours of operation, and ful l menu. This wil l help gain out-‐of-‐state customers while these customers wil l be in town for a short period and wil l provide only single or multiple sales over a short period. The website wil l have key words that wil l help it come to the top of the l ist with people type in “Missoula dining” to Google, Bing, Yahoo, or other search engines. This wil l include simple ads by these search engines. Also, Bahia wil l have a Facebook page, Blog, Twitter, and other Internet media sites that wil l help online searches place Bahia as a top place to eat in Missoula. Many of these strategies wil l be free or charged based on the number of people who visit the site. Sales Strategy The founder, Tom Snyder, wil l work with local advertisers such as the Missoulian, Independent, and radio stations, to operate the sales strategy. Tom wil l organize and operate the majority of sales, which wil l
P a g e | 11
help el iminate the need of hiring and paying a director of marketing. Therefore, sales expenses wil l be to l imited to the occasional use of independent advertising f irms for certain marketing projects. Sales Forecast Bahia wil l gain a rapid customer base in the f irst two years. In order to help faci l itate this growth they wil l encompass the Missoula market with advertising and public relations. (Refer to Exhibit 16,17, and 18) In the f irst year the company projects sales of around $230,000 and by year 3 it wil l grow close to $470,000. This wil l be faci l itated in growth from 125 meals purchased a day to 210. Operations Plan Operations Strategy Al l raw materials and inputs for the food wil l be outsourced to Sysco and B&R (Bakery and Restaurant) Supply’s. They wil l provide Bahia with al l the meat, vegetables, spices, and other produce needed to create the menu. Whenever local produce is available from these suppliers it wil l be used in the menu to help create a local and sustainable vibe. Once the raw materials are shipped to Bahia’s location in Missoula they wil l be prepped and prepared by the workers. Whenever possible they wil l not freeze the food so it is as fresh as possible. This wil l help give Bahia a competitive advantage of giving the customer the freshest food achievable. Ongoing Operations In order to have fresh food daily there wil l need to be a 2-‐3 hours of t ime spent in the morning prepping the food and then preparing it for the customer before opening. Store hours wil l be from 11am to 9pm in order to accommodate the lunch and dinner customer. There wil l be a shift manager that wil l come in at 8:00am-‐3:30pm every day and start prepping and cutting al l the different meats that wil l need to be used during the day. They wil l also start cooking items such as

P a g e | 12
stews that wil l need multiple hours to cook before opening. The shift manager wil l be responsible for making sure that the l ine is f i l led with food and that al l cooking is done in order to keep up with customer demand. They are also the person that wil l make sure that al l other employees are acting in accordance to protocol and staying on task. Another shift manager wil l rel ieve them at 3:30pm-‐10pm and wil l take over their task. The next employee to come to work wil l arrive at 9:00am-‐3pm to start prepping more basic produce items. This wil l include starting the rice in the rice cooker and prepping many of the vegetables. They wil l be responsible for al l other prepping that is not taken care of by the shift manager. Once the store opens at 11am they wil l be responsible for serving customers and making sure basic prep work is done. At 3:00pm-‐10:00pm someone wil l come in and take over their responsibil it ies for the rest of the night. The third employee wil l arrive at 10am-‐4pm and start setting up the store for opening. This wil l include putting down chairs, stocking drinks, and setting up the l ine where the food wil l be served. Once the store opens they wil l also be responsible for serving customers and basic prep work. They wil l be rel ieved from someone working a shift from 4pm-‐10pm. Al l employees wil l also need to keep the front of the restaurant clean, the front stocked, tables cleaned, f loors cleaned, dishes done, utensils stocked, and drink l ids/straws stocked. If needed, due to high business, a fourth person wil l arrive at 12pm-‐8pm, the busiest hours of operation, and help with al l activit ies done by the non-‐shift manager employees. Development Plan Bahia is in the process of creating a strong Brazi l ian menu to enter the market with. The goal is to have a simple menu of 6-‐8 main dishes served over a bed of r ice, 1 soup/stew, and 1-‐2 desserts. Bahia is well on its way to fulf i l l ing its menu requirements yet is sti l l in the process of testing recipes and re-‐working ideas. The tentative date for a completed menu wil l be October of 2011.
P a g e | 13
Development Strategy The development strategy is to start marketing the product well before the opening of the store. This wil l be done through social media sites, stickers, bumper stickers, and word of mouth. From there Bahia wil l take initial investing of $105,000 and secure additional investing if needed. (Refer to Exhibit 7) Employee wages wil l start at $7.50 and as a shift manger $8.00. These are at a sl ight premium above minimum wage in order to attract a higher end employee so Bahia is wil l ing to pay the premium. This higher end employee wil l make the customers feel more welcomed and also make them feel that Bahia is serving better food then the traditional fast food restaurant. There wil l be a shift manger on shift for 14.5 hours a day and he/she wil l be getting paid $8.00 an hour. The 1s t shift wil l be there 13 hours, 2nd shift 12 hours, a possible third shift (which is showed in the calculations to show the maximum possible amount paid to employees) 8 hours a day; they wil l al l receive $7.50 an hour. After one year of employment each employee wil l receive an increase in their hourly paycheck, this wil l show an increased employee wage increase from year 1 to year 2. Although there is a high employee turnover in the restaurant industry, we wil l assume all employees’ stay and each receive a wage in order to have conservative estimates. Critical Risks Market Interest and Growth Potential Although there is strong market interest in the fast casual dining sector and this growth is projected to continually grow in the next ten years there is a chance that forecasts could change. If consumers have a change in taste and the need of a restaurant serving fresh food in a fast manner decreases then sales would dramatical ly drop and large growth over the f irst three years would not be possible. In this case Bahia would quickly change the business model in order to accompany the changing attitudes of their customers. Since Bahia is the f irst Brazi l ian restaurant to enter the Missoula location market, interest is harder to predict. It has received a lot of positive feedback about the food and wil l continue to test the market moving
P a g e | 14
forward, changing menu items along the way to keep in l ine with the market interest. New Entrance Into the Market Since Bahia is one of the f irst, i f not the f irst, Brazi l ian style restaurant to enter into the fast casual dining, others could fol low. In this case Bahia would not only have to differentiate itself from other fast casual restaurants but from other Brazi l ian style locations. In this case Bahia would rely on strong brand name recognition and al low for a larger advertising budget. Food Costs A very real r isk is r ising food prices which affect the cost of goods sold. Foods cost are at almost 8% inflation and some proteins are into the double digits (Davis 2011). These represent some of the highest food prices seen in recent history. With fuel prices rising even more into the summer and unexpected freezes in New Mexico and other major produce producing states these numbers are only expected to rise. In this case profit margins wil l go down unless prices are increased. Bahia wil l use price increase as a last option if they are affected by food cost increases. They wil l instead focus on operating efficiencies in order to drive down costs. They wil l continue to use fresh ingredients and quality food. Financials Bahia generates revenue by sel l ing Brazi l ian style dishes. They wil l augment this revenue with fountain drink sales, classic Brazi l ian cookies, and apparel. Sources and Uses of Funding Init ial funding for Bahia Brazi l ian Cuisine wil l be through family members and outside investors. Original funding wil l cover the initial costs of equipment, leasehold improvement, and starting inventory. An Initial itemized projection of equipment needed is shown in Exhibit 3 . From that point forward costs wil l be covered by operations and sales. This wil l include inventory purchases and new equipment needed.
P a g e | 15
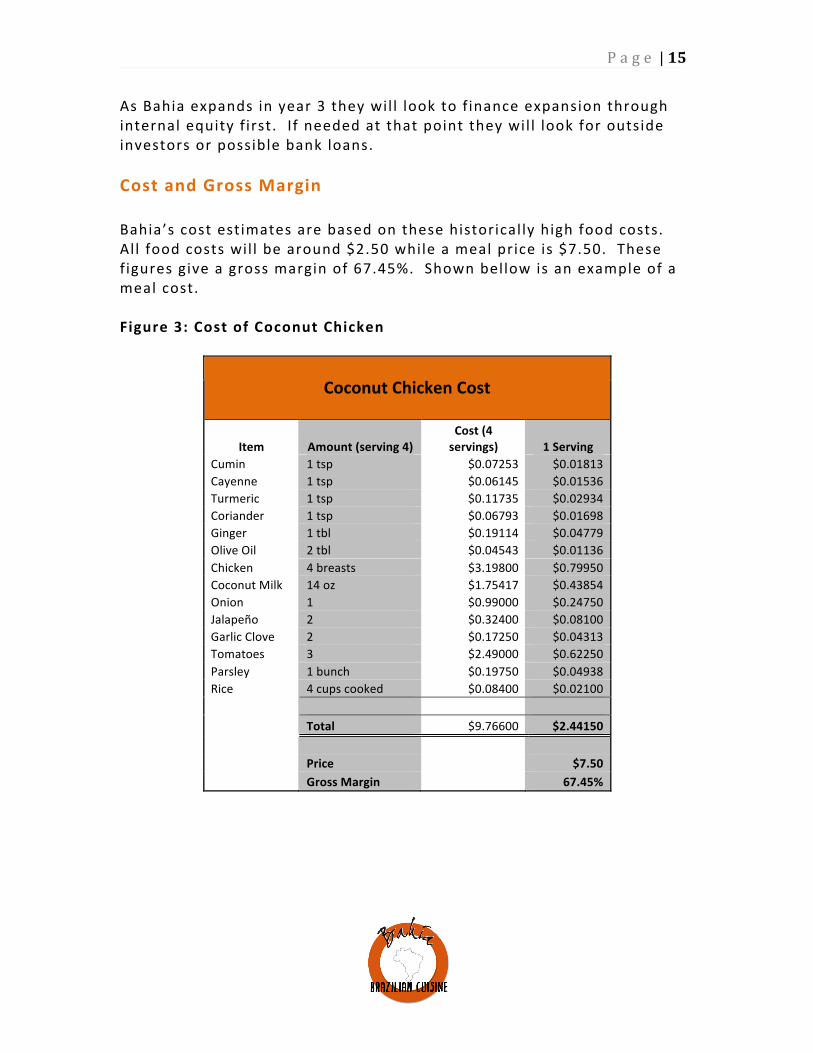
As Bahia expands in year 3 they wil l look to f inance expansion through internal equity f irst. If needed at that point they wil l look for outside investors or possible bank loans. Cost and Gross Margin Bahia’s cost estimates are based on these historical ly high food costs. Al l food costs wil l be around $2.50 while a meal price is $7.50. These f igures give a gross margin of 67.45%. Shown bellow is an example of a meal cost. Figure 3: Cost of Coconut Chicken
Coconut Chicken Cost
Item Amount (serving 4) Cost (4 servings) 1 Serving
Cumin 1 tsp $0.07253 $0.01813 Cayenne 1 tsp $0.06145 $0.01536 Turmeric 1 tsp $0.11735 $0.02934 Coriander 1 tsp $0.06793 $0.01698 Ginger 1 tbl $0.19114 $0.04779 Olive Oil 2 tbl $0.04543 $0.01136 Chicken 4 breasts $3.19800 $0.79950 Coconut Milk 14 oz $1.75417 $0.43854 Onion 1 $0.99000 $0.24750 Jalapeño 2 $0.32400 $0.08100 Garlic Clove 2 $0.17250 $0.04313 Tomatoes 3 $2.49000 $0.62250 Parsley 1 bunch $0.19750 $0.04938 Rice 4 cups cooked $0.08400 $0.02100
Total $9.76600 $2.44150
Price $7.50 Gross Margin 67.45%
P a g e | 16
Financial Assumptions
⋅ Init ial costs wil l not exceed $105,000, which is the maximum equity available.
⋅ Sales Volume at Bahia is based on information obtained through observation, work experience, and surveys of restaurants.
⋅ Leasehold improvements are not above $23,000. ⋅ An established fast casual restaurant in Missoula averages 200
tickets a day or more. o This is shown by our projections at year 3.
⋅ Operations costs show rent of $1,600 a month, which is average for a 1,600 square foot commercial space.
o About $10 per square foot for retai l rental ⋅ Bahia is able to grow unit sales from 125 to 175 to 210 in the f irst
three years. o These are the unit sales in summer months. o Seasonality is accounted for by placing lower %’s of sales in
slower months accordingly. ⋅ Payroll taxes and other employee expenses do not exceed 10%. ⋅ UI Taxes wil l be $800 annually. ⋅ Unemployment and Insurance wil l be $90 Monthly. ⋅ Current inventory wil l be offset by accounts payable.
P a g e | 17
Income Statements (3 Years)
Income Statement (3 Years)
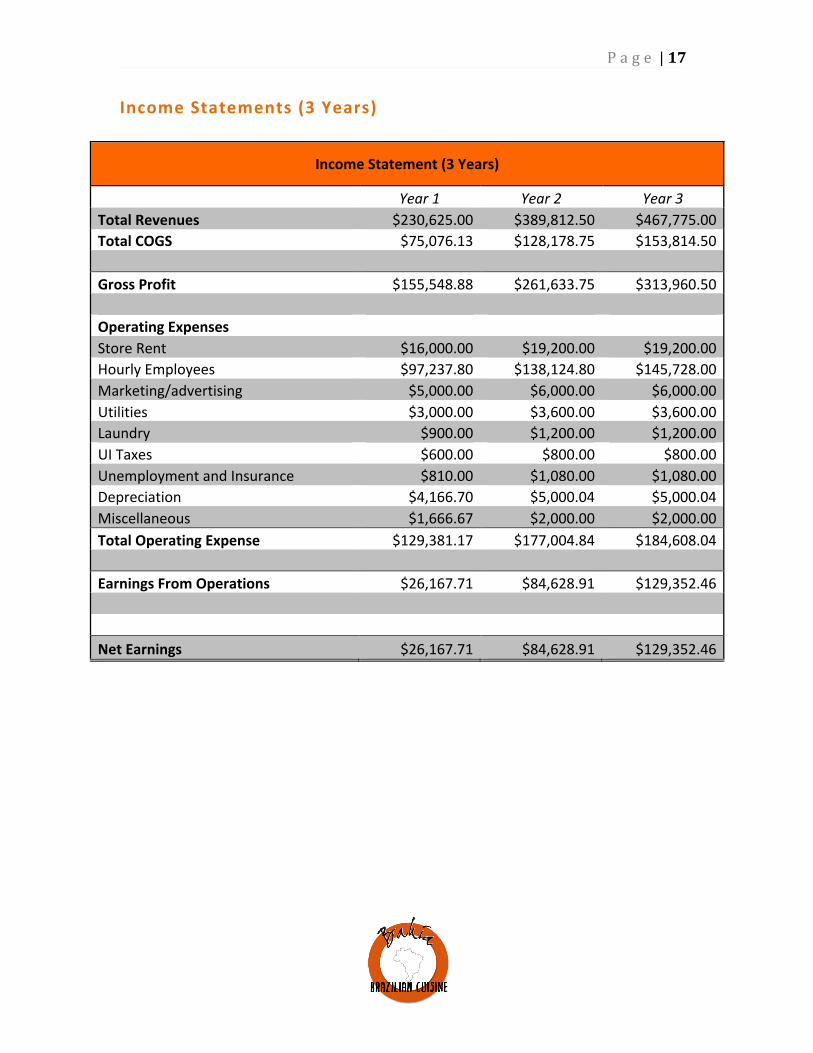
Year 1 Year 2 Year 3 Total Revenues $230,625.00 $389,812.50 $467,775.00 Total COGS $75,076.13 $128,178.75 $153,814.50 Gross Profit $155,548.88 $261,633.75 $313,960.50 Operating Expenses Store Rent $16,000.00 $19,200.00 $19,200.00 Hourly Employees $97,237.80 $138,124.80 $145,728.00 Marketing/advertising $5,000.00 $6,000.00 $6,000.00 Utilities $3,000.00 $3,600.00 $3,600.00 Laundry $900.00 $1,200.00 $1,200.00 UI Taxes $600.00 $800.00 $800.00 Unemployment and Insurance $810.00 $1,080.00 $1,080.00 Depreciation $4,166.70 $5,000.04 $5,000.04 Miscellaneous $1,666.67 $2,000.00 $2,000.00 Total Operating Expense $129,381.17 $177,004.84 $184,608.04 Earnings From Operations $26,167.71 $84,628.91 $129,352.46
Net Earnings $26,167.71 $84,628.91 $129,352.46
P a g e | 18
Cash Flow Statement (3 Years)
Cash Flow Statement (3 Years)
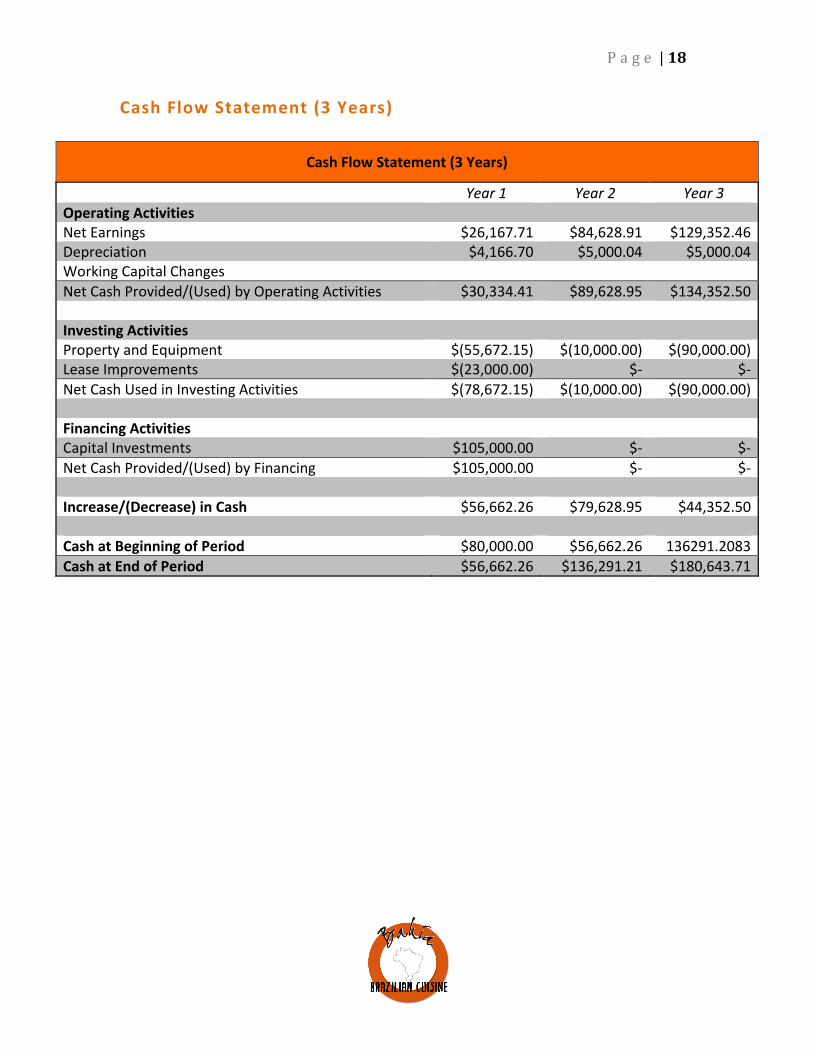
Year 1 Year 2 Year 3 Operating Activities Net Earnings $26,167.71 $84,628.91 $129,352.46 Depreciation $4,166.70 $5,000.04 $5,000.04 Working Capital Changes Net Cash Provided/(Used) by Operating Activities $30,334.41 $89,628.95 $134,352.50 Investing Activities Property and Equipment $(55,672.15) $(10,000.00) $(90,000.00) Lease Improvements $(23,000.00) $-‐ $-‐ Net Cash Used in Investing Activities $(78,672.15) $(10,000.00) $(90,000.00) Financing Activities Capital Investments $105,000.00 $-‐ $-‐ Net Cash Provided/(Used) by Financing $105,000.00 $-‐ $-‐ Increase/(Decrease) in Cash $56,662.26 $79,628.95 $44,352.50 Cash at Beginning of Period $80,000.00 $56,662.26 136291.2083 Cash at End of Period $56,662.26 $136,291.21 $180,643.71
P a g e | 19
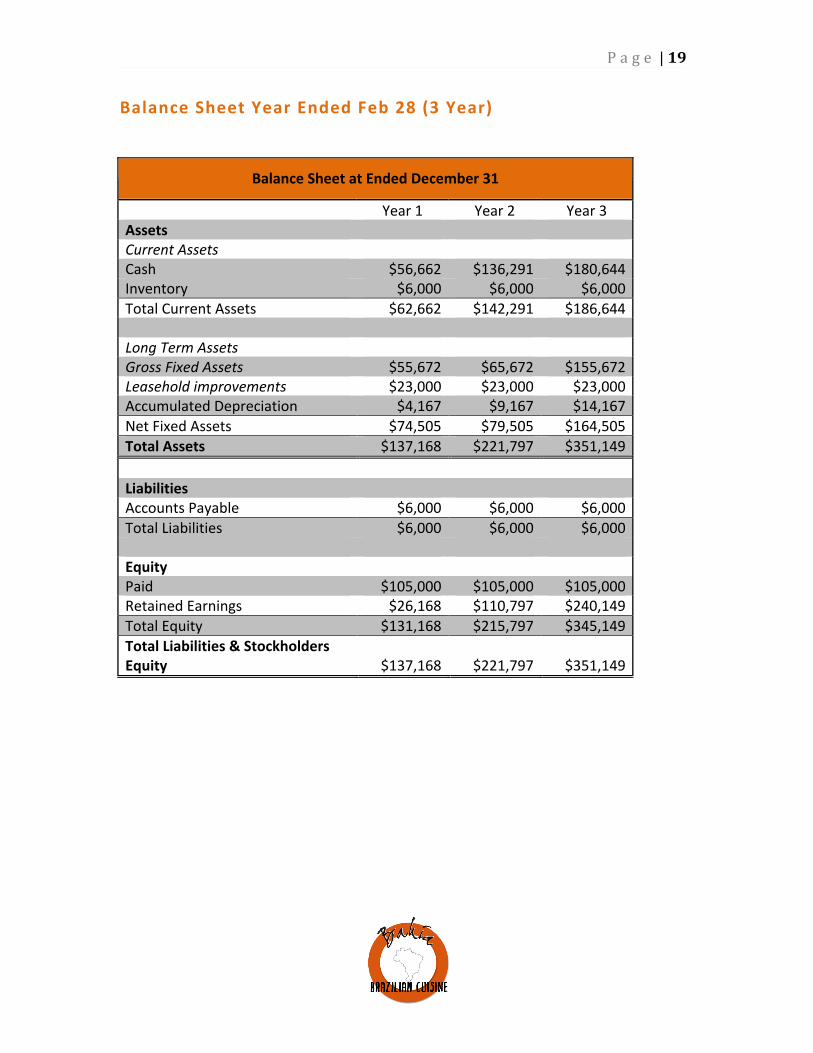
Balance Sheet Year Ended Feb 28 (3 Year)
Balance Sheet at Ended December 31
Year 1 Year 2 Year 3 Assets Current Assets Cash $56,662 $136,291 $180,644 Inventory $6,000 $6,000 $6,000 Total Current Assets $62,662 $142,291 $186,644 Long Term Assets Gross Fixed Assets $55,672 $65,672 $155,672 Leasehold improvements $23,000 $23,000 $23,000 Accumulated Depreciation $4,167 $9,167 $14,167 Net Fixed Assets $74,505 $79,505 $164,505 Total Assets $137,168 $221,797 $351,149 Liabilities Accounts Payable $6,000 $6,000 $6,000 Total Liabilities $6,000 $6,000 $6,000 Equity Paid $105,000 $105,000 $105,000 Retained Earnings $26,168 $110,797 $240,149 Total Equity $131,168 $215,797 $345,149 Total Liabilities & Stockholders Equity $137,168 $221,797 $351,149
P a g e | 20
Appendix Exhibit 1, Maps of Brazil
P a g e | 21
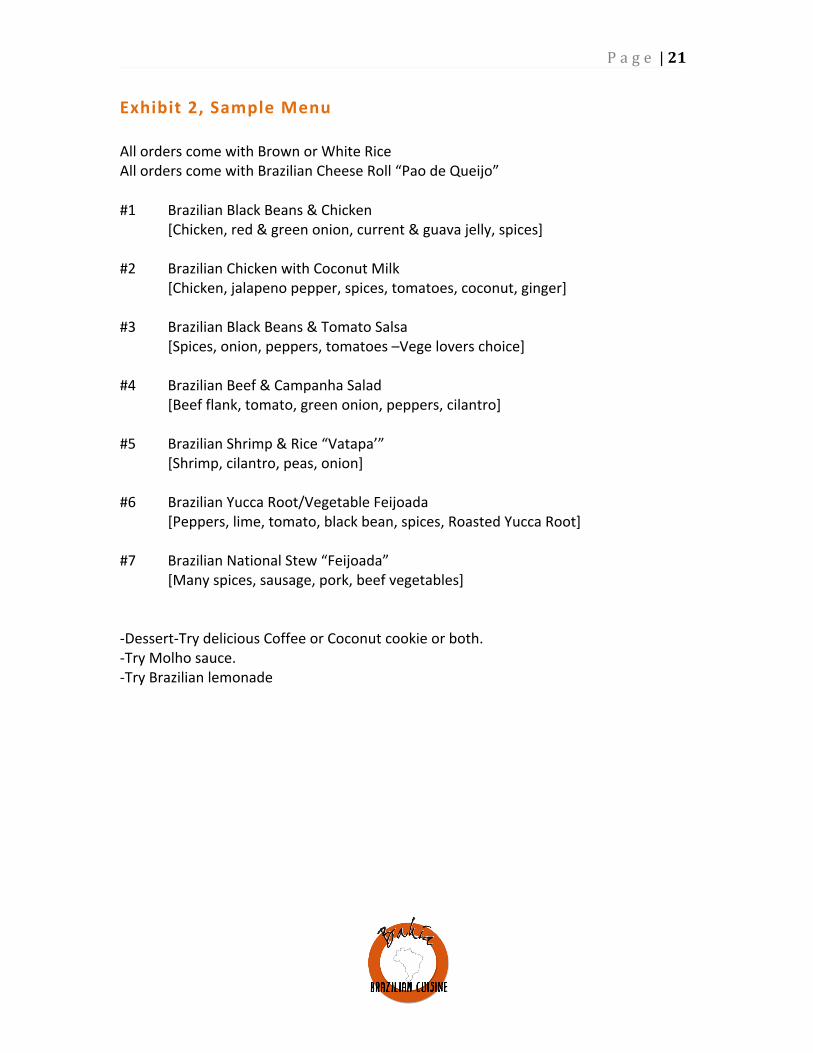
Exhibit 2, Sample Menu All orders come with Brown or White Rice All orders come with Brazilian Cheese Roll “Pao de Queijo” #1 Brazilian Black Beans & Chicken [Chicken, red & green onion, current & guava jelly, spices] #2 Brazilian Chicken with Coconut Milk [Chicken, jalapeno pepper, spices, tomatoes, coconut, ginger] #3 Brazilian Black Beans & Tomato Salsa [Spices, onion, peppers, tomatoes –Vege lovers choice] #4 Brazilian Beef & Campanha Salad [Beef flank, tomato, green onion, peppers, cilantro] #5 Brazilian Shrimp & Rice “Vatapa’” [Shrimp, cilantro, peas, onion] #6 Brazilian Yucca Root/Vegetable Feijoada [Peppers, lime, tomato, black bean, spices, Roasted Yucca Root] #7 Brazilian National Stew “Feijoada” [Many spices, sausage, pork, beef vegetables] -‐Dessert-‐Try delicious Coffee or Coconut cookie or both. -‐Try Molho sauce. -‐Try Brazilian lemonade
P a g e | 22
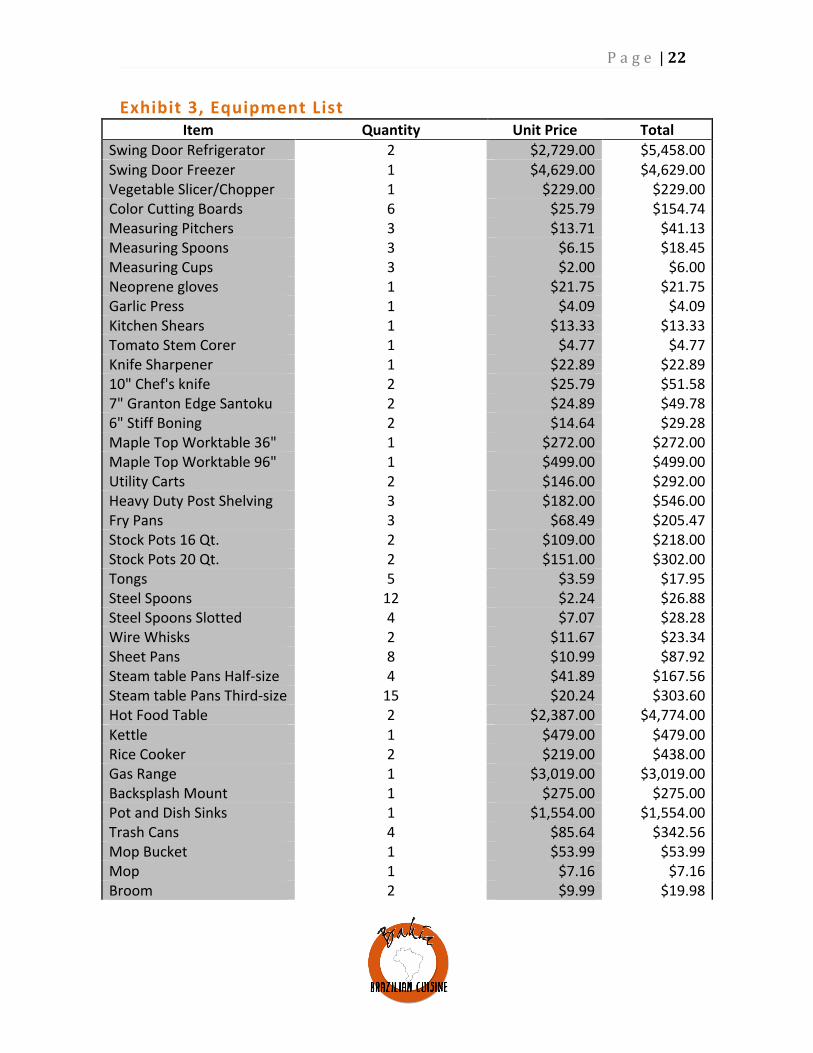
Exhibit 3, Equipment List Item Quantity Unit Price Total
Swing Door Refrigerator 2 $2,729.00 $5,458.00 Swing Door Freezer 1 $4,629.00 $4,629.00 Vegetable Slicer/Chopper 1 $229.00 $229.00 Color Cutting Boards 6 $25.79 $154.74 Measuring Pitchers 3 $13.71 $41.13 Measuring Spoons 3 $6.15 $18.45 Measuring Cups 3 $2.00 $6.00 Neoprene gloves 1 $21.75 $21.75 Garlic Press 1 $4.09 $4.09 Kitchen Shears 1 $13.33 $13.33 Tomato Stem Corer 1 $4.77 $4.77 Knife Sharpener 1 $22.89 $22.89 10" Chef's knife 2 $25.79 $51.58 7" Granton Edge Santoku 2 $24.89 $49.78 6" Stiff Boning 2 $14.64 $29.28 Maple Top Worktable 36" 1 $272.00 $272.00 Maple Top Worktable 96" 1 $499.00 $499.00 Utility Carts 2 $146.00 $292.00 Heavy Duty Post Shelving 3 $182.00 $546.00 Fry Pans 3 $68.49 $205.47 Stock Pots 16 Qt. 2 $109.00 $218.00 Stock Pots 20 Qt. 2 $151.00 $302.00 Tongs 5 $3.59 $17.95 Steel Spoons 12 $2.24 $26.88 Steel Spoons Slotted 4 $7.07 $28.28 Wire Whisks 2 $11.67 $23.34 Sheet Pans 8 $10.99 $87.92 Steam table Pans Half-‐size 4 $41.89 $167.56 Steam table Pans Third-‐size 15 $20.24 $303.60 Hot Food Table 2 $2,387.00 $4,774.00 Kettle 1 $479.00 $479.00 Rice Cooker 2 $219.00 $438.00 Gas Range 1 $3,019.00 $3,019.00 Backsplash Mount 1 $275.00 $275.00 Pot and Dish Sinks 1 $1,554.00 $1,554.00 Trash Cans 4 $85.64 $342.56 Mop Bucket 1 $53.99 $53.99 Mop 1 $7.16 $7.16 Broom 2 $9.99 $19.98
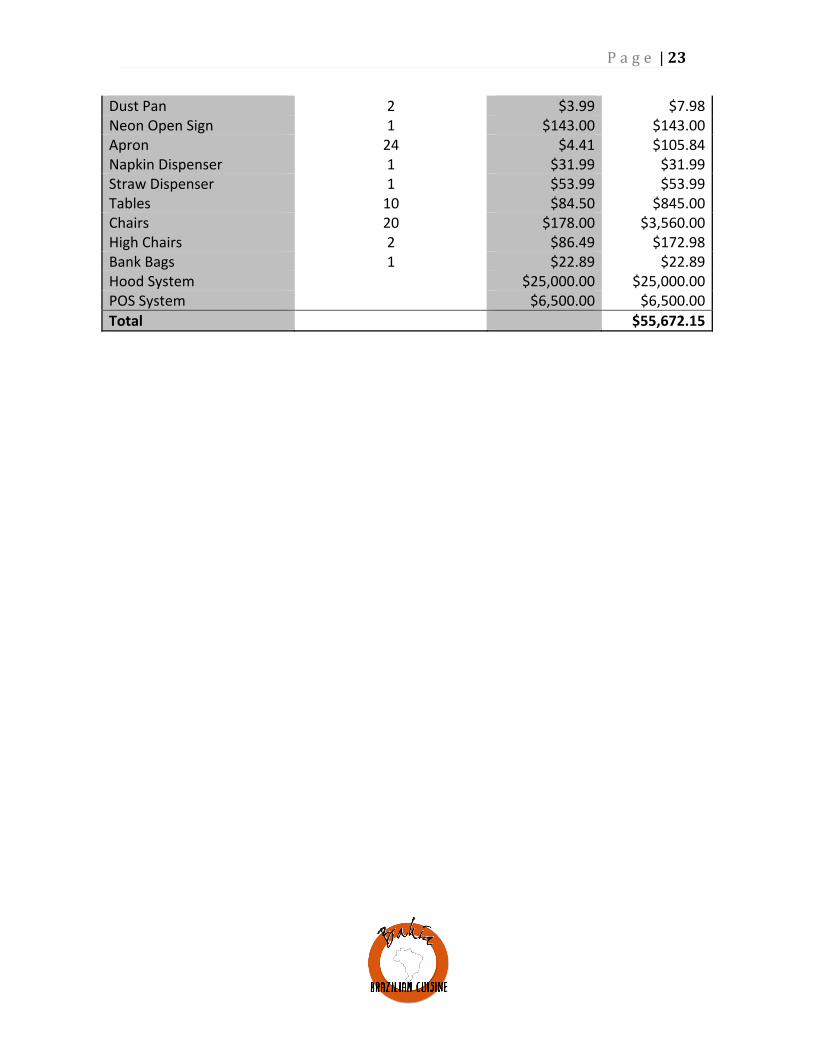
P a g e | 23
Dust Pan 2 $3.99 $7.98 Neon Open Sign 1 $143.00 $143.00 Apron 24 $4.41 $105.84 Napkin Dispenser 1 $31.99 $31.99 Straw Dispenser 1 $53.99 $53.99 Tables 10 $84.50 $845.00 Chairs 20 $178.00 $3,560.00 High Chairs 2 $86.49 $172.98 Bank Bags 1 $22.89 $22.89 Hood System $25,000.00 $25,000.00 POS System $6,500.00 $6,500.00 Total $55,672.15

P a g e | 24
Exhibit 4, Revenue Year 1 Revenue Worksheet
Product Price Units Sold/ Day Total Revenue Average meal $7.50 125 $937.50 Total $937.50
Exhibit 5, COGS Year 1
Cost of Goods Worksheet Product Price Gross Margin Revenue COGS Average Meal $7.50 67.45% $937.50 305.1875 Total Revenue $937.50 COGS 305.1875 Earnings after food costs/ day $632.31 Gross Profit Margin 67.45%
Exhibit 6, Operating Expenses Year 1
Operating Expense Worksheet Expense Weekly Monthly Yearly Total Store Rent $1,600 $19,200 Hourly Employees $2,701 $129,650 Marketing/advertising $500 $6,000 Utilities $300 $3,600 Laundry $100 $1,200 UI Tax $800 $800 Unemployment Insurance $90 $1,080 Depreciation $417 $5,000 Miscellaneous $2,000 $2,000 Totals $168,530
P a g e | 25
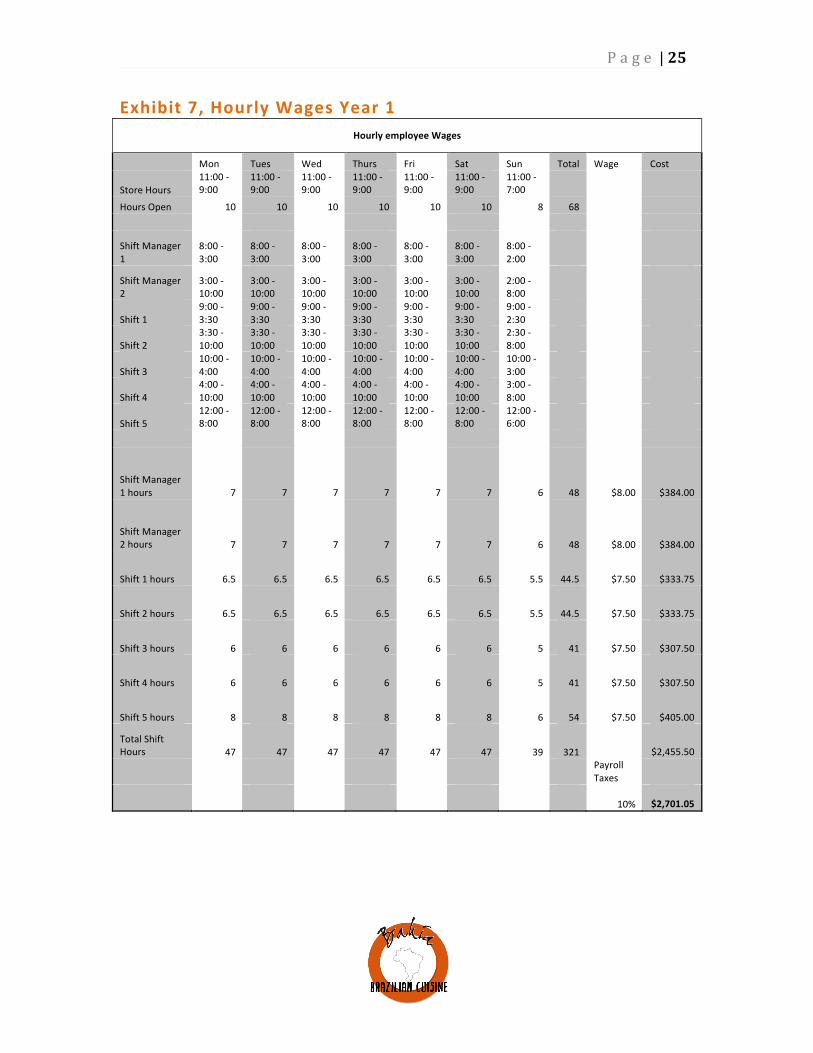
Exhibit 7, Hourly Wages Year 1 Hourly employee Wages
Mon Tues Wed Thurs Fri Sat Sun Total Wage Cost
Store Hours 11:00 -‐ 9:00
11:00 -‐ 9:00
11:00 -‐ 9:00
11:00 -‐ 9:00
11:00 -‐ 9:00
11:00 -‐ 9:00
11:00 -‐ 7:00
Hours Open 10 10 10 10 10 10 8 68
Shift Manager 1
8:00 -‐ 3:00
8:00 -‐ 3:00
8:00 -‐ 3:00
8:00 -‐ 3:00
8:00 -‐ 3:00
8:00 -‐ 3:00
8:00 -‐ 2:00
Shift Manager 2
3:00 -‐ 10:00
3:00 -‐ 10:00
3:00 -‐ 10:00
3:00 -‐ 10:00
3:00 -‐ 10:00
3:00 -‐ 10:00
2:00 -‐ 8:00
Shift 1 9:00 -‐ 3:30
9:00 -‐ 3:30
9:00 -‐ 3:30
9:00 -‐ 3:30
9:00 -‐ 3:30
9:00 -‐ 3:30
9:00 -‐ 2:30
Shift 2 3:30 -‐ 10:00
3:30 -‐ 10:00
3:30 -‐ 10:00
3:30 -‐ 10:00
3:30 -‐ 10:00
3:30 -‐ 10:00
2:30 -‐ 8:00
Shift 3 10:00 -‐ 4:00
10:00 -‐ 4:00
10:00 -‐ 4:00
10:00 -‐ 4:00
10:00 -‐ 4:00
10:00 -‐ 4:00
10:00 -‐ 3:00
Shift 4 4:00 -‐ 10:00
4:00 -‐ 10:00
4:00 -‐ 10:00
4:00 -‐ 10:00
4:00 -‐ 10:00
4:00 -‐ 10:00
3:00 -‐ 8:00
Shift 5 12:00 -‐ 8:00
12:00 -‐ 8:00
12:00 -‐ 8:00
12:00 -‐ 8:00
12:00 -‐ 8:00
12:00 -‐ 8:00
12:00 -‐ 6:00
Shift Manager 1 hours 7 7 7 7 7 7 6 48 $8.00 $384.00
Shift Manager 2 hours 7 7 7 7 7 7 6 48 $8.00 $384.00
Shift 1 hours 6.5 6.5 6.5 6.5 6.5 6.5 5.5 44.5 $7.50 $333.75
Shift 2 hours 6.5 6.5 6.5 6.5 6.5 6.5 5.5 44.5 $7.50 $333.75
Shift 3 hours 6 6 6 6 6 6 5 41 $7.50 $307.50
Shift 4 hours 6 6 6 6 6 6 5 41 $7.50 $307.50
Shift 5 hours 8 8 8 8 8 8 6 54 $7.50 $405.00
Total Shift Hours 47 47 47 47 47 47 39 321
$2,455.50
Payroll Taxes
10%
$2,701.05
P a g e | 26
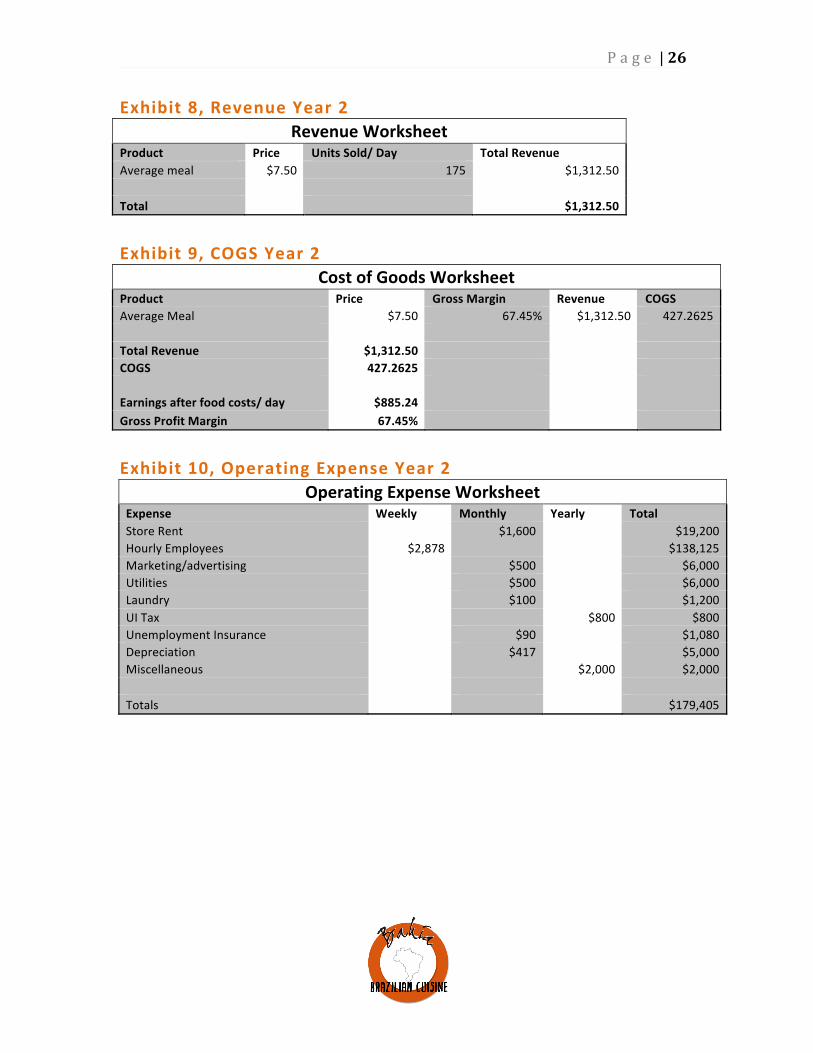
Exhibit 8, Revenue Year 2 Revenue Worksheet
Product Price Units Sold/ Day Total Revenue Average meal $7.50 175 $1,312.50 Total $1,312.50
Exhibit 9, COGS Year 2
Cost of Goods Worksheet Product Price Gross Margin Revenue COGS Average Meal $7.50 67.45% $1,312.50 427.2625 Total Revenue $1,312.50 COGS 427.2625
Earnings after food costs/ day $885.24 Gross Profit Margin 67.45%
Exhibit 10, Operating Expense Year 2
Operating Expense Worksheet Expense Weekly Monthly Yearly Total Store Rent $1,600 $19,200 Hourly Employees $2,878 $138,125 Marketing/advertising $500 $6,000 Utilities $500 $6,000 Laundry $100 $1,200 UI Tax $800 $800 Unemployment Insurance $90 $1,080 Depreciation $417 $5,000 Miscellaneous $2,000 $2,000 Totals $179,405

P a g e | 27
Exhibit 11, Hourly Wages Year 2 Hourly employee Wages
Mon Tues Wed Thurs Fri Sat Sun Total Wage Cost
Store Hours 11:00 -‐ 9:00
11:00 -‐ 9:00
11:00 -‐ 9:00
11:00 -‐ 9:00
11:00 -‐ 9:00
11:00 -‐ 9:00
11:00 -‐ 7:00
Hours Open 10 10 10 10 10 10 8 68
Shift Manager 1
8:00 -‐ 3:00
8:00 -‐ 3:00
8:00 -‐ 3:00
8:00 -‐ 3:00
8:00 -‐ 3:00
8:00 -‐ 3:00
8:00 -‐ 2:00
Shift Manager 2
3:00 -‐ 10:00
3:00 -‐ 10:00
3:00 -‐ 10:00
3:00 -‐ 10:00
3:00 -‐ 10:00
3:00 -‐ 10:00
2:00 -‐ 8:00
Shift 1 9:00 -‐ 3:30
9:00 -‐ 3:30
9:00 -‐ 3:30
9:00 -‐ 3:30
9:00 -‐ 3:30
9:00 -‐ 3:30
9:00 -‐ 2:30
Shift 2 3:30 -‐ 10:00
3:30 -‐ 10:00
3:30 -‐ 10:00
3:30 -‐ 10:00
3:30 -‐ 10:00
3:30 -‐ 10:00
2:30 -‐ 8:00
Shift 3 10:00 -‐ 4:00
10:00 -‐ 4:00
10:00 -‐ 4:00
10:00 -‐ 4:00
10:00 -‐ 4:00
10:00 -‐ 4:00
10:00 -‐ 3:00
Shift 4 4:00 -‐ 10:00
4:00 -‐ 10:00
4:00 -‐ 10:00
4:00 -‐ 10:00
4:00 -‐ 10:00
4:00 -‐ 10:00
3:00 -‐ 8:00
Shift 5 12:00 -‐ 8:00
12:00 -‐ 8:00
12:00 -‐ 8:00
12:00 -‐ 8:00
12:00 -‐ 8:00
12:00 -‐ 8:00
12:00 -‐ 6:00
Shift Manager 1 hours 7 7 7 7 7 7 6 48 $8.50 $408.00 Shift Manager 2 hours 7 7 7 7 7 7 6 48 $8.50 $408.00 Shift 1 hours 6.5 6.5 6.5 6.5 6.5 6.5 5.5 44.5 $8.00 $356.00 Shift 2 hours 6.5 6.5 6.5 6.5 6.5 6.5 5.5 44.5 $8.00 $356.00 Shift 3 hours 6 6 6 6 6 6 5 41 $8.00 $328.00 Shift 4 hours 6 6 6 6 6 6 5 41 $8.00 $328.00 Shift 5 hours 8 8 8 8 8 8 6 54 $8.00 $432.00 Total Shift Hours 47 47 47 47 47 47 39 321
$2,616.00
Payroll Taxes
10%
$2,877.60
P a g e | 28
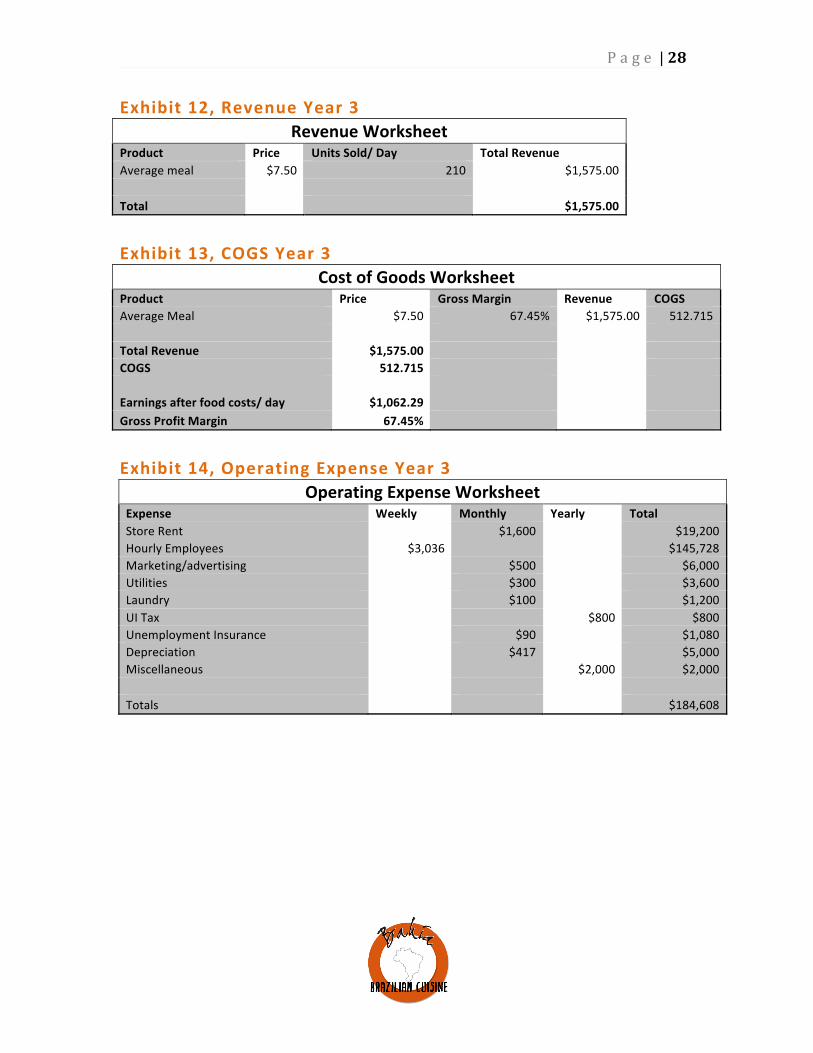
Exhibit 12, Revenue Year 3 Revenue Worksheet
Product Price Units Sold/ Day Total Revenue Average meal $7.50 210 $1,575.00 Total $1,575.00
Exhibit 13, COGS Year 3
Cost of Goods Worksheet Product Price Gross Margin Revenue COGS Average Meal $7.50 67.45% $1,575.00 512.715 Total Revenue $1,575.00 COGS 512.715
Earnings after food costs/ day $1,062.29 Gross Profit Margin 67.45%
Exhibit 14, Operating Expense Year 3
Operating Expense Worksheet Expense Weekly Monthly Yearly Total Store Rent $1,600 $19,200 Hourly Employees $3,036 $145,728 Marketing/advertising $500 $6,000 Utilities $300 $3,600 Laundry $100 $1,200 UI Tax $800 $800 Unemployment Insurance $90 $1,080 Depreciation $417 $5,000 Miscellaneous $2,000 $2,000 Totals $184,608
P a g e | 29
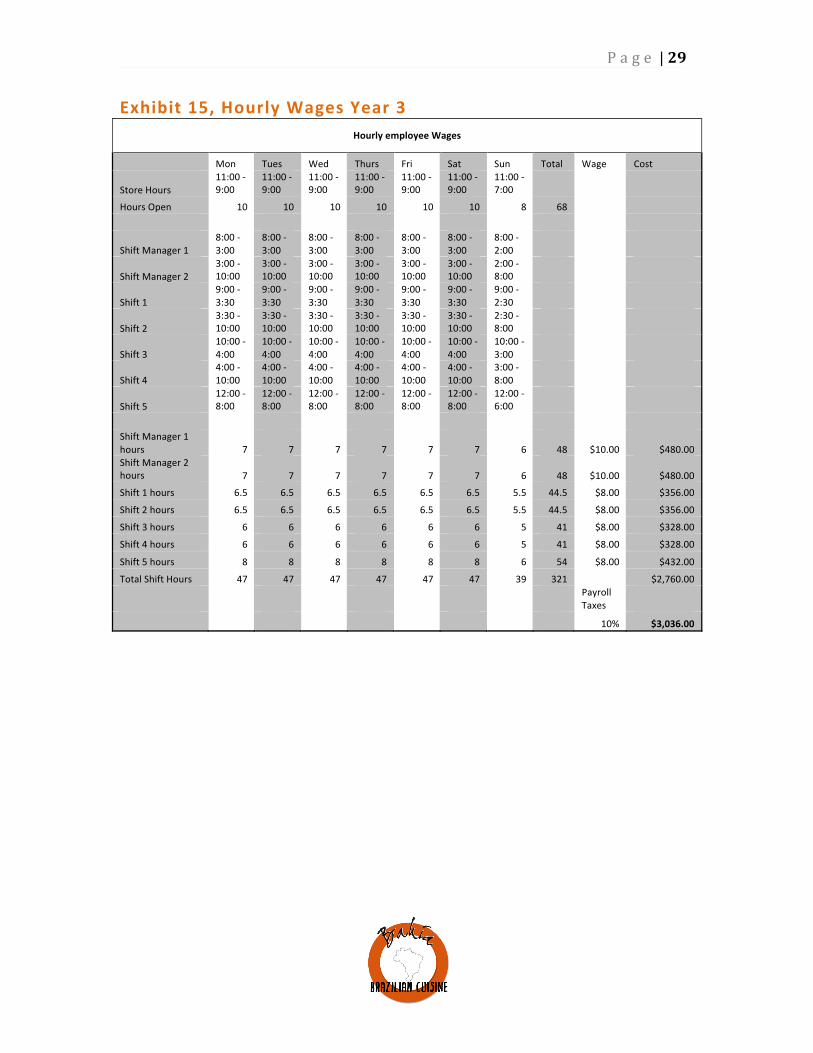
Exhibit 15, Hourly Wages Year 3 Hourly employee Wages
Mon Tues Wed Thurs Fri Sat Sun Total Wage Cost
Store Hours 11:00 -‐ 9:00
11:00 -‐ 9:00
11:00 -‐ 9:00
11:00 -‐ 9:00
11:00 -‐ 9:00
11:00 -‐ 9:00
11:00 -‐ 7:00
Hours Open 10 10 10 10 10 10 8 68
Shift Manager 1 8:00 -‐ 3:00
8:00 -‐ 3:00
8:00 -‐ 3:00
8:00 -‐ 3:00
8:00 -‐ 3:00
8:00 -‐ 3:00
8:00 -‐ 2:00
Shift Manager 2 3:00 -‐ 10:00
3:00 -‐ 10:00
3:00 -‐ 10:00
3:00 -‐ 10:00
3:00 -‐ 10:00
3:00 -‐ 10:00
2:00 -‐ 8:00
Shift 1 9:00 -‐ 3:30
9:00 -‐ 3:30
9:00 -‐ 3:30
9:00 -‐ 3:30
9:00 -‐ 3:30
9:00 -‐ 3:30
9:00 -‐ 2:30
Shift 2 3:30 -‐ 10:00
3:30 -‐ 10:00
3:30 -‐ 10:00
3:30 -‐ 10:00
3:30 -‐ 10:00
3:30 -‐ 10:00
2:30 -‐ 8:00
Shift 3 10:00 -‐ 4:00
10:00 -‐ 4:00
10:00 -‐ 4:00
10:00 -‐ 4:00
10:00 -‐ 4:00
10:00 -‐ 4:00
10:00 -‐ 3:00
Shift 4 4:00 -‐ 10:00
4:00 -‐ 10:00
4:00 -‐ 10:00
4:00 -‐ 10:00
4:00 -‐ 10:00
4:00 -‐ 10:00
3:00 -‐ 8:00
Shift 5 12:00 -‐ 8:00
12:00 -‐ 8:00
12:00 -‐ 8:00
12:00 -‐ 8:00
12:00 -‐ 8:00
12:00 -‐ 8:00
12:00 -‐ 6:00
Shift Manager 1 hours 7 7 7 7 7 7 6 48 $10.00 $480.00 Shift Manager 2 hours 7 7 7 7 7 7 6 48 $10.00 $480.00
Shift 1 hours 6.5 6.5 6.5 6.5 6.5 6.5 5.5 44.5 $8.00 $356.00
Shift 2 hours 6.5 6.5 6.5 6.5 6.5 6.5 5.5 44.5 $8.00 $356.00
Shift 3 hours 6 6 6 6 6 6 5 41 $8.00 $328.00
Shift 4 hours 6 6 6 6 6 6 5 41 $8.00 $328.00
Shift 5 hours 8 8 8 8 8 8 6 54 $8.00 $432.00
Total Shift Hours 47 47 47 47 47 47 39 321 $2,760.00
Payroll Taxes
10% $3,036.00
P a g e | 30
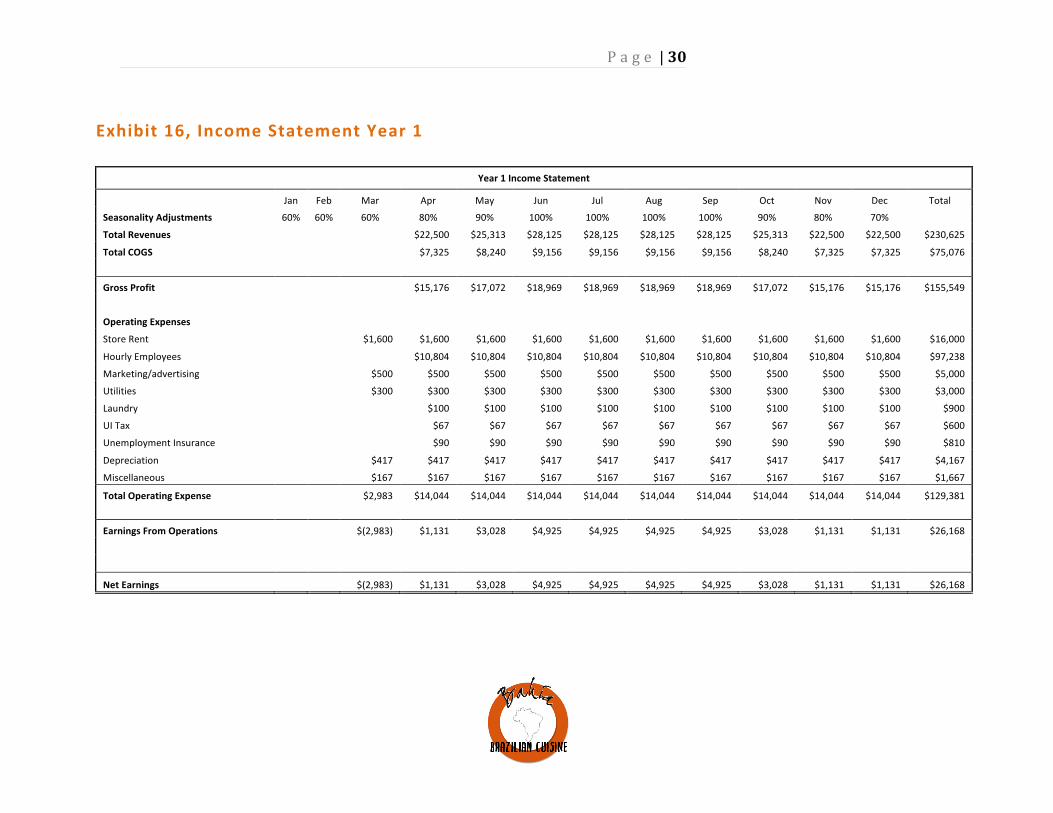
Exhibit 16, Income Statement Year 1
Year 1 Income Statement
Jan Feb Mar Apr May Jun Jul Aug Sep Oct Nov Dec Total
Seasonality Adjustments 60% 60% 60% 80% 90% 100% 100% 100% 100% 90% 80% 70%
Total Revenues $22,500 $25,313 $28,125 $28,125 $28,125 $28,125 $25,313 $22,500 $22,500 $230,625
Total COGS $7,325 $8,240 $9,156 $9,156 $9,156 $9,156 $8,240 $7,325 $7,325 $75,076
Gross Profit $15,176 $17,072 $18,969 $18,969 $18,969 $18,969 $17,072 $15,176 $15,176 $155,549
Operating Expenses
Store Rent $1,600 $1,600 $1,600 $1,600 $1,600 $1,600 $1,600 $1,600 $1,600 $1,600 $16,000
Hourly Employees $10,804 $10,804 $10,804 $10,804 $10,804 $10,804 $10,804 $10,804 $10,804 $97,238
Marketing/advertising $500 $500 $500 $500 $500 $500 $500 $500 $500 $500 $5,000
Utilities $300 $300 $300 $300 $300 $300 $300 $300 $300 $300 $3,000
Laundry $100 $100 $100 $100 $100 $100 $100 $100 $100 $900
UI Tax $67 $67 $67 $67 $67 $67 $67 $67 $67 $600
Unemployment Insurance $90 $90 $90 $90 $90 $90 $90 $90 $90 $810
Depreciation $417 $417 $417 $417 $417 $417 $417 $417 $417 $417 $4,167
Miscellaneous $167 $167 $167 $167 $167 $167 $167 $167 $167 $167 $1,667
Total Operating Expense $2,983 $14,044 $14,044 $14,044 $14,044 $14,044 $14,044 $14,044 $14,044 $14,044 $129,381
Earnings From Operations $(2,983) $1,131 $3,028 $4,925 $4,925 $4,925 $4,925 $3,028 $1,131 $1,131 $26,168
Net Earnings $(2,983) $1,131 $3,028 $4,925 $4,925 $4,925 $4,925 $3,028 $1,131 $1,131 $26,168
P a g e | 31
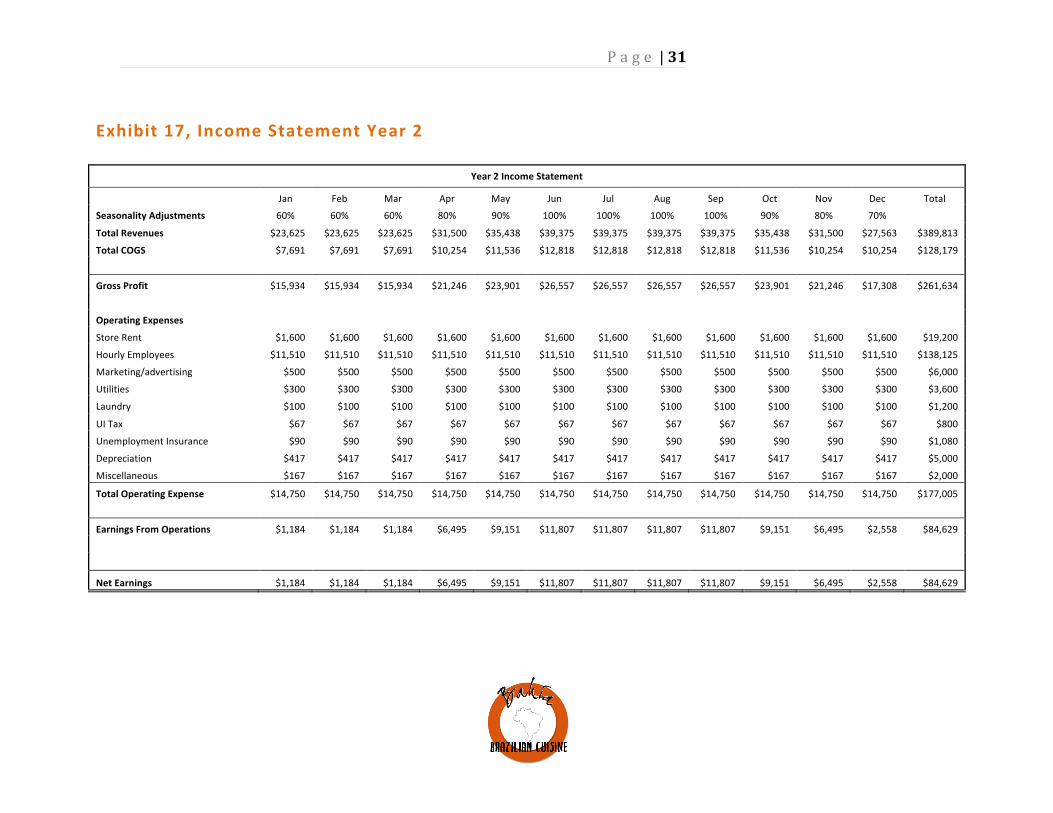
Exhibit 17, Income Statement Year 2
Year 2 Income Statement
Jan Feb Mar Apr May Jun Jul Aug Sep Oct Nov Dec Total
Seasonality Adjustments 60% 60% 60% 80% 90% 100% 100% 100% 100% 90% 80% 70%
Total Revenues $23,625 $23,625 $23,625 $31,500 $35,438 $39,375 $39,375 $39,375 $39,375 $35,438 $31,500 $27,563 $389,813
Total COGS $7,691 $7,691 $7,691 $10,254 $11,536 $12,818 $12,818 $12,818 $12,818 $11,536 $10,254 $10,254 $128,179
Gross Profit $15,934 $15,934 $15,934 $21,246 $23,901 $26,557 $26,557 $26,557 $26,557 $23,901 $21,246 $17,308 $261,634
Operating Expenses
Store Rent $1,600 $1,600 $1,600 $1,600 $1,600 $1,600 $1,600 $1,600 $1,600 $1,600 $1,600 $1,600 $19,200
Hourly Employees $11,510 $11,510 $11,510 $11,510 $11,510 $11,510 $11,510 $11,510 $11,510 $11,510 $11,510 $11,510 $138,125
Marketing/advertising $500 $500 $500 $500 $500 $500 $500 $500 $500 $500 $500 $500 $6,000
Utilities $300 $300 $300 $300 $300 $300 $300 $300 $300 $300 $300 $300 $3,600
Laundry $100 $100 $100 $100 $100 $100 $100 $100 $100 $100 $100 $100 $1,200
UI Tax $67 $67 $67 $67 $67 $67 $67 $67 $67 $67 $67 $67 $800
Unemployment Insurance $90 $90 $90 $90 $90 $90 $90 $90 $90 $90 $90 $90 $1,080
Depreciation $417 $417 $417 $417 $417 $417 $417 $417 $417 $417 $417 $417 $5,000
Miscellaneous $167 $167 $167 $167 $167 $167 $167 $167 $167 $167 $167 $167 $2,000
Total Operating Expense $14,750 $14,750 $14,750 $14,750 $14,750 $14,750 $14,750 $14,750 $14,750 $14,750 $14,750 $14,750 $177,005
Earnings From Operations $1,184 $1,184 $1,184 $6,495 $9,151 $11,807 $11,807 $11,807 $11,807 $9,151 $6,495 $2,558 $84,629
Net Earnings $1,184 $1,184 $1,184 $6,495 $9,151 $11,807 $11,807 $11,807 $11,807 $9,151 $6,495 $2,558 $84,629

P a g e | 32
Exhibit 18, Income Statement Year 3
Income Statement Year 3
Jan Feb Mar Apr May Jun Jul Aug Sep Oct Nov Dec Total
Seasonality Adjustments 60% 60% 60% 80% 90% 100% 100% 100% 100% 90% 80% 70%
Total Revenues $28,350 $28,350 $28,350 $37,800 $42,525 $47,250 $47,250 $47,250 $47,250 $42,525 $37,800 $33,075 $467,775
Total COGS $9,229 $9,229 $9,229 $12,305 $13,843 $15,381 $15,381 $15,381 $15,381 $13,843 $12,305 $12,305 $153,815
Gross Profit $19,121 $19,121 $19,121 $25,495 $28,682 $31,869 $31,869 $31,869 $31,869 $28,682 $25,495 $20,770 $313,961
Operating Expenses
Store Rent $1,600 $1,600 $1,600 $1,600 $1,600 $1,600 $1,600 $1,600 $1,600 $1,600 $1,600 $1,600 $19,200
Hourly Employees $12,144 $12,144 $12,144 $12,144 $12,144 $12,144 $12,144 $12,144 $12,144 $12,144 $12,144 $12,144 $145,728
Marketing/advertising $500 $500 $500 $500 $500 $500 $500 $500 $500 $500 $500 $500 $6,000
Utilities $300 $300 $300 $300 $300 $300 $300 $300 $300 $300 $300 $300 $3,600
Laundry $100 $100 $100 $100 $100 $100 $100 $100 $100 $100 $100 $100 $1,200
UI Tax $67 $67 $67 $67 $67 $67 $67 $67 $67 $67 $67 $67 $800
Unemployment Insurance $90 $90 $90 $90 $90 $90 $90 $90 $90 $90 $90 $90 $1,080
Depreciation $417 $417 $417 $417 $417 $417 $417 $417 $417 $417 $417 $417 $5,000
Miscellaneous $167 $167 $167 $167 $167 $167 $167 $167 $167 $167 $167 $167 $2,000
Total Operating Expense $15,384 $15,384 $15,384 $15,384 $15,384 $15,384 $15,384 $15,384 $15,384 $15,384 $15,384 $15,384 $184,608
Earnings From Operations $3,737 $3,737 $3,737 $10,111 $13,298 $16,485 $16,485 $16,485 $16,485 $13,298 $10,111 $5,386 $129,352
Net Earnings $3,737 $3,737 $3,737 $10,111 $13,298 $16,485 $16,485 $16,485 $16,485 $13,298 $10,111 $5,386 $129,352

P a g e | 33
Exhibit 19, Cash Flow Statement Year 1
Bahia Cash Flow Statement Year 1
Jan Feb Mar Apr May Jun Jul Aug Sep Oct Nov Dec
Operating Activities
Net Earnings $(2,983) $1,131 $3,028 $4,925 $4,925 $4,925 $4,925 $3,028 $1,131 $1,131
Depreciation $417 $417 $417 $417 $417 $417 $417 $417 $417 $417
Working Capital Changes
Net Cash Provided/(Used) by Operating Activities $(2,567) $1,548 $3,445 $5,342 $5,342 $5,342 $5,342 $3,445 $1,548 $1,548
Investing Activities
Property and Equipment $(55,672)
Lease Improvements $(23,000)
Net Cash Used in Investing Activities $(78,672) $-‐ $-‐ $-‐ $-‐ $-‐ $-‐ $-‐ $-‐ $-‐
Financing Activities
Capital Investments $105,000
Net Cash Provided/(Used) by Financing $105,000 $-‐ $-‐ $-‐ $-‐ $-‐ $-‐ $-‐ $-‐ $-‐
Increase/(Decrease) in Cash $23,761 $1,548 $3,445 $5,342 $5,342 $5,342 $5,342 $3,445 $1,548 $1,548
Cash at Beginning of Period $-‐ $23,761 $25,309 $28,754 $34,096 $39,438 $44,780 $50,121 $53,566 $55,114
Cash at End of Period $23,761 $25,309 $28,754 $34,096 $39,438 $44,780 $50,121 $53,566 $55,114 $56,662
P a g e | 34
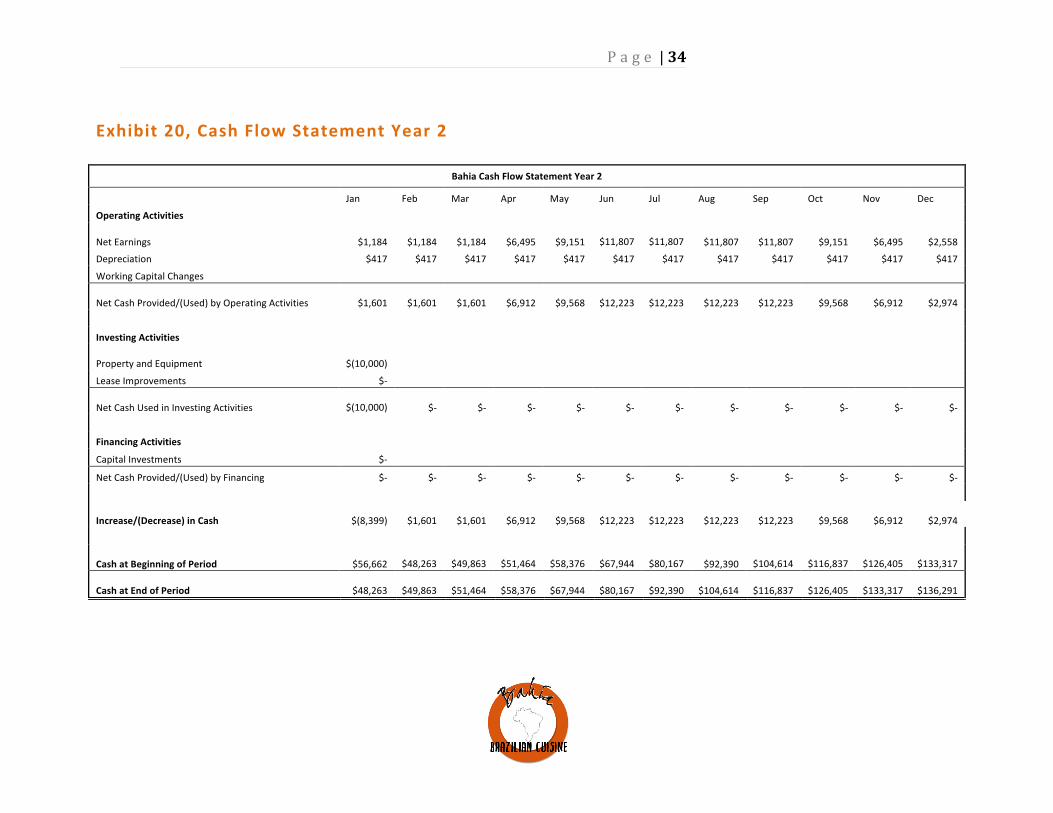
Exhibit 20, Cash Flow Statement Year 2
Bahia Cash Flow Statement Year 2
Jan Feb Mar Apr May Jun Jul Aug Sep Oct Nov Dec
Operating Activities
Net Earnings $1,184 $1,184 $1,184 $6,495 $9,151
$11,807
$11,807 $11,807 $11,807 $9,151 $6,495 $2,558
Depreciation $417 $417 $417 $417 $417 $417 $417 $417 $417 $417 $417 $417
Working Capital Changes
Net Cash Provided/(Used) by Operating Activities $1,601 $1,601 $1,601 $6,912 $9,568
$12,223
$12,223 $12,223 $12,223 $9,568 $6,912 $2,974
Investing Activities
Property and Equipment
$(10,000)
Lease Improvements $-‐
Net Cash Used in Investing Activities
$(10,000) $-‐ $-‐ $-‐ $-‐ $-‐ $-‐ $-‐ $-‐ $-‐ $-‐ $-‐
Financing Activities
Capital Investments $-‐
Net Cash Provided/(Used) by Financing $-‐ $-‐ $-‐ $-‐ $-‐ $-‐ $-‐ $-‐ $-‐ $-‐ $-‐ $-‐
Increase/(Decrease) in Cash $(8,399) $1,601 $1,601 $6,912 $9,568
$12,223
$12,223 $12,223 $12,223 $9,568 $6,912 $2,974
Cash at Beginning of Period $56,662
$48,263
$49,863
$51,464
$58,376
$67,944
$80,167 $92,390
$104,614
$116,837
$126,405
$133,317
Cash at End of Period $48,263
$49,863
$51,464
$58,376
$67,944
$80,167
$92,390
$104,614
$116,837
$126,405
$133,317
$136,291
P a g e | 35
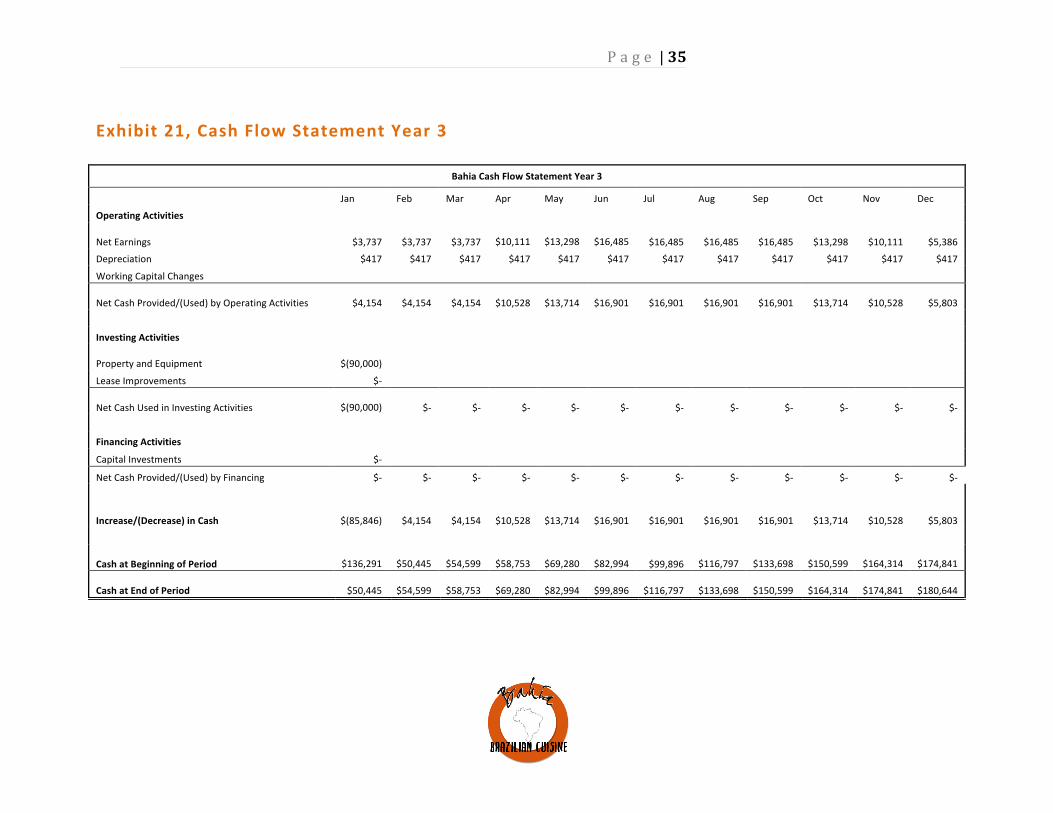
Exhibit 21, Cash Flow Statement Year 3
Bahia Cash Flow Statement Year 3
Jan Feb Mar Apr May Jun Jul Aug Sep Oct Nov Dec
Operating Activities
Net Earnings $3,737 $3,737 $3,737
$10,111
$13,298
$16,485 $16,485 $16,485 $16,485 $13,298 $10,111 $5,386
Depreciation $417 $417 $417 $417 $417 $417 $417 $417 $417 $417 $417 $417
Working Capital Changes
Net Cash Provided/(Used) by Operating Activities $4,154 $4,154 $4,154
$10,528
$13,714
$16,901 $16,901 $16,901 $16,901 $13,714 $10,528 $5,803
Investing Activities
Property and Equipment
$(90,000)
Lease Improvements $-‐
Net Cash Used in Investing Activities
$(90,000) $-‐ $-‐ $-‐ $-‐ $-‐ $-‐ $-‐ $-‐ $-‐ $-‐ $-‐
Financing Activities
Capital Investments $-‐
Net Cash Provided/(Used) by Financing $-‐ $-‐ $-‐ $-‐ $-‐ $-‐ $-‐ $-‐ $-‐ $-‐ $-‐ $-‐
Increase/(Decrease) in Cash
$(85,846) $4,154 $4,154
$10,528
$13,714
$16,901 $16,901 $16,901 $16,901 $13,714 $10,528 $5,803
Cash at Beginning of Period
$136,291
$50,445
$54,599
$58,753
$69,280
$82,994 $99,896
$116,797
$133,698
$150,599
$164,314
$174,841
Cash at End of Period $50,445
$54,599
$58,753
$69,280
$82,994
$99,896
$116,797
$133,698
$150,599
$164,314
$174,841
$180,644
P a g e | 36
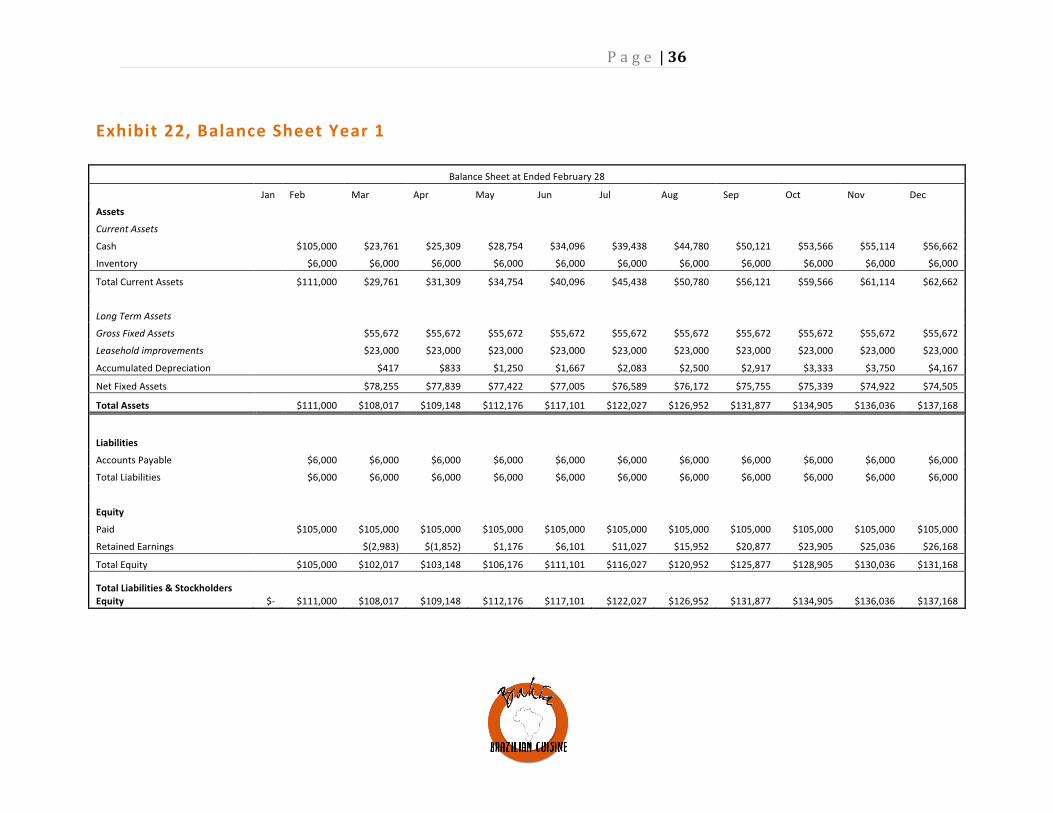
Exhibit 22, Balance Sheet Year 1
Balance Sheet at Ended February 28
Jan Feb Mar Apr May Jun Jul Aug Sep Oct Nov Dec
Assets
Current Assets
Cash $105,000 $23,761 $25,309 $28,754 $34,096 $39,438 $44,780 $50,121 $53,566 $55,114 $56,662
Inventory $6,000 $6,000 $6,000 $6,000 $6,000 $6,000 $6,000 $6,000 $6,000 $6,000 $6,000
Total Current Assets $111,000 $29,761 $31,309 $34,754 $40,096 $45,438 $50,780 $56,121 $59,566 $61,114 $62,662
Long Term Assets
Gross Fixed Assets $55,672 $55,672 $55,672 $55,672 $55,672 $55,672 $55,672 $55,672 $55,672 $55,672
Leasehold improvements $23,000 $23,000 $23,000 $23,000 $23,000 $23,000 $23,000 $23,000 $23,000 $23,000
Accumulated Depreciation $417 $833 $1,250 $1,667 $2,083 $2,500 $2,917 $3,333 $3,750 $4,167
Net Fixed Assets $78,255 $77,839 $77,422 $77,005 $76,589 $76,172 $75,755 $75,339 $74,922 $74,505
Total Assets $111,000 $108,017 $109,148 $112,176 $117,101 $122,027 $126,952 $131,877 $134,905 $136,036 $137,168
Liabilities
Accounts Payable $6,000 $6,000 $6,000 $6,000 $6,000 $6,000 $6,000 $6,000 $6,000 $6,000 $6,000
Total Liabilities $6,000 $6,000 $6,000 $6,000 $6,000 $6,000 $6,000 $6,000 $6,000 $6,000 $6,000
Equity
Paid $105,000 $105,000 $105,000 $105,000 $105,000 $105,000 $105,000 $105,000 $105,000 $105,000 $105,000
Retained Earnings $(2,983) $(1,852) $1,176 $6,101 $11,027 $15,952 $20,877 $23,905 $25,036 $26,168
Total Equity $105,000 $102,017 $103,148 $106,176 $111,101 $116,027 $120,952 $125,877 $128,905 $130,036 $131,168
Total Liabilities & Stockholders Equity $-‐ $111,000 $108,017 $109,148 $112,176 $117,101 $122,027 $126,952 $131,877 $134,905 $136,036 $137,168
P a g e | 37
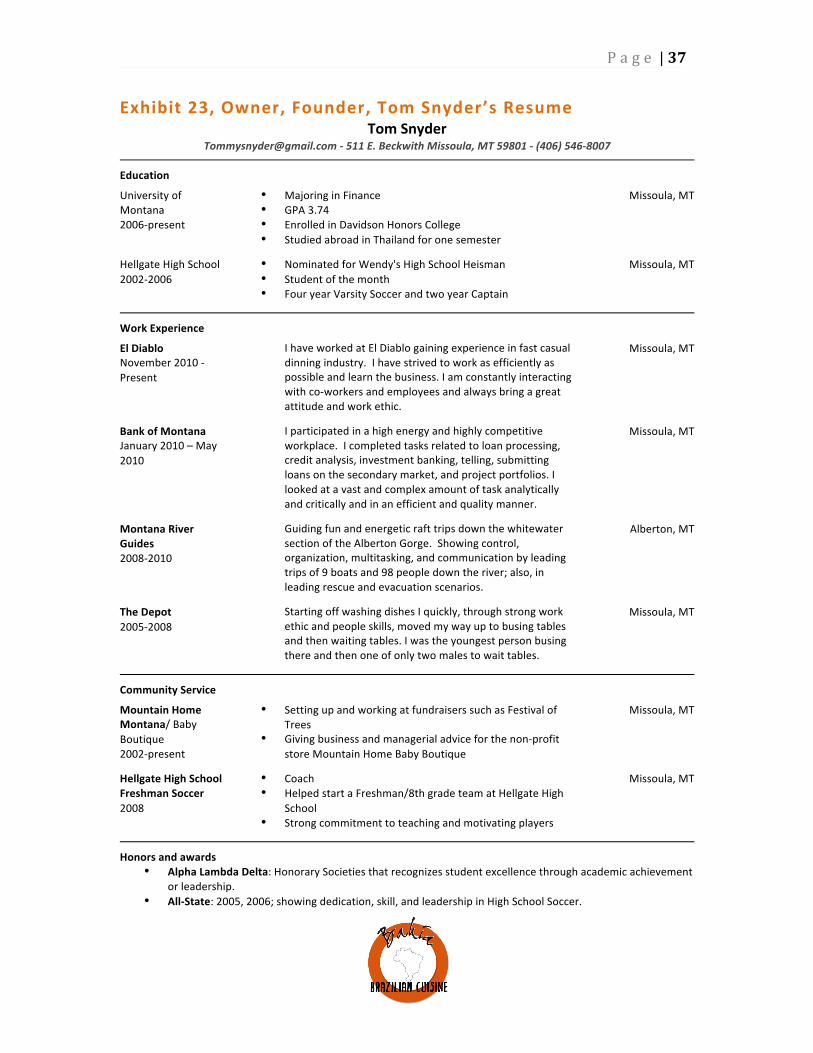
Exhibit 23, Owner, Founder, Tom Snyder’s Resume Tom Snyder
[email protected] -‐ 511 E. Beckwith Missoula, MT 59801 -‐ (406) 546-‐8007
Education
University of Montana 2006-‐present
• Majoring in Finance • GPA 3.74 • Enrolled in Davidson Honors College • Studied abroad in Thailand for one semester
Missoula, MT
Hellgate High School 2002-‐2006
• Nominated for Wendy's High School Heisman • Student of the month • Four year Varsity Soccer and two year Captain
Missoula, MT
Work Experience
El Diablo November 2010 -‐ Present
I have worked at El Diablo gaining experience in fast casual dinning industry. I have strived to work as efficiently as possible and learn the business. I am constantly interacting with co-‐workers and employees and always bring a great attitude and work ethic.
Missoula, MT
Bank of Montana January 2010 – May 2010
I participated in a high energy and highly competitive workplace. I completed tasks related to loan processing, credit analysis, investment banking, telling, submitting loans on the secondary market, and project portfolios. I looked at a vast and complex amount of task analytically and critically and in an efficient and quality manner.
Missoula, MT
Montana River Guides 2008-‐2010
Guiding fun and energetic raft trips down the whitewater section of the Alberton Gorge. Showing control, organization, multitasking, and communication by leading trips of 9 boats and 98 people down the river; also, in leading rescue and evacuation scenarios.
Alberton, MT
The Depot 2005-‐2008
Starting off washing dishes I quickly, through strong work ethic and people skills, moved my way up to busing tables and then waiting tables. I was the youngest person busing there and then one of only two males to wait tables.
Missoula, MT
Community Service
Mountain Home Montana/ Baby Boutique 2002-‐present
• Setting up and working at fundraisers such as Festival of Trees
• Giving business and managerial advice for the non-‐profit store Mountain Home Baby Boutique
Missoula, MT
Hellgate High School Freshman Soccer 2008
• Coach • Helped start a Freshman/8th grade team at Hellgate High
School • Strong commitment to teaching and motivating players
Missoula, MT
Honors and awards
• Alpha Lambda Delta: Honorary Societies that recognizes student excellence through academic achievement or leadership.
• All-‐State: 2005, 2006; showing dedication, skill, and leadership in High School Soccer.
P a g e | 38
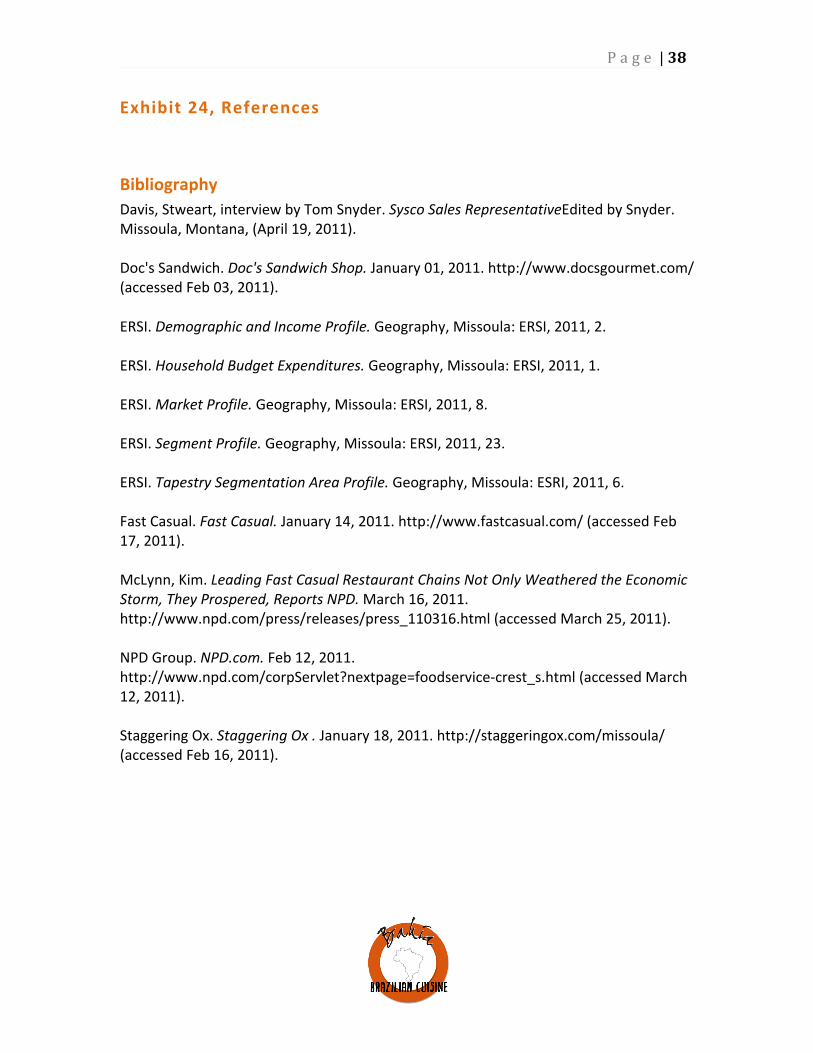
Exhibit 24, References
Bibliography Davis, Stweart, interview by Tom Snyder. Sysco Sales RepresentativeEdited by Snyder. Missoula, Montana, (April 19, 2011). Doc's Sandwich. Doc's Sandwich Shop. January 01, 2011. http://www.docsgourmet.com/ (accessed Feb 03, 2011). ERSI. Demographic and Income Profile. Geography, Missoula: ERSI, 2011, 2. ERSI. Household Budget Expenditures. Geography, Missoula: ERSI, 2011, 1. ERSI. Market Profile. Geography, Missoula: ERSI, 2011, 8. ERSI. Segment Profile. Geography, Missoula: ERSI, 2011, 23. ERSI. Tapestry Segmentation Area Profile. Geography, Missoula: ESRI, 2011, 6. Fast Casual. Fast Casual. January 14, 2011. http://www.fastcasual.com/ (accessed Feb 17, 2011). McLynn, Kim. Leading Fast Casual Restaurant Chains Not Only Weathered the Economic Storm, They Prospered, Reports NPD. March 16, 2011. http://www.npd.com/press/releases/press_110316.html (accessed March 25, 2011). NPD Group. NPD.com. Feb 12, 2011. http://www.npd.com/corpServlet?nextpage=foodservice-‐crest_s.html (accessed March 12, 2011). Staggering Ox. Staggering Ox . January 18, 2011. http://staggeringox.com/missoula/ (accessed Feb 16, 2011).