Embed Size (px)
Citation preview
Cardiac Arrhythmia Classification Using a Combination of Quadratic Spline-Based Wavelet Transform and
Artificial Neural Classification Network.
Jose Antonio Gutierrez-Gnecchi1, Rodrigo Morfin-Magaña1, Adriana del Carmen Tellez-Anguiano1, Daniel Lorias-Espinoza2, Enrique Reyes-Archundia1, Obeth Her-
nández Díaz1.
1Instituto Tecnológico de Morelia, Departamento de Ingeniería Electrónica, Avenida Tecnoló-gico 1500, Col. Lomas de Santiaguito, Morelia, Michoacán, México. C. P. 58120. Telephone:
(52) 4433121570 ext 270, Email: [email protected]. 2CINVESTAV/IPN, Av. Instituto Politécnico Nacional 2508, Col. San Pedro Zacatenco, C.P.
07360 México, D.F., México. Telephone: (52) 5557473800. Email: [email protected]
Keywords: Electrocardiogram, Wavelet Transform, Probabilistic Neural Net-work, Cardiac Arrhythmia, Digital Signal Processing.
Abstract. The authors present the use of Wavelet Transform, using a quadratic spline
function, and Probabilistic Neural Network (PNN) to classify 8 heartbeat condi-tions. The process consists of four mains stages. The first part consists of pre-processing a nd f iltering selected ECG l ead II (D II) data re gisters f rom t he PhysioNet repository. The filtered signal is fed to a w avelet transform process using a quadratic s pline f unction, to obtain a f eature v ector. T he r esults ar e transferred to a Probabilistic Neural Network algorithm for heartbeat classifica-tion. Finally, the algorithm is tested with confusion matrices to determine clas-sification accuracy. The algorithm yielded a 9 1.5%, 90.3% and 95.5% classifi-cation accu racy f or au ricular f ibrillation, s inoauricular h eart block an d p arox-ysmal atrial fibrillation conditions respectively. The lower scores were obtained for p remature at rial co ntraction and premature v entricular co ntraction condi-tions (75.5% and 69.9% respectively). However, considering the validation test conditions, the results suggest the algorithm is suitable for on-line classification of heartbeat conditions as part of a DSP-based Holter device.
1 Introduction
Cardiovascular disease prevails as one of the main causes of death worldwide. In turn t achyarrhythmic events are associated with a large p ercentage o f sudden d eath cases [1]. Cardiac arrhythmia o ccurs intermittently which difficults early d iagnosis. Amongst the c linical methods used for measuring cardiac act ivity the electrocardio-gram (ECG) continues to be a cost-effective method for elucidating heart condition [2-3]: cardiac act ivity is recorded non-invasively by means of a s et of electrodes at-
Proceedings IWBBIO 2014. Granada 7-9 April, 2014 1743
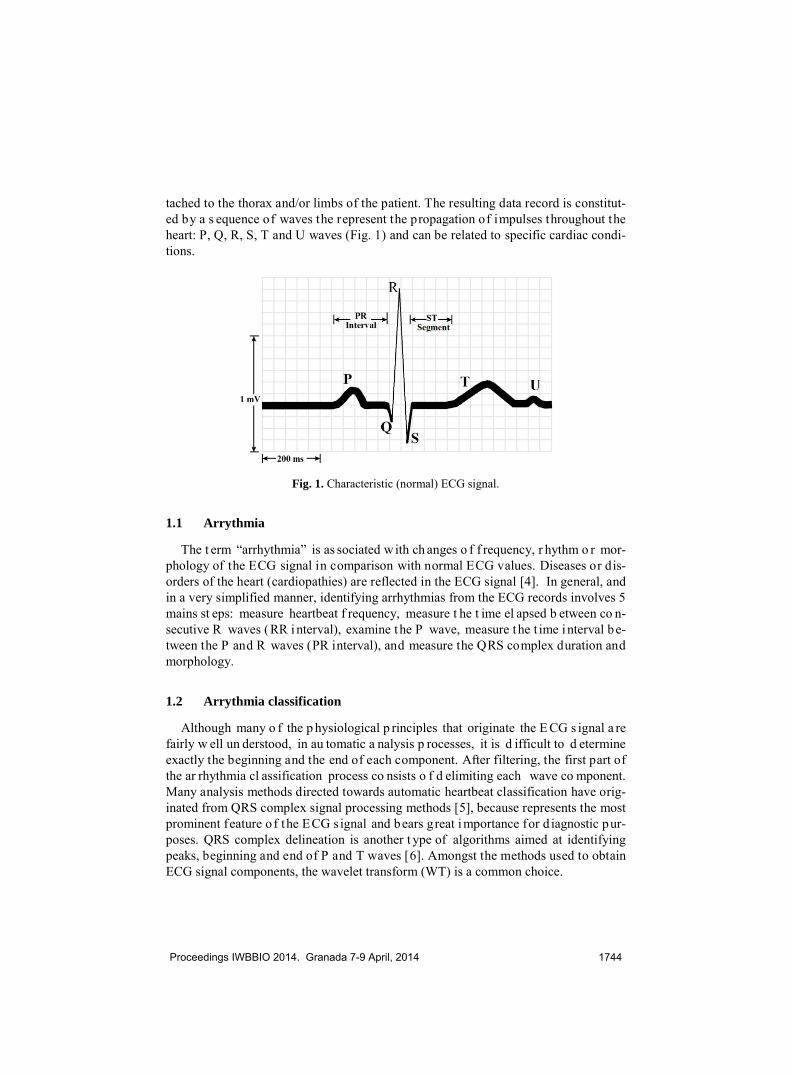
tached to the thorax and/or limbs of the patient. The resulting data record is constitut-ed by a s equence of waves the represent the propagation of impulses throughout the heart: P, Q, R, S, T and U waves (Fig. 1) and can be related to specific cardiac condi-tions.
Fig. 1. Characteristic (normal) ECG signal.
1.1 Arrythmia
The t erm “arrhythmia” is as sociated w ith ch anges o f f requency, r hythm o r mor-phology of the ECG signal in comparison with normal ECG values. Diseases or dis-orders of the heart (cardiopathies) are reflected in the ECG signal [4]. In general, and in a very simplified manner, identifying arrhythmias from the ECG records involves 5 mains st eps: measure heartbeat f requency, measure t he t ime el apsed b etween co n-secutive R waves (RR i nterval), examine the P wave, measure the t ime interval be-tween the P and R waves (PR interval), and measure the QRS complex duration and morphology.
1.2 Arrythmia classification
Although many o f the p hysiological p rinciples that originate the E CG s ignal a re fairly w ell un derstood, in au tomatic a nalysis p rocesses, it is d ifficult to d etermine exactly the beginning and the end of each component. After filtering, the first part of the ar rhythmia cl assification process co nsists o f d elimiting each wave co mponent. Many analysis methods directed towards automatic heartbeat classification have orig-inated from QRS complex signal processing methods [5], because represents the most prominent feature o f the ECG s ignal and bears great importance for d iagnostic pur-poses. QRS complex delineation is another t ype of algorithms aimed at identifying peaks, beginning and end of P and T waves [6]. Amongst the methods used to obtain ECG signal components, the wavelet transform (WT) is a common choice.
Proceedings IWBBIO 2014. Granada 7-9 April, 2014 1744

1.3 Wavelet Transform
Performing the wavelet transform on a g iven signal can be considered as a l ineal operation to o btain a ti me-frequency co mponent r epresentation at d ifferent s cales. Consider Ψ(x) as a function of real or complex values in Hilbert space L2(R), where L represents the vector space of square-integrable functions and satisfies the admissibil-ity condition so that (1):
∫ 𝜓(𝑥)∞−∞ 𝑑𝑥 = 0 (1)
One of the properties of the wavelet transform is that it can be scaled (2):
𝜓𝑠(𝑥) = 1𝑠 𝜓 �𝑥
𝑠� (2)
The scale factor, s, dilates (s>0) or contracts (s<0) the wavelet function. Thus a con-tinuous wavelet transform representation of function f(x) ϵ L2(R) is (3):
𝑊𝑠𝑓(𝑥) = 𝑓(𝑥) ∗ 𝜓𝑠(𝑥) = 1𝑠 ∫ 𝑓(𝑡) �𝜓 �𝑥−𝑡
𝑠�� 𝑑𝑡∞
−∞ (3)
where t is the translational factor, and corresponds to the time-domain convolution of f(x) and the basis function. From (3) the wavelet transform result depends on scale parameter s . In o rder to implement the wavelet transform on a computing device to operate on real data, it is necessary to use a fast discrete wavelet transformation. Giv-en the scale factor s=2j where j ϵ Z, and Z is the set of all integers, yields the binary or dyadic wavelet transform [7]; assigning s to be multiples of two, results in a discrete binary wavelet transform implementation suitable for digital signal processing appli-cations. The discrete wavelet transform of a digital signal f(n) can be calculated using (4) and (5):
𝑠2𝑗𝑓(𝑛) = ∑ ℎ𝑘𝑠2
𝑗−1𝑓(𝑛 − 2𝑗−1𝑘)𝑘 𝜖 𝒁 (4)
𝑊2𝑗𝑓(𝑛) = ∑ 𝑔𝑘𝑠2
𝑗−1𝑓(𝑛 − 2𝑗−1𝑘)𝑘 𝜖 𝒁 (5)
where 𝑠2𝑗𝑓(𝑛) are approximation coefficients, 𝑊2
𝑗𝑓(𝑛)represent detail coefficients (2j scale w avelet transform o f f(n)) a nd n is t he s ample number. The terms {ℎ𝑘 , 𝑘 𝜖 𝒁}and {𝑔𝑘 , 𝑘 𝜖 𝒁} correspond to low pass (H(W)) and high pass (G(W)) coef-ficients r espectively. A number o f wavelet functions for heartbeat classification ar e continuously r eported, i ncluding t he H aar wavelet ( Fig. 2 A) [ 8], t he M exican h at wavelet (Fig. 2B) [9], the Morlet wavelet (Fig. 2C) [10] quadratic wavelet spline de-rived from a Gaussian function (Fig 2D) and combination of wavelet functions [11]. In particular, quadratic wavelets have shown acceptable time and frequency resolution when applied to ECG analysis [12], and suitability for implementation on dedicated processing hardware [13]. The quadratic wavelet used in this work to obtain the ECG fiducial marker and feature arrays, is derived from a Gaussian function (Fig. 2D) for compact support (6):
Proceedings IWBBIO 2014. Granada 7-9 April, 2014 1745
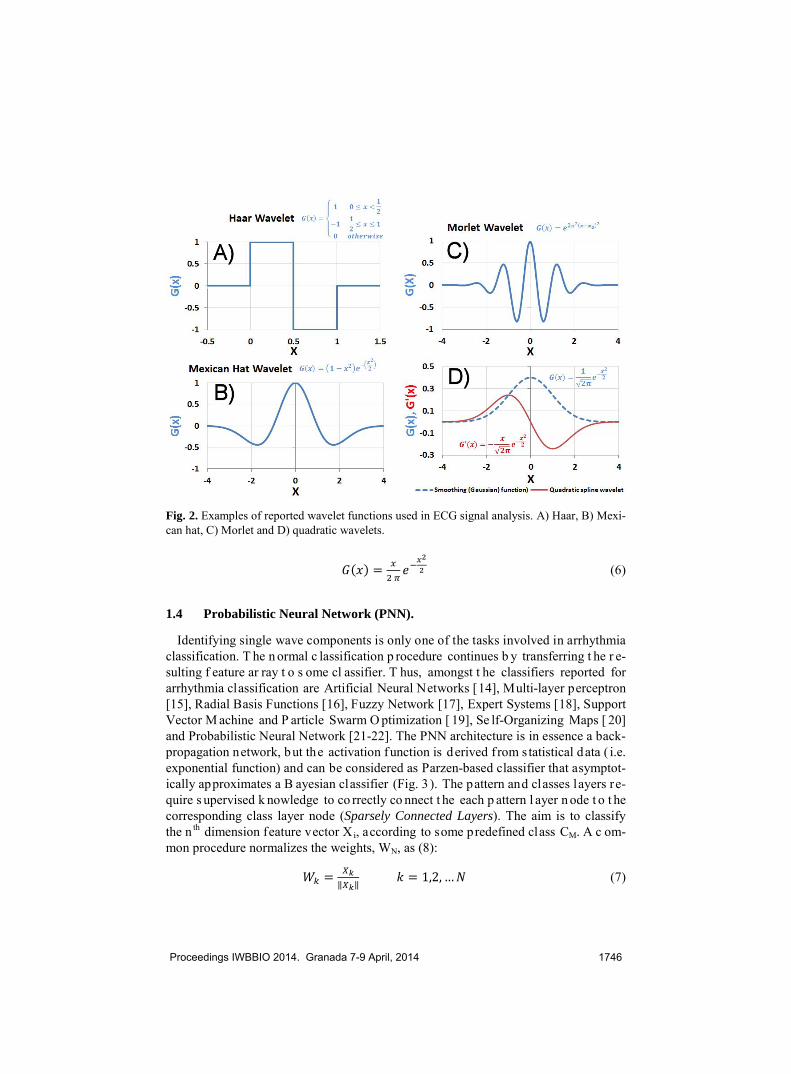
Fig. 2. Examples of reported wavelet functions used in ECG signal analysis. A) Haar, B) Mexi-can hat, C) Morlet and D) quadratic wavelets.
𝐺(𝑥) = 𝑥2 𝜋𝑒−
𝑥22 (6)
1.4 Probabilistic Neural Network (PNN).
Identifying single wave components is only one of the tasks involved in arrhythmia classification. T he n ormal c lassification p rocedure continues b y transferring t he r e-sulting f eature ar ray t o s ome cl assifier. T hus, amongst t he classifiers reported for arrhythmia classification are Artificial Neural Networks [14], Multi-layer perceptron [15], Radial Basis Functions [16], Fuzzy Network [17], Expert Systems [18], Support Vector M achine and P article Swarm O ptimization [ 19], Se lf-Organizing Maps [ 20] and Probabilistic Neural Network [21-22]. The PNN architecture is in essence a back-propagation network, but the activation function is derived f rom s tatistical data ( i.e. exponential function) and can be considered as Parzen-based classifier that asymptot-ically approximates a B ayesian classifier (Fig. 3 ). The pattern and classes layers re-quire s upervised k nowledge to co rrectly co nnect t he each p attern l ayer n ode t o t he corresponding class layer node (Sparsely Connected Layers). The aim is to classify the n th dimension feature vector Xi, according to some predefined class CM. A c om-mon procedure normalizes the weights, WN, as (8):
𝑊𝑘 = 𝑋𝑘‖𝑋𝑘‖
𝑘 = 1,2, …𝑁 (7)
Proceedings IWBBIO 2014. Granada 7-9 April, 2014 1746
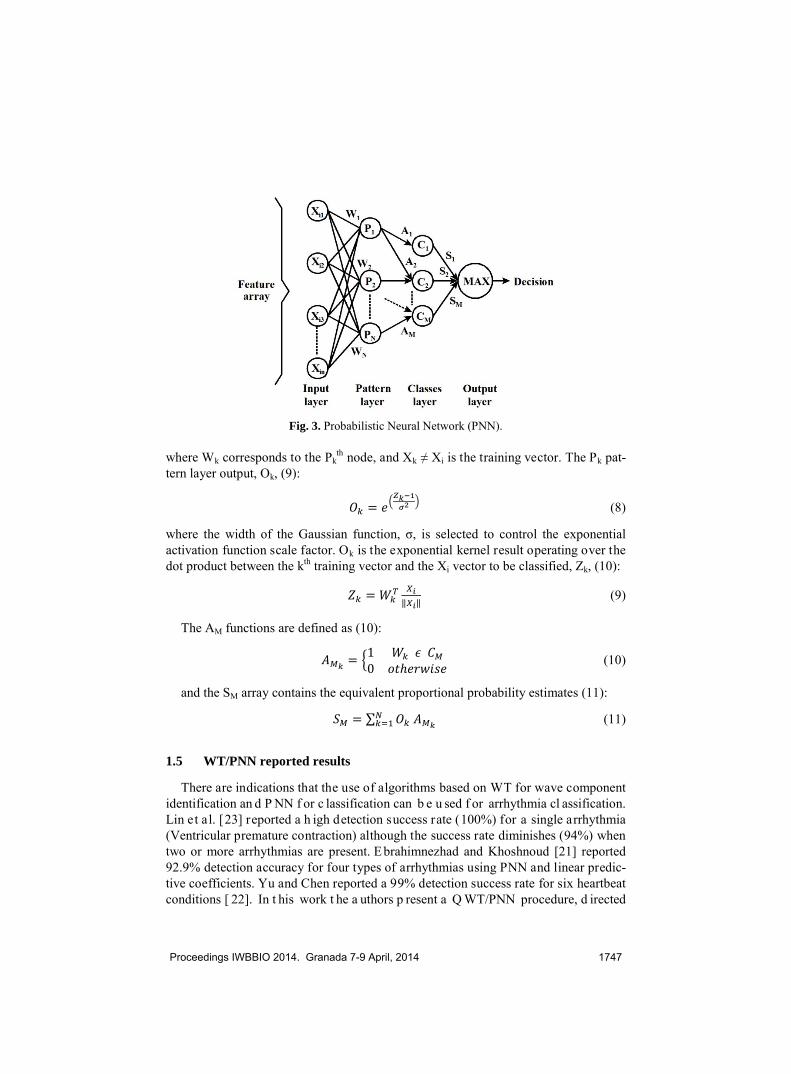
Fig. 3. Probabilistic Neural Network (PNN).
where Wk corresponds to the Pkth node, and Xk ≠ Xi is the training vector. The Pk pat-
tern layer output, Ok, (9):
𝑂𝑘 = 𝑒�𝑍𝑘−1𝜎2
� (8)
where the width of the Gaussian function, σ, is selected to control the exponential activation function scale factor. Ok is the exponential kernel result operating over the dot product between the kth training vector and the Xi vector to be classified, Zk, (10):
𝑍𝑘 = 𝑊𝑘𝑇 𝑋𝑖‖𝑋𝑖‖
(9)
The AM functions are defined as (10):
𝐴𝑀𝑘 = �1 𝑊𝑘 𝜖 𝐶𝑀0 𝑜𝑡ℎ𝑒𝑟𝑤𝑖𝑠𝑒 (10)
and the SM array contains the equivalent proportional probability estimates (11):
𝑆𝑀 = ∑ 𝑂𝑘 𝐴𝑀𝑘𝑁𝑘=1 (11)
1.5 WT/PNN reported results
There are indications that the use of algorithms based on WT for wave component identification an d P NN f or c lassification can b e u sed f or arrhythmia cl assification. Lin et al. [23] reported a h igh detection success rate (100%) for a single arrhythmia (Ventricular premature contraction) although the success rate diminishes (94%) when two or more arrhythmias are present. Ebrahimnezhad and Khoshnoud [21] reported 92.9% detection accuracy for four types of arrhythmias using PNN and linear predic-tive coefficients. Yu and Chen reported a 99% detection success rate for six heartbeat conditions [ 22]. In t his work t he a uthors p resent a Q WT/PNN procedure, d irected
Proceedings IWBBIO 2014. Granada 7-9 April, 2014 1747
towards c lassifying e ight heart b eat c onditions: no rmal s inus r hythm ( N), auricular fibrillation ( AF), p remature a trial contraction ( PAC), left b undle b ranch b lock (LBBB), right b undle b ranch block ( RBBB), premature ve ntricular contraction (PVC), sinoauricular heart block (SHB) and paroxysmal atrial fibrillation (PAF).
2 QWT/PNN arrhythmia classification procedure
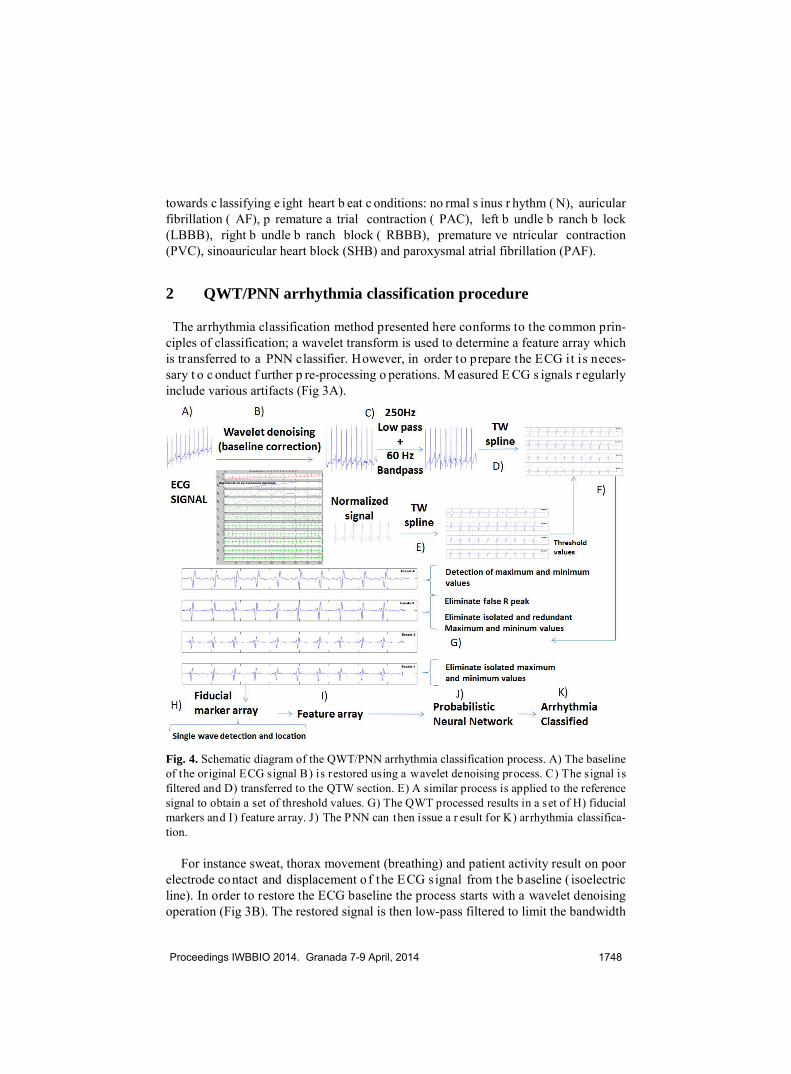
The arrhythmia classification method presented here conforms to the common prin-ciples of classification; a wavelet transform is used to determine a feature array which is transferred to a PNN classifier. However, in order to prepare the ECG it is neces-sary t o c onduct f urther p re-processing o perations. M easured E CG s ignals r egularly include various artifacts (Fig 3A).
Fig. 4. Schematic diagram of the QWT/PNN arrhythmia classification process. A) The baseline of the original ECG signal B) is restored using a wavelet denoising process. C) The signal is filtered and D) transferred to the QTW section. E) A similar process is applied to the reference signal to obtain a set of threshold values. G) The QWT processed results in a set of H) fiducial markers and I) feature array. J) The PNN can then issue a r esult for K) arrhythmia classifica-tion.
For instance sweat, thorax movement (breathing) and patient activity result on poor electrode contact and displacement o f the ECG s ignal from the baseline ( isoelectric line). In order to restore the ECG baseline the process starts with a wavelet denoising operation (Fig 3B). The restored signal is then low-pass filtered to limit the bandwidth
Proceedings IWBBIO 2014. Granada 7-9 April, 2014 1748
to 250 Hz, a nd band-reject filtered to reduce the ef fect o f t he mains ( 50 or 60 H z, selectable) (Fig 3C). The filtered signal is then transferred to the QWT section (Fig. 3F). In a similar manner, the reference ECG signal is processed (Fig. 3E) to determine a set of threshold values (Fig 3F) as the basis to obtain the fiducial marker array (Fig 3H) and thus the feature array (Fig. 3I). The results are transferred to the PNN (Fig. 3J) which produces the arrhythmia classification results.
3 Experimental test procedure
The availability of arrhythmia databases has contributed to development of ECG signal processing algorithms. In particular the MIT /BIH database [24] has proved and invaluable tool [25] for testing arrhythmia classification methodologies. The method presented in section 2, was coded in MATLAB and tested using seventeen 30-minute ECG lead II (D II) data registers from the PhysioNet repository: 100, 101, 103, 105, 106, 118, 119, 201, 202, 203, 205, 207, 209, 210, 213, 215 y 219. The algorithm op-erates over 6-second d ata blocks. The wavelet co efficients were s elected t o fit four scale bandwidths (Table 1). Table 2 describes the parameters used for feature extrac-tion.
Table 1. Bandwidth correspondence to scale levels used
Scale Bandwidth 2¹ 31 to 94 Hz. 2² 16 to 39 Hz. 2³ 8 to 26 Hz. 24 4 to 12Hz.
Table 2. Parameters for feature extraction
Parameter 1st beat ........ Nth beat Number of P waves 0,1,2.... ........ 0,1,2....
P wave polarity -1 negative, 1 positive 0 more than 1 P wave ....... -1 negative, 1 positive
0 more than 1 P wave
QRS duration Time (s) ........ Time (s) PR interval Time (s) ........ Time (s)
Position of R Referenced to the beginning of the segment ........ Referenced to the beginning of the
segment
RR interval Time (s) ......... Time (s) HR Beats / minute .......... --
Global rhythm 0 abnormal, 1 normal .......... ---
Classes are assigned per type of heartbeat condition: auricular fibrillation (AF)=1,
normal s inus r hythm ( N) = 2 , p remature at rial co ntraction ( PAC)=3, l eft b undle branch block (LBBB)=4, right bundle branch block (RBBB)=5, premature ventricular
Proceedings IWBBIO 2014. Granada 7-9 April, 2014 1749
contraction (PVC)=6, sinoauricular heart block (SHB)=7 and paroxysmal atrial fibril-lation (PAF)=8.
4 Results
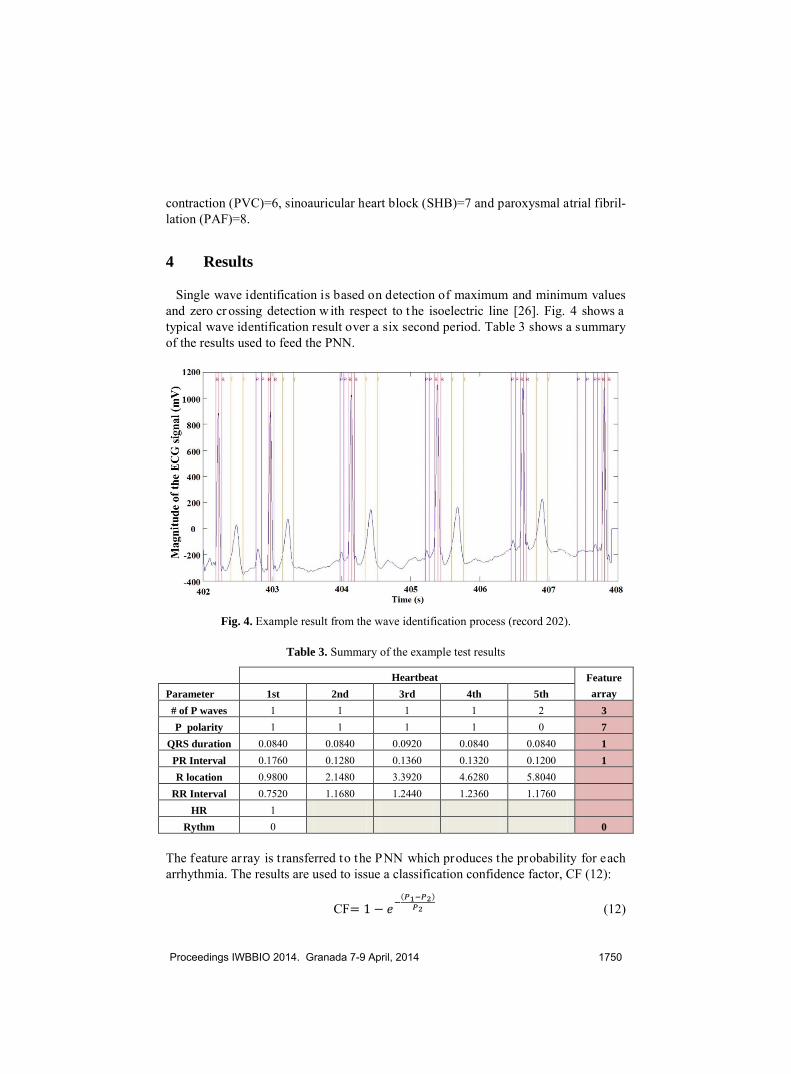
Single wave identification is based on detection of maximum and minimum values and zero cr ossing detection w ith respect to t he isoelectric line [26]. Fig. 4 shows a typical wave identification result over a six second period. Table 3 shows a summary of the results used to feed the PNN.
Fig. 4. Example result from the wave identification process (record 202).
Table 3. Summary of the example test results
Heartbeat Feature
array Parameter 1st 2nd 3rd 4th 5th
# of P waves 1 1 1 1 2 3
P polarity 1 1 1 1 0 7
QRS duration 0.0840 0.0840 0.0920 0.0840 0.0840 1
PR Interval 0.1760 0.1280 0.1360 0.1320 0.1200 1
R location 0.9800 2.1480 3.3920 4.6280 5.8040
RR Interval 0.7520 1.1680 1.2440 1.2360 1.1760
HR 1
Rythm 0 0
The feature array is t ransferred to the PNN which produces the probability for each arrhythmia. The results are used to issue a classification confidence factor, CF (12):
CF= 1 − 𝑒−(𝑃1−𝑃2)
𝑃2 (12)
Proceedings IWBBIO 2014. Granada 7-9 April, 2014 1750
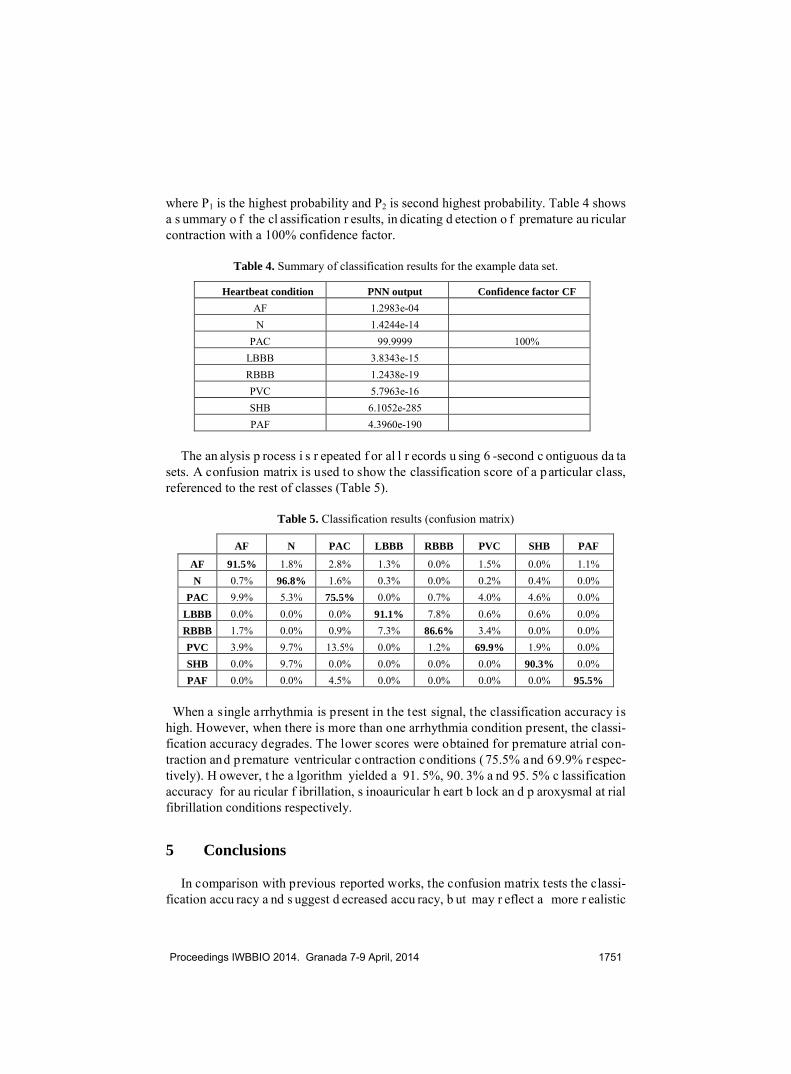
where P1 is the highest probability and P2 is second highest probability. Table 4 shows a s ummary o f the cl assification r esults, in dicating d etection o f premature au ricular contraction with a 100% confidence factor.
Table 4. Summary of classification results for the example data set.
Heartbeat condition PNN output Confidence factor CF
AF 1.2983e-04 N 1.4244e-14
PAC 99.9999 100% LBBB 3.8343e-15 RBBB 1.2438e-19 PVC 5.7963e-16 SHB 6.1052e-285 PAF 4.3960e-190
The an alysis p rocess i s r epeated f or al l r ecords u sing 6 -second c ontiguous da ta
sets. A confusion matrix is used to show the classification score of a p articular class, referenced to the rest of classes (Table 5).
Table 5. Classification results (confusion matrix)
AF N PAC LBBB RBBB PVC SHB PAF
AF 91.5% 1.8% 2.8% 1.3% 0.0% 1.5% 0.0% 1.1% N 0.7% 96.8% 1.6% 0.3% 0.0% 0.2% 0.4% 0.0%
PAC 9.9% 5.3% 75.5% 0.0% 0.7% 4.0% 4.6% 0.0% LBBB 0.0% 0.0% 0.0% 91.1% 7.8% 0.6% 0.6% 0.0% RBBB 1.7% 0.0% 0.9% 7.3% 86.6% 3.4% 0.0% 0.0% PVC 3.9% 9.7% 13.5% 0.0% 1.2% 69.9% 1.9% 0.0% SHB 0.0% 9.7% 0.0% 0.0% 0.0% 0.0% 90.3% 0.0% PAF 0.0% 0.0% 4.5% 0.0% 0.0% 0.0% 0.0% 95.5%
When a single arrhythmia is present in the test signal, the classification accuracy is high. However, when there is more than one arrhythmia condition present, the classi-fication accuracy degrades. The lower scores were obtained for premature atrial con-traction and p remature ventricular contraction conditions (75.5% and 69.9% respec-tively). H owever, t he a lgorithm yielded a 91. 5%, 90. 3% a nd 95. 5% c lassification accuracy for au ricular f ibrillation, s inoauricular h eart b lock an d p aroxysmal at rial fibrillation conditions respectively.
5 Conclusions
In comparison with previous reported works, the confusion matrix tests the classi-fication accu racy a nd s uggest d ecreased accu racy, b ut may r eflect a more r ealistic
Proceedings IWBBIO 2014. Granada 7-9 April, 2014 1751
result. When two or more arrhythmia conditions are present in the test signal the accu-racy d ecreases co nsiderably. For in stance, PVC r esulted difficult to d etect d ue to a small RR interval; the effect is also related to AF. A factor that may have influenced the low d etection scores, i s t he reduced number of d ata set u sed for training. Thus there is room for improvement by increasing the number of training data sets. The six-second ECG data length was selected bearing in mind a lgorithm implementation on dedicated DSP hardware; i t i s necessary to i nvestigate t he e ffectiveness a nd robust-ness of the algorithm for different amounts of data. The inherent nature of the digital signal processing operations involved suggest that the method is suitable for implanta-tion on a portable ECG data acquisition devices. Coding the algorithm in MATLAB allows rapid functional verification. However, it is necessary to develop the appropri-ate code, optimized for specific DSP hardware. Nevertheless, i t was shown that t he procedure presented h ere can p erform E CG cl assification on s ignals where t here i s more than a single arrhythmia condition.
6 Acknowledgments
The authors acknowledge the financial support from Secretaria de Educación Pú-blica through Direccion General de Educación Superior Tecnologica (SEP-DGEST) to carry out this work.
7 References
1. Goldberger, J . J ., Buxton, A. E ., Cain, M., Constantini, O ., Exner, D . V., Knight, B . P., Lloyd-Jones, D ., K adish, A . H ., L ee, B ., M oss, A ., M yerburg, R ., Passman, R ., R osen-baum, D ., Stevenson, W ., Zareba, W ., Zi pes, D . P.: R isk S tratification f or A rrhythmic Sudden Cardiac Death: Identifying the Roadblocks. Circulation, vol. 123, n. 21, pp. 2423-2430 (2011).
2. Suh, W. M., Wong, C., Krishnan, S. C.: Importance of Electrocardiography in the Assess-ment and Management of Heart Failure: a case report. J Electrocardiol, vol. 41, n . 1, pp. 44-48 (2008).
3. Drew, B . J .: Pitfalls and a rtifacts in e lectrocardiography. Cardiol C lin, vol. 24, n . 3 , pp. 309-315, vii (2006).
4. Campbell R . W. F.: International H andbook of Arrhythmia. N ew Y ork: M arcel D ekker, Inc. (1997).
5. Köhler, B. -U., H ennig,C., O rglmeister, R .: T he p rinciples o f s oftware Q RS d etection. IEEE Eng Med Biol, vol. 21, pp. 42–57, (2002).
6. Martínez, J. P., Almeida, R., Olmos, S., Rocha, A. P., Laguna, P.: A wavelet-Based ECG Delineator: Evaluation on Standard Databases. IEEE Trans on Biomed Eng, vol. 51, n. 4, pp. 570-581 (2004).
7. Mallat, S., Hwang, W. L.: Singularity Detection and Processing with Wavelets. IEEE T In-form Theory, Vol. 38, pp. 617-643 (1993).
8. Gutierrez, A., Lara, M., Hernandez, P.: A QRS Detector Based on Haar Wavelet, Evalua-tion with MIT–BIH Arrhythmia and European ST–T Databases. Comp y S ist vol.8, n.4. (2005).
Proceedings IWBBIO 2014. Granada 7-9 April, 2014 1752
9. Guo, X ., C hen, M., C hen, M ., Peng, C .: Q RS co mplex d etection b ased o n m exican-hat wavelet. Computer Engineering and Applications Year 2010, Issue 9, pp. 177-179 (2010).
10. Vassilikos, V. P., Mantziari, L., Dakos, G., Kamperidis, V., Chouvarda, I., Chatzizisis, Y. S., Kalpidis, P., Theofilogiannakos, E., Paraskevaidis, S., Karvounis H., Mochlas, S., Mag-laveras, N., Styliadis, I. H.: QRS analysis using wavelet transformation for the prediction of response to cardiac resynchronization therapy: A prospective pilot study. J Electrocardi-ol, vol. 47, n. 1, pp. 59-65 (2014).
11. Zeng, C., Lin, H., Jiana, Q., Xu, M.: QRS Complex Detection Using Combination of Mex-ican-hat W avelet a nd C omplex Morlet W avelet. J ournal of C omputers, N orth A merica, Vol 8, No 11, pp. 2951-2958 (2013).
12. Alvarado, C., Arregui, J., Ramos, J., Pallas-Areny, R.: Automatic Detection of ECG Ven-tricular Activity Waves Using Continuous Spline Wavelet Transform. In: 2nd International Conference o n E lectrical an d E lectronics E ngineering ( ICEEE) and XI C onference o n Electrical E ngineering ( CIE 205). M exico C ity, M exico, S eptember 7 -8, pp . 18 9-192 (2005).
13. Ieong, C.-I., Mak, P.-I., Lam, C.-P., Dong, C.: A 0.83- μW QRS Detection Processor Us-ing Q uadratic S pline W avelet T ransform f or Wireless EC G Acquisition i n 0 .35-μm CMOS. IEEE Transactions on Biomedical C ircuits a nd S ystems, vol.6, n .6, pp.586-595, (2012).
14. Alexakis, C., Nyongesa, H. O., Saatchi, R., Harris, N. D., Davies, C., emery, C., Ireland, R. H., Heller, S. R.: Feature extraction and classification of electrocardiogram (ECG) sig-nals related to hypoglycaemia. Comput Cardiol, vol. 30, pp. 537 – 540 (2003).
15. Kumari, V . S. R ., Kumar, P . R .: C ardiac Arrhythmia P rediction Using I mproved M ulti-layer Perceptron Neural Network. International Journal of Electronics, Communication & Instrumentation Engineering Research and Development (IJECIERD), vol. 4, n. 4, pp. 73- 80 (2013).
16. Al-Fahoum, A. S ., H owitt, I .: C ombined w avelet t ransformation a nd r adial basis ne ural networks for c lassifying l ife t hreatening c ardiac a rrhythmias. M ed B iol Eng C omp, vol. 37, pp. 566—73 (1999).
17. Homaeinezhad, M . R ., T avakkoli, E ., G haffari, A .: D iscrete W avelet-based F uzzy N et-work Architecture for ECG Rhythm-Type Recognition: Feature Extraction and Clustering-Oriented Tuning of F uzzy I nference S ystem. I nternational J ournal of S ignal P rocessing, Image Processing and Pattern Recognition, vol. 4, n. 3 (2011).
18. Tsipouras, M. G., Fotiadis, D. I., Sideris, D.: An arrhythmia classification system based on the RR-interval signal. Artif Intell Med, vol. 33, pp. 237—250 (2005).
19. Melgani, F ., B azi, Y .: C lassification o f Ele ctrocardiogram S ignals w ith S upport V ector Machines and Particle Swarm Optimization. IEEE T Inf Technol B, vol. 12, n. 5, pp. 667-677 (2008).
20. Kaneko, M., Gotho, T., Iseri, F., Takeshita, K., Ohki, H., Sueda, N.: QRS Complex Analy-sis Using Wavelet Transform an d Two L ayered S elf-Organizing Map. In: Computing in Cardiology, vol. 38, pp. 813-816 (2011).
21. Ebrahimnezhad H., Khoshnoud, S.: Classification of Arrhythmias Using Linear Predictive Coefficients and Probabilistic Neural Network. Applied Medical Informatics, Vol. 33, No. 3, pp. 55 – 62 (2013).
22. Yu, S . N., Chen, Y. H.: Electrocardiogram beat cl assification based on wavelet t ransfor-mation a nd pr obabilistic ne ural network. P attern R ecogn L ett, v ol. 2 8, p p. 1 142–1150 (2007).
23. Lin, C. H., Du, Y. C., Chen, T.: Adaptive wavelet network for multiple cardiac arrhythmi-as recognition. Expert Syst Appl, vol. 34, pp. 2601-2611 (2008).
Proceedings IWBBIO 2014. Granada 7-9 April, 2014 1753
24. Moody G. B., Mark, R. G.: The Impact of the MIT BIH Arrhythmia Database. IEEE Eng Med Biol, vol. 20, n. 3, pp. 45-50, (2001).
25. Goldberger, A . L, Amaral L. A. N., Glass, L, Hausdorff, J. M. Ivanov, P.Ch., Mark, R. G., Mietus, J. E., Moody, G. B., Peng, C.-K., Stanley, H. E.: PhysioBank, PhysioToolkit, and PhysioNet: Components of a New Research Resource for Complex Physiologic Sig-nals. Circulation, vol. 101, n. 23, e215-e220 (2000).
26. Sandoval-Monroy, A. I.: Clasificador de Arritmias Cardiacas usando Red Neuronal Proba-bilística y Transformada Wavelet. MSc. Thesis. Instituto Tecnologico de Morelia, Morelia, Michoacan, Mexico, (2005).
Proceedings IWBBIO 2014. Granada 7-9 April, 2014 1754


![Journal of Arrhythmia - COnnecting REpositories · of arrhythmia diagnosis [1], and implantable loop recorders are especially suitable for identifying undetected sources of a suspected](https://img.pdfslide.tips/doc/110x75/607210056cc22557db7f5efd/journal-of-arrhythmia-connecting-repositories-of-arrhythmia-diagnosis-1-and.jpg)