Embed Size (px)
Citation preview

標準理論の成功 (量子色力学)
強い相互作用解明の歴史:核力を記述する場の量子論 (1935年、湯川)
予言された湯川中間子(π±)が発見(1947年、C.F. Powell)される。ハドロンの新発見が続く:K+ (1949)、π0 (1950)、Λ (1951)、∆ (1952)粒子の爆発的発見 (1953~、Particle Zoo) ⇒ 湯川理論の背後の物理(量子数、複合粒子描像、対称性)の探索:中野・西島・Gell-Mann、坂田模型、クォーク模型、U(3)対称性
棚橋 誠治 (名大) 素粒子標準理論の現状と残された課題 2014 年 6 月 24 日 7 / 35
標準理論の成功 (量子色力学)
量子色力学 (QCD)の登場 (1972)
* くりこみ可能な SU(3)ゲージ理論であり予言能力が高い* 色荷をもつフェルミオン (クォーク)
* 色荷に結合するゲージ場 (グルーオン)
* さまざまなハドロンは複数のクォークの束縛状態
QCDは、その漸近自由性のため、高エネルギーでは摂動計算ができるが、実験と比較するための理論計算を行うには、クォーク閉じ込めやカイラル対称性の力学的破れなどの低エネルギーでの非摂動論的効果が重要になる。理論的進展:* パートン理論やQCD和則などの開発 (非摂動論的効果を摂動論的計算から分離)
* 格子ゲージ理論の発明 (QCDの非摂動論的効果が直接計算可能に)
棚橋 誠治 (名大) 素粒子標準理論の現状と残された課題 2014 年 6 月 24 日 8 / 35
標準理論の成功 (量子色力学)
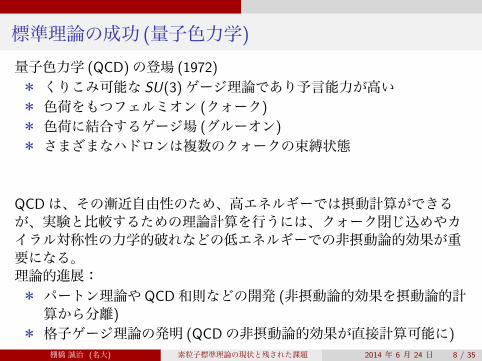
さまざまな方法で求められたQCD結合定数 αs(Mz)が高い精度で一致
30 9. Quantum chromodynamics
Preliminary determinations of αs from CMS data on the ratio of inclusive 3-jet to2-jet cross sections [259], at NLO, and from the top-quark cross section [301], inNNLO, quote values of αs(M2
Z) = 0.1148± 0.0014(exp.)± 0.0018(PDF)+0.0050−0.0000(scale) and
αs(M2Z) = 0.1151+0.0033
−0.0032, respectively, indicating many new results to be expected forinclusion in upcoming reviews.
9.3.11. Electroweak precision fits :The N3LO calculation of the hadronic Z decay width was used in a revision of the globalfit to electroweak precision data [349], resulting in αs(M2
Z) = 0.1193± 0.0028, claiming anegligible theoretical uncertainty. For this Review the value obtained in Sec. Electroweakmodel and constraints on new physics from data at the Z-pole, αs(M2
Z) = 0.1197± 0.0028will be used instead, as it is based on a more constrained data set where QCD correctionsdirectly enter through the hadronic decay width of the Z. We note that all theseresults from electroweak precision data, however, strongly depend on the strict validityof Standard Model predictions and the existence of the minimal Higgs mechanism toimplement electroweak symmetry breaking. Any - even small - deviation of nature fromthis model could strongly influence this extraction of αs.
0.11 0.12 0.13αα ((ΜΜ ))s ΖΖ
LatticeDIS e+e- annihilation
τ-decays
Z pole fits
Figure 9.3: Summary of values of αs(M2Z) obtained for various sub-classes
of measurements (see Fig. 9.2 (a) to (d)). The new world average value ofαs(M2
Z) = 0.1185 ± 0.0006 is indicated by the dashed line and the shaded band.
9.3.12. Determination of the world average value of αs(M2Z) :
Obtaining a world average value for αs(M2Z) is a non-trivial exercise. A certain
arbitrariness and subjective component is inevitable because of the choice of measurementsto be included in the average, the treatment of (non-Gaussian) systematic uncertaintiesof mostly theoretical nature, as well as the treatment of correlations among the variousinputs, of theoretical as well as experimental origin.
We have chosen to determine pre-averages for classes of measurements which areconsidered to exhibit a maximum of independence between each other, consideringexperimental as well as theoretical issues. These pre-averages are then combined to thefinal world average value of αs(M2
Z), using the χ2 averaging method and error treatmentas described above. The five pre-averages are summarized in Fig. 9.3; we recall that these
December 18, 2013 12:00
有効結合定数のエネルギースケール依存性が、QCDの予言と一致9. Quantum chromodynamics 33
QCD αs(Mz) = 0.1185 ± 0.0006
Z pole fit
0.1
0.2
0.3
αs (Q)
1 10 100Q [GeV]
Heavy Quarkonia (NLO)
e+e– jets & shapes (res. NNLO)
DIS jets (NLO)
Sept. 2013
Lattice QCD (NNLO)
(N3LO)
τ decays (N3LO)
1000
pp –> jets (NLO)(–)
Figure 9.4: Summary of measurements of αs as a function of the energy scale Q.The respective degree of QCD perturbation theory used in the extraction of αs isindicated in brackets (NLO: next-to-leading order; NNLO: next-to-next-to leadingorder; res. NNLO: NNLO matched with resummed next-to-leading logs; N3LO:next-to-NNLO).
9.4. Acknowledgments
We are grateful to J.-F. Arguin, G. Altarelli, J. Butterworth, M. Cacciari, L. delDebbio, D. d’Enterria, P. Gambino, C. Glasman Kuguel, N. Glover, M. Grazzini, A.Kronfeld, K. Kousouris, M. Luscher, M. d’Onofrio, S. Sharpe, G. Sterman, D. Treille,N. Varelas, M. Wobisch, W.M. Yao, C.P. Yuan, and G. Zanderighi for discussions,suggestions and comments on this and earlier versions of this review.
References:1. R.K. Ellis, W.J. Stirling, and B.R. Webber, “QCD and collider physics,” Camb.
Monogr. Part. Phys. Nucl. Phys. Cosmol. 81 (1996).2. C. A. Baker et al., Phys. Rev. Lett. 97, 131801 (2006).3. H. -Y. Cheng, Phys. Reports 158, 1 (1988).4. G. Dissertori, I.G. Knowles, and M. Schmelling, “High energy experiments and
theory,” Oxford, UK: Clarendon (2003).5. R. Brock et al., [CTEQ Collab.], Rev. Mod. Phys. 67, 157 (1995), see also
http://www.phys.psu.edu/~cteq/handbook/v1.1/handbook.pdf.6. A. S. Kronfeld and C. Quigg, Am. J. Phys. 78, 1081 (2010).7. R. Stock (Ed.), Relativistic Heavy Ion Physics, Springer-Verlag Berlin, Heidelberg,
2010.8. Proceedings of the XXIII International Conference on Ultrarelativistic Nucleus–
Nucleus Collisions, Quark Matter 2012, Nucl. Phys. A, volumes 904–905.9. Special Issue: Physics of Hot and Dense QCD in High-Energy Nuclear
Collisions, Ed. C. Salgado. Int. J. Mod. Phys. A, volume 28, number 11.[http://www.worldscientific.com/toc/ijmpa/28/11].
December 18, 2013 12:00
Review of Particle Physics
棚橋 誠治 (名大) 素粒子標準理論の現状と残された課題 2014 年 6 月 24 日 9 / 35
標準理論の成功 (量子色力学)
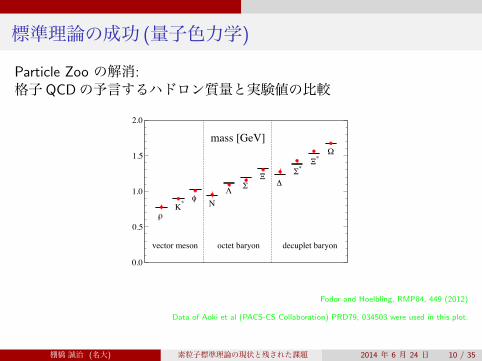
Particle Zoo の解消:格子QCDの予言するハドロン質量と実験値の比較
44
FIG. 19 Comparison of the Nf = 2+1 light hadron spectrumresults from the MILC collaboration (Bazavov et al., 2010a)with experiment. Diamonds are input quantities while cir-cles are predictions. Experimental masses of hadrons from(Amsler et al., 2008) are indicated by squares. Note that theplot also includes charmonium and bottomonium masses withsome of the later ones used to set the scale. Plot reproducedwith friendly permission of the MILC collaboration.
were directly simulated and a reweighting to the phys-ical point was carried out with the lightest ensemble.In the extrapolated ensemble finite size e↵ects on thepseudoscalar masses were corrected using SU(2) �PT atNLO. The tiny chiral extrapolation was performed lin-early in the light quark mass and M⌦ was used to setthe scale. More involved chiral forms were subsequentlyinvestigated in (Ishikawa et al., 2009). Similarly in thereweighted ensemble the masses of the ⇡, K and ⌦ wereused to tune to the physical point. The final result fromthe extrapolation method is plotted in fig. 20. Very simi-lar results have been found with the reweighting methodas detailed in (Aoki et al., 2010).
Full control over all systematic uncertainties at the fewpercent level was achieved in the light hadron spectrumcalculation of the Budapest-Marseille-Wuppertal collabo-ration (Durr et al., 2008). They used tree level improved6-step stout smeared Nf = 2 + 1 clover fermions on atree level Symanzik improved gauge action on lattices ofspatial extent of L ⇠ 2.0 � 4.1 fm. Both the gauge andthe fermion action are known to be in the correct uni-versality classes and the updating algorithm is exact andfree of possible ergodicity problems. Pion masses downto 190 MeV and three lattice spacings a ⇠ 0.065 fm,a ⇠ 0.85 fm and a ⇠ 0.125 fm were used which allowedfor a fully controlled extrapolation to the continuum andthe physical point with various ansatze for both. Possi-
0.0
0.5
1.0
1.5
2.0
lK*
qN
RY
U6
Y�
U�
1
vector meson octet baryon decuplet baryon
mass [GeV]
FIG. 20 The extrapolated Nf = 2+ 1 light hadron spectrumresults from the PACS-CS collaboration. Experimental dataare from (Amsler et al., 2008). The plot is reproduced from(Aoki et al., 2009a) with friendly permission of the PACS-CScollaboration.
0.1 0.2 0.3 0.4 0.5M�
2 [GeV2]
0
0.5
1
1.5
2
M [G
eV]
a~~0.085 fma~~0.065 fm
a~~0.125 fm
physical M�
N
1
FIG. 21 Sample chiral and continuum extrapolation of thelattice hadron masses of (Durr et al., 2008) at physical M2
K �M2
⇡/2 in physical units. The scale setting variable M⌦ andthe nucleon mass are plotted vs. the square of the pion masstogether with a fit of the data at every lattice spacing. Thevertical dashed line represents the physical pion mass.
ble contamination of the propagators from excited stateswere accounted for by varying the fit range. Finite vol-ume corrections were applied including energy shifts forresonant states (as described in sect. IV.C.2) that allowedfor a detailed treatment of resonant states, too. The con-tinuum extrapolation was performed with a term linearin a or a2 and chiral fits were done with both Taylorand NLO heavy baryon �PT with a free coe�cient (seefig. 21 for an example extrapolation to the physical pointand continuum limit). The above procedure allowed for afully controlled calculation of the systematic uncertaintyvia the spread of the results of all analyses weighted by
Fodor and Hoelbling, RMP84, 449 (2012)
Data of Aoki et al (PACS-CS Collaboration) PRD79, 034503 were used in this plot.
棚橋 誠治 (名大) 素粒子標準理論の現状と残された課題 2014 年 6 月 24 日 10 / 35
標準理論の成功 (電弱相互作用)
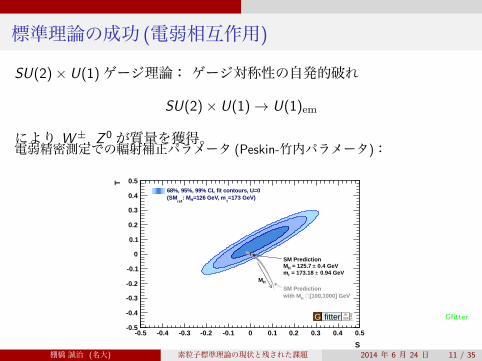
SU(2)× U(1)ゲージ理論: ゲージ対称性の自発的破れ
SU(2)× U(1) → U(1)em
により W±, Z 0が質量を獲得。電弱精密測定での輻射補正パラメータ (Peskin-竹内パラメータ):
S
-0.5 -0.4 -0.3 -0.2 -0.1 0 0.1 0.2 0.3 0.4 0.5
T
-0.5
-0.4
-0.3
-0.2
-0.1
0
0.1
0.2
0.3
0.4
0.568%, 95%, 99% CL fit contours, U=0
=173 GeV)t
=126 GeV, mH: Mref
(SM
SM Prediction 0.4 GeV± = 125.7 HM 0.94 GeV± = 173.18 tm
SM Prediction [100,1000] GeV∈ Hwith M
HM
G fitter SMB
Sep 12 Gfitter
棚橋 誠治 (名大) 素粒子標準理論の現状と残された課題 2014 年 6 月 24 日 11 / 35
標準理論の成功 (電弱相互作用)
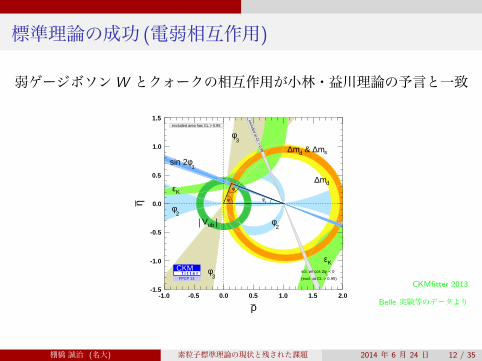
弱ゲージボソンW とクォークの相互作用が小林・益川理論の予言と一致
ユニタリティー三角形
3φ
3φ
2φ
2φ
dm∆Kε
Kε
sm∆ & dm∆
ubV
1φsin 2
(excl. at CL > 0.95)
< 01
φsol. w/ cos 2
excluded at CL > 0.95
2φ
1φ
3φ
ρ-1.0 -0.5 0.0 0.5 1.0 1.5 2.0
η
-1.5
-1.0
-0.5
0.0
0.5
1.0
1.5excluded area has CL > 0.95
FPCP 13
CKMf i t t e r
CKMfitter 2013
Belle 実験等のデータより
棚橋 誠治 (名大) 素粒子標準理論の現状と残された課題 2014 年 6 月 24 日 12 / 35
標準理論の成功 (電弱相互作用)
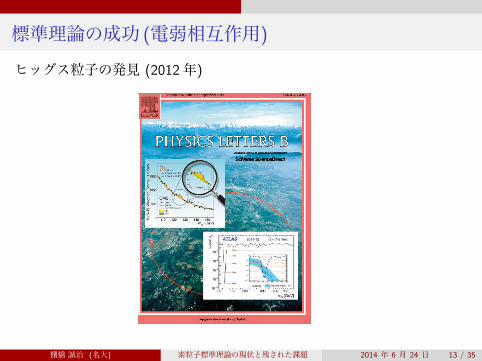
ヒッグス粒子の発見 (2012年)
棚橋 誠治 (名大) 素粒子標準理論の現状と残された課題 2014 年 6 月 24 日 13 / 35
標準理論の成功 (電弱相互作用)
strengths of the five channels and the SM expectation of one is about 8%. The compatibility betweenthe combined best-fit signal strength µ and the best-fit signal strengths of the five channels is 13%. Thedependence of the combined value of µ on the assumed mH has been investigated and is relatively weak:changing the mass hypothesis between 124.5 and 126.5 GeV changes the value of µ by about 4%.
Table 2: Summary of the best-fit values and uncertainties for the signal strength µ for the individualchannels and their combination at a Higgs boson mass of 125.5 GeV.
Higgs Boson Decay µ(mH=125.5 GeV)
VH → Vbb −0.4 ± 1.0H → ττ 0.8 ± 0.7
H → WW (∗) 1.0 ± 0.3H → γγ 1.6 ± 0.3
H → ZZ(∗) 1.5 ± 0.4Combined 1.30 ± 0.20
)µSignal strength ( -1 0 +1
Combined
4l→ (*) ZZ→H
γγ →H
νlν l→ (*) WW→H
ττ →H
bb→W,Z H
-1Ldt = 4.6 - 4.8 fb∫ = 7 TeV: s-1Ldt = 13 - 20.7 fb∫ = 8 TeV: s
-1Ldt = 4.6 fb∫ = 7 TeV: s-1Ldt = 20.7 fb∫ = 8 TeV: s
-1Ldt = 4.8 fb∫ = 7 TeV: s-1Ldt = 20.7 fb∫ = 8 TeV: s
-1Ldt = 4.6 fb∫ = 7 TeV: s-1Ldt = 20.7 fb∫ = 8 TeV: s
-1Ldt = 4.6 fb∫ = 7 TeV: s-1Ldt = 13 fb∫ = 8 TeV: s
-1Ldt = 4.7 fb∫ = 7 TeV: s-1Ldt = 13 fb∫ = 8 TeV: s
= 125.5 GeVHm
0.20± = 1.30 µ
ATLAS Preliminary
Figure 1: Measurements of the signal strength parameter µ for mH =125.5 GeV for the individual chan-nels and their combination.
In the SM, the production cross sections are completely fixed once mH is specified. The best-fit valuefor the global signal strength factor µ does not give any direct information on the relative contributionsfrom different production modes. Furthermore, fixing the ratios of the production cross sections to theratios predicted by the SM may conceal tension between the data and the SM. Therefore, in addition tothe signal strength in different decay modes, the signal strengths of different Higgs production processescontributing to the same final state are determined. Such a separation avoids model assumptions needed
5
Vκ
0.7 0.8 0.9 1 1.1 1.2 1.3
Fκ
-1
0
1
2
3SMBest fit68% CL95% CL
-1Ldt = 13-20.7 fb∫ = 8 TeV, s
-1Ldt = 4.6-4.8 fb∫ = 7 TeV, sATLAS Preliminary
(a) (b)
Vκ
0.7 0.8 0.9 1 1.1 1.2 1.3 1.4
) Vκ(
Λ-2
ln
0123456789
10]Fκ,Vκ[
ObservedSM expected-1Ldt = 13-20.7 fb∫ = 8 TeV, s
-1Ldt = 4.6-4.8 fb∫ = 7 TeV, sATLAS Preliminary
(c)
Fκ
-1.5 -1 -0.5 0 0.5 1 1.5
) Fκ(
Λ-2
ln
0123456789
10]Fκ,Vκ[
ObservedSM expected-1Ldt = 13-20.7 fb∫ = 8 TeV, s
-1Ldt = 4.6-4.8 fb∫ = 7 TeV, sATLAS Preliminary
(d)
Figure 5: Fits for 2-parameter benchmark models described in Equations (10-13) probing different cou-pling strength scale factors for fermions and vector bosons, assuming only SM contributions to the totalwidth: (a) Correlation of the coupling scale factors κF and κV ; (b) the same correlation, overlaying the68% CL contours derived from the individual channels and their combination; (c) coupling scale factorκV (κF is profiled); (d) coupling scale factor κF (κV is profiled). The dashed curves in (c) and (d) showthe SM expectation. The thin dotted lines in (c) indicate the continuation of the likelihood curve whenrestricting the parameters to either the positive or negative sector of κF .
As can be seen in Fig. 5(a) the fit prefers the SM minimum with a positive relative sign, but the localminimum with negative relative sign is also compatible at the ∼ 1σ level. The likelihood as a function ofκV when κF is profiled and as a function of κF when κV is profiled is presented in Fig. 5(c) and Fig. 5(d)respectively. Figure 5(d) shows in particular to what extent the sign degeneracy is resolved. Figure 5(b)illustrates how the H→ γγ, H → ZZ(∗), H → WW (∗), H → ττ and H → bb channels contribute to thecombined measurement.
The 68% CL intervals of κF and κV when profiling over the other parameter are:
κF ∈ [−0.88,−0.75] ∪ [0.73, 1.07] (14)κV ∈ [0.91, 0.97] ∪ [1.05, 1.21] . (15)
These intervals combine all experimental and theoretical systematic uncertainties. The two-dimensionalcompatibility of the SM hypothesis with the best fit point is 8%.
11
ATLAS-CONF-2013-034
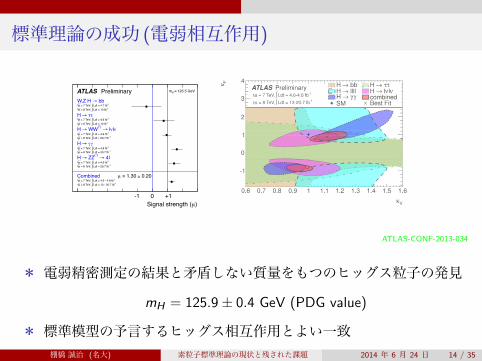
* 電弱精密測定の結果と矛盾しない質量をもつのヒッグス粒子の発見
mH = 125.9± 0.4 GeV (PDG value)
* 標準模型の予言するヒッグス相互作用とよい一致棚橋 誠治 (名大) 素粒子標準理論の現状と残された課題 2014 年 6 月 24 日 14 / 35
標準理論の成功 (MH ≃ 126 GeV のインパクト)
102 104 106 108 1010 1012 1014 1016 1018 1020-0.05
0.00
0.05
0.10
0.15
RGE scale m or h vev in GeV
HiggsquarticcouplinglHmL
Mh = 126.5 GeV HdashedLMh = 124.5 GeV HdottedL
Mt = 173.1 GeVasHMZL = 0.1184
leff = 4Vêh4
l in MS
bl
102 104 106 108 1010 1012 1014 1016 1018 1020-0.05
0.00
0.05
0.10
0.15
RGE scale m or h vev in GeV
HiggsquarticcouplinglHmL
Mh = 126.5 GeV HdashedLMh = 124.5 GeV HdottedL
Mt = 171.0 GeVasHMZL = 0.1184
leff = 4Vêh4
l in MS
bl
Figure 3: Evolution of the Higgs coupling �(µ) and its beta function, eq. (50), as a function of therenormalization scale, compared to the evolution of the e↵ective coupling �e↵(h), defined in eq. (51),as a function of the field value. Left: curves plotted for the best-fit value of Mt. Right: curvesplotted for the lower value of Mt that corresponds to �(MPl) = 0.
The factor
�(h) ⌘Z h
Mt
�(µ) d lnµ , (54)
where � ⌘ d lnh/d lnµ is the Higgs field anomalous dimension, takes into account the wave-
function renormalization. We have also defined rp ⌘ ln[pe2�(h)].
The di↵erence �e↵(h) � �(h) is positive, as illustrated in fig. 3. As a result [9], at a
given field value the potential is more stable than what guessed from the naive expectation
based on the RG-improved tree-level potential in eq. (49), with µ = h. We finally notice
that the di↵erence �e↵(h) � �(h) gets suppressed at large field values, especially when �
reaches its minimum close to the Planck scale. This is expected according to the following
two observations: 1) the di↵erence between �e↵ and � can be reabsorbed by a shift in the
scales at which the two couplings are evaluated, up to finite two-loop corrections; 2) this
shift has a small impact at large field values given the corresponding vanishing of �� (see
fig. 3).
14
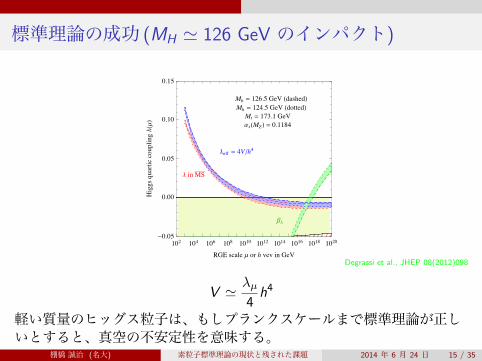
Degrassi et al., JHEP 08(2012)098
V ≃ λµ4h4
軽い質量のヒッグス粒子は、もしプランクスケールまで標準理論が正しいとすると、真空の不安定性を意味する。
棚橋 誠治 (名大) 素粒子標準理論の現状と残された課題 2014 年 6 月 24 日 15 / 35
標準理論の成功 (MH ≃ 126 GeV のインパクト)
0 50 100 150 2000
50
100
150
200
Higgs mass Mh in GeV
TopmassM
tinGeV
Instability
Non-perturbativity
Stability
Meta-st
ability
Instability
107
109
1010
1012
115 120 125 130 135165
170
175
180
Higgs mass Mh in GeV
PoletopmassM
tinGeV
1,2,3 s
Instability
Stability
Meta-stability
Figure 5: Regions of absolute stability, meta-stability and instability of the SM vacuum in the Mt–Mh plane (upper left) and in the �–yt plane, in terms of parameter renormalized at the Planckscale (upper right). Bottom: Zoom in the region of the preferred experimental range of Mh andMt (the gray areas denote the allowed region at 1, 2, and 3�). The three boundary lines correspondto ↵s(MZ) = 0.1184 ± 0.0007, and the grading of the colors indicates the size of the theoreticalerror. The dotted contour-lines show the instability scale ⇤ in GeV assuming ↵s(MZ) = 0.1184.
determined at hadron colliders su↵ers from O(⇤QCD) non-perturbative uncertainties [41]. A
possibility to overcome this problem and, at the same time, to improve the experimental
error on Mt, would be a direct determination of the MS top-quark running mass from ex-
periments, for instance from the tt cross-section at a future e+e� collider operating above
the tt threshold. In this respect, such a collider could become crucial for establishing the
structure of the vacuum and the ultimate fate of our universe.
As far as the RG equations are concerned, the error of ±0.2 GeV is a conservative
estimate, based on the parametric size of the missing terms. The smallness of this error,
compared to the uncertainty due to threshold corrections, can be understood by the smallness
of all the couplings at high scales: four-loop terms in the RG equations do not compete with
finite tree-loop corrections close to the electroweak scale, where the strong and the top-quark
Yukawa coupling are large.
The LHC will be able to measure the Higgs mass with an accuracy of about 100–200
MeV, which is far better than the theoretical error with which we are able to determine the
condition of absolute stability.
18
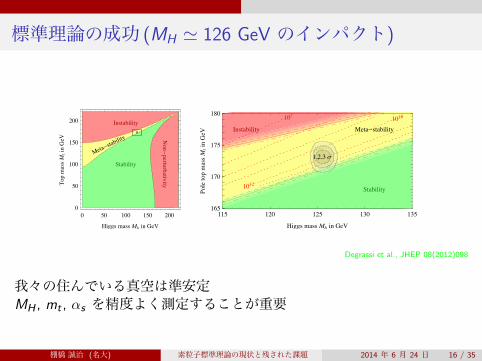
Degrassi et al., JHEP 08(2012)098
我々の住んでいる真空は準安定MH , mt , αs を精度よく測定することが重要
棚橋 誠治 (名大) 素粒子標準理論の現状と残された課題 2014 年 6 月 24 日 16 / 35
標準理論の成功 (まとめ)
* 標準理論のパラダイム (くりこみ可能なゲージ理論)は、さまざまな実験事実を定量的に説明することに成功している。
* 標準理論のくりこみ可能性によって、低エネルギーでの現象は高エネルギーの物理に insensitive になっている。
* ヒッグス粒子の発見によって、標準理論の予言する素粒子はすべて発見されたことになる。
* ヒッグス粒子の質量の測定によって、標準理論の真空は (もしプランクスケールまで標準理論が正しいとすると)準安定になっていると考えられている。
* MH , mt , αs が高精度に決定されることが望まれる。
棚橋 誠治 (名大) 素粒子標準理論の現状と残された課題 2014 年 6 月 24 日 17 / 35


![[CB16] 難解なウェブアプリケーションの脆弱性 by Andrés Riancho](https://img.pdfslide.tips/doc/110x75/5877569d1a28ab84388b76cb/cb16-by-andres-riancho.jpg)