Embed Size (px)
Citation preview

CEBI WORKING PAPER SERIES
Working Paper 10/21
FINANCING CONSTRAINTS, HOME EQUITY AND SELECTION INTO ENTREPRENEURSHIP
Thais Laerkholm Jensen Søren Leth-Petersen Ramana Nanda
CEBI Department of Economics University of Copenhagen www.cebi.ku.dk
ISSN 2596-44TX

Financing Constraints, Home Equity and Selectioninto Entrepreneurship∗
Thais Laerkholm JensenDanmarks Nationalbank
Søren Leth-PetersenUniversity of Copenhagen (CEBI) and CEPR
Ramana NandaHarvard Business School and NBER
May 2021
Abstract
We exploit a mortgage reform that differentially unlocked home equity across theDanish population and study how this impacted selection into entrepreneurship.We find that increased entry was concentrated among entrepreneurs whose firmswere founded in industries where they had no prior work experience. In addition,we find that marginal entrants benefiting from the reform had higher pre-entryearnings and that a significant share of entrants started longer-lasting firms. Ourresults are most consistent with the view that housing collateral enabled high abilityindividuals with less-well-established track records to overcome credit rationing andstart new firms, rather than just leading to ‘frivolous entry’ by those without priorindustry experience.
∗Jensen: [email protected], Leth-Petersen: [email protected], Nanda:[email protected] We are extremely grateful to Manuel Adelino, Joan Farre-Mensa, KristopherGerardi, Erik Hurst, Raj Iyer, Bill Kerr, Chris Hansman, Renata Kosova, Francine Lafontaine, JoshLerner, Ross Levine, Gustavo Manso, Matt Notowidigdo, Alex Oettl, Tarun Ramadorai, David Robinson,Matt Rhodes-Kropf, Martin Schmalz, Antoinette Schoar, Elvira Sojli, David Sraer, Peter Thompsonand the seminar participants at the NBER summer institute, NBER productivity lunch, ImperialCollege London, ISNIE conference, Georgia Tech, UC Berkeley, University of Cambridge, Universityof Copenhagen, University of Southern Denmark, University of Mannheim, Goethe University, OECD,Paris School of Economics, Tilburg University and Rotterdam School of Management for helpfulcomments. The research presented in this paper is supported by Center for Economic Behavior andInequality (CEBI), a center of excellence at the University of Copenhagen financed by grant DNRF134from the Danish National Research Foundation, and by funding from the Danish Council for IndependentResearch, the Danish Economic Policy Research Network - EPRN, the Kauffman Foundation and theDivision of Research and Faculty Development at the Harvard Business School. Leth-Petersen is researchfollow at the Danish Finance Institute.
1

1 Introduction
Startups play a disproportionate role in the economy in terms of aggregate job creation
and productivity growth (Haltiwanger, Jarmin, and Miranda 2013; Adelino, Ma, and
Robinson 2017), which is why reducing financing frictions for new firms remains a key
policy goal across the world (Bernanke 2010; Mills and McCarthy 2014).
Despite the importance of the issue and widespread policies across countries to promote
entrepreneurship, little is known about how relaxing financing constraints impacts who
selects into entrepreneurship, both in terms of the characteristics of the entrepreneurs
who enter as well as the performance of the firms they found. An understanding of how
the composition of potential entrepreneurs shifts when constraints are relaxed is also key
to understanding the efficacy of broad-based policies aimed at facilitating entrepreneurial
entry, particularly in light of growing evidence of heterogeneity in the motivations and
nature of constraints facing different potential entrepreneurs (Hamilton 2000; Hurst and
Pugsley 2011; Hvide and Møen 2010; Andersen and Nielsen 2012; Levine and Rubinstein
2017, 2018; Bellon et al. 2020).
The dearth of evidence on this question is driven in large part by the difficulty of
connecting an exogenous change in financing constraints to comprehensive, population-
wide data that can connect individuals and firms in a longitudinal manner. We overcome
these challenges in this paper by combining individual- and firm-level panel data, drawn
from administrative records in Denmark together with a major mortgage reform in 1992
that unexpectedly and differentially unlocked home equity across the population (Leth-
Petersen 2010).
Before the reform, mortgages in Denmark could only be established for buying a
house. As of 1992 this was changed and owners could now take out a mortgage and
use the proceeds for any purpose, including the financing of a business start-up. Since,
at the time, only regular fixed rate mortgage contracts with instalments were available,
1

equity-to-value at the point of the reform was in part determined by the time since
the house was purchased, creating cross-sectional variation in the access to home equity
across individuals. We detail below how the reform was unanticipated, and how we use the
resulting exogenous variation in access to home equity across individuals to study selection
into entrepreneurship. A key element of our study is that in addition to measuring the
magnitude of the response to relaxed constraints, we are also able to characterize the
marginal entrants in terms of their ex ante background, as well as ex post survival of the
startups they found.
We first trace the effect of the reform through home-equity based borrowing to an
increase in entrepreneurship. Those benefiting from the reform increased personal debt
by 18% relative to those who did not benefit from unlocked collateral. Differences-in-
differences estimations document that on average, entry into entrepreneurship for the
treated group increased by 14% following the reform. Consistent with prior work docu-
menting the housing collateral channel in enabling entrepreneurship, we find this average
effect was driven by the sub-population of homeowners who had the largest increase in
access to housing collateral.
When looking at the characteristics of entrants and the firms they found, we find two
sets of key results: First, we find that the increase in entrepreneurship among the treated
group was driven almost entirely by individuals without prior experience in the indus-
try that they entered, suggesting that individuals who took advantage of the unlocked
home equity were entrepreneurs with less-well-established track records, who could now
overcome credit rationing by pledging tangible assets themselves. Since entrepreneur ex-
perience and skill is believed to be an important driver of success, the potential lack or
relevant experience for the entrepreneurship we document could be seen as ‘frivolous’ or
driven by those with low human capital (Andersen and Nielsen (2012). Alternatively, it
could reflect credit rationing to entrepreneurs who were harder to screen on observable
dimensions Stiglitz and Weiss (1981), but who were nevertheless building legitimate firms.
2

Our second set of findings speak to this question of entrepreneur quality. We find that
on average, treated individuals who became entrepreneurs had higher pre-entry income in
the year prior to starting their firm than equivalent individuals who founded firms before
the reform and that a substantial share of entry among the treated group was comprised
of startups that survived at least 3 years (which is the median survival age of new firms).
These findings are consistent with Evans and Jovanovic (1989), who predict that higher
ability entrepreneurs are most likely to be constrained when collateral constraints bind.
While we cannot rule out the possibility of ‘frivolous’ entry in some cases, our results
appear most consistent with the view that access to home equity enabled high ability
individuals with less-well-established track records to overcome credit rationing and start
new firms.
Our results relate to a number of strands of the literature on financing constraints
in entrepreneurship. While the broader topic of credit constraints facing potential en-
trepreneurs has received substantial academic attention, a lack of population-level data to-
gether with exogenous shifts in credit constraints has meant that little is known about the
characteristics of entrepreneurs who benefit most when constraints are relaxed. Our work
highlights how credit rationing appears tied to key elements of a potential entrepreneur’s
background, which has important implications for who selects into entrepreneurship when
constraints are relaxed. In fact, the lack of entry response to increased credit availability
among those with prior industry experience – including those with substantial increases
in housing collateral entering more capital intensive industries – suggests that credit ra-
tioning in the pre-period was related more to financiers’ perceptions of an entrepreneur’s
relevant experience rather than attributes of the industry per se. Given that many en-
trepreneurs typically found businesses in areas where they have prior experience (e.g Bhide
(1999)), this finding is line with theoretical models such as Stiglitz and Weiss (1981), where
entrepreneurs face credit rationing in equilibrium when they are perceived as being too
risky or their ability to be successful is harder to evaluate. An important paper along
3

these lines is Andersen and Nielsen (2012), who find that the marginal entrepreneur who
starts a business after receiving a windfall bequest is of lower quality. As with Andersen
and Nielsen (2012), we also find an increase in entrants who quickly fail. However, our
results on the pre-entry salary of entrants and the presence of longer-term entry suggests
that not all the entry in our context was comprised of those with low ability. Indeed, in
our context, on average, the marginal entrant had higher ability as proxied by their salary
prior to founding their firm.
Our work also speaks to the growing literature that has documented the role of housing
collateral for enabling entrepreneurship (Adelino, Schoar, and Severino 2015; Black, Meza,
and Jeffreys 1996; Bracke, Hilber, and Silva 2018; Corradin and Popov 2015; Schmalz,
Sraer, and Thesmar 2017), since home equity allows banks to rely on pledgable collateral
when their screening technology cannot fully overcome the challenges associated with
asymmetric information on young firms’ businesses (Chaney, Sraer, and Thesmar 2012).
While prior results have focused on the ability of home equity to alleviate financing
frictions, our results shed light on the characteristics of founders or businesses that may be
most likely to benefit from housing collateral: those that financiers find harder to evaluate,
rather than just those starting businesses with a higher reliance on external finance. In
particular, our finding that those with prior experience entering capital intensive industries
did not appear, on average, to be facing constraints is related to recent work showing the
high prevalence of lending to firms based on anticipated cash flow (Kermani and Ma
2020) rather than the simply the tangibility of collateral. It can also help rationalize why
housing collateral is simultaneously shown to be extremely valuable to alleviate financing
constraints for entrepreneurs but also shown to be far from universally needed for startups
raising external finance (Kerr, Kerr, and Nanda 2019).
4

2 The Danish mortgage market and the mortgage
reform of 1992
The setting for our study is the Danish mortgage market reform of 1992. Several features
make this an attractive setting for such an analysis. First, Denmark’s mortgage market
has been dominated by fixed rate mortgage loans that can be prepaid without penalties
at any time prior to maturity. In this sense the Danish mortgage market is similar to
the US market, where long term fixed rate loans are common, and refinancing is also
possible (Campbell 2013). Due to this and the detailed data collected by the Danish
authorities, the Danish mortgage market has been the setting for a number of influential
analyses in recent years (e.g. Andersen et al. (2020); Andersen and Leth-Petersen (2020);
Leth-Petersen (2010)), highlighting the generalizeability of its context.
Second, the Danish reform provides a unique opportunity to examine the role of home
equity in enabling entrepreneurship by understanding the characteristics of those who
benefited most from the reform. Until 2007, mortgage debt in Denmark was provided
exclusively through mortgage banks – financial intermediaries specialized in the provision
of mortgage loans. The Danish credit market reform studied in this paper took effect on
21 May 1992. The reform was part of a general trend of liberalization of the financial
sector in Denmark and in Europe, although the exact timing appears to be motivated by
its potential stimulating impact to the economy during the recession of 1992.1 The reform
was implemented with short notice and passed through parliament in three months. The
short period of time from enactment to implementation is useful for our identification
strategy as it suggests that it is unlikely that the timing of individuals’ house purchases
was systematically linked to a forecast of unlocking housing collateral for the business.
The reform changed the rules governing mortgage loans in two critical ways that are
relevant to our study. The most important here is that it introduced the possibility of
1We discuss in Section 4.1 how our identification strategy addresses business cycle effects.
5

using the proceeds from a mortgage loan for purposes other than financing real property,
i.e. the reform introduced the possibility to use housing equity as collateral for loans
established through mortgage banks where the proceeds could be used for, among other
things, starting or growing a business. The May 1992 bill introduced a limit of 60%
of the house value for loans for non-housing purposes. This limit was extended to 80%
in December 1992. A second feature of the reform increased the maximum maturity of
mortgage loans from 20 to 30 years. For people who were already mortgaged to the limit
prior to the reform, and who therefore could not establish additional mortgage loans for
non-housing consumption or investment, this option potentially provided the possibility
of acquiring more liquidity by spreading out the payments over a longer period and hence
reducing the monthly outlay towards paying down the loan.
The highly structured mortgage market in Denmark at the time was such that the
equity unlocked by the reform was driven largely by the timing of the house purchase
and the level of the down-payment. That is, while it was possible to refinance mortgage
loans prior to the reform to lock in lower interest rates, refinanced loans had to be of the
same maturity as the original loan and the principal could not be expanded. Similarly,
people could prepay their loan, but having done so, it was not possible to extract equity
through a mortgage loan on the same house. These restrictions implied that mortgage-
loan-to-value ratios across individuals in 1991 were determined to a large extent by the
timing of the house purchase relative to the reform. Individuals therefore entered the
post-reform period with different loan-to-value ratios, implying a differential ability to
use home equity to finance their businesses. We use this cross-sectional variation in the
available equity at the time of the reform to identify the effect of getting access to credit
by comparing the propensity to become a business owner across households who entered
the reform period with high vs. low amounts of housing equity that could be used to
collateralize loans for the business. Section 4.1 provides a more detailed description of
our identification strategy.
6

Commercial banks were not restricted in offering conventional bank loans, either before
or after 1992. However the granting of such bank loans was subject to a regular credit
assessment based on project’s projected cash flows as opposed to solely on the basis of
the value of housing collateral, as was the case with the mortgage banks.2
Overall, therefore, the reform allowed home owners to raise debt backed by home
equity – for any purpose based solely on the assessment of the collateral and not on how
the capital would be used. In this way, the riskiness or potential of an individual’s start-up
did not play a role in their ability to take out a new loan. Studying the characteristics of
‘treated individuals’ who were most likely to start new firms in the post period therefore
also helps us understand the types of individuals who benefited most from being able raise
capital in this way, without regard for how it would be used.
3 Data
We use a matched employer-employee panel dataset drawn from the Integrated Database
for Labor Market Research in Denmark, which is maintained by the Danish Government
and is referred to by its Danish acronym, IDA. IDA has a number of features that makes
it very attractive for this study.
2The combination of the regulation around mortgage lending and protection afforded by the titleregistration system and the buffer to cover loan defaults implied that the loans offered by mortgage bankswere very safe, justifying lending based solely on the value of collateral. Specifically, when granting amortgage loan for a home in Denmark, the mortgage bank issued bonds that directly matched therepayment profile and maturity of the loan granted. The bonds were sold on the stock exchange toinvestors and the proceeds from the sale paid out to the borrower. Once the bank had screened potentialborrowers based on the valuation of their property and on their ability to service the loan, all borrowerswho were granted a loan at a given point in time faced the same interest rate. This was feasible becauseof the detailed regulation of the mortgage market. First, mortgage banks were subject to solvency ratiorequirements monitored by the Financial Supervision Authority, and there was a legally defined thresholdof limiting lending to 80% of the house value at loan origination. In addition, each plot of land in Denmarkhas a unique identification number, the title number, to which all relevant information about owners andcollateralized debt is recorded in a public title number registration system. Mortgage loans have priorityover any other loan and the system therefore secures optimum coverage for the mortgage bank in caseof default and enforced sale. Creditors can enforce their rights and demand a sale if debtors cannot pay.Furthermore, mortgage banks accumulate a buffer through contributions from all borrowers, and theyuse this buffer to cover loans defaults.
7

First, the data is collected from government registers on an annual basis, providing de-
tailed data on the labor market status of individuals, including their primary occupation.
An individual’s primary occupation in IDA is characterized by their main occupation in
the last week of November. This allows us to identify entrepreneurs in precise manner
that does not rely on survey evidence. For example, we can distinguish the truly self-
employed from those who are unemployed but may report themselves as self-employed in
surveys. We can also distinguish the self-employed from those who employ others in their
firm. Finally, since our definition of entrepreneurship is based on an individual’s primary
occupation code, we are also able to exclude part-time consultants and individuals who
may set up a side business in order to shelter taxes.
Second, the database is both comprehensive and longitudinal: all legal residents of
Denmark and every firm in Denmark is included in the database. This is particularly
useful in studying entry into entrepreneurship where such transitions are a rare event.
Our sample size of entrepreneurs is therefore considerably larger than most studies of
entrepreneurship at the individual level of analysis. Our analyses are based on a sample
of about 300,000 individuals over the nine years from 1988-1996, leading to 2.7 million ob-
servations. It also allows us to control for many sources of heterogeneity at the individual-
industry - and region-level.
Third, the database links an individual’s ID with a range of other demographic char-
acteristics such as their age, gender, educational qualifications, marital status, number of
children, as well as detailed information on income, assets and liabilities.3 House value,
cash holdings, mortgage debt, bank debt, and interest payments are reported automat-
ically at the last day of the year by banks and other financial intermediaries to the tax
3Assets are further broken into six categories: housing assets, shares, deposited mortgage deeds,cash holdings, bonds, and other assets. Liabilities are broken into four different categories up to 1992:mortgage debt, bank debt, secured debt and other debt. Importantly, the size of the mortgage is knownup to 1993. After this point definitions of the available variables are changed. A measure of liabilities thatis consistent across the entire observation period can only be obtained for the total size of the liabilitystock.
8

authorities for all Danish tax payers and are therefore considered very reliable. While cash
holdings and interest payments are recorded directly, the house value is the tax assessed
value scaled by the ratio of the tax assessed value to market value as is recorded among
traded houses in that municipality and year, and mortgage debt is recorded as the market
value of the underlying bonds at the last day of the year. The remaining components,
including the data on individual wealth, are self-reported, but subject to auditing by the
tax authorities because of the presence of both a wealth tax and an income tax. The
detailed data on liabilities, assets and capital income is particularly useful for a study
looking at entrepreneurship where wealth is likely to be correlated with a host of factors
that can impact selection into entrepreneurship (Hurst and Lusardi 2004).
3.1 Sample
Since we are exploiting a mortgage reform for our analysis, we focus on individuals who
are home-owners in 1991 (the year before the reform). Among home owners, we focus on
those who are between the age of 25 and 50 in 1991, to ensure that we do not capture
individuals retiring into entrepreneurship. Therefore, the youngest person at the start of
our sample (in 1988) is 22 and the oldest person at the end of our sample (in 1996) is
55. Finally, we focus on individuals who are not employed in the agricultural industry in
1991, because, like many western European nations, the agricultural sector in Denmark
is subject to numerous subsidies and incentives that may interact with entrepreneurship.
We create a nine year panel for a 25% random sample of these individuals (who were
home owners, between the ages of 25 and 50 and not involved in the agricultural sector,
all in 1991), yielding data on 303,431 individuals for the years 1988-1996. There is some
attrition from our panel due to death (after 1991) and individuals who are living abroad
and hence not in the tax system in a given year (both before and after 1991). However,
this attrition leads to less than a 1% fall relative to a balanced panel, yielding a total of
9

2,708,892 observations.
3.2 Definition and Validation of Entrepreneurship measure
We focus our analysis of entrepreneurship on individuals who are employers (that is, self
employed with at least one employee) in a given year. We use this measure to focus
on more serious businesses and make our results more comparable with studies that use
firm-level datasets (e.g. such as the Longitudinal Business Database in the US, that are
comprised of firms with at least one employee) as well as those that study employment
growth in the context of entrepreneurship. As shown in Figure 1, these are also the
entrepreneurs relying considerably on debt finance, who would be impacted by the reform.
We define individuals as having entered entrepreneurship if they were not an entrepreneur
in t− 1 but became an entrepreneur in year t.
Figure 1 documents the trajectory of interest payments on and personal debt for in-
dividuals in our sample who transitioned from employment to employers in 1990 – that
is two years prior to the reform.4 It compares the trajectory with individuals who transi-
tioned from employment to being self-employed and those who remained in employment
over the 1990 period. As seen in Figure 1, those who transitioned to self-employment
and to becoming employers had higher levels of interest payments but similar pre-trends.
This is consistent with them being wealthier and owning larger houses, as shown in many
papers linking personal wealth to the propensity to become an entrepreneur (e.g., Hurst
and Lusardi (2004)).
However, Figure 1 also shows that the sharp increase in interest payments around
the year of entry is seen principally among employers as opposed to those entering self-
employment. The increase in interest payments in the year of entry is equivalent to a
230,000 DKK increase in debt around the entry year (just under $40,000). Individuals
4The 1990 cohort is useful because it gives us a two year “pre-trend” and allows us to look at debtaccumulation up to a year after entry in the pre-reform period.
10

becoming employers are therefore more likely to need external finance and hence face
financing constraints. A second element of this analysis is that it highlights both the
importance of debt financing for new firms (as noted in Robb and Robinson (2014)), as
well as how a number of individuals were able to raise debt to finance their businesses in
the pre-reform period despite not having access to housing collateral.
3.3 Descriptive Statistics
Table 1 documents that the annual probability that an individual enters entrepreneurship
is 0.58%. These numbers are very consistent with those seen in US.5 It also provides
descriptive statistics, comparing the covariates of the treated and control groups used in
our subsequent analysis. About 45% of the individuals in our sample were in the treated
group. The table highlights that on average, those in the treated group bought their house
several years earlier (on average in 1979), whereas those in the control group bought their
house in 1985. This difference in the timing of when the home was bought is the key
source of variation we want to exploit. Unsurprisingly, the individuals with greater than
0.25 in ETV are different from those with ETV below 0.25, along dimensions related to
life cycle, wealth and family choice. For example, individuals in the treated group are
older, somewhat less likely to have children, and are wealthier, which intuitively relate
to having greater cash available for a downpayment or having bought the house earlier
in time. However, as we elaborate in more detail below, our estimation design aims to
control for these differences (not only in levels, but also in terms of their differential impact
across time) by interacting these covariates with a full set of year fixed effects.
5For example, Kerr, Kerr, and Nanda (2019) use LEHD data to estimate transition rates of 0.6% inthe U.S.
11

4 Results
4.1 Identification Strategy
As noted in Section 2, the mortgage reform we study took effect in 1992, and enabled
individuals, for the first time, to borrow against their home for uses other than the prop-
erty itself. Our identification strategy exploits cross-sectional variation in the intensity of
the reform’s treatment across individuals. The reform allowed individuals to borrow up
to a maximum of 80% of the home value. Even if individuals lowered their payments by
extending a mortgage from 20-30 years, those with more than 0.75 in loan-to-value (LTV)
would have not gained sufficient equity to extract any debt for non-housing purposes. We
therefore focus on individuals with less than 0.75 in LTV or those with at least 0.25 in
equity-to-value (ETV) in 1991 as our treated group. In our core specifications, we there-
fore compare the differential response of individuals who had home equity unlocked by
the reform to those who did not get any equity unlocked. Given that the reform was first
introduced in May of 1992 and data are recorded as of November, we include 1992 in our
post-reform period and measure individual attributes as of 1991. The core specification
takes the form:
yit = β1I (ETV91 > 0.25)i + β2POSTt × I (ETV91 > 0.25)i + γX91i × φt + uit (1)
where I (ETV91 > 0.25) is an indicator that takes a value of 1 if the individual was
treated by the reform, POSTt is an indicator that takes a value of 1 for the period 1992-
1996, X is a matrix of individual, municipality and industry-level controls, φt refer to year
fixed effects which, as shown in Equation (1) are interacted with the sets of individual,
municipality and industry covariates. Standard errors are clustered at the individual level.
Our key coefficient of interest is β2, which measures the response of individuals who got
access to home equity following the reform relative to those who did not get access.
12

While I (ETV91 > 0.25)i is an indicator in the base specification, we also estimate
specifications where I (ETV91 > 0.25)i is expanded to be a vector of dummy variables
indicating different levels of equity to value in 1991. We do this to explore whether effects
vary with the amount of credit that house owners gain access to with the 1992 mortgage
reform but without imposing arbitrary functional form assumptions. We also report
results using a continuous measure of ETV in the Appendix to document the robustness
of the results.6
As shown in equation (1), we account for the differential response of individuals at dif-
ferent points in the life cycle, wealth, working in different industries and living in different
municipalities by including an interaction between these individual covariates and year
fixed effects.7 Specifically, we include in X91i indicators to the individual’s gender, educa-
tional background, marital status, children, age (one for each year from 25-50), household
wealth (fixed effect for the decile of household wealth), the municipality of residence and
the industry that the person works in. We interact each of these characteristics with year
dummies, φt, to control for different trends in debt accumulation and entrepreneurship
across people with different observable characteristics. Given the structured mortgage
system at the time, a significant driver of who got access was driven by when the home
was purchased. Table A.1 in the Appendix documents the equity to value (ETV), or the
percentage of house value that is available to collateralize for investments other than the
home, in the year prior to the reform, broken down by an individual’s age and when they
bought their house. As can be seen from Table A.1, the level of equity is much more stable
across rows than within columns. That is, a significant driver of the amount of housing
6As we show below, the relationship between access to equity and entrepreneurship appears to behighly non-linear. Individuals with the largest amount of unlocked equity respond with substantiallygreater elasticities. Because of this, we prefer the non parametric specifications to estimate magnitudes.However, as seen in Appendix Tables A.3 and A.4, the results are robust to imposing a linear relationshipbetween unlocked equity and entry into entrepreneurship.
7There are 98 municipalities in Denmark, which is a level of aggregation that is larger than a zip codebut smaller than a county. To put this in perspective, Denmark’s population is approximately the sizeof Massachusetts, which has fourteen counties and 536 zip code.
13

equity available to collateralize seems to be the timing of the home purchase. Those who
bought their home after 1984 tend to have less than 25% of their housing equity available
to draw on, while those who bought their houses earlier tend to have much greater housing
equity available to borrow against.
While age, which proxies for life cycle factors that would impact the timing of the home
purchase, is clearly important, Table A.1 documents that there is significant variation in
available equity within age buckets, which in turn is strongly correlated with the year in
which the house was bought. This plausibly exogenous variation in the timing of house
purchase by some years relative to the reform is the source of our identification. In effect,
we are examining the relative response of two ‘identical’ individuals (in terms of their
age, gender, educational background, wealth, marital status and children) who work in
the same industry and live in the same municipality, but one who bought the home some
years before the other.8
Our identification is therefore predicated on the assumption that, controlling for
covariate-times-year fixed effects, the timing of the house purchase is unrelated to the
propensity to become an entrepreneur. Our discussion above helps document that the
notion of using home equity did not exist before the reform and that it was passed quickly
enough that it could not have directly impacted the decision to purchase of house to unlock
collateral.9
8In principle, those who got access to housing collateral may also have differential house price changeswithin a given municipality in the pre-period, as any across-municipality differences in house prices areaddressed through municipality-by-year fixed effects. In practice, (in unreported regressions) we find nodifference in the trajectory of house prices within municipalities for those who were treated by the reformin 1992 relative to those who were not.
9We document parallel trends in the pre-period in Figures 3,5,6 and 7. We therefore believe thatEquation (1) enables us to estimate the impact of a release of home equity on household borrowing andentrepreneurship.
14

4.2 Borrowing based on Home Equity
We start by documenting that the reform impacted a large number of individuals and
that it was substantial. Figure 2 plots the amount of equity that was unlocked for the
individuals in our sample. The X-axis buckets individuals into 100 bins of equity to value
(ETV) in 1991. We then plot the amount of equity that was unlocked for individuals in
each of these buckets (measured on the left Y-axis) at the mean, 25th percentile, median
and 75th percentile. These lines document two important facts. First, the amount of
equity unlocked was substantial. The average equity unlocked was 200,000 DKK ($33,819
using the end of 1991 exchange rate of 5.91). This amount was large both in relative terms
(the median treated individual got access to at least a year’s disposable income) and in
terms of the starting capital of business. Some individuals with high levels of ETV had
over 500,000 DKK (over $70,000) unlocked by this reform. Second, the slope of the lines
are constant, which documents that the dollar value of equity unlocked was a constant
proportion of the ETV in 1991. In other words, the average house value across those in
different ETV buckets was extremely well-balanced, suggesting both that ETV in 1991 is
a good measure for the total amount of credit that was unlocked across the buckets and
that ETV did not vary dramatically across wealth.
We next document that treated individuals responded to the reform by substantially
increasing the amount of personal debt outstanding. In Table 2 we present a version of
Equation (1), where the dependent variable is the level of household debt in each year,
measured in constant 1991 DKK. Column (1) of Table 2, documents that after controlling
for covariate-by-year fixed effects, the estimated debt outstanding for Danish households in
1990 was 654,605 DKK (approximately $ 110,000). As expected, those with ETV > 0.25
are individuals who bought their homes earlier, implying that they had more of their
mortgage paid down and had lower levels of debt. On average, individuals in the treated
bucket had half the debt of those in the treated category (654,605 - 322,744= 331,861
15

DKK in debt). The average increase in household debt for the treated group in the post
period was 62,204 DKK. Column (2) of Table 2 shows that the inclusion of municipality-
by-year fixed effects barely shifts the coefficients, indicating that the equity extraction
was not different across municipalities of Denmark. Comparing the average increase in
household debt in the post period for the treated group (62,046 DKK) with the average
level of debt in the pre-period (651,304 - 315,122 = 336,182), suggests that the treatment
group increased household debt by an average of 19% in the post period, consistent with
prior work looking at the elasticity of household debt extraction with respect to changes
in collateral value (e.g. Hurst and Stafford (2004); Mian and Sufi (2011)).
Columns (3) and (4) document how this average of 19% varies across the size of the
treatment. For example, those with ETV between 0.25 and 0.5 increased debt by 7%
(33,810 / (654,437-193,746)) in the post period, while those with ETV between 0.75 and
1 increased household debt by an average of 66% (106,275 / (654,437-494,285)). Table
A.2 shows that the large average increases in household debt were driven by about 10% to
15% of households extracting an exceptionally large amount of debt together with many
households that did not increase debt substantially, or at all.
In Figure 3 we show the dynamics of household debt around the reform, broken down
by ETV bucket, by running dynamic specifications corresponding to column (4) of Table
2. This figure documents two important patterns that provide further confidence that the
collateral channel was driving the results noted in Table 2. First, it documents a strong
reversal in the level of household debt, corresponding exactly to the timing of the reform.
Second, the cross-sectional variation in the patterns noted – where those with higher ETV
show a stronger reversal – are also exactly what one would have predicted if the increase
in debt was being driven by the increased access to housing collateral.
16

4.3 Entry into Entrepreneurship
Having established that the reform unlocked a significant amount of housing collateral
and that those in the treatment group responded to this by increasing their personal
debt, we now turn to studying the impact of the reform on entrepreneurship. If credit
constraints were holding back potential entrepreneurs in our sample, we should see that
those who received an exogenous increase in access to credit would be more likely to be
entrepreneurs.
We look next at entry into entrepreneurship. Table 3 reports the coefficients from
the differences-in-differences specification outlined in equation (1), where the dependent
variable takes a value of 1 if the individual was not an entrepreneur in t− 1 but became
an entrepreneur in year.
Table 3 shows that as with household debt, the treated group had a larger increase
in entrepreneurship in the post period. Moreover, the coefficients are extremely stable
when including a larger number of fixed effects. Columns (2) and (4) of Table 3 not
only include municipality-by-year fixed effects but also industry-by-year fixed effects to
control for differential increases in entry rates across industries that might confound the
estimates. The stability of the coefficients suggests that neither geographic nor industry
differences in the entry across treated and control groups is responsible for the effects
measured in columns (1) and (3) respectively.10 Figure 5 plots dynamic specifications
corresponding to column (2) of Table 3, showing parallel trends prior to the reform and
an increase in entry emerging after the reform.
Calculating the magnitude of the effect in the same way as was calculated in Table
10Identification in our setting comes primarily from cross-sectional variation since most individualsonly attempt entrepreneurship once. However, we have within variation and hence are mechanically ableto estimate individual fixed effects regressions. As can be seen from Appendix Table 5, the coefficientsremain stable when including individual fixed effects, implying that there are no residual correlatedindividual effects that matter for our parameter of interest. Given this, we report the results exploitingcross-section variation but have verified that all results are robust to the inclusion of individual fixedeffects.
17

2, column (2) of Table 3 documents that the baseline probability of entry after control-
ling for covariate-by-year fixed effects is 0.59% and that those in the treated group had
slightly lower entry rates in the pre-period. Accounting for this difference in baseline en-
try probabilities, column (2) shows that the increase in entry of 0.061 percentage points
due to the unlocked home equity corresponded to a 14% increase in entrepreneurship for
the treated group relative to the pre-period. Columns (3) and (4) show that this average
effect was driven by the much larger impact on those in the 0.75-1 ETV bucket, in other
words those who benefited the most from treatment. For this group of individuals who
comprised about 10% of the total sample, the increase in entrepreneurship relative to the
pre-period was 28%. Although the magnitude is smaller and not precisely estimated, the
pattern associated with the other two treated buckets also document a increase in entry
relative to the control group in the post-period.
In understanding the magnitude of the response, it is noteworthy that the 14% average
appears driven to a large extent by those in the highest ETV bucket, where as noted
above, we report 28% increase in entry in the treated group relative to the pre-period.
Unlocked equity was substantial in this group – equivalent to an increase in home equity
arising from a 75% increase in house prices in a context such as the US. This non-linear
relationship between unlocked equity and entrepreneurship suggests that the benefit of
housing collateral may be particularly valuable when it facilitates comparatively larger
loans.
4.4 Characteristics of Entrants
Thus far we have documented that the reform unlocked substantial equity for homeowners,
that the elasticity of debt extraction was similar to prior studies and that the average
increase in entry of 14% among the treated group relative to the control was driven
by those who had the most ‘intensive treatment’. These results document that potential
18

entrepreneurs facing credit constraints could overcome them by pledging housing collateral
to raise the capital needed to start their business.
We turn next to understanding the characteristics of entrants in order to understand
the types of entrepreneurs that might benefit most from being able to pledge housing
collateral. As noted above, a unique element of our setting is that we can examine the
types of individuals for who we see the greatest relative response from the treated group,
which enables us to characterize the marginal entrant that benefited most from the reform.
To characterize the entrepreneurs who benefited most from getting access to housing
equity, we look at the entry responses based on the experience the entrepreneurs had in
the industry where they found their firm. Specifically, we examine the industry into which
the individual entered (at the granularity of 111 industries as documented in Figure 4)
and code entry based on whether the industry they worked in period t− 1 is the same as
that of the industry in which they founded their startup. These results are reported in
Table 4.
Before moving to interpreting the results in Table 4, note that so as to focus on
the key results, we now report only the specifications with the full set of fixed effects
(equivalent to columns (2) and (4) of Table 3) although they remain robust regardless of
the specification used. Also, in order to focus on key results, note that we only report the
β2 coefficients from equation (1). The β1 coefficients are included in all specifications and
reported as controls so as to focus on the key coefficients of interest. Finally, note that
the dependent variable in these estimations now corresponds to entry in industries where
the entrepreneur had prior experience vs. not. In other words, all regressions are run on
the same sample (rather than being split on any dimension).
This approach has two benefits: first, we are able to control for systematic trends
related to an industry an individual starts a business in, without having to split the
sample on any dimension ex ante. Second, due to the fact that entry into capital and
less capital industries are mutually exclusive and collectively exhaustive, the sum of the
19

coefficients should equal the overall coefficient associated to entry reported in Table 3.11
This implies that in addition to examining whether or not entry into these buckets is
statistically significant from zero, one can examine the share of the overall entry response
that comes from those starting businesses in where they had prior experience vs. not.
Looking at columns (1) and (3) of Table 4 shows that the entire response we measure
in column (2) of Table 3 comes from those entering industries where they do not have any
prior experience. Comparing columns (2) and (4) reinforces this finding, showing that
this is equally true across all the treatment buckets. In fact, the effect is so strong that
even those in the ETV 0.5-0.75 bucket show a statistically significant response, something
that we did not see in Table 3. Our results document the apparent importance of having
prior experience in an industry as a strong signal for financiers, which is consistent with
studies that highlight the degree to which financiers focus on entrepreneurial backgrounds
when making capital allocation decisions (Bernstein, Korteweg, and Laws 2017).
In Figures 6 and 7, we graph the results from dynamic estimations, where we re-
port year-by-year effects relative to 1991. Figure 6 reports the coefficient of dynamic
estimations corresponding to columns (1) and (3) of Table 4, while Figure 7 reports the
coefficients on the highest ETV bucket of dynamic estimations corresponding columns (2)
and (4) of Table 4. As can be seen with both figures, we see parallel trends prior to the
reform, a sharp and persistent increase in entry among those entering in industries where
they did not have prior experience, and no differential increase among the treated group
for those entering in industries where they had prior experience.
The fact that we see no measured response from treated individuals starting businesses
with prior experience, even among those with substantial treatment, is interesting. It
suggests that the individuals for whom access to home equity reduced constraints was
primarily the subset of those starting firms in industries where it was harder for a financier
11To check this, note that the coefficient 0.00044 (in column (1) of Table ??) and the coefficient 0.00017(in column (3) Table ??) add to 0.00061, which is the coefficient on overall entry reported in column (2)of Table 3).
20

to evaluate whether the entrepreneur was qualified to run the venture. One way to
examine whether the channel is related to entrepreneurial characteristics vs. attributes of
the industry, such as capital intensity, is to examine the differential response of individuals
entering more vs. less capital intensive industries based on their prior experience. We
measure capital intensity of an industry by calculating the change in debt associated
with starting a business as an employer in each of 111 different industries in the pre-
period, as shown in Figure 4.12 Industries that are above the median according to this
measure are classified as being more dependent on external finance, and as seen in Figure
4, this variation exists both across broad industry classifications but also within industry
classifications, so continues to be identified when including the broader industry-by-year
fixed effects.13
Table 5 reports results from the to jointly study entry into more vs. less capital inten-
sive industries based on whether the entrepreneur had prior experience in that industry
or not. Looking across columns (1) through (4) shows that there is a negligible response
for those with prior experience in their founding industry. Of particular note, as seen
in columns (1) and (2) is that we see no measurable impact of relaxed constraints even
among those entering capital intensive industries and with the highest level of treatment.
The coefficients here are precisely estimated, so we can rule out that our null effect is due
to a lack of power. On the other hand, we see substantial effects among those without
prior experience. Here we see a statistically significant response for all the treated groups
entering capital intensive industries, not just those with ETV > 0.75 (column (7)). Sec-
ond, we now see statistically significant responses for two of the three buckets among those
without experience entering less capital intensive industries (Column (8)). Entrepreneurs
with less-well-established track records faced credit rationing even when raising financing
12In the interest of space, Figure 4 depicts the capital intensity for the main 1 digit SIC industrieswhich is why the sub-categories of industries in the Figure do not represent all 111 industries used in theanalysis.
13In unreported analyses, we also find a positive correspondence to a similar measure constructed usingthe Survey of Small Business Finances in the US.
21

for less capital intensive industries. In addition, since an absence of a measured response
from a group when financing constraints are relaxed can be interpreted as that given
group not facing borrowing constraints (Banerjee and Duflo 2014), our results point to
the fact that founder experience rather than capital intensity per se seems more relevant
in driving the credit rationing facing entrepreneurs.
4.5 Founder Ability
Our results thus far have highlighted how the entry response to the mortgage reform was
concentrated among those with a lack of experience in the industry where they founded
their firm, pointing to the fact that these individuals were most likely to have been
constrained prior to the reform. Given the perceived importance of prior background in
entrepreneurial success, it is possible that this could have been ‘frivolous’ entry driven
by personal preferences, or comprised of low ability entrepreneurs founding ‘marginal’
businesses (Andersen and Nielsen 2012). On the other hand, theories such as Evans and
Jovanovic (1989) predict that higher ability entrepreneurs are most likely to be constrained
when collateral constraints bind.
To understand founder ability, we proceed in two steps. First, we examine ability
using an ex ante measure, proxied by the income rank of the individual in the year prior
to entry. On average higher ability individuals are likely to earn more, so systematic shifts
in the average ability of individuals can be measured through shifts in the average income
rank of individuals. Second, we examine the ex post outcome of the ventures they found,
looking in particular at firm survival. Since half of new ventures fail within three years
of entry, looking at the degree to which these startups survive at least three years can
provide an indication of the startups’ quality.
In Table 6 we report results from estimations where the dependent variable is the
interaction between an indicator that takes a value of 1 if the individual is classified as
22

being an entrant in Table 4 and their percentile of income in the year prior to entry.
Higher income is coded as having a higher income percentile, so that a positive coefficient
implies that marginal entrants benefiting from the reform had higher income in the year
prior to their entry. As can be seen from columns (3) and (4) of Table 6, treated entrants
without experience in the post period had higher income following the reform on average,
suggesting that the marginal entrant was higher ability or with a higher outside option
compared to equivalent entrants prior to the reform. This finding is consistent with
Evans and Jovanovic (1989), which predicts that higher ability individuals are more likely
to be constrained when collateral constraints bind so that a relaxation of a financing
constraint should lead the marginal entrant to be higher ability than those who entered
when constraints were binding.
While Table 6 examines founder quality using an ex ante measure of pre-entry earnings,
we are also able to trace the survival of the firms that entrepreneurs found, to examine an
ex post measure of firm success - namely survival. Prior work has documented that about
half of all entrants in a given cohort fail within three years of entry (Kerr and Nanda
2009). Studying the degree to which the firms started by treated individuals survived for
a longer period of time allows us to unpack the degree to which this was ‘frivolous’ or
churning entry that quickly ended in failure, or whether the firms that were founded were
those that survived a longer period of time. We document the results of this analysis in
Table 7, where the dependent variable is an indicator that takes a value of one if the firm
entered and survived at least three years. As can be seen from Table 7, a substantial
share of the entrants following the reform had firms that did not quickly fail, which is
consistent with the fact that these were high ability individuals starting legitimate firms.
Putting the results from Table 6 and Table 7 together, we find that marginal entrants
benefiting from the reform had higher pre-entry earnings and included a substantial num-
ber of longer-lasting firms, suggesting that the reform did not just lead to ‘frivolous entry’.
Rather, housing collateral enabled high ability individuals with less-well-established track
23

records to overcome credit rationing and start new firms.
5 Discussion and Conclusions
In this paper, we combine a unique mortgage reform with population level matched
employer-employee micro data to study how an exogenous increase in the ability to access
home equity finance impacted selection into entrepreneurship. A critical element of our
setting is the fact that prior to the 1992 reform, individuals in Denmark were precluded
from borrowing against their home for uses other than financing the underlying property.
The reform therefore enabled home equity loans for the first time, and hence allowed
individuals who were previously credit constrained to borrow from mortgage banks based
on the strength of their housing collateral.
We highlight how this allows us to not only measure the quantitative impact of relaxing
financing constraints, but also to understand the characteristics of entrepreneurs who
demonstrated the greatest response. In doing so, we can shed more light on the types of
individuals who benefit the most from financing constraints relaxed by being able to post
housing collateral.
We find the reform lead to a 14% increase in entry on average, with substantially
stronger increases among individuals who had more housing equity unlocked by the reform.
When understanding the types of individuals who benefited the most, we found that
the increased entry was concentrated among the set of individuals starting businesses in
industries they where they did not have prior experience. In looking at the quality of firms
being founded, we find that on average, treated individuals with higher pre-entry income
became entrepreneurs after the reform and that a substantial share of this entry was
longer lived. While we do find entry that was comprised of early failure and cannot rule
out that some of this was ‘frivolous‘ or more marginal entry, our results suggest that on
average, it was higher ability individuals without well-established track records who were
24

among the biggest beneficiaries of the reform. This is also similar to findings of the way
in which banking deregulations in the US enabled entrepreneurship (Black and Strahan
2002; Cetorelli and Strahan 2006), where Kerr and Nanda (2009) find that deregulations
led to both an increase in longer-term and churning entry.
Our results are relevant to the extensive literature on entrepreneurial entry, and the
degree to which this is shaped by credit constraints. While substantial work has docu-
mented the presence of financing constraints and the degree to which housing collateral
can alleviate them, less is understood about who benefits more when constraints are re-
laxed. Our results shed light on the characteristics of founders or businesses that may be
most likely to benefit from housing collateral: those that financiers find harder to evalu-
ate, rather than just those starting businesses with a higher reliance on external finance.
In doing so, these results also provide strong empirical support for canonical models of
credit constraints in entrepreneurship that predict credit rationing when screening is dif-
ficult (Stiglitz and Weiss 1981) and that the marginal entrant who benefits from relaxed
constraints is likely to be of higher quality than those entering prior to a constraint being
relaxed (e.g. Evans and Jovanovic (1989)).
25

References
Adelino, Manuel, Song Ma, and David Robinson. 2017. “Firm age, investment opportunities,and job creation.” Journal of Finance 72 (3):999–1038.
Adelino, Manuel, Antoinette Schoar, and Felipe Severino. 2015. “House prices, collateral, andself-employment.” Journal of Financial Economics 117 (2):288–306.
Andersen, Henrik Yde and Søren Leth-Petersen. 2020. “Housing Wealth or Collateral: HowHome Value Shocks Drive Home Equity Extraction and Spending.” Journal of The EuropeanEconomic Association Forthcoming.
Andersen, Steffen, John. Y. Campbell, Kasper Meisner Nielsen, and Tarun Ramadorai. 2020.“Sources of Inaction in Household Finance: Evidence from the Danish Mortgage Market.”American Economic Review Forthcoming.
Andersen, Steffen and Kasper Meisner Nielsen. 2012. “Ability or finances as constraints onentrepreneurship? Evidence from survival rates in a natural experiment.” Review of FinancialStudies 25 (12):3684–3710.
Banerjee, Abhijit and Esther Duflo. 2014. “Do Firms Want to Borrow More? Testing CreditConstraints Using a Directed Lending Program.” Review of Economic Studies 81:572–607.
Bellon, Aymeric, J. Anthony Cookson, Erik P Gilje, and Rawley Z Heimer. 2020. “PersonalWealth and Self-Employment.” Working Paper 27452, National Bureau of Economic Research.
Bernanke, Ben S. 2010. “Restoring the Flow of Credit to Small Businesses.” FederalReserve Meeting Series: “Addressing the Financing Needs of Small Businesses” July12 (http://www.federalreserve.gov/newsevents/speech/bernanke20100712a.htm):2010.
Bernstein, Shai, Arthur Korteweg, and Kevin Laws. 2017. “Attracting Early-Stage Investors:Evidence from a Randomized Field Experiment.” Journal of Finance 72 (2):509–538.
Bhide, Amar. 1999. The Origins and Evolution of New Businesses. Oxford University Press.
Black, Jane, David de Meza, and David Jeffreys. 1996. “House prices, the supply of collateraland the enterprise economy.” Economic Journal 106 (434):60–75.
Black, Sandra E. and Philip E. Strahan. 2002. “Entrepreneurship and bank credit availability.”Journal of Finance 57 (6):2807–2833.
Bracke, Philippe, Christian A. L. Hilber, and Olmo Silva. 2018. “Mortgage debt and en-trepreneurship.” Journal of Urban Economics .
Campbell, John Y. 2013. “Mortgage Market Design.” Review of Finance 17 (1):1–33.
Cetorelli, Nicola and Philip E. Strahan. 2006. “Finance as a barrier to entry: Bank competitionand industry structure in local US markets.” Journal of Finance 61 (1):437–461.
Chaney, Thomas, David Sraer, and David Thesmar. 2012. “The collateral channel: How realestate shocks affect corporate investment.” American Economic Review 102 (6):2381–2409.
26

Corradin, Stefano and Alexander Popov. 2015. “House prices, home equity borrowing, andentrepreneurship.” Review of Financial Studies 28 (8):2399–2428.
Evans, David S. and Boyan Jovanovic. 1989. “An estimated model of entrepreneurial choiceunder liquidity constraints.” Journal of Political Economy 97 (4):808–827.
Haltiwanger, John, Ron S. Jarmin, and Javier Miranda. 2013. “Who creates jobs? Small versuslarge versus young.” Review of Economics and Statistics 95 (2):347–361.
Hamilton, Barton H. 2000. “Does entrepreneurship pay? An empirical analysis of the returnsto self-employment.” Journal of Political Economy 108 (3):604–631.
Hurst, Erik and Annamaria Lusardi. 2004. “Liquidity constraints, household wealth, and en-trepreneurship.” Journal of Political Economy 112 (2):319–347.
Hurst, Erik and Benjamin Wild Pugsley. 2011. “What do small businesses do?” BrookingsPapers on Economic Activity (2).
Hurst, Erik and Frank Stafford. 2004. “Home is where the equity is: Liquidity constraints,refinancing and consumption.” Journal of Money, Credit and Banking 36 (6):985–1014.
Hvide, Hans and Jarle Møen. 2010. “Lean and Hungry or Fat and Content? Entrepreneurs’Wealth and Start-Up Performance.” Management Science 56 (8):1242–1258.
Kermani, Amir and Yueran Ma. 2020. “Two Tales of Debt.” NBER Working Paper (27641).
Kerr, Sari, William R. Kerr, and Ramana Nanda. 2019. “House prices, home equity and en-trepreneurship: Evidence from US census micro data.” NBER Working Paper (21458).
Kerr, William R. and Ramana Nanda. 2009. “Democratizing entry: Banking deregulations,financing constraints, and entrepreneurship.” Journal of Financial Economics 94 (1):124–149.
Leth-Petersen, Søren. 2010. “Intertemporal consumption and credit constraints: Does to-tal expenditure respond to an exogenous shock to credit?” American Economic Review100 (3):1080–1103.
Levine, Ross and Yona Rubinstein. 2017. “Smart and Illicit: Who Becomes an Entrepreneurand Do They Earn More?” The Quarterly Journal of Economics 132 (2):963–1018.
———. 2018. “Selection into Entrepreneurship and Self-Employment.” NBER Working Papers25350, National Bureau of Economic Research, Inc.
Mian, Atif and Amir Sufi. 2011. “House prices, home equity-based borrowing, and the UShousehold leverage crisis.” American Economic Review 101 (5):2132–56.
Mills, Karen and Brayden McCarthy. 2014. “The state of small business lending: Credit accessduring the recovery and how technology may change the game.” Harvard Business SchoolWorking Paper 15-004.
27

Robb, Alicia M. and David T. Robinson. 2014. “The capital structure decisions of new firms.”Review of Financial Studies 27 (1):153–179.
Schmalz, Martin C., David A. Sraer, and David Thesmar. 2017. “Housing collateral and en-trepreneurship.” Journal of Finance 72 (1):99–132.
Stiglitz, Joseph E. and Andrew Weiss. 1981. “Credit rationing in markets with imperfect infor-mation.” American Economic Review 71 (3):393–410.
28

Figure 1: Change in Total Debt for Entrepreneurs, Self-Employed and those in PaidEmployment.
This figure uses interest payments on personal debt to document the degree to which reliance on debt changes for
individuals who transitioned from employment to being self-employed (non-employers) or self-employed employers and
those who remained in employment over the 1990 period. It shows that who transitioned to self-employment and to
becoming employers had higher levels of interest payments. This is consistent with them being wealthier and having larger
mortgages, as shown in many papers linking personal wealth to the propensity to become an entrepreneur (e.g., Hurst and
Lusardi (2004)). However it also shows that the sharp increase in interest payments around the year of entry is seen
principally among employers as opposed to those entering self-employment. The increase in interest payments in the year
of entry is equivalent to an increase in debt around the entry year of just under $40,000. This analysis is consistent with
prior research showing the importance of debt financing for new firms. It also documents that a number of individuals
were able to raise debt to finance their businesses in the pre-reform period despite not having access to housing collateral.
29

Figure 2: Unlocked equity as a function of Equity-to-Value (ETV in 1991)
This figure plots the amount of equity that was unlocked for the individuals in our sample. The X-axis buckets individuals
into 100 bins of equity to value (ETV) in 1991. We then plot the amount of equity that was unlocked for individuals in
each of these buckets (measured on the left Y-axis) at the mean, 25th percentile, median and 75th percentile. These lines
document two important facts. First, the amount of equity unlocked was substantial. The average equity unlocked was
200,000 DKK, which is large both in relative terms (the median treated individual got access to at least a year’s
disposable income) and in terms of the starting capital of business. Second, the slope of the lines are quite constant, which
documents the average house value across those in different ETV buckets was extremely well-balanced up to at least the
ninetieth percentile of equity to value, suggesting both that ETV in 1991 is a good measure for the total amount of credit
that was unlocked across the buckets and that ETV did not vary dramatically across wealth.
30
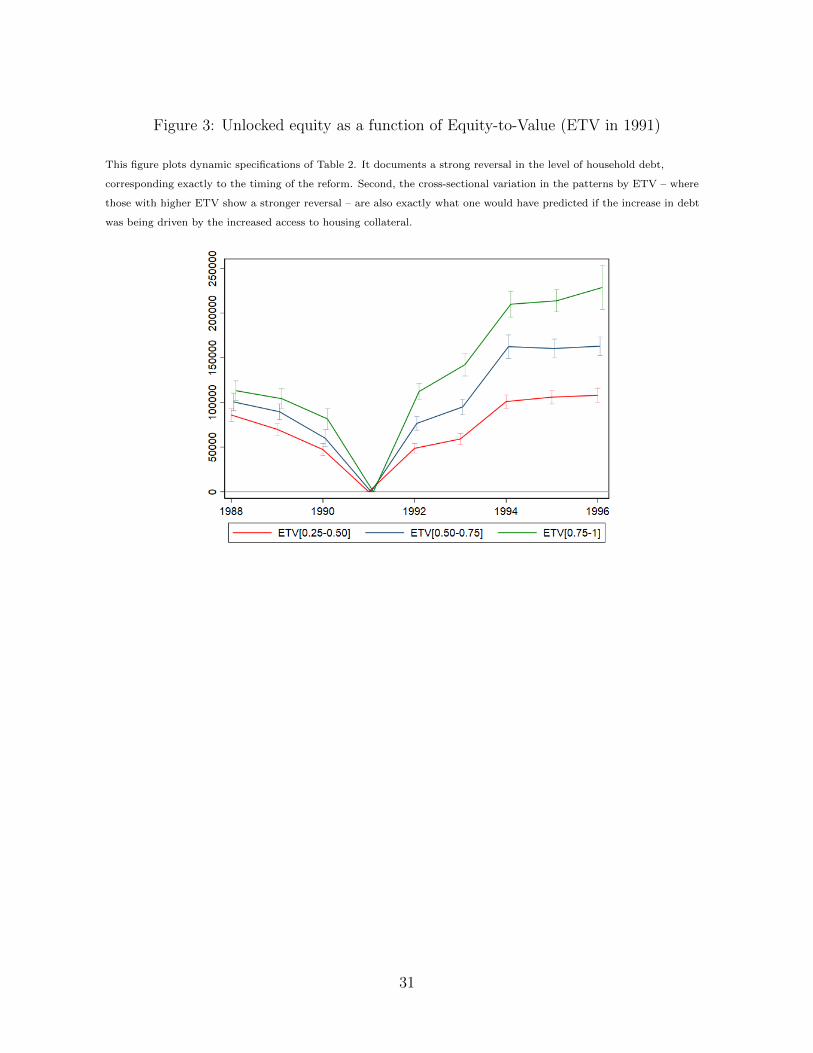
Figure 3: Unlocked equity as a function of Equity-to-Value (ETV in 1991)
This figure plots dynamic specifications of Table 2. It documents a strong reversal in the level of household debt,
corresponding exactly to the timing of the reform. Second, the cross-sectional variation in the patterns by ETV – where
those with higher ETV show a stronger reversal – are also exactly what one would have predicted if the increase in debt
was being driven by the increased access to housing collateral.
31

Fig
ure
4:C
apit
alIn
tensi
tyby
Indust
ry
Th
isF
igu
red
epic
tsth
eca
pit
al
inte
nsi
tyfo
ra
sub
set
of
the
111
ind
ust
ries
inou
ran
aly
sis
that
are
part
of
the
main
1d
igit
SIC
ind
ust
ries
.In
du
stri
esth
at
are
ab
ove
the
med
ian
acc
ord
ing
toth
ism
easu
reare
class
ified
as
bei
ng
more
dep
end
ent
on
exte
rnal
fin
an
ce.
As
seen
inth
efi
gu
re,
vari
ati
on
ind
epen
den
ceon
exte
rnal
fin
an
ceex
ists
both
acr
oss
bro
ad
ind
ust
rycl
ass
ifica
tion
sb
ut
als
ow
ith
inin
du
stry
class
ifica
tion
s,so
conti
nu
esto
be
iden
tifi
edw
hen
incl
ud
ing
the
bro
ad
erin
du
stry
-by-y
ear
fixed
effec
ts.
In
un
rep
ort
edan
aly
ses,
we
als
ofi
nd
ap
osi
tive
corr
esp
on
den
ceto
asi
milar
mea
sure
con
stru
cted
usi
ng
the
Su
rvey
of
Sm
all
Bu
sin
ess
Fin
an
ces
inth
eU
S.
32

Figure 5: Relative increase in treated group’s entry
This figure graphs the point estimate and ninety-five percent confidence intervals from dynamic estimations corresponding
to column 2 of Table 3, where we report year-by-year effects relative to 1991.
33

Figure 6: Relative increase in treated group’s entry for those with and without priorexperience in the startup’s industry
This figure graphs the point estimate and ninety-five percent confidence intervals from dynamic estimations corresponding
to columns (1) and (3) of Table 4, where we report year-by-year effects relative to 1991.
Figure 7: Relative increase in group receiving the highest level of treatment for those withand without prior experience in the startup’s industry
This figure graphs the point estimate and ninety-five percent confidence intervals from dynamic estimations corresponding
to the highest ETV bucket of the estimations documented in columns (2) and (4) of Table 4, where we report year-by-year
effects relative to 1991.
34

Tab
le1:
Sum
mar
ySta
tist
ics
Th
ista
ble
pre
sents
des
crip
tive
stati
stic
sfo
rth
e303,4
31
ind
ivid
uals
inou
rsa
mp
leb
ase
don
wh
eth
erth
eyw
ere
the
trea
ted
or
contr
ol
gro
up
in1991.
The
trea
ted
gro
up
com
pri
ses
ind
ivid
uals
wh
ose
equ
ity-t
o-v
alu
e(E
TV
)in
1991
was
bet
wee
n0.2
5an
d1,
an
dis
furt
her
bro
ken
dow
nin
toth
ree
equ
al
bu
cket
sof
ET
V.
Th
eco
ntr
ol
gro
up
are
those
wh
ose
ET
Vin
1991
was
less
than
0.2
5.
Hou
sin
gass
ets
refe
rto
the
tax
ass
esse
dvalu
ati
on
of
the
ind
ivid
ual’s
pro
per
tysc
ale
dw
ith
the
rati
oof
mark
etp
rice
sto
tax
ass
esse
dh
ou
sevalu
esfo
rhou
ses
that
have
bee
ntr
ad
edin
that
mun
icip
ality
an
dyea
r.L
iqu
id,
non
hou
sin
gass
ets
com
pri
seth
ein
div
idu
al’s
oth
erfi
nan
cial
ass
ets
such
as
stock
s,b
on
ds
an
db
an
kd
eposi
ts.
All
vari
ab
les
are
mea
sure
das
of
1991,
the
yea
rb
efore
the
refo
rm.
Total
[0‐0.25]
[0.25‐0.5]
[0.5‐0.75]
[0.75‐1]
Average year of h
ouse purchase
1982
1985
1981
1977
1978
Age
38.7
36.4
40.0
43.0
42.4
Female=1
0.51
0.49
0.51
0.54
0.57
Partne
r=1
0.88
0.87
0.89
0.92
0.86
Kids=1
0.64
0.66
0.66
0.61
0.53
Educ, V
ocational,
0.47
0.47
0.47
0.49
0.46
Educ, B
Sc0.15
0.15
0.14
0.14
0.13
Educ, M
Sc, PhD
0.05
0.06
0.04
0.04
0.04
Hou
sing assets, tDK
K770,560
733,381
844,544
879,324
704,639
Liqu
id (n
on‐hou
sing) assets, tD
KK138,667
112,417
116,119
162,561
274,567
Average de
bt in
1991, tD
KK572,068
727,594
500,796
359,039
180,553
Prob
ability of transition
ing to entrepren
eurship in 1991
0.0058
0.0063
0.0058
0.0052
0.0044
Observatio
ns303,431
170,632
56,578
41,103
35,118
35

Table 2: The impact of unlocked collateral on household debt (in DKK)
Notes: This table reports estimates from OLS regressions, where the dependent variable is level of debt measured in
constant 1991 DKK. The main RHS variables are indicators corresponding to different buckets for an individual’s home
equity as a share of home value (ETV), measured before the reform in 1991 and these indicators interacted with an
indicator for the post mortgage reform period (1992-1996). All columns include year fixed effects interacted with fixed
effects for the individual’s age (fixed effect for each year from 25-50), educational background (4 categories), gender,
marital status, number of children and household wealth (fixed effect for the decile of household wealth). Columns (2) and
(4) also include municipality-by-year fixed effects. Standard errors are clustered at the individual level and are reported in
parentheses. *, **, *** indicate statistically different from zero at 5%, 1% and 0.1% level respectively.
(1) (2) (3) (4)
[ETV91 > 0.25] x POST 62,204*** 62,046***(2,224) (2,175)
[ETV91 > 0.25] ‐322,744*** ‐315,122***(2,208) (2,145)
ETV91 [0.25‐0.50] x POST 33,954*** 33,810***(2,403) (2,399)
ETV91 [0.50‐0.75] x POST 69,055*** 69,035***(3,017) (2,987)
ETV91 [0.75‐1.00] x POST 106,523*** 106,275***(4,831) (4,774)
ETV91 [0.25‐0.50] ‐200,888*** ‐193,746***(2,378) (2,321)
ETV91 [0.50‐0.75] ‐359,670*** ‐355,504***(3,176) (3,092)
ETV91 [0.75‐1.00] ‐506,276*** ‐494,285***(4,077) (4,048)
Constant 654,605*** 651,304*** 657,691*** 654,437***(1,288) (1,219) (1,288) (1,218)
Observations 2,708,892 2,708,892 2,708,892 2,708,892
Birth cohort X Year FE YES YES YES YESIndividual covariates x Year FE YES YES YES YESMunicipality x Year FE NO YES NO YES
36

Table 3: The impact of unlocked collateral on Entrepreneurship
Notes: This table reports estimates from OLS regressions, where the dependent variable is an indicator that takes a value
1 if the individual was not classified as an entrepreneur in t− 1 but was classified as an entrepreneur in year t . The main
RHS variables are indicators corresponding to different buckets for an individual’s home equity as a share of home value
(ETV), measured before the reform in 1991 and these indicators interacted with an indicator for the post mortgage reform
period (1992-1996). All columns include year fixed effects interacted with fixed effects for the individual’s age (fixed effect
for each year from 25-50), educational background (4 categories), gender, marital status, number of children and
household wealth (fixed effect for the decile of household wealth). Columns (2) and (4) also include municipality-by-year
fixed effects and industry-by-year fixed effects. Standard errors are clustered at the individual level and are reported in
parentheses. *, **, *** indicate statistically different from zero at 5%, 1% and 0.1% level respectively.
(1) (2) (3) (4)
[ETV91 > 0.25] x POST 0.00065*** 0.00061**(0.00019) (0.00019)
[ETV91 > 0.25] ‐0.00142*** ‐0.00148***(0.00015) (0.00015)
ETV91 [0.25‐0.50] x POST 0.00039 0.00034(0.00023) (0.00023)
ETV91 [0.50‐0.75] x POST 0.00046 0.00049(0.00026) (0.00026)
ETV91 [0.75‐1.00] x POST 0.00134*** 0.00126***(0.00029) (0.00030)
ETV91 [0.25‐0.50] ‐0.00117*** ‐0.00120***(0.00019) (0.00018)
ETV91 [0.50‐0.75] ‐0.00201*** ‐0.00204***(0.00021) (0.00021)
ETV91 [0.75‐1.00] ‐0.00119*** ‐0.00137***(0.00023) (0.00023)
Constant 0.00586*** 0.00590*** 0.00587*** 0.00591***(0.00007) (0.00007) (0.00007) (0.00007)
Observations 2,708,892 2,708,892 2,708,892 2,708,892Birth cohort X Year FE YES YES YES YESIndividual covariates x Year FE YES YES YES YESIndustry x Year FE NO YES NO YESMunicipality x Year FE NO YES NO YES
37

Table 4: Entry into industries with prior experience vs. no prior experience
Notes: This table reports estimates from OLS regressions, where the dependent variable is an indicator that takes a value
of 1 if the individual was not classified as an entrepreneur in t− 1 but was classified as an entrepreneur in year t, entering
an industry where they either had, or did not have prior experience. The main RHS variables are indicators corresponding
to different buckets for an individual’s home equity as a share of home value (ETV), measured before the reform in 1991
and these indicators interacted with an indicator for the post mortgage reform period (1992-1996). All columns include
year fixed effects interacted with fixed effects for the individual’s age (fixed effect for each year from 25-50), educational
background (4 categories), gender, marital status, number of children and household wealth (fixed effect for the decile of
household wealth), as well as municipality-by-year fixed effects and industry-by-year fixed effects. The β1 coefficients from
equation (1) are included in all specifications and reported as controls so as to focus on the key coefficients of interest.
Standard errors are clustered at the individual level and are reported in parentheses. *, **, *** indicate statistically
different from zero at 5%, 1% and 0.1% level respectively.
(1) (2) (3) (4)
[ETV91 > 0.25] x POST ‐0.00001 0.00062***(0.00014) (0.00014)
ETV91 [0.25‐0.50] x POST 0.00010 0.00024(0.00017) (0.00016)
ETV91 [0.50‐0.75] x POST ‐0.00015 0.00064***(0.00019) (0.00018)
ETV91 [0.75‐1.00] x POST ‐0.00003 0.00129***(0.00021) (0.00021)
Constant 0.00299*** 0.00299*** 0.00291*** 0.00291***(0.00005) (0.00005) (0.00005) (0.00005)
Observations 2,708,892 2,708,892 2,708,892 2,708,892Control for ETV Main effect YES YES YES YESBirth cohort X Year FE YES YES YES YESIndividual covariates x Year FE YES YES YES YESIndustry x Year FE YES YES YES YESMunicipality x Year FE YES YES YES YES
Prior experience in entering
industry
No prior experience in entering
industry
38

Tab
le5:
Entr
yin
toin
dust
ries
by
capit
alin
tensi
tyan
dpri
orex
per
ience
Note
s:T
his
tab
lere
port
ses
tim
ate
sfr
om
OL
Sre
gre
ssio
ns,
wh
ere
the
dep
end
ent
vari
ab
leis
an
ind
icato
rth
at
takes
avalu
eof
1if
the
ind
ivid
ual
was
not
class
ified
as
an
entr
epre
neu
rint−
1b
ut
was
class
ified
as
an
entr
epre
neu
rin
yea
rt,
ente
rin
gan
ind
ust
ryw
her
eth
eyei
ther
had
,or
did
not
have
pri
or
exp
erie
nce
as
wel
las
wh
eth
erit
was
am
ore
or
less
cap
ital
inte
nsi
ve
ind
ust
ry.
Ple
ase
see
Tab
le4
for
det
ails
on
contr
ols
an
dfi
xed
effec
ts.
(1)
(2)
(3)
(4)
(5)
(6)
(7)
(8)
[ETV
91 > 0.25] x POST
0.00
001
‐0.000
010.00
044***
0.00
018
(0.000
09)
(0.000
10)
(0.000
10)
(0.000
10)
ETV9
1 [0.25‐0.50
] x POST
0.00
005
0.00
005
0.00
024*
0.00
001
(0.000
11)
(0.000
13)
(0.000
11)
(0.000
12)
ETV9
1 [0.50‐0.75
] x POST
‐0.000
03‐0.000
110.00
035**
0.00
030*
(0.000
13)
(0.000
14)
(0.000
13)
(0.000
13)
ETV9
1 [0.75‐1.00
] x POST
‐0.000
040.00
001
0.00
093***
0.00
035**
(0.000
15)
(0.000
15)
(0.000
17)
(0.000
13)
Constant
0.00
120***
0.00
120***
0.00
178***
0.00
179***
0.00
140***
0.00
139***
0.00
152***
0.00
152***
(0.000
03)
(0.000
03)
(0.000
04)
(0.000
04)
(0.000
03)
(0.000
03)
(0.000
04)
(0.000
04)
Observatio
ns2,70
8,89
22,70
8,89
22,70
8,89
22,70
8,89
22,70
8,89
22,70
8,89
22,70
8,89
22,70
8,89
2Co
ntrol for ETV
Main effect
YES
YES
YES
YES
YES
YES
YES
YES
Birth coho
rt X Year F
EYES
YES
YES
YES
YES
YES
YES
YES
Individu
al covariates x
Year F
EYES
YES
YES
YES
YES
YES
YES
YES
Indu
stry x Year F
EYES
YES
YES
YES
YES
YES
YES
YES
Mun
icipality
x Year F
EYES
YES
YES
YES
YES
YES
YES
YES
Prior experience in entering industry
No prior experience in entering industry
More Capital Intensive
Industries
Less Capital Intensive
Industries
More Capital Intensive
Industries
Less Capital Intensive Industries
Table 6: Entry into indu
strie
s by capital inten
sity and prior e
xperience
39

Table 6: Pre-Entry income rank of Entrepreneurs
Notes: This table reports estimates from OLS regressions, where the dependent variable is an interaction between an
indicator that takes a value of 1 if the individual is classified as being an entrant in Table 4 and their income rank in the
year prior to entry. Higher income is coded as having a higher income rank, so that a positive coefficient implies that
marginal entrants benefiting from the reform had higher income in the year prior to their entry. Please see Table 4 for
details on controls and fixed effects.
(1) (2) (3) (4)
[ETV91 > 0.25] x POST ‐0.0044 0.0360***(0.0092) (0.0096)
ETV91 [0.25‐0.50] x POST 0.0020 0.0135(0.0114) (0.0115)
ETV91 [0.50‐0.75] x POST ‐0.0146 0.0299*(0.0127) (0.0129)
ETV91 [0.75‐1.00] x POST ‐0.0045 0.0846***(0.0143) (0.0149)
Constant 0.1794*** 0.1796*** 0.1857*** 0.1858***(0.0033) (0.0033) (0.0035) (0.0035)
Observations 2,708,892 2,708,892 2,708,892 2,708,892Control for ETV Main effect YES YES YES YESBirth cohort X Year FE YES YES YES YESIndividual covariates x Year FE YES YES YES YESIndustry x Year FE YES YES YES YESMunicipality x Year FE YES YES YES YES
Prior experience in entering
industry
No prior experience in entering
industry
40

Table 7: Entrants that survive at least 3 years from founding
Notes: This table reports estimates from OLS regressions, where the dependent variable is an indicator that takes a value
of 1 if the individual classified as being an entrant in Table 4 remained an entrepreneur for at least 3 years following entry.
Please see Table 4 for details on controls and fixed effects.
(1) (2) (3) (4)
[ETV91 > 0.25] x POST ‐0.00008 0.00028**(0.00008) (0.00007)
ETV91 [0.25‐0.50] x POST ‐0.00011 0.00004(0.00010) (0.00008)
ETV91 [0.50‐0.75] x POST ‐0.00013 0.00036***(0.00010) (0.00009)
ETV91 [0.75‐1.00] x POST 0.00002 0.00062***(0.00011) (0.00012)
Constant 0.00157*** 0.00157*** 0.00168*** 0.00168***(0.00003) (0.00003) (0.00002) (0.00002)
Observations 2,708,892 2,708,892 2,708,892 2,708,892Control for ETV Main effect YES YES YES YESBirth cohort X Year FE YES YES YES YESIndividual covariates x Year FE YES YES YES YESIndustry x Year FE YES YES YES YESMunicipality x Year FE YES YES YES YES
Prior experience in entering
industry
No prior experience in entering
industry
41

Appendix
Financing Constraints, Home Equity and Selection
into Entrepreneurship
1

Tab
leA
.1:
Ave
rage
equit
y-t
o-va
lue
in19
91fo
rhom
eow
ner
s,bas
edon
age
and
year
ofla
stm
ove
Th
ista
ble
show
sth
em
ean
equ
ity
tovalu
ein
1991,
by
age
of
ind
ivid
ual
an
dth
eyea
rof
hou
sep
urc
hase
.It
show
sth
at
the
level
of
equ
ity
ism
uch
more
stab
leacr
oss
row
s
than
wit
hin
colu
mn
s.W
hile
age,
wh
ich
pro
xie
sfo
rlife
cycl
efa
ctors
that
wou
ldim
pact
the
tim
ing
of
the
hom
ep
urc
hase
,is
clea
rly
imp
ort
ant,
ther
eis
sign
ifica
nt
vari
ati
on
inavailab
leeq
uit
yw
ith
inage
bu
cket
s,w
hic
hin
turn
isst
ron
gly
corr
elate
dw
ith
the
yea
rin
wh
ich
the
hou
sew
as
bou
ght.
Th
ose
wh
ob
ou
ght
thei
rh
om
eaft
er1984
ten
dto
have
less
than
25%
of
thei
rh
ou
sin
geq
uit
yavailab
leto
dra
won
,w
hile
those
wh
ob
ou
ght
thei
rh
ou
ses
earl
ier
ten
dto
have
mu
chgre
ate
rh
ou
sin
geq
uit
yavailab
leto
borr
ow
again
st.
Th
isp
lau
sib
lyex
ogen
ou
svari
ati
on
inth
eti
min
gof
hou
sep
urc
hase
by
som
eyea
rsre
lati
ve
toth
ere
form
isth
ekey
sou
rce
of
vari
ati
on
use
din
the
iden
tifi
cati
on
stra
tegy.
2526
2728
2930
3132
3334
3536
3738
3940
4142
4344
4546
4748
4950
1970
or b
efor
e0.
620.
620.
620.
620.
650.
650.
650.
660.
670.
6919
710.
590.
620.
630.
620.
610.
620.
620.
640.
650.
6819
720.
580.
630.
590.
590.
600.
610.
590.
610.
600.
630.
620.
6419
730.
590.
570.
580.
570.
560.
570.
570.
600.
590.
610.
610.
630.
6419
740.
560.
540.
520.
560.
550.
560.
560.
550.
570.
590.
580.
580.
610.
6219
750.
480.
490.
470.
500.
500.
490.
500.
510.
520.
550.
530.
550.
560.
560.
5819
760.
430.
450.
410.
430.
450.
440.
460.
460.
490.
500.
480.
500.
510.
510.
540.
5419
770.
390.
380.
410.
390.
420.
410.
440.
450.
450.
470.
470.
470.
490.
490.
520.
530.
5319
780.
360.
380.
340.
360.
370.
400.
370.
390.
380.
400.
410.
420.
440.
430.
440.
450.
470.
480.
5019
790.
310.
300.
320.
310.
310.
310.
310.
350.
350.
360.
340.
340.
350.
370.
380.
380.
380.
410.
430.
4519
800.
340.
340.
310.
280.
300.
290.
290.
280.
320.
300.
310.
320.
330.
330.
360.
340.
360.
350.
390.
410.
3819
810.
220.
280.
250.
290.
280.
290.
290.
300.
290.
300.
330.
320.
360.
360.
320.
340.
370.
380.
370.
400.
390.
4119
820.
220.
260.
260.
230.
250.
250.
260.
290.
270.
280.
260.
280.
290.
290.
290.
310.
310.
300.
310.
310.
330.
340.
3519
830.
240.
220.
230.
210.
220.
220.
220.
230.
230.
230.
230.
240.
220.
250.
260.
240.
270.
260.
260.
270.
260.
290.
300.
3119
840.
210.
160.
170.
180.
150.
160.
160.
140.
170.
160.
150.
180.
180.
190.
170.
180.
170.
190.
180.
180.
200.
210.
220.
210.
2219
850.
180.
170.
160.
140.
150.
150.
140.
140.
150.
150.
140.
140.
170.
160.
160.
150.
160.
160.
170.
180.
210.
170.
200.
210.
210.
2319
860.
140.
130.
130.
130.
120.
120.
120.
120.
110.
120.
130.
130.
130.
130.
140.
130.
140.
140.
150.
160.
160.
170.
190.
180.
200.
2119
870.
140.
120.
120.
120.
120.
120.
120.
120.
130.
130.
120.
140.
140.
140.
150.
150.
150.
150.
150.
180.
160.
180.
200.
220.
210.
2019
880.
120.
130.
110.
120.
120.
120.
130.
140.
120.
130.
140.
130.
150.
150.
140.
150.
150.
170.
170.
170.
190.
200.
180.
180.
220.
2319
890.
130.
130.
130.
130.
140.
140.
140.
130.
140.
130.
130.
150.
160.
160.
170.
150.
180.
190.
170.
180.
210.
190.
200.
210.
210.
2319
900.
150.
140.
150.
150.
140.
160.
150.
150.
160.
170.
160.
170.
160.
160.
160.
190.
190.
190.
190.
200.
220.
210.
220.
260.
240.
26
Yea
r of
hous
e pu
rcha
se
Age
in 1
991
2

Table A.2: Share of households with large increases in debt
Notes: This table examines how much of the average increase in debt was driven by a small number of very large increases
in debt.
(1) (2) (3) (4)
[ETV91 > 0.25] x POST 0.06553*** 0.01699***(0.00114) (0.00057)
[ETV91 > 0.25] 0.00272*** 0.00011(0.00075) (0.00035)
ETV91 [0.25‐0.50] x POST 0.03675*** 0.01060***(0.00137) (0.00060)
ETV91 [0.50‐0.75] x POST 0.08035*** 0.01795***(0.00167) (0.00073)
ETV91 [0.75‐1.00] x POST 0.10208*** 0.02776***(0.00196) (0.00115)
ETV91 [0.25‐0.50] 0.00641*** ‐0.00362***(0.00090) (0.00036)
ETV91 [0.50‐0.75] ‐0.00673*** ‐0.00606***(0.00107) (0.00043)
ETV91 [0.75‐1.00] 0.00666*** 0.01410***(0.00129) (0.00073)
Constant 0.09288*** 0.09254*** 0.01776*** 0.01757***(0.00038) (0.00038) (0.00017) (0.00018)
Observations 2,708,892 2,708,892 2,708,892 2,708,892Birth cohort X Year FE YES YES YES YESIndividual covariates x Year FE YES YES YES YESMunicipality x Year FE NO YES NO YES
Increase in Debt is Greater than
150,000 DKK
Increase in Debt is Greater than
500,000 DKK
3

Table A.3: Increase in Household Debt using a continuous measure of Equity to Value
Notes: This table documents the robustness of results of reported in Table 2 to imposing a linear relationship between
equity to value and changes in household debt. Please see Table 2 for details on controls and fixed effects.
(1) (2)
ETV91 in 1991 x POST 127,636*** 127,305***(4,548) (4,456)
ETV in 1991 ‐626,560*** ‐613,375***(4,059) (3,983)
Constant 689,636*** 685,862***(1,404) (1,333)
Observations 2,708,892 2,708,892
Birth cohort X Year FE YES YESIndividual covariates x Year FE YES YESMunicipality x Year FE NO YES
4

Tab
leA
.4:
Entr
yin
Entr
epre
neu
rship
usi
ng
aco
nti
nuou
sm
easu
reof
Equit
yto
Val
ue
Note
s:T
his
tab
led
ocu
men
tsth
ero
bu
stn
ess
of
resu
lts
of
rep
ort
edin
Tab
les
3an
d4
toim
posi
ng
alin
ear
rela
tion
ship
bet
wee
neq
uit
yto
valu
ean
dch
an
ges
inh
ou
seh
old
deb
t.P
lease
see
Tab
les
3an
d4
for
det
ails
on
contr
ols
an
dfi
xed
effec
ts.
(1)
(2)
(3)
Prior experience in entering
industry
No prior experience in
entering industry
ETV9
1 in 199
1 x PO
ST0.00
131***
‐0.000
070.00
138***
(0.000
32)
(0.000
23)
(0.000
23)
ETV in 199
1‐0.002
16***
‐0.000
62***
‐0.001
54***
(0.000
25)
(0.000
18)
(0.000
17)
Constant
0.00
582***
0.00
296***
0.00
285***
(0.000
08)
(0.000
05)
(0.000
05)
Observatio
ns2,70
8,89
22,70
8,89
22,70
8,89
2Birth coho
rt X Year F
EYES
YES
YES
Individu
al covariates x
Year F
EYES
YES
YES
Indu
stry x Year F
EYES
YES
YES
Mun
icipality
x Year F
EYES
YES
YES
5

Tab
leA
.5:
Entr
yre
gres
sion
sw
ith
Indiv
idual
Fix
edE
ffec
ts
Note
s:T
his
tab
lesh
ow
sth
at
the
resu
lts
note
din
Tab
les
3an
d4
are
un
chan
ged
wh
enin
clu
din
gin
div
idu
al
fixed
effec
ts
(1)
(2)
(3)
(4)
(5)
(6)
ETV9
1 in 199
1 x PO
ST0.00
061**
‐0.000
010.00
062***
(0.000
19)
(0.000
14)
(0.000
14)
ETV9
1 [0.25‐0.50
] x POST
0.00
034
0.00
010
0.00
024
(0.000
23)
(0.000
17)
(0.000
16)
ETV9
1 [0.50‐0.75
] x POST
0.00
049
‐0.000
150.00
064***
(0.000
26)
(0.000
19)
(0.000
18)
ETV9
1 [0.75‐1.00
] x POST
0.00
126***
‐0.000
030.00
129***
(0.000
30)
(0.000
21)
(0.000
21)
Constant
Observatio
ns2,70
8,89
22,70
8,89
22,70
8,89
22,70
8,89
22,70
8,89
22,70
8,89
2Birth coho
rt X Year F
EYES
YES
YES
YES
YES
YES
Individu
al covariates x
Year F
EYES
YES
YES
YES
YES
YES
Indu
stry x Year F
EYES
YES
YES
YES
YES
YES
Mun
icipality
x Year F
EYES
YES
YES
YES
YES
YES
Individu
al Fixed
Effe
cts
YES
YES
YES
YES
YES
YES
Prior e
xperience in entering indu
stry
No prior e
xperience in entering indu
stry
Table 3 with individual fixed
effects
Table 4 with individual fixed
effects
6

![DEMB Working Paper Series N. 71merlino.unimo.it/campusone/web_dep/wpdemb/0071.pdf · [ 1 ] DEMB Working Paper Series . N. 71 . L'informatizzazione delle procedure per la ricostruzione:](https://img.pdfslide.tips/doc/110x75/5e1f35682dd6a5032656f5c6/demb-working-paper-series-n-1-demb-working-paper-series-n-71-linformatizzazione.jpg)