Embed Size (px)
Citation preview

Age Pension Age Eligibility, Retirement and Health Outcomes in Australia*
NILS working paper series No 201
Kostas Mavromaras Sue Richardson
Rong Zhu
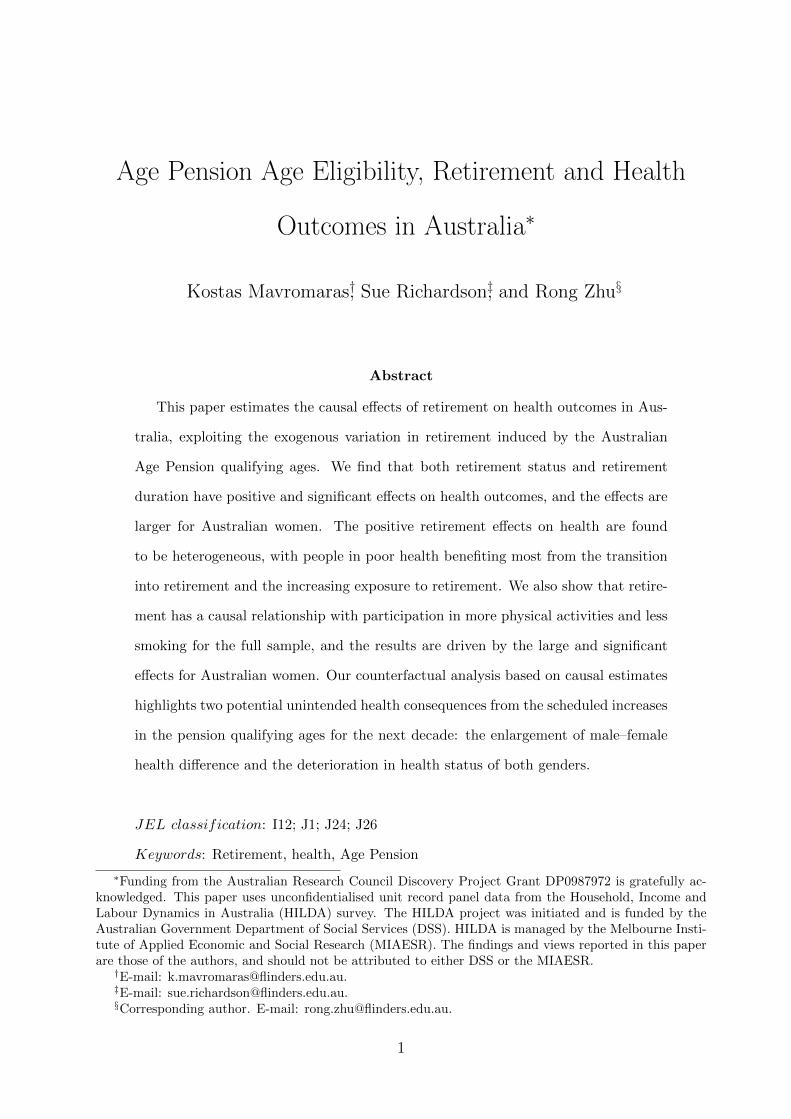
Age Pension Age Eligibility, Retirement and Health
Outcomes in Australia∗
Kostas Mavromaras†, Sue Richardson‡, and Rong Zhu§
Abstract
This paper estimates the causal effects of retirement on health outcomes in Aus-
tralia, exploiting the exogenous variation in retirement induced by the Australian
Age Pension qualifying ages. We find that both retirement status and retirement
duration have positive and significant effects on health outcomes, and the effects are
larger for Australian women. The positive retirement effects on health are found
to be heterogeneous, with people in poor health benefiting most from the transition
into retirement and the increasing exposure to retirement. We also show that retire-
ment has a causal relationship with participation in more physical activities and less
smoking for the full sample, and the results are driven by the large and significant
effects for Australian women. Our counterfactual analysis based on causal estimates
highlights two potential unintended health consequences from the scheduled increases
in the pension qualifying ages for the next decade: the enlargement of male–female
health difference and the deterioration in health status of both genders.
JEL classification: I12; J1; J24; J26
Keywords: Retirement, health, Age Pension
∗Funding from the Australian Research Council Discovery Project Grant DP0987972 is gratefully ac-knowledged. This paper uses unconfidentialised unit record panel data from the Household, Income andLabour Dynamics in Australia (HILDA) survey. The HILDA project was initiated and is funded by theAustralian Government Department of Social Services (DSS). HILDA is managed by the Melbourne Insti-tute of Applied Economic and Social Research (MIAESR). The findings and views reported in this paperare those of the authors, and should not be attributed to either DSS or the MIAESR.†E-mail: [email protected].‡E-mail: [email protected].§Corresponding author. E-mail: [email protected].
1

1 Introduction
The last decade has witnessed a growing literature examining the causal effects of re-
tirement on health outcomes. As an important change in lifestyle, retirement can exert
positive influence on people’s health through reduced stress and increased enjoyment of
life, however, the reduction in physical–related activities and the loss of social interactions
associated with retirement can also lead to negative health consequences. Understanding
the net and causal effects of retirement on health is important under the background of
worldwide prolonged life expectancy and increasing population ageing. To alleviate from
the burgeoning financial burden on the sustainability of social security systems, many de-
veloped countries have already started or will start raising the statutory state pension
eligibility age with the intention to induce postponed retirement (Hering and Klassen,
2010).1 For example, the Australian Age Pension eligibility age for women has increased
from 60 in 1995 at the rate of six months every two years during the past decade, reaching
the constant eligibility age of 65 for males in 2014. From 2017, the pension qualifying age
for the two genders will start rising again from 65 years old by six months every two years
until reaching 67 years of age in 2023. The success of such policies in reducing government
expenditures on social security programs partially depends on the potential health effects
of delayed retirement. If postponed retirement leads to deteriorations in population health,
the alleviation of government financial stress from reduced pension expenditures can be
offset by the increase in health care spending.
Establishing the causal links between retirement and health is of significance for pol-
icy concerns such as postponing retirement ages, however, the identification is confronted
1Countries planning to increase pension ages in the next one or two decades include (but are notlimited to): the United States, the United Kingdom, Denmark, the Netherlands, Germany, France, Spainand Australia. In the US, the normal retirement age will increase from 65 by two–month increment untilreaching 67 years of age in 2025; In the UK, the age at which old people can claim state pension benefitshas been 65 for men and 60 for women. The retirement age for women is to be increased gradually andequaled to the retirement age for men in 2018. The pension age will further rise to 67 for both men andwomen in 2026. In Denmark, the normal pension age is currently 65 but will be increased at the rate of sixmonths per year to age 67 in the period 2024–2027; In the Netherlands, the normal retirement age is 65,and it will increase gradually to 67 years of age in 2025; In Germany, the retirement age is to be increasedgradually from 65 and reach 67 years in 2029; In France, the normal retirement age is to be increasedgradually from 65 to 67 years old during 2016–2024; And in Spain, the statutory pension age will increasefrom 65 to 67 during 2013–2024. See Hering and Klassen (2010) for details.
2

with several difficulties: first, the selection into retirement is not a random process; sec-
ond, unobserved individual heterogeneity and time–varying confounding factors can affect
both retirement decisions and health outcomes; and finally, as documented in the existing
literature, a reverse causality problem can exist in the sense that individual health may
have direct impacts on retirement decisions, where in many cases economic inactivity is
triggered by poor health (Bound et al., 1999; Disney et al., 2006). The endogeneity issue
of retirement resulting from these confounding factors implies that the causality from re-
tirement to health cannot be easily established using methods like ordinary least squares
estimations or fixed effect panel estimations.2
A recent development in the literature convincingly exploits the key retirement ages
induced by social security benefits to estimate the causal effects of retirement on health.
For example, in the United Kingdom, a significant portion of retirement income become
available at age 65 for men and 60 for women (Bound and Waidmann, 2007). In the United
State, age 62 is the earliest age at which people can receive social security retirement
benefits and age 65 is the age at which retired people can claim full social security benefits
(Bonsang et al., 2012). The variations in retirement induced by social security benefits are
credibly exogenous, and have been used to identify the causal health effects of retirement.
Using the second wave of the English Longitudinal Study of Aging (ELSA), Bound and
Waidmann (2007) find that retirement status has a small and positive causal effect on
physical health of men, and the effect is not significant for women. With data from the US
Health and Retirement Survey (HRS), Charles (2004) and Neuman (2008) both find that
being retired preserves subjective health, while Bonsang et al. (2012) highlight a significant
negative effect of retirement on cognitive functioning. A few other studies have exploited
cross–country differences in the eligibility ages for retirement benefits as the exogenous
source of variations in retirement rates in Europe. With data from the Survey of Health,
Ageing and Retirement in Europe (SHARE), Rohwedder and Willis (2010) and Mazzonna
and Peracchi (2012) find that the causal effects of retirement on cognitive functioning are
2For example, with data from the Health and Retirement Survey (HRS), Dave et al. (2008) use fixedeffect panel estimations and find that being retired is associated with a decline in both physical and mentalhealth outcomes in the US, however, this relationship may have an interpretation other than causal effectdue to the reverse causality problem.
3

negative and statistically significant, while Coe and Zamarro (2011) find large and positive
effects of retirement on self–assessed health and a health index constructed using a rich set
of health variables.
This paper aims to contribute to this debated area featuring mixed findings in several
important and novel ways. First, this study is the first to estimate the causal effects of
retirement on physical and mental health outcomes in Australia.3 The existing studies
designed to establish retirement–health causality all use data from surveys like the HRS,
ELSA and SHARE, thus limiting the scope of retirement–health analysis to the US and
Europe. However, population ageing is factually a global issue, and delayed retirement is
the objective of policies scheduled in many countries (Lutz et al., 2008; Hering and Klassen,
2010). This is a debate to which the unique experience of Australia can contribute. As
pointed out by Rohwedder and Willis (2010), “policy variations that affects the timing of
retirement is ideally suited as an instrument, but such variation is rarely found, at least
within a single country, because pension or social security reforms are rare”. The recent
Australian Age Pension reform offers such a rare experiment, where within–country policy
variations affecting retirement timing can be found (among Australian women).4
Exploiting the exogenous variation in retirement decisions induced by the Age Pension
eligibility ages, this paper examines the effects of retirement on health in Australia, and
in contrast with most existing studies, we differentiate between the causal health effects of
retirement status (being retire or not, as a discrete event) and retirement duration (length
of time spent in retirement, as a cumulative process).5 We find that retirement status
has positive and highly significant effects on self–reported health, SF–36 physical and
mental health measures, and the effects are all larger for women than for men in Australia.
The effects of retirement duration are also found to be positive and highly significant for
3The effect of health on labour force participation in Australia has been documented in Cai and Kalb(2006) and Cai (2010), and both studies find that health has a positive and significant impact on people’sdecision to join the workforce in Australia.
4In footnote 1, we mentioned the scheduled increases in pensions ages in the US and European countries.It should be noted that these within–country changes either have not started or have just started, andthis makes Australia’s experience in reforming the Age Pension exceptional.
5The only study that has analyzed the health effects of both retirement status and retirement durationis Bonsang et al. (2012). Other existing studies on the causal health effects either focus solely on retirementstatus (Charles, 2004; Neuman, 2008; Rohwedder and Willis, 2010; Coe and Zamarro, 2011) or retirementduration (Coe et al., 2012; Mazzonna and Peracchi, 2012).
4

Australian women, however, the effects are smaller and much weaker for Australian men.
We also find evidence that the retirement effects are not uniform on different constituents
and aspects of physical and mental health.
Second, we highlight the heterogeneity in the effects of retirement on health. We pay
particular attention to the different effects of retirement status and retirement duration
for people with different health status. More specifically, we examine whether the health
effects of retirement are different for individuals whose health is above or below the median
value of each of the SF–36 health indexes we use. Our analysis novelly reveals substantial
dispersion of the health effects of retirement, and we find that it is mainly the people
with poorer health (namely, whose health is worse than at least 50% of observations) that
experience the strongest health improvement from the transition into retirement status
and increasing exposure to retirement.
Third, we contribute by estimating the economic mechanisms generating the strong
health effects of retirement in Australia. While the health effects of retirement have been
investigated in the existing literature, we provide the novel evidence on whether the inci-
dence and intensity of health–related behaviors such as physical exercising, smoking and
drinking are causally influenced by retirement status and retirement duration. Our anal-
ysis show that retirement has a causal relationship with participation in more physical
activities and less smoking for the full sample, which indicates that these behaviors are the
channels through which the positive and significant effects of retirement on health exist in
Australia. However, the results for the full sample are driven by the large and significant
effects for Australian women. This finding of gender differences in the effects of retirement
on health–related behaviors helps explain why the health effects of retirement are larger
for women than for men.
Finally, two important policy changes in the Australian Age Pension qualifying ages
have been scheduled for the next decade in Australia: (i) from January 2014, the pension
eligibility age requirements are the same for both genders; and (ii) the pension qualifying
ages will start rising from 65 in July 2017 to 67 years of age in July 2023 at the rate of six
months every two years for both genders. We use counterfactual analysis based on causal
5

estimates to provide a direct and quantifiable evaluation of two potentially unintended
health consequences arising from the scheduled increases in the pension qualifying ages
for the next decade: (i) the enlargement of male–female health difference; and (ii) the
deterioration in health status of both genders. In this sense, this study also contributes to
the literature on the gender health differences among old people (Arber and Cooper, 1999;
Pinquart and Sorensen, 2001; Bambra et al., 2009) and the literature on health changes
around retirement ages (Salokangas and Joukamaa, 1991; Orfila et al., 2000; van Solinge,
2007).
The rest of the paper is organized as follows. Section two describes the Age Pension
system in Australia. Section three describes the data and presents summary statistics. The
next section discusses the empirical approach. Section five presents the estimation results.
The last section concludes.
2 Age Pension System in Australia
The Australian system of retirement income support is consisted of three components
(Barrett and Tseng, 2008; Agnew, 2013; Ryan and Whelan, 2013; Atalay and Barrett,
2014): (i) the publicly funded Age Pension; (ii) income from the mandatory employer–
contributed superannuation; and (iii) voluntary private retirement savings.
The eligibility for the Australian Age Pension is subject to three qualifying conditions.6
The first one is a residency condition that requires pension applicants to be a resident
in Australia for at least ten years. The second condition indicates that the Age Pension
is means tested in the sense that income and asset levels can have an effect on pension
eligibility and also on the amount received by a pension beneficiary. Specifically, in terms
of income in 2013, an individual (a couple) is entitled to full pension payment if the income
per fortnight does not exceed $156 ($276 for a couple). Pension benefits are reduced by $0.5
for each dollar above the threshold value. The asses test depends on the status of home
6More details can be found at the website of the Australian Government Department of Human Services:http://www.humanservices.gov.au/customer/services/centrelink/age-pension. Interested readers are re-ferred to Barrett and Tseng (2008) and Agnew (2013) for a comprehensive institutional description of theAustralian retirement system.
6
ownership. For homeowners, the threshold value is $196,750 for singles and $279,000 for
couples, while for non-homeowners, the threshold value is $339,250 for singles and $421,500
for couples. Assets over these amounts reduce the pension benefits by $1.50 per fortnight
for every $1,000 above the amount. In 2013, the maximum benefit payment is $751.70
per fortnight for individuals and $1333.20 for couples. Generally, around 70 percent of the
elderly population in Australia receive some Age Pension benefits, and about two thirds
of recipients receive full pension benefits.
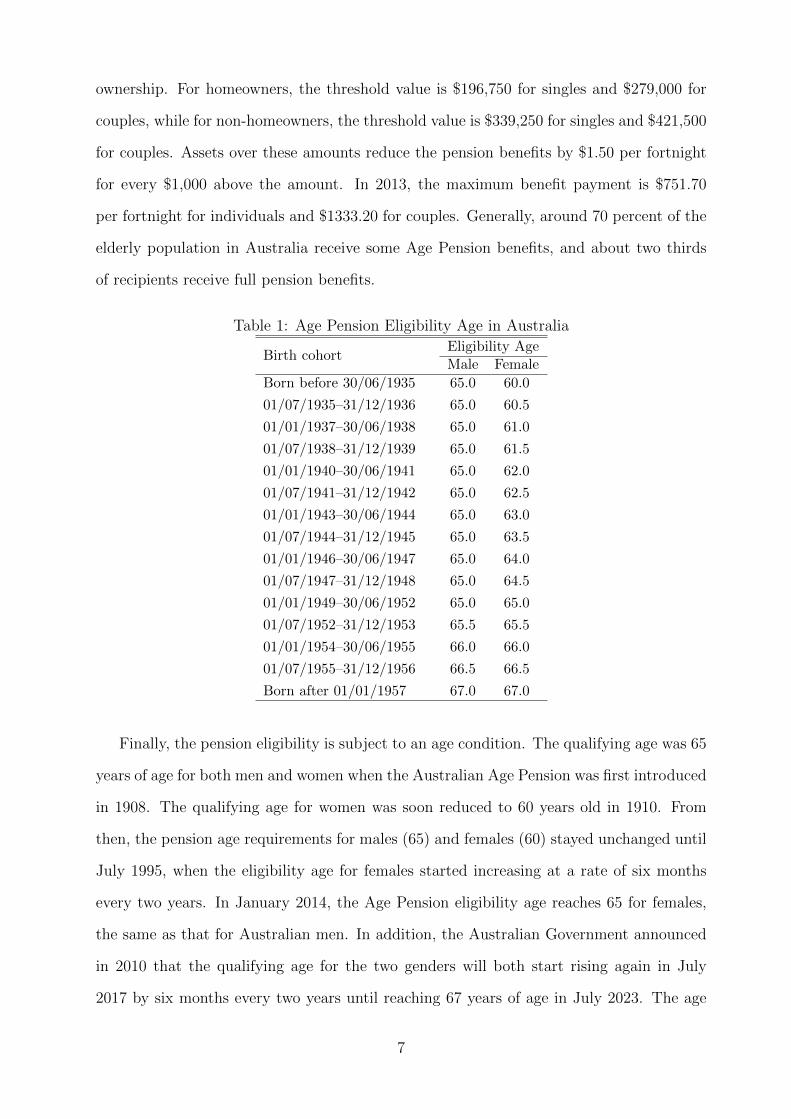
Table 1: Age Pension Eligibility Age in Australia
Birth cohortEligibility AgeMale Female
Born before 30/06/1935 65.0 60.0
01/07/1935–31/12/1936 65.0 60.5
01/01/1937–30/06/1938 65.0 61.0
01/07/1938–31/12/1939 65.0 61.5
01/01/1940–30/06/1941 65.0 62.0
01/07/1941–31/12/1942 65.0 62.5
01/01/1943–30/06/1944 65.0 63.0
01/07/1944–31/12/1945 65.0 63.5
01/01/1946–30/06/1947 65.0 64.0
01/07/1947–31/12/1948 65.0 64.5
01/01/1949–30/06/1952 65.0 65.0
01/07/1952–31/12/1953 65.5 65.5
01/01/1954–30/06/1955 66.0 66.0
01/07/1955–31/12/1956 66.5 66.5
Born after 01/01/1957 67.0 67.0
Finally, the pension eligibility is subject to an age condition. The qualifying age was 65
years of age for both men and women when the Australian Age Pension was first introduced
in 1908. The qualifying age for women was soon reduced to 60 years old in 1910. From
then, the pension age requirements for males (65) and females (60) stayed unchanged until
July 1995, when the eligibility age for females started increasing at a rate of six months
every two years. In January 2014, the Age Pension eligibility age reaches 65 for females,
the same as that for Australian men. In addition, the Australian Government announced
in 2010 that the qualifying age for the two genders will both start rising again in July
2017 by six months every two years until reaching 67 years of age in July 2023. The age
7
qualifying requirements for the Age Pension for relevant birth cohorts are illustrated by
gender in Table 1. In this paper, we exploit the exogenous variation in retirement decisions
induced by the Age Pension eligibility ages, and identify the causal effects of retirement
on the health outcomes of Australians.
3 Data
3.1 The Household, Income and Labour Dynamics in Australia
(HILDA) Survey
For this study, we use the data from the Household, Income and Labour Dynamics in
Australia (HILDA) Survey, which is the first and only large–scale, nationally representative
household panel survey in Australia. Starting from 2001, HILDA collects rich information
on people’s demographics, education, labour market dynamics and health status.7 The first
eleven waves (2001–2011) of the unconfidentialised HILDA are used. The unconfidentialised
data contains the information on the exact date of birth and the date of survey for each
individual, which, together with the Age Pension eligibility ages described in Table 1,
enable us to accurately identify whether an individual has attained the pension qualifying
age at the interview date.
A few sample restrictions are applied to facilitate the analysis. First, we follow Bonsang
et al. (2012) to focus on mature age people aged between 51 and 75. Second, as described in
the previous section, the eligibility for the Age Pension is subject to a residency condition
of living in Australia for at least ten years, so we exclude a few observations that do not
meet the condition. Finally, observations with missing information on core variables used
in this study are dropped. Our final sample is an unbalanced panel consisting of 36,713
observations for 7,269 persons in Australia.
7More detailed description of the survey can be found in Wooden and Watson (2007) and Richardson(2013).
8
3.2 Variables and Descriptive Statistics
Our definition of retirement follows those in French (2005), Bonsang et al. (2012) and
Mazzonna and Peracchi (2012). An individual is defined to be retired if he/she is not in
the labour force.
HILDA contains a rich set of variables measuring individual health status. Respondents
were asked to rate their health on a five–point scale: excellent, very good, good, fair and
poor, based on which, we generate a dummy variable for subjective good health that is
equal to 1 if an individual’s self–assessed health is good, very good or excellent (in contrast
with poor, fair).
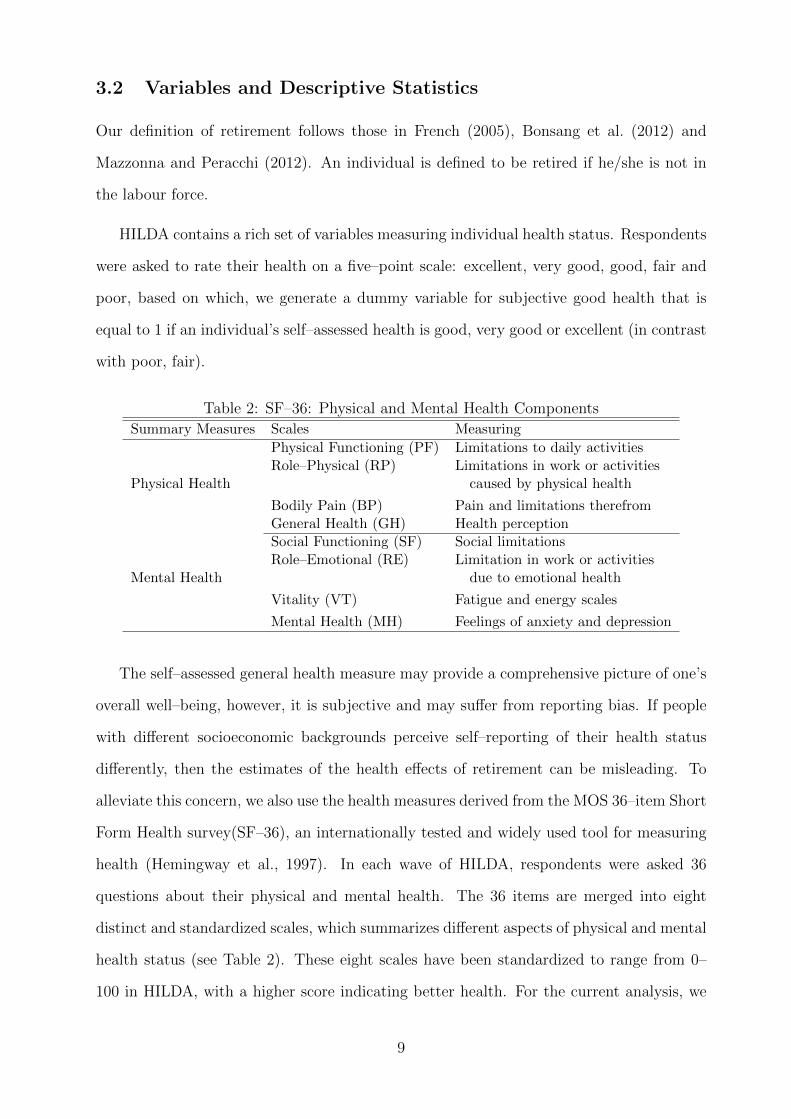
Table 2: SF–36: Physical and Mental Health Components
Summary Measures Scales Measuring
Physical Health
Physical Functioning (PF) Limitations to daily activitiesRole–Physical (RP) Limitations in work or activities
caused by physical health
Bodily Pain (BP) Pain and limitations therefromGeneral Health (GH) Health perception
Mental Health
Social Functioning (SF) Social limitationsRole–Emotional (RE) Limitation in work or activities
due to emotional health
Vitality (VT) Fatigue and energy scales
Mental Health (MH) Feelings of anxiety and depression
The self–assessed general health measure may provide a comprehensive picture of one’s
overall well–being, however, it is subjective and may suffer from reporting bias. If people
with different socioeconomic backgrounds perceive self–reporting of their health status
differently, then the estimates of the health effects of retirement can be misleading. To
alleviate this concern, we also use the health measures derived from the MOS 36–item Short
Form Health survey(SF–36), an internationally tested and widely used tool for measuring
health (Hemingway et al., 1997). In each wave of HILDA, respondents were asked 36
questions about their physical and mental health. The 36 items are merged into eight
distinct and standardized scales, which summarizes different aspects of physical and mental
health status (see Table 2). These eight scales have been standardized to range from 0–
100 in HILDA, with a higher score indicating better health. For the current analysis, we
9

generate a physical health measure for each observation by calculating a simple average
of the four physical health scales: Physical Functioning (PF), Role–Physical (RP), Bodily
Pain (BP) and General Health (GH). A mental health measure is obtained similarly by
calculating the average score of Social Functioning (SF), Role–Emotional (RE), Vitality
(VT) and Mental Health (MH). We also create an overall health variable that summarize
both physical and mental health, by taking the average of all the eight scales.
Table 3: Summary Statistics
All Male FemaleMean SD Mean SD Mean SD
Demographic characteristicsRetired 0.49 0.50 0.42 0.49 0.56 0.50
Age 61.27 6.73 61.31 6.72 61.23 6.74
Age eligible for Age Pension 0.35 0.48 0.31 0.46 0.38 0.49
Schooling 11.67 2.40 11.97 2.38 11.41 2.39
Married 0.74 0.44 0.81 0.40 0.69 0.46
Family size 2.24 1.05 2.37 1.12 2.13 0.97
Health measuresSelf–reported good health 0.76 0.43 0.76 0.43 0.76 0.42
Physical health (SF–36) 69.78 24.00 70.92 23.61 68.73 24.29
Physical Functioning (PF) 76.01 23.88 78.11 23.44 74.09 24.12Role–Physical (RP) 70.90 40.24 72.37 39.59 69.55 40.78Bodily Pain (BP) 67.33 25.39 68.99 24.93 65.80 25.71General Health (GH) 64.87 22.41 64.22 22.21 65.48 22.57
Mental health (SF–36) 75.19 20.26 76.38 19.89 74.10 20.54
Social Functioning (SF) 81.36 24.59 82.49 23.94 80.34 25.12Role–Emotional (RE) 82.32 33.92 83.21 33.29 81.50 34.47Vitality (VT) 61.05 20.33 62.58 19.91 59.65 20.62Mental health (MH) 76.03 17.13 77.25 16.72 74.91 17.43
Overall health (SF–36) 72.48 20.65 73.65 20.43 71.41 20.79
N 36,713 17,527 19,186
Note: Data Source: HILDA 2001–2011.
The summary statistics of demographic characteristics and health measures are pre-
sented separately by gender in Table 3. The overall retirement rate is 49 percent in Aus-
tralia, with the gender–specific rate being 42 percent for males and 56 percent for females.
The average ages for men and women are similar, being slightly over 61 years old. As the
pension eligibility ages are lower for women, the proportion of women (38 percent) meeting
the age requirement of the Age Pension is found to be seven percent higher than that for
men (31 percent). Furthermore. men are slightly better educated, more likely to be mar-
10
ried and have a larger family size than women. In terms of health measures, 76 percent of
Australian people report to have a good, very good or excellent health status, and we find
no difference between the two genders. The summary statistics of SF–36 health measures
show that Australian men are in slightly better physical, mental and overall health than
women.
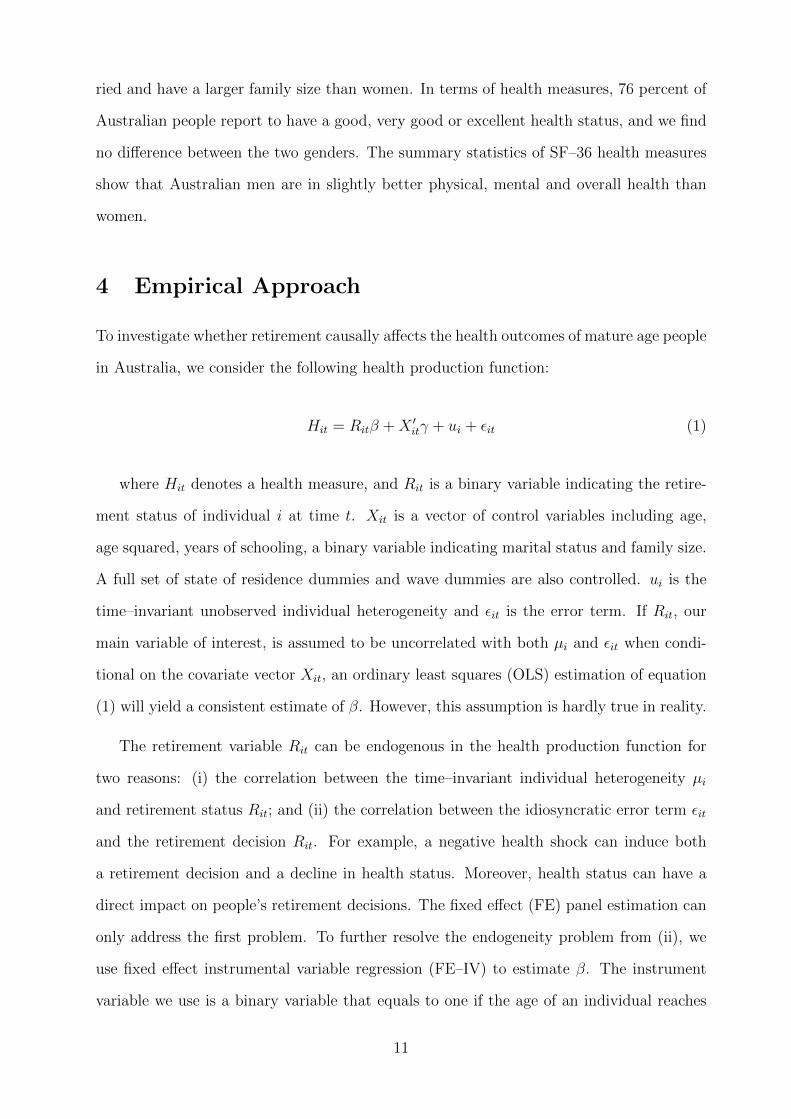
4 Empirical Approach
To investigate whether retirement causally affects the health outcomes of mature age people
in Australia, we consider the following health production function:
Hit = Ritβ +X ′itγ + ui + εit (1)
where Hit denotes a health measure, and Rit is a binary variable indicating the retire-
ment status of individual i at time t. Xit is a vector of control variables including age,
age squared, years of schooling, a binary variable indicating marital status and family size.
A full set of state of residence dummies and wave dummies are also controlled. ui is the
time–invariant unobserved individual heterogeneity and εit is the error term. If Rit, our
main variable of interest, is assumed to be uncorrelated with both µi and εit when condi-
tional on the covariate vector Xit, an ordinary least squares (OLS) estimation of equation
(1) will yield a consistent estimate of β. However, this assumption is hardly true in reality.
The retirement variable Rit can be endogenous in the health production function for
two reasons: (i) the correlation between the time–invariant individual heterogeneity µi
and retirement status Rit; and (ii) the correlation between the idiosyncratic error term εit
and the retirement decision Rit. For example, a negative health shock can induce both
a retirement decision and a decline in health status. Moreover, health status can have a
direct impact on people’s retirement decisions. The fixed effect (FE) panel estimation can
only address the first problem. To further resolve the endogeneity problem from (ii), we
use fixed effect instrumental variable regression (FE–IV) to estimate β. The instrument
variable we use is a binary variable that equals to one if the age of an individual reaches
11

the corresponding Age Pension eligibility ages displayed in Table 1. This instrument is
believed to be highly correlated with the retirement decisions of Australian people, and we
will test this relevance condition in the next section. Also, after controlling for a flexible
function of individual age, the binary instrumental variable indicating whether people reach
certain specific ages is unlikely to have a direct effect on people’s health except through
the channel of people’s retirement decisions. While this instrument exclusion condition is
not testable, the variations in retirement that are induced by social security incentives are
exogenous (Rohwedder and Willis, 2010).
5 Results
5.1 The Causal Effects of Retirement Status on Health
Table 4 reports the results when equation (1) is estimated with OLS regressions. Retire-
ment status is found to be associated with a significant deterioration in health for each of
the four health measures. For example, on average, a retired individual is 22.5 percent less
likely to report a good, very good or excellent health status than a labor force participant.
The SF–36 physical health and mental health measures are also lower for retirees. We also
find that the health of Australian men is more influenced by retirement status than that
of women. In addition, being retired seems to exert a larger influence on physical health
than on mental health, and this result holds for each gender group.
The fixed effect (FE) panel estimation results displayed in Table 4 show that the as-
sociations between retirement status and health measures are negative and significant but
much smaller in magnitude than those estimated with OLS regressions. There are two
possible explanations for this finding. The first one is that fixed effect estimations take
unobserved time–invariant heterogeneity into account. For example, people with higher
unobserved ability (which is relatively stable over a short time span), may be more likely
to stay in the labor force, and in the meanwhile, they can take better care of their health.
Ignoring this individual heterogeneity, as in OLS estimation, can lead to an overstatement
of the negative effect of retirement on health. A second explanation is that fixed effect esti-
12

Tab
le4:
OL
San
dF
EE
stim
atio
nR
esult
sO
LS
Est
imati
on
FE
Est
imati
on
Sel
f–re
port
edP
hysi
cal
Men
tal
Ove
rall
Sel
f–re
por
ted
Physi
cal
Men
tal
Ove
rall
good
hea
lth
hea
lth
hea
lth
hea
lth
good
hea
lth
hea
lth
hea
lth
hea
lth
All
–0.
225*
**–15
.521
***
–10.
698*
**–1
3.11
0***
–0.0
51**
*–3
.843
***
–2.6
07**
*–3
.225
***
(0.0
10)
(0.6
25)
(0.5
21)
(0.5
45)
(0.0
08)
(0.3
98)
(0.3
96)
(0.3
50)
Male
–0.
280*
**–18
.484
***
–12.
824*
**–1
5.65
4***
–0.0
46**
*–3
.982
***
–2.5
10**
*–3
.246
***
(0.0
16)
(0.9
32)
(0.8
11)
(0.8
34)
(0.0
11)
(0.5
70)
(0.5
41)
(0.5
05)
Fem
ale
–0.
184*
**–13
.562
***
–9.1
48**
*–1
1.35
5***
–0.0
57**
*–3
.727
***
–2.6
95**
*–3
.211
***
(0.0
14)
(0.8
30)
(0.6
75)
(0.7
11)
(0.0
11)
(0.5
49)
(0.5
23)
(0.4
80)
Note:
*p<
0.1;
**p<
0.05
;**
*p<
0.01
.C
ontr
ol
vari
ab
les
incl
ud
eage,
age
squ
are
,ye
ars
of
sch
ooli
ng,
am
arr
ied
du
mm
y,fa
mil
ysi
ze,
and
afu
llse
tof
stat
eof
resi
den
ced
um
mie
san
dw
ave
du
mm
ies.
Hu
ber
–W
hit
ero
bu
stst
an
dard
erro
rscl
ust
ered
at
the
ind
ivid
ual
leve
lar
ere
por
ted
inp
aren
thes
es.
13

mates are more susceptible to the measure error problem than OLS estimates. A measure
error in the retirement variable can result in estimates with smaller magnitude and larger
attenuation bias in the fixed effect estimation than in the OLS estimation (Griliches and
Hausman, 1986). However, the confounding problems from the correlation between the
retirement variable and the idiosyncratic error term, which may result from time–varying
confounding factors or reverse causality, disable us from identifying the causal effects of
retirement on health with either OLS or fixed effect estimation.
Table 5: First–Stage Results of FE–IV Estimation
All Male Female
InstrumentAge eligible for 0.101*** 0.105*** 0.084***the Age Pension (0.007) (0.010) (0.009)
ControlsAge 0.067*** 0.058 0.078**
(0.025) (0.036) (0.033)
Agesq/100 –0.000 0.025*** –0.023***(0.005) (0.008) (0.007)
Schooling –0.000 –0.027** 0.013(0.007) (0.013) (0.009)
Married 0.015 –0.015 0.031**(0.011) (0.016) (0.014)
Family size 0.006* 0.008* 0.005(0.003) (0.005) (0.005)
State dummies Yes Yes YesWave dummies Yes Yes Yes
F–statistic on the231.39 117.64 82.45
excluded instrumentN 36,713 17,527 19,186
Note: * p<0.1; ** p<0.05; *** p<0.01. Standard errors
are reported in parentheses.
We now move to the fixed effect instrumental variable (FE–IV) estimation results where
the causality from retirement status to health can be convincingly established. Before dis-
cussing the causal effects of retirement status on health, we look at the first–stage regression
results from FE–IV estimations. The results reported in Table 5 help assess whether the
instrumental variable we use satisfies the relevance condition for a valid instrument. The
coefficient estimates of the age eligibility variable are highly significant for the full sam-
ple and each gender sample, indicating that the age eligibility for the Age Pension is a
14

strong predictor for retirement behavior in Australia. The first–stage F–statistics on the
excluded instrument all far exceed the Staiger and Stock (1997) rule-of-thumb threshold
of 10, indicating that the instrument is not weak and has sufficient explanatory power
in our specifications. For males, being over the Age Pension eligibility age increases the
probability of being retired by 10.5 percentage points, and the retirement–inducing effect
is 8.4 percentage points for females.
Table 6: The Causal Effects of Retirement Status on HealthSelf–reported Physical Mental Overallgood health health health health
All 0.310*** 14.523*** 14.364*** 14.444***(0.074) (3.382) (3.258) (2.950)
Male 0.293*** 13.482*** 10.863*** 12.173***(0.100) (4.556) (4.181) (3.890)
Female 0.390*** 18.464*** 22.201*** 20.332***(0.129) (6.005) (6.101) (5.410)
Note: * p<0.1; ** p<0.05; *** p<0.01. Control variables include
age, age square, years of schooling, a married dummy, family size,
and a full set of state of residence dummies and wave dummies.
Standard errors are reported in parentheses.
Table 6 reports the FE–IV regression results, which estimates the causal contempora-
neous effects of being retired on health measures we use. Unlike the findings from OLS
and fixed effect estimations, we find positive and highly significant causal health effects of
retirement status in Australia, showing that OLS and FE estimates are inconsistent and
misleading. Being retired significantly leads to a 31.0 percent increase in the likelihood of
reporting good, very good or excellent health status. The positive effect of retirement on
health is also confirmed when using the SF–36 health measures. Both the physical and
mental health are improved when transiting from labor force participation into retirement.
For example, the SF–36 physical health measure of a typical individual in our sample
would be 14.523 higher in retirement than in labor force, which corresponds to about 20.8
percent increase in physical health when compared with the sample average. We also find
that the health effects of retirement status are uniformly larger for women than for men
in Australia.
15

5.2 Does Retirement Duration Affect Health?
In the previous section, we consider retirement as a discrete change in lifestyle, and our
estimates in Table 6 constrain the retirement effects to be a discontinuous change in health
in response to the retirement event. Another perspective to view retirement is a cumulative
process of exposure to being out of labor force. In this section, we investigate how the health
of Australian people can be affected the length of time spent exposing to retirement. The
retirement duration variable (denoted with RETdurationit) is constructed as the elapse
time between self–reported retirement age and the age at the time of survey. For those
who are not retired, the value of retirement duration is set to zero. To identify the causal
effect of retirement duration on health, the instrumental variable used is the duration of
being age eligible for the Age Pension (denoted with ELIdurationit), which is constructed
as the duration between the minimum age when being age qualifying for the pension and
the current age of each individual. Similarly, if an individual is not age eligible for the
pension, the eligibility duration is equal to zero.
We follow Bonsang et al. (2012) in using the log form of duration
Hit = α + Log(RETduration+ 1)itβ +X ′itγ + µi + εit (2)
and estimate this equation with fixed effect instrumental variable (FE–IV) regression. The
results are displayed in Table 8. OLS and fixed effect estimation results are displayed in
Table 7 for comparison purposes.
OLS estimation results in Table 7 show that retirement duration has negative and statis-
tically significant effects on health measures. A doubling of the time exposing to retirement
is associated with 8.8 percent decrease in the probability of reporting good health. The
magnitudes of the coefficients on the retirement duration variable are considerably smaller
when using the fixed effect estimation method, and almost all estimates are insignificant.8
The causal results displayed in Table 8 show that the time spent in retirement has a
8The only exception is that the association between the physical health of female and retirement dura-tion is negative and significant at the 10% level when using fixed effect estimation.
16

Tab
le7:
The
Eff
ects
ofR
etir
emen
tD
ura
tion
onH
ealt
h(O
LS
and
FE
Est
imat
es)
OL
SE
stim
ati
on
FE
Est
imati
on
Sel
f–re
port
edP
hysi
cal
Men
tal
Ove
rall
Sel
f–re
por
ted
Physi
cal
Men
tal
Ove
rall
good
hea
lth
hea
lth
hea
lth
hea
lth
good
hea
lth
hea
lth
hea
lth
hea
lth
All
–0.
088*
**–5
.695
***
–3.8
27**
*–4
.761
***
–0.0
06–0
.325
–0.1
35–0
.230
(0.0
05)
(0.3
19)
(0.2
59)
(0.2
77)
(0.0
04)
(0.2
08)
(0.2
01)
(0.1
83)
Male
–0.
131*
**–8
.201
***
–5.6
94**
*–6
.948
***
–0.0
02–0
.103
0.14
10.
019
(0.0
08)
(0.4
91)
(0.4
25)
(0.4
38)
(0.0
07)
(0.3
21)
(0.3
18)
(0.2
84)
Fem
ale
–0.
069*
**–4
.645
***
–3.0
24**
*–3
.835
***
–0.0
08–0
.466
*–0
.295
–0.3
81(0
.007
)(0
.408
)(0
.325
)(0
.350
)(0
.006
)(0
.272
)(0
.260
)(0
.238
)
Note:
*p<
0.1;
**p<
0.05
;**
*p<
0.01
.C
ontr
ol
vari
ab
les
incl
ud
eage,
age
squ
are
,ye
ars
of
sch
ooli
ng,
am
arr
ied
du
mm
y,fa
mil
y
size
,an
da
full
set
ofst
ate
ofre
sid
ence
du
mm
ies
an
dw
ave
du
mm
ies.
Hu
ber
–W
hit
ero
bu
stst
an
dard
erro
rscl
ust
ered
at
the
ind
ivid
ual
leve
lar
ere
por
ted
inp
aren
thes
es.
17
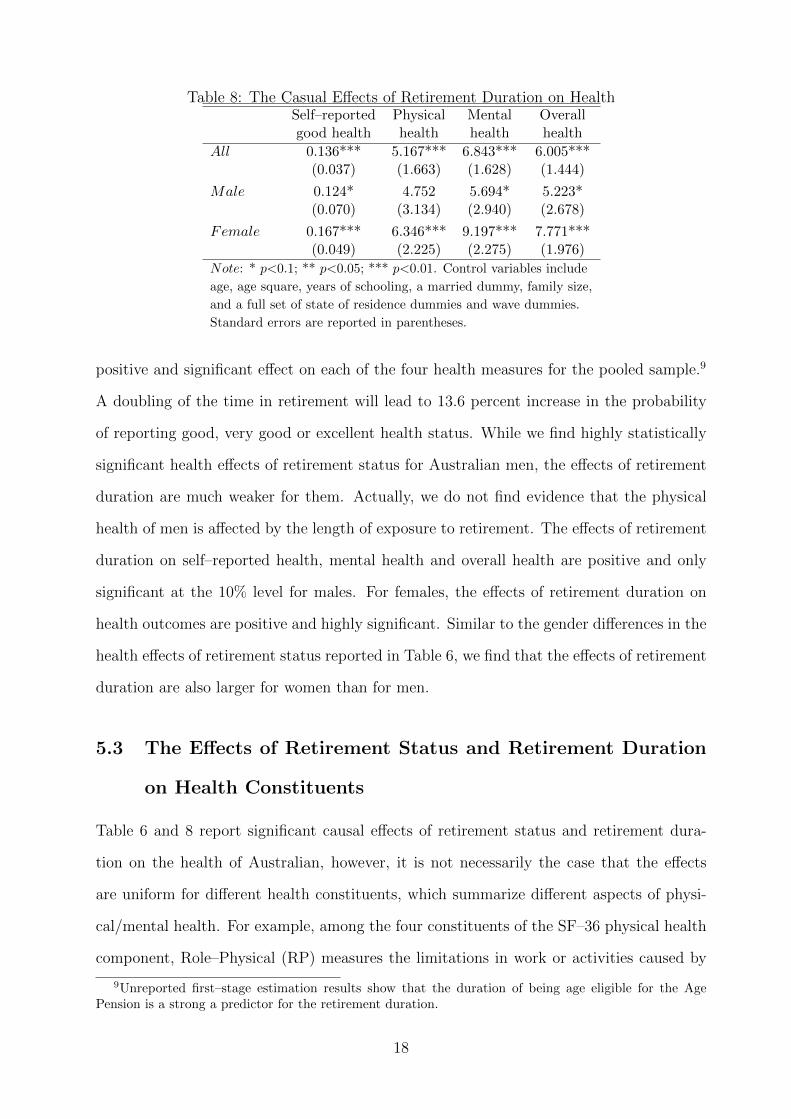
Table 8: The Casual Effects of Retirement Duration on HealthSelf–reported Physical Mental Overallgood health health health health
All 0.136*** 5.167*** 6.843*** 6.005***(0.037) (1.663) (1.628) (1.444)
Male 0.124* 4.752 5.694* 5.223*(0.070) (3.134) (2.940) (2.678)
Female 0.167*** 6.346*** 9.197*** 7.771***(0.049) (2.225) (2.275) (1.976)
Note: * p<0.1; ** p<0.05; *** p<0.01. Control variables include
age, age square, years of schooling, a married dummy, family size,
and a full set of state of residence dummies and wave dummies.
Standard errors are reported in parentheses.
positive and significant effect on each of the four health measures for the pooled sample.9
A doubling of the time in retirement will lead to 13.6 percent increase in the probability
of reporting good, very good or excellent health status. While we find highly statistically
significant health effects of retirement status for Australian men, the effects of retirement
duration are much weaker for them. Actually, we do not find evidence that the physical
health of men is affected by the length of exposure to retirement. The effects of retirement
duration on self–reported health, mental health and overall health are positive and only
significant at the 10% level for males. For females, the effects of retirement duration on
health outcomes are positive and highly significant. Similar to the gender differences in the
health effects of retirement status reported in Table 6, we find that the effects of retirement
duration are also larger for women than for men.
5.3 The Effects of Retirement Status and Retirement Duration
on Health Constituents
Table 6 and 8 report significant causal effects of retirement status and retirement dura-
tion on the health of Australian, however, it is not necessarily the case that the effects
are uniform for different health constituents, which summarize different aspects of physi-
cal/mental health. For example, among the four constituents of the SF–36 physical health
component, Role–Physical (RP) measures the limitations in work or activities caused by
9Unreported first–stage estimation results show that the duration of being age eligible for the AgePension is a strong a predictor for the retirement duration.
18
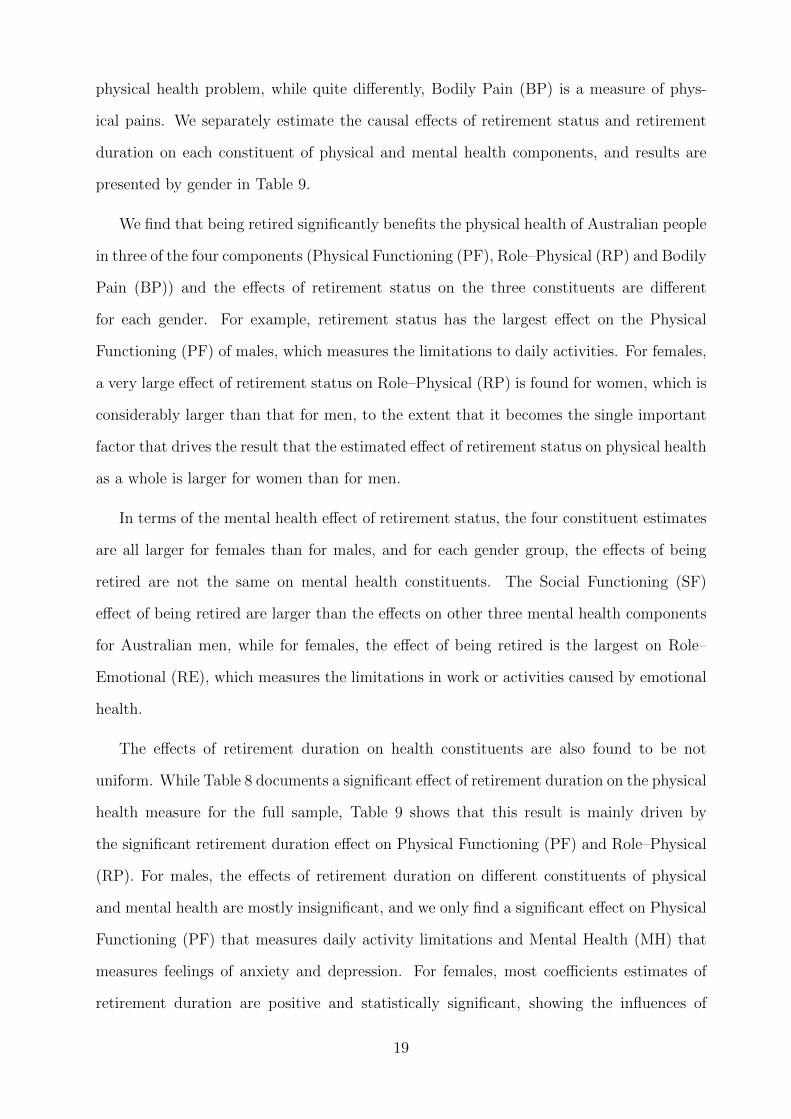
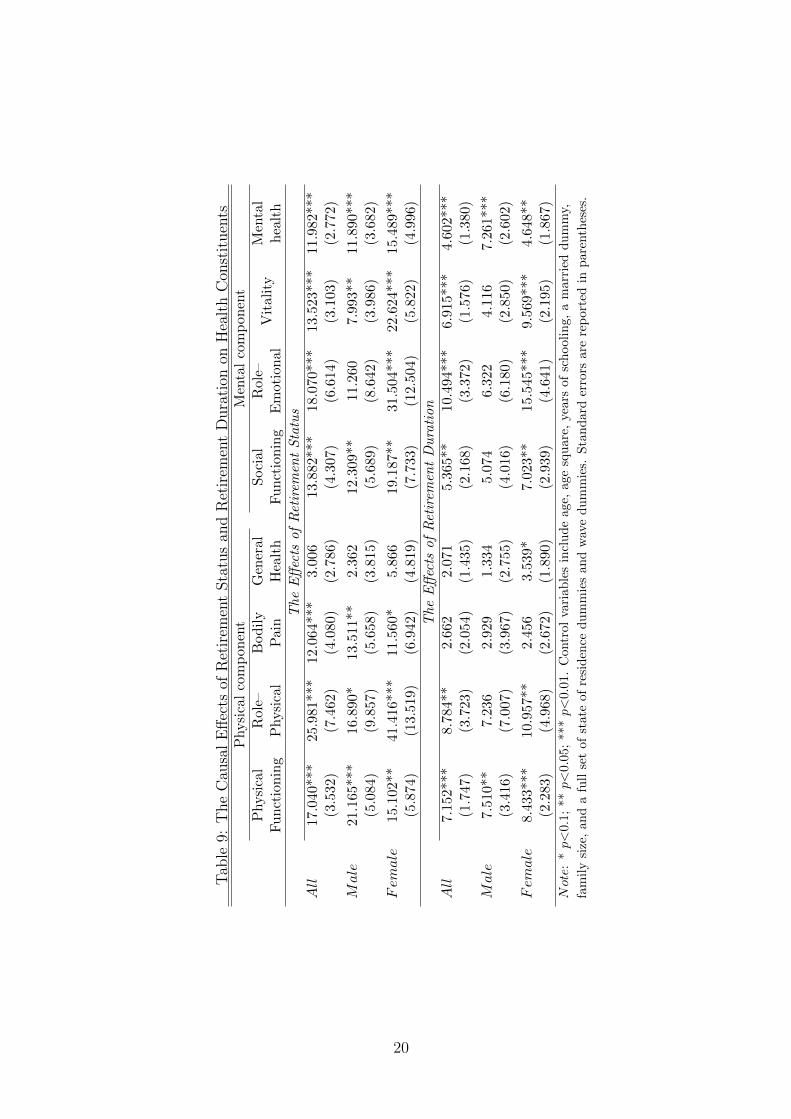
physical health problem, while quite differently, Bodily Pain (BP) is a measure of phys-
ical pains. We separately estimate the causal effects of retirement status and retirement
duration on each constituent of physical and mental health components, and results are
presented by gender in Table 9.
We find that being retired significantly benefits the physical health of Australian people
in three of the four components (Physical Functioning (PF), Role–Physical (RP) and Bodily
Pain (BP)) and the effects of retirement status on the three constituents are different
for each gender. For example, retirement status has the largest effect on the Physical
Functioning (PF) of males, which measures the limitations to daily activities. For females,
a very large effect of retirement status on Role–Physical (RP) is found for women, which is
considerably larger than that for men, to the extent that it becomes the single important
factor that drives the result that the estimated effect of retirement status on physical health
as a whole is larger for women than for men.
In terms of the mental health effect of retirement status, the four constituent estimates
are all larger for females than for males, and for each gender group, the effects of being
retired are not the same on mental health constituents. The Social Functioning (SF)
effect of being retired are larger than the effects on other three mental health components
for Australian men, while for females, the effect of being retired is the largest on Role–
Emotional (RE), which measures the limitations in work or activities caused by emotional
health.
The effects of retirement duration on health constituents are also found to be not
uniform. While Table 8 documents a significant effect of retirement duration on the physical
health measure for the full sample, Table 9 shows that this result is mainly driven by
the significant retirement duration effect on Physical Functioning (PF) and Role–Physical
(RP). For males, the effects of retirement duration on different constituents of physical
and mental health are mostly insignificant, and we only find a significant effect on Physical
Functioning (PF) that measures daily activity limitations and Mental Health (MH) that
measures feelings of anxiety and depression. For females, most coefficients estimates of
retirement duration are positive and statistically significant, showing the influences of
19
Tab
le9:
The
Cau
sal
Eff
ects
ofR
etir
emen
tSta
tus
and
Ret
irem
ent
Dura
tion
onH
ealt
hC
onst
ituen
tsP
hysi
cal
com
pon
ent
Men
tal
com
pon
ent
Physi
cal
Rol
e–B
od
ily
Gen
eral
Soci
alR
ole–
Vit
alit
yM
enta
lF
un
ctio
nin
gP
hysi
cal
Pai
nH
ealt
hF
un
ctio
nin
gE
mot
ion
alh
ealt
h
The
Eff
ects
of
Ret
irem
ent
Sta
tus
All
17.
040*
**25.
981*
**12
.064
***
3.00
613
.882
***
18.0
70**
*13
.523
***
11.9
82**
*(3
.532)
(7.4
62)
(4.0
80)
(2.7
86)
(4.3
07)
(6.6
14)
(3.1
03)
(2.7
72)
Male
21.
165*
**16
.890
*13
.511
**2.
362
12.3
09**
11.2
607.
993*
*11
.890
***
(5.0
84)
(9.8
57)
(5.6
58)
(3.8
15)
(5.6
89)
(8.6
42)
(3.9
86)
(3.6
82)
Fem
ale
15.
102*
*41
.416
***
11.5
60*
5.86
619
.187
**31
.504
***
22.6
24**
*15
.489
***
(5.8
74)
(13.
519)
(6.9
42)
(4.8
19)
(7.7
33)
(12.
504)
(5.8
22)
(4.9
96)
The
Eff
ects
of
Ret
irem
ent
Du
rati
on
All
7.1
52**
*8.
784*
*2.
662
2.07
15.
365*
*10
.494
***
6.91
5***
4.60
2***
(1.7
47)
(3.7
23)
(2.0
54)
(1.4
35)
(2.1
68)
(3.3
72)
(1.5
76)
(1.3
80)
Male
7.51
0**
7.23
62.
929
1.33
45.
074
6.32
24.
116
7.26
1***
(3.4
16)
(7.0
07)
(3.9
67)
(2.7
55)
(4.0
16)
(6.1
80)
(2.8
50)
(2.6
02)
Fem
ale
8.43
3***
10.9
57**
2.45
63.
539*
7.02
3**
15.5
45**
*9.
569*
**4.
648*
*(2
.283
)(4
.968
)(2
.672
)(1
.890
)(2
.939
)(4
.641
)(2
.195
)(1
.867
)
Note:
*p<
0.1;
**p<
0.05
;**
*p<
0.01
.C
ontr
ol
vari
ab
les
incl
ud
eage,
age
squ
are
,ye
ars
of
sch
ooli
ng,
am
arr
ied
du
mm
y,
fam
ily
size
,an
da
full
set
ofst
ate
ofre
sid
ence
du
mm
ies
an
dw
ave
du
mm
ies.
Sta
ndard
erro
rsare
rep
ort
edin
pare
nth
eses
.
20
retirement duration are exerted on most aspects of female physical and mental health.
The results of Table 9 also highlight that retirement status and retirement duration affect
individual health in different ways.
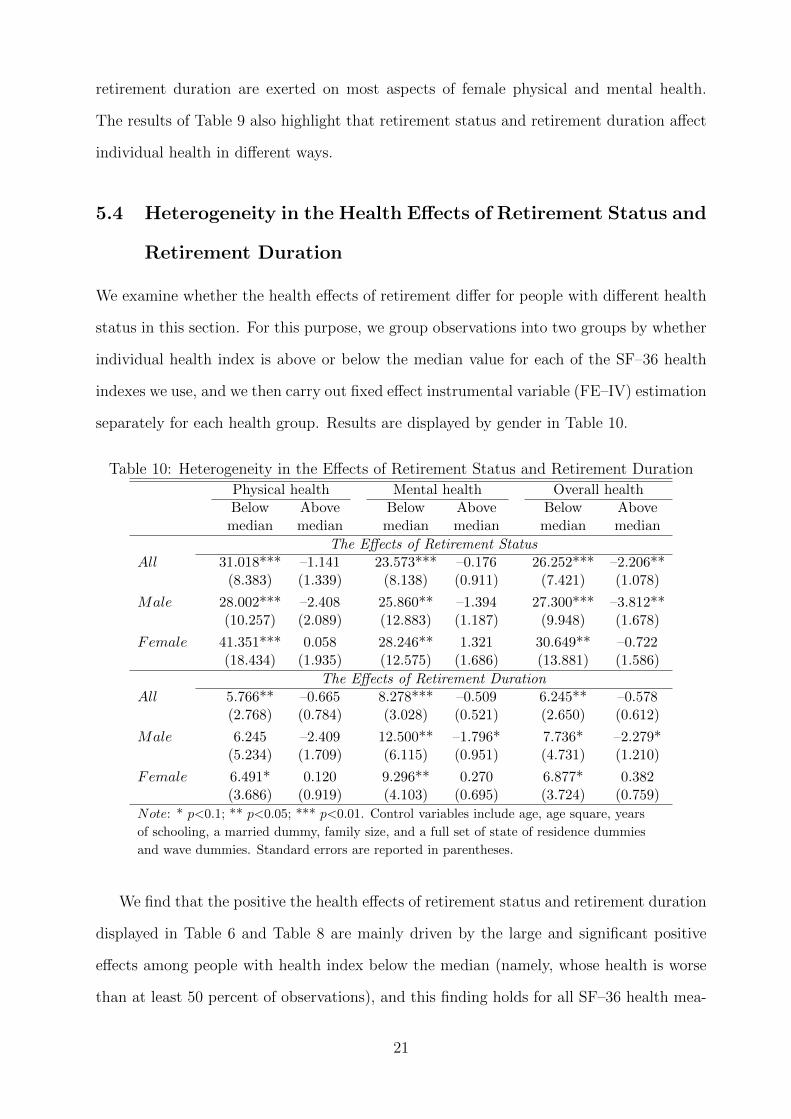
5.4 Heterogeneity in the Health Effects of Retirement Status and
Retirement Duration
We examine whether the health effects of retirement differ for people with different health
status in this section. For this purpose, we group observations into two groups by whether
individual health index is above or below the median value for each of the SF–36 health
indexes we use, and we then carry out fixed effect instrumental variable (FE–IV) estimation
separately for each health group. Results are displayed by gender in Table 10.
Table 10: Heterogeneity in the Effects of Retirement Status and Retirement Duration
Physical health Mental health Overall healthBelow Above Below Above Below Abovemedian median median median median median
The Effects of Retirement StatusAll 31.018*** –1.141 23.573*** –0.176 26.252*** –2.206**
(8.383) (1.339) (8.138) (0.911) (7.421) (1.078)
Male 28.002*** –2.408 25.860** –1.394 27.300*** –3.812**(10.257) (2.089) (12.883) (1.187) (9.948) (1.678)
Female 41.351*** 0.058 28.246** 1.321 30.649** –0.722(18.434) (1.935) (12.575) (1.686) (13.881) (1.586)
The Effects of Retirement DurationAll 5.766** –0.665 8.278*** –0.509 6.245** –0.578
(2.768) (0.784) (3.028) (0.521) (2.650) (0.612)
Male 6.245 –2.409 12.500** –1.796* 7.736* –2.279*(5.234) (1.709) (6.115) (0.951) (4.731) (1.210)
Female 6.491* 0.120 9.296** 0.270 6.877* 0.382(3.686) (0.919) (4.103) (0.695) (3.724) (0.759)
Note: * p<0.1; ** p<0.05; *** p<0.01. Control variables include age, age square, years
of schooling, a married dummy, family size, and a full set of state of residence dummies
and wave dummies. Standard errors are reported in parentheses.
We find that the positive the health effects of retirement status and retirement duration
displayed in Table 6 and Table 8 are mainly driven by the large and significant positive
effects among people with health index below the median (namely, whose health is worse
than at least 50 percent of observations), and this finding holds for all SF–36 health mea-
21

sures, and also for each gender. For people with health above the median, the retirement
effects are mostly negative and insignificant. We even find negative and significant causal
effects of retirement status in a few cases. Specifically, the effects of retirement status
on the SF–36 overall health measure are negative and significant for people whose overall
health is higher than the relevant median in the full sample and also the male sample.
Moreover, we find that retirement duration can hurt the mental health and overall health
of men who are in relatively better health status (health measures above the relevant medi-
ans). The results in Table 10 reveals that the positive health effects of retirement found in
Table 6 and 8 conceal the coexistence of both positive and negative effects in a population.
It should be noted that the insignificant results displayed in Table 10 are hardly driven
by the weak instrument problem as the related first–stage F–statistics on the excluded
instrument are all greater than 40, far exceeding the rule-of-thumb cutoff of 10 for weak
identification not to be considered a problem (Staiger and Stock, 1997).
We also conduct a sensitivity analysis by including household income and the value of
household housing asset into our modeling. Two reasons justify our approach here. First,
a change in income or wealth may affect medical expenses, health services utilizations
and other health–related behaviors that may have an impact on the health outcomes of
Australian people. Second and more importantly, our instrument, which describes whether
the age of an individual meets the age requirement of the Australian Age Pension, now
has a different interpretation. As the observations in our sample all satisfy the pension
residency condition, when we include the income levels and the values of housing asset in
the modeling, whether the age of an individual is eligible for the Age Pension is equivalent
to whether the individual is eligible for the Age Pension.
The results are reported in Table 11. The health effects of retirement status and
retirement duration reported herein, which are further conditional on household income
and housing wealth, are very similar to those reported in Table 6, 8 and 10. We find
very robust evidence that retirement as a discrete event and as an cumulative process
can both lead to significant improvement in self–reported health and physical and mental
health outcomes. Similarly, we find substantial heterogeneity in the retirement effects on
22

Tab
le11
:R
obust
nes
sch
eck
usi
ng
Hou
sehol
dIn
com
ean
dH
ousi
ng
Wea
lth
asA
ddit
ional
Con
trol
s
Sel
f–re
por
ted
Physi
cal
hea
lth
Men
tal
hea
lth
Over
all
hea
lth
good
hea
lth
All
Bel
owA
bov
eA
llB
elow
Ab
ove
All
Bel
owA
bov
em
edia
nm
edia
nm
edia
nm
edia
nm
edia
nm
edia
n
The
Eff
ects
of
Ret
irem
ent
Sta
tus
All
0.2
98**
*14
.014*
**29
.605
***
–1.1
2513
.945
***
22.8
68**
*–0
.181
13.9
80**
*25
.248
***
–2.2
00**
(0.0
71)
(3.2
70)
(7.9
08)
(1.3
01)
(3.1
52)
(7.8
22)
(0.8
90)
(2.8
51)
(7.0
33)
(1.0
49)
Male
0.2
89**
*13
.252*
**26
.643
***
–2.4
0810
.665
***
25.1
16**
–1.4
0012
.172
***
27.3
00**
*–3
.812
**(0
.099)
(4.4
90)
(9.6
92)
(2.0
83)
(4.1
23)
(12.
373)
(1.1
85)
(3.8
90)
(9.9
48)
(1.6
78)
Fem
ale
0.3
56**
*17
.211*
**38
.683
**0.
096
20.9
70**
*27
.133
**1.
248
19.0
91**
*28
.778
**–0
.736
(0.1
20)
(5.6
15)
(16.
506)
(1.8
23)
(5.7
01)
(11.
935)
(1.5
84)
(5.0
43)
(12.
820)
(1.4
95)
The
Eff
ects
of
Ret
irem
ent
Du
rati
on
All
0.1
30**
*4.9
94*
**5.
566*
*–0
.659
6.70
9***
8.19
0**
–0.5
105.
851*
**6.
156*
*–0
.603
(0.0
36)
(1.6
30)
(2.7
18)
(0.7
61)
(1.5
95)
(2.9
94)
(0.5
09)
(1.4
15)
(2.6
11)
(0.5
95)
Male
0.12
1*4.6
185.
971
–2.4
005.
577*
12.4
16**
–1.7
77*
5.09
7*7.
665*
–2.2
47*
(0.0
69)
(3.0
85)
(5.0
73)
(1.6
74)
(2.8
94)
(5.9
97)
(0.9
40)
(2.6
63)
(4.6
10)
(1.1
93)
Fem
ale
0.1
58**
*6.0
76*
**6.
009*
0.14
48.
981*
**9.
183*
*0.
253
7.52
8***
6.60
9*0.
343
(0.0
48)
(2.1
68)
(3.5
81)
(0.8
87)
(2.2
17)
(4.0
44)
(0.6
73)
(1.9
24)
(3.6
49)
(0.7
33)
Note:
*p<
0.1;
**p<
0.05
;**
*p<
0.01
.C
ontr
olva
riab
les
incl
ud
eage,
age
squ
are
,ye
ars
of
sch
ooli
ng,
am
arr
ied
du
mm
y,fa
mil
ysi
ze,
an
da
full
set
of
stat
eof
resi
den
ced
um
mie
san
dw
ave
du
mm
ies.
Sta
nd
ard
erro
rsare
rep
ort
edin
pare
nth
eses
.
23

the health of Australian people with different levels of health. It is mainly the people
with poorer health (namely, whose health measures are below the relevant medians) that
experience the strongest health improvement from the transition into retirement status
and increasing exposure to retirement.
5.5 The Effects of Retirement on Health–Related Behaviors
In this section, we examine the causal effects of retirement status and retirement dura-
tion on three types of health–related behaviors: physical exercising, smoking and drinking.
Participation in physical activity is well known for health promotion and disease preven-
tion (Miles, 2007), and smoking and heavy drinking are known causes of chronic health
conditions such as cancer, diabetes and heart disease (Sturm, 2002). We check whether
these behaviors are the possible channels through which the positive and significant effects
of retirement on health exist in Australia and the possible reasons for the larger health
effects of retirement for women than for men.
We separately estimate the following models with fixed effect instrumental variable
(FE–IV) regressions
HBit = Ritβ +X ′itγ + ui + εit (3)
HBit = α + Log(RETduration+ 1)itβ +X ′itγ + µi + εit (4)
where HBit denotes one of the following six variables indicating the participation or in-
tensity of health–related behaviors of individual i at time t: (i) whether takes any physical
activity; (ii) whether participates in physical exercises at least three times per week; (iii)
currently a smoker; (iv) number of cigarettes smoked per week; (v) currently an alcohol
drinker and (vi) drinks alcohol at least three time per week. Xit refers to the same set of
controls as in equation (1). Results are reported in Table 12.
The FE–IV results for the full sample indicate that individuals tend to participate
more frequently in physical activities after retirement. The gender results show that the
effect is significant for females only. For example, Australian women are found to be
38.9 percent more likely to take physical activities at least three times per week than
24

Table 12: The Effects of Retirement on Health Related BehaviorsExercising Smoking Drinking
Take At least Currently Number of Currently At leastphysical 3 times a cigarettes drink 3 timesexercise per week smoker per week alcohol per week
The Effects of Retirement StatusAll –0.092 0.186* –0.093** –9.450 0.058 –0.027
(0.067) (0.097) (0.047) (6.808) (0.057) (0.072)
Male –0.112 0.055 0.025 3.924 0.063 0.079(0.092) (0.135) (0.064) (10.368) (0.067) (0.102)
Female –0.062 0.389** –0.261*** –23.973** 0.053 –0.166(0.115) (0.168) (12.575) (0.085) (0.109) (0.120)
The Effects of Retirement DurationAll –0.005 0.075 –0.045** –3.378 0.037 –0.004
(0.034) (0.050) (0.023) (3.328) (0.028) (0.035)
Male 0.043 0.005 –0.040 –1.396 0.014 0.072(0.066) (0.098) (0.049) (7.793) (0.050) (0.075)
Female –0.025 0.141** –0.054* –3.001 0.052 –0.043(0.045) (0.065) (0.028) (3.467) (0.038) (0.041)
Note: * p<0.1; ** p<0.05; *** p<0.01. Control variables include age, age square, years
of schooling, a married dummy, family size, and a full set of state of residence dummies
and wave dummies. Standard errors are reported in parentheses.
when in the labor force. The effect of retirement duration on physical activity is also
positive and significant for females only. Moreover, we find that an individual in the
full sample is estimated to be 9.3 percent less likely to be a current smoker, however, this
decrease in smoking participation is also driven the large and significant effects for females.
After the transition into retirement from workforce, Australian women not only are less
likely to be a smoker, but also reduce the number of cigarettes smoked. In addition, a
doubling of exposure to retirement will lead to 5.4 percent decrease in female smoking
participation, and we do not find significant effect of retirement duration on smoking
intensity. Finally, neither retirement status nor retirement duration are found to affect the
drinking behaviors of Australians. It should be noted that the insignificant results in Table
12 are not attributable to the weak instrument problem as the first–stage F–statistics on
the excluded instrument are all greater than the rule-of-thumb cutoff of 10 suggested by
Staiger and Stock (1997).
To sum up, we find that for the full sample both retirement status and retirement
duration leads to more physical activities and less smoking behaviors, indicating that exer-
25

cising and smoking are the possible channels through which retirement affect people health
in Australia. Our gender analysis show that this finding is primarily driven by the large
and significant retirement effects on the health investment behaviors of Australian women.
Neither the participation nor intensity of exercising, smoking and drinking behaviors of
Australian men are affected by their retirement status or retirement duration. The finding
of gender difference in the effects of retirement on health–related behaviors may explain
why the health effects of retirement are larger for women than for men.
5.6 Age Pension Eligibility, Retirement and Health: Counter-
factual Gender Health Difference and Counterfactual Over–
time Health Evolution
The results in previous sections show that the health effects of retirement are larger for
females than for males, and Table 3 shows that the retirement rate among women (56
percent) is 14 percent higher than that of Australian men (42 percent). Therefore, we
conclude that the health of women benefit more from retirement than that of men. Given
that the gender differences in health measures displayed in Table 3 are very small, a natural
question to ask is that had the retirement rate of women been the same as that of men,
how much worse the health of women would have been than the actual case and how larger
the counterfactual gender gap in health would have been. Also, as we have find evidence
that pension age eligibility induces retirement, it is of interest to know to what extent
the gender differences in retirement rates is induced by the gender differences in the Age
Pension eligibility ages.
Given the context that female retirement rate has declined from 61.6 to 51.7 percent
during 2001–2011, the second question we answer is that had the retirement rate for women
not declined in the last decade, how much better off the health of Australian women in 2011
would have been than the actual level? Also, as the eligibility age for the Age Pension for
women has sequentially increased from 61.5 to 64.0 at a rate of six months every two years
during 2001–2011, we quantify the contribution of the increase in the pension eligibility
ages to the decrease in women’s retirement rate during the past decade.
26

The counterfactual analysis is important as it sheds light on the possible health con-
sequences of two important scheduled changes in the pension qualifying ages for the next
decade: (i) from January 2014, the pension eligibility age requirements are the same for
both genders; (ii) the pension qualifying ages will start rising from 65 in July 2017 to
67 years of age in July 2023 at a rate of six months every two years. The following dis-
cussions provide a direct and quantifiable evaluation of two potential unintended health
consequences resulting from the scheduled increases in the pension qualifying ages for the
next decade: the enlargement of male–female health difference and the deterioration in
health status of both genders. As the analysis based on retirement status and retirement
duration come to similar conclusions, the following discussions will be based on retirement
status only.
5.6.1 Counterfactual Gender Differences in Health Had Women Shared the
Same Retirement Rate as Men
As shown in the empirical approach section, the equation we estimate with fixed effect
instrumental variable (FE–IV) regression is
Hit = Ritβ +X ′itγ + ui + εit (5)
where Hit is the health for individual i at time t, Rit is the retirement status variable and
Xit denotes the vector of control variables. ui is the time–invariant unobserved individual
heterogeneity and εit is the error term.
When the equation is estimated separately for males (denoted with M) and females
(denoted with F ), we can get the following equations for each gender (g=M ,F ):
Hg = Rgβ̂g +X′gγ̂g + ug (6)
where Hg, R̂g and Xg denote respectively the mean values of health measures, retirement
rates and control variables for gender group g.
Now consider the case, when the female retirement rate is equal to any counterfactual
27
value RC
F (superscript C is used to indicate counterfactual variables) and all other factors
stays the same, equation (6) becomes
HC
F = RC
F β̂F +X′F γ̂F + uF (7)
Take a difference between equation (7) and (5) (when g= F ) gives
HC
F −HF = (RC
F −RF )β̂F (8)
Let the counterfactual female retirement rate be RC
F=RM , equation (8) is equivalent to
HC
F −HF = (RM −RF )β̂F (9)
where HC
F is the counterfactual health of women had females shared the same retirement
rate as males (RC
F=RM). HC
F−HF shows how much worse the health of women in the
counterfactual case than in the actual case, and HM−HC
F indicates the counterfactual
gender difference in health where there was no gender difference in retirement rates.
To answer the question to what extent the gender health difference in retirement rates
is induced by the different Age pension eligibility rules for males and females, we turn to
the first–stage of the FE–IV estimation:
Rit = Eitθ +X ′itλ+ ui + εit (10)
where Eit is a binary variable showing whether individual i is age eligible for Age Pension
at time t.
The mean gender difference in retirement rates can be written as:
RM −RF = (EM θ̂M − EF θ̂F ) + (X′M λ̂M −X
′F λ̂F ) + (uM − uF ) (11)
(EM θ̂M−EF θ̂F ) in the above equation is the term that relates to pension age eligibility
rates to retirement rates, and it can be written as a standard Oaxaca–Blinder decomposi-
28

tion:
EM θ̂M − EF θ̂F = (EM − EF )θ̂F + EM(θ̂M − θ̂F ) (12)
As the first–stage estimates the causal effect of pension eligibility on retirement, the
amount of gender difference in retirement rates causally induced by the gender difference
in pension eligibility rates is given by (EM−EF )θ̂F . As the overall gender difference in re-
tirement rates is (RM−RF ), (EM−EF )θ̂FRM−RF
is the proportion of gender difference in retirement
rates that is induced by the gender difference in Age Pension eligibility rules.
Table 13: Counterfactual Gender Difference in Health Had RC
F=RM
Self–reported Physical Mental Overallgood health health health health
Actual case
HM 0.759 70.921 76.383 73.652
HF 0.765 68.731 74.098 71.415
HM−HF –0.006 2.190 2.287 2.237
Counterfactual case when RCF=RM
HCF=HF+(RM−RF )β̂F 0.710 66.636 69.336 67.988
HCF –HF=(RM−RF )β̂F –0.055 –2.095 –4.762 –3.427
HCF−HF
HF= (RM−RF )β̂F
HF–7.190% –3.044% –6.427% –4.799%
HM−HCF 0.049 4.285 7.049 5.664
Proportion of the gender retirement difference that was induced by genderdifference in Age Pension qualifying ages
(EM−EF )θ̂FRM−RF
4.200%
The counterfactual results are displayed in Table 13. In the actual case, Australian
men are 0.6 percent less likely to report good health than women (HM−HF ). In terms of
SF–36 health measures, males are slightly better off in physical, mental and overall health.
When considering the counterfactual case when females shared the same retirement rate
as males (RC
F=RM), the health of Australian women became worse than the actual health
(HC
F–HF<0). This is expected as females have a larger retirement rate than males and
retirement are found to have positive and significant effects on health. More specifically,
had RC
F=RM , women are 5.5 percent less likely to report good, very good or excellent
health status (HC
F–HF ) than the current rate, representing a 7.19 percent decrease from
the actual level (HCF−HF
HF). The physical and mental health measures would be respectively
29

3.04 percent and 6.43 percent lower than the current levels in 2011. Had females shared
the same retirement rate as males, the male–female health gap (HM−HC
F ) would become
more than doubled the actual health gap (HM−HF ). The positive retirement gap between
females and males (56%–42%=14%) helps narrow the gender health differentials with the
contribution of gender difference in retirement rates being −(HC
F−HF ). We further find
that 4.2 percent of the gender difference in retirement rates is explained by the gender
difference in the eligibility ages for the Age Pension ( (EM−EF )θ̂FRM−RF
).
5.6.2 Counterfactual Health of Women Had Women’s Retirement Rate not
Changed During 2001–2011
In this section, we quantify the contribution of the reduction of female retirement rate
(from 61.6 percent in 2001 to 51.7 percent in 2011) to the change in women’s health from
2001 to 2011. The over–time health difference of women can be written as:
HF,2011−HF,2001 = (RF,2011−RF,2001)β̂F + (XF,2011−XF,2001)′γ̂F + (uF,2011−uF,2001) (13)
Now consider the counterfactual case where women’s retirement rate in 2011 is RC
F,2011,
and everything else stays the same, the counterfactual health difference between year 2011
and 2001 will be given by:
HC
F,2011−HF,2001 = (RC
F,2011−RF,2001)β̂F + (XF,2011−XF,2001)′γ̂F + (uF,2011−uF,2001) (14)
From equation (13) and (14), we get
HC
F,2011 −HF,2011 = (RC
F,2011 −RF,2011)β̂F (15)
Let the counterfactual female retirement rate in 2011 be the same as in 2001 (RC
F,2011=RF,2001),
equation (15) becomes
HC
F,2011 −HF,2011 = −(RF,2011 −RF,2001)β̂F (16)
30

where HC
F,2011 denotes the counterfactual health of women had RC
F,2011=RF,2001.
The proportion of the amount of variation in retirement during 2001–2011 that can be
explained by the changes in women’s Age Pension eligibility can be similarly obtained with
(EF,2011−EF,2001)θ̂FRF,2011−RF,2001
.
Table 14: Counterfactual Health of Women in 2011 when RC
F,2011=RF,2001
Self–reported Physical Mental Overallgood health health health health
Actual case
HF,2001 0.768 68.979 74.501 71.740
HF,2011 0.767 67.902 73.286 70.594
HF,2011−HF,2001 –0.001 –1.077 –1.215 –1.146
Counterfactual case when RCF,2011=RF,2001
HCF,2011=HF,2011–(RF,2011−RF,2001)β̂F 0.806 69.730 75.4846 72.607
HCF,2011–HF,2011=–(RF,2011−RF,2001)β̂F 0.039 1.828 2.198 2.013
HCF,2011−HF,2001
HF,20115.085% 2.692% 3.000% 2.852%
HCF,2011−HF,2011 0.038 0.751 0.983 0.867
Proportion of the retirement rate different between 2001 and 2011 that was induced bythe change in Age Pension qualifying ages for females
(EF,2011−EF,2001)θ̂FRF,2011−RF,2001
7.042%
The counterfactual results are presented in Table 14. The actual health measures
in 2011 are found to be smaller than those in 2001 (HF,2011–HF,2001<0), indicating the
worsening of women’s health during the past decade. Had the retirement rate of Australian
women in 2011 been the same as in 2001, women’s counterfactual health in 2011 would
be better than the actual case (HC
F,2011–HF,2011>0). For example, in 2011, 76.7 percent of
women factually report a good, very good or excellent health status. The counterfactual
percentage of women reporting good health (HC
F,2011) would reach 80.6% when women’s
retirement rate had not changed between 2001 and 2011, representing an increase of 5.085
percent (H
CF,2011−HF,2001
HF,2011) from the current rate of 76.7 percent. The SF–36 physical, mental
and overall health measures would respectively be 2.692 percent, 3.000 percent and 2.852
percent higher than the current levels in the hypothetical case. We also find that 7.042
percent of the decrease in women’s retirement rates between 2001 and 2011 is causally
induced by the sequential increases in the Age Pension eligibility age from 61.5 in 2001
31

to 64.0 in 2011 among Australian women ((EF,2011−EF,2001)θ̂FRF,2011−RF,2001
). We safely predict that the
scheduled sequential increase in pension qualifying ages for the next decade will result in
further reduction in retirement rates of mature age people, which will subsequently lead
to unintended health deteriorations among both genders.
6 Conclusion
The paper contributes to the literature on the causal effects of retirement on health in
several important ways. First, we extend the scope of current literature to a country out-
side the US and Europe: Australia. Exploiting the Australian Age Pension eligibility ages
as the source of exogenous variations in retirement, we identify the causal effects of both
retirement status and retirement duration on health outcomes, using unconfidentialised
data from the Household, Income and labor Dynamics in Australia (HILDA) Survey. Sec-
ond, we uncover the heterogeneous effects of retirement status and retirement duration for
people with different levels of health status, and this type of heterogeneity was not ana-
lyzed in the previous literature. Third, this paper is the first to establish the causal links
between retirement and health investment behaviors such as physical exercising, smoking
and drinking. And finally, we provide a direct and quantifiable evaluation of the potential
unintended health consequences from the scheduled increases in the pension qualifying ages
for the next decade, using counterfactual analysis based on the causal estimates we have
obtained.
Our analysis show that both retirement status and retirement duration have positive
and significant effects on self–reported health, physical health and mental health outcomes
in Australia, and the effects are larger for Australian women. For example, Australian men
are 29.3 percent more likely to report good health when in retirement than in the labor
force, and effect is 39 percent for females. The retirement effects on health are found to be
very heterogeneous, and it is mainly the people with health index below the relevant me-
dian that experience the strongest health improvement from the transition into retirement
and the increasing exposure to retirement. Our analysis also show that retirement has a
32

causal relationship with participation in more physical activities and less smoking, and the
results are driven by the large and significant effects for Australian women. Furthermore,
our counterfactual analysis based on causal estimates show that had there been no gender
difference in retirement rates, women’s counterfactual health measures would be 3.0 to 7.2
percent lower than actual health. Had the female retirement rate remained the same in
2011 as in 2001, female health indexes would be 2.7 to 5.1 percent higher. Our counter-
factual analysis highlights two potentially unintended health consequences among mature
age people from the scheduled increases in the pension qualifying ages for the next decade:
the enlargement of male–female health difference and the deterioration in health status of
both genders. This implies that the anticipated alleviation of financial stress from reduced
government pension expenditures comes at the cost of greater gender health inequality and
increase in health care spending.
References
Agnew, J. (2013). “Australia’s retirement system: Strengths, weaknesses, and reforms”.
Center for Retirement Research Issue Brief 13–5, Boston College.
Arber, S. and H. Cooper (1999). “Gender differences in health in later life: the new
paradox?”. Social Science & Medicine 48, 61–76.
Atalay, K. and G. F. Barrett (2014). “The impact of age pension eligibility age on retire-
ment and program dependence: Evidence from an Australian experiement”. Review of
Economics and Statistics , forthcoming.
Bambra, C., D. Pope, V. Swami, D. Stanistreet, A. Roskam, A. Kunst, and A. Scott-
Samuel (2009). “Gender, health inequalities and welfare state regimes: a cross–national
study of 13 European countries”. Journal of Epidemiology and Community Health 63,
38–44.
Barrett, G. F. and Y.-P. Tseng (2008). “Retirement savings in Australia”. Canadian Public
Policy 34, 177–193.
33

Bonsang, E., S. Adam, and S. Perelman (2012). “Does retirement affect cognitive func-
tioning?”. Journal of Health Economics 31, 490–501.
Bound, J., M. Schoenbaum, T. Stinebrickner, and T. Waidmann (1999). “The dynamic
effects of health on the labor force transitions of older workers”. Labour Economics 6,
179–202.
Bound, J. and T. Waidmann (2007). “Estimating the health effects of retirement”. Uni-
versity of Michigan Retirement Research Center working paper 2007–168.
Cai, L. (2010). “The relationship between health and labour force participation: Evidence
from a panel data simultaneous equation model”. Labour Economics 17, 77–90.
Cai, L. and G. Kalb (2006). “Health status and labour force participation: Evidence from
Australia”. Health Economics 15, 241–261.
Charles, K. K. (2004). “Is retirement depressing? Labour force inactivity and psychological
well–being in later life”. Research in Labor Economics 23, 269–299.
Coe, B. N. and G. Zamarro (2011). “Retirement effect on health in Europe”. Journal of
Health Economics 30, 77–86.
Coe, N., H. von Gaudecker, M. Lindeboom, and J. Maurer (2012). “The effect of retirement
on cognitive functioning”. Health Economics 21, 913–927.
Dave, D., I. Rashad, and J. Spasojevic (2008). “The effects of retirement on physical and
mental health outcomes”. Southern Economic Journal 75, 497–523.
Disney, R., C. Emmerson, and M. Wakefield (2006). “Ill health and retirement in Britain:
A panel data–based analysis”. Journal of Health Economics 25, 621–649.
French, E. (2005). “The effects of health, wealth and wages on labour mobility and retire-
ment behavior”. Review of Economic Studies 72, 395–427.
Griliches, Z. and J. Hausman (1986). “Errors in variables in panel data”. Journal of
Econometrics 31, 91–118.
34

Hemingway, H., M. Stafford, S. Stansfeld, M. Shipley, and M. Marmot (1997). “Is the
SF–36 a valid measure of change in population health? Results from the Whitehall II
Study”. British Medical Journal 315, 1273–1279.
Hering, M. and T. R. Klassen (2010). “Is 70 the new 65? Raising the eligibility age in
the Canada pension”. Mowat Centre for Policy Innovation. School of Public Policy and
Governance, University of Toronto.
Lutz, W., W. Sanderson, and S. Scherbov (2008). “The coming acceleration of global
population ageing”. Nature 451, 716–719.
Mazzonna, F. and F. Peracchi (2012). “Ageing, cognitive abilities and retirement”. Euro-
pean Economic Review 56, 691–710.
Miles, L. (2007). “Physical activity and health”. Nutrition Bulletin 32, 314–363.
Neuman, K. (2008). “Quit your job and get healthier? The effect of retiremtn on health”.
Journal of Labor Research 29, 177–201.
Orfila, F., M. Ferrer, R. Lamarca, and J. Alonso (2000). “Evolution of self–rated health
status in the elderly: Cross–sectional vs. longitudinal estimates”. Journal of Clinical
Epidemiology 53, 563–570.
Pinquart, M. and S. Sorensen (2001). “Gender differences in self–concept and psychological
well–being in old age: A meta–analysis”. Journals of Gerontology: Series B 56, 195–213.
Richardson, S. (2013). “A reflection on the Household, Income and Labour Dynamics in
Australia Survey”. Australian Economic Review 46, 216–222.
Rohwedder, S. and R. J. Willis (2010). “Mental retirement”. Journal of Economic Per-
spectives 24, 119–138.
Ryan, C. and S. Whelan (2013). “Age pension eligibility, and female labour force participa-
tion”. Working paper, Melbourne Institute of Applied Economics and Social Research.
Salokangas, R. and M. Joukamaa (1991). “Physical and mental health changes in retirement
age”. Psychother Psychosom 55, 100–107.
35

Staiger, D. and J. H. Stock (1997). “Instrumental variables regression with weak instru-
ments”. Econometrica 65, 557–586.
Sturm, R. (2002). “The effects of obesity, smoking, and drinking on medical problems and
costs”. Health Affairs 21, 245–253.
van Solinge, H. (2007). “Health change in retirement: A longitudinal study among older
workers in the Netherlands”. Research on Ageing 29, 225–256.
Wooden, M. and N. Watson (2007). “The HILDA survey and its contribution to economic
and social research (so far)”. Economic Record 83, 208–231.
36