Embed Size (px)
Citation preview

7/28/2019 Ch 34 Lecture
http://slidepdf.com/reader/full/ch-34-lecture 1/60
© 2013 Pearson

7/28/2019 Ch 34 Lecture
http://slidepdf.com/reader/full/ch-34-lecture 2/60
© 2013 Pearson
Why has our dollar been sinking?

7/28/2019 Ch 34 Lecture
http://slidepdf.com/reader/full/ch-34-lecture 3/60
© 2013 Pearson
34When you have completed your
study of this chapter, you will be able to
1 Describe a country’s balance of payments accounts andexplain what determines the amount of internationalborrowing and lending.
2 Explain how the exchange rate is determined and why itfluctuates.
CHAPTER CHECKLIST
International Finance

7/28/2019 Ch 34 Lecture
http://slidepdf.com/reader/full/ch-34-lecture 4/60
© 2013 Pearson
34.1 FINANCING INTERNATIONAL TRADE
Balance of Payment Accounts
A country’s balance of payments accounts records
its international trading, borrowing, and lending.
Current account records goods and services to other countries (exports), minus payments for goods andservices bought from other countries (imports), plus the
net amount of interest and transfers received from andpaid to other countries.

7/28/2019 Ch 34 Lecture
http://slidepdf.com/reader/full/ch-34-lecture 5/60
© 2013 Pearson
34.1 FINANCING INTERNATIONAL TRADE
Capital account records foreign investment in theUnited States minus U.S. investment abroad.
Official settlements account records the change inU.S. official reserves.
U.S. official reserves are the government’s holdingsof foreign currency.
Table 34.1 on the next slide shows the U.S. balance of payments in 2010.

7/28/2019 Ch 34 Lecture
http://slidepdf.com/reader/full/ch-34-lecture 6/60
© 2013 Pearson
34.1 FINANCING INTERNATIONAL TRADE

7/28/2019 Ch 34 Lecture
http://slidepdf.com/reader/full/ch-34-lecture 7/60© 2013 Pearson
34.1 FINANCING INTERNATIONAL TRADE
Personal Analogy
A person’s current account records the income fromsupplying the services of factors of production and the
expenditures on goods and services. An example: In 2011, Joanne
• Worked and earned an income of $25,000.
• Had investments that paid an interest of $1,000.
Her income of $25,000 is analogous to a country’s export.
Her $1,000 of interest is analogous to a country’s interest
from foreigners.

7/28/2019 Ch 34 Lecture
http://slidepdf.com/reader/full/ch-34-lecture 8/60© 2013 Pearson
34.1 FINANCING INTERNATIONAL TRADE
Joanne:
• Spent $18,000 buying goods and services to consume.
• Bought an apartment, which cost her $60,000.
Joanne’s total expenditure was $78,000.
Her expenditure is analogous to a country’s imports.
Her current account balance was $26,000 – $78,000, adeficit of $52,000.

7/28/2019 Ch 34 Lecture
http://slidepdf.com/reader/full/ch-34-lecture 9/60© 2013 Pearson
34.1 FINANCING INTERNATIONAL TRADE
To pay the $52,000 deficit, Joanne borrowed $50,000 fromthe bank and used $2,000 that she had in her bankaccount.
Joanne’s borrowing is analogous to a country’s borrowingfrom the rest of the world.
The change in her bank account is analogous to the
change in the country’s official reserves.

7/28/2019 Ch 34 Lecture
http://slidepdf.com/reader/full/ch-34-lecture 10/60© 2013 Pearson
34.1 FINANCING INTERNATIONAL TRADE
Borrowers and Lenders, Debtors and Creditors
Net borrower is a country that is borrowing more from
the rest of the world than it is lending to the rest of theworld.
Net lender is a country that is lending more to the rest of the world than it is borrowing from the rest of the world.

7/28/2019 Ch 34 Lecture
http://slidepdf.com/reader/full/ch-34-lecture 11/60© 2013 Pearson
34.1 FINANCING INTERNATIONAL TRADE
Debtor nation is a country that during its entirehistory has borrowed more from the rest of the worldthan it has lent to it.
A debtor nation has a stock of outstanding debt to therest of the world that exceeds the stock of its ownclaims on the rest of the world.
Creditor nation is a country that has invested morein the rest of the world than other countries haveinvested in it.

7/28/2019 Ch 34 Lecture
http://slidepdf.com/reader/full/ch-34-lecture 12/60© 2013 Pearson
34.1 FINANCING INTERNATIONAL TRADE
Flows and Stocks
• Borrowing and lending are flows.
• Debts are stocks—amounts owed at a point in time.
The flow of borrowing and lending changes the stock of debt.
Since 1989, the total stock of U.S. borrowing from the restof the world has exceeded U.S. lending to the rest of theworld.

7/28/2019 Ch 34 Lecture
http://slidepdf.com/reader/full/ch-34-lecture 13/60© 2013 Pearson
34.1 FINANCING INTERNATIONAL TRADE
Current Account Balance
The largest items in the current account are exports and
imports. So net exports are the main component of thecurrent account.
We can define the current account balance (CAB) as
CAB = NX + Net interest and transfers from abroad
Net interest and transfers from abroad are small and don’tfluctuate much, so to study the current account balance welook at what determines net exports.

7/28/2019 Ch 34 Lecture
http://slidepdf.com/reader/full/ch-34-lecture 14/60© 2013 Pearson
34.1 FINANCING INTERNATIONAL TRADE
Net Exports
Private sector balance is saving minus investment.
Government sector balance is equal to net taxes minusgovernment expenditure on goods and services.
Table 34.2 on the next slide shows what determines net
exports.

7/28/2019 Ch 34 Lecture
http://slidepdf.com/reader/full/ch-34-lecture 15/60© 2013 Pearson
34.1 FINANCING INTERNATIONAL TRADE

7/28/2019 Ch 34 Lecture
http://slidepdf.com/reader/full/ch-34-lecture 16/60© 2013 Pearson
34.2 THE EXCHANGE RATE
Foreign exchange market is the market in which thecurrency of one country is exchanged for the currency of another.
The foreign exchange market is made up of importersand exporters, banks, and specialist dealers who buyand sell currencies.

7/28/2019 Ch 34 Lecture
http://slidepdf.com/reader/full/ch-34-lecture 17/60© 2013 Pearson
34.2 THE EXCHANGE RATE
Foreign exchange rate is the price at which onecurrency exchanges for another.
For example, in October 2011, one U.S. dollar bought75 euro cents. The exchange rate was 0.75 euros per dollar.
This exchange rate can be expressed in terms of dollars
(or cents) per euro. In October 2011, the exchange ratewas $1.33 per euro.

7/28/2019 Ch 34 Lecture
http://slidepdf.com/reader/full/ch-34-lecture 18/60© 2013 Pearson
34.2 THE EXCHANGE RATE
Currency appreciation is the rise in the value of onecurrency in terms of another currency.
For example, when the dollar rose from 0.86 euros in1999 to 1.17 euros in 2000, the dollar appreciated by36 percent.
Currency depreciation is the fall in the value of one
currency in terms of another currency.
For example, when the dollar fell from 1.17 euros in2001 to 0.63 euros in 2008, the dollar depreciated by46 percent.

7/28/2019 Ch 34 Lecture
http://slidepdf.com/reader/full/ch-34-lecture 19/60© 2013 Pearson
34.2 THE EXCHANGE RATE
The value of the foreign exchange rate fluctuates.
Sometimes the U.S. dollar depreciates and sometimes it
appreciates. Why?
The foreign exchange rate is a price and, like all prices,demand and supply in the foreign exchange marketdetermine its value.

7/28/2019 Ch 34 Lecture
http://slidepdf.com/reader/full/ch-34-lecture 20/60© 2013 Pearson
34.2 THE EXCHANGE RATE
Demand in the Foreign Exchange Market
The quantity of dollars demanded in the foreign exchange
market is the amount that traders plan to buy during agiven period at a given exchange rate.
The quantity of dollars demanded depends on
• The exchange rate
• Interest rates in the United States and other countries
• The expected future exchange rate

7/28/2019 Ch 34 Lecture
http://slidepdf.com/reader/full/ch-34-lecture 21/60© 2013 Pearson
34.2 THE EXCHANGE RATE
The Law of Demand for Foreign Exchange
Other things remaining the same, the higher the exchange
rate, the smaller is the quantity of dollars demanded.
The exchange rate influences the quantity of dollarsdemanded for two reasons:
• Exports effect
• Expected profit effect

7/28/2019 Ch 34 Lecture
http://slidepdf.com/reader/full/ch-34-lecture 22/60© 2013 Pearson
34.2 THE EXCHANGE RATE
Exports Effect
The larger the value of U.S. exports, the larger is the
quantity of dollars demanded on the foreign exchangemarket.
The lower the exchange rate, the cheaper areU.S.-made goods and services to people in the rest of the
world, the more the United States exports, and the greater is the quantity of U.S. dollars demanded to pay for them.

7/28/2019 Ch 34 Lecture
http://slidepdf.com/reader/full/ch-34-lecture 23/60© 2013 Pearson
34.2 THE EXCHANGE RATE
Expected Profit Effect
The larger the expected profit from holding dollars, the
greater is the quantity of dollars demanded in the foreignexchange market.
But the expected profit depends on the exchange rate.
The lower the exchange rate, other things remaining thesame, the larger is the expected profit from holding dollarsand the greater is the quantity of dollars demanded.

7/28/2019 Ch 34 Lecture
http://slidepdf.com/reader/full/ch-34-lecture 24/60
© 2013 Pearson
Figure 34.1 shows thedemand for dollars.
2. If the exchange rate falls,the quantity of dollarsdemanded increasesalong the demand curvefor dollars.
1. If the exchange raterises, the quantity of dollars demandeddecreases along thedemand curve for dollars.
34.2 THE EXCHANGE RATE

7/28/2019 Ch 34 Lecture
http://slidepdf.com/reader/full/ch-34-lecture 25/60
© 2013 Pearson
34.2 THE EXCHANGE RATE
Changes in the Demand for Dollars
A change in any influence (other than the exchange
rate) on the quantity of U.S. dollars that people plan tobuy in the foreign exchange market changes thedemand for U.S. dollars and shifts the demand curve for dollars.
These influences are
• Interest rates in the United States and other countries
• Expected future exchange rate
7/28/2019 Ch 34 Lecture
http://slidepdf.com/reader/full/ch-34-lecture 26/60
© 2013 Pearson
34.2 THE EXCHANGE RATE
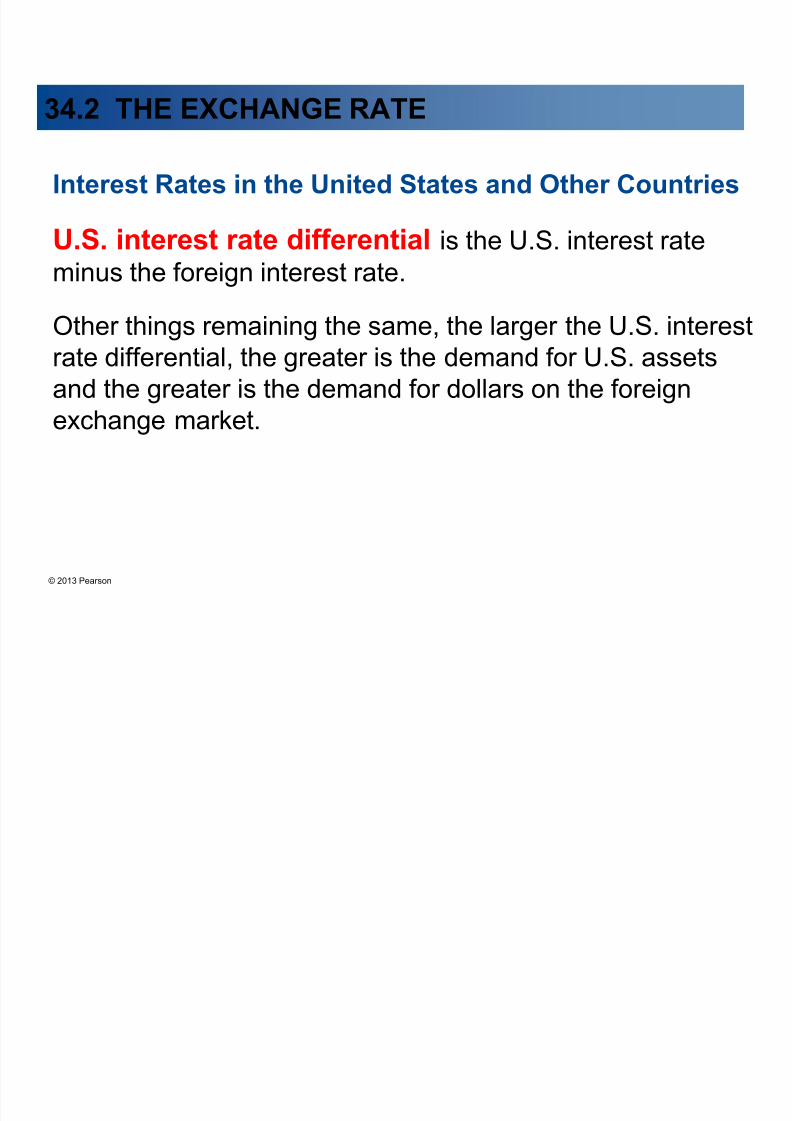
Interest Rates in the United States and Other Countries
U.S. interest rate differential is the U.S. interest rate
minus the foreign interest rate.
Other things remaining the same, the larger the U.S. interestrate differential, the greater is the demand for U.S. assetsand the greater is the demand for dollars on the foreign
exchange market.

7/28/2019 Ch 34 Lecture
http://slidepdf.com/reader/full/ch-34-lecture 27/60
© 2013 Pearson
34.2 THE EXCHANGE RATE
The Expected Future Exchange Rate
Other things remaining the same, the higher the expected
future exchange rate, the greater is the demand for dollars.
The higher the expected future exchange rate, the larger is the expected profit from holding dollars, so the larger is
the quantity of dollars that people plan to buy on theforeign exchange market.

7/28/2019 Ch 34 Lecture
http://slidepdf.com/reader/full/ch-34-lecture 28/60
© 2013 Pearson
Figure 34.2 showschanges in the demandfor dollars.
34.2 THE EXCHANGE RATE
1. An increase in thedemand for dollars.
2. A decrease in thedemand for dollars.

7/28/2019 Ch 34 Lecture
http://slidepdf.com/reader/full/ch-34-lecture 29/60
© 2013 Pearson
34.2 THE EXCHANGE RATE
Supply in the Foreign Exchange Market
The quantity of U.S dollars supplied in the foreign
exchange market is the amount that traders plan to sellduring a given time period at a given exchange rate.
The quantity of U.S. dollars supplied depends on manyfactors, but the main ones are
• The exchange rate
• Interest rates in the United States and other countries
• The expected future exchange rate

7/28/2019 Ch 34 Lecture
http://slidepdf.com/reader/full/ch-34-lecture 30/60
© 2013 Pearson
34.2 THE EXCHANGE RATE
The Law of Supply of Foreign Exchange
Traders supply U.S. dollars in the foreign exchangemarket when they buy other currencies.
Other things remaining the same, the higher the exchangerate, the greater is the quantity of U.S. dollars supplied inthe foreign exchange market.
The exchange rate influences the quantity of dollarssupplied for two reasons:
• Imports effect
• Expected profit effect

7/28/2019 Ch 34 Lecture
http://slidepdf.com/reader/full/ch-34-lecture 31/60
© 2013 Pearson
34.2 THE EXCHANGE RATE
Imports Effect
The larger the value of U.S. imports, the larger is thequantity of foreign currency demanded to pay for theseimports.
When people buy foreign currency, they supply dollars.
Other things remaining the same, the higher the exchangerate, the cheaper are foreign-made goods and services to
Americans. So the more the United States imports, thegreater is the quantity of U.S. dollars supplied on theforeign exchange market.

7/28/2019 Ch 34 Lecture
http://slidepdf.com/reader/full/ch-34-lecture 32/60
© 2013 Pearson
34.2 THE EXCHANGE RATE
Expected Profit Effect
The larger the expected profit from holding a foreigncurrency, the greater is the quantity of that currencydemanded and so the greater is the quantity of dollarssupplied in the foreign exchange market.
The expected profit depends on the exchange rate.
Other things remaining the same, the higher theexchange rate, the larger is the expected profit fromselling dollars and the greater is the quantity of dollarssupplied in the foreign exchange market.

7/28/2019 Ch 34 Lecture
http://slidepdf.com/reader/full/ch-34-lecture 33/60
© 2013 Pearson
Figure 34.3 shows thesupply of dollars.
2. If the exchange ratefalls, the quantity of dollars supplieddecreases along the
supply curve for dollars.
1. If the exchange rate
rises, the quantity of dollars suppliedincreases along thesupply curve for dollars.
34.2 THE EXCHANGE RATE

7/28/2019 Ch 34 Lecture
http://slidepdf.com/reader/full/ch-34-lecture 34/60
© 2013 Pearson
34.2 THE EXCHANGE RATE
Changes in the Supply of Dollars
A change in any influence (other than the current
exchange rate) on the quantity of U.S. dollars thatpeople plan to sell in the foreign exchange marketchanges the supply of U.S. dollars and shifts the supplycurve for dollars.
These influences are
• Interest rates in the United States and other countries
• Expected future exchange rate

7/28/2019 Ch 34 Lecture
http://slidepdf.com/reader/full/ch-34-lecture 35/60
© 2013 Pearson
34.2 THE EXCHANGE RATE
Interest Rates in the United States and Other
Countries
The larger the U.S. interest rate differential, the smaller is the demand for foreign assets, so the smaller is thesupply of U.S. dollars on the foreign exchange market.

7/28/2019 Ch 34 Lecture
http://slidepdf.com/reader/full/ch-34-lecture 36/60
© 2013 Pearson
34.2 THE EXCHANGE RATE
The Expected Future Exchange Rate
Other things remaining the same, the higher the expected
future exchange rate, the smaller is the expected profitfrom selling U.S. dollars today, so the smaller is the supplyof dollars today.

7/28/2019 Ch 34 Lecture
http://slidepdf.com/reader/full/ch-34-lecture 37/60
© 2013 Pearson
Figure 34.4 showschanges in the supplyof dollars.
34.2 THE EXCHANGE RATE
1. An increase in thesupply of dollars.
2. A decrease in the
supply of dollars.

7/28/2019 Ch 34 Lecture
http://slidepdf.com/reader/full/ch-34-lecture 38/60
© 2013 Pearson
34.2 THE EXCHANGE RATE
Market Equilibrium
Demand and supply in the foreign exchange market
determines the exchange rate.
If the exchange rate is too low, there is a shortage of dollars.
If the exchange rate is too high, there is a surplus of dollars.
At the equilibrium exchange rate, there is neither ashortage nor a surplus of dollars.

7/28/2019 Ch 34 Lecture
http://slidepdf.com/reader/full/ch-34-lecture 39/60
© 2013 Pearson
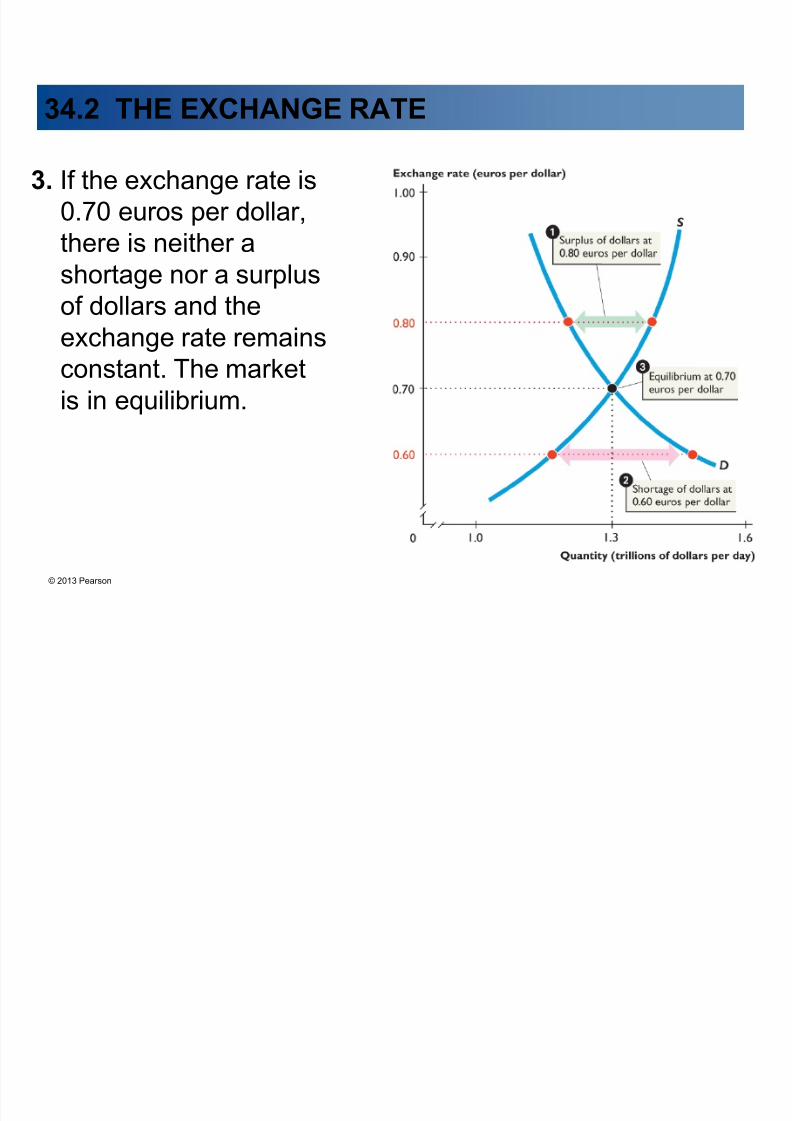
Figure 34.5 shows theequilibrium exchange rate.
1. If the exchange rate is0.80 euros per dollar,there is a surplus of dollars and the exchangerate falls.
2. If the exchange rate is0.60 euros per dollar,there is a shortage of dollars and the exchange
rate rises.
34.2 THE EXCHANGE RATE
7/28/2019 Ch 34 Lecture
http://slidepdf.com/reader/full/ch-34-lecture 40/60
© 2013 Pearson
3. If the exchange rate is0.70 euros per dollar,there is neither a
shortage nor a surplusof dollars and theexchange rate remainsconstant. The marketis in equilibrium.
34.2 THE EXCHANGE RATE

7/28/2019 Ch 34 Lecture
http://slidepdf.com/reader/full/ch-34-lecture 41/60
© 2013 Pearson
34.2 THE EXCHANGE RATE
Why Exchange Rates Are Volatile
Sometimes the dollar appreciates and at other times it
depreciates, but the quantity of dollars traded each daybarely changes.
Why?
The main reason is that demand and supply are notindependent in the foreign exchange market.

7/28/2019 Ch 34 Lecture
http://slidepdf.com/reader/full/ch-34-lecture 42/60
© 2013 Pearson
34.2 THE EXCHANGE RATE
Suppose that a Big Mac costs $4 (Canadian) in Torontoand $3 (U.S.) in New York.
If the exchange rate is $1.33 Canadian per U.S. dollar,
then the two monies have the same value—you can buya Big Mac in Toronto or New York for either $4 Canadianor $3 U.S.
But if a Big Mac in New York rises to $4 and theexchange rate remains at $1.33 Canadian per U.S.dollar, then money buys more in Canada than in theUnited States.
Money does not have equal value.

7/28/2019 Ch 34 Lecture
http://slidepdf.com/reader/full/ch-34-lecture 43/60
© 2013 Pearson
34.2 THE EXCHANGE RATE
The value of money is determined by the price level.
If prices in the United States rise faster than those of other countries, people will generally expect the foreignexchange value of the U.S. dollar to fall.
Demand for U.S. dollars will decrease, and supply of U.S. dollars will increase.
The U.S. dollar exchange rate will fall.
The U.S. dollar depreciates.

7/28/2019 Ch 34 Lecture
http://slidepdf.com/reader/full/ch-34-lecture 44/60
© 2013 Pearson
34.2 THE EXCHANGE RATE
If prices in the United States rise more slowly than thoseof other countries, people will generally expect theforeign exchange value of the U.S. dollar to rise.
Demand for U.S. dollars will increase, and supply of U.S. dollars will decrease.
The U.S. dollar exchange rate will rise.
The U.S. dollar appreciates.

7/28/2019 Ch 34 Lecture
http://slidepdf.com/reader/full/ch-34-lecture 45/60
© 2013 Pearson
34.2 THE EXCHANGE RATE
Interest Rate Parity
Interest rate parity means equal interest rates—a
situation in which the interest rate in one currency equalsthe interest rate in another currency when exchange ratechanges are taken into account.

7/28/2019 Ch 34 Lecture
http://slidepdf.com/reader/full/ch-34-lecture 46/60
© 2013 Pearson
34.2 THE EXCHANGE RATE
Suppose a Canadian dollar deposit in a Toronto bankearns 5 percent a year and the U.S. dollar deposit inNew York earns 3 percent a year.
If people expect the Canadian dollar to depreciate by2 percent in a year, then the expected fall in the value of the Canadian dollar must be subtracted to calculate thenet return on the Canadian dollar deposit.
The net return on the Canadian dollar deposit is3 percent (5 percent minus 2 percent) a year.
Interest rate parity holds.

7/28/2019 Ch 34 Lecture
http://slidepdf.com/reader/full/ch-34-lecture 47/60
© 2013 Pearson
34.2 THE EXCHANGE RATE
Adjusted for risk, interest rate parity always holds.
Traders in the foreign exchange market move their funds
into the currencies that earn the highest return.
This action of buying and selling currencies brings aboutinterest rate parity.

7/28/2019 Ch 34 Lecture
http://slidepdf.com/reader/full/ch-34-lecture 48/60
© 2013 Pearson
34.2 THE EXCHANGE RATE
Monetary Policy and the Exchange Rate
Monetary policy influences the U.S. interest rate, so theFed’s actions influence the U.S. dollar exchange rate.
If the U.S. interest rate rises relative to those in other countries, the value of the U.S. dollar rises on the foreignexchange market.
If foreign interest rate rises relative to U.S. interest rate,the value of the U.S. dollar falls on the foreign exchangemarket.
So the exchange rate responds to monetary policy.

7/28/2019 Ch 34 Lecture
http://slidepdf.com/reader/full/ch-34-lecture 49/60
© 2013 Pearson
34.2 THE EXCHANGE RATE
Pegging the Exchange Rate
But the Fed can intervene directly in the foreign exchange
market to influence the exchange rate.The Fed can try to smooth out fluctuations in the exchangerate by changing the supply of U.S. dollars.
The Fed changes the supply of U.S. dollars on the foreignexchange market by buying or selling U.S. dollars.

7/28/2019 Ch 34 Lecture
http://slidepdf.com/reader/full/ch-34-lecture 50/60
© 2013 Pearson
Figure 34.6 shows foreignmarket intervention.
1. If demand increases fromD
0 toD
1, the Fed sellsU.S. dollars to increasethe supply of dollars.
34.2 THE EXCHANGE RATE
Suppose that the Fed’s
target exchange rate is0.70 euros per dollar.

7/28/2019 Ch 34 Lecture
http://slidepdf.com/reader/full/ch-34-lecture 51/60
© 2013 Pearson
2. If demand decreasesfrom D0 to D2, the Fedbuys U.S. dollars to
decrease the supply of dollars.
34.2 THE EXCHANGE RATE
Persistent intervention on
one side of the marketcannot be sustained.

7/28/2019 Ch 34 Lecture
http://slidepdf.com/reader/full/ch-34-lecture 52/60
© 2013 Pearson
34.2 THE EXCHANGE RATE
The People’s Bank of China in the ForeignExchange Market
The People’s Bank of China has been pilingup reserves of U.S.dollars since 2000.

7/28/2019 Ch 34 Lecture
http://slidepdf.com/reader/full/ch-34-lecture 53/60
© 2013 Pearson
At the target exchange rate,the yuan is undervalued.
34.2 THE EXCHANGE RATE
3. To keep the exchange rate
pegged at its target, thePeople's Bank of Chinamust buy U.S. dollars inexchange for yuan.
China’s reserves of U.S.dollars pile up.
Only by allowing the yuan toappreciate can China stop
piling up U.S. dollars

7/28/2019 Ch 34 Lecture
http://slidepdf.com/reader/full/ch-34-lecture 54/60
© 2013 Pearson

7/28/2019 Ch 34 Lecture
http://slidepdf.com/reader/full/ch-34-lecture 55/60
© 2013 Pearson
Our dollar has been on a falling trend since the early2000s but it hasn’t always been sinking.
A Rising Dollar: 1999 –2000
Between 1999 and 2000, the dollar appreciatedagainst the euro.
It rose from 0.86 euros to 1.17 euros per dollar.
Figure 1 on the next slide explains why thishappened.
Why Has Our Dollar Been Sinking?

7/28/2019 Ch 34 Lecture
http://slidepdf.com/reader/full/ch-34-lecture 56/60
© 2013 Pearson
In 1999, the demand andsupply curves were thoselabeled D99 and S 99.
The equilibrium exchange
rate was 0.86 euros per dollar —where the quantityof dollars suppliedequaled the quantity of
dollars demanded.
Why Has Our Dollar Been Sinking?

7/28/2019 Ch 34 Lecture
http://slidepdf.com/reader/full/ch-34-lecture 57/60
© 2013 Pearson
During 2000, the U.S.economy expanded faster than the European economy.
The interest rate in Europe
was 2 percentage pointslower than the U.S. interestrate.
The euro was expected todepreciate against thedollar ―the dollar wasexpected to appreciateagainst the euro.
Why Has Our Dollar Been Sinking?
7/28/2019 Ch 34 Lecture
http://slidepdf.com/reader/full/ch-34-lecture 58/60
© 2013 Pearson
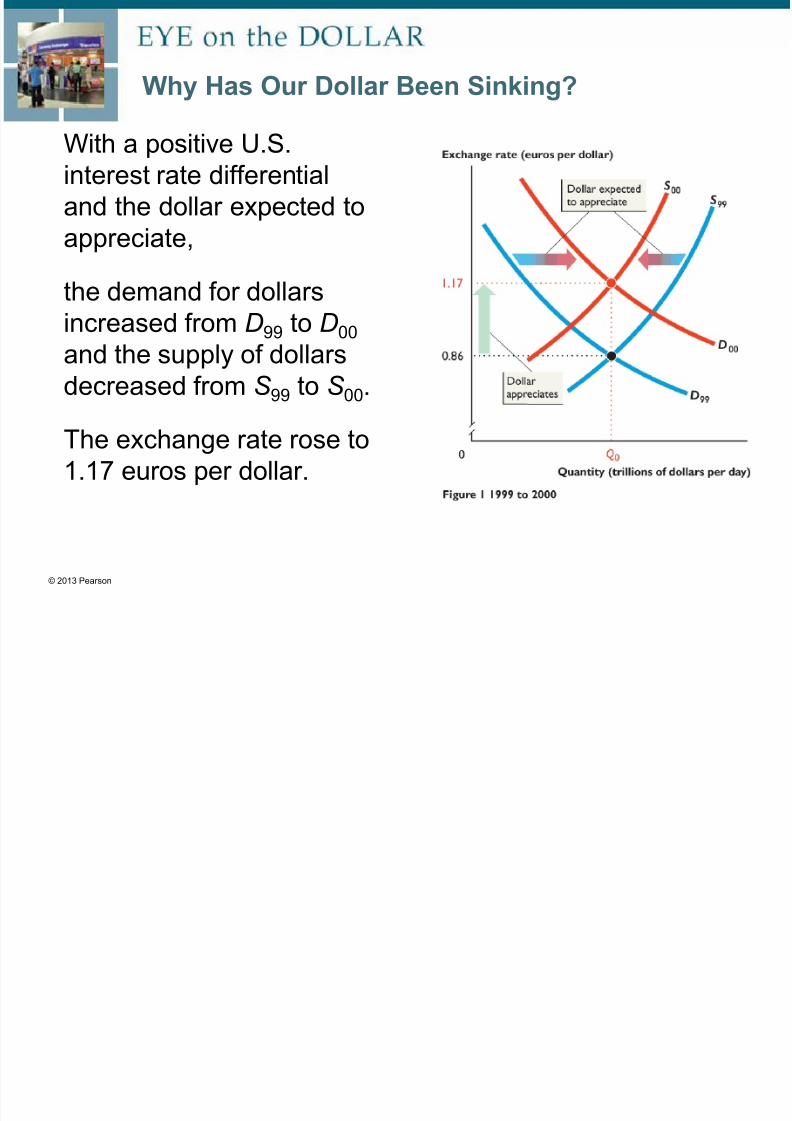
With a positive U.S.interest rate differentialand the dollar expected toappreciate,
the demand for dollarsincreased from D99 to D00 and the supply of dollarsdecreased from S 99 to S 00.
The exchange rate rose to1.17 euros per dollar.
Why Has Our Dollar Been Sinking?
7/28/2019 Ch 34 Lecture
http://slidepdf.com/reader/full/ch-34-lecture 59/60
© 2013 Pearson
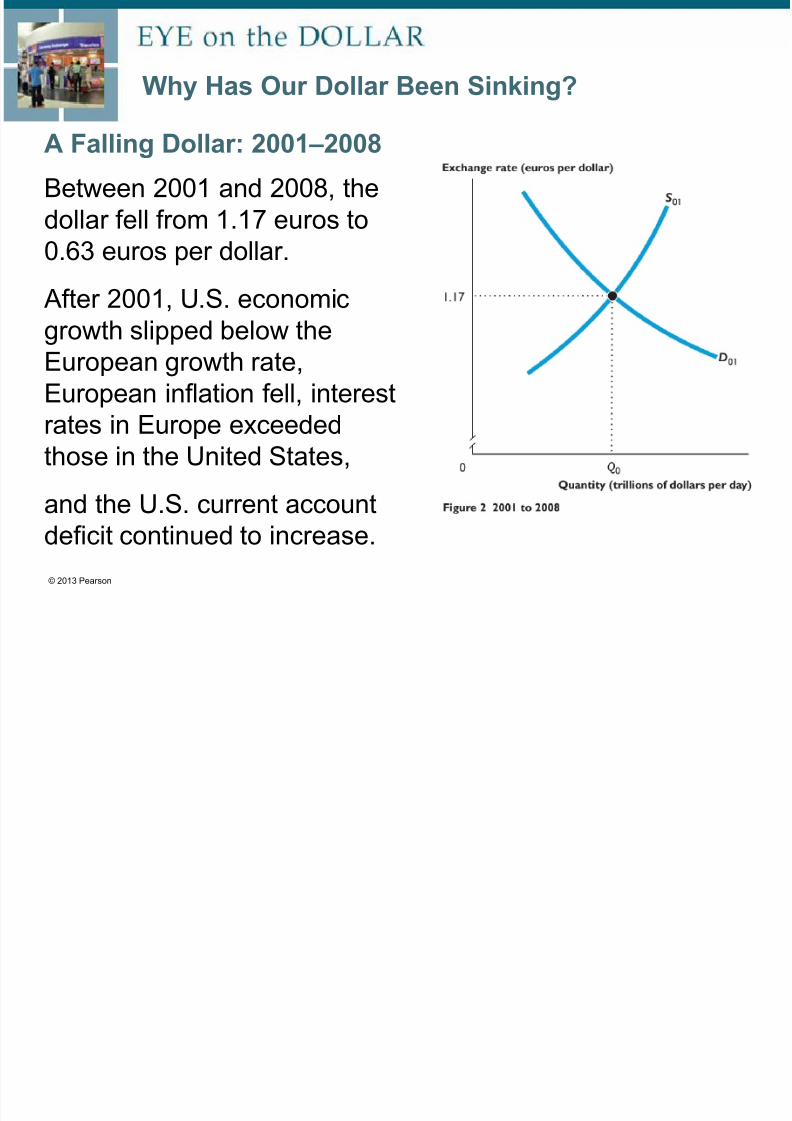
A Falling Dollar: 2001 –2008Between 2001 and 2008, thedollar fell from 1.17 euros to0.63 euros per dollar.
After 2001, U.S. economicgrowth slipped below theEuropean growth rate,European inflation fell, interest
rates in Europe exceededthose in the United States,
and the U.S. current accountdeficit continued to increase.
Why Has Our Dollar Been Sinking?

7/28/2019 Ch 34 Lecture
http://slidepdf.com/reader/full/ch-34-lecture 60/60
Under these conditions,
currency traders expectedthe exchange rate to fall –thedollar to depreciate against
the euro.
The demand for dollarsdecreased to D08 and thesupply of dollars increasedto S 08.
The exchange rate fell to0.63 euros per dollar.
Why Has Our Dollar Been Sinking?