Embed Size (px)
Citation preview
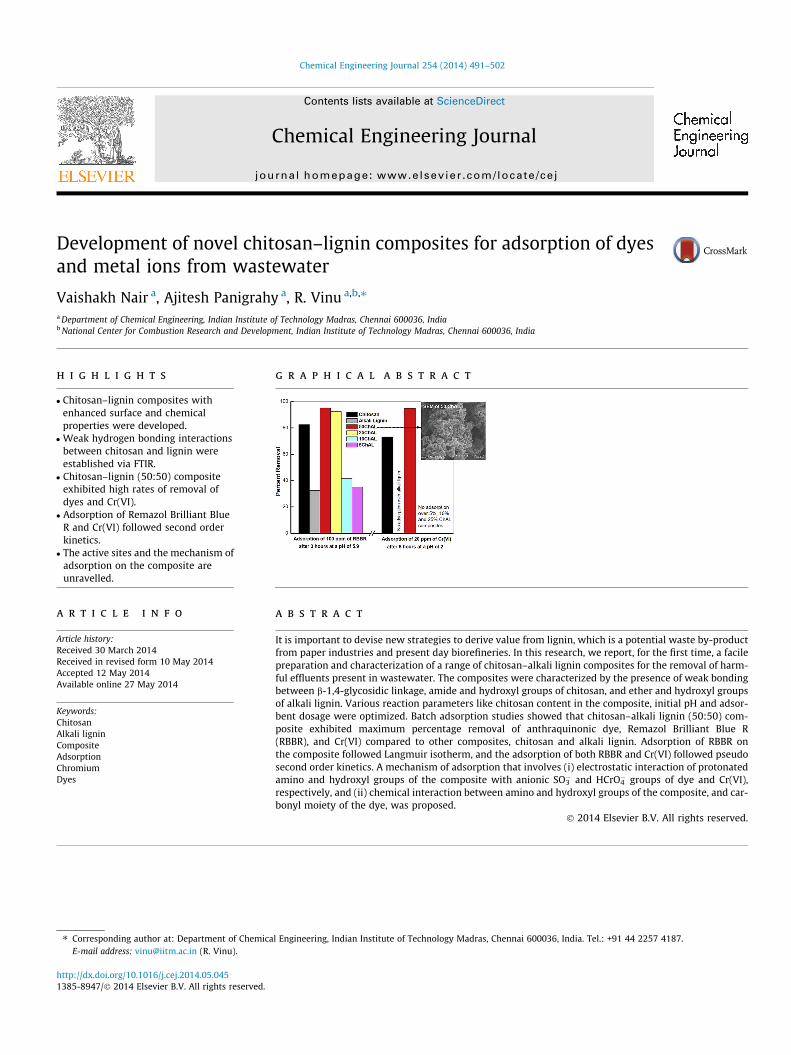
Chemical Engineering Journal 254 (2014) 491–502
Contents lists available at ScienceDirect
Chemical Engineering Journal
journal homepage: www.elsevier .com/locate /cej
Development of novel chitosan–lignin composites for adsorption of dyesand metal ions from wastewater
http://dx.doi.org/10.1016/j.cej.2014.05.0451385-8947/� 2014 Elsevier B.V. All rights reserved.
⇑ Corresponding author at: Department of Chemical Engineering, Indian Institute of Technology Madras, Chennai 600036, India. Tel.: +91 44 2257 4187.E-mail address: [email protected] (R. Vinu).
Vaishakh Nair a, Ajitesh Panigrahy a, R. Vinu a,b,⇑a Department of Chemical Engineering, Indian Institute of Technology Madras, Chennai 600036, Indiab National Center for Combustion Research and Development, Indian Institute of Technology Madras, Chennai 600036, India
h i g h l i g h t s
� Chitosan–lignin composites withenhanced surface and chemicalproperties were developed.� Weak hydrogen bonding interactions
between chitosan and lignin wereestablished via FTIR.� Chitosan–lignin (50:50) composite
exhibited high rates of removal ofdyes and Cr(VI).� Adsorption of Remazol Brilliant Blue
R and Cr(VI) followed second orderkinetics.� The active sites and the mechanism of
adsorption on the composite areunravelled.
g r a p h i c a l a b s t r a c t
a r t i c l e i n f o
Article history:Received 30 March 2014Received in revised form 10 May 2014Accepted 12 May 2014Available online 27 May 2014
Keywords:ChitosanAlkali ligninCompositeAdsorptionChromiumDyes
a b s t r a c t
It is important to devise new strategies to derive value from lignin, which is a potential waste by-productfrom paper industries and present day biorefineries. In this research, we report, for the first time, a facilepreparation and characterization of a range of chitosan–alkali lignin composites for the removal of harm-ful effluents present in wastewater. The composites were characterized by the presence of weak bondingbetween b-1,4-glycosidic linkage, amide and hydroxyl groups of chitosan, and ether and hydroxyl groupsof alkali lignin. Various reaction parameters like chitosan content in the composite, initial pH and adsor-bent dosage were optimized. Batch adsorption studies showed that chitosan–alkali lignin (50:50) com-posite exhibited maximum percentage removal of anthraquinonic dye, Remazol Brilliant Blue R(RBBR), and Cr(VI) compared to other composites, chitosan and alkali lignin. Adsorption of RBBR onthe composite followed Langmuir isotherm, and the adsorption of both RBBR and Cr(VI) followed pseudosecond order kinetics. A mechanism of adsorption that involves (i) electrostatic interaction of protonatedamino and hydroxyl groups of the composite with anionic SO3
� and HCrO4� groups of dye and Cr(VI),
respectively, and (ii) chemical interaction between amino and hydroxyl groups of the composite, and car-bonyl moiety of the dye, was proposed.
� 2014 Elsevier B.V. All rights reserved.
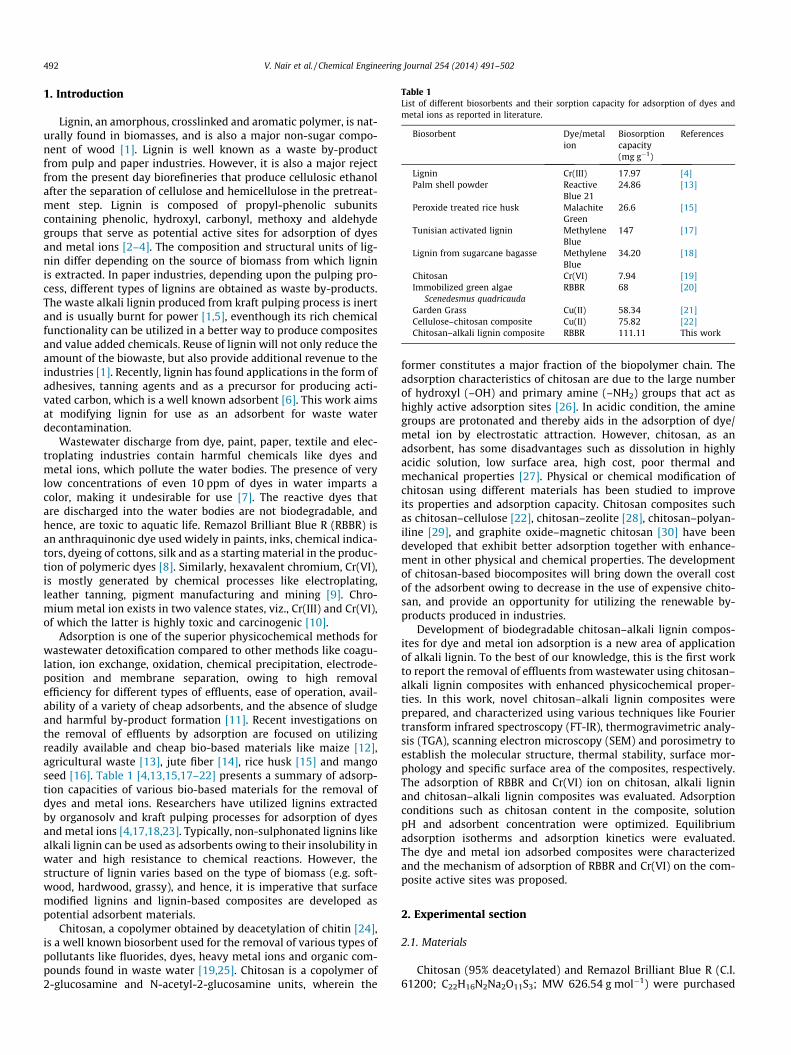
Table 1List of different biosorbents and their sorption capacity for adsorption of dyes andmetal ions as reported in literature.
Biosorbent Dye/metalion
Biosorptioncapacity(mg g�1)
References
Lignin Cr(III) 17.97 [4]Palm shell powder Reactive
Blue 2124.86 [13]
Peroxide treated rice husk MalachiteGreen
26.6 [15]
Tunisian activated lignin MethyleneBlue
147 [17]
Lignin from sugarcane bagasse MethyleneBlue
34.20 [18]
Chitosan Cr(VI) 7.94 [19]Immobilized green algae
Scenedesmus quadricaudaRBBR 68 [20]
Garden Grass Cu(II) 58.34 [21]Cellulose–chitosan composite Cu(II) 75.82 [22]Chitosan–alkali lignin composite RBBR 111.11 This work
492 V. Nair et al. / Chemical Engineering Journal 254 (2014) 491–502
1. Introduction
Lignin, an amorphous, crosslinked and aromatic polymer, is nat-urally found in biomasses, and is also a major non-sugar compo-nent of wood [1]. Lignin is well known as a waste by-productfrom pulp and paper industries. However, it is also a major rejectfrom the present day biorefineries that produce cellulosic ethanolafter the separation of cellulose and hemicellulose in the pretreat-ment step. Lignin is composed of propyl-phenolic subunitscontaining phenolic, hydroxyl, carbonyl, methoxy and aldehydegroups that serve as potential active sites for adsorption of dyesand metal ions [2–4]. The composition and structural units of lig-nin differ depending on the source of biomass from which ligninis extracted. In paper industries, depending upon the pulping pro-cess, different types of lignins are obtained as waste by-products.The waste alkali lignin produced from kraft pulping process is inertand is usually burnt for power [1,5], eventhough its rich chemicalfunctionality can be utilized in a better way to produce compositesand value added chemicals. Reuse of lignin will not only reduce theamount of the biowaste, but also provide additional revenue to theindustries [1]. Recently, lignin has found applications in the form ofadhesives, tanning agents and as a precursor for producing acti-vated carbon, which is a well known adsorbent [6]. This work aimsat modifying lignin for use as an adsorbent for waste waterdecontamination.
Wastewater discharge from dye, paint, paper, textile and elec-troplating industries contain harmful chemicals like dyes andmetal ions, which pollute the water bodies. The presence of verylow concentrations of even 10 ppm of dyes in water imparts acolor, making it undesirable for use [7]. The reactive dyes thatare discharged into the water bodies are not biodegradable, andhence, are toxic to aquatic life. Remazol Brilliant Blue R (RBBR) isan anthraquinonic dye used widely in paints, inks, chemical indica-tors, dyeing of cottons, silk and as a starting material in the produc-tion of polymeric dyes [8]. Similarly, hexavalent chromium, Cr(VI),is mostly generated by chemical processes like electroplating,leather tanning, pigment manufacturing and mining [9]. Chro-mium metal ion exists in two valence states, viz., Cr(III) and Cr(VI),of which the latter is highly toxic and carcinogenic [10].
Adsorption is one of the superior physicochemical methods forwastewater detoxification compared to other methods like coagu-lation, ion exchange, oxidation, chemical precipitation, electrode-position and membrane separation, owing to high removalefficiency for different types of effluents, ease of operation, avail-ability of a variety of cheap adsorbents, and the absence of sludgeand harmful by-product formation [11]. Recent investigations onthe removal of effluents by adsorption are focused on utilizingreadily available and cheap bio-based materials like maize [12],agricultural waste [13], jute fiber [14], rice husk [15] and mangoseed [16]. Table 1 [4,13,15,17–22] presents a summary of adsorp-tion capacities of various bio-based materials for the removal ofdyes and metal ions. Researchers have utilized lignins extractedby organosolv and kraft pulping processes for adsorption of dyesand metal ions [4,17,18,23]. Typically, non-sulphonated lignins likealkali lignin can be used as adsorbents owing to their insolubility inwater and high resistance to chemical reactions. However, thestructure of lignin varies based on the type of biomass (e.g. soft-wood, hardwood, grassy), and hence, it is imperative that surfacemodified lignins and lignin-based composites are developed aspotential adsorbent materials.
Chitosan, a copolymer obtained by deacetylation of chitin [24],is a well known biosorbent used for the removal of various types ofpollutants like fluorides, dyes, heavy metal ions and organic com-pounds found in waste water [19,25]. Chitosan is a copolymer of2-glucosamine and N-acetyl-2-glucosamine units, wherein the
former constitutes a major fraction of the biopolymer chain. Theadsorption characteristics of chitosan are due to the large numberof hydroxyl (–OH) and primary amine (–NH2) groups that act ashighly active adsorption sites [26]. In acidic condition, the aminegroups are protonated and thereby aids in the adsorption of dye/metal ion by electrostatic attraction. However, chitosan, as anadsorbent, has some disadvantages such as dissolution in highlyacidic solution, low surface area, high cost, poor thermal andmechanical properties [27]. Physical or chemical modification ofchitosan using different materials has been studied to improveits properties and adsorption capacity. Chitosan composites suchas chitosan–cellulose [22], chitosan–zeolite [28], chitosan–polyan-iline [29], and graphite oxide–magnetic chitosan [30] have beendeveloped that exhibit better adsorption together with enhance-ment in other physical and chemical properties. The developmentof chitosan-based biocomposites will bring down the overall costof the adsorbent owing to decrease in the use of expensive chito-san, and provide an opportunity for utilizing the renewable by-products produced in industries.
Development of biodegradable chitosan–alkali lignin compos-ites for dye and metal ion adsorption is a new area of applicationof alkali lignin. To the best of our knowledge, this is the first workto report the removal of effluents from wastewater using chitosan–alkali lignin composites with enhanced physicochemical proper-ties. In this work, novel chitosan–alkali lignin composites wereprepared, and characterized using various techniques like Fouriertransform infrared spectroscopy (FT-IR), thermogravimetric analy-sis (TGA), scanning electron microscopy (SEM) and porosimetry toestablish the molecular structure, thermal stability, surface mor-phology and specific surface area of the composites, respectively.The adsorption of RBBR and Cr(VI) ion on chitosan, alkali ligninand chitosan–alkali lignin composites was evaluated. Adsorptionconditions such as chitosan content in the composite, solutionpH and adsorbent concentration were optimized. Equilibriumadsorption isotherms and adsorption kinetics were evaluated.The dye and metal ion adsorbed composites were characterizedand the mechanism of adsorption of RBBR and Cr(VI) on the com-posite active sites was proposed.
2. Experimental section
2.1. Materials
Chitosan (95% deacetylated) and Remazol Brilliant Blue R (C.I.61200; C22H16N2Na2O11S3; MW 626.54 g mol�1) were purchased
4000 3500 3000 2500 2000 1500 1000 500
-C-H stretching
% T
rans
mitt
ance
Wavenumber(cm-1)
Alkali lignin
Chitosan
50ChAL
-NH2 bending
-OH bending
-NH
bending-C-Ostretching
-OH,-NH2stretching
Fig. 1. FT-IR spectra of alkali lignin, chitosan and 50ChAL composite.
V. Nair et al. / Chemical Engineering Journal 254 (2014) 491–502 493
from Sisco Research Laboratories, India. Alkali lignin (CAS No.8068051) was obtained from Sigma Aldrich. Orange G (C.I.116230; C16H10N2Na2O7S2; MW 452.37 g mol�1) and MalachiteGreen (C.I. 42000; C52H54N4O12; MW 927.02 g mol�1) were pur-chased from S.D. Fine Chem., and Thermo Fisher Scientific, India,respectively. Rhodamine B (C.I. 45170; C28H31CIN2O3; MW479.02 g mol�1) and Alizarin Red S (C.I. 58005; C14H7NaO7S; MW342.26 g mol�1) were obtained from HiMedia Laboratories, India.Potassium dichromate (K2Cr2O7) was procured from Ranbaxy FineChemicals, India. All the chemicals were used as received. All solu-tions were prepared using double distilled water.
2.2. Preparation of chitosan–alkali lignin composites
A known concentration of alkali lignin was added to 100 mL ofdouble distilled water and stirred well. An aqueous solution ofchitosan was prepared in 100 mL of aqueous acetic acid (2% v/v)and stirred well to form a homogeneous solution. The alkali ligninsolution was then added to the dissolved chitosan solution, andstirred at 300 rpm for 3 h. The chitosan–alkali lignin mixture wasthen filtered and dried at room temperature for 48 h. The compos-ite was powdered and then washed with double distilled water.The composite was then vacuum filtered using 0.45 lm nylonmembrane and finally dried at 100 �C for 3 h. Different concentra-tions of chitosan:alkali lignin composites, viz., 5:95 wt.% (hence-forth denoted as 5ChAL), 10:90 wt.% (10ChAL), 25:75 wt.%(25ChAL), 50:50 wt.% (50ChAL) were prepared according to theabove procedure. Preparation of the composite using any furtherhigher concentration of chitosan resulted in the formation of a jellymass owing to high crosslinking. Importantly, the main aim of thework is to utilize significant amounts of alkali lignin in the com-posite to replace the costly chitosan, and hence, composites up to50ChAL were subjected to further investigation.
2.3. Characterization of ChAL composites
The FT-IR spectra of the composites, chitosan and alkali ligninwere recorded in Agilent Cary 660 FT-IR spectrometer in the rangeof 4000–400 cm�1 in transmittance mode with 16 scans, and a res-olution of 4 cm�1. The samples were analyzed in the form of KBrpellets. Thermogravimetric analyses (TGA) of the composites,chitosan, alkali lignin and physical mixtures were performed inSDT Q 600 TGA (T.A. instruments) under nitrogen atmosphere(100 mL min�1) from 25 �C to 900 �C at a heating rate of20 �C min�1. In order to evaluate the apparent activation energyof decomposition, 50ChAL, chitosan and alkali lignin were sub-jected to TGA at multiple heating rates from 5 to 30 �C min�1.The surface morphology of the composites was characterized usinga Hitachi S-4800 High Resolution SEM. The specific surface areaand pore size of the materials were obtained by nitrogen adsorp-tion–desorption isotherm at 77 K using Micromeritics ASAP 2020porosimeter. Specific surface area and pore sizes were evaluatedusing Brunauer Emmett Teller (BET) and Barrett Joyner Halenda(BJH) methods, respectively. Energy dispersive X-ray analyses(EDS) of the composites and Cr(VI)-adsorbed composite were per-formed using JEOL JSM-7610F Field Emission SEM.
2.4. Batch experiments for dye and metal ion adsorption
A stock solution of 500 mg L�1 of RBBR was prepared and wasfurther diluted to obtain different concentrations from 10 mg L�1
to 300 mg L�1. The adsorption experiments were carried out atambient temperature (27 ± 2 �C) using 50 mL of the dye solutionand 0.1 g of the adsorbent and continuously stirred at 250 rpm.The natural pH of the dye solution was 5.9 ± 0.1. Aqueous solutionsof Cr(VI) of different concentrations were prepared by diluting
500 mg L�1 of K2Cr2O7 stock solution. The volume of metal ionsolution and the concentration of the adsorbent used were similarto the experiments of dye adsorption. The adsorption experimentsof Cr(VI) were conducted at a pH of 2, as the percentage adsorptionof Cr(VI) for various chitosan composites was reported to be max-imum at low acidic pH, while high alkaline pH favors the adsorp-tion of Cr(III) [31,32]. Solution pH was regulated using 0.1 M HCland 0.1 M NaOH. Samples were withdrawn at periodic time inter-vals from the reaction mixture, centrifuged at 3500 rpm and ana-lyzed to determine the concentration using Shimadzu UV-1800UV–Vis spectrophotometer. RBBR concentration was measuredby noting the decrease in absorbance of the peak at 595 nm, whilethe concentration of Cr(VI) was measured similarly at 540 nmusing 1,5-diphenyl carbazide as the complexing agent [10]. Theexperiments were repeated thrice and the uncertainty in concen-tration at the end of adsorption was less than 5%. The amount ofdye or metal ion adsorbed, qt (mg g�1), was calculated using thefollowing equation:
qt ¼ ðC0 � CtÞV=W ð1Þ
where C0 and Ct (in mg L�1) denote initial concentration and con-centration of the adsorbate after time t, W is the weight of theadsorbent used (g), and V is the volume of the adsorbate solution(L). The percentage removal of the adsorbate was calculated usingthe following equation:
% Removal ¼ ðC0 � CtÞ � 100=C0 ð2Þ
3. Results and discussion
3.1. Characterization of ChAL composites
3.1.1. FT-IR analysisThe FT-IR spectra of alkali lignin, chitosan and 50ChAL compos-
ite, as shown in Fig. 1, were analyzed to identify the key functionalgroups responsible for the binding of alkali lignin and chitosan. Abroad peak at 3453–3362 cm�1 corresponding to stretching of phe-nolic and aliphatic –OH group is observed for alkali lignin. Thepeaks at 2939 and 2829 cm�1 are attributed to the stretching ofC–H bond present in the aromatic, methoxy and alkyl groups.The peaks at 1596 and 1515 cm�1 are typical of aromatic C@Cstretching in the phenolic group of lignin [33]. The peaks at1461, 1423 and 1367 cm�1 correspond to O–H bending of the
494 V. Nair et al. / Chemical Engineering Journal 254 (2014) 491–502
phenolic group. The peaks at 1270 and 1213 cm�1 are due toC–O–C stretching in a-O-4 and b-O-4 linkages of alkali lignin,respectively. The peaks at 1135 and 1085 cm�1 are due to C-O-Cstretching in the alkyl substituted ether. The peak at 624 cm�1 isdue to the S–C stretching in thioether group.
For chitosan, the presence of a broad peak at 3463–3362 cm�1
corresponds to the stretching of O–H and N–H bonds. The peaksat 2927 and 2857 cm�1 are attributed to C–H stretching of the alkylgroup. The peak at 1654 cm�1 represents bending of N–H in pri-mary amine group. Small peaks at 1560 and 1549 cm�1 are dueto bending of N–H of secondary amine. A peak at 1380 cm�1 corre-sponds to C–H bending of alkyl group. The peaks at 1157 and1084 cm�1 are related to C–O stretching in the b-1,4-glycosidiclinkage present in chitosan [30]. The peak at 669 cm�1 is due tothe out-of-plane bending of the O–H group. The FT-IR spectrumof the 50ChAL composite had all the key features of alkali ligninand chitosan with minor shifts and changes in peak intensities cor-responding to the weak interaction between the two componentsas shown in Table 2. The disappearance of peak at 1560–1549 cm�1 present in chitosan and the change in intensity of thepeak of aromatic ring at 1596 cm�1 are due to the interactionsbetween aromatic ring of alkali lignin and the secondary aminegroup of chitosan. There are shifts observed in the peakscorresponding to C–O stretching from 1157 cm�1 to 1145 cm�1 ofb-1,4-glycosidic linkage in the chitosan, and 1085 cm�1 to1074 cm�1 [29,34] of alkyl substituted ether of the alkali lignin.These signify the interactions due to hydrogen bonding betweenthe hydroxyl of alkali lignin with b-1,4-glycosidic linkage of chito-san, and the interaction of the alkyl substituted ether of alkali lig-nin with hydroxyl group of chitosan. There was no significantchange in the peaks of primary amine, confirming no interactionof primary amine groups of chitosan in the formation of thecomposite.
Scheme 1 depicts the interactions present in chitosan–alkali lig-nin composites as ascertained from FT-IR characterization. All theinteractions between chitosan and alkali lignin are likely due tothe formation of weak hydrogen bonds. The hydroxyl group pres-ent in the phenolic ring of alkali lignin can interact with (a)b-1,4-glycosidic oxygen (shown as dashed line 1 in Scheme 1)and (b) hydroxyl group of chitosan (dashed line 3). A weak bondis also formed between hydroxyl group of chitosan and methoxygroup of alkali lignin (dashed line 2). Finally, a weak interactionbetween aromatic ring of alkali lignin and secondary amino groupof chitosan is also observed (dashed line 4).
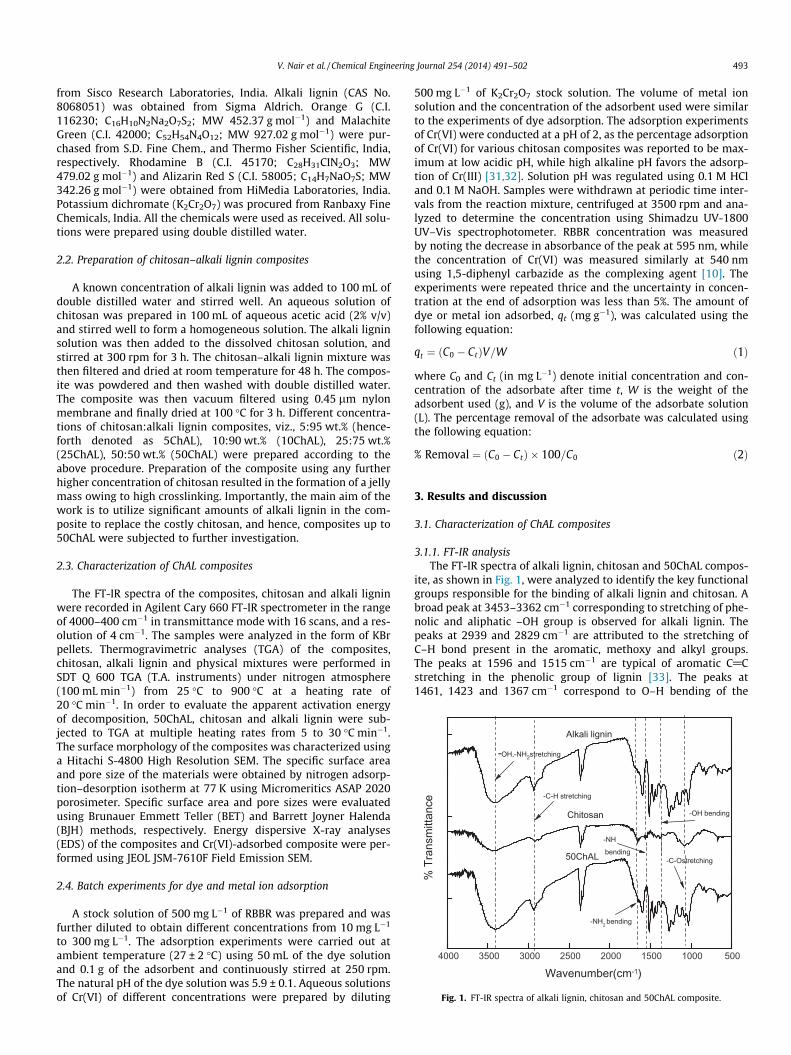
3.1.2. Thermogravimetric analysisThermogravimetric weight loss curves of chitosan, alkali lignin,
composites and 50:50 physical mixture of chitosan and lignin(50:50 Ch:AL(phys)) are depicted in Fig. 2(a). Initial weight lossaround 100 �C observed for chitosan, 50ChAL and the physical mix-ture can be ascribed to the removal of physisorbed moisture fromthe samples. Final weight losses observed for various samples at900 �C follows the order: chitosan (78%) > 50:50 Ch:AL (phys)
Table 2Key changes in FT-IR peaks of 50ChAL composite and their significance.
Wavenumber, cm�1 Functional group
Peaks corresponding to chitosan in the composite1654 Bending of N–H of primary amine1560–1549 Bending of N–H of secondary amine1157 C–O stretching in the b-1,4-glycosidi
Peaks corresponding to alkali lignin in the composite1596 Aromatic C@C stretching in the phen1461, 1423, 1367 Bending of O–H of the phenolic grou1085 C–O–C stretching in the alkyl substit
(67%) > 5ChAL (64%) > 50ChAL (63%) > 10ChAL (62%) � 25ChAL(62%) > alkali lignin (59%). It is clear that lower extent of decompo-sition occurs in the composites owing to the presence of lignin thatleads to the formation of a crosslinked and condensed matrix ofaromatic structures at high temperatures. In order to ascertainthe temperature range of decomposition of these materials, differ-ential weight loss profiles were plotted as depicted in Fig. SI 1 (inSupplementary data). It is clear that chitosan exhibits a single-step,sharp decomposition in the temperature range of 210–410 �Cwhile alkali lignin and 50ChAL decompose in a wide temperaturerange of 140–600 �C. The composite also exhibits a higher percentdegradation in the temperature range of 200–330 �C compared toalkali lignin. Interestingly, the physical mixture decomposes inthe range of 150–500 �C, with a sharp peak at 305 �C. This temper-ature corresponds to the maximum weight loss rate, as observed inthe differential weight loss profile. A similar peak was alsoobserved for chitosan at 308 �C. However, there is no sharp transi-tion for alkali lignin and 50ChAL composite. This shows that in thephysical mixture the decomposition of individual componentsshows an additive effect owing to the physically separated phasesof chitosan and alkali lignin. Nevertheless, the composite is homo-geneous in terms of binding of chitosan and lignin via weak hydro-gen bonds, and hence decomposes gradually without any signaturepeak of chitosan. This also stands as evidence alongside FT-IR char-acterization to prove that the synthesized composite containschemically integrated domains of chitosan and lignin. The differen-tial weight loss profiles of chitosan and alkali lignin reported in thiswork are in line with earlier reports [35,36].
In order to quantify the thermal stability of the composite withrespect to its constituents, chitosan and lignin, variation of appar-ent activation energy of decomposition with conversion was eval-uated using the integral isoconversional method of Kissinger–Akahira–Sunose (KAS). The functional form of KAS method is givenby [37]:
lnb
T2a
!¼ ln
Aa � REa � ln ½ð1� aÞ�1�
!� Ea
R � Ta
� �ð3Þ
where b denotes sample heating rate, Ta, Ea and Aa denote temper-ature, apparent activation energy and pre-exponential factor at afixed value of conversion, a, respectively. This equation correspondsto first order decomposition of the material in the conversion rangeof 20–50% [37]. This method involves determining the temperatureat various chosen values of conversion at different heating rates,and plotting ln(b/Ta
2) versus 1/Ta. The slopes of the curves at differ-ent conversion levels yield Ea. Fig. SI 2(a–c) (see Supplementarydata) depict the KAS plots for alkali lignin, chitosan and 50ChALcomposite. Fig. 2(b) depicts the variation of Ea with conversion forthe above three materials. It is clear that in the conversion rangeof 30–45%, alkali lignin is thermally more stable than chitosanand 50ChAL owing to higher Ea of 170–273 kJ mol�1. In the conver-sion range of 30–40%, Ea of 50ChAL varies in the range of140–165 kJ mol�1, while that of chitosan varies in the range of152–169 kJ mol�1. Such low differences in apparent activation
Interaction in 50ChAL
Presence of peakAbsence of peak
c linkage Decrease in wavenumber by 12 cm�1
olic group Decrease in intensity of peak by 50%p Decrease in wavenumber by 6, 5, 9 cm�1
uted ether Decrease in wavenumber by 11 cm�1
+O
OH
NH2
O
O
OH
OH NH
O
O OOH
NH2
O
OH
CH3
n
OOH
NH2
O
O
OH
OH NH
O
O OOH
NH2
O
OH
CH3
n
Chitosan/Alkali Lignin Composite
Alkali lignin stirred in aqueous medium
Chitosan dissolved in 2% acetic acid solution
Stirred for 3 hours and dried at room temperature
OH
O
OH
O
OH
O
O
O
CH3
CH3CH3
SHOHH O
O CH3
OH
CH3
OH
O
OH
O
OH
O
O
O
CH3
CH3CH3
SHOHH O
O CH3
OH
CH3
OH
O
OH
O
OH
O
O
O
CH3
CH3
SHOHH O
O CH3
OH
CH3
CH3
Hydrogen bonding
1
2
3
4
Scheme 1. Preparation of chitosan–alkali lignin composite. The dashed lines showthe possible weak bonding between chitosan and alkali lignin.
100 200 300 400
20
40
60
80
100
20 25 3050
100
150
200
250
300
50:50 Ch:AL(phys)
50C
Sam
ple
mas
s (%
)
Temp
Chitosan
20 oC/min
Appa
rent
act
ivat
ion
ener
gy,
Ea(k
Jmol
-1)
Conversio
Alkali LigninChitosan50ChAL
Fig. 2. (a) Thermogravimetric curves of chitosan, lignin, ChAL composites and 50:5020 �C min�1. (b) Variation of apparent activation energy of decomposition of lignin, chit
V. Nair et al. / Chemical Engineering Journal 254 (2014) 491–502 495
energy of c.a. 10 kJ mol�1 (i.e. c.a. 2 kcal mol�1) is within the exper-imental uncertainty involved in these calculations, and hence, it canbe concluded that 50ChAL composite and chitosan exhibit similarthermal stability, while alkali lignin is more stable than the two.Interestingly, chitosan–lignin composites reported by Chen et al.[34] with low lignin content (<30%) also exhibited a similar stabilityto that of chitosan based on a qualitative analysis of differentialweight loss profiles.
3.1.3. Surface morphology and specific surface area analysisThe surface morphologies of chitosan, alkali lignin, 25ChAL and
50ChAL composites, studied using SEM, are shown in Fig. 3. It isobserved that the surface of chitosan is non-uniform and roughwith short fibrous structures, while the alkali lignin particles arelarger in size with sharp edges and lesser surface roughness. Fromthe SEM images of 25ChAL and 50ChAL composites (Fig. 3(c) and(d)), the interfacial adhesion that binds the chitosan flakes on lig-nin surface is very clear. The formation of chitosan agglomerateson alkali lignin surface is clear at certain regions of the 50ChALcomposite. EDS analysis of 50ChAL composite (Fig. SI 3 in Supple-mentary data) clearly shows the presence of various elements likeNa, Mg, Al, Si, S, K and Ca in trace quantities that originate predom-inantly from alkali lignin.
Porosimetry was done to determine the specific surface areaand pore size distribution of chitosan, alkali lignin and 50ChALcomposite. Fig. SI 4 (in Supplementary data) depicts the adsorp-tion–desorption isotherm of 50ChAL composite. From Table 3, itcan be observed that the surface area was 2.44 m2 g�1 for 50ChALcomposite, which is higher than that of both chitosan (2.1 m2 g�1)and alkali lignin (0.24 m2 g�1). The specific surface area of chitosanevaluated in this work matches well with the literature [25]. Thisincrease in surface area of the composite is primarily due to thedisintegration and transformation of the fibrous structure of chito-san to a flaky structure during the preparation of the composite, asconfirmed by the SEM image of the 50ChAL composite. The averagepore diameter of 50ChAL composite is significantly lesser than thatof alkali lignin and comparable with that of chitosan. However the
500 600 700 800 900
35 40 45 50
hAL
(b)
Alkali lignin
erature(oC)
50ChAL25ChAL10ChAL5ChAL
(a)
n (mass%)
physical mixture of chitosan and lignin (50:50 Ch:AL(phys)) at a heating rate ofosan and 50ChAL with conversion evaluated by isoconversional KAS method.
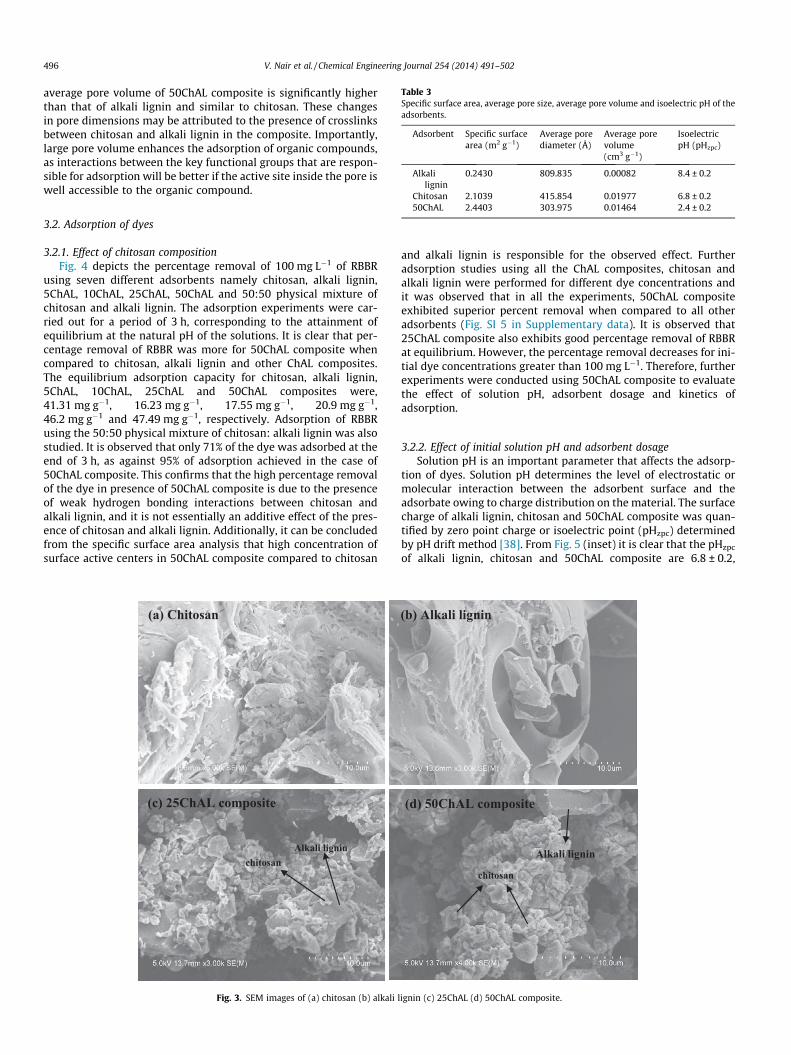
Table 3Specific surface area, average pore size, average pore volume and isoelectric pH of theadsorbents.
Adsorbent Specific surfacearea (m2 g�1)
Average porediameter (Å)
Average porevolume(cm3 g�1)
IsoelectricpH (pHzpc)
Alkalilignin
0.2430 809.835 0.00082 8.4 ± 0.2
Chitosan 2.1039 415.854 0.01977 6.8 ± 0.2
496 V. Nair et al. / Chemical Engineering Journal 254 (2014) 491–502
average pore volume of 50ChAL composite is significantly higherthan that of alkali lignin and similar to chitosan. These changesin pore dimensions may be attributed to the presence of crosslinksbetween chitosan and alkali lignin in the composite. Importantly,large pore volume enhances the adsorption of organic compounds,as interactions between the key functional groups that are respon-sible for adsorption will be better if the active site inside the pore iswell accessible to the organic compound.
50ChAL 2.4403 303.975 0.01464 2.4 ± 0.2
3.2. Adsorption of dyes
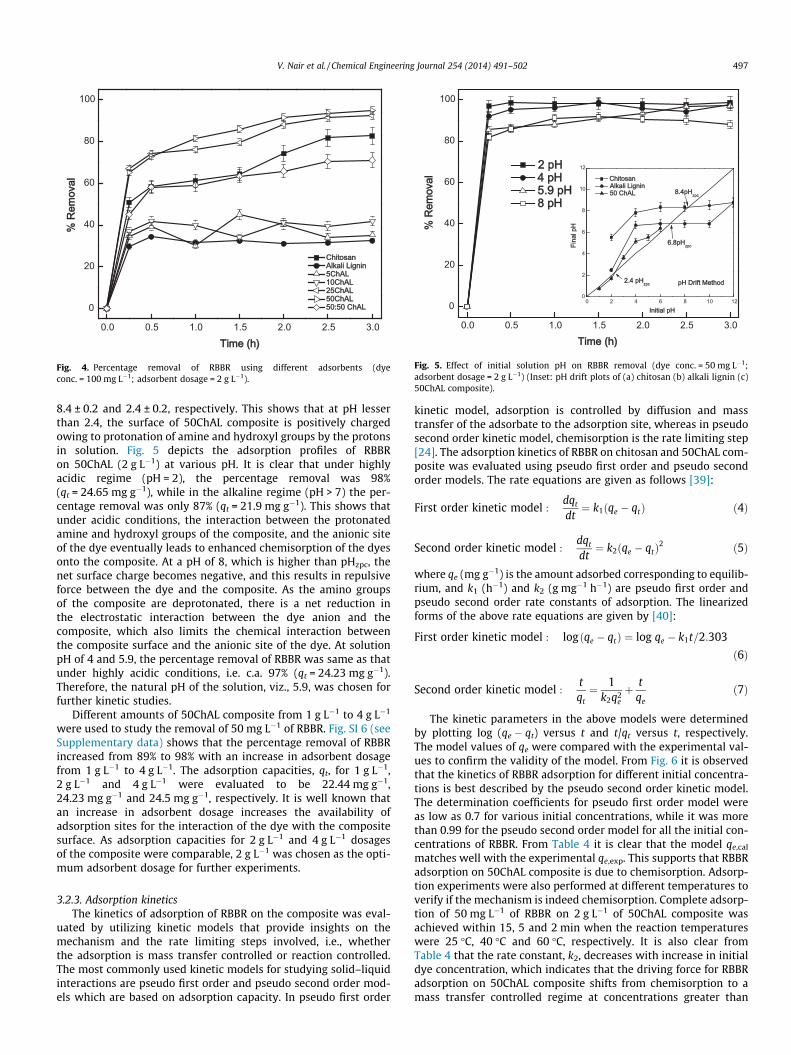
3.2.1. Effect of chitosan compositionFig. 4 depicts the percentage removal of 100 mg L�1 of RBBR
using seven different adsorbents namely chitosan, alkali lignin,5ChAL, 10ChAL, 25ChAL, 50ChAL and 50:50 physical mixture ofchitosan and alkali lignin. The adsorption experiments were car-ried out for a period of 3 h, corresponding to the attainment ofequilibrium at the natural pH of the solutions. It is clear that per-centage removal of RBBR was more for 50ChAL composite whencompared to chitosan, alkali lignin and other ChAL composites.The equilibrium adsorption capacity for chitosan, alkali lignin,5ChAL, 10ChAL, 25ChAL and 50ChAL composites were,41.31 mg g�1, 16.23 mg g�1, 17.55 mg g�1, 20.9 mg g�1,46.2 mg g�1 and 47.49 mg g�1, respectively. Adsorption of RBBRusing the 50:50 physical mixture of chitosan: alkali lignin was alsostudied. It is observed that only 71% of the dye was adsorbed at theend of 3 h, as against 95% of adsorption achieved in the case of50ChAL composite. This confirms that the high percentage removalof the dye in presence of 50ChAL composite is due to the presenceof weak hydrogen bonding interactions between chitosan andalkali lignin, and it is not essentially an additive effect of the pres-ence of chitosan and alkali lignin. Additionally, it can be concludedfrom the specific surface area analysis that high concentration ofsurface active centers in 50ChAL composite compared to chitosan
(c) 25ChAL composite
chitosanAlkali lignin
(a) Chitosan
Fig. 3. SEM images of (a) chitosan (b) alkali l
and alkali lignin is responsible for the observed effect. Furtheradsorption studies using all the ChAL composites, chitosan andalkali lignin were performed for different dye concentrations andit was observed that in all the experiments, 50ChAL compositeexhibited superior percent removal when compared to all otheradsorbents (Fig. SI 5 in Supplementary data). It is observed that25ChAL composite also exhibits good percentage removal of RBBRat equilibrium. However, the percentage removal decreases for ini-tial dye concentrations greater than 100 mg L�1. Therefore, furtherexperiments were conducted using 50ChAL composite to evaluatethe effect of solution pH, adsorbent dosage and kinetics ofadsorption.
3.2.2. Effect of initial solution pH and adsorbent dosageSolution pH is an important parameter that affects the adsorp-
tion of dyes. Solution pH determines the level of electrostatic ormolecular interaction between the adsorbent surface and theadsorbate owing to charge distribution on the material. The surfacecharge of alkali lignin, chitosan and 50ChAL composite was quan-tified by zero point charge or isoelectric point (pHzpc) determinedby pH drift method [38]. From Fig. 5 (inset) it is clear that the pHzpc
of alkali lignin, chitosan and 50ChAL composite are 6.8 ± 0.2,
(d) 50ChAL composite
chitosan
Alkali lignin
(b) Alkali lignin
ignin (c) 25ChAL (d) 50ChAL composite.
0.0 0.5 1.0 1.5 2.0 2.5 3.0
0
20
40
60
80
100
% R
emov
al%
Rem
oval
Time (h)Time (h)
Chitosan Chitosan Alkali Lignin Alkali Lignin 5ChAL 5ChAL 10ChAL 10ChAL 25ChAL 25ChAL 50ChAL 50ChAL 50:50 ChAL 50:50 ChAL
Fig. 4. Percentage removal of RBBR using different adsorbents (dyeconc. = 100 mg L�1; adsorbent dosage = 2 g L�1).
8 pH8 pH5.9 pH5.9 pH
2 pH 2 pH4 pH4 pH
0.0 0.5 1.0 1.5 2.0 2.5 3.0
0
20
40
60
80
100
0 2 4 6 8 10 120
2
4
6
8
10
12
Fina
l pH
Fina
l pH
Initial pHInitial pH
ChitosanChitosan Alkali Lignin Alkali Lignin 50 ChAL 50 ChAL
pH Drift MethodpH Drift Method
8.4pH8.4pHzpczpc
6.8pH6.8pHzpczpc
2.4 pH2.4 pHzpczpc
% R
emov
al%
Rem
oval
Time (h)Time (h)
Fig. 5. Effect of initial solution pH on RBBR removal (dye conc. = 50 mg L�1;adsorbent dosage = 2 g L�1) (Inset: pH drift plots of (a) chitosan (b) alkali lignin (c)50ChAL composite).
V. Nair et al. / Chemical Engineering Journal 254 (2014) 491–502 497
8.4 ± 0.2 and 2.4 ± 0.2, respectively. This shows that at pH lesserthan 2.4, the surface of 50ChAL composite is positively chargedowing to protonation of amine and hydroxyl groups by the protonsin solution. Fig. 5 depicts the adsorption profiles of RBBRon 50ChAL (2 g L�1) at various pH. It is clear that under highlyacidic regime (pH = 2), the percentage removal was 98%(qt = 24.65 mg g�1), while in the alkaline regime (pH > 7) the per-centage removal was only 87% (qt = 21.9 mg g�1). This shows thatunder acidic conditions, the interaction between the protonatedamine and hydroxyl groups of the composite, and the anionic siteof the dye eventually leads to enhanced chemisorption of the dyesonto the composite. At a pH of 8, which is higher than pHzpc, thenet surface charge becomes negative, and this results in repulsiveforce between the dye and the composite. As the amino groupsof the composite are deprotonated, there is a net reduction inthe electrostatic interaction between the dye anion and thecomposite, which also limits the chemical interaction betweenthe composite surface and the anionic site of the dye. At solutionpH of 4 and 5.9, the percentage removal of RBBR was same as thatunder highly acidic conditions, i.e. c.a. 97% (qt = 24.23 mg g�1).Therefore, the natural pH of the solution, viz., 5.9, was chosen forfurther kinetic studies.
Different amounts of 50ChAL composite from 1 g L�1 to 4 g L�1
were used to study the removal of 50 mg L�1 of RBBR. Fig. SI 6 (seeSupplementary data) shows that the percentage removal of RBBRincreased from 89% to 98% with an increase in adsorbent dosagefrom 1 g L�1 to 4 g L�1. The adsorption capacities, qt, for 1 g L�1,2 g L�1 and 4 g L�1 were evaluated to be 22.44 mg g�1,24.23 mg g�1 and 24.5 mg g�1, respectively. It is well known thatan increase in adsorbent dosage increases the availability ofadsorption sites for the interaction of the dye with the compositesurface. As adsorption capacities for 2 g L�1 and 4 g L�1 dosagesof the composite were comparable, 2 g L�1 was chosen as the opti-mum adsorbent dosage for further experiments.
3.2.3. Adsorption kineticsThe kinetics of adsorption of RBBR on the composite was eval-
uated by utilizing kinetic models that provide insights on themechanism and the rate limiting steps involved, i.e., whetherthe adsorption is mass transfer controlled or reaction controlled.The most commonly used kinetic models for studying solid–liquidinteractions are pseudo first order and pseudo second order mod-els which are based on adsorption capacity. In pseudo first order
kinetic model, adsorption is controlled by diffusion and masstransfer of the adsorbate to the adsorption site, whereas in pseudosecond order kinetic model, chemisorption is the rate limiting step[24]. The adsorption kinetics of RBBR on chitosan and 50ChAL com-posite was evaluated using pseudo first order and pseudo secondorder models. The rate equations are given as follows [39]:
First order kinetic model :dqt
dt¼ k1ðqe � qtÞ ð4Þ
Second order kinetic model :dqt
dt¼ k2ðqe � qtÞ
2 ð5Þ
where qe (mg g�1) is the amount adsorbed corresponding to equilib-rium, and k1 (h�1) and k2 (g mg�1 h�1) are pseudo first order andpseudo second order rate constants of adsorption. The linearizedforms of the above rate equations are given by [40]:
First order kinetic model : log ðqe � qtÞ ¼ log qe � k1t=2:303
ð6Þ
Second order kinetic model :tqt¼ 1
k2q2eþ t
qeð7Þ
The kinetic parameters in the above models were determinedby plotting log (qe � qt) versus t and t/qt versus t, respectively.The model values of qe were compared with the experimental val-ues to confirm the validity of the model. From Fig. 6 it is observedthat the kinetics of RBBR adsorption for different initial concentra-tions is best described by the pseudo second order kinetic model.The determination coefficients for pseudo first order model wereas low as 0.7 for various initial concentrations, while it was morethan 0.99 for the pseudo second order model for all the initial con-centrations of RBBR. From Table 4 it is clear that the model qe,cal
matches well with the experimental qe,exp. This supports that RBBRadsorption on 50ChAL composite is due to chemisorption. Adsorp-tion experiments were also performed at different temperatures toverify if the mechanism is indeed chemisorption. Complete adsorp-tion of 50 mg L�1 of RBBR on 2 g L�1 of 50ChAL composite wasachieved within 15, 5 and 2 min when the reaction temperatureswere 25 �C, 40 �C and 60 �C, respectively. It is also clear fromTable 4 that the rate constant, k2, decreases with increase in initialdye concentration, which indicates that the driving force for RBBRadsorption on 50ChAL composite shifts from chemisorption to amass transfer controlled regime at concentrations greater than
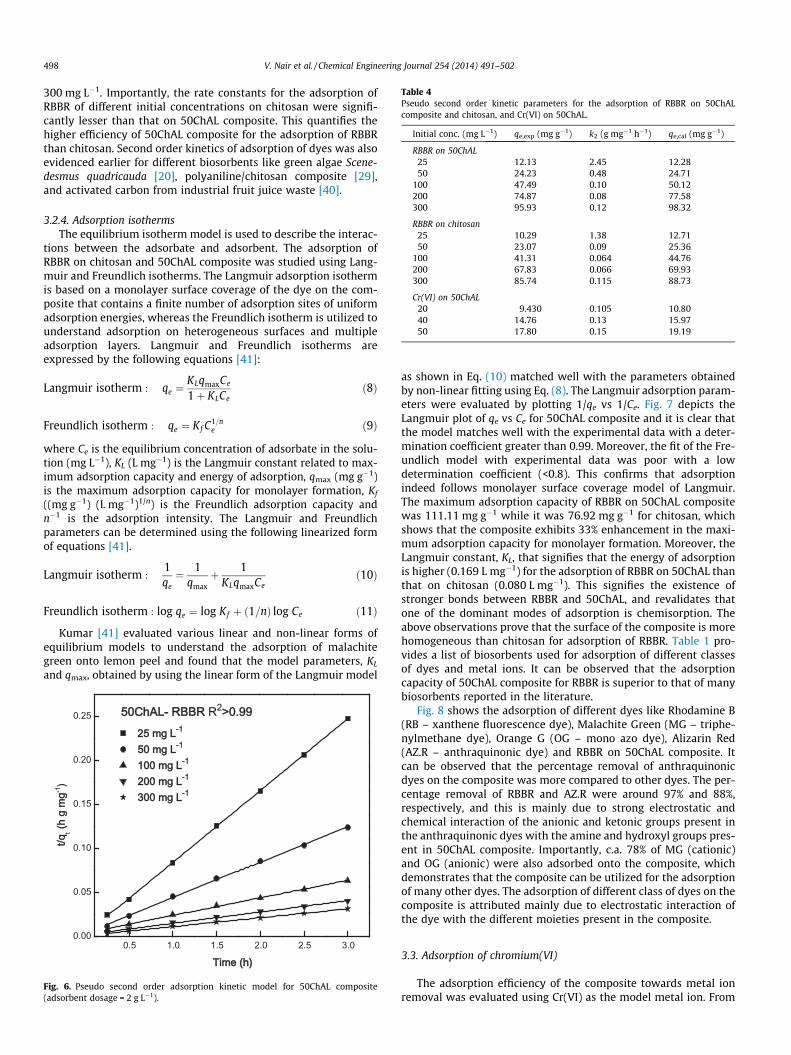
Table 4Pseudo second order kinetic parameters for the adsorption of RBBR on 50ChALcomposite and chitosan, and Cr(VI) on 50ChAL.
Initial conc. (mg L�1) qe,exp (mg g�1) k2 (g mg�1 h�1) qe,cal (mg g�1)
RBBR on 50ChAL25 12.13 2.45 12.2850 24.23 0.48 24.71
100 47.49 0.10 50.12200 74.87 0.08 77.58300 95.93 0.12 98.32
RBBR on chitosan25 10.29 1.38 12.7150 23.07 0.09 25.36
100 41.31 0.064 44.76200 67.83 0.066 69.93300 85.74 0.115 88.73
Cr(VI) on 50ChAL20 9.430 0.105 10.8040 14.76 0.13 15.9750 17.80 0.15 19.19
498 V. Nair et al. / Chemical Engineering Journal 254 (2014) 491–502
300 mg L�1. Importantly, the rate constants for the adsorption ofRBBR of different initial concentrations on chitosan were signifi-cantly lesser than that on 50ChAL composite. This quantifies thehigher efficiency of 50ChAL composite for the adsorption of RBBRthan chitosan. Second order kinetics of adsorption of dyes was alsoevidenced earlier for different biosorbents like green algae Scene-desmus quadricauda [20], polyaniline/chitosan composite [29],and activated carbon from industrial fruit juice waste [40].
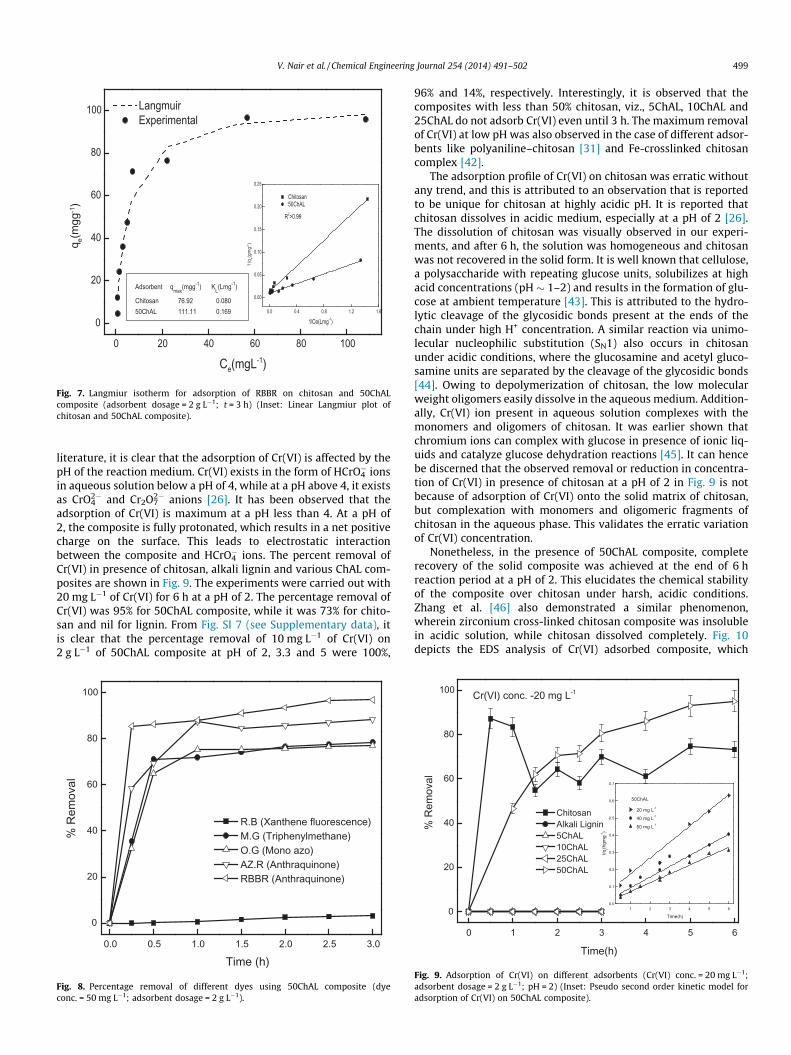
3.2.4. Adsorption isothermsThe equilibrium isotherm model is used to describe the interac-
tions between the adsorbate and adsorbent. The adsorption ofRBBR on chitosan and 50ChAL composite was studied using Lang-muir and Freundlich isotherms. The Langmuir adsorption isothermis based on a monolayer surface coverage of the dye on the com-posite that contains a finite number of adsorption sites of uniformadsorption energies, whereas the Freundlich isotherm is utilized tounderstand adsorption on heterogeneous surfaces and multipleadsorption layers. Langmuir and Freundlich isotherms areexpressed by the following equations [41]:
Langmuir isotherm : qe ¼KLqmaxCe
1þ KLCeð8Þ
Freundlich isotherm : qe ¼ Kf C1=ne ð9Þ
where Ce is the equilibrium concentration of adsorbate in the solu-tion (mg L�1), KL (L mg�1) is the Langmuir constant related to max-imum adsorption capacity and energy of adsorption, qmax (mg g�1)is the maximum adsorption capacity for monolayer formation, Kf
((mg g�1) (L mg�1)1/n) is the Freundlich adsorption capacity andn�1 is the adsorption intensity. The Langmuir and Freundlichparameters can be determined using the following linearized formof equations [41].
Langmuir isotherm :1qe¼ 1
qmaxþ 1
KLqmaxCeð10Þ
Freundlich isotherm : log qe ¼ log Kf þ ð1=nÞ log Ce ð11Þ
Kumar [41] evaluated various linear and non-linear forms ofequilibrium models to understand the adsorption of malachitegreen onto lemon peel and found that the model parameters, KL
and qmax, obtained by using the linear form of the Langmuir model
0.5 1.0 1.5 2.0 2.5 3.00.00
0.05
0.10
0.15
0.20
0.25
25 mg L25 mg L-1-1
50 mg L 50 mg L-1-1
100 mg L 100 mg L-1-1
200 mg L 200 mg L-1-1
300 mg L 300 mg L-1-1
t/qt/qt (h
g m
g(h
g m
g-1-1)
Time (h)Time (h)
50ChAL50ChAL- RBBR - RBBR R2>0.99>0.99
Fig. 6. Pseudo second order adsorption kinetic model for 50ChAL composite(adsorbent dosage = 2 g L�1).
as shown in Eq. (10) matched well with the parameters obtainedby non-linear fitting using Eq. (8). The Langmuir adsorption param-eters were evaluated by plotting 1/qe vs 1/Ce. Fig. 7 depicts theLangmuir plot of qe vs Ce for 50ChAL composite and it is clear thatthe model matches well with the experimental data with a deter-mination coefficient greater than 0.99. Moreover, the fit of the Fre-undlich model with experimental data was poor with a lowdetermination coefficient (<0.8). This confirms that adsorptionindeed follows monolayer surface coverage model of Langmuir.The maximum adsorption capacity of RBBR on 50ChAL compositewas 111.11 mg g�1 while it was 76.92 mg g�1 for chitosan, whichshows that the composite exhibits 33% enhancement in the maxi-mum adsorption capacity for monolayer formation. Moreover, theLangmuir constant, KL, that signifies that the energy of adsorptionis higher (0.169 L mg�1) for the adsorption of RBBR on 50ChAL thanthat on chitosan (0.080 L mg�1). This signifies the existence ofstronger bonds between RBBR and 50ChAL, and revalidates thatone of the dominant modes of adsorption is chemisorption. Theabove observations prove that the surface of the composite is morehomogeneous than chitosan for adsorption of RBBR. Table 1 pro-vides a list of biosorbents used for adsorption of different classesof dyes and metal ions. It can be observed that the adsorptioncapacity of 50ChAL composite for RBBR is superior to that of manybiosorbents reported in the literature.
Fig. 8 shows the adsorption of different dyes like Rhodamine B(RB – xanthene fluorescence dye), Malachite Green (MG – triphe-nylmethane dye), Orange G (OG – mono azo dye), Alizarin Red(AZ.R – anthraquinonic dye) and RBBR on 50ChAL composite. Itcan be observed that the percentage removal of anthraquinonicdyes on the composite was more compared to other dyes. The per-centage removal of RBBR and AZ.R were around 97% and 88%,respectively, and this is mainly due to strong electrostatic andchemical interaction of the anionic and ketonic groups present inthe anthraquinonic dyes with the amine and hydroxyl groups pres-ent in 50ChAL composite. Importantly, c.a. 78% of MG (cationic)and OG (anionic) were also adsorbed onto the composite, whichdemonstrates that the composite can be utilized for the adsorptionof many other dyes. The adsorption of different class of dyes on thecomposite is attributed mainly due to electrostatic interaction ofthe dye with the different moieties present in the composite.
3.3. Adsorption of chromium(VI)
The adsorption efficiency of the composite towards metal ionremoval was evaluated using Cr(VI) as the model metal ion. From
0 20 40 60 80 100
0
20
40
60
80
100
q e(mgg
-1)
Ce(mgL-1)
LangmuirExperimental
0.0 0.4 0.8 1.2 1.6
0.00
0.05
0.10
0.15
0.20
0.25
Chitosan50ChAL
1/q
e(gm
g-1)
1/Ce(Lmg-1)
R2>0.99
Adsorbent qmax(mgg-1) KL(Lmg-1)
Chitosan 76.92 0.08050ChAL 111.11 0.169
Fig. 7. Langmiur isotherm for adsorption of RBBR on chitosan and 50ChALcomposite (adsorbent dosage = 2 g L�1; t = 3 h) (Inset: Linear Langmiur plot ofchitosan and 50ChAL composite).
V. Nair et al. / Chemical Engineering Journal 254 (2014) 491–502 499
literature, it is clear that the adsorption of Cr(VI) is affected by thepH of the reaction medium. Cr(VI) exists in the form of HCrO4
� ionsin aqueous solution below a pH of 4, while at a pH above 4, it existsas CrO4
2� and Cr2O72� anions [26]. It has been observed that the
adsorption of Cr(VI) is maximum at a pH less than 4. At a pH of2, the composite is fully protonated, which results in a net positivecharge on the surface. This leads to electrostatic interactionbetween the composite and HCrO4
� ions. The percent removal ofCr(VI) in presence of chitosan, alkali lignin and various ChAL com-posites are shown in Fig. 9. The experiments were carried out with20 mg L�1 of Cr(VI) for 6 h at a pH of 2. The percentage removal ofCr(VI) was 95% for 50ChAL composite, while it was 73% for chito-san and nil for lignin. From Fig. SI 7 (see Supplementary data), itis clear that the percentage removal of 10 mg L�1 of Cr(VI) on2 g L�1 of 50ChAL composite at pH of 2, 3.3 and 5 were 100%,
0.0 0.5 1.0 1.5 2.0 2.5 3.0
0
20
40
60
80
100
% R
emov
al
Time (h)
R.B (Xanthene fluorescence)M.G (Triphenylmethane)O.G (Mono azo)AZ.R (Anthraquinone)RBBR (Anthraquinone)
Fig. 8. Percentage removal of different dyes using 50ChAL composite (dyeconc. = 50 mg L�1; adsorbent dosage = 2 g L�1).
96% and 14%, respectively. Interestingly, it is observed that thecomposites with less than 50% chitosan, viz., 5ChAL, 10ChAL and25ChAL do not adsorb Cr(VI) even until 3 h. The maximum removalof Cr(VI) at low pH was also observed in the case of different adsor-bents like polyaniline–chitosan [31] and Fe-crosslinked chitosancomplex [42].
The adsorption profile of Cr(VI) on chitosan was erratic withoutany trend, and this is attributed to an observation that is reportedto be unique for chitosan at highly acidic pH. It is reported thatchitosan dissolves in acidic medium, especially at a pH of 2 [26].The dissolution of chitosan was visually observed in our experi-ments, and after 6 h, the solution was homogeneous and chitosanwas not recovered in the solid form. It is well known that cellulose,a polysaccharide with repeating glucose units, solubilizes at highacid concentrations (pH � 1–2) and results in the formation of glu-cose at ambient temperature [43]. This is attributed to the hydro-lytic cleavage of the glycosidic bonds present at the ends of thechain under high H+ concentration. A similar reaction via unimo-lecular nucleophilic substitution (SN1) also occurs in chitosanunder acidic conditions, where the glucosamine and acetyl gluco-samine units are separated by the cleavage of the glycosidic bonds[44]. Owing to depolymerization of chitosan, the low molecularweight oligomers easily dissolve in the aqueous medium. Addition-ally, Cr(VI) ion present in aqueous solution complexes with themonomers and oligomers of chitosan. It was earlier shown thatchromium ions can complex with glucose in presence of ionic liq-uids and catalyze glucose dehydration reactions [45]. It can hencebe discerned that the observed removal or reduction in concentra-tion of Cr(VI) in presence of chitosan at a pH of 2 in Fig. 9 is notbecause of adsorption of Cr(VI) onto the solid matrix of chitosan,but complexation with monomers and oligomeric fragments ofchitosan in the aqueous phase. This validates the erratic variationof Cr(VI) concentration.
Nonetheless, in the presence of 50ChAL composite, completerecovery of the solid composite was achieved at the end of 6 hreaction period at a pH of 2. This elucidates the chemical stabilityof the composite over chitosan under harsh, acidic conditions.Zhang et al. [46] also demonstrated a similar phenomenon,wherein zirconium cross-linked chitosan composite was insolublein acidic solution, while chitosan dissolved completely. Fig. 10depicts the EDS analysis of Cr(VI) adsorbed composite, which
0 1 2 3 4 5 6
0
20
40
60
80
100
% R
emov
al
Time(h)
ChitosanAlkali Lignin5ChAL10ChAL25ChAL50ChAL
1 2 3 4 5 60.0
0.1
0.2
0.3
0.4
0.5
0.6
0.7
t/qt(h
gmg-1
)
Time(h)
20 mg L-1
40 mg L-1
50 mg L-1
50ChAL
Cr(VI) conc. -20 mg L-1
Fig. 9. Adsorption of Cr(VI) on different adsorbents (Cr(VI) conc. = 20 mg L�1;adsorbent dosage = 2 g L�1; pH = 2) (Inset: Pseudo second order kinetic model foradsorption of Cr(VI) on 50ChAL composite).
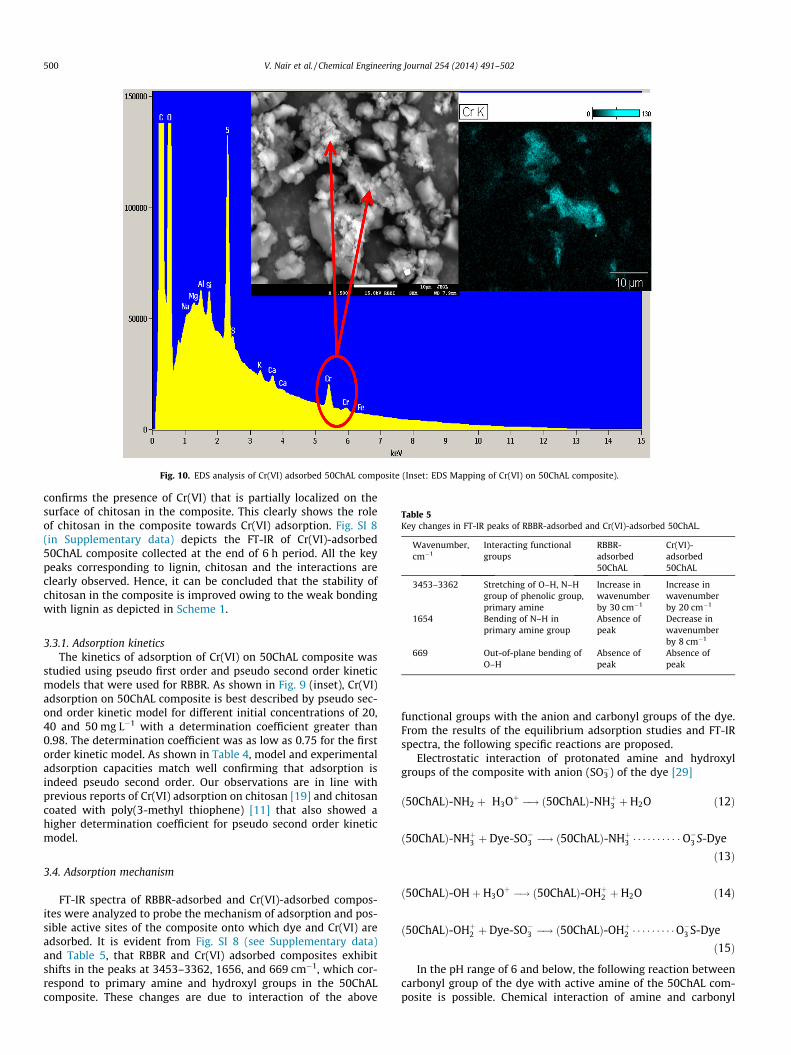
Fig. 10. EDS analysis of Cr(VI) adsorbed 50ChAL composite (Inset: EDS Mapping of Cr(VI) on 50ChAL composite).
Table 5Key changes in FT-IR peaks of RBBR-adsorbed and Cr(VI)-adsorbed 50ChAL.
Wavenumber,cm�1
Interacting functionalgroups
RBBR-adsorbed50ChAL
Cr(VI)-adsorbed50ChAL
3453–3362 Stretching of O–H, N–Hgroup of phenolic group,primary amine
Increase inwavenumberby 30 cm�1
Increase inwavenumberby 20 cm�1
500 V. Nair et al. / Chemical Engineering Journal 254 (2014) 491–502
confirms the presence of Cr(VI) that is partially localized on thesurface of chitosan in the composite. This clearly shows the roleof chitosan in the composite towards Cr(VI) adsorption. Fig. SI 8(in Supplementary data) depicts the FT-IR of Cr(VI)-adsorbed50ChAL composite collected at the end of 6 h period. All the keypeaks corresponding to lignin, chitosan and the interactions areclearly observed. Hence, it can be concluded that the stability ofchitosan in the composite is improved owing to the weak bondingwith lignin as depicted in Scheme 1.
1654 Bending of N–H inprimary amine group
Absence ofpeak
Decrease inwavenumberby 8 cm�1
669 Out-of-plane bending ofO–H
Absence ofpeak
Absence ofpeak
3.3.1. Adsorption kineticsThe kinetics of adsorption of Cr(VI) on 50ChAL composite was
studied using pseudo first order and pseudo second order kineticmodels that were used for RBBR. As shown in Fig. 9 (inset), Cr(VI)adsorption on 50ChAL composite is best described by pseudo sec-ond order kinetic model for different initial concentrations of 20,40 and 50 mg L�1 with a determination coefficient greater than0.98. The determination coefficient was as low as 0.75 for the firstorder kinetic model. As shown in Table 4, model and experimentaladsorption capacities match well confirming that adsorption isindeed pseudo second order. Our observations are in line withprevious reports of Cr(VI) adsorption on chitosan [19] and chitosancoated with poly(3-methyl thiophene) [11] that also showed ahigher determination coefficient for pseudo second order kineticmodel.
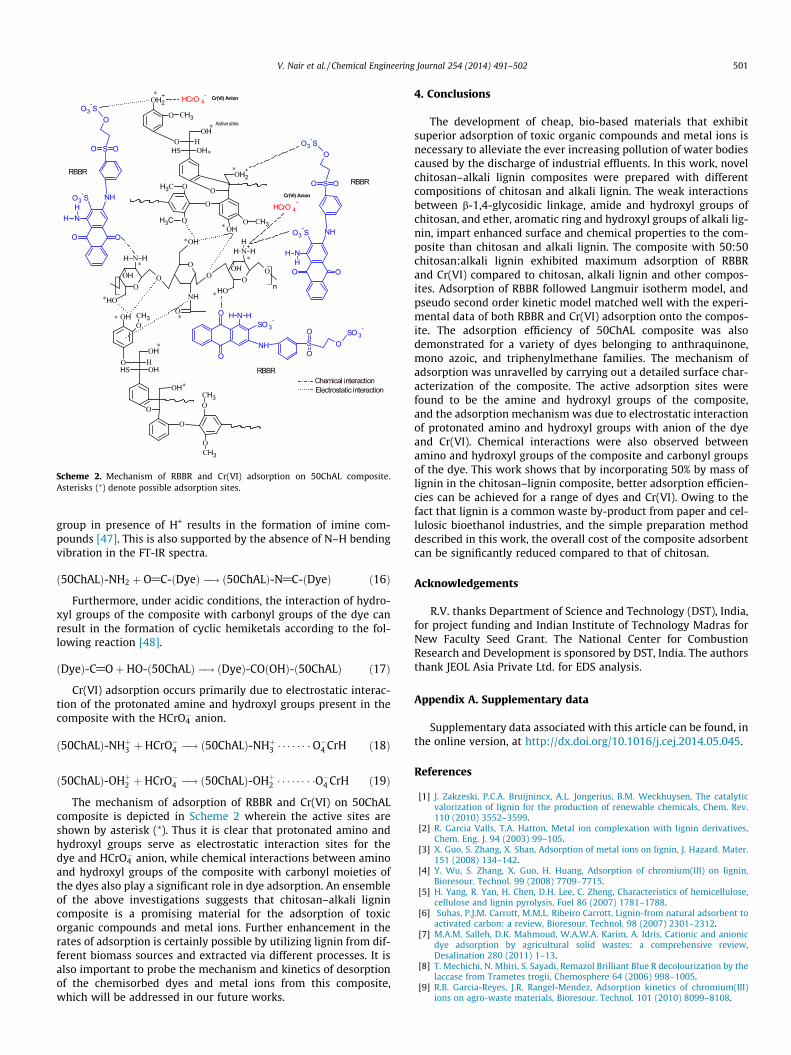
3.4. Adsorption mechanism
FT-IR spectra of RBBR-adsorbed and Cr(VI)-adsorbed compos-ites were analyzed to probe the mechanism of adsorption and pos-sible active sites of the composite onto which dye and Cr(VI) areadsorbed. It is evident from Fig. SI 8 (see Supplementary data)and Table 5, that RBBR and Cr(VI) adsorbed composites exhibitshifts in the peaks at 3453–3362, 1656, and 669 cm�1, which cor-respond to primary amine and hydroxyl groups in the 50ChALcomposite. These changes are due to interaction of the above
functional groups with the anion and carbonyl groups of the dye.From the results of the equilibrium adsorption studies and FT-IRspectra, the following specific reactions are proposed.
Electrostatic interaction of protonated amine and hydroxylgroups of the composite with anion (SO3
�) of the dye [29]
ð50ChALÞ-NH2 þ H3Oþ �! ð50ChALÞ-NHþ3 þH2O ð12Þ
ð50ChALÞ-NHþ3 þ Dye-SO�3 �! ð50ChALÞ-NHþ3 � � � � � � � � � � O�3 S-Dye
ð13Þ
ð50ChALÞ-OHþH3Oþ �! ð50ChALÞ-OHþ2 þH2O ð14Þ
ð50ChALÞ-OHþ2 þ Dye-SO�3 �! ð50ChALÞ-OHþ2 � � � � � � � � �O�3 S-Dye
ð15Þ
In the pH range of 6 and below, the following reaction betweencarbonyl group of the dye with active amine of the 50ChAL com-posite is possible. Chemical interaction of amine and carbonyl
OOH
N
O
O
OH
OH NH
O
O OOH
N+
O
OH
HHH
HH
n
O O
NH
H
NH
SO O
OO3
-S
O3-S
O
O
N HH
NH SO
OO
SO 3-SO 3
-
RBBR
RBBR
HCrO 4-
Cr(VI) Anion
O O
NHH
NH
SO O
OO3
-S
O3-S
OHOCH3
OOH
HSH OH
O
OH
O
O
O
CH3
CH3
OHO CH3
O
OH2+
SHO
OHH
OH
O CH3
O
O
O
CH3
OH2+
CH3
RBBR
HCrO 4- Cr(VI) Anion
∗
∗
∗
∗
∗
∗
Active sites
∗∗
∗
∗
∗
∗
∗
∗
Chemical interactionElectrostatic interaction
Scheme 2. Mechanism of RBBR and Cr(VI) adsorption on 50ChAL composite.Asterisks (⁄) denote possible adsorption sites.
V. Nair et al. / Chemical Engineering Journal 254 (2014) 491–502 501
group in presence of H+ results in the formation of imine com-pounds [47]. This is also supported by the absence of N–H bendingvibration in the FT-IR spectra.
ð50ChALÞ-NH2 þ O@C-ðDyeÞ �! ð50ChALÞ-N@C-ðDyeÞ ð16Þ
Furthermore, under acidic conditions, the interaction of hydro-xyl groups of the composite with carbonyl groups of the dye canresult in the formation of cyclic hemiketals according to the fol-lowing reaction [48].
ðDyeÞ-C@OþHO-ð50ChALÞ �! ðDyeÞ-COðOHÞ-ð50ChALÞ ð17Þ
Cr(VI) adsorption occurs primarily due to electrostatic interac-tion of the protonated amine and hydroxyl groups present in thecomposite with the HCrO4
� anion.
ð50ChALÞ-NHþ3 þHCrO�4 �! ð50ChALÞ-NHþ3 � � � � � � � O�4 CrH ð18Þ
ð50ChALÞ-OHþ2 þHCrO�4 �! ð50ChALÞ-OHþ2 � � � � � � � �O�4 CrH ð19Þ
The mechanism of adsorption of RBBR and Cr(VI) on 50ChALcomposite is depicted in Scheme 2 wherein the active sites areshown by asterisk (⁄). Thus it is clear that protonated amino andhydroxyl groups serve as electrostatic interaction sites for thedye and HCrO4
� anion, while chemical interactions between aminoand hydroxyl groups of the composite with carbonyl moieties ofthe dyes also play a significant role in dye adsorption. An ensembleof the above investigations suggests that chitosan–alkali lignincomposite is a promising material for the adsorption of toxicorganic compounds and metal ions. Further enhancement in therates of adsorption is certainly possible by utilizing lignin from dif-ferent biomass sources and extracted via different processes. It isalso important to probe the mechanism and kinetics of desorptionof the chemisorbed dyes and metal ions from this composite,which will be addressed in our future works.
4. Conclusions
The development of cheap, bio-based materials that exhibitsuperior adsorption of toxic organic compounds and metal ions isnecessary to alleviate the ever increasing pollution of water bodiescaused by the discharge of industrial effluents. In this work, novelchitosan–alkali lignin composites were prepared with differentcompositions of chitosan and alkali lignin. The weak interactionsbetween b-1,4-glycosidic linkage, amide and hydroxyl groups ofchitosan, and ether, aromatic ring and hydroxyl groups of alkali lig-nin, impart enhanced surface and chemical properties to the com-posite than chitosan and alkali lignin. The composite with 50:50chitosan:alkali lignin exhibited maximum adsorption of RBBRand Cr(VI) compared to chitosan, alkali lignin and other compos-ites. Adsorption of RBBR followed Langmuir isotherm model, andpseudo second order kinetic model matched well with the experi-mental data of both RBBR and Cr(VI) adsorption onto the compos-ite. The adsorption efficiency of 50ChAL composite was alsodemonstrated for a variety of dyes belonging to anthraquinone,mono azoic, and triphenylmethane families. The mechanism ofadsorption was unravelled by carrying out a detailed surface char-acterization of the composite. The active adsorption sites werefound to be the amine and hydroxyl groups of the composite,and the adsorption mechanism was due to electrostatic interactionof protonated amino and hydroxyl groups with anion of the dyeand Cr(VI). Chemical interactions were also observed betweenamino and hydroxyl groups of the composite and carbonyl groupsof the dye. This work shows that by incorporating 50% by mass oflignin in the chitosan–lignin composite, better adsorption efficien-cies can be achieved for a range of dyes and Cr(VI). Owing to thefact that lignin is a common waste by-product from paper and cel-lulosic bioethanol industries, and the simple preparation methoddescribed in this work, the overall cost of the composite adsorbentcan be significantly reduced compared to that of chitosan.
Acknowledgements
R.V. thanks Department of Science and Technology (DST), India,for project funding and Indian Institute of Technology Madras forNew Faculty Seed Grant. The National Center for CombustionResearch and Development is sponsored by DST, India. The authorsthank JEOL Asia Private Ltd. for EDS analysis.
Appendix A. Supplementary data
Supplementary data associated with this article can be found, inthe online version, at http://dx.doi.org/10.1016/j.cej.2014.05.045.
References
[1] J. Zakzeski, P.C.A. Bruijnincx, A.L. Jongerius, B.M. Weckhuysen, The catalyticvalorization of lignin for the production of renewable chemicals, Chem. Rev.110 (2010) 3552–3599.
[2] R. Garcia Valls, T.A. Hatton, Metal ion complexation with lignin derivatives,Chem. Eng. J. 94 (2003) 99–105.
[3] X. Guo, S. Zhang, X. Shan, Adsorption of metal ions on lignin, J. Hazard. Mater.151 (2008) 134–142.
[4] Y. Wu, S. Zhang, X. Guo, H. Huang, Adsorption of chromium(III) on lignin,Bioresour. Technol. 99 (2008) 7709–7715.
[5] H. Yang, R. Yan, H. Chen, D.H. Lee, C. Zheng, Characteristics of hemicellulose,cellulose and lignin pyrolysis, Fuel 86 (2007) 1781–1788.
[6] Suhas, P.J.M. Carrott, M.M.L. Ribeiro Carrott, Lignin-from natural adsorbent toactivated carbon: a review, Bioresour. Technol. 98 (2007) 2301–2312.
[7] M.A.M. Salleh, D.K. Mahmoud, W.A.W.A. Karim, A. Idris, Cationic and anionicdye adsorption by agricultural solid wastes: a comprehensive review,Desalination 280 (2011) 1–13.
[8] T. Mechichi, N. Mhiri, S. Sayadi, Remazol Brilliant Blue R decolourization by thelaccase from Trametes trogii, Chemosphere 64 (2006) 998–1005.
[9] R.B. Garcia-Reyes, J.R. Rangel-Mendez, Adsorption kinetics of chromium(III)ions on agro-waste materials, Bioresour. Technol. 101 (2010) 8099–8108.
502 V. Nair et al. / Chemical Engineering Journal 254 (2014) 491–502
[10] C. Jung, J. Heo, J. Han, N. Her, S.J. Lee, J. Oh, Hexavalent chromium removal byvarious adsorbents: powdered activated carbon, chitosan, and single/multi-walled carbon nanotubes, Sep. Purif. Technol. 106 (2013) 63–71.
[11] S. Hena, Removal of chromium hexavalent ion from aqueous solutions usingbiopolymer chitosan coated with poly(3-methyl thiophene) polymer, J.Hazard. Mater. 181 (2010) 474–479.
[12] G.H. Sonawane, V.S. Shrivastava, Kinetics of decolourization of malachite greenfrom aqueous medium by maize cob (zea maize): an agricultural solid waste,Desalination 247 (2009) 430–441.
[13] G. Sreelatha, V. Ageetha, J. Parmar, P. Padmaja, Equilibrium and kinetic studieson reactive dye adsorption using palm shell powder (an agrowaste) andchitosan, J. Chem. Eng. Data 56 (2011) 35–42.
[14] A. Roy, S. Chakraborty, S.P. Kundu, B. Adhikari, S.B. Majumder, Adsorption ofanionic-azo dye from aqueous solution by lignocellulose-biomass jute fiber:equilibrium, kinetics, and thermodynamics study, Ind. Eng. Chem. Res. 51(2012) 12095–12106.
[15] B. Ramaraju, P. Manoj, K. Reddy, C. Subrahmanyam, Low cost adsorbents fromagricultural waste for removal of dyes, Environ. Prog. Sustain. Energy 33(2014) 38–46.
[16] P.S. Kumar, M. Palaniyappan, M. Priyadharshini, A.M. Vignesh, A. Thanjiappan,Adsorption of basic dye onto raw and surface-modified agricultural waste,Environ. Prog. Sustain. Energy 33 (2014) 87–98.
[17] A. Kriaa, N. Hamdi, E. Srasra, Adsorption studies of methylene blue dye ontunisian activated lignin, Russ. J. Phys. Chem. A 85 (2011) 279–287.
[18] N.C. Filho, E.C. Venancio, M.F. Barriquello, A.A.W. Hechenleitner, E.A.G. Pineda,Methylene blue adsorption onto modified lignin from sugarcane bagasse,Ecletica Quim. 32 (2007) 63–70.
[19] Y.A. Aydin, N.D. Aksoy, Adsorption of chromium on chitosan: optimization,kinetics and thermodynamics, Chem. Eng. J. 151 (2009) 188–194.
[20] A. Ergene, K. Ada, S. Tan, H. Katırcıoglu, Removal of Remazol Brilliant Blue Rdye from aqueous solutions by adsorption onto immobilized Scenedesmusquadricauda: equilibrium and kinetic modeling studies, Desalination 249(2009) 1308–1314.
[21] M.A. Hossain, H.H. Ngo, W.S. Guo, T. Setiadi, Adsorption and desorption ofcopper(II) ions onto garden grass, Bioresour. Technol. 121 (2012) 386–395.
[22] S. Peng, H. Meng, Y. Ouyang, J. Chang, Nanoporous magneticcellulose�chitosan composite microspheres: preparation, characterization,and application for Cu(II) adsorption, Ind. Eng. Chem. Res. 53 (6) (2014) 2106–2113.
[23] H. Harmita, K.G. Karthikeyan, X. Pan, Copper and cadmium sorption onto kraftand organosolv lignins, Bioresour. Technol. 100 (2009) 6183–6191.
[24] G. Crini, P.M. Badot, Application of chitosan, a natural aminopolysaccharide,for dye removal from aqueous solutions by adsorption processes using batchstudies: a review of recent literature, Prog. Polym. Sci. 33 (2008) 399–447.
[25] S. Jagtap, D. Thakre, S. Wanjari, S. Kamble, N. Labhsetwar, S. Rayalu, Newmodified chitosan-based adsorbent for defluoridation of water, J. Coll.Interface Sci. 332 (2009) 280–290.
[26] X. Hu, J. Wang, Y. Liu, X. Li, G. Zeng, Z. Bao, Adsorption of chromium(VI) byethylenediamine-modified cross-linked magnetic chitosan resin: isotherms,kinetics and thermodynamics, J. Hazard. Mater. 185 (2011) 306–314.
[27] A.A. Perez-Fonseca, C. Gomez, H. Davila, R.G. Nunez, J.R.R. Ortiz, M.O.V. Lepe,Chitosan supported onto agave fiber-postconsumer HDPE composites forCr(VI) adsorption, Ind. Eng. Chem. Res. 51 (2012) 5939–5946.
[28] A.C.L. Batista, E.R. Villanueva, R.V.S. Amorim, M.T. Tavares, G.M.C. Takaki,Chromium(VI) ion adsorption features of chitosan film and its chitosan/zeoliteconjugate 13X film, Molecules 16 (2011) 3569–3579.
[29] V. Janaki, B.T. Oh, K. Shanthi, K.J. Lee, A.K. Ramasamy, S.K. Kannan, Polyaniline/chitosan composite: an eco-friendly polymer for enhanced removal of dyesfrom aqueous solution, Synth. Met. 162 (2012) 974–980.
[30] N.A. Travlou, G.Z. Kyzas, N.K. Lazaridis, E.A. Deliyanni, Functionalization ofgraphite oxide with magnetic chitosan for the preparation of a nanocompositedye adsorbent, Langmuir 29 (2013) 1657–1668.
[31] A.G. Yavuz, E.D. Atalay, A. Uygun, F. Gode, E. Aslan, A comparison study ofadsorption of Cr(VI) from aqueous solutions onto alkyl-substitutedpolyaniline/chitosan composites, Desalination 279 (2011) 325–331.
[32] J. Dai, F. Ren, C.Y. Tao, Adsorption of Cr(VI) and speciation of Cr(VI) and Cr(III)in aqueous solutions using chemically modified chitosan, Int. J. Environ. Res.Public Health 9 (2012) 1757–1770.
[33] Q.-F. Lü, Z.-K. Huang, B. Liu, X. Cheng, Preparation and heavy metal ionsbiosorption of graft copolymers from enzymatic hydrolysis lignin and aminoacids, Bioresour. Technol. 104 (2012) 111–118.
[34] L. Chen, C. Tang, N. Ning, C. Wang, Q. Fu, Q. Zhang, Preparation and propertiesof chitosan/lignin composite films, Chinese J. Polym. Sci. 27 (2009) 739–746.
[35] V.A. Spinelli, M.C.M. Laranjeira, V.T. Favere, Preparation and characterizationof quaternary chitosan salt: adsorption equilibrium of chromium(VI) ion,React. Funct. Polym. 61 (2004) 347–352.
[36] E.L. Mansouri, Q. Yaun, F. Huang, Characterization of alkaline lignins for use inphenol-formaldehyde and epoxy resins, Bioresources 6 (2011) 2647–2662.
[37] N. Sbirrazzuoli, L. Vincent, A. Mija, N. Guigo, Integral, differential and advancedisoconversional methods. Complex mechanisms and isothermal predictedconversion-time curves, Chemom. Intell. Lab. Syst. 96 (2009) 219–226.
[38] S. Nethaji, A. Sivasamy, G. Thennarasu, S. Saravanan, Adsorption of malachitegreen dye onto activated carbon derived from Borassus aethiopum flowerbiomass, J. Hazard. Mater. 181 (2010) 271–280.
[39] G. Annadurai, L.Y. Ling, J.F. Lee, Adsorption of reactive dye from an aqueoussolution by chitosan: isotherm, kinetic and thermodynamic analysis, J. Hazard.Mater. 152 (2008) 337–346.
[40] D. Angin, Utilization of activated carbon produced from fruit juice industrysolid waste for the adsorption of Yellow 18 from aqueous solution, Bioresour.Technol. (2014), http://dx.doi.org/10.1016/j.biortech.2014.02.100.
[41] K.V. Kumar, Optimum sorption isotherm by linear and non-linear methods formalachite green onto lemon peel, Dyes Pigments 74 (2007) 595–597.
[42] A.C. Zimmermann, A. Mecabo, T. Fagundes, C.A. Rodrigues, Adsorption of Cr(VI)using Fe-crosslinked chitosan complex (Ch-Fe), J. Hazard. Mater. 179 (2010)192–196.
[43] F. Camacho, P. Gonzalez-Tello, E. Jurado, A. Robles, Microcrystalline-cellulosehydrolysis with concentrated sulphuric acid, J. Chem. Technol. Biotechnol. 67(1996) 350–356.
[44] A. Zamani, M.J. Taherzadeh, Production of low molecular weight chitosan byhot dilute sulfuric acid, Bioresources 5 (2010) 1554–1564.
[45] Y. Zhang, E.A. Pidko, E.J.M. Hensen, Molecular aspects of glucose dehydrationby chromium chlorides, Chem. Eur. J. 17 (2011) 5281–5288.
[46] L. Zhang, W. Xia, B. Teng, X. Liu, W. Zhang, Zirconium cross-linked chitosancomposite: preparation, characterization and application in adsorption ofCr(VI), Chem. Eng. J. 229 (2013) 1–8.
[47] R.T. Morrison, R.N. Boyd, Organic Chemistry, 2, Pearson Education Pvt. Ltd.,2002.
[48] O.H. Wheeler, Structure and properties of cyclic compounds. IX. Hemiketalformation of cyclic ketones, J. Am. Chem. Soc. 79 (1957) 4191–4194.