Embed Size (px)
Citation preview
101
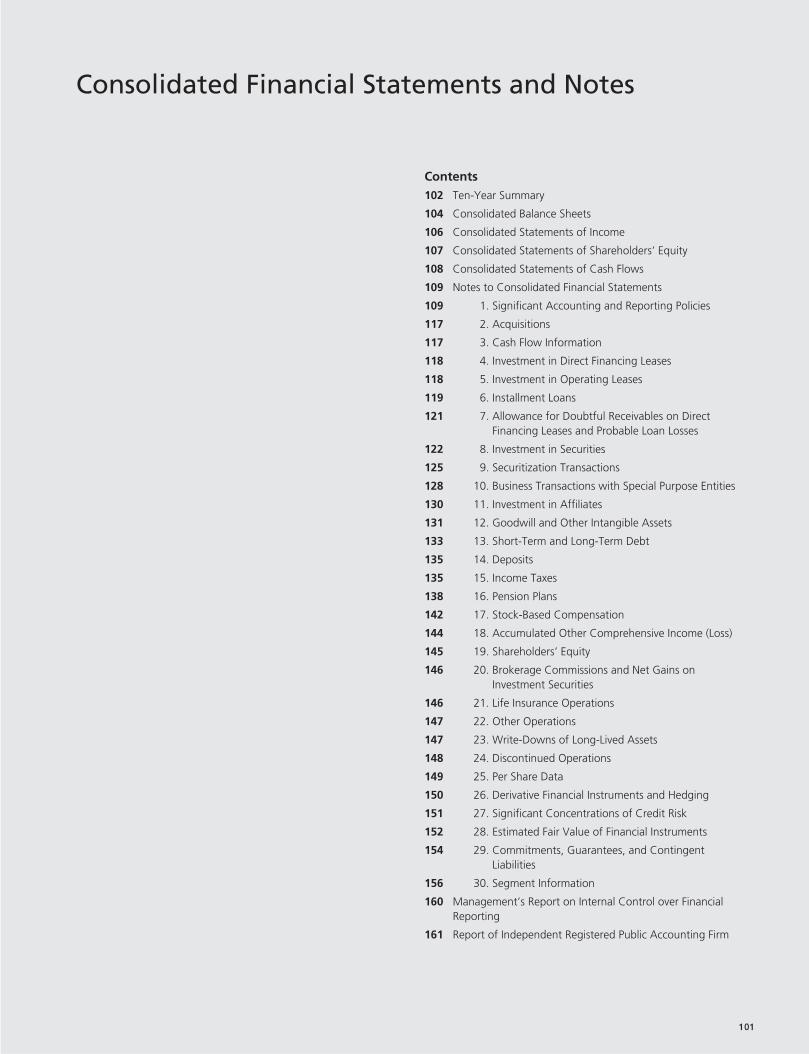
Consolidated Financial Statements and Notes
Contents102 Ten-Year Summary
104 Consolidated Balance Sheets
106 Consolidated Statements of Income
107 Consolidated Statements of Shareholders’ Equity
108 Consolidated Statements of Cash Flows
109 Notes to Consolidated Financial Statements
109 01. Significant Accounting and Reporting Policies
117 02. Acquisitions
117 03. Cash Flow Information
118 04. Investment in Direct Financing Leases
118 05. Investment in Operating Leases
119 06. Installment Loans
121 07. Allowance for Doubtful Receivables on Direct Financing Leases and Probable Loan Losses
122 08. Investment in Securities
125 09. Securitization Transactions
128 10. Business Transactions with Special Purpose Entities
130 11. Investment in Affiliates
131 12. Goodwill and Other Intangible Assets
133 13. Short-Term and Long-Term Debt
135 14. Deposits
135 15. Income Taxes
138 16. Pension Plans
142 17. Stock-Based Compensation
144 18. Accumulated Other Comprehensive Income (Loss)
145 19. Shareholders’ Equity
146 20. Brokerage Commissions and Net Gains onInvestment Securities
146 21. Life Insurance Operations
147 22. Other Operations
147 23. Write-Downs of Long-Lived Assets
148 24. Discontinued Operations
149 25. Per Share Data
150 26. Derivative Financial Instruments and Hedging
151 27. Significant Concentrations of Credit Risk
152 28. Estimated Fair Value of Financial Instruments
154 29. Commitments, Guarantees, and ContingentLiabilities
156 30. Segment Information
160 Management’s Report on Internal Control over FinancialReporting
161 Report of Independent Registered Public Accounting Firm
102
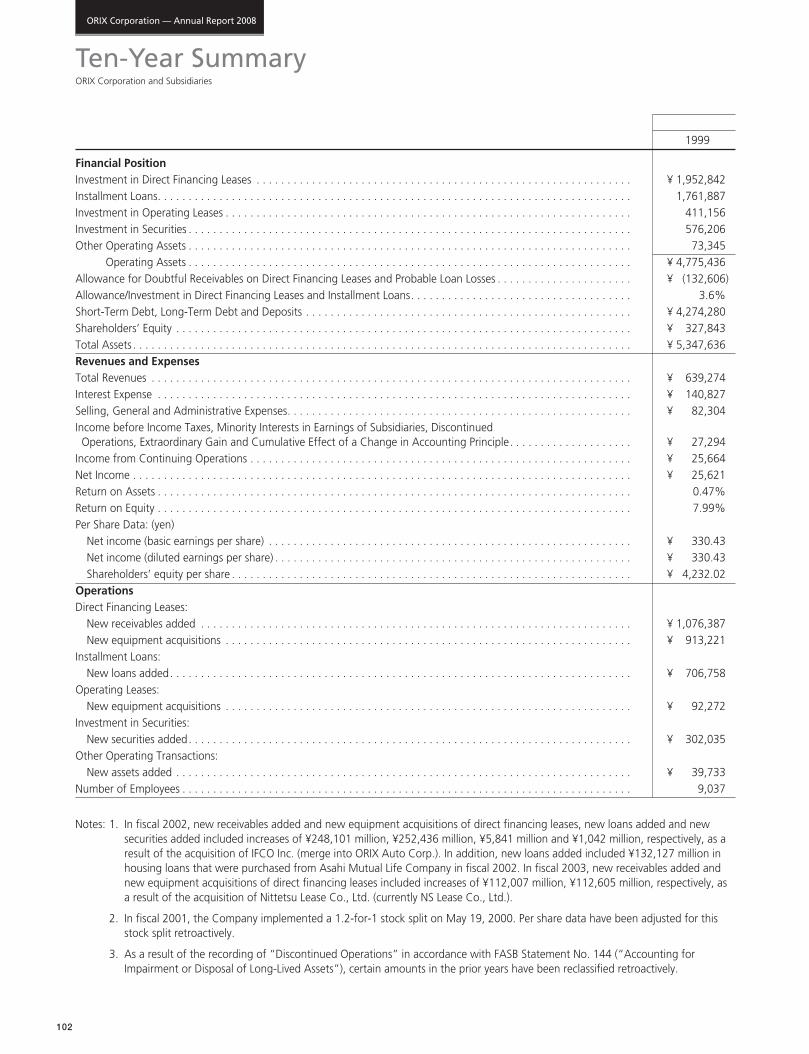
ORIX Corporation — Annual Report 2008
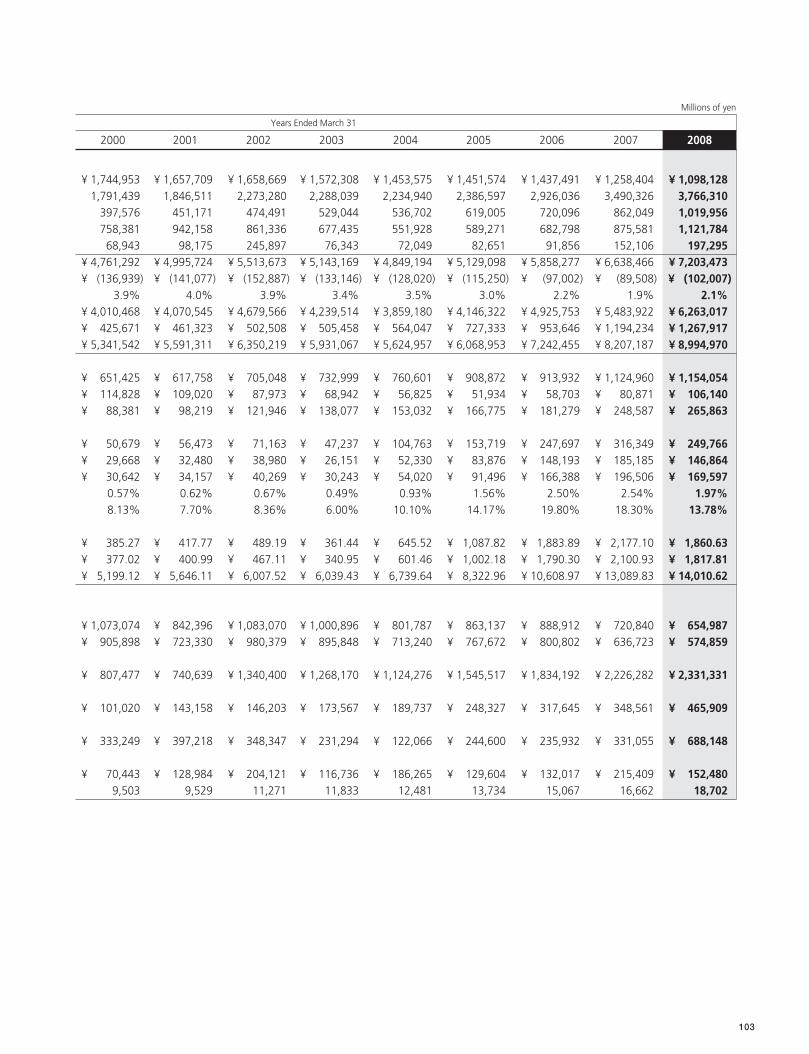
Ten-Year SummaryORIX Corporation and Subsidiaries
1999
Financial PositionInvestment in Direct Financing Leases . . . . . . . . . . . . . . . . . . . . . . . . . . . . . . . . . . . . . . . . . . . . . . . . . . . . . . . . . . . . . ¥ 1,952,842Installment Loans. . . . . . . . . . . . . . . . . . . . . . . . . . . . . . . . . . . . . . . . . . . . . . . . . . . . . . . . . . . . . . . . . . . . . . . . . . . . . 1,761,887Investment in Operating Leases . . . . . . . . . . . . . . . . . . . . . . . . . . . . . . . . . . . . . . . . . . . . . . . . . . . . . . . . . . . . . . . . . . 411,156Investment in Securities . . . . . . . . . . . . . . . . . . . . . . . . . . . . . . . . . . . . . . . . . . . . . . . . . . . . . . . . . . . . . . . . . . . . . . . . 576,206Other Operating Assets . . . . . . . . . . . . . . . . . . . . . . . . . . . . . . . . . . . . . . . . . . . . . . . . . . . . . . . . . . . . . . . . . . . . . . . . 73,345Other Operating Assets . . . . . . . . . . . . . . . . . . . . . . . . . . . . . . . . . . . . . . . . . . . . . . . . . . . . . . . . . . . . . . . . . . . . . . . . ¥ 4,775,436Allowance for Doubtful Receivables on Direct Financing Leases and Probable Loan Losses . . . . . . . . . . . . . . . . . . . . . . ¥ (132,606)Allowance/Investment in Direct Financing Leases and Installment Loans. . . . . . . . . . . . . . . . . . . . . . . . . . . . . . . . . . . . 3.6%Short-Term Debt, Long-Term Debt and Deposits . . . . . . . . . . . . . . . . . . . . . . . . . . . . . . . . . . . . . . . . . . . . . . . . . . . . . ¥ 4,274,280Shareholders’ Equity . . . . . . . . . . . . . . . . . . . . . . . . . . . . . . . . . . . . . . . . . . . . . . . . . . . . . . . . . . . . . . . . . . . . . . . . . . ¥ 327,843Total Assets . . . . . . . . . . . . . . . . . . . . . . . . . . . . . . . . . . . . . . . . . . . . . . . . . . . . . . . . . . . . . . . . . . . . . . . . . . . . . . . . . ¥ 5,347,636Revenues and ExpensesTotal Revenues . . . . . . . . . . . . . . . . . . . . . . . . . . . . . . . . . . . . . . . . . . . . . . . . . . . . . . . . . . . . . . . . . . . . . . . . . . . . . . ¥ 639,274Interest Expense . . . . . . . . . . . . . . . . . . . . . . . . . . . . . . . . . . . . . . . . . . . . . . . . . . . . . . . . . . . . . . . . . . . . . . . . . . . . . ¥ 140,827Selling, General and Administrative Expenses. . . . . . . . . . . . . . . . . . . . . . . . . . . . . . . . . . . . . . . . . . . . . . . . . . . . . . . . ¥ 82,304Income before Income Taxes, Minority Interests in Earnings of Subsidiaries, DiscontinuedOperations, Extraordinary Gain and Cumulative Effect of a Change in Accounting Principle. . . . . . . . . . . . . . . . . . . . ¥ 27,294
Income from Continuing Operations . . . . . . . . . . . . . . . . . . . . . . . . . . . . . . . . . . . . . . . . . . . . . . . . . . . . . . . . . . . . . . ¥ 25,664Net Income . . . . . . . . . . . . . . . . . . . . . . . . . . . . . . . . . . . . . . . . . . . . . . . . . . . . . . . . . . . . . . . . . . . . . . . . . . . . . . . . . ¥ 25,621Return on Assets . . . . . . . . . . . . . . . . . . . . . . . . . . . . . . . . . . . . . . . . . . . . . . . . . . . . . . . . . . . . . . . . . . . . . . . . . . . . . 0.47%Return on Equity . . . . . . . . . . . . . . . . . . . . . . . . . . . . . . . . . . . . . . . . . . . . . . . . . . . . . . . . . . . . . . . . . . . . . . . . . . . . . 7.99%Per Share Data: (yen)
Net income (basic earnings per share) . . . . . . . . . . . . . . . . . . . . . . . . . . . . . . . . . . . . . . . . . . . . . . . . . . . . . . . . . . . ¥ 330.43Net income (diluted earnings per share) . . . . . . . . . . . . . . . . . . . . . . . . . . . . . . . . . . . . . . . . . . . . . . . . . . . . . . . . . . ¥ 330.43Shareholders’ equity per share . . . . . . . . . . . . . . . . . . . . . . . . . . . . . . . . . . . . . . . . . . . . . . . . . . . . . . . . . . . . . . . . . ¥ 4,232.02
OperationsDirect Financing Leases:
New receivables added . . . . . . . . . . . . . . . . . . . . . . . . . . . . . . . . . . . . . . . . . . . . . . . . . . . . . . . . . . . . . . . . . . . . . . ¥ 1,076,387New equipment acquisitions . . . . . . . . . . . . . . . . . . . . . . . . . . . . . . . . . . . . . . . . . . . . . . . . . . . . . . . . . . . . . . . . . . ¥ 913,221
Installment Loans:New loans added. . . . . . . . . . . . . . . . . . . . . . . . . . . . . . . . . . . . . . . . . . . . . . . . . . . . . . . . . . . . . . . . . . . . . . . . . . . ¥ 706,758
Operating Leases:New equipment acquisitions . . . . . . . . . . . . . . . . . . . . . . . . . . . . . . . . . . . . . . . . . . . . . . . . . . . . . . . . . . . . . . . . . . ¥ 92,272
Investment in Securities:New securities added. . . . . . . . . . . . . . . . . . . . . . . . . . . . . . . . . . . . . . . . . . . . . . . . . . . . . . . . . . . . . . . . . . . . . . . . ¥ 302,035
Other Operating Transactions:New assets added . . . . . . . . . . . . . . . . . . . . . . . . . . . . . . . . . . . . . . . . . . . . . . . . . . . . . . . . . . . . . . . . . . . . . . . . . . ¥ 39,733
Number of Employees . . . . . . . . . . . . . . . . . . . . . . . . . . . . . . . . . . . . . . . . . . . . . . . . . . . . . . . . . . . . . . . . . . . . . . . . . 9,037
Notes: 1. In fiscal 2002, new receivables added and new equipment acquisitions of direct financing leases, new loans added and newsecurities added included increases of ¥248,101 million, ¥252,436 million, ¥5,841 million and ¥1,042 million, respectively, as aresult of the acquisition of IFCO Inc. (merge into ORIX Auto Corp.). In addition, new loans added included ¥132,127 million inhousing loans that were purchased from Asahi Mutual Life Company in fiscal 2002. In fiscal 2003, new receivables added andnew equipment acquisitions of direct financing leases included increases of ¥112,007 million, ¥112,605 million, respectively, asa result of the acquisition of Nittetsu Lease Co., Ltd. (currently NS Lease Co., Ltd.).
2. In fiscal 2001, the Company implemented a 1.2-for-1 stock split on May 19, 2000. Per share data have been adjusted for thisstock split retroactively.
3. As a result of the recording of “Discontinued Operations” in accordance with FASB Statement No. 144 (“Accounting forImpairment or Disposal of Long-Lived Assets”), certain amounts in the prior years have been reclassified retroactively.
103
Millions of yen
Years Ended March 31
2000 2001 2002 2003 2004 2005 2006 2007 2008
¥ 1,744,953 ¥ 1,657,709 ¥ 1,658,669 ¥ 1,572,308 ¥ 1,453,575 ¥ 1,451,574 ¥ 1,437,491 ¥ 1,258,404 ¥ 1,098,1281,791,439 1,846,511 2,273,280 2,288,039 2,234,940 2,386,597 2,926,036 3,490,326 3,766,310
397,576 451,171 474,491 529,044 536,702 619,005 720,096 862,049 1,019,956758,381 942,158 861,336 677,435 551,928 589,271 682,798 875,581 1,121,78468,943 98,175 245,897 76,343 72,049 82,651 91,856 152,106 197,295
¥ 4,761,292 ¥ 4,995,724 ¥ 5,513,673 ¥ 5,143,169 ¥ 4,849,194 ¥ 5,129,098 ¥ 5,858,277 ¥ 6,638,466 ¥ 7,203,473¥ (136,939) ¥ (141,077) ¥ (152,887) ¥ (133,146) ¥ (128,020) ¥ (115,250) ¥ (97,002) ¥ (89,508) ¥ (102,007)
3.9% 4.0% 3.9% 3.4% 3.5% 3.0% 2.2% 1.9% 2.1%¥ 4,010,468 ¥ 4,070,545 ¥ 4,679,566 ¥ 4,239,514 ¥ 3,859,180 ¥ 4,146,322 ¥ 4,925,753 ¥ 5,483,922 ¥ 6,263,017¥ 425,671 ¥ 461,323 ¥ 502,508 ¥ 505,458 ¥ 564,047 ¥ 727,333 ¥ 953,646 ¥ 1,194,234 ¥ 1,267,917¥ 5,341,542 ¥ 5,591,311 ¥ 6,350,219 ¥ 5,931,067 ¥ 5,624,957 ¥ 6,068,953 ¥ 7,242,455 ¥ 8,207,187 ¥ 8,994,970
¥ 651,425 ¥ 617,758 ¥ 705,048 ¥ 732,999 ¥ 760,601 ¥ 908,872 ¥ 913,932 ¥ 1,124,960 ¥ 1,154,054¥ 114,828 ¥ 109,020 ¥ 87,973 ¥ 68,942 ¥ 56,825 ¥ 51,934 ¥ 58,703 ¥ 80,871 ¥ 106,140¥ 88,381 ¥ 98,219 ¥ 121,946 ¥ 138,077 ¥ 153,032 ¥ 166,775 ¥ 181,279 ¥ 248,587 ¥ 265,863
¥ 50,679 ¥ 56,473 ¥ 71,163 ¥ 47,237 ¥ 104,763 ¥ 153,719 ¥ 247,697 ¥ 316,349 ¥ 249,766¥ 29,668 ¥ 32,480 ¥ 38,980 ¥ 26,151 ¥ 52,330 ¥ 83,876 ¥ 148,193 ¥ 185,185 ¥ 146,864¥ 30,642 ¥ 34,157 ¥ 40,269 ¥ 30,243 ¥ 54,020 ¥ 91,496 ¥ 166,388 ¥ 196,506 ¥ 169,597
0.57% 0.62% 0.67% 0.49% 0.93% 1.56% 2.50% 2.54% 1.97%8.13% 7.70% 8.36% 6.00% 10.10% 14.17% 19.80% 18.30% 13.78%
¥ 385.27 ¥ 417.77 ¥ 489.19 ¥ 361.44 ¥ 645.52 ¥ 1,087.82 ¥ 1,883.89 ¥ 2,177.10 ¥ 1,860.63¥ 377.02 ¥ 400.99 ¥ 467.11 ¥ 340.95 ¥ 601.46 ¥ 1,002.18 ¥ 1,790.30 ¥ 2,100.93 ¥ 1,817.81¥ 5,199.12 ¥ 5,646.11 ¥ 6,007.52 ¥ 6,039.43 ¥ 6,739.64 ¥ 8,322.96 ¥ 10,608.97 ¥ 13,089.83 ¥ 14,010.62
¥ 1,073,074 ¥ 842,396 ¥ 1,083,070 ¥ 1,000,896 ¥ 801,787 ¥ 863,137 ¥ 888,912 ¥ 720,840 ¥ 654,987¥ 905,898 ¥ 723,330 ¥ 980,379 ¥ 895,848 ¥ 713,240 ¥ 767,672 ¥ 800,802 ¥ 636,723 ¥ 574,859
¥ 807,477 ¥ 740,639 ¥ 1,340,400 ¥ 1,268,170 ¥ 1,124,276 ¥ 1,545,517 ¥ 1,834,192 ¥ 2,226,282 ¥ 2,331,331
¥ 101,020 ¥ 143,158 ¥ 146,203 ¥ 173,567 ¥ 189,737 ¥ 248,327 ¥ 317,645 ¥ 348,561 ¥ 465,909
¥ 333,249 ¥ 397,218 ¥ 348,347 ¥ 231,294 ¥ 122,066 ¥ 244,600 ¥ 235,932 ¥ 331,055 ¥ 688,148
¥ 70,443 ¥ 128,984 ¥ 204,121 ¥ 116,736 ¥ 186,265 ¥ 129,604 ¥ 132,017 ¥ 215,409 ¥ 152,4809,503 9,529 11,271 11,833 12,481 13,734 15,067 16,662 18,702
104
ORIX Corporation — Annual Report 2008
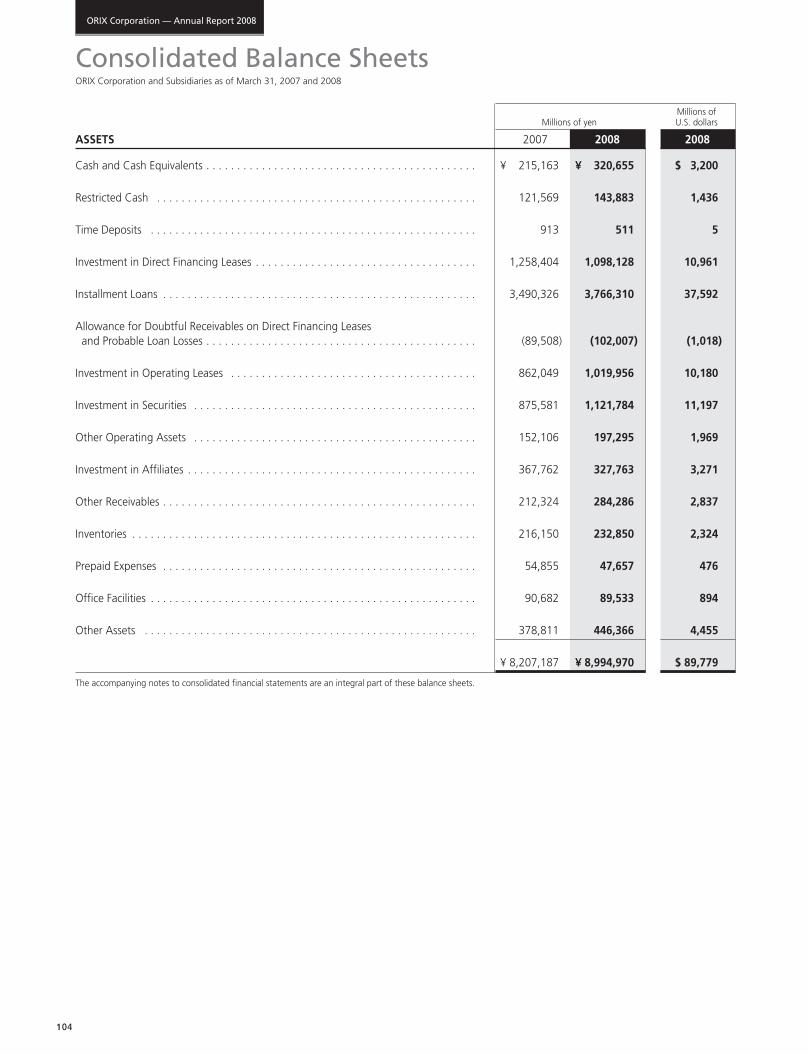
Consolidated Balance SheetsORIX Corporation and Subsidiaries as of March 31, 2007 and 2008
Millions of Millions of yen U.S. dollars
ASSETS 2007 2008 2008
Cash and Cash Equivalents . . . . . . . . . . . . . . . . . . . . . . . . . . . . . . . . . . . . . . . . . . . . ¥ 215,163 ¥ 320,655 $ 3,200
Restricted Cash . . . . . . . . . . . . . . . . . . . . . . . . . . . . . . . . . . . . . . . . . . . . . . . . . . . . 121,569 143,883 1,436
Time Deposits . . . . . . . . . . . . . . . . . . . . . . . . . . . . . . . . . . . . . . . . . . . . . . . . . . . . . 913 511 5
Investment in Direct Financing Leases . . . . . . . . . . . . . . . . . . . . . . . . . . . . . . . . . . . . 1,258,404 1,098,128 10,961
Installment Loans . . . . . . . . . . . . . . . . . . . . . . . . . . . . . . . . . . . . . . . . . . . . . . . . . . . 3,490,326 3,766,310 37,592
Allowance for Doubtful Receivables on Direct Financing Leases and Probable Loan Losses . . . . . . . . . . . . . . . . . . . . . . . . . . . . . . . . . . . . . . . . . . . . (89,508) (102,007) (1,018)
Investment in Operating Leases . . . . . . . . . . . . . . . . . . . . . . . . . . . . . . . . . . . . . . . . 862,049 1,019,956 10,180
Investment in Securities . . . . . . . . . . . . . . . . . . . . . . . . . . . . . . . . . . . . . . . . . . . . . . 875,581 1,121,784 11,197
Other Operating Assets . . . . . . . . . . . . . . . . . . . . . . . . . . . . . . . . . . . . . . . . . . . . . . 152,106 197,295 1,969
Investment in Affiliates . . . . . . . . . . . . . . . . . . . . . . . . . . . . . . . . . . . . . . . . . . . . . . . 367,762 327,763 3,271
Other Receivables . . . . . . . . . . . . . . . . . . . . . . . . . . . . . . . . . . . . . . . . . . . . . . . . . . . 212,324 284,286 2,837
Inventories . . . . . . . . . . . . . . . . . . . . . . . . . . . . . . . . . . . . . . . . . . . . . . . . . . . . . . . . 216,150 232,850 2,324
Prepaid Expenses . . . . . . . . . . . . . . . . . . . . . . . . . . . . . . . . . . . . . . . . . . . . . . . . . . . 54,855 47,657 476
Office Facilities . . . . . . . . . . . . . . . . . . . . . . . . . . . . . . . . . . . . . . . . . . . . . . . . . . . . . 90,682 89,533 894
Other Assets . . . . . . . . . . . . . . . . . . . . . . . . . . . . . . . . . . . . . . . . . . . . . . . . . . . . . . 378,811 446,366 4,455
. . . . . . . . . . . . . . . . . . . . . . . . . . . . . . . . . . . . . . . . . . . . . . . . . . . . . . . . . . . ¥ 8,207,187 ¥ 8,994,970 $ 89,779
The accompanying notes to consolidated financial statements are an integral part of these balance sheets.
105
ORIX Corporation — Annual Report 2008
Millions of Millions of yen U.S. dollars
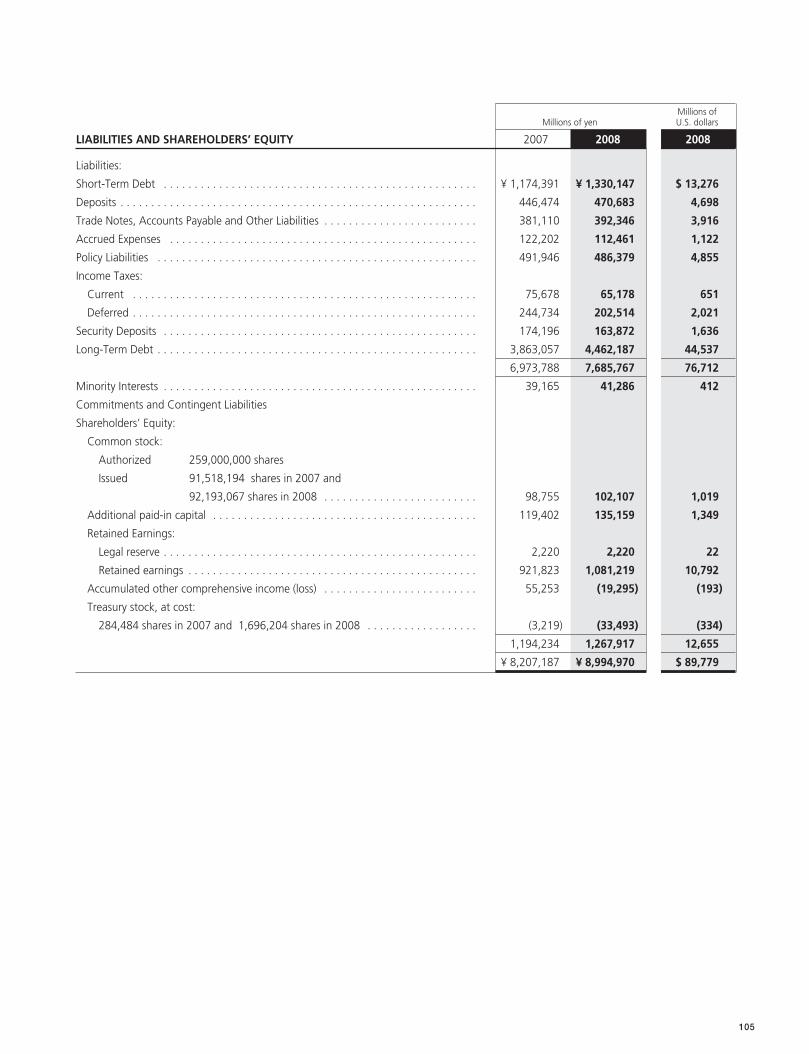
LIABILITIES AND SHAREHOLDERS’ EQUITY 2007 2008 2008
Liabilities:
Short-Term Debt . . . . . . . . . . . . . . . . . . . . . . . . . . . . . . . . . . . . . . . . . . . . . . . . . . . ¥ 1,174,391 ¥ 1,330,147 $ 13,276
Deposits . . . . . . . . . . . . . . . . . . . . . . . . . . . . . . . . . . . . . . . . . . . . . . . . . . . . . . . . . . 446,474 470,683 4,698
Trade Notes, Accounts Payable and Other Liabilities . . . . . . . . . . . . . . . . . . . . . . . . . 381,110 392,346 3,916
Accrued Expenses . . . . . . . . . . . . . . . . . . . . . . . . . . . . . . . . . . . . . . . . . . . . . . . . . . 122,202 112,461 1,122
Policy Liabilities . . . . . . . . . . . . . . . . . . . . . . . . . . . . . . . . . . . . . . . . . . . . . . . . . . . . 491,946 486,379 4,855
Income Taxes:
Current . . . . . . . . . . . . . . . . . . . . . . . . . . . . . . . . . . . . . . . . . . . . . . . . . . . . . . . . 75,678 65,178 651
Deferred . . . . . . . . . . . . . . . . . . . . . . . . . . . . . . . . . . . . . . . . . . . . . . . . . . . . . . . . 244,734 202,514 2,021
Security Deposits . . . . . . . . . . . . . . . . . . . . . . . . . . . . . . . . . . . . . . . . . . . . . . . . . . . 174,196 163,872 1,636
Long-Term Debt . . . . . . . . . . . . . . . . . . . . . . . . . . . . . . . . . . . . . . . . . . . . . . . . . . . . 3,863,057 4,462,187 44,537
. . . . . . . . . . . . . . . . . . . . . . . . . . . . . . . . . . . . . . . . . . . . . . . . . . . . . . . . . . . 6,973,788 7,685,767 76,712
Minority Interests . . . . . . . . . . . . . . . . . . . . . . . . . . . . . . . . . . . . . . . . . . . . . . . . . . . 39,165 41,286 412
Commitments and Contingent Liabilities
Shareholders’ Equity:
Common stock:
Authorized 259,000,000 shares
Issued 91,518,194 shares in 2007 and
92,193,067 shares in 2008 . . . . . . . . . . . . . . . . . . . . . . . . . 98,755 102,107 1,019
Additional paid-in capital . . . . . . . . . . . . . . . . . . . . . . . . . . . . . . . . . . . . . . . . . . . 119,402 135,159 1,349
Retained Earnings:
Legal reserve . . . . . . . . . . . . . . . . . . . . . . . . . . . . . . . . . . . . . . . . . . . . . . . . . . . 2,220 2,220 22
Retained earnings . . . . . . . . . . . . . . . . . . . . . . . . . . . . . . . . . . . . . . . . . . . . . . . 921,823 1,081,219 10,792
Accumulated other comprehensive income (loss) . . . . . . . . . . . . . . . . . . . . . . . . . 55,253 (19,295) (193)
Treasury stock, at cost:
284,484 shares in 2007 and 1,696,204 shares in 2008 . . . . . . . . . . . . . . . . . . (3,219) (33,493) (334)
. . . . . . . . . . . . . . . . . . . . . . . . . . . . . . . . . . . . . . . . . . . . . . . . . . . . . . . . . . . 1,194,234 1,267,917 12,655
. . . . . . . . . . . . . . . . . . . . . . . . . . . . . . . . . . . . . . . . . . . . . . . . . . . . . . . . . . . ¥ 8,207,187 ¥ 8,994,970 $ 89,779
106
ORIX Corporation — Annual Report 2008
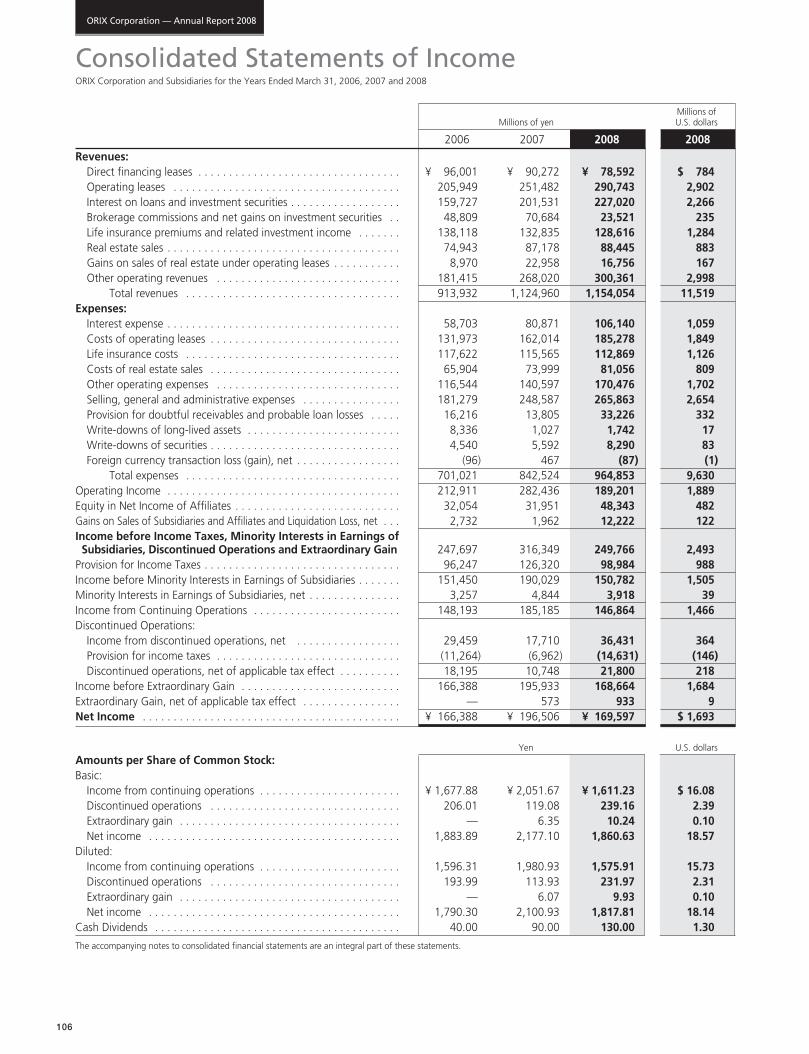
Consolidated Statements of IncomeORIX Corporation and Subsidiaries for the Years Ended March 31, 2006, 2007 and 2008
Millions of Millions of yen U.S. dollars
2006 2007 2008 2008Revenues:
Direct financing leases . . . . . . . . . . . . . . . . . . . . . . . . . . . . . . . . . ¥ 96,001 ¥ 90,272 ¥ 78,592 $ 784 Operating leases . . . . . . . . . . . . . . . . . . . . . . . . . . . . . . . . . . . . . 205,949 251,482 290,743 2,902 Interest on loans and investment securities . . . . . . . . . . . . . . . . . . 159,727 201,531 227,020 2,266 Brokerage commissions and net gains on investment securities . . 48,809 70,684 23,521 235 Life insurance premiums and related investment income . . . . . . . 138,118 132,835 128,616 1,284 Real estate sales . . . . . . . . . . . . . . . . . . . . . . . . . . . . . . . . . . . . . . 74,943 87,178 88,445 883 Gains on sales of real estate under operating leases . . . . . . . . . . . 8,970 22,958 16,756 167 Other operating revenues . . . . . . . . . . . . . . . . . . . . . . . . . . . . . . 181,415 268,020 300,361 2,998
Total revenues . . . . . . . . . . . . . . . . . . . . . . . . . . . . . . . . . . . 913,932 1,124,960 1,154,054 11,519 Expenses:
Interest expense . . . . . . . . . . . . . . . . . . . . . . . . . . . . . . . . . . . . . . 58,703 80,871 106,140 1,059 Costs of operating leases . . . . . . . . . . . . . . . . . . . . . . . . . . . . . . . 131,973 162,014 185,278 1,849 Life insurance costs . . . . . . . . . . . . . . . . . . . . . . . . . . . . . . . . . . . 117,622 115,565 112,869 1,126 Costs of real estate sales . . . . . . . . . . . . . . . . . . . . . . . . . . . . . . . 65,904 73,999 81,056 809 Other operating expenses . . . . . . . . . . . . . . . . . . . . . . . . . . . . . . 116,544 140,597 170,476 1,702 Selling, general and administrative expenses . . . . . . . . . . . . . . . . 181,279 248,587 265,863 2,654 Provision for doubtful receivables and probable loan losses . . . . . 16,216 13,805 33,226 332 Write-downs of long-lived assets . . . . . . . . . . . . . . . . . . . . . . . . . 8,336 1,027 1,742 17 Write-downs of securities . . . . . . . . . . . . . . . . . . . . . . . . . . . . . . . 4,540 5,592 8,290 83 Foreign currency transaction loss (gain), net . . . . . . . . . . . . . . . . . (96) 467 (87) (1)
Total expenses . . . . . . . . . . . . . . . . . . . . . . . . . . . . . . . . . . . 701,021 842,524 964,853 9,630 Operating Income . . . . . . . . . . . . . . . . . . . . . . . . . . . . . . . . . . . . . . 212,911 282,436 189,201 1,889 Equity in Net Income of Affiliates . . . . . . . . . . . . . . . . . . . . . . . . . . . 32,054 31,951 48,343 482 Gains on Sales of Subsidiaries and Affiliates and Liquidation Loss, net . . . 2,732 1,962 12,222 122 Income before Income Taxes, Minority Interests in Earnings ofSubsidiaries, Discontinued Operations and Extraordinary Gain 247,697 316,349 249,766 2,493
Provision for Income Taxes . . . . . . . . . . . . . . . . . . . . . . . . . . . . . . . . 96,247 126,320 98,984 988 Income before Minority Interests in Earnings of Subsidiaries . . . . . . . 151,450 190,029 150,782 1,505 Minority Interests in Earnings of Subsidiaries, net . . . . . . . . . . . . . . . 3,257 4,844 3,918 39 Income from Continuing Operations . . . . . . . . . . . . . . . . . . . . . . . . 148,193 185,185 146,864 1,466 Discontinued Operations:
Income from discontinued operations, net . . . . . . . . . . . . . . . . . 29,459 17,710 36,431 364 Provision for income taxes . . . . . . . . . . . . . . . . . . . . . . . . . . . . . . (11,264) (6,962) (14,631) (146)Discontinued operations, net of applicable tax effect . . . . . . . . . . 18,195 10,748 21,800 218
Income before Extraordinary Gain . . . . . . . . . . . . . . . . . . . . . . . . . . 166,388 195,933 168,664 1,684 Extraordinary Gain, net of applicable tax effect . . . . . . . . . . . . . . . . — 573 933 9 Net Income . . . . . . . . . . . . . . . . . . . . . . . . . . . . . . . . . . . . . . . . . . ¥ 166,388 ¥ 196,506 ¥ 169,597 $ 1,693
Yen U.S. dollarsAmounts per Share of Common Stock:Basic:
Income from continuing operations . . . . . . . . . . . . . . . . . . . . . . . ¥ 1,677.88 ¥ 2,051.67 ¥ 1,611.23 $ 16.08 Discontinued operations . . . . . . . . . . . . . . . . . . . . . . . . . . . . . . . 206.01 119.08 239.16 2.39 Extraordinary gain . . . . . . . . . . . . . . . . . . . . . . . . . . . . . . . . . . . . — 6.35 10.24 0.10 Net income . . . . . . . . . . . . . . . . . . . . . . . . . . . . . . . . . . . . . . . . . 1,883.89 2,177.10 1,860.63 18.57
Diluted:Income from continuing operations . . . . . . . . . . . . . . . . . . . . . . . 1,596.31 1,980.93 1,575.91 15.73 Discontinued operations . . . . . . . . . . . . . . . . . . . . . . . . . . . . . . . 193.99 113.93 231.97 2.31 Extraordinary gain . . . . . . . . . . . . . . . . . . . . . . . . . . . . . . . . . . . . — 6.07 9.93 0.10 Net income . . . . . . . . . . . . . . . . . . . . . . . . . . . . . . . . . . . . . . . . . 1,790.30 2,100.93 1,817.81 18.14
Cash Dividends . . . . . . . . . . . . . . . . . . . . . . . . . . . . . . . . . . . . . . . . 40.00 90.00 130.00 1.30
The accompanying notes to consolidated financial statements are an integral part of these statements.
107
ORIX Corporation — Annual Report 2008
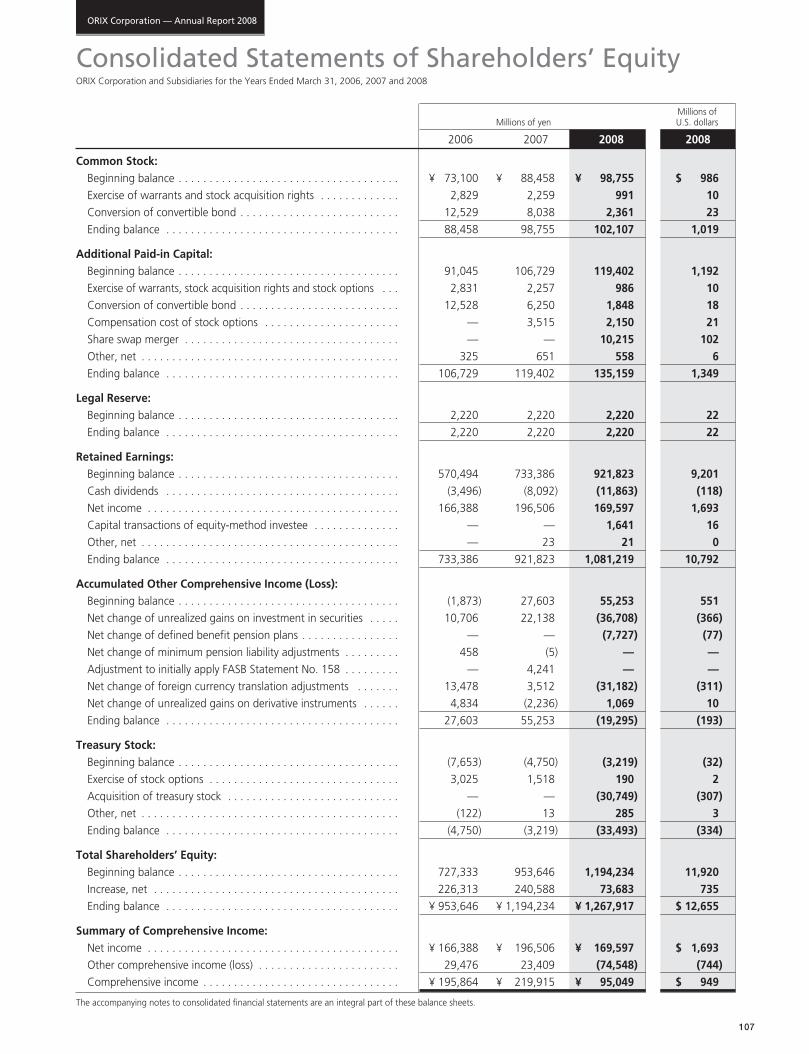
Consolidated Statements of Shareholders’ EquityORIX Corporation and Subsidiaries for the Years Ended March 31, 2006, 2007 and 2008
Millions of Millions of yen U.S. dollars
2006 2007 2008 2008
Common Stock:Beginning balance . . . . . . . . . . . . . . . . . . . . . . . . . . . . . . . . . . . . ¥ 73,100 ¥ 88,458 ¥ 98,755 $ 986 Exercise of warrants and stock acquisition rights . . . . . . . . . . . . . 2,829 2,259 991 10 Conversion of convertible bond . . . . . . . . . . . . . . . . . . . . . . . . . . 12,529 8,038 2,361 23 Ending balance . . . . . . . . . . . . . . . . . . . . . . . . . . . . . . . . . . . . . . 88,458 98,755 102,107 1,019
Additional Paid-in Capital:Beginning balance . . . . . . . . . . . . . . . . . . . . . . . . . . . . . . . . . . . . 91,045 106,729 119,402 1,192 Exercise of warrants, stock acquisition rights and stock options . . . 2,831 2,257 986 10 Conversion of convertible bond . . . . . . . . . . . . . . . . . . . . . . . . . . 12,528 6,250 1,848 18 Compensation cost of stock options . . . . . . . . . . . . . . . . . . . . . . — 3,515 2,150 21 Share swap merger . . . . . . . . . . . . . . . . . . . . . . . . . . . . . . . . . . . — — 10,215 102 Other, net . . . . . . . . . . . . . . . . . . . . . . . . . . . . . . . . . . . . . . . . . . 325 651 558 6 Ending balance . . . . . . . . . . . . . . . . . . . . . . . . . . . . . . . . . . . . . . 106,729 119,402 135,159 1,349
Legal Reserve:Beginning balance . . . . . . . . . . . . . . . . . . . . . . . . . . . . . . . . . . . . 2,220 2,220 2,220 22 Ending balance . . . . . . . . . . . . . . . . . . . . . . . . . . . . . . . . . . . . . . 2,220 2,220 2,220 22
Retained Earnings:Beginning balance . . . . . . . . . . . . . . . . . . . . . . . . . . . . . . . . . . . . 570,494 733,386 921,823 9,201 Cash dividends . . . . . . . . . . . . . . . . . . . . . . . . . . . . . . . . . . . . . . (3,496) (8,092) (11,863) (118)Net income . . . . . . . . . . . . . . . . . . . . . . . . . . . . . . . . . . . . . . . . . 166,388 196,506 169,597 1,693 Capital transactions of equity-method investee . . . . . . . . . . . . . . — — 1,641 16 Other, net . . . . . . . . . . . . . . . . . . . . . . . . . . . . . . . . . . . . . . . . . . — 23 21 0 Ending balance . . . . . . . . . . . . . . . . . . . . . . . . . . . . . . . . . . . . . . 733,386 921,823 1,081,219 10,792
Accumulated Other Comprehensive Income (Loss):Beginning balance . . . . . . . . . . . . . . . . . . . . . . . . . . . . . . . . . . . . (1,873) 27,603 55,253 551 Net change of unrealized gains on investment in securities . . . . . 10,706 22,138 (36,708) (366)Net change of defined benefit pension plans . . . . . . . . . . . . . . . . — — (7,727) (77)Net change of minimum pension liability adjustments . . . . . . . . . 458 (5) — —Adjustment to initially apply FASB Statement No. 158 . . . . . . . . . — 4,241 — —Net change of foreign currency translation adjustments . . . . . . . 13,478 3,512 (31,182) (311)Net change of unrealized gains on derivative instruments . . . . . . 4,834 (2,236) 1,069 10 Ending balance . . . . . . . . . . . . . . . . . . . . . . . . . . . . . . . . . . . . . . 27,603 55,253 (19,295) (193)
Treasury Stock:Beginning balance . . . . . . . . . . . . . . . . . . . . . . . . . . . . . . . . . . . . (7,653) (4,750) (3,219) (32)Exercise of stock options . . . . . . . . . . . . . . . . . . . . . . . . . . . . . . . 3,025 1,518 190 2 Acquisition of treasury stock . . . . . . . . . . . . . . . . . . . . . . . . . . . . — — (30,749) (307)Other, net . . . . . . . . . . . . . . . . . . . . . . . . . . . . . . . . . . . . . . . . . . (122) 13 285 3 Ending balance . . . . . . . . . . . . . . . . . . . . . . . . . . . . . . . . . . . . . . (4,750) (3,219) (33,493) (334)
Total Shareholders’ Equity:Beginning balance . . . . . . . . . . . . . . . . . . . . . . . . . . . . . . . . . . . . 727,333 953,646 1,194,234 11,920 Increase, net . . . . . . . . . . . . . . . . . . . . . . . . . . . . . . . . . . . . . . . . 226,313 240,588 73,683 735 Ending balance . . . . . . . . . . . . . . . . . . . . . . . . . . . . . . . . . . . . . . ¥ 953,646 ¥ 1,194,234 ¥ 1,267,917 $ 12,655
Summary of Comprehensive Income:Net income . . . . . . . . . . . . . . . . . . . . . . . . . . . . . . . . . . . . . . . . . ¥ 166,388 ¥ 196,506 ¥ 169,597 $ 1,693 Other comprehensive income (loss) . . . . . . . . . . . . . . . . . . . . . . . 29,476 23,409 (74,548) (744)Comprehensive income . . . . . . . . . . . . . . . . . . . . . . . . . . . . . . . . ¥ 195,864 ¥ 219,915 ¥ 95,049 $ 949
The accompanying notes to consolidated financial statements are an integral part of these balance sheets.
108
ORIX Corporation — Annual Report 2008
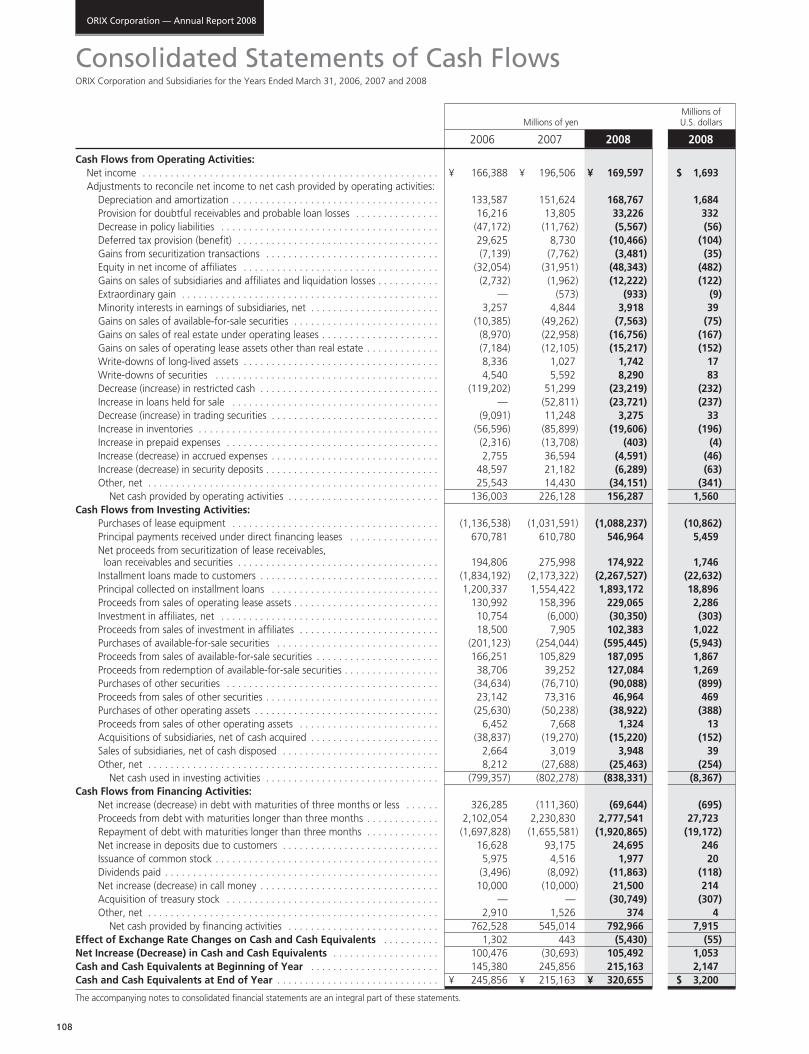
Consolidated Statements of Cash FlowsORIX Corporation and Subsidiaries for the Years Ended March 31, 2006, 2007 and 2008
Millions of Millions of yen U.S. dollars
2006 2007 2008 2008
Cash Flows from Operating Activities:Net income . . . . . . . . . . . . . . . . . . . . . . . . . . . . . . . . . . . . . . . . . . . . . . . . . . . . . ¥ 166,388 ¥ 196,506 ¥ 169,597 $ 1,693 Adjustments to reconcile net income to net cash provided by operating activities:
Depreciation and amortization . . . . . . . . . . . . . . . . . . . . . . . . . . . . . . . . . . . . . 133,587 151,624 168,767 1,684 Provision for doubtful receivables and probable loan losses . . . . . . . . . . . . . . . 16,216 13,805 33,226 332 Decrease in policy liabilities . . . . . . . . . . . . . . . . . . . . . . . . . . . . . . . . . . . . . . . (47,172) (11,762) (5,567) (56)Deferred tax provision (benefit) . . . . . . . . . . . . . . . . . . . . . . . . . . . . . . . . . . . . 29,625 8,730 (10,466) (104)Gains from securitization transactions . . . . . . . . . . . . . . . . . . . . . . . . . . . . . . . (7,139) (7,762) (3,481) (35)Equity in net income of affiliates . . . . . . . . . . . . . . . . . . . . . . . . . . . . . . . . . . . (32,054) (31,951) (48,343) (482)Gains on sales of subsidiaries and affiliates and liquidation losses . . . . . . . . . . . (2,732) (1,962) (12,222) (122)Extraordinary gain . . . . . . . . . . . . . . . . . . . . . . . . . . . . . . . . . . . . . . . . . . . . . . — (573) (933) (9)Minority interests in earnings of subsidiaries, net . . . . . . . . . . . . . . . . . . . . . . . 3,257 4,844 3,918 39 Gains on sales of available-for-sale securities . . . . . . . . . . . . . . . . . . . . . . . . . . (10,385) (49,262) (7,563) (75)Gains on sales of real estate under operating leases . . . . . . . . . . . . . . . . . . . . . (8,970) (22,958) (16,756) (167)Gains on sales of operating lease assets other than real estate . . . . . . . . . . . . . (7,184) (12,105) (15,217) (152)Write-downs of long-lived assets . . . . . . . . . . . . . . . . . . . . . . . . . . . . . . . . . . . 8,336 1,027 1,742 17 Write-downs of securities . . . . . . . . . . . . . . . . . . . . . . . . . . . . . . . . . . . . . . . . 4,540 5,592 8,290 83 Decrease (increase) in restricted cash . . . . . . . . . . . . . . . . . . . . . . . . . . . . . . . . (119,202) 51,299 (23,219) (232)Increase in loans held for sale . . . . . . . . . . . . . . . . . . . . . . . . . . . . . . . . . . . . . — (52,811) (23,721) (237)Decrease (increase) in trading securities . . . . . . . . . . . . . . . . . . . . . . . . . . . . . . (9,091) 11,248 3,275 33 Increase in inventories . . . . . . . . . . . . . . . . . . . . . . . . . . . . . . . . . . . . . . . . . . . (56,596) (85,899) (19,606) (196)Increase in prepaid expenses . . . . . . . . . . . . . . . . . . . . . . . . . . . . . . . . . . . . . . (2,316) (13,708) (403) (4)Increase (decrease) in accrued expenses . . . . . . . . . . . . . . . . . . . . . . . . . . . . . . 2,755 36,594 (4,591) (46)Increase (decrease) in security deposits . . . . . . . . . . . . . . . . . . . . . . . . . . . . . . . 48,597 21,182 (6,289) (63)Other, net . . . . . . . . . . . . . . . . . . . . . . . . . . . . . . . . . . . . . . . . . . . . . . . . . . . . 25,543 14,430 (34,151) (341)
Net cash provided by operating activities . . . . . . . . . . . . . . . . . . . . . . . . . . . 136,003 226,128 156,287 1,560 Cash Flows from Investing Activities:
Purchases of lease equipment . . . . . . . . . . . . . . . . . . . . . . . . . . . . . . . . . . . . . (1,136,538) (1,031,591) (1,088,237) (10,862)Principal payments received under direct financing leases . . . . . . . . . . . . . . . . 670,781 610,780 546,964 5,459 Net proceeds from securitization of lease receivables, loan receivables and securities . . . . . . . . . . . . . . . . . . . . . . . . . . . . . . . . . . . . 194,806 275,998 174,922 1,746
Installment loans made to customers . . . . . . . . . . . . . . . . . . . . . . . . . . . . . . . . (1,834,192) (2,173,322) (2,267,527) (22,632)Principal collected on installment loans . . . . . . . . . . . . . . . . . . . . . . . . . . . . . . 1,200,337 1,554,422 1,893,172 18,896 Proceeds from sales of operating lease assets . . . . . . . . . . . . . . . . . . . . . . . . . . 130,992 158,396 229,065 2,286 Investment in affiliates, net . . . . . . . . . . . . . . . . . . . . . . . . . . . . . . . . . . . . . . . 10,754 (6,000) (30,350) (303)Proceeds from sales of investment in affiliates . . . . . . . . . . . . . . . . . . . . . . . . . 18,500 7,905 102,383 1,022 Purchases of available-for-sale securities . . . . . . . . . . . . . . . . . . . . . . . . . . . . . (201,123) (254,044) (595,445) (5,943)Proceeds from sales of available-for-sale securities . . . . . . . . . . . . . . . . . . . . . . 166,251 105,829 187,095 1,867 Proceeds from redemption of available-for-sale securities . . . . . . . . . . . . . . . . . 38,706 39,252 127,084 1,269 Purchases of other securities . . . . . . . . . . . . . . . . . . . . . . . . . . . . . . . . . . . . . . (34,634) (76,710) (90,088) (899)Proceeds from sales of other securities . . . . . . . . . . . . . . . . . . . . . . . . . . . . . . . 23,142 73,316 46,964 469 Purchases of other operating assets . . . . . . . . . . . . . . . . . . . . . . . . . . . . . . . . . (25,630) (50,238) (38,922) (388)Proceeds from sales of other operating assets . . . . . . . . . . . . . . . . . . . . . . . . . 6,452 7,668 1,324 13 Acquisitions of subsidiaries, net of cash acquired . . . . . . . . . . . . . . . . . . . . . . . (38,837) (19,270) (15,220) (152)Sales of subsidiaries, net of cash disposed . . . . . . . . . . . . . . . . . . . . . . . . . . . . 2,664 3,019 3,948 39 Other, net . . . . . . . . . . . . . . . . . . . . . . . . . . . . . . . . . . . . . . . . . . . . . . . . . . . . 8,212 (27,688) (25,463) (254)
Net cash used in investing activities . . . . . . . . . . . . . . . . . . . . . . . . . . . . . . . (799,357) (802,278) (838,331) (8,367)Cash Flows from Financing Activities:
Net increase (decrease) in debt with maturities of three months or less . . . . . . 326,285 (111,360) (69,644) (695)Proceeds from debt with maturities longer than three months . . . . . . . . . . . . . 2,102,054 2,230,830 2,777,541 27,723 Repayment of debt with maturities longer than three months . . . . . . . . . . . . . (1,697,828) (1,655,581) (1,920,865) (19,172)Net increase in deposits due to customers . . . . . . . . . . . . . . . . . . . . . . . . . . . . 16,628 93,175 24,695 246 Issuance of common stock . . . . . . . . . . . . . . . . . . . . . . . . . . . . . . . . . . . . . . . . 5,975 4,516 1,977 20 Dividends paid . . . . . . . . . . . . . . . . . . . . . . . . . . . . . . . . . . . . . . . . . . . . . . . . . (3,496) (8,092) (11,863) (118)Net increase (decrease) in call money . . . . . . . . . . . . . . . . . . . . . . . . . . . . . . . . 10,000 (10,000) 21,500 214 Acquisition of treasury stock . . . . . . . . . . . . . . . . . . . . . . . . . . . . . . . . . . . . . . — — (30,749) (307)Other, net . . . . . . . . . . . . . . . . . . . . . . . . . . . . . . . . . . . . . . . . . . . . . . . . . . . . 2,910 1,526 374 4
Net cash provided by financing activities . . . . . . . . . . . . . . . . . . . . . . . . . . . 762,528 545,014 792,966 7,915 Effect of Exchange Rate Changes on Cash and Cash Equivalents . . . . . . . . . . 1,302 443 (5,430) (55)Net Increase (Decrease) in Cash and Cash Equivalents . . . . . . . . . . . . . . . . . . . 100,476 (30,693) 105,492 1,053 Cash and Cash Equivalents at Beginning of Year . . . . . . . . . . . . . . . . . . . . . . . 145,380 245,856 215,163 2,147 Cash and Cash Equivalents at End of Year . . . . . . . . . . . . . . . . . . . . . . . . . . . . . ¥ 245,856 ¥ 215,163 ¥ 320,655 $ 3,200
The accompanying notes to consolidated financial statements are an integral part of these statements.
109
In preparing the accompanying consolidated financial statements, ORIX Corporation (the “Company”) and its subsidiaries have
complied with accounting principles generally accepted in the United States of America (“US GAAP”), modified for the accounting for
stock splits (see (o)). Significant accounting and reporting policies are summarized as follows:
(a) Basis of presenting financial statements
The Company and its subsidiaries in Japan maintain their books in conformity with Japanese accounting practices, which differ in
certain respects from US GAAP.
The accompanying consolidated financial statements have been prepared in conformity with US GAAP and, therefore, reflect certain
adjustments to these company’s books and records. The principal adjustments relate to accounting for direct financing leases, use of the
straight-line method of depreciation for operating lease equipment, deferral of life insurance policy acquisition cost, calculation of
insurance policy liabilities, accounting for goodwill and intangible assets resulting from business combinations, accounting for pension
plans, and a reflection of the income tax effect on such adjustments and reclassification of discontinued operations.
(b) Principles of consolidation
The consolidated financial statements include the accounts of the Company and all of its subsidiaries. Investments in affiliates, where
the Company has the ability to exercise significant influence by way of 20%-50% ownership or other means, are accounted for by using
the equity method. For certain entities where the Company holds majority voting interests but minority shareholders have substantive
participation rights to decisions that occur as part of the ordinary course of their business, the equity method is applied pursuant to
Emerging Issue Task Force (“EITF”) 96-16 (Investor’s accounting for an investee when the investor has a majority of the voting interest
but the minority shareholder or shareholders have certain approval or veto rights). In addition, the consolidated financial statements also
include variable interest entities to which the Company and its subsidiaries are primary beneficiaries pursuant to FASB Interpretation No.
46 (revised December 2003) (“FIN 46(R)”) (“Consolidation of Variable Interest Entities”). A lag period of up to three months is used on a
consistent basis when considered necessary and appropriate for recognizing the results of subsidiaries and affiliates.
All significant intercompany accounts and transactions have been eliminated in consolidation.
(c) Use of estimates
The preparation of the consolidated financial statements in conformity with generally accepted accounting principles requires
management to make estimates and assumptions that affect the reported amounts of assets and liabilities at the date of the financial
statements and the reported amounts of revenues and expenses during the reporting period. Actual results could differ from those
estimates. The Company has identified nine areas where it believes assumptions and estimates are particularly critical to the financial
statements. These are the determination and periodic reassessment of the unguaranteed residual value for direct financing leases and
operating leases (see (e)), the determination and reassessment of insurance policy liabilities and deferred policy acquisition costs (see (f)),
the determination of the allowance for doubtful receivables on direct financing leases and probable loan losses (see (g)), the
determination of impairment of long-lived assets (see (h)), the determination of impairment of investment in securities (see (i)), the
determination of the valuation allowance for deferred tax assets and the evaluation of tax positions (see (j)), assessment and
measurement of effectiveness in hedging relationship using derivative financial instruments (see (l)), the determination of benefit
obligation and net periodic pension cost (see (m)), and the determination of impairment of goodwill and intangible assets not subject to
amortization (see (w)).
(d) Foreign currencies translation
The Company and its subsidiaries maintain their accounting records in their functional currency. Transactions in foreign currencies are
recorded in the entity’s functional currency based on the prevailing exchange rates on the transaction date.
The financial statements of overseas subsidiaries and affiliates are translated into Japanese yen by applying the exchange rates in
effect at the end of each fiscal year to all assets and liabilities. Income and expenses are translated at the average rates of exchange
prevailing during the fiscal year. The currencies in which the operations of the overseas subsidiaries and affiliates are conducted are
regarded as the functional currencies of these companies. Foreign currency translation adjustments reflected in accumulated other
comprehensive income (loss) in shareholders’ equity are from the translation of foreign currency financial statements into Japanese yen.
1. Significant Accounting and Reporting Policies
ORIX Corporation — Annual Report 2008
Notes to Consolidated Financial StatementsORIX Corporation and Subsidiaries
110
(e) Recognition of revenues
Revenues are recognized when persuasive evidence of an arrangement exists, the service has been rendered or the goods have been
delivered to the customer, the transaction price is fixed or determinable and collectibility is reasonably assured.
In addition to the aforementioned general policy, the policies as specifically described hereinafter are applied for each of the major
revenue items.
Leases — The Company and its subsidiaries lease various assets to customers under direct financing or operating lease arrangements.
Classification of a lease arrangement into either a direct financing lease or an operating lease is depending upon the specific conditions
of the arrangement. Revenue recognition policies applied for direct financing leases and operating leases are specifically described in
sections following this paragraph. In providing leasing services, the Company and its subsidiaries execute supplemental services, such as
paying insurance and handling taxes on leased assets on behalf of lessees. In some cases, automobile maintenance services are also
provided to lessees. Where under terms of the lease or related maintenance agreements the Company and its subsidiaries bear the
favorable or unfavorable variability of cost, revenues and expenses are recorded on a gross basis. For those arrangements in which the
Company and its subsidiaries do not have substantial risks and rewards of ownership, but instead serve as an agent in collecting from
lessees and remitting payments to third parties, the Company and its subsidiaries record revenues net of third-party services costs.
Revenues from automobile maintenance services are taken into income over the contract period in proportion to the estimated service
costs to be incurred and are recorded in other operating revenues in the accompanying consolidated statements of income.
(1) Recognition of revenues for direct financing leases
Direct financing leases consist of full-payout leases for various equipment types, including office equipment, industrial machinery
and transportation equipment. The excess of aggregate lease rentals plus the estimated unguaranteed residual value over the cost of
the leased equipment constitutes the unearned lease income to be taken into income over the lease term. The estimated residual
values represent estimated proceeds from the disposition of equipment at the time the lease is terminated. Estimates of
unguaranteed residual values are based on current market values of used equipment and estimates of when and how much
equipment will become obsolete. Certain direct lease origination costs (“initial direct costs”) are being deferred and amortized over
the lease term as a yield adjustment. The unamortized balance of initial direct costs is reflected as a component of investment in
direct financing leases. Amortization of unearned lease income and initial direct cost is computed using the interest method.
(2) Recognition of revenues for operating leases
Revenues from operating leases are recognized on a straight-line basis over the contract terms. Operating lease assets are recorded
at cost and are depreciated over their estimated useful lives mainly on a straight-line basis. Estimated average useful lives of principal
operating lease assets classified as transportation equipment is 7 years, as measuring equipment and personal computers is 4 years,
and as real estate is 30 years. Depreciation costs are included in costs of operating leases. Gains or losses arising from dispositions of
operating lease assets, except real estate operating leases, are included in operating lease revenues. With respect to some sales of
real estate under operating leases such as commercial buildings, the Company or its subsidiaries may retain an interest in some cash
flows from the real estate in the form of property management or other participation in performance of the lease asset. Where the
Company or its subsidiaries have continuing involvement with the cash flows from such previously leased real estate disposed, the
gains or losses arising from such disposition are separately disclosed as “Gains on sales of real estate under operating leases”
whereas if the Company or its subsidiaries have no continuing involvement with the cash flows from such disposed real estate, the
gains or losses are reported as “Discontinued operations-Income from discontinued operations, net.”
Estimates of residual values are based on current market values of used equipment and estimates of when and how much
equipment will become obsolete.
Installment loans — Interest income on installment loans is recognized on an accrual basis. Certain direct loan origination costs,
offset by loan origination fees (“loan origination costs, net”), are being deferred and amortized over the contractual term of the loan as
an adjustment of the related loan’s yield using the interest method.
Interest payments received on impaired loans are recorded as interest income unless the collection of the remaining investment is
doubtful at which time payments received are recorded as reductions of principal.
Interest payments received on loans with evidence of deterioration of credit quality since origination and for which it is probable at
acquisition that collection of all contractually required payments from the debtors is unlikely are recognized on cash basis method or
recorded as reductions of principal if the timing and amount of cash flows expected to be collected are reasonably unable to be
estimated.
111
Non-accrual policy — Revenues on direct financing leases and installment loans are no longer accrued at the time when principal or
interest become past due 90 days or more, or earlier, if management believes their collectibility is doubtful. Accrued but uncollected
interest is reclassified to investment in direct financing leases or installment loans in the accompanying consolidated balance sheets and
becomes subject to the allowance for doubtful receivables and probable loan loss process. Cash repayments received on these accounts
are applied first against past due interest until qualifying for a return to accrual status and then any surpluses are taken to income.
Brokerage commissions and net gains on investment securities — Brokerage commissions and net gains on investment
securities are recorded on a trade date basis.
Real estate sales — Revenues from the sales of real estate are recognized when a contract is in place, a closing has taken place, the
buyer’s initial and continuing investment is adequate to demonstrate a commitment to pay for the property and the Company and its
subsidiaries do not have a substantial continuing involvement in the property.
(f) Insurance premiums and expenses
Premium income from life insurance policies are recognized as earned premiums when due.
Life insurance benefits are recorded as expenses when they are incurred. Policy liabilities for future policy benefits are established for
by the net level premium method, based on actuarial estimates of the amount of future policyholder benefits. The policies are
characterized as long-duration policies and mainly consist of whole life, term life, endowments, and medical insurance. Computation of
policy liabilities necessarily includes assumptions about mortality, lapse rates and future yields on related investments and other factors
applicable at the time the policies are written. The average rates of assumed investment yields are 2.0%, 2.1% and 1.5% for fiscal
2006, 2007 and 2008, respectively. A life insurance subsidiary continually evaluates the potential for changes in the estimates and
assumptions applied in determining policy liabilities, both positive and negative, and uses the results of these evaluations both to adjust
recorded liabilities and to adjust underwriting criteria and product offerings.
FASB Statement No. 60 (“Accounting and Reporting by Insurance Enterprises”) requires insurance companies to defer certain costs
associated with writing insurances, or deferred policy acquisition costs, and amortize them over the respective policy periods in
proportion to anticipated premium revenue. Deferred policy acquisition costs are the costs related to the acquisition of new and renewal
insurance policies and consist primarily of first-year commissions in excess of recurring policy maintenance costs and certain variable
costs and expenses for underwriting policies.
(g) Allowance for doubtful receivables on direct financing leases and probable loan losses
The allowance for doubtful receivables on direct financing leases and probable loan losses is maintained at a level which, in the
judgment of management, is adequate to provide for probable losses inherent in lease and loan portfolios. The allowance is increased by
provisions charged to income and is decreased by charge-offs, net of recoveries.
Developing the allowance for doubtful receivables on direct financing leases and probable loan losses is subject to numerous
estimates and judgments. In evaluating the adequacy of the allowance, management considers various factors, including the nature and
characteristics of the obligors, current economic conditions and trends, prior charge-off experience, current delinquencies and
delinquency trends, future cash flows expected to be received from the direct financing leases and loans and the value of underlying
collateral and guarantees. Generally, the valuation allowance for large balance non-homogeneous loans is individually assessed to
determine whether the loan is impaired. If the loan is deemed to be impaired, it is evaluated based on the present value of expected
future cash flows, the loan’s observable market price or the fair value of the collateral securing the loan if the loan is collateral-
dependent. The allowance for losses on smaller-balance homogeneous loans, including individual housing loans and card loans which
are not restructured, and lease receivables, is collectively evaluated, considering current economic conditions and trends, the value of
underlying collateral and guarantees, prior charge-off experience, delinquencies and non-accruals.
Receivables are charged off when, in the opinion of management, the likelihood of any future collection is believed to be minimal.
(h) Impairment of long-lived assets
The Company and its subsidiaries have followed FASB Statement No. 144 (“Accounting for the Impairment or Disposal of Long-Lived
Assets”). Under FASB Statement No. 144, long-lived assets to be held and used in operations, including tangible assets and intangible
assets being amortized, consisting primarily of real estate development projects, golf courses and other operating assets, shall be tested
for recoverability whenever events or changes in circumstances indicate that the assets might be impaired. When the undiscounted
future cash flows estimated to be generated by those assets are less than the carrying amount of those assets, the net carrying amount
of assets not recoverable is reduced to estimated fair value if lower than the carrying amount. In determining fair value, appraisals
prepared by independent third party appraisers or the Company’s own staff of qualified appraisers, based on recent transactions
involving sales of similar assets or other valuation techniques to estimate fair value are utilized.
112
( i ) Investment in securities
Trading securities are reported at fair value with unrealized gains and losses included in income.
Available-for-sale securities are reported at fair value, and unrealized gains or losses are recorded through other comprehensive
income (loss), net of applicable income taxes.
Held-to-maturity securities are recorded at amortized cost.
Other securities are recorded at cost and under equity method.
Generally, the Company and its subsidiaries recognize losses related to available-for-sale equity securities for which the fair value has
been significantly below the acquisition cost (or current carrying value if an adjustment has been made in the past) for more than six
months. In addition, the Company and its subsidiaries recognize losses related to available-for-sale securities in certain other situations.
The Company and its subsidiaries charge against income losses related to available-for-sale debt securities in situations where it is
considered that the decline in the fair value of a debt security is other than temporary because there has been a significant deterioration
in a bond issuer’s credit rating, an issuer’s default or a similar event. Moreover, the Company and its subsidiaries charge against income
losses related to equity securities in situations where, even though the fair value has not remained significantly below the carrying value
for six months, the decline in the fair value of an equity security is based on issuer’s specific economic conditions and not just general
declines in the related market and where it is considered unlikely that the fair value of the equity security will recover within the next six
months. In addition, the Company and its subsidiaries reduce the carrying value of other security to the fair value and charge against
income losses related to other securities in situations where it is considered that the decline in the value of other security is other than
temporary.
( j ) Income taxes
Income taxes are accounted for under the asset and liability method. Deferred tax assets and liabilities are recognized for the future
tax consequences attributable to differences between the financial statement carrying amounts of existing assets and liabilities and their
respective tax bases and operating loss and tax credit carryforwards. Deferred tax assets and liabilities are measured using enacted tax
rates expected to apply to taxable income in the year in which those temporary differences are expected to be recovered or settled. The
effect on deferred tax assets and liabilities of a change in tax rate is recognized in income in the period that includes the enactment
date. A valuation allowance is recognized if, based on the weight of available evidence, it is “more likely than not” that some portion or
all of the deferred tax asset will not be realized.
In fiscal 2008, the Company and its subsidiaries adopted FASB Interpretation No. 48 (“Accounting for Uncertainty in Income Taxes —
an interpretation of FASB Statement No. 109”) (see (ae)). According to the interpretation, the Company and its subsidiaries recognize
the financial statement effects of a tax position taken or expected to be taken in a tax return when it is more likely than not, based on
the technical merits, that the position will be sustained upon tax examination, including resolution of any related appeals or litigation
processes, and measure the tax position that meets the recognition threshold at the largest amount of tax benefit that is greater than
50% likely of being realized upon settlement with the taxing authority. The Company and its subsidiaries classify penalties and interest
expense related to income taxes as part of provision for income taxes in the consolidated statements of income.
(k) Securitized assets
The Company and its subsidiaries have securitized and sold to investors certain lease receivables, loan receivables and investment in
securities. In the securitization process, the assets to be securitized (“the assets”) are sold to trusts and special-purpose entities that issue
asset-backed beneficial interests and securities to the investors. The Company and its subsidiaries account for the sale when control over
the assets is surrendered. When the Company and its subsidiaries sell the assets in a securitization transaction, the carrying value of the
assets is allocated to the portion sold and the portion that continues to be held, based on relative fair values. The Company and its
subsidiaries recognize gains or losses for the difference between the net proceeds received and the allocated carrying value of the assets
sold. Any gain or loss from a securitization transaction is recorded as revenue of direct financing leases, interest on loans and investment
securities, or brokerage commissions and net gains on investment securities.
Interests that continue to be held include senior interests, subordinated interests and cash collateral account. Interests that continue
to be held are initially recorded at allocated carrying value of the assets based on their fair value and are periodically reviewed for
impairment. When a decline in fair value below the carrying value of interests that continue to be held is other than temporary, the
Company and its subsidiaries consider the value of the interests that continue to be held to be impaired and record a write-down of the
interests that continue to be held to fair value.
Fair values of interests that continue to be held are estimated by determining the present value of future expected cash flows based
on management’s estimates of key assumptions, including expected credit loss rate, discount rate and prepayment rate.
113
( l ) Derivative financial instruments
The Company and its subsidiaries apply FASB Statement No. 133 (“Accounting for Derivative Instruments and Hedging Activities”)
and all derivatives held by the Company and its subsidiaries are recognized on the balance sheet at fair value. The accounting treatment
of subsequent changes in their fair value depends on their use, and whether they qualify as effective “hedges” for accounting purposes.
Derivatives that are not hedges must be adjusted to fair value through the income statement. If a derivative is a hedge, then depending
on its nature, changes in its fair value will be either offset against change in the fair value of hedged assets or liabilities through the
income statement, or recorded in other comprehensive income (loss).
If a derivative is held as a hedge of the variability of fair value related to a recognized asset or liability or an unrecognized firm
commitment (“fair value” hedge), changes in the fair value of the derivative are recorded in earnings along with the changes in the fair
value of the hedged item.
If a derivative is held as a hedge of the variability of cash flows related to a forecasted transaction, a recognized asset or liability (“cash
flow” hedge), changes in the fair value of the derivative are recorded in accumulated other comprehensive income (loss) to the extent that
the derivative is effective as a hedge, until earnings are affected by the variability in cash flows of the designated hedged item.
If a derivative is held as a hedge of a foreign-currency fair-value or cash-flow hedge (“foreign currency” hedge), changes in the fair
value of the derivative are recorded in either earnings or accumulated other comprehensive income (loss), depending on whether the
hedged transaction is a fair-value hedge or a cash-flow hedge. However, if a derivative is used as a hedge of a net investment in a
foreign operation, changes in its fair value, to the extent effective as a hedge, are recorded in the foreign currency translation
adjustments account within accumulated other comprehensive income (loss).
Changes in the fair value of a derivative, which is not held as a hedge, such as those held for trading use, or the ineffective portion of
the change in fair value of a derivative that qualifies as a hedge, are recorded in earnings.
For all hedging relationships, at inception the Company and its subsidiaries formally document the details of the hedging relationship
and hedged activity. The Company and its subsidiaries also formally assess, both at the hedge’s inception and on an ongoing basis, the
effectiveness of the hedge relationship. The Company and its subsidiaries cease hedge accounting prospectively when the derivative no
longer qualifies for hedge accounting.
(m) Pension plans
The Company and certain subsidiaries have contributory and non-contributory funded pension plans covering substantially all of their
employees. The Company and its subsidiaries apply FASB Statement No. 87 (“Employers’ Accounting for Pensions”), and the costs of
pension plans are accrued based on amounts determined using actuarial methods under the assumptions of discount rate, rate of
increase in compensation level, expected long-term rate of return on plan assets and others.
The Company and its subsidiaries also apply the recognition and disclosure provisions of FASB Statement No. 158 (“Employers’
Accounting for Defined Benefits Pension and Other Postretirement Plans - an amendment of FASB Statements No. 87, 88, 106 and
132(R)”), and recognize the funded status of pension plans, measured as the difference between the fair value of plan assets and the
benefit obligation, on the consolidated balance sheet. Changes in that funded status are recognized in the year in which the changes
occur through other comprehensive income (loss), net of applicable income taxes.
(n) Stock-based compensation
The Company and its subsidiaries apply FASB Statement No. 123 (revised 2004) (FASB Statement 123(R)) (“Share-Based Payment”).
FASB Statement 123(R) superseded APB Opinion No. 25 (“Accounting for Stock Issued to Employees”) and replaced FASB Statement No.
123 (“Accounting for Stock-Based Compensation”), and requires, with limited exception, that the cost of employee services received in
exchange for an award of equity instruments be measured based on the grant-date fair value. The costs are recognized over the
requisite employee service period.
(o) Stock splits
Stock splits implemented prior to October 1, 2001 had been accounted for by transferring an amount equivalent to the par value of
the shares from additional paid-in capital to common stock as required by the Japanese Commercial Code (the “Code”) before
amendment. However, no such reclassification was made for stock splits when common stock already included a portion of the
proceeds from shares issued at a price in excess of par value. This method of accounting was in conformity with accounting principles
generally accepted in Japan.
As a result of a revision to the Code before amendment effective on October 1, 2001 and Company Law implemented on May 1,
2006, the above-mentioned method of accounting required by the Code has become unnecessary.
In the United States, stock splits in comparable circumstances are considered to be stock dividends and are accounted for by
transferring from retained earnings to common stock and additional paid-in capital amounts equal to the fair market value of the shares
114
issued. Common stock is increased by the par value of the shares and additional paid-in capital is increased by the excess of the market
value over par value of the shares issued. Had such stock splits made prior to October 1, 2001 been accounted for in this manner,
additional paid-in capital as of March 31, 2008 would have increased by approximately ¥24,674 million ($246 million), with a
corresponding decrease in retained earnings. Total shareholders’ equity would remain unchanged. A stock split on May 19, 2000 was
excluded from the above amounts because the stock split was not considered to be a stock dividend under accounting principles
generally accepted in the United States of America.
(p) Cash and cash equivalents
Cash and cash equivalents include cash on hand, deposits placed with banks and short-term highly liquid investments with original
maturities of three months or less.
(q) Restricted cash
Restricted cash consists of cash held in trusts for the segregation of assets under an investor protection fund, deposits related to
servicing agreements and deposits collected on behalf of the customers and applied to non-recourse loans.
(r) Other operating assets
Other operating assets consist primarily of operating facilities (including golf courses, hotels and training facilities), which are stated at
cost less accumulated depreciation, and depreciation is calculated mainly on the straight-line basis over the estimated useful lives of the
assets. Accumulated depreciation was ¥16,035 million and ¥17,838 million ($178 million) as of March 31, 2007 and 2008, respectively.
Estimated useful lives range up to 50 years for buildings, up to 56 years for land improvement and up to 20 years for others.
(s) Other receivables
Other receivables include primarily payments made on behalf of lessees for property tax, maintenance fees and insurance premiums in
relation to direct financing lease contracts, accounts receivables in relation to sales of assets to be leased, residential condominiums and
other assets, and accrued assets of sold receivables.
(t) Inventories
Inventories consist primarily of advance and/or progress payments for development of residential condominiums for sale and
completed residential condominiums (including completed residential condominiums waiting to be delivered to buyers under the
contracts for sale). Advance and/or progress payments for development of residential condominiums for sale are carried at cost less any
impairment losses and finished goods (including completed residential condominiums) are stated at the lower of cost or market. As of
March 31, 2007 and 2008, advance and/or progress payments were ¥200,840 million and ¥210,312 million ($2,099 million),
respectively, and finished goods were ¥15,310 million and ¥22,538 million ($225 million), respectively.
A certain subsidiary recorded ¥5,222 million ($52 million) of write-downs principally for advance and/or progress payments for
development of residential condominiums for sale, resulting from an increase in development costs. These write-downs were recorded in
costs of real estate sales and included in the Real Estate segment.
(u) Office facilities
Office facilities are stated at cost less accumulated depreciation. Depreciation is calculated on a declining-balance basis or straight-line
basis over the estimated useful lives of the assets. Accumulated depreciation was ¥34,724 million and ¥35,857 million ($358 million) as
of March 31, 2007 and 2008, respectively. Estimated useful lives range up to 62 years for buildings and fixtures and up to 20 years for
machinery and equipment.
(v) Other assets
Other assets consist primarily of the excess of purchase prices over the net assets acquired in acquisitions (goodwill) and other
intangible assets (see (w)), deferred insurance policy acquisition costs which are amortized over the contract periods, leasehold deposits
and advance payments made in relation to purchases of assets to be leased and to construction of real estate under operating lease.
(w) Goodwill and other intangible assets
The Company and its subsidiaries have followed FASB Statement No. 141 (“Business Combinations”) and FASB Statement No. 142
(“Goodwill and Other Intangible Assets”). FASB Statement No. 141 requires that all business combinations be accounted for using the
purchase method. Accounting for business combinations using the pooling of interests method is no longer allowed. FASB Statement
115
No. 141 also requires that intangible assets acquired in a business combination be recognized apart from goodwill if the intangible
assets meet one of two criteria — either the contractual-legal criterion or the separability criterion.
FASB Statement No. 142 establishes how intangible assets (other than those acquired in a business combination) should be accounted
for upon acquisition. It also addresses how goodwill and other intangible assets should be accounted for subsequent to their acquisition.
Both goodwill and intangible assets that have indefinite useful lives are no longer amortized but tested at least annually for impairment.
The Company and its subsidiaries test the goodwill either at the operating segment level or one level below the operating segments.
Intangible assets with finite lives are amortized over their useful lives and tested for impairment in accordance with FASB Statement No.
144 (“Accounting for the Impairment or Disposal of Long-Lived Assets”).
(x) Trade notes, accounts payable and other liabilities
Trade notes, accounts payable and other liabilities include derivative payables and guarantee liabilities.
(y) Capitalization of interest costs
The Company and its subsidiaries capitalized interest costs of ¥69 million, ¥636 million and ¥2,345 million ($23 million) in fiscal 2006,
2007 and 2008, respectively, related to specific long-term development projects.
(z) Advertising
The costs of advertising are expensed as incurred. The total amounts charged to advertising expense in fiscal 2006, 2007 and 2008
are ¥12,465 million, ¥13,664 million and ¥14,004 million ($140 million), respectively.
(aa) Discontinued operations
The Company and its subsidiaries have followed FASB Statement No.144 (“Accounting for the Impairment or Disposal of Long-Lived
Assets”). Under FASB Statement No.144, the scope of discontinued operations includes the operating results of any component of an
entity with its own identifiable operations and cash flow and in which operations the Company and its subsidiaries will not have
significant continuing involvement. Included in reported discontinued operations are the operating results of operations for the
subsidiaries, the business units, and certain properties sold or to be disposed of by sale without significant continuing involvements,
which results of operations for the presented periods were reclassified in the accompanying consolidated statements of income.
(ab) Financial statements presentation in U.S. dollars
The translations of the Japanese yen amounts into U.S. dollars are included solely for the convenience of the readers, using the
prevailing exchange rate at March 31, 2008, which was ¥100.19 to $1.00. The convenience translations should not be construed as
representations that the Japanese yen amounts have been, could have been, or could in the future be, converted into U.S. dollars at this
or any other rate of exchange.
(ac) Earnings per share
Basic earnings per share is computed by dividing income from continuing operations and net income by the weighted average
number of shares of common stock outstanding in each period and diluted earnings per share reflects the potential dilution that could
occur if securities or other contracts to issue common stock were exercised or converted into common stock. Earnings per share is
adjusted for any stock splits and stock dividends retroactively.
Furthermore, the Company and its subsidiaries apply EITF Issue No. 04-8 (“The Effect of Contingently Convertible Instruments on
Diluted Earnings per Share”) to Liquid Yield Option NotesTM.
(ad) Issuance of stock by a subsidiary or an affiliate
When a subsidiary or an affiliate issues stocks to unrelated third parties, the Company and its subsidiaries’ ownership interest in the
subsidiary or the affiliate decreases. In the event that the price per share is more or less than the Company and its subsidiaries’ average
carrying amount per share, the Company and its subsidiaries adjust the carrying amount of its investment in the subsidiary and the
affiliate and recognizes gain or loss included in the consolidated statements of income in the year in which the change in ownership
interest occurs.
(ae) New accounting pronouncements
In February 2006, FASB Statement No. 155 (“Accounting for Certain Hybrid Financial Instruments — an amendment of FASB Statements
No. 133 and 140”) was issued. This Statement resolves issues addressed in Statement 133 Implementation Issue No. D1 (“Application of
116
Statement 133 to Beneficial Interests in Securitized Financial Assets”), and amends FASB Statement No. 140 (“Accounting for Transfers and
Servicing of Financial Assets and Extinguishments of Liabilities — a replacement of FASB Statement No. 125”). This Statement is effective for
all financial instruments acquired or issued after the beginning of fiscal years that begin after September 15, 2006. Adoption of this Statement
did not have a significant effect on the Company and its subsidiaries’ results of operations or financial position.
In March 2006, FASB Statement No. 156 (“Accounting for Servicing of Financial Assets — an amendment of FASB Statement No. 140”)
was issued. This Statement addresses recognition and measurement of separately recognized servicing assets and liabilities, and amends FASB
Statement No. 140. This Statement is effective for fiscal years beginning after September 15, 2006. Adoption of this Statement did not have a
significant effect on the Company and its subsidiaries’ results of operations or financial position.
In June 2006, FASB Interpretation No. 48 (“Accounting for Uncertainty in Income Taxes — an interpretation of FASB Statements No. 109”)
was issued. This interpretation clarifies the accounting for uncertainty in income taxes recognized in the financial statements by prescribing a
recognition threshold and measurement attribute for financial statement recognition and measurement of a tax position taken or expected to
be taken in a tax return. This Statement is effective for fiscal years beginning after December 15, 2006. Adoption of this Statement did not
have a significant effect on the Company and its subsidiaries’ results of operations or financial position.
In September 2006, FASB Statement No. 157 (“Fair Value Measurements”) was issued. This Statement defines fair value, establishes a
framework for measuring fair value and expands disclosures about fair value measurements. This Statement is effective for fiscal years
beginning after November 15, 2007. Adoption of this Statement will not have a significant effect on the Company and its subsidiaries’ results
of operations or financial position.
In February 2007, FASB Statement No. 159 (“The Fair Value Option for Financial Assets and Financial Liabilities — Including an amendment
of FASB Statement No. 115”) was issued. This Statement permits entities to choose to measure many financial instruments and certain other
items at fair value and amends FASB Statement No. 115 (“Accounting for Certain Investments in Debt and Equity Securities”). This Statement
is effective for fiscal years beginning after November 15, 2007. The Company and its subsidiaries are currently evaluating the effect that the
adoption of this Statement will have on the Company and its subsidiaries’ results of operations or financial position.
In December 2007, FASB Statement No. 141 (revised 2007) (“Business Combinations”) was issued. This Statement requires the acquiring
entity in a business combination to recognize the full fair value of assets acquired, liabilities assumed and noncontrolling interest in the
transaction at the acquisition date (whether a full or partial acquisition); requires expensing of acquisition-related transaction and restructuring
costs; and requires the acquirer to disclose to investors and other users all of the information needed to evaluate and understand the nature
and financial effect of the business combination. This Statement applies prospectively to business combinations for which the acquisition date
is on or after the beginning of the fiscal years beginning on or after December 15, 2008. Generally, the effect on the Company and its
subsidiaries’ results of operations or financial position on this Statement will depend on future acquisitions.
In December 2007, FASB Statement No. 160 (“Noncontrolling Interests in Consolidated Financial Statements — an amendment of ARB No.
51”) was issued. This Statement requires noncontrolling interests in subsidiaries to be classified as a separate component of equity. Under this
Statement, increases and decreases in the parent’s ownership interest that leave control intact are accounted for as equity transactions. On
the other hand, in a transaction that results in the loss of control, the gain or loss recognized in income includes the realized gain or loss
related to the portion of ownership interest sold and the gain or loss on the remeasurement to fair value of the interest retained. This
Statement is effective for fiscal years, and interim periods within those fiscal years, beginning on or after December 15, 2008. The Company
and its subsidiaries are currently evaluating the effect that the adoption of this Statement will have on the Company and its subsidiaries’
results of operations or financial position.
In March 2008, FASB Statement No. 161 (“Disclosures about Derivative Instruments and Hedging Activities — an amendment of FASB
Statement No. 133”) was issued. This Statement requires companies with derivative instruments to disclose information that should enable
financial-statement users to understand how and why a company uses derivative instruments, how derivative instruments and related hedged
items are accounted for under FASB Statement No. 133 (“Accounting for Derivative Instruments and Hedging Activities”), and how derivative
instruments and related hedged items affect a company’s financial position, financial performance, and cash flow. The required disclosures
include the fair value of derivative instruments and their gains or losses in tabular format, information about credit-risk-related contingent
features in derivative agreements, counterparty credit risk, and the company’s strategies and objective for using derivative instruments. This
Statement is effective for fiscal years and interim periods beginning after November 15, 2008. Adoption of this Statement will not have a
significant effect on the Company and its subsidiaries’ results of operations or financial position.
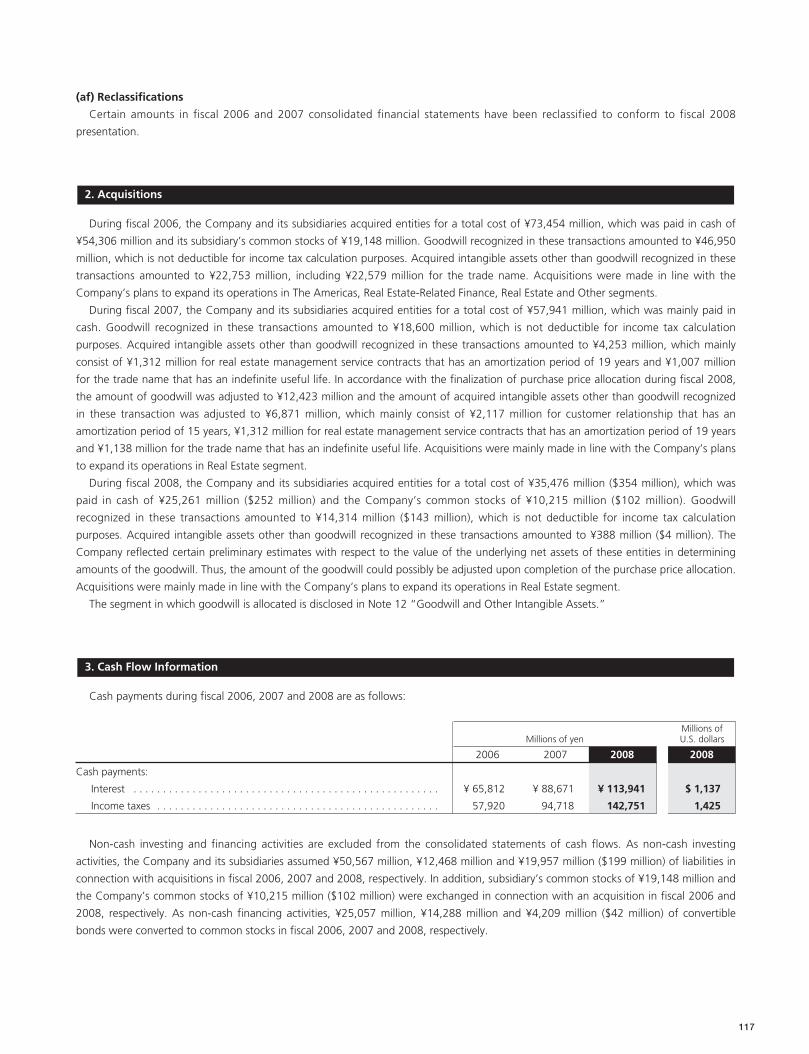
117
(af) Reclassifications
Certain amounts in fiscal 2006 and 2007 consolidated financial statements have been reclassified to conform to fiscal 2008
presentation.
During fiscal 2006, the Company and its subsidiaries acquired entities for a total cost of ¥73,454 million, which was paid in cash of
¥54,306 million and its subsidiary’s common stocks of ¥19,148 million. Goodwill recognized in these transactions amounted to ¥46,950
million, which is not deductible for income tax calculation purposes. Acquired intangible assets other than goodwill recognized in these
transactions amounted to ¥22,753 million, including ¥22,579 million for the trade name. Acquisitions were made in line with the
Company’s plans to expand its operations in The Americas, Real Estate-Related Finance, Real Estate and Other segments.
During fiscal 2007, the Company and its subsidiaries acquired entities for a total cost of ¥57,941 million, which was mainly paid in
cash. Goodwill recognized in these transactions amounted to ¥18,600 million, which is not deductible for income tax calculation
purposes. Acquired intangible assets other than goodwill recognized in these transactions amounted to ¥4,253 million, which mainly
consist of ¥1,312 million for real estate management service contracts that has an amortization period of 19 years and ¥1,007 million
for the trade name that has an indefinite useful life. In accordance with the finalization of purchase price allocation during fiscal 2008,
the amount of goodwill was adjusted to ¥12,423 million and the amount of acquired intangible assets other than goodwill recognized
in these transaction was adjusted to ¥6,871 million, which mainly consist of ¥2,117 million for customer relationship that has an
amortization period of 15 years, ¥1,312 million for real estate management service contracts that has an amortization period of 19 years
and ¥1,138 million for the trade name that has an indefinite useful life. Acquisitions were mainly made in line with the Company’s plans
to expand its operations in Real Estate segment.
During fiscal 2008, the Company and its subsidiaries acquired entities for a total cost of ¥35,476 million ($354 million), which was
paid in cash of ¥25,261 million ($252 million) and the Company’s common stocks of ¥10,215 million ($102 million). Goodwill
recognized in these transactions amounted to ¥14,314 million ($143 million), which is not deductible for income tax calculation
purposes. Acquired intangible assets other than goodwill recognized in these transactions amounted to ¥388 million ($4 million). The
Company reflected certain preliminary estimates with respect to the value of the underlying net assets of these entities in determining
amounts of the goodwill. Thus, the amount of the goodwill could possibly be adjusted upon completion of the purchase price allocation.
Acquisitions were mainly made in line with the Company’s plans to expand its operations in Real Estate segment.
The segment in which goodwill is allocated is disclosed in Note 12 “Goodwill and Other Intangible Assets.”
Cash payments during fiscal 2006, 2007 and 2008 are as follows:
Millions ofMillions of yen U.S. dollars
2006 2007 2008 2008
Cash payments:
Interest . . . . . . . . . . . . . . . . . . . . . . . . . . . . . . . . . . . . . . . . . . . . . . . . . . . . ¥ 65,812 ¥ 88,671 ¥ 113,941 $ 1,137
Income taxes . . . . . . . . . . . . . . . . . . . . . . . . . . . . . . . . . . . . . . . . . . . . . . . . 57,920 94,718 142,751 1,425
Non-cash investing and financing activities are excluded from the consolidated statements of cash flows. As non-cash investing
activities, the Company and its subsidiaries assumed ¥50,567 million, ¥12,468 million and ¥19,957 million ($199 million) of liabilities in
connection with acquisitions in fiscal 2006, 2007 and 2008, respectively. In addition, subsidiary’s common stocks of ¥19,148 million and
the Company’s common stocks of ¥10,215 million ($102 million) were exchanged in connection with an acquisition in fiscal 2006 and
2008, respectively. As non-cash financing activities, ¥25,057 million, ¥14,288 million and ¥4,209 million ($42 million) of convertible
bonds were converted to common stocks in fiscal 2006, 2007 and 2008, respectively.
3. Cash Flow Information
2. Acquisitions
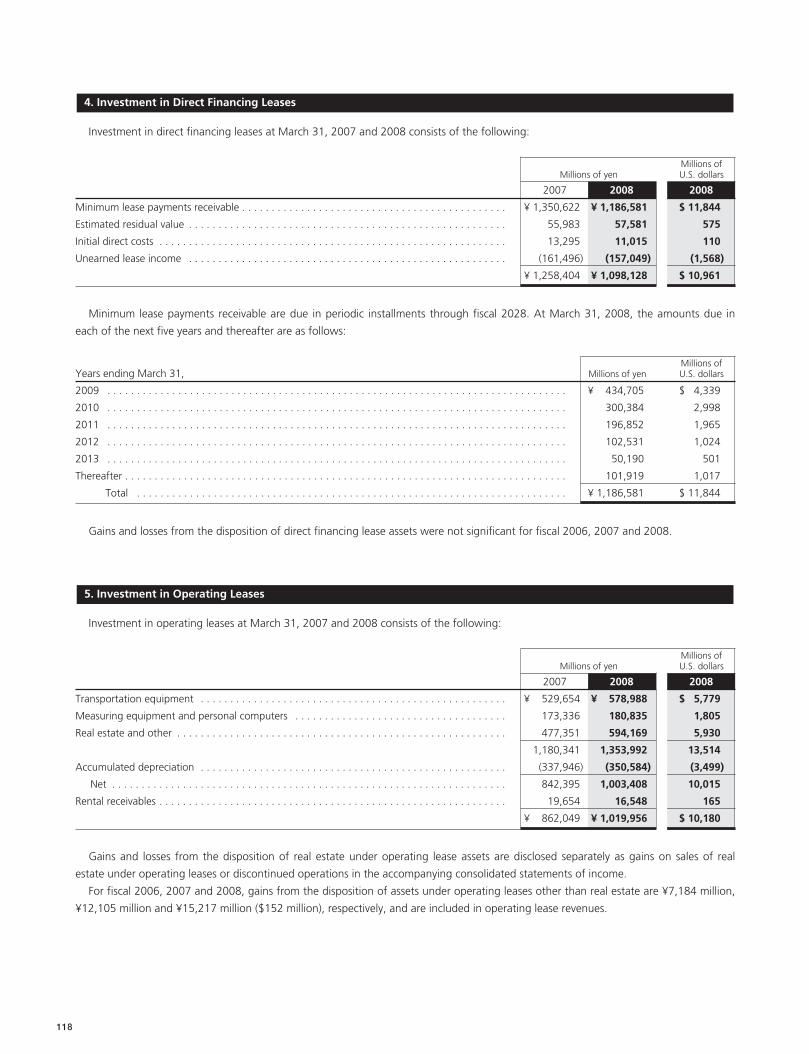
118
Investment in direct financing leases at March 31, 2007 and 2008 consists of the following:
Millions ofMillions of yen U.S. dollars
2007 2008 2008
Minimum lease payments receivable . . . . . . . . . . . . . . . . . . . . . . . . . . . . . . . . . . . . . . . . . . . . . ¥ 1,350,622 ¥ 1,186,581 $ 11,844
Estimated residual value . . . . . . . . . . . . . . . . . . . . . . . . . . . . . . . . . . . . . . . . . . . . . . . . . . . . . . 55,983 57,581 575
Initial direct costs . . . . . . . . . . . . . . . . . . . . . . . . . . . . . . . . . . . . . . . . . . . . . . . . . . . . . . . . . . . 13,295 11,015 110
Unearned lease income . . . . . . . . . . . . . . . . . . . . . . . . . . . . . . . . . . . . . . . . . . . . . . . . . . . . . . (161,496) (157,049) (1,568)
. . . . . . . . . . . . . . . . . . . . . . . . . . . . . . . . . . . . . . . . . . . . . . . . . . . . . . . . . . . . . . ¥ 1,258,404 ¥ 1,098,128 $ 10,961
Minimum lease payments receivable are due in periodic installments through fiscal 2028. At March 31, 2008, the amounts due in
each of the next five years and thereafter are as follows:
Millions ofYears ending March 31, Millions of yen U.S. dollars
2009 . . . . . . . . . . . . . . . . . . . . . . . . . . . . . . . . . . . . . . . . . . . . . . . . . . . . . . . . . . . . . . . . . . . . . . . . . . . . . . ¥ 434,705 $ 4,339
2010 . . . . . . . . . . . . . . . . . . . . . . . . . . . . . . . . . . . . . . . . . . . . . . . . . . . . . . . . . . . . . . . . . . . . . . . . . . . . . . 300,384 2,998
2011 . . . . . . . . . . . . . . . . . . . . . . . . . . . . . . . . . . . . . . . . . . . . . . . . . . . . . . . . . . . . . . . . . . . . . . . . . . . . . . 196,852 1,965
2012 . . . . . . . . . . . . . . . . . . . . . . . . . . . . . . . . . . . . . . . . . . . . . . . . . . . . . . . . . . . . . . . . . . . . . . . . . . . . . . 102,531 1,024
2013 . . . . . . . . . . . . . . . . . . . . . . . . . . . . . . . . . . . . . . . . . . . . . . . . . . . . . . . . . . . . . . . . . . . . . . . . . . . . . . 50,190 501
Thereafter . . . . . . . . . . . . . . . . . . . . . . . . . . . . . . . . . . . . . . . . . . . . . . . . . . . . . . . . . . . . . . . . . . . . . . . . . . . 101,919 1,017
Total . . . . . . . . . . . . . . . . . . . . . . . . . . . . . . . . . . . . . . . . . . . . . . . . . . . . . . . . . . . . . . . . . . . . . . . . . ¥ 1,186,581 $ 11,844
Gains and losses from the disposition of direct financing lease assets were not significant for fiscal 2006, 2007 and 2008.
Investment in operating leases at March 31, 2007 and 2008 consists of the following:
Millions ofMillions of yen U.S. dollars
2007 2008 2008
Transportation equipment . . . . . . . . . . . . . . . . . . . . . . . . . . . . . . . . . . . . . . . . . . . . . . . . . . . . ¥ 529,654 ¥ 578,988 $ 5,779
Measuring equipment and personal computers . . . . . . . . . . . . . . . . . . . . . . . . . . . . . . . . . . . . 173,336 180,835 1,805
Real estate and other . . . . . . . . . . . . . . . . . . . . . . . . . . . . . . . . . . . . . . . . . . . . . . . . . . . . . . . . 477,351 594,169 5,930
. . . . . . . . . . . . . . . . . . . . . . . . . . . . . . . . . . . . . . . . . . . . . . . . . . . . . . . . . . . . . . 1,180,341 1,353,992 13,514
Accumulated depreciation . . . . . . . . . . . . . . . . . . . . . . . . . . . . . . . . . . . . . . . . . . . . . . . . . . . . (337,946) (350,584) (3,499)
Net . . . . . . . . . . . . . . . . . . . . . . . . . . . . . . . . . . . . . . . . . . . . . . . . . . . . . . . . . . . . . . . . . . . 842,395 1,003,408 10,015
Rental receivables . . . . . . . . . . . . . . . . . . . . . . . . . . . . . . . . . . . . . . . . . . . . . . . . . . . . . . . . . . . 19,654 16,548 165
. . . . . . . . . . . . . . . . . . . . . . . . . . . . . . . . . . . . . . . . . . . . . . . . . . . . . . . . . . . . . . ¥ 862,049 ¥ 1,019,956 $ 10,180
Gains and losses from the disposition of real estate under operating lease assets are disclosed separately as gains on sales of real
estate under operating leases or discontinued operations in the accompanying consolidated statements of income.
For fiscal 2006, 2007 and 2008, gains from the disposition of assets under operating leases other than real estate are ¥7,184 million,
¥12,105 million and ¥15,217 million ($152 million), respectively, and are included in operating lease revenues.
5. Investment in Operating Leases
4. Investment in Direct Financing Leases
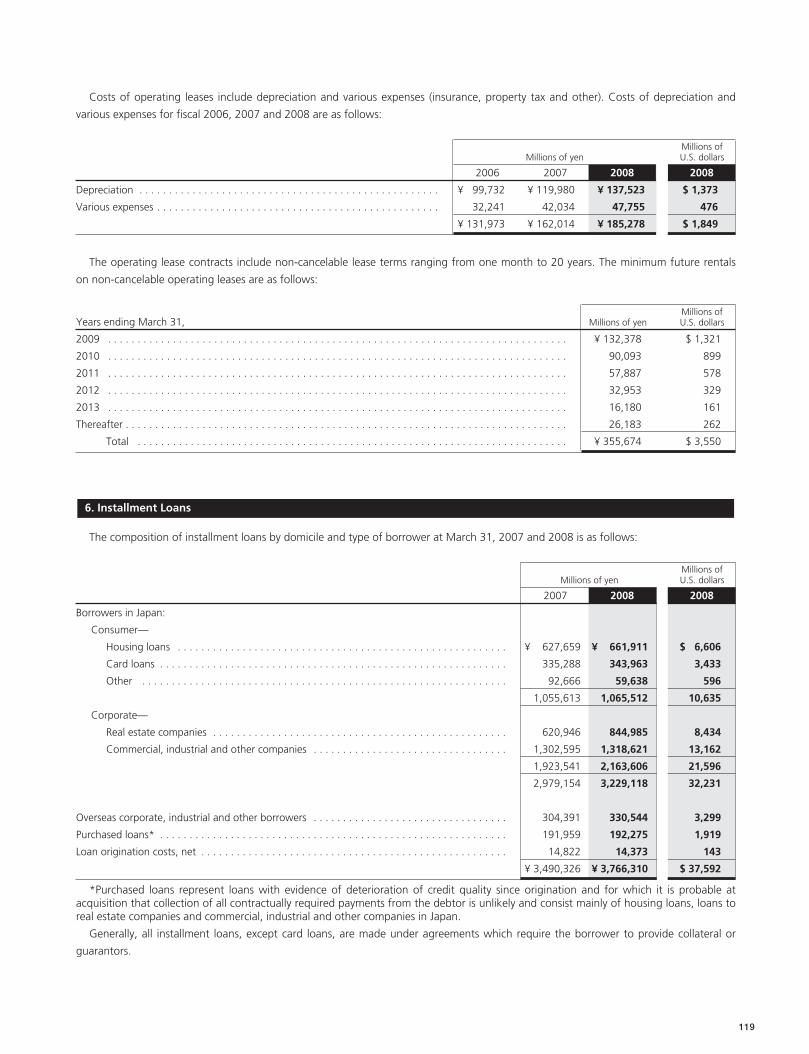
119
Costs of operating leases include depreciation and various expenses (insurance, property tax and other). Costs of depreciation and
various expenses for fiscal 2006, 2007 and 2008 are as follows:
Millions ofMillions of yen U.S. dollars
2006 2007 2008 2008
Depreciation . . . . . . . . . . . . . . . . . . . . . . . . . . . . . . . . . . . . . . . . . . . . . . . . . . . ¥ 99,732 ¥ 119,980 ¥ 137,523 $ 1,373
Various expenses . . . . . . . . . . . . . . . . . . . . . . . . . . . . . . . . . . . . . . . . . . . . . . . . 32,241 42,034 47,755 476
. . . . . . . . . . . . . . . . . . . . . . . . . . . . . . . . . . . . . . . . . . . . . . . . . . . ¥ 131,973 ¥ 162,014 ¥ 185,278 $ 1,849
The operating lease contracts include non-cancelable lease terms ranging from one month to 20 years. The minimum future rentals
on non-cancelable operating leases are as follows:
Millions ofYears ending March 31, Millions of yen U.S. dollars
2009 . . . . . . . . . . . . . . . . . . . . . . . . . . . . . . . . . . . . . . . . . . . . . . . . . . . . . . . . . . . . . . . . . . . . . . . . . . . . . . ¥ 132,378 $ 1,321
2010 . . . . . . . . . . . . . . . . . . . . . . . . . . . . . . . . . . . . . . . . . . . . . . . . . . . . . . . . . . . . . . . . . . . . . . . . . . . . . . 90,093 899
2011 . . . . . . . . . . . . . . . . . . . . . . . . . . . . . . . . . . . . . . . . . . . . . . . . . . . . . . . . . . . . . . . . . . . . . . . . . . . . . . 57,887 578
2012 . . . . . . . . . . . . . . . . . . . . . . . . . . . . . . . . . . . . . . . . . . . . . . . . . . . . . . . . . . . . . . . . . . . . . . . . . . . . . . 32,953 329
2013 . . . . . . . . . . . . . . . . . . . . . . . . . . . . . . . . . . . . . . . . . . . . . . . . . . . . . . . . . . . . . . . . . . . . . . . . . . . . . . 16,180 161
Thereafter . . . . . . . . . . . . . . . . . . . . . . . . . . . . . . . . . . . . . . . . . . . . . . . . . . . . . . . . . . . . . . . . . . . . . . . . . . . 26,183 262
Total . . . . . . . . . . . . . . . . . . . . . . . . . . . . . . . . . . . . . . . . . . . . . . . . . . . . . . . . . . . . . . . . . . . . . . . . . ¥ 355,674 $ 3,550
The composition of installment loans by domicile and type of borrower at March 31, 2007 and 2008 is as follows:
Millions ofMillions of yen U.S. dollars
2007 2008 2008
Borrowers in Japan:
Consumer—
Housing loans . . . . . . . . . . . . . . . . . . . . . . . . . . . . . . . . . . . . . . . . . . . . . . . . . . . . . . . . ¥ 627,659 ¥ 661,911 $ 6,606
Card loans . . . . . . . . . . . . . . . . . . . . . . . . . . . . . . . . . . . . . . . . . . . . . . . . . . . . . . . . . . . 335,288 343,963 3,433
Other . . . . . . . . . . . . . . . . . . . . . . . . . . . . . . . . . . . . . . . . . . . . . . . . . . . . . . . . . . . . . . 92,666 59,638 596
. . . . . . . . . . . . . . . . . . . . . . . . . . . . . . . . . . . . . . . . . . . . . . . . . . . . . . . . . . . . . . 1,055,613 1,065,512 10,635
Corporate—
Real estate companies . . . . . . . . . . . . . . . . . . . . . . . . . . . . . . . . . . . . . . . . . . . . . . . . . . 620,946 844,985 8,434
Commercial, industrial and other companies . . . . . . . . . . . . . . . . . . . . . . . . . . . . . . . . . 1,302,595 1,318,621 13,162
. . . . . . . . . . . . . . . . . . . . . . . . . . . . . . . . . . . . . . . . . . . . . . . . . . . . . . . . . . . . . . 1,923,541 2,163,606 21,596
. . . . . . . . . . . . . . . . . . . . . . . . . . . . . . . . . . . . . . . . . . . . . . . . . . . . . . . . . . . . . . 2,979,154 3,229,118 32,231
Overseas corporate, industrial and other borrowers . . . . . . . . . . . . . . . . . . . . . . . . . . . . . . . . . 304,391 330,544 3,299
Purchased loans* . . . . . . . . . . . . . . . . . . . . . . . . . . . . . . . . . . . . . . . . . . . . . . . . . . . . . . . . . . . 191,959 192,275 1,919
Loan origination costs, net . . . . . . . . . . . . . . . . . . . . . . . . . . . . . . . . . . . . . . . . . . . . . . . . . . . . 14,822 14,373 143
. . . . . . . . . . . . . . . . . . . . . . . . . . . . . . . . . . . . . . . . . . . . . . . . . . . . . . . . . . . . . . ¥ 3,490,326 ¥ 3,766,310 $ 37,592
*Purchased loans represent loans with evidence of deterioration of credit quality since origination and for which it is probable atacquisition that collection of all contractually required payments from the debtor is unlikely and consist mainly of housing loans, loans toreal estate companies and commercial, industrial and other companies in Japan.
Generally, all installment loans, except card loans, are made under agreements which require the borrower to provide collateral or
guarantors.
6. Installment Loans
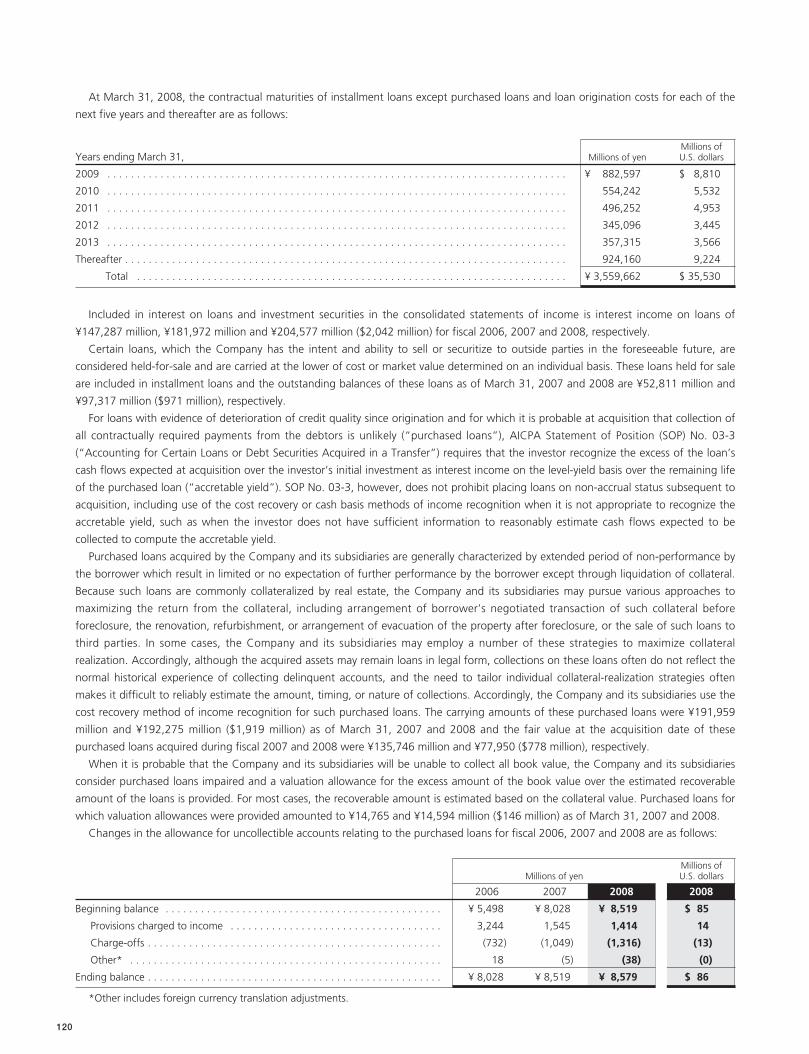
120
At March 31, 2008, the contractual maturities of installment loans except purchased loans and loan origination costs for each of the
next five years and thereafter are as follows:
Millions ofYears ending March 31, Millions of yen U.S. dollars
2009 . . . . . . . . . . . . . . . . . . . . . . . . . . . . . . . . . . . . . . . . . . . . . . . . . . . . . . . . . . . . . . . . . . . . . . . . . . . . . . ¥ 882,597 $ 8,810
2010 . . . . . . . . . . . . . . . . . . . . . . . . . . . . . . . . . . . . . . . . . . . . . . . . . . . . . . . . . . . . . . . . . . . . . . . . . . . . . . 554,242 5,532
2011 . . . . . . . . . . . . . . . . . . . . . . . . . . . . . . . . . . . . . . . . . . . . . . . . . . . . . . . . . . . . . . . . . . . . . . . . . . . . . . 496,252 4,953
2012 . . . . . . . . . . . . . . . . . . . . . . . . . . . . . . . . . . . . . . . . . . . . . . . . . . . . . . . . . . . . . . . . . . . . . . . . . . . . . . 345,096 3,445
2013 . . . . . . . . . . . . . . . . . . . . . . . . . . . . . . . . . . . . . . . . . . . . . . . . . . . . . . . . . . . . . . . . . . . . . . . . . . . . . . 357,315 3,566
Thereafter . . . . . . . . . . . . . . . . . . . . . . . . . . . . . . . . . . . . . . . . . . . . . . . . . . . . . . . . . . . . . . . . . . . . . . . . . . . 924,160 9,224
Total . . . . . . . . . . . . . . . . . . . . . . . . . . . . . . . . . . . . . . . . . . . . . . . . . . . . . . . . . . . . . . . . . . . . . . . . . ¥ 3,559,662 $ 35,530
Included in interest on loans and investment securities in the consolidated statements of income is interest income on loans of
¥147,287 million, ¥181,972 million and ¥204,577 million ($2,042 million) for fiscal 2006, 2007 and 2008, respectively.
Certain loans, which the Company has the intent and ability to sell or securitize to outside parties in the foreseeable future, are
considered held-for-sale and are carried at the lower of cost or market value determined on an individual basis. These loans held for sale
are included in installment loans and the outstanding balances of these loans as of March 31, 2007 and 2008 are ¥52,811 million and
¥97,317 million ($971 million), respectively.
For loans with evidence of deterioration of credit quality since origination and for which it is probable at acquisition that collection of
all contractually required payments from the debtors is unlikely (“purchased loans”), AICPA Statement of Position (SOP) No. 03-3
(“Accounting for Certain Loans or Debt Securities Acquired in a Transfer”) requires that the investor recognize the excess of the loan’s
cash flows expected at acquisition over the investor’s initial investment as interest income on the level-yield basis over the remaining life
of the purchased loan (“accretable yield”). SOP No. 03-3, however, does not prohibit placing loans on non-accrual status subsequent to
acquisition, including use of the cost recovery or cash basis methods of income recognition when it is not appropriate to recognize the
accretable yield, such as when the investor does not have sufficient information to reasonably estimate cash flows expected to be
collected to compute the accretable yield.
Purchased loans acquired by the Company and its subsidiaries are generally characterized by extended period of non-performance by
the borrower which result in limited or no expectation of further performance by the borrower except through liquidation of collateral.
Because such loans are commonly collateralized by real estate, the Company and its subsidiaries may pursue various approaches to
maximizing the return from the collateral, including arrangement of borrower’s negotiated transaction of such collateral before
foreclosure, the renovation, refurbishment, or arrangement of evacuation of the property after foreclosure, or the sale of such loans to
third parties. In some cases, the Company and its subsidiaries may employ a number of these strategies to maximize collateral
realization. Accordingly, although the acquired assets may remain loans in legal form, collections on these loans often do not reflect the
normal historical experience of collecting delinquent accounts, and the need to tailor individual collateral-realization strategies often
makes it difficult to reliably estimate the amount, timing, or nature of collections. Accordingly, the Company and its subsidiaries use the
cost recovery method of income recognition for such purchased loans. The carrying amounts of these purchased loans were ¥191,959
million and ¥192,275 million ($1,919 million) as of March 31, 2007 and 2008 and the fair value at the acquisition date of these
purchased loans acquired during fiscal 2007 and 2008 were ¥135,746 million and ¥77,950 ($778 million), respectively.
When it is probable that the Company and its subsidiaries will be unable to collect all book value, the Company and its subsidiaries
consider purchased loans impaired and a valuation allowance for the excess amount of the book value over the estimated recoverable
amount of the loans is provided. For most cases, the recoverable amount is estimated based on the collateral value. Purchased loans for
which valuation allowances were provided amounted to ¥14,765 and ¥14,594 million ($146 million) as of March 31, 2007 and 2008.
Changes in the allowance for uncollectible accounts relating to the purchased loans for fiscal 2006, 2007 and 2008 are as follows:
Millions ofMillions of yen U.S. dollars
2006 2007 2008 2008
Beginning balance . . . . . . . . . . . . . . . . . . . . . . . . . . . . . . . . . . . . . . . . . . . . . . . ¥ 5,498 ¥ 8,028 ¥ 8,519 $ 85
Provisions charged to income . . . . . . . . . . . . . . . . . . . . . . . . . . . . . . . . . . . . 3,244 1,545 1,414 14
Charge-offs . . . . . . . . . . . . . . . . . . . . . . . . . . . . . . . . . . . . . . . . . . . . . . . . . . (732) (1,049) (1,316) (13)
Other* . . . . . . . . . . . . . . . . . . . . . . . . . . . . . . . . . . . . . . . . . . . . . . . . . . . . . 18 (5) (38) (0)
Ending balance . . . . . . . . . . . . . . . . . . . . . . . . . . . . . . . . . . . . . . . . . . . . . . . . . . ¥ 8,028 ¥ 8,519 ¥ 8,579 $ 86
*Other includes foreign currency translation adjustments.
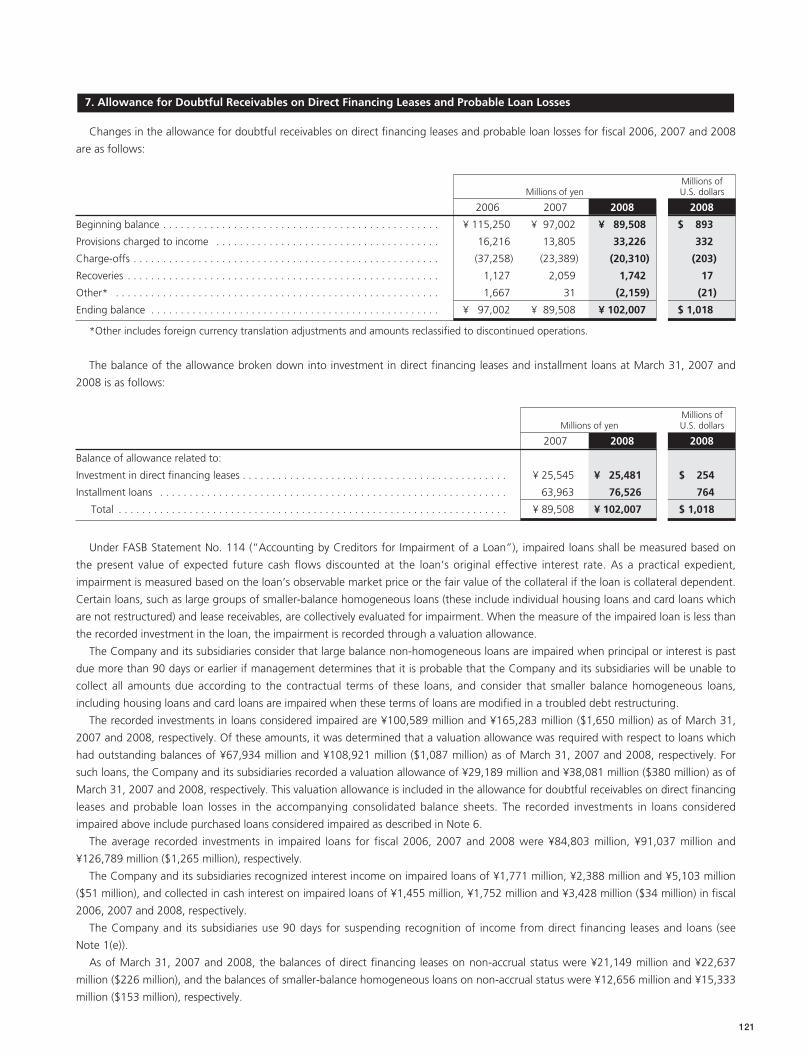
121
Changes in the allowance for doubtful receivables on direct financing leases and probable loan losses for fiscal 2006, 2007 and 2008
are as follows:
Millions ofMillions of yen U.S. dollars
2006 2007 2008 2008
Beginning balance . . . . . . . . . . . . . . . . . . . . . . . . . . . . . . . . . . . . . . . . . . . . . . . ¥ 115,250 ¥ 97,002 ¥ 89,508 $ 893
Provisions charged to income . . . . . . . . . . . . . . . . . . . . . . . . . . . . . . . . . . . . . . 16,216 13,805 33,226 332
Charge-offs . . . . . . . . . . . . . . . . . . . . . . . . . . . . . . . . . . . . . . . . . . . . . . . . . . . . (37,258) (23,389) (20,310) (203)
Recoveries . . . . . . . . . . . . . . . . . . . . . . . . . . . . . . . . . . . . . . . . . . . . . . . . . . . . . 1,127 2,059 1,742 17
Other* . . . . . . . . . . . . . . . . . . . . . . . . . . . . . . . . . . . . . . . . . . . . . . . . . . . . . . . 1,667 31 (2,159) (21)
Ending balance . . . . . . . . . . . . . . . . . . . . . . . . . . . . . . . . . . . . . . . . . . . . . . . . . ¥ 97,002 ¥ 89,508 ¥ 102,007 $ 1,018
*Other includes foreign currency translation adjustments and amounts reclassified to discontinued operations.
The balance of the allowance broken down into investment in direct financing leases and installment loans at March 31, 2007 and
2008 is as follows:
Millions ofMillions of yen U.S. dollars
2007 2008 2008
Balance of allowance related to:
Investment in direct financing leases . . . . . . . . . . . . . . . . . . . . . . . . . . . . . . . . . . . . . . . . . . . . . ¥ 25,545 ¥ 25,481 $ 254
Installment loans . . . . . . . . . . . . . . . . . . . . . . . . . . . . . . . . . . . . . . . . . . . . . . . . . . . . . . . . . . . 63,963 76,526 764
Total . . . . . . . . . . . . . . . . . . . . . . . . . . . . . . . . . . . . . . . . . . . . . . . . . . . . . . . . . . . . . . . . . . ¥ 89,508 ¥ 102,007 $ 1,018
Under FASB Statement No. 114 (“Accounting by Creditors for Impairment of a Loan”), impaired loans shall be measured based on
the present value of expected future cash flows discounted at the loan’s original effective interest rate. As a practical expedient,
impairment is measured based on the loan’s observable market price or the fair value of the collateral if the loan is collateral dependent.
Certain loans, such as large groups of smaller-balance homogeneous loans (these include individual housing loans and card loans which
are not restructured) and lease receivables, are collectively evaluated for impairment. When the measure of the impaired loan is less than
the recorded investment in the loan, the impairment is recorded through a valuation allowance.
The Company and its subsidiaries consider that large balance non-homogeneous loans are impaired when principal or interest is past
due more than 90 days or earlier if management determines that it is probable that the Company and its subsidiaries will be unable to
collect all amounts due according to the contractual terms of these loans, and consider that smaller balance homogeneous loans,
including housing loans and card loans are impaired when these terms of loans are modified in a troubled debt restructuring.
The recorded investments in loans considered impaired are ¥100,589 million and ¥165,283 million ($1,650 million) as of March 31,
2007 and 2008, respectively. Of these amounts, it was determined that a valuation allowance was required with respect to loans which
had outstanding balances of ¥67,934 million and ¥108,921 million ($1,087 million) as of March 31, 2007 and 2008, respectively. For
such loans, the Company and its subsidiaries recorded a valuation allowance of ¥29,189 million and ¥38,081 million ($380 million) as of
March 31, 2007 and 2008, respectively. This valuation allowance is included in the allowance for doubtful receivables on direct financing
leases and probable loan losses in the accompanying consolidated balance sheets. The recorded investments in loans considered
impaired above include purchased loans considered impaired as described in Note 6.
The average recorded investments in impaired loans for fiscal 2006, 2007 and 2008 were ¥84,803 million, ¥91,037 million and
¥126,789 million ($1,265 million), respectively.
The Company and its subsidiaries recognized interest income on impaired loans of ¥1,771 million, ¥2,388 million and ¥5,103 million
($51 million), and collected in cash interest on impaired loans of ¥1,455 million, ¥1,752 million and ¥3,428 million ($34 million) in fiscal
2006, 2007 and 2008, respectively.
The Company and its subsidiaries use 90 days for suspending recognition of income from direct financing leases and loans (see
Note 1(e)).
As of March 31, 2007 and 2008, the balances of direct financing leases on non-accrual status were ¥21,149 million and ¥22,637
million ($226 million), and the balances of smaller-balance homogeneous loans on non-accrual status were ¥12,656 million and ¥15,333
million ($153 million), respectively.
7. Allowance for Doubtful Receivables on Direct Financing Leases and Probable Loan Losses
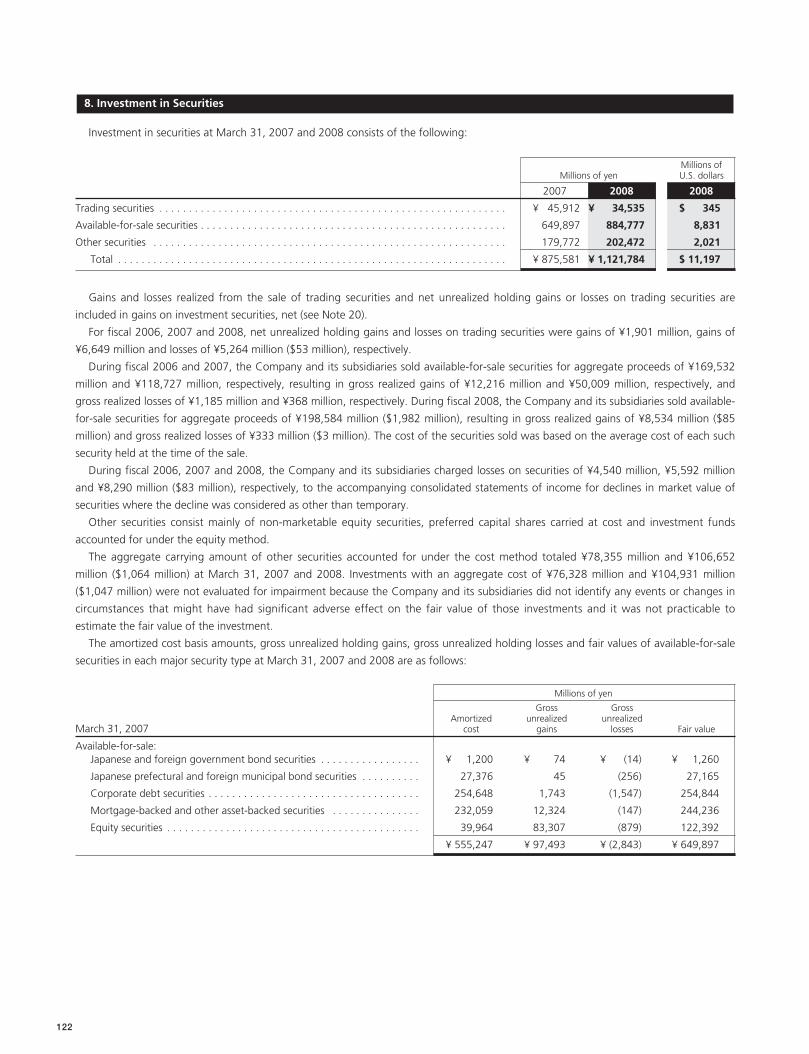
122
Investment in securities at March 31, 2007 and 2008 consists of the following:
Millions ofMillions of yen U.S. dollars
2007 2008 2008
Trading securities . . . . . . . . . . . . . . . . . . . . . . . . . . . . . . . . . . . . . . . . . . . . . . . . . . . . . . . . . . . ¥ 45,912 ¥ 34,535 $ 345
Available-for-sale securities . . . . . . . . . . . . . . . . . . . . . . . . . . . . . . . . . . . . . . . . . . . . . . . . . . . . 649,897 884,777 8,831
Other securities . . . . . . . . . . . . . . . . . . . . . . . . . . . . . . . . . . . . . . . . . . . . . . . . . . . . . . . . . . . . 179,772 202,472 2,021
Total . . . . . . . . . . . . . . . . . . . . . . . . . . . . . . . . . . . . . . . . . . . . . . . . . . . . . . . . . . . . . . . . . . ¥ 875,581 ¥ 1,121,784 $ 11,197
Gains and losses realized from the sale of trading securities and net unrealized holding gains or losses on trading securities are
included in gains on investment securities, net (see Note 20).
For fiscal 2006, 2007 and 2008, net unrealized holding gains and losses on trading securities were gains of ¥1,901 million, gains of
¥6,649 million and losses of ¥5,264 million ($53 million), respectively.
During fiscal 2006 and 2007, the Company and its subsidiaries sold available-for-sale securities for aggregate proceeds of ¥169,532
million and ¥118,727 million, respectively, resulting in gross realized gains of ¥12,216 million and ¥50,009 million, respectively, and
gross realized losses of ¥1,185 million and ¥368 million, respectively. During fiscal 2008, the Company and its subsidiaries sold available-
for-sale securities for aggregate proceeds of ¥198,584 million ($1,982 million), resulting in gross realized gains of ¥8,534 million ($85
million) and gross realized losses of ¥333 million ($3 million). The cost of the securities sold was based on the average cost of each such
security held at the time of the sale.
During fiscal 2006, 2007 and 2008, the Company and its subsidiaries charged losses on securities of ¥4,540 million, ¥5,592 million
and ¥8,290 million ($83 million), respectively, to the accompanying consolidated statements of income for declines in market value of
securities where the decline was considered as other than temporary.
Other securities consist mainly of non-marketable equity securities, preferred capital shares carried at cost and investment funds
accounted for under the equity method.
The aggregate carrying amount of other securities accounted for under the cost method totaled ¥78,355 million and ¥106,652
million ($1,064 million) at March 31, 2007 and 2008. Investments with an aggregate cost of ¥76,328 million and ¥104,931 million
($1,047 million) were not evaluated for impairment because the Company and its subsidiaries did not identify any events or changes in
circumstances that might have had significant adverse effect on the fair value of those investments and it was not practicable to
estimate the fair value of the investment.
The amortized cost basis amounts, gross unrealized holding gains, gross unrealized holding losses and fair values of available-for-sale
securities in each major security type at March 31, 2007 and 2008 are as follows:
Millions of yen
Gross GrossAmortized unrealized unrealized
March 31, 2007 cost gains losses Fair value
Available-for-sale:Japanese and foreign government bond securities . . . . . . . . . . . . . . . . . ¥ 1,200 ¥ 74 ¥ (14) ¥ 1,260
Japanese prefectural and foreign municipal bond securities . . . . . . . . . . 27,376 45 (256) 27,165
Corporate debt securities . . . . . . . . . . . . . . . . . . . . . . . . . . . . . . . . . . . . 254,648 1,743 (1,547) 254,844
Mortgage-backed and other asset-backed securities . . . . . . . . . . . . . . . 232,059 12,324 (147) 244,236
Equity securities . . . . . . . . . . . . . . . . . . . . . . . . . . . . . . . . . . . . . . . . . . . 39,964 83,307 (879) 122,392
. . . . . . . . . . . . . . . . . . . . . . . . . . . . . . . . . . . . . . . . . . . . . . . ¥ 555,247 ¥ 97,493 ¥ (2,843) ¥ 649,897
8. Investment in Securities
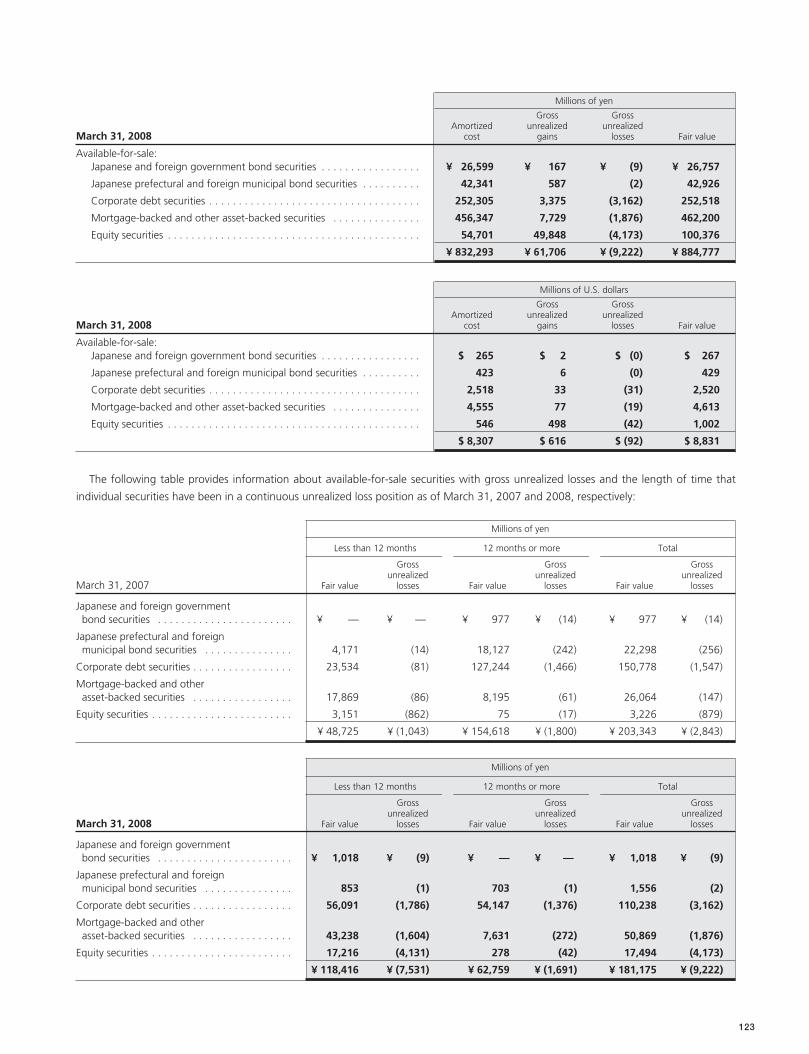
123
Millions of yen
Gross GrossAmortized unrealized unrealized
March 31, 2008 cost gains losses Fair value
Available-for-sale:Japanese and foreign government bond securities . . . . . . . . . . . . . . . . . ¥ 26,599 ¥ 167 ¥ (9) ¥ 26,757
Japanese prefectural and foreign municipal bond securities . . . . . . . . . . 42,341 587 (2) 42,926
Corporate debt securities . . . . . . . . . . . . . . . . . . . . . . . . . . . . . . . . . . . . 252,305 3,375 (3,162) 252,518
Mortgage-backed and other asset-backed securities . . . . . . . . . . . . . . . 456,347 7,729 (1,876) 462,200
Equity securities . . . . . . . . . . . . . . . . . . . . . . . . . . . . . . . . . . . . . . . . . . . 54,701 49,848 (4,173) 100,376
. . . . . . . . . . . . . . . . . . . . . . . . . . . . . . . . . . . . . . . . . . . . . . . ¥ 832,293 ¥ 61,706 ¥ (9,222) ¥ 884,777
Millions of U.S. dollars
Gross GrossAmortized unrealized unrealized
March 31, 2008 cost gains losses Fair value
Available-for-sale:Japanese and foreign government bond securities . . . . . . . . . . . . . . . . . $ 265 $ 2 $ (0) $ 267
Japanese prefectural and foreign municipal bond securities . . . . . . . . . . 423 6 (0) 429
Corporate debt securities . . . . . . . . . . . . . . . . . . . . . . . . . . . . . . . . . . . . 2,518 33 (31) 2,520
Mortgage-backed and other asset-backed securities . . . . . . . . . . . . . . . 4,555 77 (19) 4,613
Equity securities . . . . . . . . . . . . . . . . . . . . . . . . . . . . . . . . . . . . . . . . . . . 546 498 (42) 1,002
. . . . . . . . . . . . . . . . . . . . . . . . . . . . . . . . . . . . . . . . . . . . . . . $ 8,307 $ 616 $ (92) $ 8,831
The following table provides information about available-for-sale securities with gross unrealized losses and the length of time that
individual securities have been in a continuous unrealized loss position as of March 31, 2007 and 2008, respectively:
Millions of yen
Less than 12 months 12 months or more Total
Gross Gross Grossunrealized unrealized unrealized
March 31, 2007 Fair value losses Fair value losses Fair value losses
Japanese and foreign government bond securities . . . . . . . . . . . . . . . . . . . . . . . ¥ — ¥ — ¥ 977 ¥ (14) ¥ 977 ¥ (14)
Japanese prefectural and foreign municipal bond securities . . . . . . . . . . . . . . . 4,171 (14) 18,127 (242) 22,298 (256)
Corporate debt securities . . . . . . . . . . . . . . . . . 23,534 (81) 127,244 (1,466) 150,778 (1,547)
Mortgage-backed and other asset-backed securities . . . . . . . . . . . . . . . . . 17,869 (86) 8,195 (61) 26,064 (147)
Equity securities . . . . . . . . . . . . . . . . . . . . . . . . 3,151 (862) 75 (17) 3,226 (879)
. . . . . . . . . . . . . . . . . . . . . . . . . . ¥ 48,725 ¥ (1,043) ¥ 154,618 ¥ (1,800) ¥ 203,343 ¥ (2,843)
Millions of yen
Less than 12 months 12 months or more Total
Gross Gross Grossunrealized unrealized unrealized
March 31, 2008 Fair value losses Fair value losses Fair value losses
Japanese and foreign government bond securities . . . . . . . . . . . . . . . . . . . . . . . ¥ 1,018 ¥ (9) ¥ — ¥ — ¥ 1,018 ¥ (9)
Japanese prefectural and foreign municipal bond securities . . . . . . . . . . . . . . . 853 (1) 703 (1) 1,556 (2)
Corporate debt securities . . . . . . . . . . . . . . . . . 56,091 (1,786) 54,147 (1,376) 110,238 (3,162)
Mortgage-backed and other asset-backed securities . . . . . . . . . . . . . . . . . 43,238 (1,604) 7,631 (272) 50,869 (1,876)
Equity securities . . . . . . . . . . . . . . . . . . . . . . . . 17,216 (4,131) 278 (42) 17,494 (4,173)
. . . . . . . . . . . . . . . . . . . . . . . . . . ¥ 118,416 ¥ (7,531) ¥ 62,759 ¥ (1,691) ¥ 181,175 ¥ (9,222)
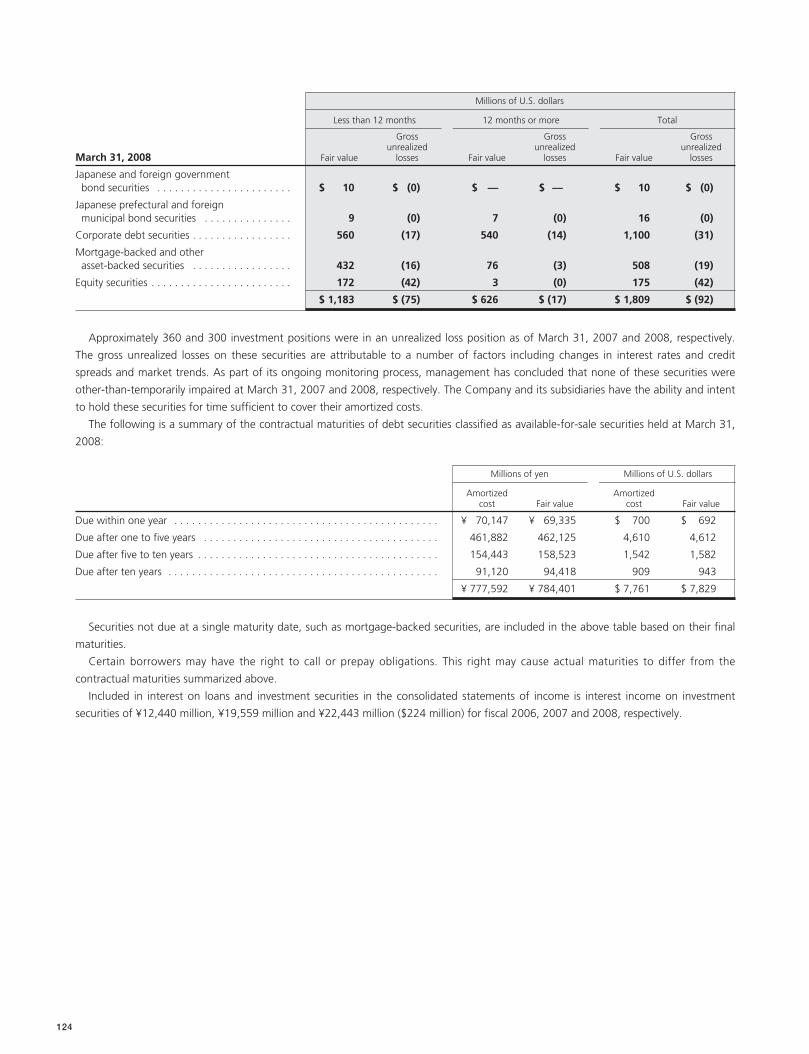
124
Millions of U.S. dollars
Less than 12 months 12 months or more Total
Gross Gross Grossunrealized unrealized unrealized
March 31, 2008 Fair value losses Fair value losses Fair value losses
Japanese and foreign government bond securities . . . . . . . . . . . . . . . . . . . . . . . $ 10 $ (0) $ — $ — $ 10 $ (0)
Japanese prefectural and foreign municipal bond securities . . . . . . . . . . . . . . . 9 (0) 7 (0) 16 (0)
Corporate debt securities . . . . . . . . . . . . . . . . . 560 (17) 540 (14) 1,100 (31)
Mortgage-backed and other asset-backed securities . . . . . . . . . . . . . . . . . 432 (16) 76 (3) 508 (19)
Equity securities . . . . . . . . . . . . . . . . . . . . . . . . 172 (42) 3 (0) 175 (42)
. . . . . . . . . . . . . . . . . . . . . . . . . . $ 1,183 $ (75) $ 626 $ (17) $ 1,809 $ (92)
Approximately 360 and 300 investment positions were in an unrealized loss position as of March 31, 2007 and 2008, respectively.
The gross unrealized losses on these securities are attributable to a number of factors including changes in interest rates and credit
spreads and market trends. As part of its ongoing monitoring process, management has concluded that none of these securities were
other-than-temporarily impaired at March 31, 2007 and 2008, respectively. The Company and its subsidiaries have the ability and intent
to hold these securities for time sufficient to cover their amortized costs.
The following is a summary of the contractual maturities of debt securities classified as available-for-sale securities held at March 31,
2008:
Millions of yen Millions of U.S. dollars
Amortized Amortizedcost Fair value cost Fair value
Due within one year . . . . . . . . . . . . . . . . . . . . . . . . . . . . . . . . . . . . . . . . . . . . . ¥ 70,147 ¥ 69,335 $ 700 $ 692
Due after one to five years . . . . . . . . . . . . . . . . . . . . . . . . . . . . . . . . . . . . . . . . 461,882 462,125 4,610 4,612
Due after five to ten years . . . . . . . . . . . . . . . . . . . . . . . . . . . . . . . . . . . . . . . . . 154,443 158,523 1,542 1,582
Due after ten years . . . . . . . . . . . . . . . . . . . . . . . . . . . . . . . . . . . . . . . . . . . . . . 91,120 94,418 909 943
. . . . . . . . . . . . . . . . . . . . . . . . . . . . . . . . . . . . . . . . . . . . . . . . . . . ¥ 777,592 ¥ 784,401 $ 7,761 $ 7,829
Securities not due at a single maturity date, such as mortgage-backed securities, are included in the above table based on their final
maturities.
Certain borrowers may have the right to call or prepay obligations. This right may cause actual maturities to differ from the
contractual maturities summarized above.
Included in interest on loans and investment securities in the consolidated statements of income is interest income on investment
securities of ¥12,440 million, ¥19,559 million and ¥22,443 million ($224 million) for fiscal 2006, 2007 and 2008, respectively.
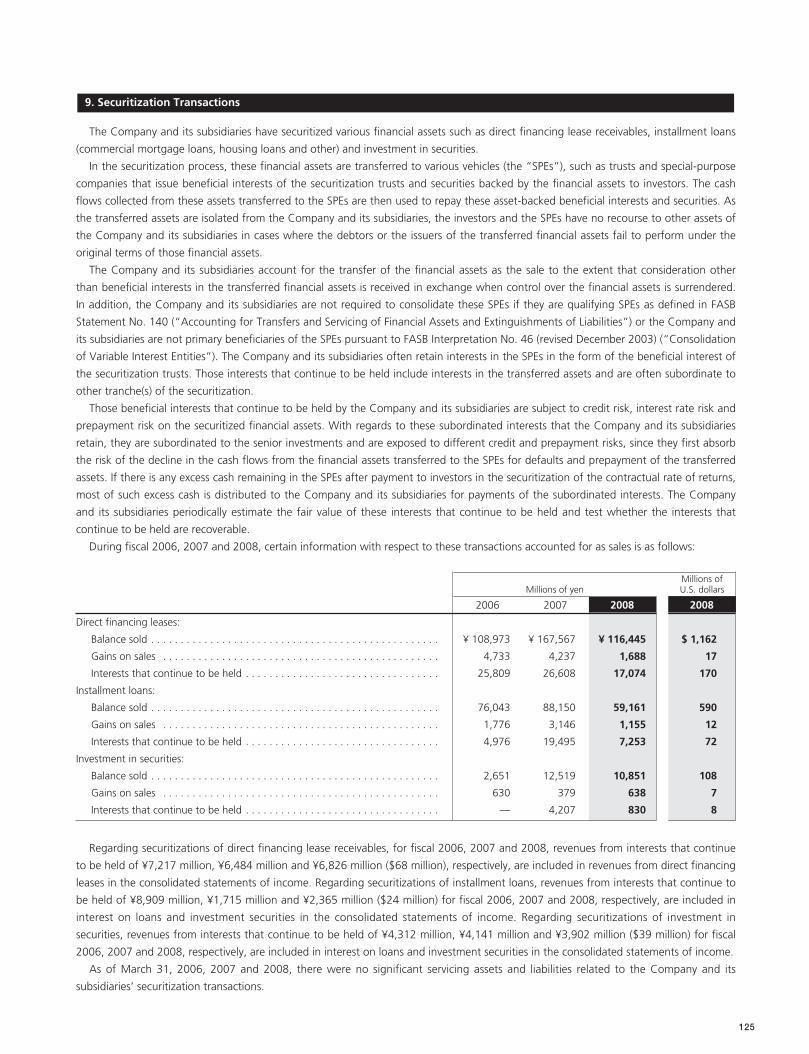
125
The Company and its subsidiaries have securitized various financial assets such as direct financing lease receivables, installment loans
(commercial mortgage loans, housing loans and other) and investment in securities.
In the securitization process, these financial assets are transferred to various vehicles (the “SPEs”), such as trusts and special-purpose
companies that issue beneficial interests of the securitization trusts and securities backed by the financial assets to investors. The cash
flows collected from these assets transferred to the SPEs are then used to repay these asset-backed beneficial interests and securities. As
the transferred assets are isolated from the Company and its subsidiaries, the investors and the SPEs have no recourse to other assets of
the Company and its subsidiaries in cases where the debtors or the issuers of the transferred financial assets fail to perform under the
original terms of those financial assets.
The Company and its subsidiaries account for the transfer of the financial assets as the sale to the extent that consideration other
than beneficial interests in the transferred financial assets is received in exchange when control over the financial assets is surrendered.
In addition, the Company and its subsidiaries are not required to consolidate these SPEs if they are qualifying SPEs as defined in FASB
Statement No. 140 (“Accounting for Transfers and Servicing of Financial Assets and Extinguishments of Liabilities”) or the Company and
its subsidiaries are not primary beneficiaries of the SPEs pursuant to FASB Interpretation No. 46 (revised December 2003) (“Consolidation
of Variable Interest Entities”). The Company and its subsidiaries often retain interests in the SPEs in the form of the beneficial interest of
the securitization trusts. Those interests that continue to be held include interests in the transferred assets and are often subordinate to
other tranche(s) of the securitization.
Those beneficial interests that continue to be held by the Company and its subsidiaries are subject to credit risk, interest rate risk and
prepayment risk on the securitized financial assets. With regards to these subordinated interests that the Company and its subsidiaries
retain, they are subordinated to the senior investments and are exposed to different credit and prepayment risks, since they first absorb
the risk of the decline in the cash flows from the financial assets transferred to the SPEs for defaults and prepayment of the transferred
assets. If there is any excess cash remaining in the SPEs after payment to investors in the securitization of the contractual rate of returns,
most of such excess cash is distributed to the Company and its subsidiaries for payments of the subordinated interests. The Company
and its subsidiaries periodically estimate the fair value of these interests that continue to be held and test whether the interests that
continue to be held are recoverable.
During fiscal 2006, 2007 and 2008, certain information with respect to these transactions accounted for as sales is as follows:
Millions ofMillions of yen U.S. dollars
2006 2007 2008 2008
Direct financing leases:
Balance sold . . . . . . . . . . . . . . . . . . . . . . . . . . . . . . . . . . . . . . . . . . . . . . . . . ¥ 108,973 ¥ 167,567 ¥ 116,445 $ 1,162
Gains on sales . . . . . . . . . . . . . . . . . . . . . . . . . . . . . . . . . . . . . . . . . . . . . . . 4,733 4,237 1,688 17
Interests that continue to be held . . . . . . . . . . . . . . . . . . . . . . . . . . . . . . . . . 25,809 26,608 17,074 170
Installment loans:
Balance sold . . . . . . . . . . . . . . . . . . . . . . . . . . . . . . . . . . . . . . . . . . . . . . . . . 76,043 88,150 59,161 590
Gains on sales . . . . . . . . . . . . . . . . . . . . . . . . . . . . . . . . . . . . . . . . . . . . . . . 1,776 3,146 1,155 12
Interests that continue to be held . . . . . . . . . . . . . . . . . . . . . . . . . . . . . . . . . 4,976 19,495 7,253 72
Investment in securities:
Balance sold . . . . . . . . . . . . . . . . . . . . . . . . . . . . . . . . . . . . . . . . . . . . . . . . . 2,651 12,519 10,851 108
Gains on sales . . . . . . . . . . . . . . . . . . . . . . . . . . . . . . . . . . . . . . . . . . . . . . . 630 379 638 7
Interests that continue to be held . . . . . . . . . . . . . . . . . . . . . . . . . . . . . . . . . — 4,207 830 8
Regarding securitizations of direct financing lease receivables, for fiscal 2006, 2007 and 2008, revenues from interests that continue
to be held of ¥7,217 million, ¥6,484 million and ¥6,826 million ($68 million), respectively, are included in revenues from direct financing
leases in the consolidated statements of income. Regarding securitizations of installment loans, revenues from interests that continue to
be held of ¥8,909 million, ¥1,715 million and ¥2,365 million ($24 million) for fiscal 2006, 2007 and 2008, respectively, are included in
interest on loans and investment securities in the consolidated statements of income. Regarding securitizations of investment in
securities, revenues from interests that continue to be held of ¥4,312 million, ¥4,141 million and ¥3,902 million ($39 million) for fiscal
2006, 2007 and 2008, respectively, are included in interest on loans and investment securities in the consolidated statements of income.
As of March 31, 2006, 2007 and 2008, there were no significant servicing assets and liabilities related to the Company and its
subsidiaries’ securitization transactions.
9. Securitization Transactions
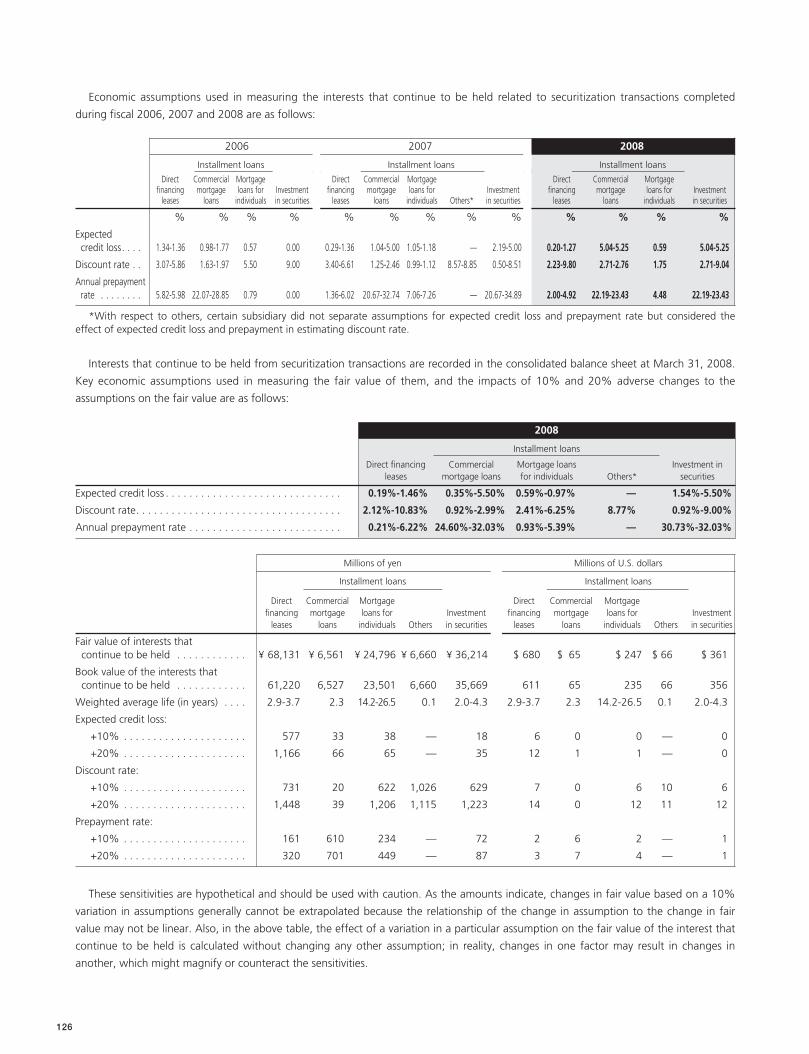
126
Economic assumptions used in measuring the interests that continue to be held related to securitization transactions completed
during fiscal 2006, 2007 and 2008 are as follows:
2006 2007 2008
Installment loans Installment loans Installment loans
Direct Commercial Mortgage Direct Commercial Mortgage Direct Commercial Mortgagefinancing mortgage loans for Investment financing mortgage loans for Investment financing mortgage loans for Investment
leases loans individuals in securities leases loans individuals Others* in securities leases loans individuals in securities
. . . . . . . . . . . % % % % % % % % % % % % %
Expected credit loss. . . . 1.34-1.36 0.98-1.77 0.57 0.00 0.29-1.36 1.04-5.00 1.05-1.18 — 2.19-5.00 0.20-1.27 5.04-5.25 0.59 5.04-5.25
Discount rate . . 3.07-5.86 1.63-1.97 5.50 9.00 3.40-6.61 1.25-2.46 0.99-1.12 8.57-8.85 0.50-8.51 2.23-9.80 2.71-2.76 1.75 2.71-9.04
Annual prepayment rate . . . . . . . . 5.82-5.98 22.07-28.85 0.79 0.00 1.36-6.02 20.67-32.74 7.06-7.26 — 20.67-34.89 2.00-4.92 22.19-23.43 4.48 22.19-23.43
*With respect to others, certain subsidiary did not separate assumptions for expected credit loss and prepayment rate but considered theeffect of expected credit loss and prepayment in estimating discount rate.
Interests that continue to be held from securitization transactions are recorded in the consolidated balance sheet at March 31, 2008.
Key economic assumptions used in measuring the fair value of them, and the impacts of 10% and 20% adverse changes to the
assumptions on the fair value are as follows:
2008
Installment loans
Direct financing Commercial Mortgage loans Investment in leases mortgage loans for individuals Others* securities
Expected credit loss . . . . . . . . . . . . . . . . . . . . . . . . . . . . . . 0.19%-1.46% 0.35%-5.50% 0.59%-0.97% — 1.54%-5.50%
Discount rate. . . . . . . . . . . . . . . . . . . . . . . . . . . . . . . . . . . 2.12%-10.83% 0.92%-2.99% 2.41%-6.25% 8.77% 0.92%-9.00%
Annual prepayment rate . . . . . . . . . . . . . . . . . . . . . . . . . . 0.21%-6.22% 24.60%-32.03% 0.93%-5.39% — 30.73%-32.03%
Millions of yen Millions of U.S. dollars
Installment loans Installment loans
Direct Commercial Mortgage Direct Commercial Mortgagefinancing mortgage loans for Investment financing mortgage loans for Investment
leases loans individuals Others in securities leases loans individuals Others in securities
Fair value of interests that continue to be held . . . . . . . . . . . . ¥ 68,131 ¥ 6,561 ¥ 24,796 ¥ 6,660 ¥ 36,214 $ 680 $ 65 $ 247 $ 66 $ 361
Book value of the interests that continue to be held . . . . . . . . . . . . 61,220 6,527 23,501 6,660 35,669 611 65 235 66 356
Weighted average life (in years) . . . . 2.9-3.7 2.3 14.2-26.5 0.1 2.0-4.3 2.9-3.7 2.3 14.2-26.5 0.1 2.0-4.3
Expected credit loss:
+10% . . . . . . . . . . . . . . . . . . . . . 577 33 38 — 18 6 0 0 — 0
+20% . . . . . . . . . . . . . . . . . . . . . 1,166 66 65 — 35 12 1 1 — 0
Discount rate:
+10% . . . . . . . . . . . . . . . . . . . . . 731 20 622 1,026 629 7 0 6 10 6
+20% . . . . . . . . . . . . . . . . . . . . . 1,448 39 1,206 1,115 1,223 14 0 12 11 12
Prepayment rate:
+10% . . . . . . . . . . . . . . . . . . . . . 161 610 234 — 72 2 6 2 — 1
+20% . . . . . . . . . . . . . . . . . . . . . 320 701 449 — 87 3 7 4 — 1
These sensitivities are hypothetical and should be used with caution. As the amounts indicate, changes in fair value based on a 10%
variation in assumptions generally cannot be extrapolated because the relationship of the change in assumption to the change in fair
value may not be linear. Also, in the above table, the effect of a variation in a particular assumption on the fair value of the interest that
continue to be held is calculated without changing any other assumption; in reality, changes in one factor may result in changes in
another, which might magnify or counteract the sensitivities.
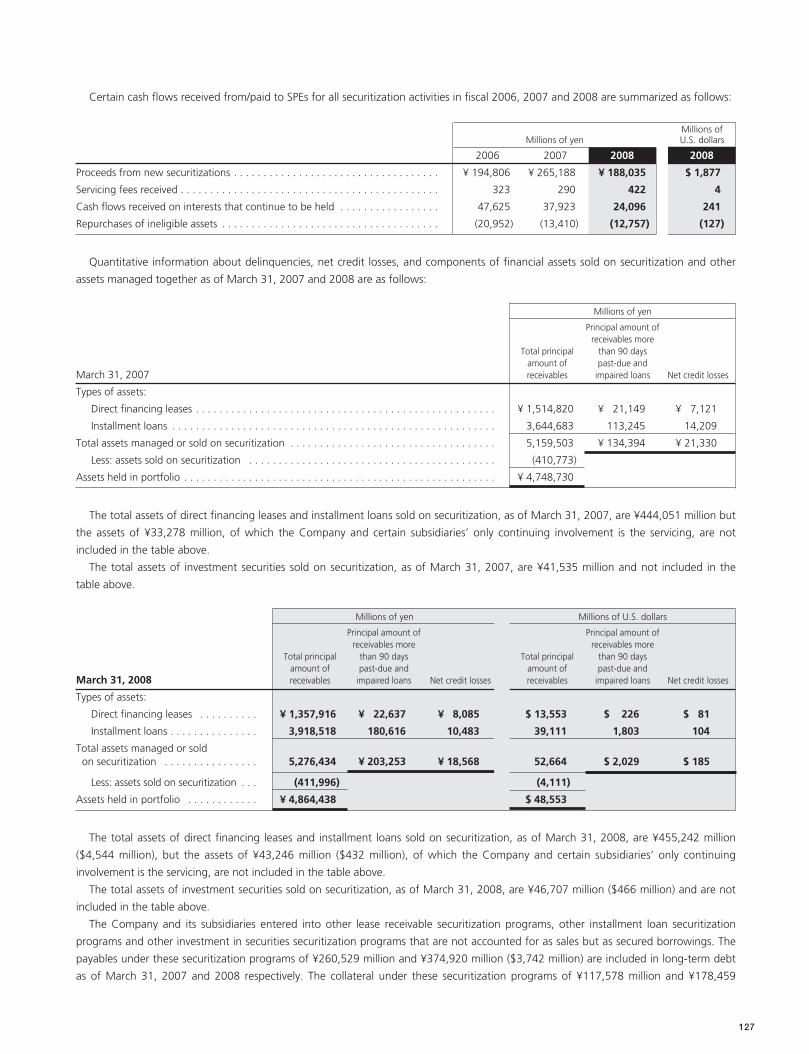
127
Certain cash flows received from/paid to SPEs for all securitization activities in fiscal 2006, 2007 and 2008 are summarized as follows:
Millions ofMillions of yen U.S. dollars
2006 2007 2008 2008
Proceeds from new securitizations . . . . . . . . . . . . . . . . . . . . . . . . . . . . . . . . . . . ¥ 194,806 ¥ 265,188 ¥ 188,035 $ 1,877
Servicing fees received . . . . . . . . . . . . . . . . . . . . . . . . . . . . . . . . . . . . . . . . . . . . 323 290 422 4
Cash flows received on interests that continue to be held . . . . . . . . . . . . . . . . . 47,625 37,923 24,096 241
Repurchases of ineligible assets . . . . . . . . . . . . . . . . . . . . . . . . . . . . . . . . . . . . . (20,952) (13,410) (12,757) (127)
Quantitative information about delinquencies, net credit losses, and components of financial assets sold on securitization and other
assets managed together as of March 31, 2007 and 2008 are as follows:
Millions of yen
Principal amount ofreceivables more
Total principal than 90 daysamount of past-due and
March 31, 2007 receivables impaired loans Net credit losses
Types of assets:
Direct financing leases . . . . . . . . . . . . . . . . . . . . . . . . . . . . . . . . . . . . . . . . . . . . . . . . . . . ¥ 1,514,820 ¥ 21,149 ¥ 7,121
Installment loans . . . . . . . . . . . . . . . . . . . . . . . . . . . . . . . . . . . . . . . . . . . . . . . . . . . . . . . 3,644,683 113,245 14,209
Total assets managed or sold on securitization . . . . . . . . . . . . . . . . . . . . . . . . . . . . . . . . . . . 5,159,503 ¥ 134,394 ¥ 21,330
Less: assets sold on securitization . . . . . . . . . . . . . . . . . . . . . . . . . . . . . . . . . . . . . . . . . . (410,773)
Assets held in portfolio . . . . . . . . . . . . . . . . . . . . . . . . . . . . . . . . . . . . . . . . . . . . . . . . . . . . . ¥ 4,748,730
The total assets of direct financing leases and installment loans sold on securitization, as of March 31, 2007, are ¥444,051 million but
the assets of ¥33,278 million, of which the Company and certain subsidiaries’ only continuing involvement is the servicing, are not
included in the table above.
The total assets of investment securities sold on securitization, as of March 31, 2007, are ¥41,535 million and not included in the
table above.
Millions of yen Millions of U.S. dollars
Principal amount of Principal amount ofreceivables more receivables more
Total principal than 90 days Total principal than 90 daysamount of past-due and amount of past-due and
March 31, 2008 receivables impaired loans Net credit losses receivables impaired loans Net credit losses
Types of assets:
Direct financing leases . . . . . . . . . . ¥ 1,357,916 ¥ 22,637 ¥ 8,085 $ 13,553 $ 226 $ 81
Installment loans . . . . . . . . . . . . . . . 3,918,518 180,616 10,483 39,111 1,803 104
Total assets managed or sold on securitization . . . . . . . . . . . . . . . . 5,276,434 ¥ 203,253 ¥ 18,568 52,664 $ 2,029 $ 185
Less: assets sold on securitization . . . (411,996) (4,111)
Assets held in portfolio . . . . . . . . . . . . ¥ 4,864,438 $ 48,553
The total assets of direct financing leases and installment loans sold on securitization, as of March 31, 2008, are ¥455,242 million
($4,544 million), but the assets of ¥43,246 million ($432 million), of which the Company and certain subsidiaries’ only continuing
involvement is the servicing, are not included in the table above.
The total assets of investment securities sold on securitization, as of March 31, 2008, are ¥46,707 million ($466 million) and are not
included in the table above.
The Company and its subsidiaries entered into other lease receivable securitization programs, other installment loan securitization
programs and other investment in securities securitization programs that are not accounted for as sales but as secured borrowings. The
payables under these securitization programs of ¥260,529 million and ¥374,920 million ($3,742 million) are included in long-term debt
as of March 31, 2007 and 2008 respectively. The collateral under these securitization programs of ¥117,578 million and ¥178,459
128
million ($1,781 million) is included in investment in direct financing leases in the consolidated balance sheets as of March 31, 2007 and
2008, respectively. The collateral under these securitization programs of ¥270,106 million and ¥284,168 million ($2,836 million) is
included in installment loans in the consolidated balance sheets as of March 31, 2007 and 2008, respectively. In addition, the collateral
under these securitization programs of ¥14,731 million ($147 million) is included in investment in securities in the consolidated balance
sheets as of March 31, 2008.
Also, the cash reserves included in trust accounts under these securitization programs of ¥7,160 million and ¥12,418 million ($124
million) are included in other assets in the consolidated balance sheets as of March 31, 2007 and 2008 respectively.
The Company and its subsidiaries use special purpose companies, partnerships and trusts (hereinafter referred to as SPEs) in the
ordinary course of business. These SPEs are not always accompanied by and are not generally controlled by voting rights. FASB
Interpretation No. 46 (revised December 2003) (“Consolidation of Variable Interest Entities”) addresses consolidation by business
enterprises of SPEs within the scope of the interpretation. Generally these SPEs are entities where a) the total equity investment at risk is
not sufficient to permit the entity to finance its activities without additional subordinated financial support provided by any parties
including the equity holders or b) as a group the holders of the equity investment at risk do not have (1) the direct or indirect ability to
make decisions about an entity’s activities through voting rights or similar rights, or (2) the obligation to absorb the expected losses of
the entity or (3) the right to receive the expected residual returns of the entity. There are certain exceptions to these general criteria.
Entities within the scope of the Interpretation are called variable interest entities (“VIEs”). The variable interest holder who will absorb a
majority of the expected losses or receive a majority of the expected residual returns or both is defined as the primary beneficiary of the
entity. VIEs are consolidated by the primary beneficiary of the entity.
Information about significant SPEs for the Company and its subsidiaries are as follows:
(a) SPEs for liquidating customer assets
The Company and its subsidiaries may use SPEs in structuring financing for customers to liquidate specific customer assets. The SPEs
are typically used to provide a structure that is bankruptcy remote with respect to the customer and the use of SPEs structure is
requested by such customer. Such SPEs typically acquire assets to be liquidated from the customer, borrow non-recourse loans from
financial institutions and have an equity investment made by the customer. By using cash flows from the liquidated assets, these SPEs
repay the loan and pay dividends to equity investors if sufficient funds exist.
The Company and its subsidiaries provide non-recourse loans to such SPEs in the aggregate of ¥26,492 million and ¥2,642 million
($26 million) as of March 31, 2007 and 2008, and occasionally make investments in these SPEs, which amount to ¥13,757 million and
¥14,882 million ($149 million) as of March 31, 2007 and 2008, respectively. The Company and its subsidiaries’ risk exposure is limited to
the amounts of the loans and investments referred to above.
Total assets of such SPEs are ¥132,328 million and ¥97,697 million ($975 million) as of March 31, 2007 and 2008, respectively.
Among those SPEs, no SPEs were subject to consolidation.
(b) SPEs for acquisition of real estate and real estate development projects for customers
Customers and the Company and its subsidiaries are involved with SPEs formed to acquire real estate and/or develop real estate
projects. In each case, a customer establishes and makes an equity investment in an SPE that is designed to be bankruptcy remote from
the customer. The SPEs acquire real estate and/or develop real estate projects.
The Company and its subsidiaries provide non-recourse loans to SPEs and hold debt securities issued by certain SPEs and/or make
investments in these SPEs. Total assets of consolidated SPEs were ¥24,015 million and ¥22,212 million ($222 million) as of March 31,
2007 and 2008, respectively. Those assets are mainly included in investment in operating leases and other operating assets in the
consolidated balance sheets.
In addition, the Company and its subsidiaries provide non-recourse loans to non-consolidated SPEs and hold debt securities issued by
certain non-consolidated SPE’s in the aggregate of ¥33,636 million and ¥16,387 million ($164 million) as of March 31, 2007 and 2008,
respectively, and/or make investments in these non-consolidated SPE’s, which amount to ¥22,539 million and ¥42,082 million ($420
million) as of March 31, 2007 and 2008, respectively. The Company and its subsidiaries’ risk exposure is limited to the amounts of the
loans, debt securities and investments referred to above. Total assets of such SPEs are ¥118,629 million and ¥451,282 million ($4,504
million) as of March 31, 2007 and 2008, respectively.
10. Business Transactions with Special Purpose Entities
129
(c) SPEs for acquisition of real estate for the Company and its subsidiaries’ real estate-related business
The Company and its subsidiaries acquire real estate and establish SPEs to borrow non-recourse loans from financial institutions and
simplify the administration activities necessary for the real estate. The Company and its subsidiaries have always consolidated such SPEs even
though the Company and its subsidiaries may not have voting rights since substantially all of such SPEs’ subordinated interests are issued to
the Company and its subsidiaries, and therefore the SPEs are controlled by and for the benefit of the Company and its subsidiaries.
Total assets of such SPEs are ¥118,499 million and ¥222,584 million ($2,222 million) as of March 31, 2007 and 2008, respectively.
Those assets are mainly included in investment in operating leases, other assets and other operating assets in the consolidated balance
sheets as of March 31, 2007 and 2008, respectively.
Certain SPEs borrow non-recourse loans from financial institutions, and ¥24,380 million and ¥103,941 million ($1,037 million) of
SPEs’ assets are pledged as collateral for the non-recourse loans as of March 31, 2007 and 2008, respectively. The lenders of the non-
recourse loans have no recourse to other assets of the Company and its subsidiaries.
(d) SPEs for corporate rehabilitation support business
Financial institutions, the Company and its subsidiary are involved with SPEs established for the corporate rehabilitation support
business. SPEs receive the funds from investors including the financial institutions, the Company and the subsidiary, and purchase loan
receivables due from borrowers which have financial problems, but deemed to have the potential to recover in the future. The servicing
operations for the SPEs are mainly conducted by the subsidiary.
The Company and its subsidiary consolidated such SPEs since the Company and the subsidiary have the majority of the investment
share of such SPEs.
Total assets of the consolidated SPEs are ¥23,601 million and ¥21,622 million ($216 million) as of March 31, 2007 and 2008,
respectively. Those assets are mainly included in installment loans in the consolidated balance sheets as of March 31, 2007 and 2008,
respectively. Certain SPEs borrow non-recourse loans from financial institutions, and ¥1,250 million and ¥714 million ($7 million) of
SPEs’ assets are pledged as collateral for the non-recourse loans as of March 31, 2007 and 2008, respectively. The lenders of the non-
recourse loans have no recourse to other assets of the Company and its subsidiaries.
(e) SPEs for acquisition of loan receivables
The Company is involved with SPEs established by customers to purchase loan receivables. SPEs receive loan receivables as trust assets
from the customers. The servicing operations for the SPEs are mainly conducted by the customers.
The Company consolidated such SPEs since the Company purchased all of beneficial interests of such SPEs.
Total assets of the consolidated SPEs are ¥131,127 million and ¥120,197 million ($1,200 million) as of March 31, 2007 and 2008,
respectively. Those assets are mainly included in installment loans in the consolidated balance sheets as of March 31, 2007 and 2008.
( f ) SPEs for investment in securities
The Company and its subsidiaries have the interests of SPEs that are investment funds and mainly invest in equity and debt securities.
Such SPEs are managed by fund management companies that are independent of the Company and its subsidiaries.
The Company consolidated certain such SPEs since the Company has the majority of the investment share of them.
Total assets of the consolidated SPEs are ¥33,912 million and ¥42,026 million ($419 million) as of March 31, 2007 and 2008,
respectively. Those assets are mainly included in other operating assets and investment in affiliates in the consolidated balance sheets as
of March 31, 2007 and 2008.
(g) Kumiai structures
In Japan, certain subsidiaries provide investment products to their customers that employ a contractual mechanism known as a kumiai,
which in part result in the subsidiaries forming a type of SPE. As a means to finance the purchase of aircraft or other large-ticket items to
be leased to third parties, the Company and its subsidiaries arrange and market kumiai products to investors, who invest a portion of the
funds necessary into the kumiai structure. The remainder of the purchase funds are borrowed by the kumiai structure in the form of a
non-recourse loan from one or more financial institutions. The kumiai investors (and any lenders to the kumiai structure) retain all of the
economic risks and rewards in connection with purchase and leasing activities of the kumiai structure, and all related gains or losses are
recorded on the financial statements of investors in the kumiai. The Company and its subsidiaries are responsible for the arrangement and
marketing of these products, and may act as servicer or administrator in kumiai transactions. The fee income for the arrangement and
administration of these transactions is recognized in the consolidated statements of income. The Company and its subsidiaries do not
guarantee or otherwise have any significant financial commitments or exposure with respect to the kumiai or its related SPE.
Most of these SPEs are not consolidated by the Company and its subsidiaries since the Company and its subsidiaries are not the
primary beneficiary.
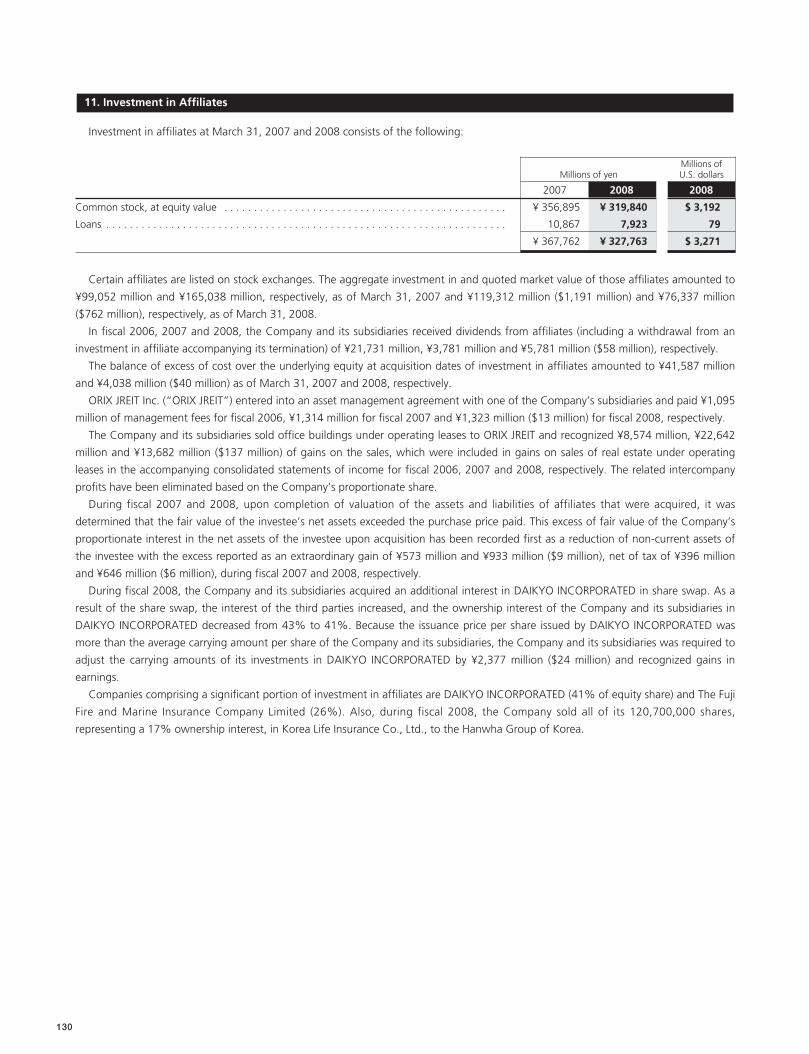
130
Investment in affiliates at March 31, 2007 and 2008 consists of the following:
Millions ofMillions of yen U.S. dollars
2007 2008 2008
Common stock, at equity value . . . . . . . . . . . . . . . . . . . . . . . . . . . . . . . . . . . . . . . . . . . . . . . . ¥ 356,895 ¥ 319,840 $ 3,192
Loans . . . . . . . . . . . . . . . . . . . . . . . . . . . . . . . . . . . . . . . . . . . . . . . . . . . . . . . . . . . . . . . . . . . . 10,867 7,923 79
. . . . . . . . . . . . . . . . . . . . . . . . . . . . . . . . . . . . . . . . . . . . . . . . . . . . . . . . . . . . . . . . . . . . . . ¥ 367,762 ¥ 327,763 $ 3,271
Certain affiliates are listed on stock exchanges. The aggregate investment in and quoted market value of those affiliates amounted to
¥99,052 million and ¥165,038 million, respectively, as of March 31, 2007 and ¥119,312 million ($1,191 million) and ¥76,337 million
($762 million), respectively, as of March 31, 2008.
In fiscal 2006, 2007 and 2008, the Company and its subsidiaries received dividends from affiliates (including a withdrawal from an
investment in affiliate accompanying its termination) of ¥21,731 million, ¥3,781 million and ¥5,781 million ($58 million), respectively.
The balance of excess of cost over the underlying equity at acquisition dates of investment in affiliates amounted to ¥41,587 million
and ¥4,038 million ($40 million) as of March 31, 2007 and 2008, respectively.
ORIX JREIT Inc. (“ORIX JREIT”) entered into an asset management agreement with one of the Company’s subsidiaries and paid ¥1,095
million of management fees for fiscal 2006, ¥1,314 million for fiscal 2007 and ¥1,323 million ($13 million) for fiscal 2008, respectively.
The Company and its subsidiaries sold office buildings under operating leases to ORIX JREIT and recognized ¥8,574 million, ¥22,642
million and ¥13,682 million ($137 million) of gains on the sales, which were included in gains on sales of real estate under operating
leases in the accompanying consolidated statements of income for fiscal 2006, 2007 and 2008, respectively. The related intercompany
profits have been eliminated based on the Company’s proportionate share.
During fiscal 2007 and 2008, upon completion of valuation of the assets and liabilities of affiliates that were acquired, it was
determined that the fair value of the investee’s net assets exceeded the purchase price paid. This excess of fair value of the Company’s
proportionate interest in the net assets of the investee upon acquisition has been recorded first as a reduction of non-current assets of
the investee with the excess reported as an extraordinary gain of ¥573 million and ¥933 million ($9 million), net of tax of ¥396 million
and ¥646 million ($6 million), during fiscal 2007 and 2008, respectively.
During fiscal 2008, the Company and its subsidiaries acquired an additional interest in DAIKYO INCORPORATED in share swap. As a
result of the share swap, the interest of the third parties increased, and the ownership interest of the Company and its subsidiaries in
DAIKYO INCORPORATED decreased from 43% to 41%. Because the issuance price per share issued by DAIKYO INCORPORATED was
more than the average carrying amount per share of the Company and its subsidiaries, the Company and its subsidiaries was required to
adjust the carrying amounts of its investments in DAIKYO INCORPORATED by ¥2,377 million ($24 million) and recognized gains in
earnings.
Companies comprising a significant portion of investment in affiliates are DAIKYO INCORPORATED (41% of equity share) and The Fuji
Fire and Marine Insurance Company Limited (26%). Also, during fiscal 2008, the Company sold all of its 120,700,000 shares,
representing a 17% ownership interest, in Korea Life Insurance Co., Ltd., to the Hanwha Group of Korea.
11. Investment in Affiliates
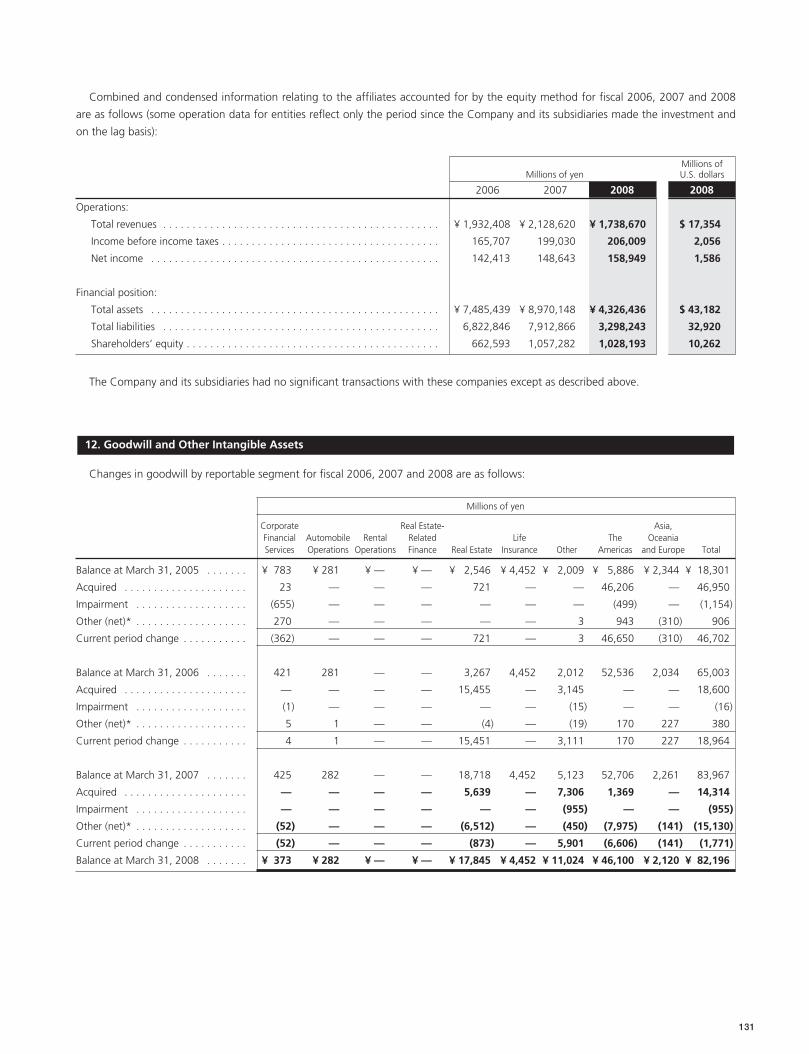
131
Combined and condensed information relating to the affiliates accounted for by the equity method for fiscal 2006, 2007 and 2008
are as follows (some operation data for entities reflect only the period since the Company and its subsidiaries made the investment and
on the lag basis):
Millions ofMillions of yen U.S. dollars
2006 2007 2008 2008
Operations:
Total revenues . . . . . . . . . . . . . . . . . . . . . . . . . . . . . . . . . . . . . . . . . . . . . . . ¥ 1,932,408 ¥ 2,128,620 ¥ 1,738,670 $ 17,354
Income before income taxes . . . . . . . . . . . . . . . . . . . . . . . . . . . . . . . . . . . . . 165,707 199,030 206,009 2,056
Net income . . . . . . . . . . . . . . . . . . . . . . . . . . . . . . . . . . . . . . . . . . . . . . . . . 142,413 148,643 158,949 1,586
Financial position:
Total assets . . . . . . . . . . . . . . . . . . . . . . . . . . . . . . . . . . . . . . . . . . . . . . . . . ¥ 7,485,439 ¥ 8,970,148 ¥ 4,326,436 $ 43,182
Total liabilities . . . . . . . . . . . . . . . . . . . . . . . . . . . . . . . . . . . . . . . . . . . . . . . 6,822,846 7,912,866 3,298,243 32,920
Shareholders’ equity . . . . . . . . . . . . . . . . . . . . . . . . . . . . . . . . . . . . . . . . . . . 662,593 1,057,282 1,028,193 10,262
The Company and its subsidiaries had no significant transactions with these companies except as described above.
Changes in goodwill by reportable segment for fiscal 2006, 2007 and 2008 are as follows:
Millions of yen
Corporate Real Estate- Asia,Financial Automobile Rental Related Life The OceaniaServices Operations Operations Finance Real Estate Insurance Other Americas and Europe Total
Balance at March 31, 2005 . . . . . . . ¥ 783 ¥ 281 ¥ — ¥ — ¥ 2,546 ¥ 4,452 ¥ 2,009 ¥ 5,886 ¥ 2,344 ¥ 18,301
Acquired . . . . . . . . . . . . . . . . . . . . . 23 — — — 721 — — 46,206 — 46,950
Impairment . . . . . . . . . . . . . . . . . . . (655) — — — — — — (499) — (1,154)
Other (net)* . . . . . . . . . . . . . . . . . . . 270 — — — — — 3 943 (310) 906
Current period change . . . . . . . . . . . (362) — — — 721 — 3 46,650 (310) 46,702
Balance at March 31, 2006 . . . . . . . 421 281 — — 3,267 4,452 2,012 52,536 2,034 65,003
Acquired . . . . . . . . . . . . . . . . . . . . . — — — — 15,455 — 3,145 — — 18,600
Impairment . . . . . . . . . . . . . . . . . . . (1) — — — — — (15) — — (16)
Other (net)* . . . . . . . . . . . . . . . . . . . 5 1 — — (4) — (19) 170 227 380
Current period change . . . . . . . . . . . 4 1 — — 15,451 — 3,111 170 227 18,964
Balance at March 31, 2007 . . . . . . . 425 282 — — 18,718 4,452 5,123 52,706 2,261 83,967
Acquired . . . . . . . . . . . . . . . . . . . . . — — — — 5,639 — 7,306 1,369 — 14,314
Impairment . . . . . . . . . . . . . . . . . . . — — — — — — (955) — — (955)
Other (net)* . . . . . . . . . . . . . . . . . . . (52) — — — (6,512) — (450) (7,975) (141) (15,130)
Current period change . . . . . . . . . . . (52) — — — (873) — 5,901 (6,606) (141) (1,771)
Balance at March 31, 2008 . . . . . . . ¥ 373 ¥ 282 ¥ — ¥ — ¥ 17,845 ¥ 4,452 ¥ 11,024 ¥ 46,100 ¥ 2,120 ¥ 82,196
12. Goodwill and Other Intangible Assets
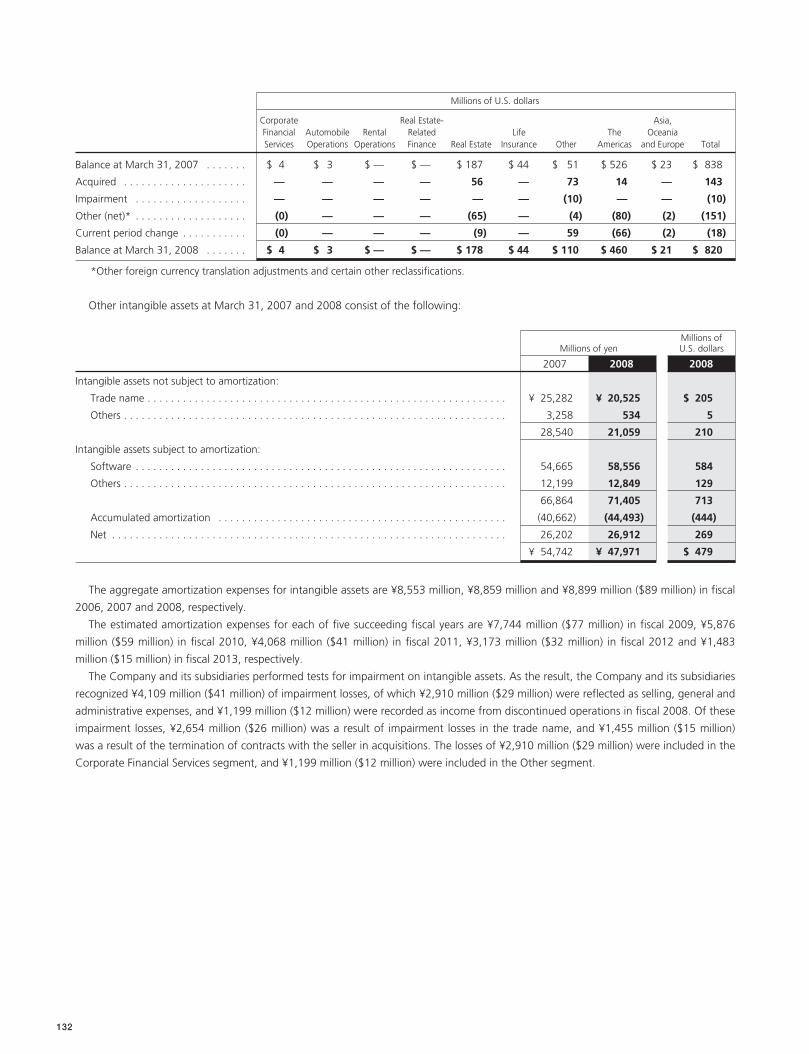
132
Millions of U.S. dollars
Corporate Real Estate- Asia,Financial Automobile Rental Related Life The OceaniaServices Operations Operations Finance Real Estate Insurance Other Americas and Europe Total
Balance at March 31, 2007 . . . . . . . $ 4 $ 3 $ — $ — $ 187 $ 44 $ 51 $ 526 $ 23 $ 838
Acquired . . . . . . . . . . . . . . . . . . . . . — — — — 56 — 73 14 — 143
Impairment . . . . . . . . . . . . . . . . . . . — — — — — — (10) — — (10)
Other (net)* . . . . . . . . . . . . . . . . . . . (0) — — — (65) — (4) (80) (2) (151)
Current period change . . . . . . . . . . . (0) — — — (9) — 59 (66) (2) (18)
Balance at March 31, 2008 . . . . . . . $ 4 $ 3 $ — $ — $ 178 $ 44 $ 110 $ 460 $ 21 $ 820
*Other foreign currency translation adjustments and certain other reclassifications.
Other intangible assets at March 31, 2007 and 2008 consist of the following:
Millions ofMillions of yen U.S. dollars
2007 2008 2008
Intangible assets not subject to amortization:
Trade name . . . . . . . . . . . . . . . . . . . . . . . . . . . . . . . . . . . . . . . . . . . . . . . . . . . . . . . . . . . . . ¥ 25,282 ¥ 20,525 $ 205
Others . . . . . . . . . . . . . . . . . . . . . . . . . . . . . . . . . . . . . . . . . . . . . . . . . . . . . . . . . . . . . . . . . 3,258 534 5
. . . . . . . . . . . . . . . . . . . . . . . . . . . . . . . . . . . . . . . . . . . . . . . . . . . . . . . . . . . . . . . . . . . . . . 28,540 21,059 210
Intangible assets subject to amortization:
Software . . . . . . . . . . . . . . . . . . . . . . . . . . . . . . . . . . . . . . . . . . . . . . . . . . . . . . . . . . . . . . . 54,665 58,556 584
Others . . . . . . . . . . . . . . . . . . . . . . . . . . . . . . . . . . . . . . . . . . . . . . . . . . . . . . . . . . . . . . . . . 12,199 12,849 129
. . . . . . . . . . . . . . . . . . . . . . . . . . . . . . . . . . . . . . . . . . . . . . . . . . . . . . . . . . . . . . . . . . . . . . 66,864 71,405 713
Accumulated amortization . . . . . . . . . . . . . . . . . . . . . . . . . . . . . . . . . . . . . . . . . . . . . . . . . (40,662) (44,493) (444)
Net . . . . . . . . . . . . . . . . . . . . . . . . . . . . . . . . . . . . . . . . . . . . . . . . . . . . . . . . . . . . . . . . . . . 26,202 26,912 269
. . . . . . . . . . . . . . . . . . . . . . . . . . . . . . . . . . . . . . . . . . . . . . . . . . . . . . . . . . . . . . . . . . . . . . ¥ 54,742 ¥ 47,971 $ 479
The aggregate amortization expenses for intangible assets are ¥8,553 million, ¥8,859 million and ¥8,899 million ($89 million) in fiscal
2006, 2007 and 2008, respectively.
The estimated amortization expenses for each of five succeeding fiscal years are ¥7,744 million ($77 million) in fiscal 2009, ¥5,876
million ($59 million) in fiscal 2010, ¥4,068 million ($41 million) in fiscal 2011, ¥3,173 million ($32 million) in fiscal 2012 and ¥1,483
million ($15 million) in fiscal 2013, respectively.
The Company and its subsidiaries performed tests for impairment on intangible assets. As the result, the Company and its subsidiaries
recognized ¥4,109 million ($41 million) of impairment losses, of which ¥2,910 million ($29 million) were reflected as selling, general and
administrative expenses, and ¥1,199 million ($12 million) were recorded as income from discontinued operations in fiscal 2008. Of these
impairment losses, ¥2,654 million ($26 million) was a result of impairment losses in the trade name, and ¥1,455 million ($15 million)
was a result of the termination of contracts with the seller in acquisitions. The losses of ¥2,910 million ($29 million) were included in the
Corporate Financial Services segment, and ¥1,199 million ($12 million) were included in the Other segment.
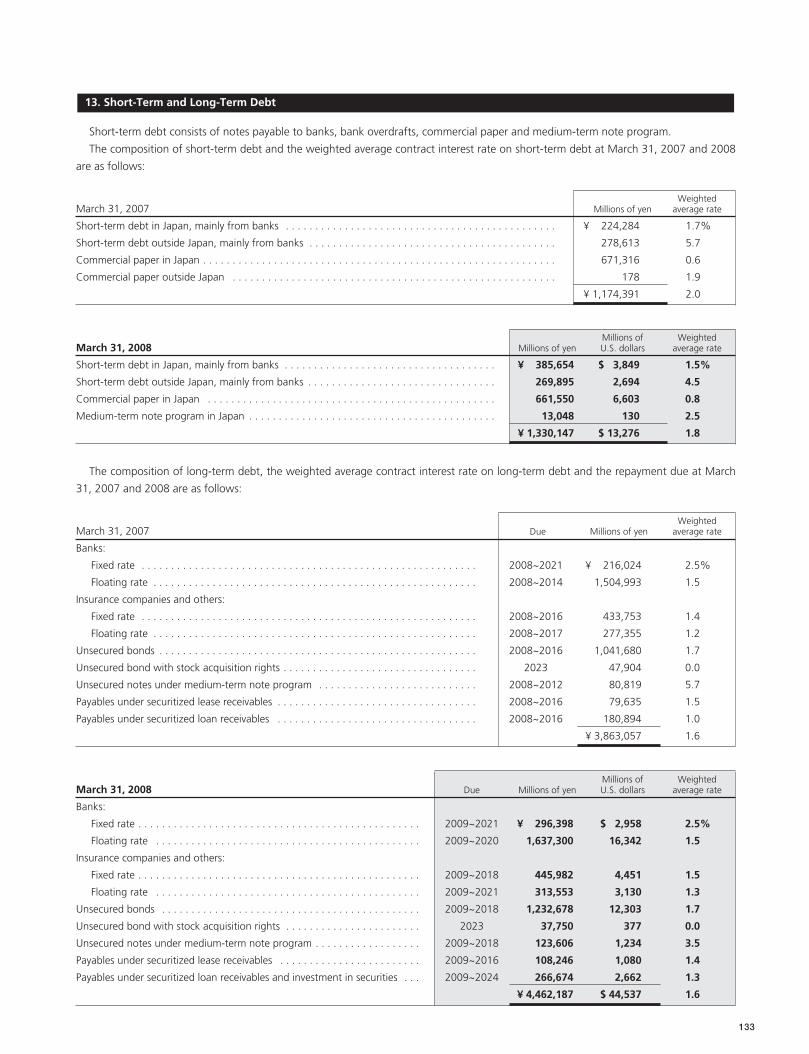
133
Short-term debt consists of notes payable to banks, bank overdrafts, commercial paper and medium-term note program.
The composition of short-term debt and the weighted average contract interest rate on short-term debt at March 31, 2007 and 2008
are as follows:
WeightedMarch 31, 2007 Millions of yen average rate
Short-term debt in Japan, mainly from banks . . . . . . . . . . . . . . . . . . . . . . . . . . . . . . . . . . . . . . . . . . . . . . ¥ 224,284 1.7%
Short-term debt outside Japan, mainly from banks . . . . . . . . . . . . . . . . . . . . . . . . . . . . . . . . . . . . . . . . . . 278,613 5.7
Commercial paper in Japan . . . . . . . . . . . . . . . . . . . . . . . . . . . . . . . . . . . . . . . . . . . . . . . . . . . . . . . . . . . . 671,316 0.6
Commercial paper outside Japan . . . . . . . . . . . . . . . . . . . . . . . . . . . . . . . . . . . . . . . . . . . . . . . . . . . . . . . 178 1.9
. . . . . . . . . . . . . . . . . . . . . . . . . . . . . . . . . . . . . . . . . . . . . . . . . . . . . . . . . . . . . . . . . . . . . . . . . . . ¥ 1,174,391 2.0
Millions of WeightedMarch 31, 2008 Millions of yen U.S. dollars average rate
Short-term debt in Japan, mainly from banks . . . . . . . . . . . . . . . . . . . . . . . . . . . . . . . . . . . . ¥ 385,654 $ 3,849 1.5%
Short-term debt outside Japan, mainly from banks . . . . . . . . . . . . . . . . . . . . . . . . . . . . . . . . 269,895 2,694 4.5
Commercial paper in Japan . . . . . . . . . . . . . . . . . . . . . . . . . . . . . . . . . . . . . . . . . . . . . . . . . 661,550 6,603 0.8
Medium-term note program in Japan . . . . . . . . . . . . . . . . . . . . . . . . . . . . . . . . . . . . . . . . . . 13,048 130 2.5
. . . . . . . . . . . . . . . . . . . . . . . . . . . . . . . . . . . . . . . . . . . . . . . . . . . . . . . . . . . . ¥ 1,330,147 $ 13,276 1.8
The composition of long-term debt, the weighted average contract interest rate on long-term debt and the repayment due at March
31, 2007 and 2008 are as follows:
WeightedMarch 31, 2007 Due Millions of yen average rate
Banks:
Fixed rate . . . . . . . . . . . . . . . . . . . . . . . . . . . . . . . . . . . . . . . . . . . . . . . . . . . . . . . . . 2008~2021 ¥ 216,024 2.5%
Floating rate . . . . . . . . . . . . . . . . . . . . . . . . . . . . . . . . . . . . . . . . . . . . . . . . . . . . . . . 2008~2014 1,504,993 1.5
Insurance companies and others:
Fixed rate . . . . . . . . . . . . . . . . . . . . . . . . . . . . . . . . . . . . . . . . . . . . . . . . . . . . . . . . . 2008~2016 433,753 1.4
Floating rate . . . . . . . . . . . . . . . . . . . . . . . . . . . . . . . . . . . . . . . . . . . . . . . . . . . . . . . 2008~2017 277,355 1.2
Unsecured bonds . . . . . . . . . . . . . . . . . . . . . . . . . . . . . . . . . . . . . . . . . . . . . . . . . . . . . . 2008~2016 1,041,680 1.7
Unsecured bond with stock acquisition rights . . . . . . . . . . . . . . . . . . . . . . . . . . . . . . . . . 2023 47,904 0.0
Unsecured notes under medium-term note program . . . . . . . . . . . . . . . . . . . . . . . . . . . 2008~2012 80,819 5.7
Payables under securitized lease receivables . . . . . . . . . . . . . . . . . . . . . . . . . . . . . . . . . . 2008~2016 79,635 1.5
Payables under securitized loan receivables . . . . . . . . . . . . . . . . . . . . . . . . . . . . . . . . . . 2008~2016 180,894 1.0
. . . . . . . . . . . . . . . . . . . . . . . . . . . . . . . . . . . . . . . . . . . . . . . . . . . . . . . . . . . . . . ¥ 3,863,057 1.6
Millions of WeightedMarch 31, 2008 Due Millions of yen U.S. dollars average rate
Banks:
Fixed rate . . . . . . . . . . . . . . . . . . . . . . . . . . . . . . . . . . . . . . . . . . . . . . . . 2009~2021 ¥ 296,398 $ 2,958 2.5%
Floating rate . . . . . . . . . . . . . . . . . . . . . . . . . . . . . . . . . . . . . . . . . . . . . 2009~2020 1,637,300 16,342 1.5
Insurance companies and others:
Fixed rate . . . . . . . . . . . . . . . . . . . . . . . . . . . . . . . . . . . . . . . . . . . . . . . . 2009~2018 445,982 4,451 1.5
Floating rate . . . . . . . . . . . . . . . . . . . . . . . . . . . . . . . . . . . . . . . . . . . . . 2009~2021 313,553 3,130 1.3
Unsecured bonds . . . . . . . . . . . . . . . . . . . . . . . . . . . . . . . . . . . . . . . . . . . . 2009~2018 1,232,678 12,303 1.7
Unsecured bond with stock acquisition rights . . . . . . . . . . . . . . . . . . . . . . . 2023 37,750 377 0.0
Unsecured notes under medium-term note program . . . . . . . . . . . . . . . . . . 2009~2018 123,606 1,234 3.5
Payables under securitized lease receivables . . . . . . . . . . . . . . . . . . . . . . . . 2009~2016 108,246 1,080 1.4
Payables under securitized loan receivables and investment in securities . . . 2009~2024 266,674 2,662 1.3
. . . . . . . . . . . . . . . . . . . . . . . . . . . . . . . . . . . . . . . . . . . . . . . . . . . . ¥ 4,462,187 $ 44,537 1.6
13. Short-Term and Long-Term Debt
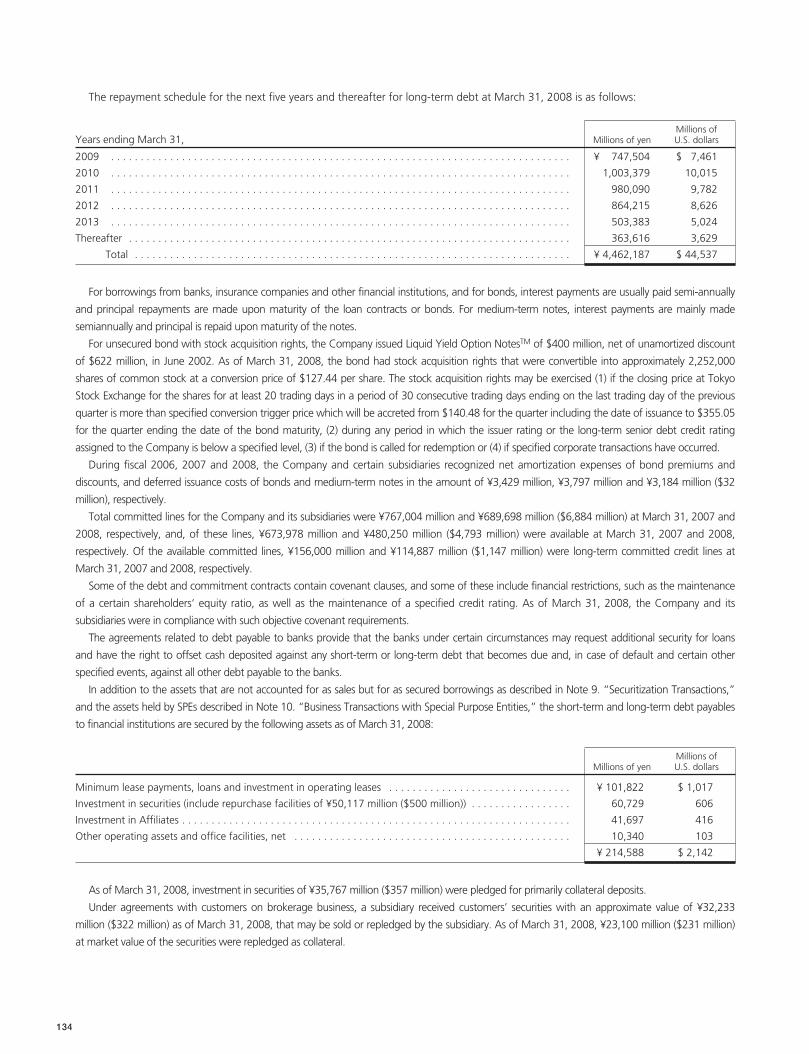
134
The repayment schedule for the next five years and thereafter for long-term debt at March 31, 2008 is as follows:
Millions ofYears ending March 31, Millions of yen U.S. dollars
2009 . . . . . . . . . . . . . . . . . . . . . . . . . . . . . . . . . . . . . . . . . . . . . . . . . . . . . . . . . . . . . . . . . . . . . . . . . . . . . . ¥ 747,504 $ 7,461
2010 . . . . . . . . . . . . . . . . . . . . . . . . . . . . . . . . . . . . . . . . . . . . . . . . . . . . . . . . . . . . . . . . . . . . . . . . . . . . . . 1,003,379 10,015
2011 . . . . . . . . . . . . . . . . . . . . . . . . . . . . . . . . . . . . . . . . . . . . . . . . . . . . . . . . . . . . . . . . . . . . . . . . . . . . . . 980,090 9,782
2012 . . . . . . . . . . . . . . . . . . . . . . . . . . . . . . . . . . . . . . . . . . . . . . . . . . . . . . . . . . . . . . . . . . . . . . . . . . . . . . 864,215 8,626
2013 . . . . . . . . . . . . . . . . . . . . . . . . . . . . . . . . . . . . . . . . . . . . . . . . . . . . . . . . . . . . . . . . . . . . . . . . . . . . . . 503,383 5,024
Thereafter . . . . . . . . . . . . . . . . . . . . . . . . . . . . . . . . . . . . . . . . . . . . . . . . . . . . . . . . . . . . . . . . . . . . . . . . . . . 363,616 3,629
Total . . . . . . . . . . . . . . . . . . . . . . . . . . . . . . . . . . . . . . . . . . . . . . . . . . . . . . . . . . . . . . . . . . . . . . . . . . ¥ 4,462,187 $ 44,537
For borrowings from banks, insurance companies and other financial institutions, and for bonds, interest payments are usually paid semi-annually
and principal repayments are made upon maturity of the loan contracts or bonds. For medium-term notes, interest payments are mainly made
semiannually and principal is repaid upon maturity of the notes.
For unsecured bond with stock acquisition rights, the Company issued Liquid Yield Option NotesTM of $400 million, net of unamortized discount
of $622 million, in June 2002. As of March 31, 2008, the bond had stock acquisition rights that were convertible into approximately 2,252,000
shares of common stock at a conversion price of $127.44 per share. The stock acquisition rights may be exercised (1) if the closing price at Tokyo
Stock Exchange for the shares for at least 20 trading days in a period of 30 consecutive trading days ending on the last trading day of the previous
quarter is more than specified conversion trigger price which will be accreted from $140.48 for the quarter including the date of issuance to $355.05
for the quarter ending the date of the bond maturity, (2) during any period in which the issuer rating or the long-term senior debt credit rating
assigned to the Company is below a specified level, (3) if the bond is called for redemption or (4) if specified corporate transactions have occurred.
During fiscal 2006, 2007 and 2008, the Company and certain subsidiaries recognized net amortization expenses of bond premiums and
discounts, and deferred issuance costs of bonds and medium-term notes in the amount of ¥3,429 million, ¥3,797 million and ¥3,184 million ($32
million), respectively.
Total committed lines for the Company and its subsidiaries were ¥767,004 million and ¥689,698 million ($6,884 million) at March 31, 2007 and
2008, respectively, and, of these lines, ¥673,978 million and ¥480,250 million ($4,793 million) were available at March 31, 2007 and 2008,
respectively. Of the available committed lines, ¥156,000 million and ¥114,887 million ($1,147 million) were long-term committed credit lines at
March 31, 2007 and 2008, respectively.
Some of the debt and commitment contracts contain covenant clauses, and some of these include financial restrictions, such as the maintenance
of a certain shareholders‘ equity ratio, as well as the maintenance of a specified credit rating. As of March 31, 2008, the Company and its
subsidiaries were in compliance with such objective covenant requirements.
The agreements related to debt payable to banks provide that the banks under certain circumstances may request additional security for loans
and have the right to offset cash deposited against any short-term or long-term debt that becomes due and, in case of default and certain other
specified events, against all other debt payable to the banks.
In addition to the assets that are not accounted for as sales but for as secured borrowings as described in Note 9. “Securitization Transactions,”
and the assets held by SPEs described in Note 10. “Business Transactions with Special Purpose Entities,” the short-term and long-term debt payables
to financial institutions are secured by the following assets as of March 31, 2008:
Millions ofMillions of yen U.S. dollars
Minimum lease payments, loans and investment in operating leases . . . . . . . . . . . . . . . . . . . . . . . . . . . . . . . ¥ 101,822 $ 1,017
Investment in securities (include repurchase facilities of ¥50,117 million ($500 million)) . . . . . . . . . . . . . . . . . 60,729 606
Investment in Affiliates . . . . . . . . . . . . . . . . . . . . . . . . . . . . . . . . . . . . . . . . . . . . . . . . . . . . . . . . . . . . . . . . . . 41,697 416
Other operating assets and office facilities, net . . . . . . . . . . . . . . . . . . . . . . . . . . . . . . . . . . . . . . . . . . . . . . . 10,340 103
. . . . . . . . . . . . . . . . . . . . . . . . . . . . . . . . . . . . . . . . . . . . . . . . . . . . . . . . . . . . . . . . . . . . . . . . . . . . . . ¥ 214,588 $ 2,142
As of March 31, 2008, investment in securities of ¥35,767 million ($357 million) were pledged for primarily collateral deposits.
Under agreements with customers on brokerage business, a subsidiary received customers’ securities with an approximate value of ¥32,233
million ($322 million) as of March 31, 2008, that may be sold or repledged by the subsidiary. As of March 31, 2008, ¥23,100 million ($231 million)
at market value of the securities were repledged as collateral.
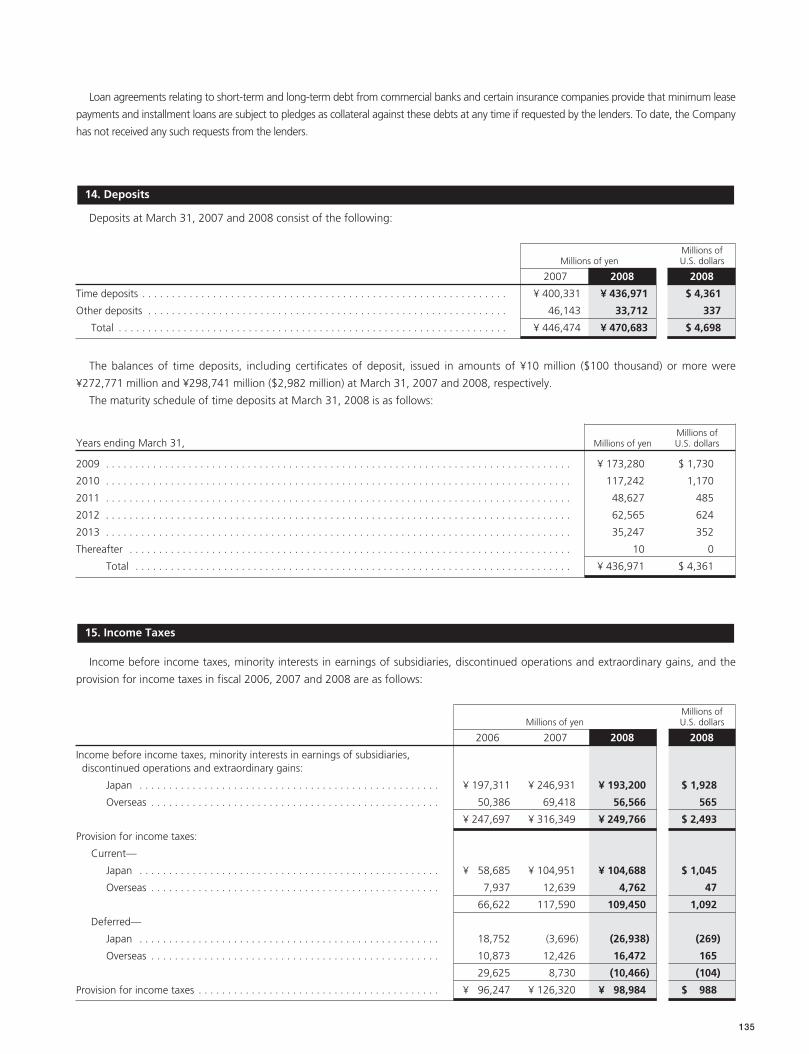
135
Loan agreements relating to short-term and long-term debt from commercial banks and certain insurance companies provide that minimum lease
payments and installment loans are subject to pledges as collateral against these debts at any time if requested by the lenders. To date, the Company
has not received any such requests from the lenders.
Deposits at March 31, 2007 and 2008 consist of the following:
Millions ofMillions of yen U.S. dollars
2007 2008 2008
Time deposits . . . . . . . . . . . . . . . . . . . . . . . . . . . . . . . . . . . . . . . . . . . . . . . . . . . . . . . . . . . . . . ¥ 400,331 ¥ 436,971 $ 4,361
Other deposits . . . . . . . . . . . . . . . . . . . . . . . . . . . . . . . . . . . . . . . . . . . . . . . . . . . . . . . . . . . . . 46,143 33,712 337
Total . . . . . . . . . . . . . . . . . . . . . . . . . . . . . . . . . . . . . . . . . . . . . . . . . . . . . . . . . . . . . . . . . . ¥ 446,474 ¥ 470,683 $ 4,698
The balances of time deposits, including certificates of deposit, issued in amounts of ¥10 million ($100 thousand) or more were
¥272,771 million and ¥298,741 million ($2,982 million) at March 31, 2007 and 2008, respectively.
The maturity schedule of time deposits at March 31, 2008 is as follows:
Millions ofYears ending March 31, Millions of yen U.S. dollars
2009 . . . . . . . . . . . . . . . . . . . . . . . . . . . . . . . . . . . . . . . . . . . . . . . . . . . . . . . . . . . . . . . . . . . . . . . . . . . . . . . ¥ 173,280 $ 1,730
2010 . . . . . . . . . . . . . . . . . . . . . . . . . . . . . . . . . . . . . . . . . . . . . . . . . . . . . . . . . . . . . . . . . . . . . . . . . . . . . . . 117,242 1,170
2011 . . . . . . . . . . . . . . . . . . . . . . . . . . . . . . . . . . . . . . . . . . . . . . . . . . . . . . . . . . . . . . . . . . . . . . . . . . . . . . . 48,627 485
2012 . . . . . . . . . . . . . . . . . . . . . . . . . . . . . . . . . . . . . . . . . . . . . . . . . . . . . . . . . . . . . . . . . . . . . . . . . . . . . . . 62,565 624
2013 . . . . . . . . . . . . . . . . . . . . . . . . . . . . . . . . . . . . . . . . . . . . . . . . . . . . . . . . . . . . . . . . . . . . . . . . . . . . . . . 35,247 352
Thereafter . . . . . . . . . . . . . . . . . . . . . . . . . . . . . . . . . . . . . . . . . . . . . . . . . . . . . . . . . . . . . . . . . . . . . . . . . . . 10 0
Total . . . . . . . . . . . . . . . . . . . . . . . . . . . . . . . . . . . . . . . . . . . . . . . . . . . . . . . . . . . . . . . . . . . . . . . . . . ¥ 436,971 $ 4,361
Income before income taxes, minority interests in earnings of subsidiaries, discontinued operations and extraordinary gains, and the
provision for income taxes in fiscal 2006, 2007 and 2008 are as follows:
Millions ofMillions of yen U.S. dollars
2006 2007 2008 2008
Income before income taxes, minority interests in earnings of subsidiaries, discontinued operations and extraordinary gains:
Japan . . . . . . . . . . . . . . . . . . . . . . . . . . . . . . . . . . . . . . . . . . . . . . . . . . . ¥ 197,311 ¥ 246,931 ¥ 193,200 $ 1,928
Overseas . . . . . . . . . . . . . . . . . . . . . . . . . . . . . . . . . . . . . . . . . . . . . . . . . 50,386 69,418 56,566 565
. . . . . . . . . . . . . . . . . . . . . . . . . . . . . . . . . . . . . . . . . . . . . . . . . . . ¥ 247,697 ¥ 316,349 ¥ 249,766 $ 2,493
Provision for income taxes:
Current—
Japan . . . . . . . . . . . . . . . . . . . . . . . . . . . . . . . . . . . . . . . . . . . . . . . . . . . ¥ 58,685 ¥ 104,951 ¥ 104,688 $ 1,045
Overseas . . . . . . . . . . . . . . . . . . . . . . . . . . . . . . . . . . . . . . . . . . . . . . . . . 7,937 12,639 4,762 47
. . . . . . . . . . . . . . . . . . . . . . . . . . . . . . . . . . . . . . . . . . . . . . . . . . . 66,622 117,590 109,450 1,092
Deferred—
Japan . . . . . . . . . . . . . . . . . . . . . . . . . . . . . . . . . . . . . . . . . . . . . . . . . . . 18,752 (3,696) (26,938) (269)
Overseas . . . . . . . . . . . . . . . . . . . . . . . . . . . . . . . . . . . . . . . . . . . . . . . . . 10,873 12,426 16,472 165
. . . . . . . . . . . . . . . . . . . . . . . . . . . . . . . . . . . . . . . . . . . . . . . . . . . 29,625 8,730 (10,466) (104)
Provision for income taxes . . . . . . . . . . . . . . . . . . . . . . . . . . . . . . . . . . . . . . . . . ¥ 96,247 ¥ 126,320 ¥ 98,984 $ 988
15. Income Taxes
14. Deposits
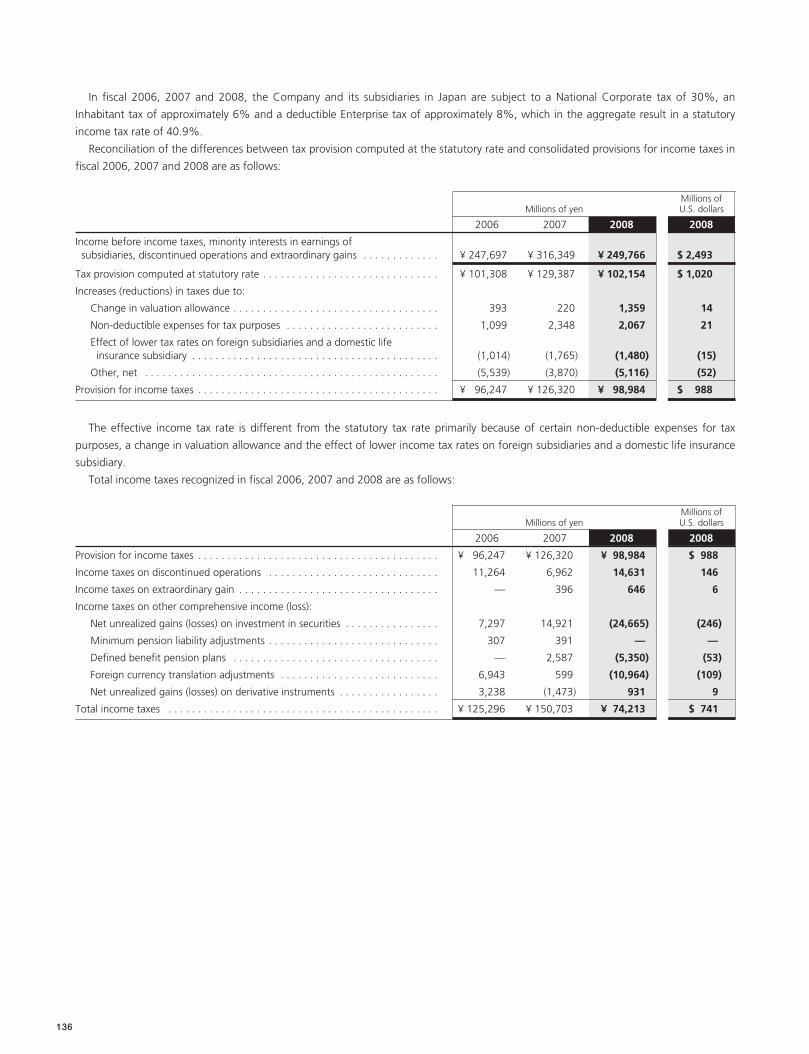
136
In fiscal 2006, 2007 and 2008, the Company and its subsidiaries in Japan are subject to a National Corporate tax of 30%, an
Inhabitant tax of approximately 6% and a deductible Enterprise tax of approximately 8%, which in the aggregate result in a statutory
income tax rate of 40.9%.
Reconciliation of the differences between tax provision computed at the statutory rate and consolidated provisions for income taxes in
fiscal 2006, 2007 and 2008 are as follows:
Millions ofMillions of yen U.S. dollars
2006 2007 2008 2008
Income before income taxes, minority interests in earnings of subsidiaries, discontinued operations and extraordinary gains . . . . . . . . . . . . . ¥ 247,697 ¥ 316,349 ¥ 249,766 $ 2,493
Tax provision computed at statutory rate . . . . . . . . . . . . . . . . . . . . . . . . . . . . . . ¥ 101,308 ¥ 129,387 ¥ 102,154 $ 1,020
Increases (reductions) in taxes due to:
Change in valuation allowance . . . . . . . . . . . . . . . . . . . . . . . . . . . . . . . . . . . 393 220 1,359 14
Non-deductible expenses for tax purposes . . . . . . . . . . . . . . . . . . . . . . . . . . 1,099 2,348 2,067 21
Effect of lower tax rates on foreign subsidiaries and a domestic life insurance subsidiary . . . . . . . . . . . . . . . . . . . . . . . . . . . . . . . . . . . . . . . . . . (1,014) (1,765) (1,480) (15)
Other, net . . . . . . . . . . . . . . . . . . . . . . . . . . . . . . . . . . . . . . . . . . . . . . . . . . (5,539) (3,870) (5,116) (52)
Provision for income taxes . . . . . . . . . . . . . . . . . . . . . . . . . . . . . . . . . . . . . . . . . ¥ 96,247 ¥ 126,320 ¥ 98,984 $ 988
The effective income tax rate is different from the statutory tax rate primarily because of certain non-deductible expenses for tax
purposes, a change in valuation allowance and the effect of lower income tax rates on foreign subsidiaries and a domestic life insurance
subsidiary.
Total income taxes recognized in fiscal 2006, 2007 and 2008 are as follows:
Millions ofMillions of yen U.S. dollars
2006 2007 2008 2008
Provision for income taxes . . . . . . . . . . . . . . . . . . . . . . . . . . . . . . . . . . . . . . . . . ¥ 96,247 ¥ 126,320 ¥ 98,984 $ 988
Income taxes on discontinued operations . . . . . . . . . . . . . . . . . . . . . . . . . . . . . 11,264 6,962 14,631 146
Income taxes on extraordinary gain . . . . . . . . . . . . . . . . . . . . . . . . . . . . . . . . . . — 396 646 6
Income taxes on other comprehensive income (loss):
Net unrealized gains (losses) on investment in securities . . . . . . . . . . . . . . . . 7,297 14,921 (24,665) (246)
Minimum pension liability adjustments . . . . . . . . . . . . . . . . . . . . . . . . . . . . . 307 391 — —
Defined benefit pension plans . . . . . . . . . . . . . . . . . . . . . . . . . . . . . . . . . . . — 2,587 (5,350) (53)
Foreign currency translation adjustments . . . . . . . . . . . . . . . . . . . . . . . . . . . 6,943 599 (10,964) (109)
Net unrealized gains (losses) on derivative instruments . . . . . . . . . . . . . . . . . 3,238 (1,473) 931 9
Total income taxes . . . . . . . . . . . . . . . . . . . . . . . . . . . . . . . . . . . . . . . . . . . . . . ¥ 125,296 ¥ 150,703 ¥ 74,213 $ 741
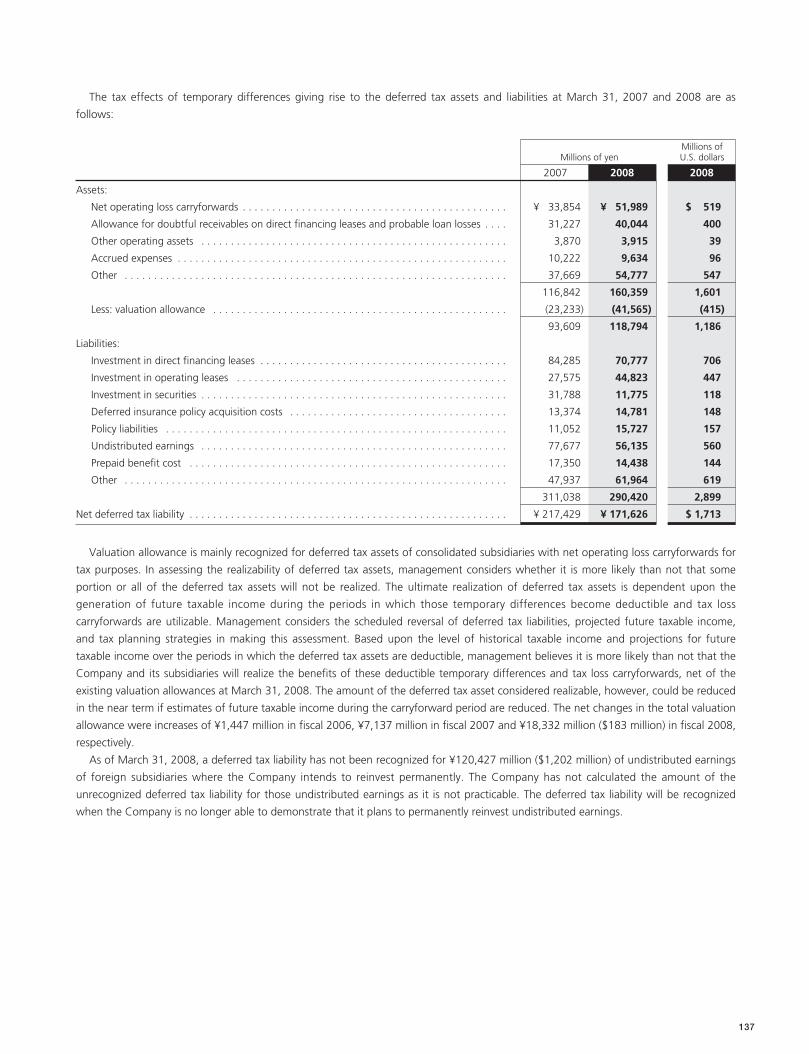
137
The tax effects of temporary differences giving rise to the deferred tax assets and liabilities at March 31, 2007 and 2008 are as
follows:
Millions ofMillions of yen U.S. dollars
2007 2008 2008
Assets:
Net operating loss carryforwards . . . . . . . . . . . . . . . . . . . . . . . . . . . . . . . . . . . . . . . . . . . . . ¥ 33,854 ¥ 51,989 $ 519
Allowance for doubtful receivables on direct financing leases and probable loan losses . . . . 31,227 40,044 400
Other operating assets . . . . . . . . . . . . . . . . . . . . . . . . . . . . . . . . . . . . . . . . . . . . . . . . . . . . 3,870 3,915 39
Accrued expenses . . . . . . . . . . . . . . . . . . . . . . . . . . . . . . . . . . . . . . . . . . . . . . . . . . . . . . . . 10,222 9,634 96
Other . . . . . . . . . . . . . . . . . . . . . . . . . . . . . . . . . . . . . . . . . . . . . . . . . . . . . . . . . . . . . . . . . 37,669 54,777 547
. . . . . . . . . . . . . . . . . . . . . . . . . . . . . . . . . . . . . . . . . . . . . . . . . . . . . . . . . . . . . . . . . . . 116,842 160,359 1,601
Less: valuation allowance . . . . . . . . . . . . . . . . . . . . . . . . . . . . . . . . . . . . . . . . . . . . . . . . . . (23,233) (41,565) (415)
. . . . . . . . . . . . . . . . . . . . . . . . . . . . . . . . . . . . . . . . . . . . . . . . . . . . . . . . . . . . . . . . . . . 93,609 118,794 1,186
Liabilities:
Investment in direct financing leases . . . . . . . . . . . . . . . . . . . . . . . . . . . . . . . . . . . . . . . . . . 84,285 70,777 706
Investment in operating leases . . . . . . . . . . . . . . . . . . . . . . . . . . . . . . . . . . . . . . . . . . . . . . 27,575 44,823 447
Investment in securities . . . . . . . . . . . . . . . . . . . . . . . . . . . . . . . . . . . . . . . . . . . . . . . . . . . . 31,788 11,775 118
Deferred insurance policy acquisition costs . . . . . . . . . . . . . . . . . . . . . . . . . . . . . . . . . . . . . 13,374 14,781 148
Policy liabilities . . . . . . . . . . . . . . . . . . . . . . . . . . . . . . . . . . . . . . . . . . . . . . . . . . . . . . . . . . 11,052 15,727 157
Undistributed earnings . . . . . . . . . . . . . . . . . . . . . . . . . . . . . . . . . . . . . . . . . . . . . . . . . . . . 77,677 56,135 560
Prepaid benefit cost . . . . . . . . . . . . . . . . . . . . . . . . . . . . . . . . . . . . . . . . . . . . . . . . . . . . . . 17,350 14,438 144
Other . . . . . . . . . . . . . . . . . . . . . . . . . . . . . . . . . . . . . . . . . . . . . . . . . . . . . . . . . . . . . . . . . 47,937 61,964 619
. . . . . . . . . . . . . . . . . . . . . . . . . . . . . . . . . . . . . . . . . . . . . . . . . . . . . . . . . . . . . . . . . . . 311,038 290,420 2,899
Net deferred tax liability . . . . . . . . . . . . . . . . . . . . . . . . . . . . . . . . . . . . . . . . . . . . . . . . . . . . . . ¥ 217,429 ¥ 171,626 $ 1,713
Valuation allowance is mainly recognized for deferred tax assets of consolidated subsidiaries with net operating loss carryforwards for
tax purposes. In assessing the realizability of deferred tax assets, management considers whether it is more likely than not that some
portion or all of the deferred tax assets will not be realized. The ultimate realization of deferred tax assets is dependent upon the
generation of future taxable income during the periods in which those temporary differences become deductible and tax loss
carryforwards are utilizable. Management considers the scheduled reversal of deferred tax liabilities, projected future taxable income,
and tax planning strategies in making this assessment. Based upon the level of historical taxable income and projections for future
taxable income over the periods in which the deferred tax assets are deductible, management believes it is more likely than not that the
Company and its subsidiaries will realize the benefits of these deductible temporary differences and tax loss carryforwards, net of the
existing valuation allowances at March 31, 2008. The amount of the deferred tax asset considered realizable, however, could be reduced
in the near term if estimates of future taxable income during the carryforward period are reduced. The net changes in the total valuation
allowance were increases of ¥1,447 million in fiscal 2006, ¥7,137 million in fiscal 2007 and ¥18,332 million ($183 million) in fiscal 2008,
respectively.
As of March 31, 2008, a deferred tax liability has not been recognized for ¥120,427 million ($1,202 million) of undistributed earnings
of foreign subsidiaries where the Company intends to reinvest permanently. The Company has not calculated the amount of the
unrecognized deferred tax liability for those undistributed earnings as it is not practicable. The deferred tax liability will be recognized
when the Company is no longer able to demonstrate that it plans to permanently reinvest undistributed earnings.
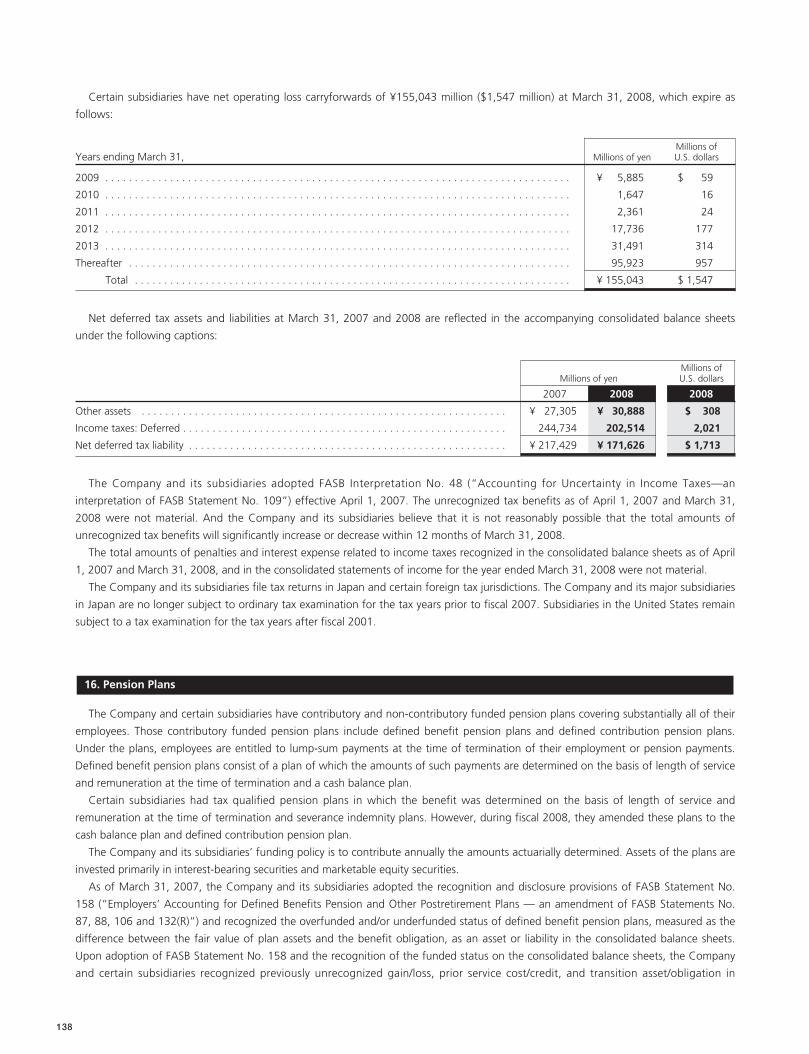
138
Certain subsidiaries have net operating loss carryforwards of ¥155,043 million ($1,547 million) at March 31, 2008, which expire as
follows:
Millions ofYears ending March 31, Millions of yen U.S. dollars
2009 . . . . . . . . . . . . . . . . . . . . . . . . . . . . . . . . . . . . . . . . . . . . . . . . . . . . . . . . . . . . . . . . . . . . . . . . . . . . . . . ¥ 5,885 $ 59
2010 . . . . . . . . . . . . . . . . . . . . . . . . . . . . . . . . . . . . . . . . . . . . . . . . . . . . . . . . . . . . . . . . . . . . . . . . . . . . . . . 1,647 16
2011 . . . . . . . . . . . . . . . . . . . . . . . . . . . . . . . . . . . . . . . . . . . . . . . . . . . . . . . . . . . . . . . . . . . . . . . . . . . . . . . 2,361 24
2012 . . . . . . . . . . . . . . . . . . . . . . . . . . . . . . . . . . . . . . . . . . . . . . . . . . . . . . . . . . . . . . . . . . . . . . . . . . . . . . . 17,736 177
2013 . . . . . . . . . . . . . . . . . . . . . . . . . . . . . . . . . . . . . . . . . . . . . . . . . . . . . . . . . . . . . . . . . . . . . . . . . . . . . . . 31,491 314
Thereafter . . . . . . . . . . . . . . . . . . . . . . . . . . . . . . . . . . . . . . . . . . . . . . . . . . . . . . . . . . . . . . . . . . . . . . . . . . . 95,923 957
Total . . . . . . . . . . . . . . . . . . . . . . . . . . . . . . . . . . . . . . . . . . . . . . . . . . . . . . . . . . . . . . . . . . . . . . . . . . ¥ 155,043 $ 1,547
Net deferred tax assets and liabilities at March 31, 2007 and 2008 are reflected in the accompanying consolidated balance sheets
under the following captions:
Millions ofMillions of yen U.S. dollars
2007 2008 2008
Other assets . . . . . . . . . . . . . . . . . . . . . . . . . . . . . . . . . . . . . . . . . . . . . . . . . . . . . . . . . . . . . . ¥ 27,305 ¥ 30,888 $ 308
Income taxes: Deferred . . . . . . . . . . . . . . . . . . . . . . . . . . . . . . . . . . . . . . . . . . . . . . . . . . . . . . . 244,734 202,514 2,021
Net deferred tax liability . . . . . . . . . . . . . . . . . . . . . . . . . . . . . . . . . . . . . . . . . . . . . . . . . . . . . . ¥ 217,429 ¥ 171,626 $ 1,713
The Company and its subsidiaries adopted FASB Interpretation No. 48 (“Accounting for Uncertainty in Income Taxes—an
interpretation of FASB Statement No. 109”) effective April 1, 2007. The unrecognized tax benefits as of April 1, 2007 and March 31,
2008 were not material. And the Company and its subsidiaries believe that it is not reasonably possible that the total amounts of
unrecognized tax benefits will significantly increase or decrease within 12 months of March 31, 2008.
The total amounts of penalties and interest expense related to income taxes recognized in the consolidated balance sheets as of April
1, 2007 and March 31, 2008, and in the consolidated statements of income for the year ended March 31, 2008 were not material.
The Company and its subsidiaries file tax returns in Japan and certain foreign tax jurisdictions. The Company and its major subsidiaries
in Japan are no longer subject to ordinary tax examination for the tax years prior to fiscal 2007. Subsidiaries in the United States remain
subject to a tax examination for the tax years after fiscal 2001.
The Company and certain subsidiaries have contributory and non-contributory funded pension plans covering substantially all of their
employees. Those contributory funded pension plans include defined benefit pension plans and defined contribution pension plans.
Under the plans, employees are entitled to lump-sum payments at the time of termination of their employment or pension payments.
Defined benefit pension plans consist of a plan of which the amounts of such payments are determined on the basis of length of service
and remuneration at the time of termination and a cash balance plan.
Certain subsidiaries had tax qualified pension plans in which the benefit was determined on the basis of length of service and
remuneration at the time of termination and severance indemnity plans. However, during fiscal 2008, they amended these plans to the
cash balance plan and defined contribution pension plan.
The Company and its subsidiaries’ funding policy is to contribute annually the amounts actuarially determined. Assets of the plans are
invested primarily in interest-bearing securities and marketable equity securities.
As of March 31, 2007, the Company and its subsidiaries adopted the recognition and disclosure provisions of FASB Statement No.
158 (“Employers’ Accounting for Defined Benefits Pension and Other Postretirement Plans — an amendment of FASB Statements No.
87, 88, 106 and 132(R)”) and recognized the overfunded and/or underfunded status of defined benefit pension plans, measured as the
difference between the fair value of plan assets and the benefit obligation, as an asset or liability in the consolidated balance sheets.
Upon adoption of FASB Statement No. 158 and the recognition of the funded status on the consolidated balance sheets, the Company
and certain subsidiaries recognized previously unrecognized gain/loss, prior service cost/credit, and transition asset/obligation in
16. Pension Plans
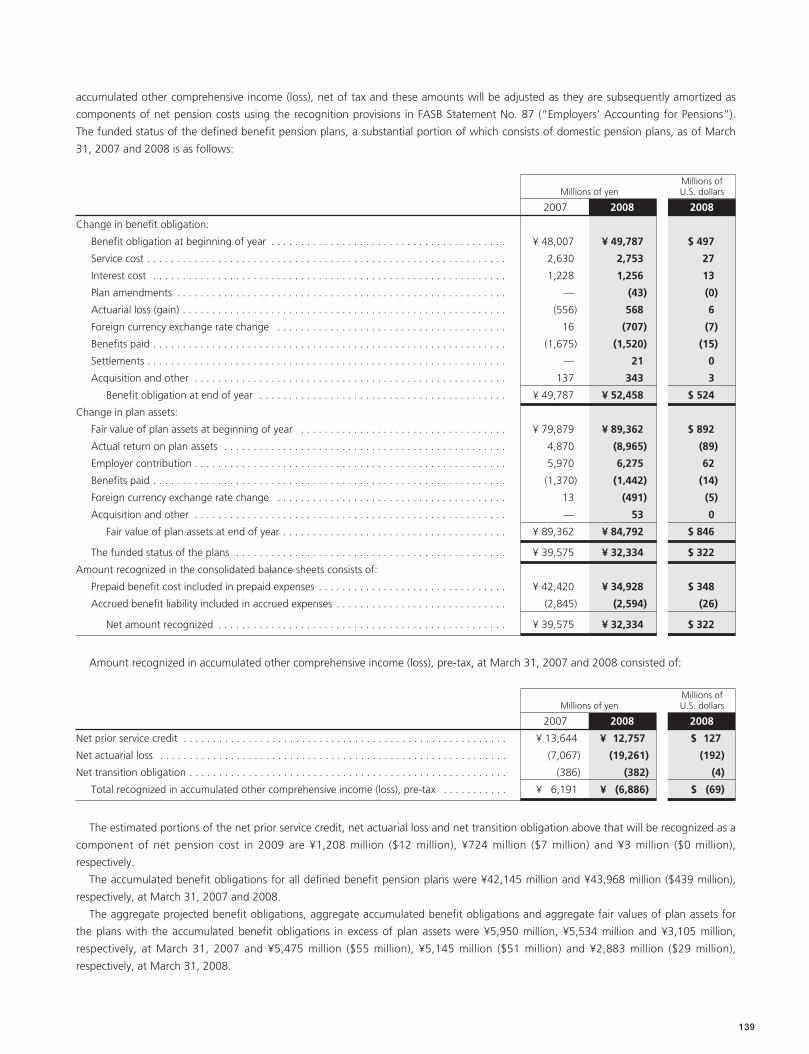
139
accumulated other comprehensive income (loss), net of tax and these amounts will be adjusted as they are subsequently amortized as
components of net pension costs using the recognition provisions in FASB Statement No. 87 (“Employers’ Accounting for Pensions”).
The funded status of the defined benefit pension plans, a substantial portion of which consists of domestic pension plans, as of March
31, 2007 and 2008 is as follows:
Millions ofMillions of yen U.S. dollars
2007 2008 2008
Change in benefit obligation:
Benefit obligation at beginning of year . . . . . . . . . . . . . . . . . . . . . . . . . . . . . . . . . . . . . . . . ¥ 48,007 ¥ 49,787 $ 497
Service cost . . . . . . . . . . . . . . . . . . . . . . . . . . . . . . . . . . . . . . . . . . . . . . . . . . . . . . . . . . . . . 2,630 2,753 27
Interest cost . . . . . . . . . . . . . . . . . . . . . . . . . . . . . . . . . . . . . . . . . . . . . . . . . . . . . . . . . . . . 1,228 1,256 13
Plan amendments . . . . . . . . . . . . . . . . . . . . . . . . . . . . . . . . . . . . . . . . . . . . . . . . . . . . . . . . — (43) (0)
Actuarial loss (gain) . . . . . . . . . . . . . . . . . . . . . . . . . . . . . . . . . . . . . . . . . . . . . . . . . . . . . . . (556) 568 6
Foreign currency exchange rate change . . . . . . . . . . . . . . . . . . . . . . . . . . . . . . . . . . . . . . . 16 (707) (7)
Benefits paid . . . . . . . . . . . . . . . . . . . . . . . . . . . . . . . . . . . . . . . . . . . . . . . . . . . . . . . . . . . . (1,675) (1,520) (15)
Settlements . . . . . . . . . . . . . . . . . . . . . . . . . . . . . . . . . . . . . . . . . . . . . . . . . . . . . . . . . . . . . — 21 0
Acquisition and other . . . . . . . . . . . . . . . . . . . . . . . . . . . . . . . . . . . . . . . . . . . . . . . . . . . . . 137 343 3
Benefit obligation at end of year . . . . . . . . . . . . . . . . . . . . . . . . . . . . . . . . . . . . . . . . . . ¥ 49,787 ¥ 52,458 $ 524
Change in plan assets:
Fair value of plan assets at beginning of year . . . . . . . . . . . . . . . . . . . . . . . . . . . . . . . . . . . ¥ 79,879 ¥ 89,362 $ 892
Actual return on plan assets . . . . . . . . . . . . . . . . . . . . . . . . . . . . . . . . . . . . . . . . . . . . . . . . 4,870 (8,965) (89)
Employer contribution . . . . . . . . . . . . . . . . . . . . . . . . . . . . . . . . . . . . . . . . . . . . . . . . . . . . . 5,970 6,275 62
Benefits paid . . . . . . . . . . . . . . . . . . . . . . . . . . . . . . . . . . . . . . . . . . . . . . . . . . . . . . . . . . . . (1,370) (1,442) (14)
Foreign currency exchange rate change . . . . . . . . . . . . . . . . . . . . . . . . . . . . . . . . . . . . . . . 13 (491) (5)
Acquisition and other . . . . . . . . . . . . . . . . . . . . . . . . . . . . . . . . . . . . . . . . . . . . . . . . . . . . . — 53 0
Fair value of plan assets at end of year . . . . . . . . . . . . . . . . . . . . . . . . . . . . . . . . . . . . . . ¥ 89,362 ¥ 84,792 $ 846
The funded status of the plans . . . . . . . . . . . . . . . . . . . . . . . . . . . . . . . . . . . . . . . . . . . . . . ¥ 39,575 ¥ 32,334 $ 322
Amount recognized in the consolidated balance sheets consists of:
Prepaid benefit cost included in prepaid expenses . . . . . . . . . . . . . . . . . . . . . . . . . . . . . . . . ¥ 42,420 ¥ 34,928 $ 348
Accrued benefit liability included in accrued expenses . . . . . . . . . . . . . . . . . . . . . . . . . . . . . (2,845) (2,594) (26)
Net amount recognized . . . . . . . . . . . . . . . . . . . . . . . . . . . . . . . . . . . . . . . . . . . . . . . . . ¥ 39,575 ¥ 32,334 $ 322
Amount recognized in accumulated other comprehensive income (loss), pre-tax, at March 31, 2007 and 2008 consisted of:
Millions ofMillions of yen U.S. dollars
2007 2008 2008
Net prior service credit . . . . . . . . . . . . . . . . . . . . . . . . . . . . . . . . . . . . . . . . . . . . . . . . . . . . . . . ¥ 13,644 ¥ 12,757 $ 127
Net actuarial loss . . . . . . . . . . . . . . . . . . . . . . . . . . . . . . . . . . . . . . . . . . . . . . . . . . . . . . . . . . . (7,067) (19,261) (192)
Net transition obligation . . . . . . . . . . . . . . . . . . . . . . . . . . . . . . . . . . . . . . . . . . . . . . . . . . . . . . (386) (382) (4)
Total recognized in accumulated other comprehensive income (loss), pre-tax . . . . . . . . . . . ¥ 6,191 ¥ (6,886) $ (69)
The estimated portions of the net prior service credit, net actuarial loss and net transition obligation above that will be recognized as a
component of net pension cost in 2009 are ¥1,208 million ($12 million), ¥724 million ($7 million) and ¥3 million ($0 million),
respectively.
The accumulated benefit obligations for all defined benefit pension plans were ¥42,145 million and ¥43,968 million ($439 million),
respectively, at March 31, 2007 and 2008.
The aggregate projected benefit obligations, aggregate accumulated benefit obligations and aggregate fair values of plan assets for
the plans with the accumulated benefit obligations in excess of plan assets were ¥5,950 million, ¥5,534 million and ¥3,105 million,
respectively, at March 31, 2007 and ¥5,475 million ($55 million), ¥5,145 million ($51 million) and ¥2,883 million ($29 million),
respectively, at March 31, 2008.
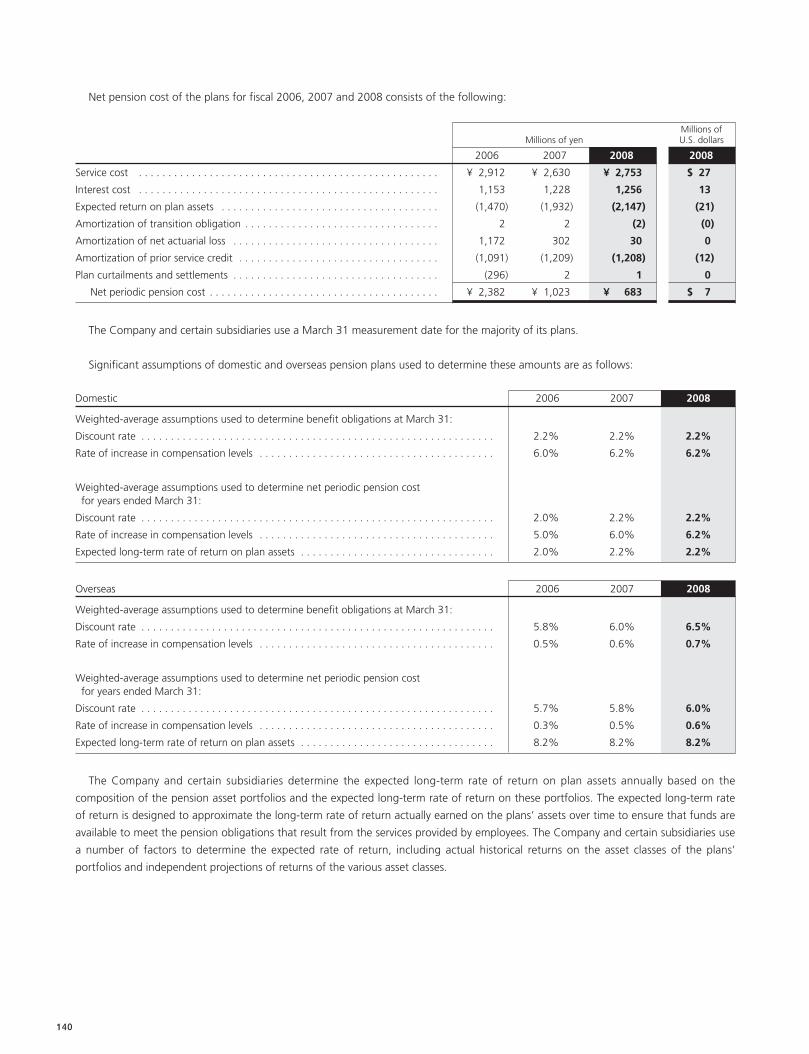
140
Net pension cost of the plans for fiscal 2006, 2007 and 2008 consists of the following:
Millions ofMillions of yen U.S. dollars
2006 2007 2008 2008
Service cost . . . . . . . . . . . . . . . . . . . . . . . . . . . . . . . . . . . . . . . . . . . . . . . . . . . ¥ 2,912 ¥ 2,630 ¥ 2,753 $ 27
Interest cost . . . . . . . . . . . . . . . . . . . . . . . . . . . . . . . . . . . . . . . . . . . . . . . . . . . 1,153 1,228 1,256 13
Expected return on plan assets . . . . . . . . . . . . . . . . . . . . . . . . . . . . . . . . . . . . . (1,470) (1,932) (2,147) (21)
Amortization of transition obligation . . . . . . . . . . . . . . . . . . . . . . . . . . . . . . . . . 2 2 (2) (0)
Amortization of net actuarial loss . . . . . . . . . . . . . . . . . . . . . . . . . . . . . . . . . . . 1,172 302 30 0
Amortization of prior service credit . . . . . . . . . . . . . . . . . . . . . . . . . . . . . . . . . . (1,091) (1,209) (1,208) (12)
Plan curtailments and settlements . . . . . . . . . . . . . . . . . . . . . . . . . . . . . . . . . . . (296) 2 1 0
Net periodic pension cost . . . . . . . . . . . . . . . . . . . . . . . . . . . . . . . . . . . . . . . ¥ 2,382 ¥ 1,023 ¥ 683 $ 7
The Company and certain subsidiaries use a March 31 measurement date for the majority of its plans.
Significant assumptions of domestic and overseas pension plans used to determine these amounts are as follows:
Domestic 2006 2007 2008
Weighted-average assumptions used to determine benefit obligations at March 31:
Discount rate . . . . . . . . . . . . . . . . . . . . . . . . . . . . . . . . . . . . . . . . . . . . . . . . . . . . . . . . . . . . 2.2% 2.2% 2.2%
Rate of increase in compensation levels . . . . . . . . . . . . . . . . . . . . . . . . . . . . . . . . . . . . . . . . 6.0% 6.2% 6.2%
Weighted-average assumptions used to determine net periodic pension cost for years ended March 31:
Discount rate . . . . . . . . . . . . . . . . . . . . . . . . . . . . . . . . . . . . . . . . . . . . . . . . . . . . . . . . . . . . 2.0% 2.2% 2.2%
Rate of increase in compensation levels . . . . . . . . . . . . . . . . . . . . . . . . . . . . . . . . . . . . . . . . 5.0% 6.0% 6.2%
Expected long-term rate of return on plan assets . . . . . . . . . . . . . . . . . . . . . . . . . . . . . . . . . 2.0% 2.2% 2.2%
Overseas 2006 2007 2008
Weighted-average assumptions used to determine benefit obligations at March 31:
Discount rate . . . . . . . . . . . . . . . . . . . . . . . . . . . . . . . . . . . . . . . . . . . . . . . . . . . . . . . . . . . . 5.8% 6.0% 6.5%
Rate of increase in compensation levels . . . . . . . . . . . . . . . . . . . . . . . . . . . . . . . . . . . . . . . . 0.5% 0.6% 0.7%
Weighted-average assumptions used to determine net periodic pension cost for years ended March 31:
Discount rate . . . . . . . . . . . . . . . . . . . . . . . . . . . . . . . . . . . . . . . . . . . . . . . . . . . . . . . . . . . . 5.7% 5.8% 6.0%
Rate of increase in compensation levels . . . . . . . . . . . . . . . . . . . . . . . . . . . . . . . . . . . . . . . . 0.3% 0.5% 0.6%
Expected long-term rate of return on plan assets . . . . . . . . . . . . . . . . . . . . . . . . . . . . . . . . . 8.2% 8.2% 8.2%
The Company and certain subsidiaries determine the expected long-term rate of return on plan assets annually based on the
composition of the pension asset portfolios and the expected long-term rate of return on these portfolios. The expected long-term rate
of return is designed to approximate the long-term rate of return actually earned on the plans’ assets over time to ensure that funds are
available to meet the pension obligations that result from the services provided by employees. The Company and certain subsidiaries use
a number of factors to determine the expected rate of return, including actual historical returns on the asset classes of the plans’
portfolios and independent projections of returns of the various asset classes.
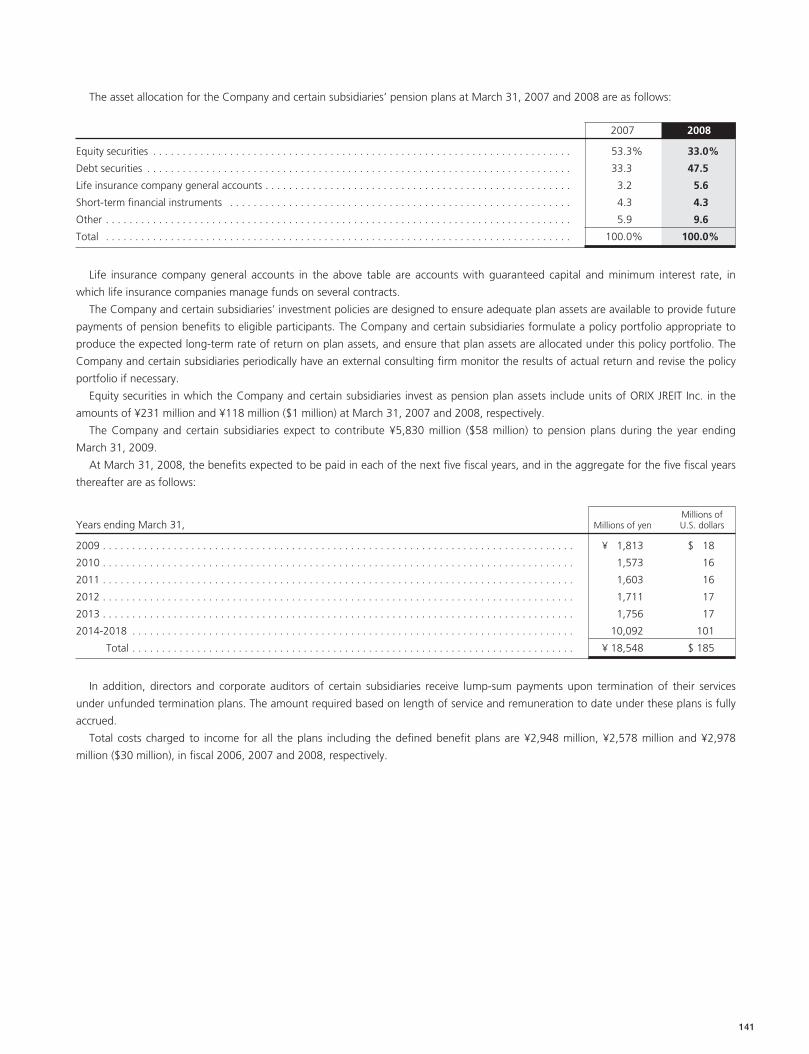
141
The asset allocation for the Company and certain subsidiaries’ pension plans at March 31, 2007 and 2008 are as follows:
2007 2008
Equity securities . . . . . . . . . . . . . . . . . . . . . . . . . . . . . . . . . . . . . . . . . . . . . . . . . . . . . . . . . . . . . . . . . . . . . . . 53.3% 33.0%
Debt securities . . . . . . . . . . . . . . . . . . . . . . . . . . . . . . . . . . . . . . . . . . . . . . . . . . . . . . . . . . . . . . . . . . . . . . . . 33.3 47.5
Life insurance company general accounts . . . . . . . . . . . . . . . . . . . . . . . . . . . . . . . . . . . . . . . . . . . . . . . . . . . . 3.2 5.6
Short-term financial instruments . . . . . . . . . . . . . . . . . . . . . . . . . . . . . . . . . . . . . . . . . . . . . . . . . . . . . . . . . . 4.3 4.3
Other . . . . . . . . . . . . . . . . . . . . . . . . . . . . . . . . . . . . . . . . . . . . . . . . . . . . . . . . . . . . . . . . . . . . . . . . . . . . . . . 5.9 9.6
Total . . . . . . . . . . . . . . . . . . . . . . . . . . . . . . . . . . . . . . . . . . . . . . . . . . . . . . . . . . . . . . . . . . . . . . . . . . . . . . . 100.0% 100.0%
Life insurance company general accounts in the above table are accounts with guaranteed capital and minimum interest rate, in
which life insurance companies manage funds on several contracts.
The Company and certain subsidiaries’ investment policies are designed to ensure adequate plan assets are available to provide future
payments of pension benefits to eligible participants. The Company and certain subsidiaries formulate a policy portfolio appropriate to
produce the expected long-term rate of return on plan assets, and ensure that plan assets are allocated under this policy portfolio. The
Company and certain subsidiaries periodically have an external consulting firm monitor the results of actual return and revise the policy
portfolio if necessary.
Equity securities in which the Company and certain subsidiaries invest as pension plan assets include units of ORIX JREIT Inc. in the
amounts of ¥231 million and ¥118 million ($1 million) at March 31, 2007 and 2008, respectively.
The Company and certain subsidiaries expect to contribute ¥5,830 million ($58 million) to pension plans during the year ending
March 31, 2009.
At March 31, 2008, the benefits expected to be paid in each of the next five fiscal years, and in the aggregate for the five fiscal years
thereafter are as follows:
Millions ofYears ending March 31, Millions of yen U.S. dollars
2009 . . . . . . . . . . . . . . . . . . . . . . . . . . . . . . . . . . . . . . . . . . . . . . . . . . . . . . . . . . . . . . . . . . . . . . . . . . . . . . . . ¥ 1,813 $ 18
2010 . . . . . . . . . . . . . . . . . . . . . . . . . . . . . . . . . . . . . . . . . . . . . . . . . . . . . . . . . . . . . . . . . . . . . . . . . . . . . . . . 1,573 16
2011 . . . . . . . . . . . . . . . . . . . . . . . . . . . . . . . . . . . . . . . . . . . . . . . . . . . . . . . . . . . . . . . . . . . . . . . . . . . . . . . . 1,603 16
2012 . . . . . . . . . . . . . . . . . . . . . . . . . . . . . . . . . . . . . . . . . . . . . . . . . . . . . . . . . . . . . . . . . . . . . . . . . . . . . . . . 1,711 17
2013 . . . . . . . . . . . . . . . . . . . . . . . . . . . . . . . . . . . . . . . . . . . . . . . . . . . . . . . . . . . . . . . . . . . . . . . . . . . . . . . . 1,756 17
2014-2018 . . . . . . . . . . . . . . . . . . . . . . . . . . . . . . . . . . . . . . . . . . . . . . . . . . . . . . . . . . . . . . . . . . . . . . . . . . . 10,092 101
Total . . . . . . . . . . . . . . . . . . . . . . . . . . . . . . . . . . . . . . . . . . . . . . . . . . . . . . . . . . . . . . . . . . . . . . . . . . . ¥ 18,548 $ 185
In addition, directors and corporate auditors of certain subsidiaries receive lump-sum payments upon termination of their services
under unfunded termination plans. The amount required based on length of service and remuneration to date under these plans is fully
accrued.
Total costs charged to income for all the plans including the defined benefit plans are ¥2,948 million, ¥2,578 million and ¥2,978
million ($30 million), in fiscal 2006, 2007 and 2008, respectively.
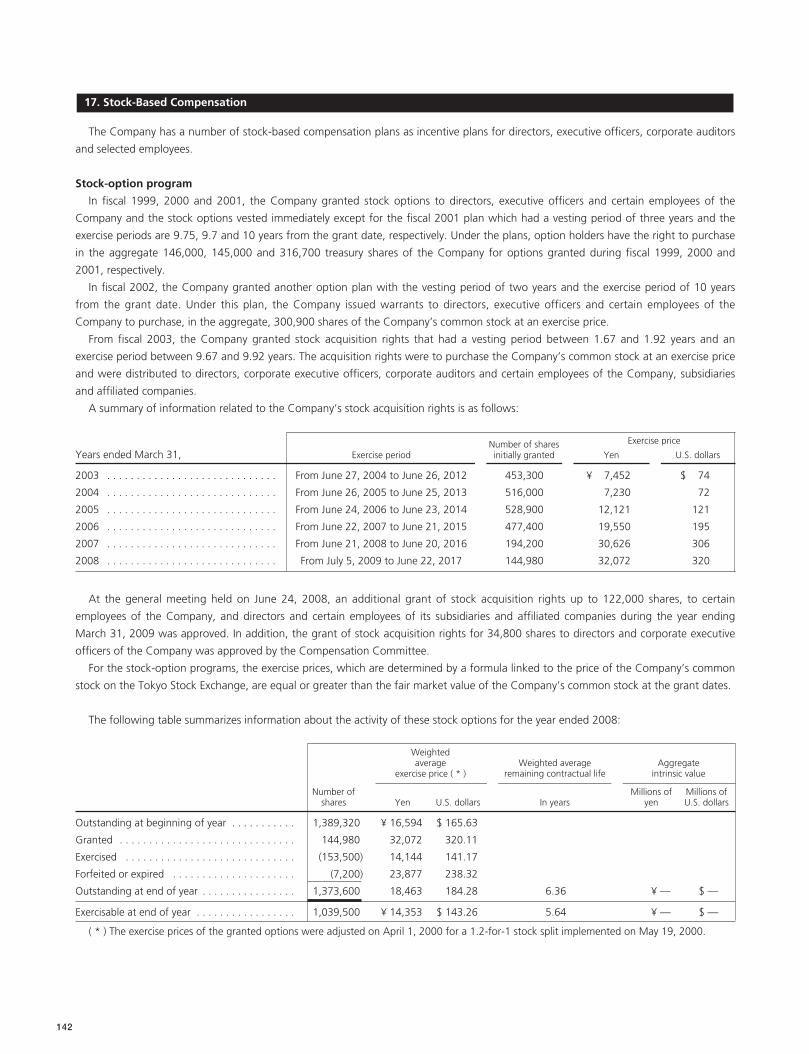
The Company has a number of stock-based compensation plans as incentive plans for directors, executive officers, corporate auditors
and selected employees.
Stock-option program
In fiscal 1999, 2000 and 2001, the Company granted stock options to directors, executive officers and certain employees of the
Company and the stock options vested immediately except for the fiscal 2001 plan which had a vesting period of three years and the
exercise periods are 9.75, 9.7 and 10 years from the grant date, respectively. Under the plans, option holders have the right to purchase
in the aggregate 146,000, 145,000 and 316,700 treasury shares of the Company for options granted during fiscal 1999, 2000 and
2001, respectively.
In fiscal 2002, the Company granted another option plan with the vesting period of two years and the exercise period of 10 years
from the grant date. Under this plan, the Company issued warrants to directors, executive officers and certain employees of the
Company to purchase, in the aggregate, 300,900 shares of the Company’s common stock at an exercise price.
From fiscal 2003, the Company granted stock acquisition rights that had a vesting period between 1.67 and 1.92 years and an
exercise period between 9.67 and 9.92 years. The acquisition rights were to purchase the Company’s common stock at an exercise price
and were distributed to directors, corporate executive officers, corporate auditors and certain employees of the Company, subsidiaries
and affiliated companies.
A summary of information related to the Company’s stock acquisition rights is as follows:
Number of shares Exercise price
Years ended March 31, Exercise period initially granted Yen U.S. dollars
2003 . . . . . . . . . . . . . . . . . . . . . . . . . . . . . From June 27, 2004 to June 26, 2012 453,300 ¥ 7,452 $ 74
2004 . . . . . . . . . . . . . . . . . . . . . . . . . . . . . From June 26, 2005 to June 25, 2013 516,000 7,230 72
2005 . . . . . . . . . . . . . . . . . . . . . . . . . . . . . From June 24, 2006 to June 23, 2014 528,900 12,121 121
2006 . . . . . . . . . . . . . . . . . . . . . . . . . . . . . From June 22, 2007 to June 21, 2015 477,400 19,550 195
2007 . . . . . . . . . . . . . . . . . . . . . . . . . . . . . From June 21, 2008 to June 20, 2016 194,200 30,626 306
2008 . . . . . . . . . . . . . . . . . . . . . . . . . . . . . From July 5, 2009 to June 22, 2017 144,980 32,072 320
At the general meeting held on June 24, 2008, an additional grant of stock acquisition rights up to 122,000 shares, to certain
employees of the Company, and directors and certain employees of its subsidiaries and affiliated companies during the year ending
March 31, 2009 was approved. In addition, the grant of stock acquisition rights for 34,800 shares to directors and corporate executive
officers of the Company was approved by the Compensation Committee.
For the stock-option programs, the exercise prices, which are determined by a formula linked to the price of the Company’s common
stock on the Tokyo Stock Exchange, are equal or greater than the fair market value of the Company’s common stock at the grant dates.
The following table summarizes information about the activity of these stock options for the year ended 2008:
Weightedaverage Weighted average Aggregate
exercise price ( * ) remaining contractual life intrinsic value
Number of Millions of Millions of shares Yen U.S. dollars In years yen U.S. dollars
Outstanding at beginning of year . . . . . . . . . . . 1,389,320 ¥ 16,594 $ 165.63
Granted . . . . . . . . . . . . . . . . . . . . . . . . . . . . . . 144,980 32,072 320.11
Exercised . . . . . . . . . . . . . . . . . . . . . . . . . . . . . (153,500) 14,144 141.17
Forfeited or expired . . . . . . . . . . . . . . . . . . . . . (7,200) 23,877 238.32
Outstanding at end of year . . . . . . . . . . . . . . . . 1,373,600 18,463 184.28 6.36 ¥ — $ —
Exercisable at end of year . . . . . . . . . . . . . . . . . 1,039,500 ¥ 14,353 $ 143.26 5.64 ¥ — $ —
( * ) The exercise prices of the granted options were adjusted on April 1, 2000 for a 1.2-for-1 stock split implemented on May 19, 2000.
17. Stock-Based Compensation
142
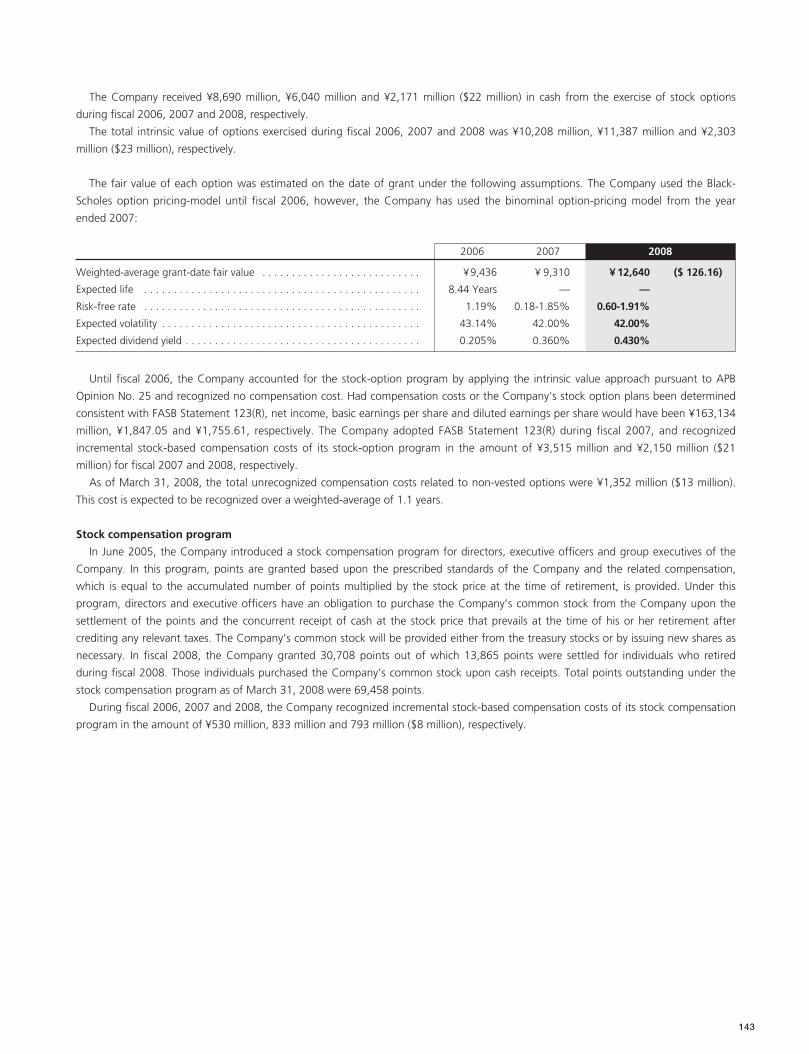
143
The Company received ¥8,690 million, ¥6,040 million and ¥2,171 million ($22 million) in cash from the exercise of stock options
during fiscal 2006, 2007 and 2008, respectively.
The total intrinsic value of options exercised during fiscal 2006, 2007 and 2008 was ¥10,208 million, ¥11,387 million and ¥2,303
million ($23 million), respectively.
The fair value of each option was estimated on the date of grant under the following assumptions. The Company used the Black-
Scholes option pricing-model until fiscal 2006, however, the Company has used the binominal option-pricing model from the year
ended 2007:
2006 2007 2008
Weighted-average grant-date fair value . . . . . . . . . . . . . . . . . . . . . . . . . . . ¥9,436 ¥ 9,310 ¥ 12,640 ($ 126.16)
Expected life . . . . . . . . . . . . . . . . . . . . . . . . . . . . . . . . . . . . . . . . . . . . . . . 8.44 Years — —
Risk-free rate . . . . . . . . . . . . . . . . . . . . . . . . . . . . . . . . . . . . . . . . . . . . . . . 1.19% 0.18-1.85% 0.60-1.91%
Expected volatility . . . . . . . . . . . . . . . . . . . . . . . . . . . . . . . . . . . . . . . . . . . . 43.14% 42.00% 42.00%
Expected dividend yield . . . . . . . . . . . . . . . . . . . . . . . . . . . . . . . . . . . . . . . . 0.205% 0.360% 0.430%
Until fiscal 2006, the Company accounted for the stock-option program by applying the intrinsic value approach pursuant to APB
Opinion No. 25 and recognized no compensation cost. Had compensation costs or the Company’s stock option plans been determined
consistent with FASB Statement 123(R), net income, basic earnings per share and diluted earnings per share would have been ¥163,134
million, ¥1,847.05 and ¥1,755.61, respectively. The Company adopted FASB Statement 123(R) during fiscal 2007, and recognized
incremental stock-based compensation costs of its stock-option program in the amount of ¥3,515 million and ¥2,150 million ($21
million) for fiscal 2007 and 2008, respectively.
As of March 31, 2008, the total unrecognized compensation costs related to non-vested options were ¥1,352 million ($13 million).
This cost is expected to be recognized over a weighted-average of 1.1 years.
Stock compensation program
In June 2005, the Company introduced a stock compensation program for directors, executive officers and group executives of the
Company. In this program, points are granted based upon the prescribed standards of the Company and the related compensation,
which is equal to the accumulated number of points multiplied by the stock price at the time of retirement, is provided. Under this
program, directors and executive officers have an obligation to purchase the Company’s common stock from the Company upon the
settlement of the points and the concurrent receipt of cash at the stock price that prevails at the time of his or her retirement after
crediting any relevant taxes. The Company’s common stock will be provided either from the treasury stocks or by issuing new shares as
necessary. In fiscal 2008, the Company granted 30,708 points out of which 13,865 points were settled for individuals who retired
during fiscal 2008. Those individuals purchased the Company’s common stock upon cash receipts. Total points outstanding under the
stock compensation program as of March 31, 2008 were 69,458 points.
During fiscal 2006, 2007 and 2008, the Company recognized incremental stock-based compensation costs of its stock compensation
program in the amount of ¥530 million, 833 million and 793 million ($8 million), respectively.
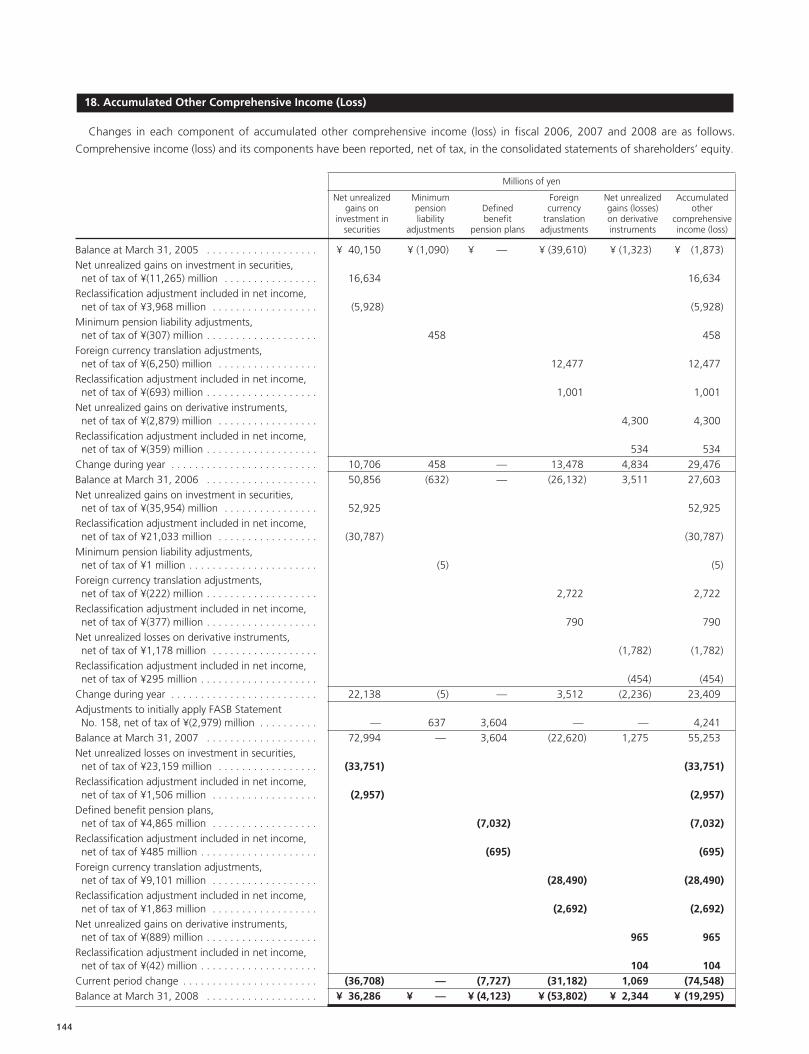
Changes in each component of accumulated other comprehensive income (loss) in fiscal 2006, 2007 and 2008 are as follows.
Comprehensive income (loss) and its components have been reported, net of tax, in the consolidated statements of shareholders’ equity.
Millions of yen
Net unrealized Minimum Foreign Net unrealized Accumulatedgains on pension Defined currency gains (losses) other
investment in liability benefit translation on derivative comprehensivesecurities adjustments pension plans adjustments instruments income (loss)
Balance at March 31, 2005 . . . . . . . . . . . . . . . . . . . ¥ 40,150 ¥ (1,090) ¥ — ¥ (39,610) ¥ (1,323) ¥ (1,873)Net unrealized gains on investment in securities, net of tax of ¥(11,265) million . . . . . . . . . . . . . . . . 16,634 16,634
Reclassification adjustment included in net income, net of tax of ¥3,968 million . . . . . . . . . . . . . . . . . . (5,928) (5,928)
Minimum pension liability adjustments, net of tax of ¥(307) million . . . . . . . . . . . . . . . . . . . 458 458
Foreign currency translation adjustments, net of tax of ¥(6,250) million . . . . . . . . . . . . . . . . . 12,477 12,477
Reclassification adjustment included in net income, net of tax of ¥(693) million . . . . . . . . . . . . . . . . . . . 1,001 1,001
Net unrealized gains on derivative instruments, net of tax of ¥(2,879) million . . . . . . . . . . . . . . . . . 4,300 4,300
Reclassification adjustment included in net income, net of tax of ¥(359) million . . . . . . . . . . . . . . . . . . . 534 534
Change during year . . . . . . . . . . . . . . . . . . . . . . . . . 10,706 458 — 13,478 4,834 29,476Balance at March 31, 2006 . . . . . . . . . . . . . . . . . . . 50,856 (632) — (26,132) 3,511 27,603Net unrealized gains on investment in securities, net of tax of ¥(35,954) million . . . . . . . . . . . . . . . . 52,925 52,925
Reclassification adjustment included in net income, net of tax of ¥21,033 million . . . . . . . . . . . . . . . . . (30,787) (30,787)
Minimum pension liability adjustments, net of tax of ¥1 million . . . . . . . . . . . . . . . . . . . . . . (5) (5)
Foreign currency translation adjustments, net of tax of ¥(222) million . . . . . . . . . . . . . . . . . . . 2,722 2,722
Reclassification adjustment included in net income, net of tax of ¥(377) million . . . . . . . . . . . . . . . . . . . 790 790
Net unrealized losses on derivative instruments, net of tax of ¥1,178 million . . . . . . . . . . . . . . . . . . (1,782) (1,782)
Reclassification adjustment included in net income, net of tax of ¥295 million . . . . . . . . . . . . . . . . . . . . (454) (454)
Change during year . . . . . . . . . . . . . . . . . . . . . . . . . 22,138 (5) — 3,512 (2,236) 23,409Adjustments to initially apply FASB Statement No. 158, net of tax of ¥(2,979) million . . . . . . . . . . — 637 3,604 — — 4,241
Balance at March 31, 2007 . . . . . . . . . . . . . . . . . . . 72,994 — 3,604 (22,620) 1,275 55,253Net unrealized losses on investment in securities, net of tax of ¥23,159 million . . . . . . . . . . . . . . . . . (33,751) (33,751)
Reclassification adjustment included in net income, net of tax of ¥1,506 million . . . . . . . . . . . . . . . . . . (2,957) (2,957)
Defined benefit pension plans, net of tax of ¥4,865 million . . . . . . . . . . . . . . . . . . (7,032) (7,032)
Reclassification adjustment included in net income, net of tax of ¥485 million . . . . . . . . . . . . . . . . . . . . (695) (695)
Foreign currency translation adjustments, net of tax of ¥9,101 million . . . . . . . . . . . . . . . . . . (28,490) (28,490)
Reclassification adjustment included in net income, net of tax of ¥1,863 million . . . . . . . . . . . . . . . . . . (2,692) (2,692)
Net unrealized gains on derivative instruments, net of tax of ¥(889) million . . . . . . . . . . . . . . . . . . . 965 965
Reclassification adjustment included in net income, net of tax of ¥(42) million . . . . . . . . . . . . . . . . . . . . 104 104
Current period change . . . . . . . . . . . . . . . . . . . . . . . (36,708) — (7,727) (31,182) 1,069 (74,548)Balance at March 31, 2008 . . . . . . . . . . . . . . . . . . . ¥ 36,286 ¥ — ¥ (4,123) ¥ (53,802) ¥ 2,344 ¥ (19,295)
18. Accumulated Other Comprehensive Income (Loss)
144
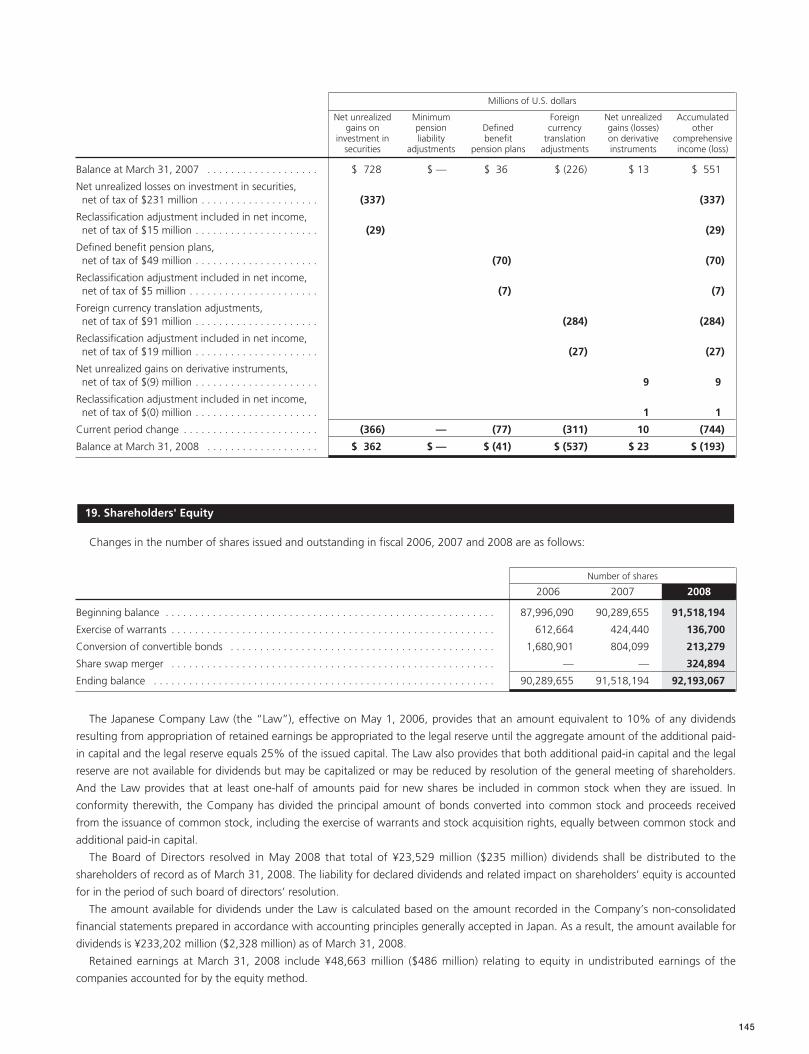
145
Millions of U.S. dollars
Net unrealized Minimum Foreign Net unrealized Accumulatedgains on pension Defined currency gains (losses) other
investment in liability benefit translation on derivative comprehensivesecurities adjustments pension plans adjustments instruments income (loss)
Balance at March 31, 2007 . . . . . . . . . . . . . . . . . . . $ 728 $ — $ 36 $ (226) $ 13 $ 551
Net unrealized losses on investment in securities, net of tax of $231 million . . . . . . . . . . . . . . . . . . . . (337) (337)
Reclassification adjustment included in net income, net of tax of $15 million . . . . . . . . . . . . . . . . . . . . . (29) (29)
Defined benefit pension plans, net of tax of $49 million . . . . . . . . . . . . . . . . . . . . . (70) (70)
Reclassification adjustment included in net income, net of tax of $5 million . . . . . . . . . . . . . . . . . . . . . . (7) (7)
Foreign currency translation adjustments, net of tax of $91 million . . . . . . . . . . . . . . . . . . . . . (284) (284)
Reclassification adjustment included in net income, net of tax of $19 million . . . . . . . . . . . . . . . . . . . . . (27) (27)
Net unrealized gains on derivative instruments, net of tax of $(9) million . . . . . . . . . . . . . . . . . . . . . 9 9
Reclassification adjustment included in net income, net of tax of $(0) million . . . . . . . . . . . . . . . . . . . . . 1 1
Current period change . . . . . . . . . . . . . . . . . . . . . . . (366) — (77) (311) 10 (744)
Balance at March 31, 2008 . . . . . . . . . . . . . . . . . . . $ 362 $ — $ (41) $ (537) $ 23 $ (193)
Changes in the number of shares issued and outstanding in fiscal 2006, 2007 and 2008 are as follows:
Number of shares
2006 2007 2008
Beginning balance . . . . . . . . . . . . . . . . . . . . . . . . . . . . . . . . . . . . . . . . . . . . . . . . . . . . . . . . 87,996,090 90,289,655 91,518,194
Exercise of warrants . . . . . . . . . . . . . . . . . . . . . . . . . . . . . . . . . . . . . . . . . . . . . . . . . . . . . . . 612,664 424,440 136,700
Conversion of convertible bonds . . . . . . . . . . . . . . . . . . . . . . . . . . . . . . . . . . . . . . . . . . . . . 1,680,901 804,099 213,279
Share swap merger . . . . . . . . . . . . . . . . . . . . . . . . . . . . . . . . . . . . . . . . . . . . . . . . . . . . . . . — — 324,894
Ending balance . . . . . . . . . . . . . . . . . . . . . . . . . . . . . . . . . . . . . . . . . . . . . . . . . . . . . . . . . . 90,289,655 91,518,194 92,193,067
The Japanese Company Law (the “Law”), effective on May 1, 2006, provides that an amount equivalent to 10% of any dividends
resulting from appropriation of retained earnings be appropriated to the legal reserve until the aggregate amount of the additional paid-
in capital and the legal reserve equals 25% of the issued capital. The Law also provides that both additional paid-in capital and the legal
reserve are not available for dividends but may be capitalized or may be reduced by resolution of the general meeting of shareholders.
And the Law provides that at least one-half of amounts paid for new shares be included in common stock when they are issued. In
conformity therewith, the Company has divided the principal amount of bonds converted into common stock and proceeds received
from the issuance of common stock, including the exercise of warrants and stock acquisition rights, equally between common stock and
additional paid-in capital.
The Board of Directors resolved in May 2008 that total of ¥23,529 million ($235 million) dividends shall be distributed to the
shareholders of record as of March 31, 2008. The liability for declared dividends and related impact on shareholders’ equity is accounted
for in the period of such board of directors’ resolution.
The amount available for dividends under the Law is calculated based on the amount recorded in the Company’s non-consolidated
financial statements prepared in accordance with accounting principles generally accepted in Japan. As a result, the amount available for
dividends is ¥233,202 million ($2,328 million) as of March 31, 2008.
Retained earnings at March 31, 2008 include ¥48,663 million ($486 million) relating to equity in undistributed earnings of the
companies accounted for by the equity method.
19. Shareholders' Equity
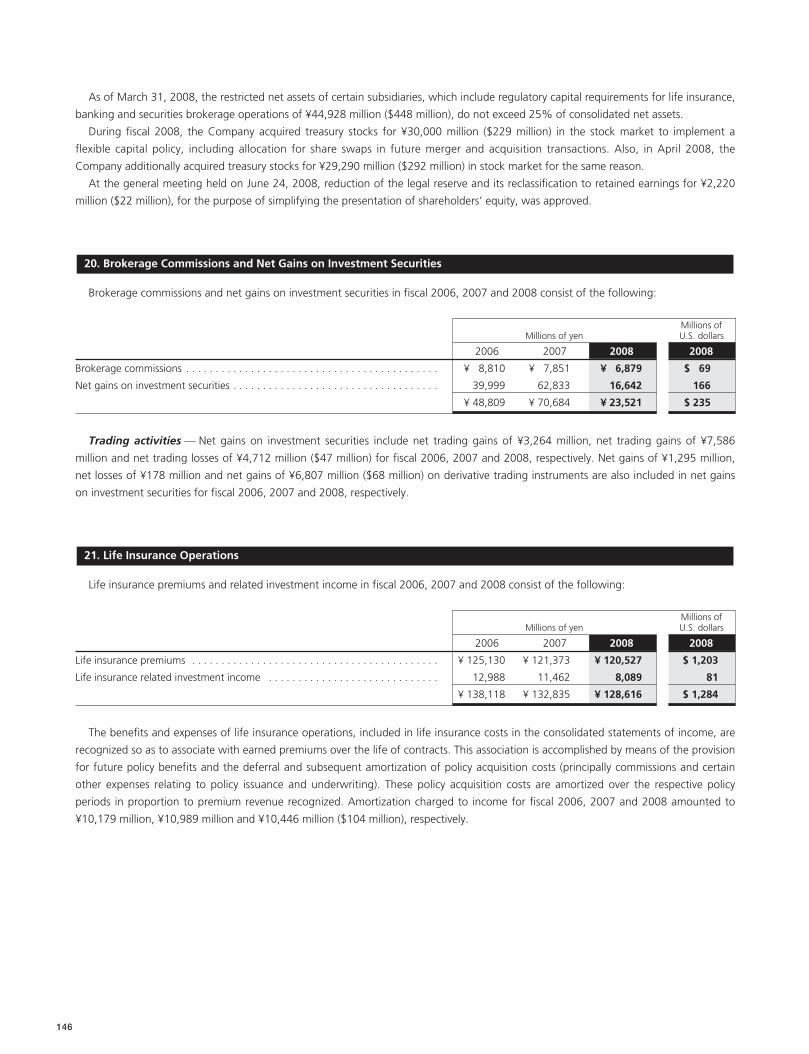
As of March 31, 2008, the restricted net assets of certain subsidiaries, which include regulatory capital requirements for life insurance,
banking and securities brokerage operations of ¥44,928 million ($448 million), do not exceed 25% of consolidated net assets.
During fiscal 2008, the Company acquired treasury stocks for ¥30,000 million ($229 million) in the stock market to implement a
flexible capital policy, including allocation for share swaps in future merger and acquisition transactions. Also, in April 2008, the
Company additionally acquired treasury stocks for ¥29,290 million ($292 million) in stock market for the same reason.
At the general meeting held on June 24, 2008, reduction of the legal reserve and its reclassification to retained earnings for ¥2,220
million ($22 million), for the purpose of simplifying the presentation of shareholders’ equity, was approved.
Brokerage commissions and net gains on investment securities in fiscal 2006, 2007 and 2008 consist of the following:
Millions ofMillions of yen U.S. dollars
2006 2007 2008 2008
Brokerage commissions . . . . . . . . . . . . . . . . . . . . . . . . . . . . . . . . . . . . . . . . . . . ¥ 8,810 ¥ 7,851 ¥ 6,879 $ 69
Net gains on investment securities . . . . . . . . . . . . . . . . . . . . . . . . . . . . . . . . . . . 39,999 62,833 16,642 166
. . . . . . . . . . . . . . . . . . . . . . . . . . . . . . . . . . . . . . . . . . . . . . . . . . . ¥ 48,809 ¥ 70,684 ¥ 23,521 $ 235
Trading activities — Net gains on investment securities include net trading gains of ¥3,264 million, net trading gains of ¥7,586
million and net trading losses of ¥4,712 million ($47 million) for fiscal 2006, 2007 and 2008, respectively. Net gains of ¥1,295 million,
net losses of ¥178 million and net gains of ¥6,807 million ($68 million) on derivative trading instruments are also included in net gains
on investment securities for fiscal 2006, 2007 and 2008, respectively.
Life insurance premiums and related investment income in fiscal 2006, 2007 and 2008 consist of the following:
Millions ofMillions of yen U.S. dollars
2006 2007 2008 2008
Life insurance premiums . . . . . . . . . . . . . . . . . . . . . . . . . . . . . . . . . . . . . . . . . . ¥ 125,130 ¥ 121,373 ¥ 120,527 $ 1,203
Life insurance related investment income . . . . . . . . . . . . . . . . . . . . . . . . . . . . . 12,988 11,462 8,089 81
. . . . . . . . . . . . . . . . . . . . . . . . . . . . . . . . . . . . . . . . . . . . . . . . . . . ¥ 138,118 ¥ 132,835 ¥ 128,616 $ 1,284
The benefits and expenses of life insurance operations, included in life insurance costs in the consolidated statements of income, are
recognized so as to associate with earned premiums over the life of contracts. This association is accomplished by means of the provision
for future policy benefits and the deferral and subsequent amortization of policy acquisition costs (principally commissions and certain
other expenses relating to policy issuance and underwriting). These policy acquisition costs are amortized over the respective policy
periods in proportion to premium revenue recognized. Amortization charged to income for fiscal 2006, 2007 and 2008 amounted to
¥10,179 million, ¥10,989 million and ¥10,446 million ($104 million), respectively.
21. Life Insurance Operations
20. Brokerage Commissions and Net Gains on Investment Securities
146
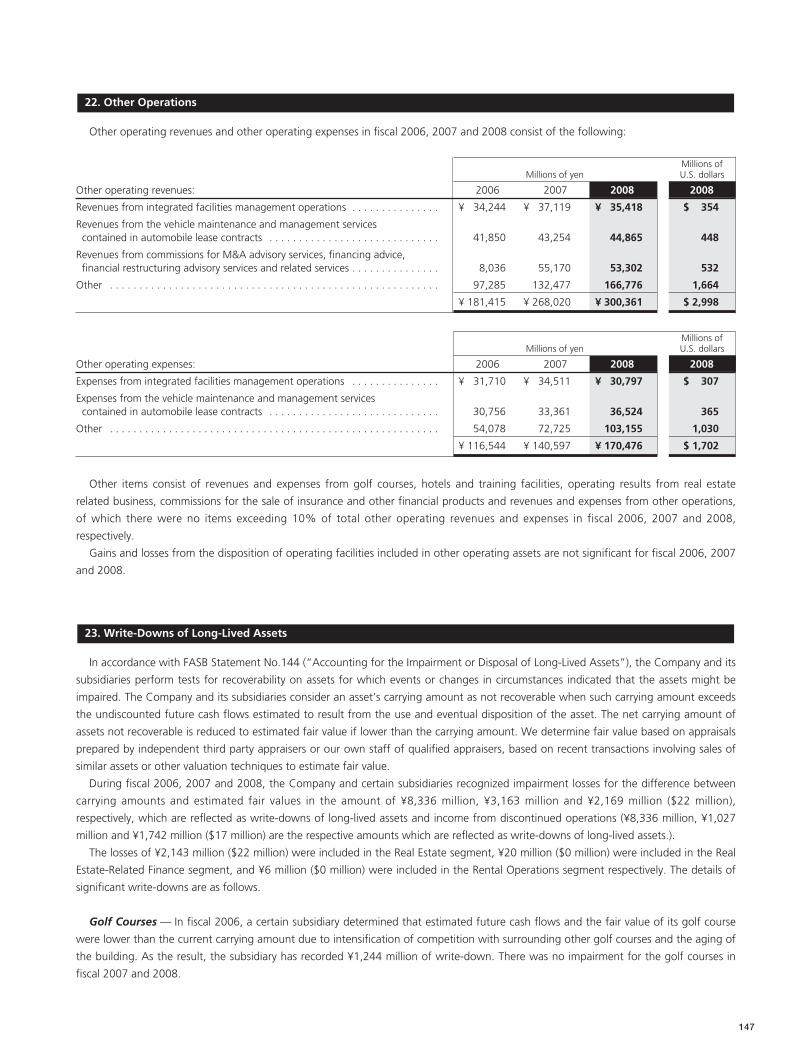
147
Other operating revenues and other operating expenses in fiscal 2006, 2007 and 2008 consist of the following:
Millions ofMillions of yen U.S. dollars
Other operating revenues: 2006 2007 2008 2008
Revenues from integrated facilities management operations . . . . . . . . . . . . . . . ¥ 34,244 ¥ 37,119 ¥ 35,418 $ 354
Revenues from the vehicle maintenance and management services contained in automobile lease contracts . . . . . . . . . . . . . . . . . . . . . . . . . . . . . 41,850 43,254 44,865 448
Revenues from commissions for M&A advisory services, financing advice, financial restructuring advisory services and related services . . . . . . . . . . . . . . . 8,036 55,170 53,302 532
Other . . . . . . . . . . . . . . . . . . . . . . . . . . . . . . . . . . . . . . . . . . . . . . . . . . . . . . . . 97,285 132,477 166,776 1,664
. . . . . . . . . . . . . . . . . . . . . . . . . . . . . . . . . . . . . . . . . . . . . . . . . . . . . . . . . . ¥ 181,415 ¥ 268,020 ¥ 300,361 $ 2,998
Millions ofMillions of yen U.S. dollars
Other operating expenses: 2006 2007 2008 2008
Expenses from integrated facilities management operations . . . . . . . . . . . . . . . ¥ 31,710 ¥ 34,511 ¥ 30,797 $ 307
Expenses from the vehicle maintenance and management services contained in automobile lease contracts . . . . . . . . . . . . . . . . . . . . . . . . . . . . . 30,756 33,361 36,524 365
Other . . . . . . . . . . . . . . . . . . . . . . . . . . . . . . . . . . . . . . . . . . . . . . . . . . . . . . . . 54,078 72,725 103,155 1,030
. . . . . . . . . . . . . . . . . . . . . . . . . . . . . . . . . . . . . . . . . . . . . . . . . . . . . . . . . . ¥ 116,544 ¥ 140,597 ¥ 170,476 $ 1,702
Other items consist of revenues and expenses from golf courses, hotels and training facilities, operating results from real estate
related business, commissions for the sale of insurance and other financial products and revenues and expenses from other operations,
of which there were no items exceeding 10% of total other operating revenues and expenses in fiscal 2006, 2007 and 2008,
respectively.
Gains and losses from the disposition of operating facilities included in other operating assets are not significant for fiscal 2006, 2007
and 2008.
In accordance with FASB Statement No.144 (“Accounting for the Impairment or Disposal of Long-Lived Assets”), the Company and its
subsidiaries perform tests for recoverability on assets for which events or changes in circumstances indicated that the assets might be
impaired. The Company and its subsidiaries consider an asset’s carrying amount as not recoverable when such carrying amount exceeds
the undiscounted future cash flows estimated to result from the use and eventual disposition of the asset. The net carrying amount of
assets not recoverable is reduced to estimated fair value if lower than the carrying amount. We determine fair value based on appraisals
prepared by independent third party appraisers or our own staff of qualified appraisers, based on recent transactions involving sales of
similar assets or other valuation techniques to estimate fair value.
During fiscal 2006, 2007 and 2008, the Company and certain subsidiaries recognized impairment losses for the difference between
carrying amounts and estimated fair values in the amount of ¥8,336 million, ¥3,163 million and ¥2,169 million ($22 million),
respectively, which are reflected as write-downs of long-lived assets and income from discontinued operations (¥8,336 million, ¥1,027
million and ¥1,742 million ($17 million) are the respective amounts which are reflected as write-downs of long-lived assets.).
The losses of ¥2,143 million ($22 million) were included in the Real Estate segment, ¥20 million ($0 million) were included in the Real
Estate-Related Finance segment, and ¥6 million ($0 million) were included in the Rental Operations segment respectively. The details of
significant write-downs are as follows.
Golf Courses — In fiscal 2006, a certain subsidiary determined that estimated future cash flows and the fair value of its golf course
were lower than the current carrying amount due to intensification of competition with surrounding other golf courses and the aging of
the building. As the result, the subsidiary has recorded ¥1,244 million of write-down. There was no impairment for the golf courses in
fiscal 2007 and 2008.
23. Write-Downs of Long-Lived Assets
22. Other Operations
Corporate Dormitories — The Company and a subsidiary are engaged in the business to lease corporate dormitory buildings in
Japan. During fiscal 2006, the Company wrote down by ¥504 million for two dormitories to be disposed of by sale. During fiscal 2007,
the Company and a subsidiary wrote down by ¥1,558 million the carrying amounts of nine dormitories to be disposed of by sale, and
one dormitory where cash flows had been decreased due to the deterioration in the occupancy rate. During fiscal 2008, the Company
and a subsidiary have written down by ¥588 million ($6 million) the carrying amounts of two dormitories to be disposed of by sale, and
one dormitory where cash flows have been decreased.
Office Buildings — During fiscal 2006, ¥5,038 million of write-down was recorded for an office building reclassified and reassessed
as rental facilities from office facilities, in line with the centralization of group companies to another headquarters building. During fiscal
2007, a subsidiary recorded impairment losses of ¥150 million for an office building with negative cash flows that were not anticipated
to be temporary. There was no impairment for the office buildings in fiscal 2008.
Hotel Properties and Commercial Buildings — During fiscal 2006, ¥356 million of write-down was recorded for an aged
commercial building. During fiscal 2007, certain subsidiaries have recorded ¥391 million in total for two hotel properties that
experienced deterioration in cash flows. There was no impairment for the hotel properties and commercial buildings in fiscal 2008.
Condominiums — During fiscal 2006 and 2007, ¥115 million of write-downs for approximately 20 units and ¥33 million of write-
downs for 15 units were recorded, respectively, due to the decline in cash flow by each unit. There was no impairment for the
condominiums in fiscal 2008.
Others — During fiscal 2006, 2007 and 2008, the Company and certain subsidiaries recognized ¥1,079 million, ¥1,031 million and
¥1,581 million ($16 million) of write-downs, respectively, for other long-lived assets including developed and undeveloped land.
FASB Statement No.144 (“Accounting for the Impairment or Disposal of Long-Lived Assets”) requires that the Company and its
subsidiaries reclassify the operations sold or to be disposed of by sale to discontinued operations, without significant continuing
involvement in the operations. Under this Statement, the Company and its subsidiaries report the gains on sales and the results of these
operations of the subsidiaries, the business units, and certain properties, which have been sold or to be disposed of by sale, as income
from discontinued operations in the accompanying consolidated statements of income. Revenues and expenses generated by the
operations of the subsidiaries, the business units and these properties recognized in fiscal 2006 and 2007 have also been reclassified as
income from discontinued operations in each year in the accompanying consolidated statements of income.
The Company and its subsidiaries sold subsidiaries and business units, which mainly consisted of a subsidiary in Japan held for
undertaking corporate rehabilitation business and a commercial mortgage servicing business in the Americas in fiscal 2006 and sold
subsidiaries and a business unit, which mainly consisted of subsidiaries in Japan held for undertaking corporate rehabilitation business
and a finance business of a subsidiary in Oceania in fiscal 2007. As the result of the sales, the Company and its subsidiaries earned
¥10,533 million and ¥5,666 million of aggregated gains on the sales of the subsidiaries and the business units in total, in fiscal 2006 and
2007, respectively. The Company has begun the liquidation procedure for a subsidiary in Europe in fiscal 2008. In addition, the
Company determined to dispose by sale a subsidiary in Japan without significant continuing involvement in the subsidiary. The related
assets and liabilities mainly include other receivables of ¥2,527 million ($25 million), inventories of ¥2,195 million ($22 million) and trade
notes, account payables and other liabilities of ¥2,437 million ($24 million) in the accompanying consolidated balance sheets at March
31, 2008. The Company concluded a contract to sale the subsidiary in Japan on April 25, 2008.
The Company and its subsidiaries own various real estate properties, including commercial and office buildings, for rental operations.
In fiscal 2006, 2007 and 2008, the Company and its subsidiaries earned ¥13,618 million, ¥10,999 million and ¥42,148 million ($421
million) of aggregated gains on such real estate properties, respectively. In addition, the Company and its subsidiaries determined to
dispose by sale properties for rental without significant continuing involvement in those properties of ¥12,529 million and ¥28,048
million ($280 million) which are mainly included in investment in operating leases in the accompanying consolidated balance sheets at
March 31, 2007 and 2008.
24. Discontinued Operations
148
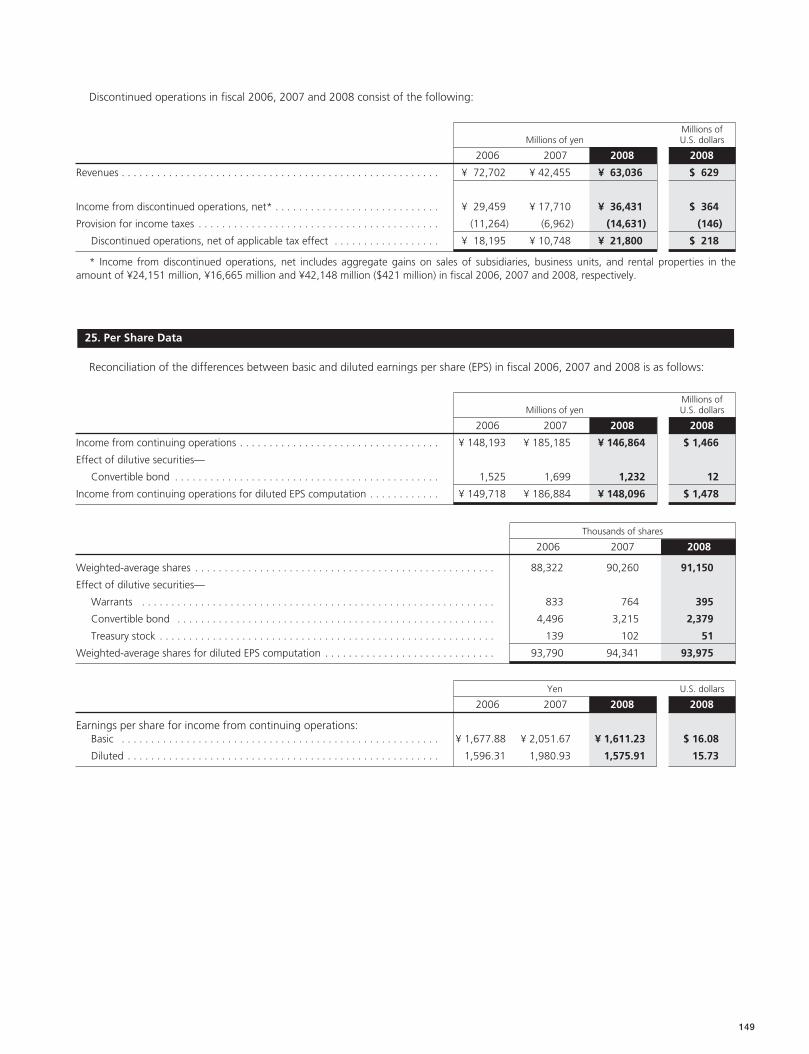
149
Discontinued operations in fiscal 2006, 2007 and 2008 consist of the following:
Millions ofMillions of yen U.S. dollars
2006 2007 2008 2008
Revenues . . . . . . . . . . . . . . . . . . . . . . . . . . . . . . . . . . . . . . . . . . . . . . . . . . . . . . ¥ 72,702 ¥ 42,455 ¥ 63,036 $ 629
Income from discontinued operations, net* . . . . . . . . . . . . . . . . . . . . . . . . . . . . ¥ 29,459 ¥ 17,710 ¥ 36,431 $ 364
Provision for income taxes . . . . . . . . . . . . . . . . . . . . . . . . . . . . . . . . . . . . . . . . . (11,264) (6,962) (14,631) (146)
Discontinued operations, net of applicable tax effect . . . . . . . . . . . . . . . . . . ¥ 18,195 ¥ 10,748 ¥ 21,800 $ 218
* Income from discontinued operations, net includes aggregate gains on sales of subsidiaries, business units, and rental properties in theamount of ¥24,151 million, ¥16,665 million and ¥42,148 million ($421 million) in fiscal 2006, 2007 and 2008, respectively.
Reconciliation of the differences between basic and diluted earnings per share (EPS) in fiscal 2006, 2007 and 2008 is as follows:
Millions ofMillions of yen U.S. dollars
2006 2007 2008 2008
Income from continuing operations . . . . . . . . . . . . . . . . . . . . . . . . . . . . . . . . . . ¥ 148,193 ¥ 185,185 ¥ 146,864 $ 1,466
Effect of dilutive securities—
Convertible bond . . . . . . . . . . . . . . . . . . . . . . . . . . . . . . . . . . . . . . . . . . . . . 1,525 1,699 1,232 12
Income from continuing operations for diluted EPS computation . . . . . . . . . . . . ¥ 149,718 ¥ 186,884 ¥ 148,096 $ 1,478
Thousands of shares
2006 2007 2008
Weighted-average shares . . . . . . . . . . . . . . . . . . . . . . . . . . . . . . . . . . . . . . . . . . . . . . . . . . . 88,322 90,260 91,150
Effect of dilutive securities—
Warrants . . . . . . . . . . . . . . . . . . . . . . . . . . . . . . . . . . . . . . . . . . . . . . . . . . . . . . . . . . . . 833 764 395
Convertible bond . . . . . . . . . . . . . . . . . . . . . . . . . . . . . . . . . . . . . . . . . . . . . . . . . . . . . . 4,496 3,215 2,379
Treasury stock . . . . . . . . . . . . . . . . . . . . . . . . . . . . . . . . . . . . . . . . . . . . . . . . . . . . . . . . . 139 102 51
Weighted-average shares for diluted EPS computation . . . . . . . . . . . . . . . . . . . . . . . . . . . . . 93,790 94,341 93,975
Yen U.S. dollars
2006 2007 2008 2008
Earnings per share for income from continuing operations:Basic . . . . . . . . . . . . . . . . . . . . . . . . . . . . . . . . . . . . . . . . . . . . . . . . . . . . . . ¥ 1,677.88 ¥ 2,051.67 ¥ 1,611.23 $ 16.08
Diluted . . . . . . . . . . . . . . . . . . . . . . . . . . . . . . . . . . . . . . . . . . . . . . . . . . . . . 1,596.31 1,980.93 1,575.91 15.73
25. Per Share Data
(a) Risk management policy
The Company and its subsidiaries manage interest rate risk through asset liability management systems. The Company and its
subsidiaries use derivative financial instruments to hedge interest rate risk and avoid changes in interest rates having a significant adverse
effect. As a result of interest rate changes, the fair value and/or cash flow of interest sensitive assets and liabilities will fluctuate.
However, such fluctuation will generally be offset by using derivative financial instruments as hedging instruments. Derivative financial
instruments that the Company and its subsidiaries use as part of the interest risk management include interest rate swaps and interest
rate caps.
The Company and its subsidiaries employ foreign currency borrowings, foreign exchange forward contracts, and foreign currency
swap agreements to hedge risks that are associated with certain transactions and investments denominated in foreign currencies due to
the potential for changes in exchange rates. Similarly, in general, overseas subsidiaries structure their liabilities to match the currency-
denomination of assets in each region.
By using derivative instruments, the Company and its subsidiaries are exposed to credit risk in the event of nonperformance by
counterparties. The Company and its subsidiaries attempt to manage the credit risk by carefully evaluating the quality of counterparties
in advance and regularly monitoring regarding the amount of notional principal, fair value, type of transaction and other factors
pertaining to each counterparty.
(b) Cash flow hedges
The Company and its subsidiaries designate interest rate swap agreements, foreign currency swap agreements and foreign exchange
forward contracts as cash flow hedges for variability of cash flows originating from floating rate borrowings and forecasted transactions.
The interest rate swap agreements outstanding as of March 31, 2008 mature at various dates through 2020. Net gains (losses) before
deducting applicable taxes on derivative contracts were reclassified from accumulated other comprehensive income (loss) into earnings
through other operating expenses and other operating revenues. The amounts of these net losses after deducting applicable taxes were
net gains (losses) of ¥534 million, net gains of ¥454 million and net losses of ¥104 million ($1 million) during fiscal 2006, 2007 and
2008, respectively. Net losses of ¥13 million, ¥7 million and ¥4 million ($0 million), which represent the total ineffectiveness of cash flow
hedges, were recorded in earnings, through other operating expenses, for fiscal 2006, 2007 and 2008, respectively. Approximately
¥6 million ($0 million) of net derivative gains included in accumulated other comprehensive income (loss), net of applicable income taxes
at March 31, 2008 will be reclassified into earnings through other operating revenues within fiscal 2009.
(c) Fair value hedges
The Company and its subsidiaries use financial instruments designated as fair value hedges to hedge their exposure to interest rate
risk and foreign currency exchange risk. The Company and its subsidiaries designate foreign currency swap agreements and foreign
exchange forward contracts to minimize foreign currency exposures on operating assets including lease receivables, loan receivables and
borrowings, denominated in foreign currency. The Company and certain overseas subsidiaries, which issued medium-term notes with
fixed interest rates, use interest rate swap contracts to hedge interest rate exposure of the fair values of these medium-term notes. In
cases where the medium-term notes were denominated in other than the subsidiaries’ local currency, foreign currency swap agreements
are used to hedge foreign exchange rate exposure. For fiscal 2006, 2007 and 2008, losses of ¥149 million, ¥449 million and gains of
¥108 million ($1 million) of hedge ineffectiveness associated with instruments designated as fair value hedges were recorded in earnings
through other operating expenses and other operating revenues.
(d) Hedges of net investment in foreign operations
The Company uses foreign exchange forward contracts and borrowings denominated in the subsidiaries’ local currencies to hedge the
foreign currency exposure of the net investment in overseas subsidiaries. The gains and losses of these hedging instruments were
recorded in foreign currency translation adjustments, which is a part of accumulated other comprehensive income (loss). The net gains
(losses) of foreign currency translation adjustments for fiscal 2006, 2007 and 2008 were losses of ¥14,738 million, ¥2,965 million and
gains of ¥21,172 million ($211 million), respectively.
(e) Trading and other derivatives
Certain subsidiaries engage in trading activities with various future contracts. The Company and certain subsidiaries entered into
interest rate swap agreements, caps and foreign exchange forward contracts for risk management purposes but not qualified for hedge
accounting under FASB Statement No. 133.
26. Derivative Financial Instruments and Hedging
150
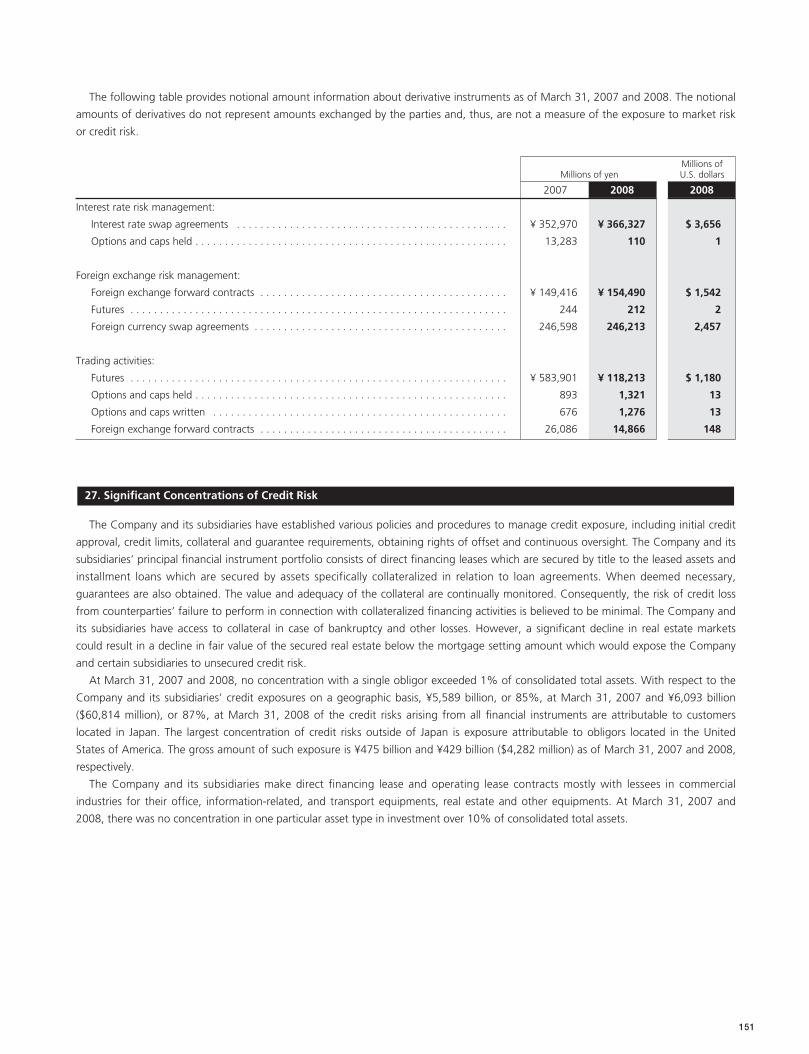
151
The following table provides notional amount information about derivative instruments as of March 31, 2007 and 2008. The notional
amounts of derivatives do not represent amounts exchanged by the parties and, thus, are not a measure of the exposure to market risk
or credit risk.
Millions ofMillions of yen U.S. dollars
2007 2008 2008
Interest rate risk management:
Interest rate swap agreements . . . . . . . . . . . . . . . . . . . . . . . . . . . . . . . . . . . . . . . . . . . . . . ¥ 352,970 ¥ 366,327 $ 3,656
Options and caps held . . . . . . . . . . . . . . . . . . . . . . . . . . . . . . . . . . . . . . . . . . . . . . . . . . . . . 13,283 110 1
Foreign exchange risk management:
Foreign exchange forward contracts . . . . . . . . . . . . . . . . . . . . . . . . . . . . . . . . . . . . . . . . . . ¥ 149,416 ¥ 154,490 $ 1,542
Futures . . . . . . . . . . . . . . . . . . . . . . . . . . . . . . . . . . . . . . . . . . . . . . . . . . . . . . . . . . . . . . . . 244 212 2
Foreign currency swap agreements . . . . . . . . . . . . . . . . . . . . . . . . . . . . . . . . . . . . . . . . . . . 246,598 246,213 2,457
Trading activities:
Futures . . . . . . . . . . . . . . . . . . . . . . . . . . . . . . . . . . . . . . . . . . . . . . . . . . . . . . . . . . . . . . . . ¥ 583,901 ¥ 118,213 $ 1,180
Options and caps held . . . . . . . . . . . . . . . . . . . . . . . . . . . . . . . . . . . . . . . . . . . . . . . . . . . . . 893 1,321 13
Options and caps written . . . . . . . . . . . . . . . . . . . . . . . . . . . . . . . . . . . . . . . . . . . . . . . . . . 676 1,276 13
Foreign exchange forward contracts . . . . . . . . . . . . . . . . . . . . . . . . . . . . . . . . . . . . . . . . . . 26,086 14,866 148
The Company and its subsidiaries have established various policies and procedures to manage credit exposure, including initial credit
approval, credit limits, collateral and guarantee requirements, obtaining rights of offset and continuous oversight. The Company and its
subsidiaries’ principal financial instrument portfolio consists of direct financing leases which are secured by title to the leased assets and
installment loans which are secured by assets specifically collateralized in relation to loan agreements. When deemed necessary,
guarantees are also obtained. The value and adequacy of the collateral are continually monitored. Consequently, the risk of credit loss
from counterparties’ failure to perform in connection with collateralized financing activities is believed to be minimal. The Company and
its subsidiaries have access to collateral in case of bankruptcy and other losses. However, a significant decline in real estate markets
could result in a decline in fair value of the secured real estate below the mortgage setting amount which would expose the Company
and certain subsidiaries to unsecured credit risk.
At March 31, 2007 and 2008, no concentration with a single obligor exceeded 1% of consolidated total assets. With respect to the
Company and its subsidiaries’ credit exposures on a geographic basis, ¥5,589 billion, or 85%, at March 31, 2007 and ¥6,093 billion
($60,814 million), or 87%, at March 31, 2008 of the credit risks arising from all financial instruments are attributable to customers
located in Japan. The largest concentration of credit risks outside of Japan is exposure attributable to obligors located in the United
States of America. The gross amount of such exposure is ¥475 billion and ¥429 billion ($4,282 million) as of March 31, 2007 and 2008,
respectively.
The Company and its subsidiaries make direct financing lease and operating lease contracts mostly with lessees in commercial
industries for their office, information-related, and transport equipments, real estate and other equipments. At March 31, 2007 and
2008, there was no concentration in one particular asset type in investment over 10% of consolidated total assets.
27. Significant Concentrations of Credit Risk
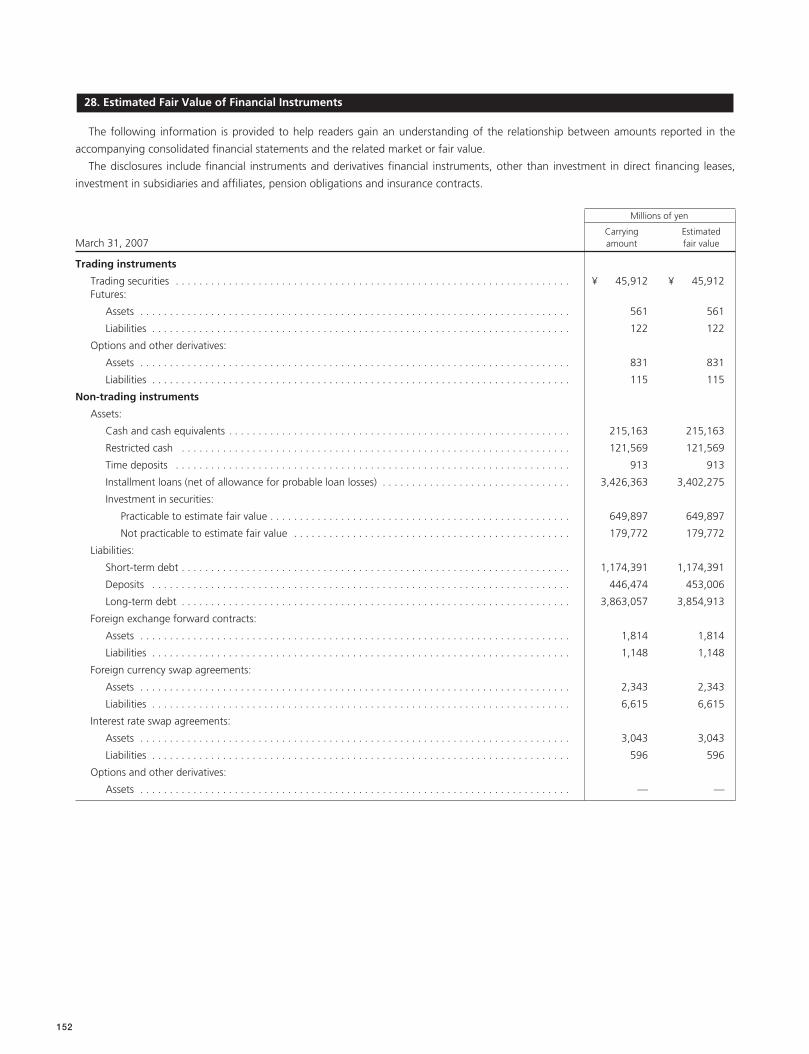
The following information is provided to help readers gain an understanding of the relationship between amounts reported in the
accompanying consolidated financial statements and the related market or fair value.
The disclosures include financial instruments and derivatives financial instruments, other than investment in direct financing leases,
investment in subsidiaries and affiliates, pension obligations and insurance contracts.
Millions of yen
Carrying EstimatedMarch 31, 2007 amount fair value
Trading instruments
Trading securities . . . . . . . . . . . . . . . . . . . . . . . . . . . . . . . . . . . . . . . . . . . . . . . . . . . . . . . . . . . . . . . . . . . ¥ 45,912 ¥ 45,912Futures:
Assets . . . . . . . . . . . . . . . . . . . . . . . . . . . . . . . . . . . . . . . . . . . . . . . . . . . . . . . . . . . . . . . . . . . . . . . . . 561 561
Liabilities . . . . . . . . . . . . . . . . . . . . . . . . . . . . . . . . . . . . . . . . . . . . . . . . . . . . . . . . . . . . . . . . . . . . . . . 122 122
Options and other derivatives:
Assets . . . . . . . . . . . . . . . . . . . . . . . . . . . . . . . . . . . . . . . . . . . . . . . . . . . . . . . . . . . . . . . . . . . . . . . . . 831 831
Liabilities . . . . . . . . . . . . . . . . . . . . . . . . . . . . . . . . . . . . . . . . . . . . . . . . . . . . . . . . . . . . . . . . . . . . . . . 115 115
Non-trading instruments
Assets:
Cash and cash equivalents . . . . . . . . . . . . . . . . . . . . . . . . . . . . . . . . . . . . . . . . . . . . . . . . . . . . . . . . . . 215,163 215,163
Restricted cash . . . . . . . . . . . . . . . . . . . . . . . . . . . . . . . . . . . . . . . . . . . . . . . . . . . . . . . . . . . . . . . . . . 121,569 121,569
Time deposits . . . . . . . . . . . . . . . . . . . . . . . . . . . . . . . . . . . . . . . . . . . . . . . . . . . . . . . . . . . . . . . . . . . 913 913
Installment loans (net of allowance for probable loan losses) . . . . . . . . . . . . . . . . . . . . . . . . . . . . . . . . 3,426,363 3,402,275
Investment in securities:
Practicable to estimate fair value . . . . . . . . . . . . . . . . . . . . . . . . . . . . . . . . . . . . . . . . . . . . . . . . . . . 649,897 649,897
Not practicable to estimate fair value . . . . . . . . . . . . . . . . . . . . . . . . . . . . . . . . . . . . . . . . . . . . . . . 179,772 179,772
Liabilities:
Short-term debt . . . . . . . . . . . . . . . . . . . . . . . . . . . . . . . . . . . . . . . . . . . . . . . . . . . . . . . . . . . . . . . . . . 1,174,391 1,174,391
Deposits . . . . . . . . . . . . . . . . . . . . . . . . . . . . . . . . . . . . . . . . . . . . . . . . . . . . . . . . . . . . . . . . . . . . . . . 446,474 453,006
Long-term debt . . . . . . . . . . . . . . . . . . . . . . . . . . . . . . . . . . . . . . . . . . . . . . . . . . . . . . . . . . . . . . . . . . 3,863,057 3,854,913
Foreign exchange forward contracts:
Assets . . . . . . . . . . . . . . . . . . . . . . . . . . . . . . . . . . . . . . . . . . . . . . . . . . . . . . . . . . . . . . . . . . . . . . . . . 1,814 1,814
Liabilities . . . . . . . . . . . . . . . . . . . . . . . . . . . . . . . . . . . . . . . . . . . . . . . . . . . . . . . . . . . . . . . . . . . . . . . 1,148 1,148
Foreign currency swap agreements:
Assets . . . . . . . . . . . . . . . . . . . . . . . . . . . . . . . . . . . . . . . . . . . . . . . . . . . . . . . . . . . . . . . . . . . . . . . . . 2,343 2,343
Liabilities . . . . . . . . . . . . . . . . . . . . . . . . . . . . . . . . . . . . . . . . . . . . . . . . . . . . . . . . . . . . . . . . . . . . . . . 6,615 6,615
Interest rate swap agreements:
Assets . . . . . . . . . . . . . . . . . . . . . . . . . . . . . . . . . . . . . . . . . . . . . . . . . . . . . . . . . . . . . . . . . . . . . . . . . 3,043 3,043
Liabilities . . . . . . . . . . . . . . . . . . . . . . . . . . . . . . . . . . . . . . . . . . . . . . . . . . . . . . . . . . . . . . . . . . . . . . . 596 596
Options and other derivatives:
Assets . . . . . . . . . . . . . . . . . . . . . . . . . . . . . . . . . . . . . . . . . . . . . . . . . . . . . . . . . . . . . . . . . . . . . . . . . — —
28. Estimated Fair Value of Financial Instruments
152
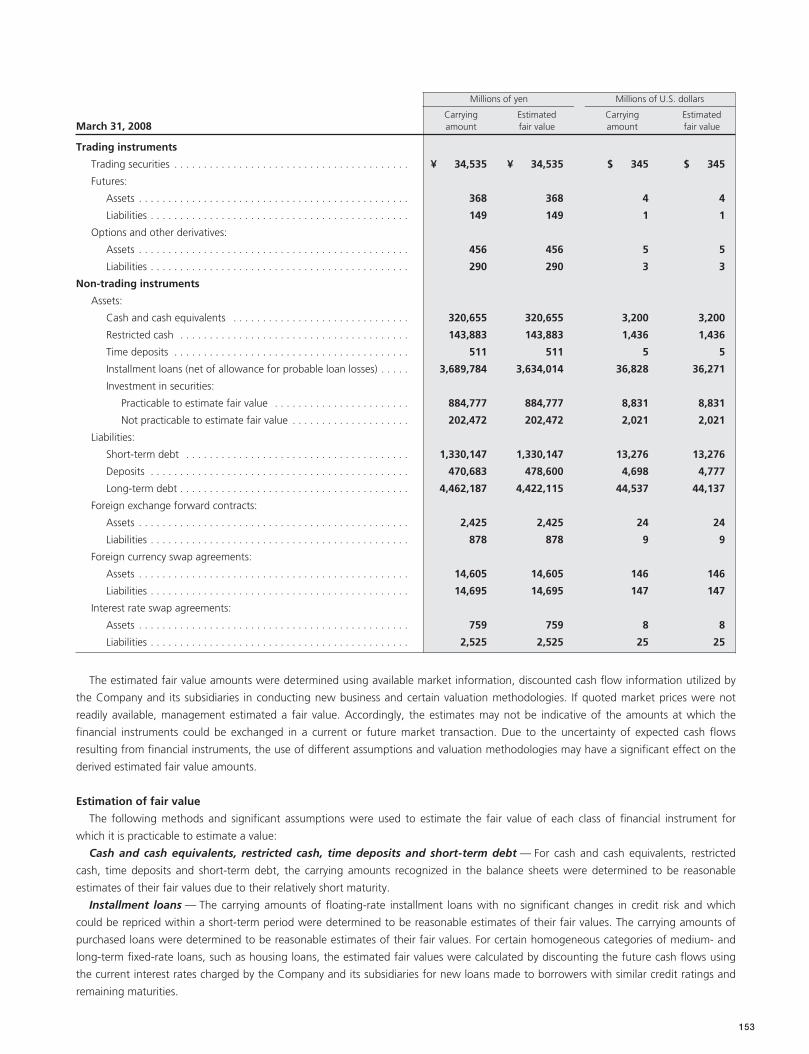
153
Millions of yen Millions of U.S. dollars
Carrying Estimated Carrying EstimatedMarch 31, 2008 amount fair value amount fair value
Trading instruments
Trading securities . . . . . . . . . . . . . . . . . . . . . . . . . . . . . . . . . . . . . . . . ¥ 34,535 ¥ 34,535 $ 345 $ 345
Futures:
Assets . . . . . . . . . . . . . . . . . . . . . . . . . . . . . . . . . . . . . . . . . . . . . . 368 368 4 4
Liabilities . . . . . . . . . . . . . . . . . . . . . . . . . . . . . . . . . . . . . . . . . . . . 149 149 1 1
Options and other derivatives:
Assets . . . . . . . . . . . . . . . . . . . . . . . . . . . . . . . . . . . . . . . . . . . . . . 456 456 5 5
Liabilities . . . . . . . . . . . . . . . . . . . . . . . . . . . . . . . . . . . . . . . . . . . . 290 290 3 3
Non-trading instruments
Assets:
Cash and cash equivalents . . . . . . . . . . . . . . . . . . . . . . . . . . . . . . 320,655 320,655 3,200 3,200
Restricted cash . . . . . . . . . . . . . . . . . . . . . . . . . . . . . . . . . . . . . . . 143,883 143,883 1,436 1,436
Time deposits . . . . . . . . . . . . . . . . . . . . . . . . . . . . . . . . . . . . . . . . 511 511 5 5
Installment loans (net of allowance for probable loan losses) . . . . . 3,689,784 3,634,014 36,828 36,271
Investment in securities:
Practicable to estimate fair value . . . . . . . . . . . . . . . . . . . . . . . 884,777 884,777 8,831 8,831
Not practicable to estimate fair value . . . . . . . . . . . . . . . . . . . . 202,472 202,472 2,021 2,021
Liabilities:
Short-term debt . . . . . . . . . . . . . . . . . . . . . . . . . . . . . . . . . . . . . . 1,330,147 1,330,147 13,276 13,276
Deposits . . . . . . . . . . . . . . . . . . . . . . . . . . . . . . . . . . . . . . . . . . . . 470,683 478,600 4,698 4,777
Long-term debt . . . . . . . . . . . . . . . . . . . . . . . . . . . . . . . . . . . . . . . 4,462,187 4,422,115 44,537 44,137
Foreign exchange forward contracts:
Assets . . . . . . . . . . . . . . . . . . . . . . . . . . . . . . . . . . . . . . . . . . . . . . 2,425 2,425 24 24
Liabilities . . . . . . . . . . . . . . . . . . . . . . . . . . . . . . . . . . . . . . . . . . . . 878 878 9 9
Foreign currency swap agreements:
Assets . . . . . . . . . . . . . . . . . . . . . . . . . . . . . . . . . . . . . . . . . . . . . . 14,605 14,605 146 146
Liabilities . . . . . . . . . . . . . . . . . . . . . . . . . . . . . . . . . . . . . . . . . . . . 14,695 14,695 147 147
Interest rate swap agreements:
Assets . . . . . . . . . . . . . . . . . . . . . . . . . . . . . . . . . . . . . . . . . . . . . . 759 759 8 8
Liabilities . . . . . . . . . . . . . . . . . . . . . . . . . . . . . . . . . . . . . . . . . . . . 2,525 2,525 25 25
The estimated fair value amounts were determined using available market information, discounted cash flow information utilized by
the Company and its subsidiaries in conducting new business and certain valuation methodologies. If quoted market prices were not
readily available, management estimated a fair value. Accordingly, the estimates may not be indicative of the amounts at which the
financial instruments could be exchanged in a current or future market transaction. Due to the uncertainty of expected cash flows
resulting from financial instruments, the use of different assumptions and valuation methodologies may have a significant effect on the
derived estimated fair value amounts.
Estimation of fair value
The following methods and significant assumptions were used to estimate the fair value of each class of financial instrument for
which it is practicable to estimate a value:
Cash and cash equivalents, restricted cash, time deposits and short-term debt — For cash and cash equivalents, restricted
cash, time deposits and short-term debt, the carrying amounts recognized in the balance sheets were determined to be reasonable
estimates of their fair values due to their relatively short maturity.
Installment loans — The carrying amounts of floating-rate installment loans with no significant changes in credit risk and which
could be repriced within a short-term period were determined to be reasonable estimates of their fair values. The carrying amounts of
purchased loans were determined to be reasonable estimates of their fair values. For certain homogeneous categories of medium- and
long-term fixed-rate loans, such as housing loans, the estimated fair values were calculated by discounting the future cash flows using
the current interest rates charged by the Company and its subsidiaries for new loans made to borrowers with similar credit ratings and
remaining maturities.
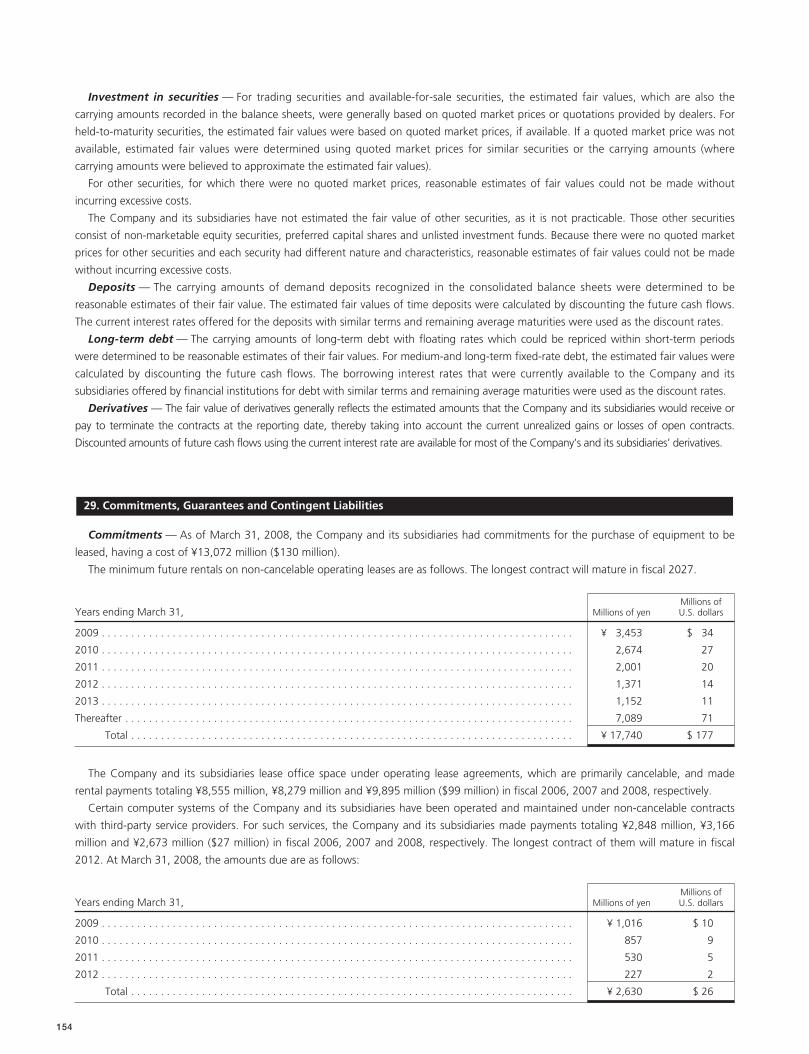
Investment in securities — For trading securities and available-for-sale securities, the estimated fair values, which are also the
carrying amounts recorded in the balance sheets, were generally based on quoted market prices or quotations provided by dealers. For
held-to-maturity securities, the estimated fair values were based on quoted market prices, if available. If a quoted market price was not
available, estimated fair values were determined using quoted market prices for similar securities or the carrying amounts (where
carrying amounts were believed to approximate the estimated fair values).
For other securities, for which there were no quoted market prices, reasonable estimates of fair values could not be made without
incurring excessive costs.
The Company and its subsidiaries have not estimated the fair value of other securities, as it is not practicable. Those other securities
consist of non-marketable equity securities, preferred capital shares and unlisted investment funds. Because there were no quoted market
prices for other securities and each security had different nature and characteristics, reasonable estimates of fair values could not be made
without incurring excessive costs.
Deposits — The carrying amounts of demand deposits recognized in the consolidated balance sheets were determined to be
reasonable estimates of their fair value. The estimated fair values of time deposits were calculated by discounting the future cash flows.
The current interest rates offered for the deposits with similar terms and remaining average maturities were used as the discount rates.
Long-term debt — The carrying amounts of long-term debt with floating rates which could be repriced within short-term periods
were determined to be reasonable estimates of their fair values. For medium-and long-term fixed-rate debt, the estimated fair values were
calculated by discounting the future cash flows. The borrowing interest rates that were currently available to the Company and its
subsidiaries offered by financial institutions for debt with similar terms and remaining average maturities were used as the discount rates.
Derivatives — The fair value of derivatives generally reflects the estimated amounts that the Company and its subsidiaries would receive or
pay to terminate the contracts at the reporting date, thereby taking into account the current unrealized gains or losses of open contracts.
Discounted amounts of future cash flows using the current interest rate are available for most of the Company’s and its subsidiaries’ derivatives.
Commitments — As of March 31, 2008, the Company and its subsidiaries had commitments for the purchase of equipment to be
leased, having a cost of ¥13,072 million ($130 million).
The minimum future rentals on non-cancelable operating leases are as follows. The longest contract will mature in fiscal 2027.
Millions ofYears ending March 31, Millions of yen U.S. dollars
2009 . . . . . . . . . . . . . . . . . . . . . . . . . . . . . . . . . . . . . . . . . . . . . . . . . . . . . . . . . . . . . . . . . . . . . . . . . . . . . . . . ¥ 3,453 $ 34
2010 . . . . . . . . . . . . . . . . . . . . . . . . . . . . . . . . . . . . . . . . . . . . . . . . . . . . . . . . . . . . . . . . . . . . . . . . . . . . . . . . 2,674 27
2011 . . . . . . . . . . . . . . . . . . . . . . . . . . . . . . . . . . . . . . . . . . . . . . . . . . . . . . . . . . . . . . . . . . . . . . . . . . . . . . . . 2,001 20
2012 . . . . . . . . . . . . . . . . . . . . . . . . . . . . . . . . . . . . . . . . . . . . . . . . . . . . . . . . . . . . . . . . . . . . . . . . . . . . . . . . 1,371 14
2013 . . . . . . . . . . . . . . . . . . . . . . . . . . . . . . . . . . . . . . . . . . . . . . . . . . . . . . . . . . . . . . . . . . . . . . . . . . . . . . . . 1,152 11
Thereafter . . . . . . . . . . . . . . . . . . . . . . . . . . . . . . . . . . . . . . . . . . . . . . . . . . . . . . . . . . . . . . . . . . . . . . . . . . . . 7,089 71
Total . . . . . . . . . . . . . . . . . . . . . . . . . . . . . . . . . . . . . . . . . . . . . . . . . . . . . . . . . . . . . . . . . . . . . . . . . . . ¥ 17,740 $ 177
The Company and its subsidiaries lease office space under operating lease agreements, which are primarily cancelable, and made
rental payments totaling ¥8,555 million, ¥8,279 million and ¥9,895 million ($99 million) in fiscal 2006, 2007 and 2008, respectively.
Certain computer systems of the Company and its subsidiaries have been operated and maintained under non-cancelable contracts
with third-party service providers. For such services, the Company and its subsidiaries made payments totaling ¥2,848 million, ¥3,166
million and ¥2,673 million ($27 million) in fiscal 2006, 2007 and 2008, respectively. The longest contract of them will mature in fiscal
2012. At March 31, 2008, the amounts due are as follows:
Millions ofYears ending March 31, Millions of yen U.S. dollars
2009 . . . . . . . . . . . . . . . . . . . . . . . . . . . . . . . . . . . . . . . . . . . . . . . . . . . . . . . . . . . . . . . . . . . . . . . . . . . . . . . . ¥ 1,016 $ 10
2010 . . . . . . . . . . . . . . . . . . . . . . . . . . . . . . . . . . . . . . . . . . . . . . . . . . . . . . . . . . . . . . . . . . . . . . . . . . . . . . . . 857 9
2011 . . . . . . . . . . . . . . . . . . . . . . . . . . . . . . . . . . . . . . . . . . . . . . . . . . . . . . . . . . . . . . . . . . . . . . . . . . . . . . . . 530 5
2012 . . . . . . . . . . . . . . . . . . . . . . . . . . . . . . . . . . . . . . . . . . . . . . . . . . . . . . . . . . . . . . . . . . . . . . . . . . . . . . . . 227 2
Total . . . . . . . . . . . . . . . . . . . . . . . . . . . . . . . . . . . . . . . . . . . . . . . . . . . . . . . . . . . . . . . . . . . . . . . . . . . ¥ 2,630 $ 26
29. Commitments, Guarantees and Contingent Liabilities
154
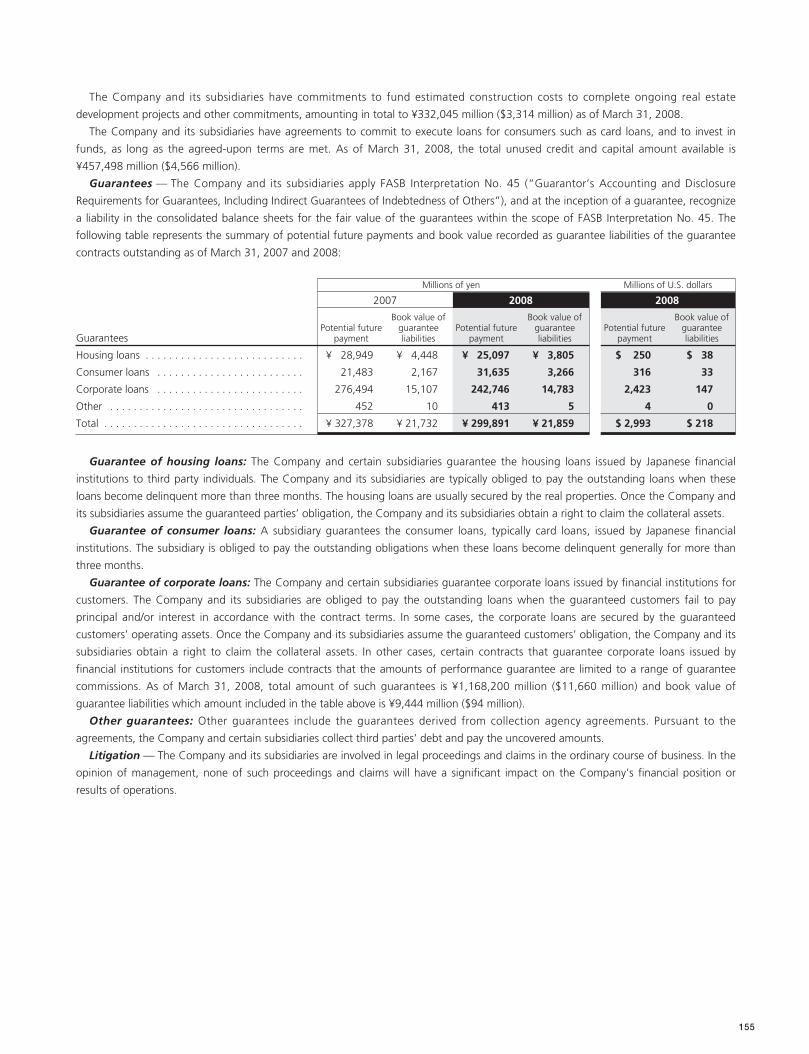
155
The Company and its subsidiaries have commitments to fund estimated construction costs to complete ongoing real estate
development projects and other commitments, amounting in total to ¥332,045 million ($3,314 million) as of March 31, 2008.
The Company and its subsidiaries have agreements to commit to execute loans for consumers such as card loans, and to invest in
funds, as long as the agreed-upon terms are met. As of March 31, 2008, the total unused credit and capital amount available is
¥457,498 million ($4,566 million).
Guarantees — The Company and its subsidiaries apply FASB Interpretation No. 45 (“Guarantor’s Accounting and Disclosure
Requirements for Guarantees, Including Indirect Guarantees of Indebtedness of Others”), and at the inception of a guarantee, recognize
a liability in the consolidated balance sheets for the fair value of the guarantees within the scope of FASB Interpretation No. 45. The
following table represents the summary of potential future payments and book value recorded as guarantee liabilities of the guarantee
contracts outstanding as of March 31, 2007 and 2008:
Millions of yen Millions of U.S. dollars
2007 2008 2008
Book value of Book value of Book value ofPotential future guarantee Potential future guarantee Potential future guarantee
Guarantees payment liabilities payment liabilities payment liabilities
Housing loans . . . . . . . . . . . . . . . . . . . . . . . . . . . ¥ 28,949 ¥ 4,448 ¥ 25,097 ¥ 3,805 $ 250 $ 38
Consumer loans . . . . . . . . . . . . . . . . . . . . . . . . . 21,483 2,167 31,635 3,266 316 33
Corporate loans . . . . . . . . . . . . . . . . . . . . . . . . . 276,494 15,107 242,746 14,783 2,423 147
Other . . . . . . . . . . . . . . . . . . . . . . . . . . . . . . . . . 452 10 413 5 4 0
Total . . . . . . . . . . . . . . . . . . . . . . . . . . . . . . . . . . ¥ 327,378 ¥ 21,732 ¥ 299,891 ¥ 21,859 $ 2,993 $ 218
Guarantee of housing loans: The Company and certain subsidiaries guarantee the housing loans issued by Japanese financial
institutions to third party individuals. The Company and its subsidiaries are typically obliged to pay the outstanding loans when these
loans become delinquent more than three months. The housing loans are usually secured by the real properties. Once the Company and
its subsidiaries assume the guaranteed parties’ obligation, the Company and its subsidiaries obtain a right to claim the collateral assets.
Guarantee of consumer loans: A subsidiary guarantees the consumer loans, typically card loans, issued by Japanese financial
institutions. The subsidiary is obliged to pay the outstanding obligations when these loans become delinquent generally for more than
three months.
Guarantee of corporate loans: The Company and certain subsidiaries guarantee corporate loans issued by financial institutions for
customers. The Company and its subsidiaries are obliged to pay the outstanding loans when the guaranteed customers fail to pay
principal and/or interest in accordance with the contract terms. In some cases, the corporate loans are secured by the guaranteed
customers’ operating assets. Once the Company and its subsidiaries assume the guaranteed customers’ obligation, the Company and its
subsidiaries obtain a right to claim the collateral assets. In other cases, certain contracts that guarantee corporate loans issued by
financial institutions for customers include contracts that the amounts of performance guarantee are limited to a range of guarantee
commissions. As of March 31, 2008, total amount of such guarantees is ¥1,168,200 million ($11,660 million) and book value of
guarantee liabilities which amount included in the table above is ¥9,444 million ($94 million).
Other guarantees: Other guarantees include the guarantees derived from collection agency agreements. Pursuant to the
agreements, the Company and certain subsidiaries collect third parties’ debt and pay the uncovered amounts.
Litigation — The Company and its subsidiaries are involved in legal proceedings and claims in the ordinary course of business. In the
opinion of management, none of such proceedings and claims will have a significant impact on the Company’s financial position or
results of operations.
The following table presents segment financial information on the basis that is regularly used by management for evaluating segment
performance and deciding how to allocate resources. The reportable segments are mainly identified based on the nature of services for
operations in Japan and on the basis of geographic area for overseas operations. With respect to the Corporate Financial Services
segment and Real Estate-Related Finance segment, the Company and its subsidiaries aggregate some operating segments that are
determined by region and type of operating assets for management purposes because they are similar in the nature of the services, the
type of customers and the economic environment.
The Corporate Financial Services segment comprises primarily lending operations and direct financing leases as well as the sale of a
variety of financial products and other fee business. The Automobile Operations segment comprises automobile leasing and automobile
rental operations. The Rental Operations segment comprises rental and leasing operations for precision measuring equipment and
information-related equipment such as personal computers. The Real Estate-Related Finance segment includes real estate-related
finance, personal housing loan lending operations and commercial mortgage-backed securities (CMBS) as well as loan servicing. The Real
Estate segment primarily comprises residential subdivision developments, the development and leasing of office buildings and logistics
facilities, the management of hotels, golf courses and training facilities, the development and management of senior housing, integrated
facilities management, as well as asset management and administration on behalf of REITs. The Life Insurance segment includes direct
and agency life insurance sales and related activities. The two overseas operating segments, The Americas and Asia, Oceania and Europe
segments, include corporate finance, investment banking, real estate-related business and ship- and aircraft-related financing
operations. The Other segment, which is not deemed by management to be sufficiently significant to disclose as separate items and do
not fall into the above segment categories, is reported under operations in Japan and primarily includes financial instruments exchange,
venture capital, card loans, principal investments business and other new business. Most of selling, general and administrative expenses,
including compensation costs that are directly related to the revenue generating activities of each segment, have been accumulated by
and charged to each segment.
The results of the reported segments from fiscal 2008 reflect the revised business classification of the Company, where leasing
operations of the affiliates, which had been included in the Other segment, have been included in the Corporate Financial Services
segment from fiscal 2008. Therefore, certain related amounts that had been previously reported in fiscal 2006 and 2007 are reclassified
to confirm to fiscal 2008 presentation.
30. Segment Information
156
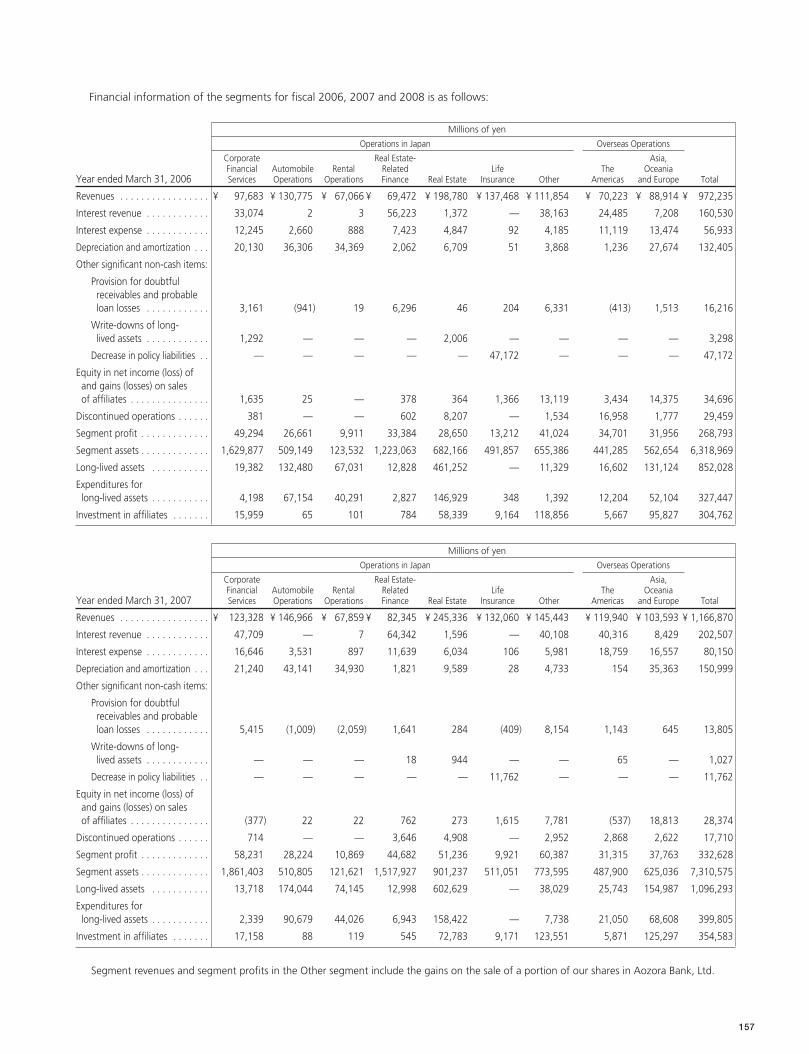
157
Financial information of the segments for fiscal 2006, 2007 and 2008 is as follows:
Millions of yen
Operations in Japan Overseas Operations
Corporate Real Estate- Asia,Financial Automobile Rental Related Life The Oceania
Year ended March 31, 2006 Services Operations Operations Finance Real Estate Insurance Other Americas and Europe Total
Revenues . . . . . . . . . . . . . . . . . ¥ 97,683 ¥ 130,775 ¥ 67,066 ¥ 69,472 ¥ 198,780 ¥ 137,468 ¥ 111,854 ¥ 70,223 ¥ 88,914 ¥ 972,235
Interest revenue . . . . . . . . . . . . 33,074 2 3 56,223 1,372 — 38,163 24,485 7,208 160,530
Interest expense . . . . . . . . . . . . 12,245 2,660 888 7,423 4,847 92 4,185 11,119 13,474 56,933
Depreciation and amortization . . . 20,130 36,306 34,369 2,062 6,709 51 3,868 1,236 27,674 132,405
Other significant non-cash items:
Provision for doubtful receivables and probable loan losses . . . . . . . . . . . . 3,161 (941) 19 6,296 46 204 6,331 (413) 1,513 16,216
Write-downs of long-lived assets . . . . . . . . . . . . 1,292 — — — 2,006 — — — — 3,298
Decrease in policy liabilities . . — — — — — 47,172 — — — 47,172
Equity in net income (loss) of and gains (losses) on sales of affiliates . . . . . . . . . . . . . . . 1,635 25 — 378 364 1,366 13,119 3,434 14,375 34,696
Discontinued operations . . . . . . 381 — — 602 8,207 — 1,534 16,958 1,777 29,459
Segment profit . . . . . . . . . . . . . 49,294 26,661 9,911 33,384 28,650 13,212 41,024 34,701 31,956 268,793
Segment assets . . . . . . . . . . . . . 1,629,877 509,149 123,532 1,223,063 682,166 491,857 655,386 441,285 562,654 6,318,969
Long-lived assets . . . . . . . . . . . 19,382 132,480 67,031 12,828 461,252 — 11,329 16,602 131,124 852,028
Expenditures for long-lived assets . . . . . . . . . . . 4,198 67,154 40,291 2,827 146,929 348 1,392 12,204 52,104 327,447
Investment in affiliates . . . . . . . 15,959 65 101 784 58,339 9,164 118,856 5,667 95,827 304,762
Millions of yen
Operations in Japan Overseas Operations
Corporate Real Estate- Asia, Financial Automobile Rental Related Life The Oceania
Year ended March 31, 2007 Services Operations Operations Finance Real Estate Insurance Other Americas and Europe Total
Revenues . . . . . . . . . . . . . . . . . ¥ 123,328 ¥ 146,966 ¥ 67,859 ¥ 82,345 ¥ 245,336 ¥ 132,060 ¥ 145,443 ¥ 119,940 ¥ 103,593 ¥ 1,166,870
Interest revenue . . . . . . . . . . . . 47,709 — 7 64,342 1,596 — 40,108 40,316 8,429 202,507
Interest expense . . . . . . . . . . . . 16,646 3,531 897 11,639 6,034 106 5,981 18,759 16,557 80,150
Depreciation and amortization . . . 21,240 43,141 34,930 1,821 9,589 28 4,733 154 35,363 150,999
Other significant non-cash items:
Provision for doubtful receivables and probable loan losses . . . . . . . . . . . . 5,415 (1,009) (2,059) 1,641 284 (409) 8,154 1,143 645 13,805
Write-downs of long-lived assets . . . . . . . . . . . . — — — 18 944 — — 65 — 1,027
Decrease in policy liabilities . . — — — — — 11,762 — — — 11,762
Equity in net income (loss) of and gains (losses) on sales of affiliates . . . . . . . . . . . . . . . (377) 22 22 762 273 1,615 7,781 (537) 18,813 28,374
Discontinued operations . . . . . . 714 — — 3,646 4,908 — 2,952 2,868 2,622 17,710
Segment profit . . . . . . . . . . . . . 58,231 28,224 10,869 44,682 51,236 9,921 60,387 31,315 37,763 332,628
Segment assets . . . . . . . . . . . . . 1,861,403 510,805 121,621 1,517,927 901,237 511,051 773,595 487,900 625,036 7,310,575
Long-lived assets . . . . . . . . . . . 13,718 174,044 74,145 12,998 602,629 — 38,029 25,743 154,987 1,096,293
Expenditures for long-lived assets . . . . . . . . . . . 2,339 90,679 44,026 6,943 158,422 — 7,738 21,050 68,608 399,805
Investment in affiliates . . . . . . . 17,158 88 119 545 72,783 9,171 123,551 5,871 125,297 354,583
Segment revenues and segment profits in the Other segment include the gains on the sale of a portion of our shares in Aozora Bank, Ltd.
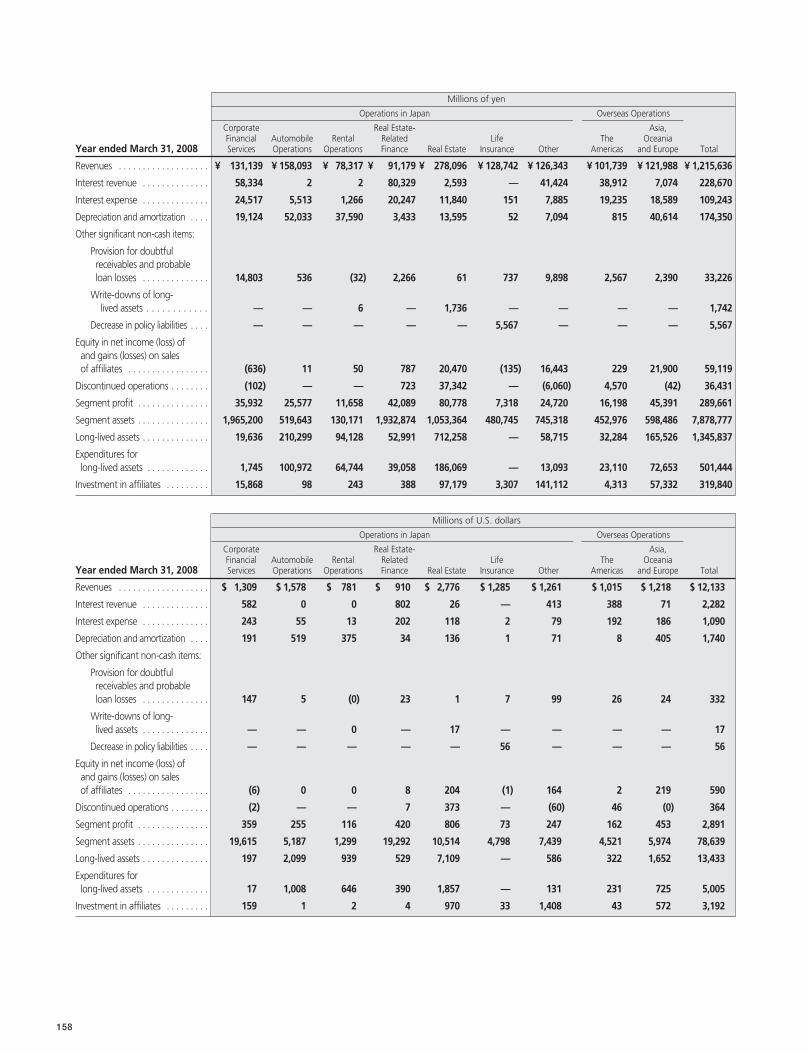
Millions of yen
Operations in Japan Overseas Operations
Corporate Real Estate- Asia, Financial Automobile Rental Related Life The Oceania
Year ended March 31, 2008 Services Operations Operations Finance Real Estate Insurance Other Americas and Europe Total
Revenues . . . . . . . . . . . . . . . . . . . ¥ 131,139 ¥ 158,093 ¥ 78,317 ¥ 91,179 ¥ 278,096 ¥ 128,742 ¥ 126,343 ¥ 101,739 ¥ 121,988 ¥ 1,215,636
Interest revenue . . . . . . . . . . . . . . 58,334 2 2 80,329 2,593 — 41,424 38,912 7,074 228,670
Interest expense . . . . . . . . . . . . . . 24,517 5,513 1,266 20,247 11,840 151 7,885 19,235 18,589 109,243
Depreciation and amortization . . . . 19,124 52,033 37,590 3,433 13,595 52 7,094 815 40,614 174,350
Other significant non-cash items:
Provision for doubtful receivables and probable loan losses . . . . . . . . . . . . . . 14,803 536 (32) 2,266 61 737 9,898 2,567 2,390 33,226
Write-downs of long-lived assets . . . . . . . . . . . . — — 6 — 1,736 — — — — 1,742
Decrease in policy liabilities . . . . — — — — — 5,567 — — — 5,567
Equity in net income (loss) of and gains (losses) on sales of affiliates . . . . . . . . . . . . . . . . . (636) 11 50 787 20,470 (135) 16,443 229 21,900 59,119
Discontinued operations . . . . . . . . (102) — — 723 37,342 — (6,060) 4,570 (42) 36,431
Segment profit . . . . . . . . . . . . . . . 35,932 25,577 11,658 42,089 80,778 7,318 24,720 16,198 45,391 289,661
Segment assets . . . . . . . . . . . . . . . 1,965,200 519,643 130,171 1,932,874 1,053,364 480,745 745,318 452,976 598,486 7,878,777
Long-lived assets . . . . . . . . . . . . . . 19,636 210,299 94,128 52,991 712,258 — 58,715 32,284 165,526 1,345,837
Expenditures for long-lived assets . . . . . . . . . . . . . 1,745 100,972 64,744 39,058 186,069 — 13,093 23,110 72,653 501,444
Investment in affiliates . . . . . . . . . 15,868 98 243 388 97,179 3,307 141,112 4,313 57,332 319,840
Millions of U.S. dollars
Operations in Japan Overseas Operations
Corporate Real Estate- Asia, Financial Automobile Rental Related Life The Oceania
Year ended March 31, 2008 Services Operations Operations Finance Real Estate Insurance Other Americas and Europe Total
Revenues . . . . . . . . . . . . . . . . . . . $ 1,309 $ 1,578 $ 781 $ 910 $ 2,776 $ 1,285 $ 1,261 $ 1,015 $ 1,218 $ 12,133
Interest revenue . . . . . . . . . . . . . . 582 0 0 802 26 — 413 388 71 2,282
Interest expense . . . . . . . . . . . . . . 243 55 13 202 118 2 79 192 186 1,090
Depreciation and amortization . . . . 191 519 375 34 136 1 71 8 405 1,740
Other significant non-cash items:
Provision for doubtful receivables and probable loan losses . . . . . . . . . . . . . . 147 5 (0) 23 1 7 99 26 24 332
Write-downs of long-lived assets . . . . . . . . . . . . . . — — 0 — 17 — — — — 17
Decrease in policy liabilities . . . . — — — — — 56 — — — 56
Equity in net income (loss) of and gains (losses) on sales of affiliates . . . . . . . . . . . . . . . . . (6) 0 0 8 204 (1) 164 2 219 590
Discontinued operations . . . . . . . . (2) — — 7 373 — (60) 46 (0) 364
Segment profit . . . . . . . . . . . . . . . 359 255 116 420 806 73 247 162 453 2,891
Segment assets . . . . . . . . . . . . . . . 19,615 5,187 1,299 19,292 10,514 4,798 7,439 4,521 5,974 78,639
Long-lived assets . . . . . . . . . . . . . . 197 2,099 939 529 7,109 — 586 322 1,652 13,433
Expenditures for long-lived assets . . . . . . . . . . . . . 17 1,008 646 390 1,857 — 131 231 725 5,005
Investment in affiliates . . . . . . . . . 159 1 2 4 970 33 1,408 43 572 3,192
158
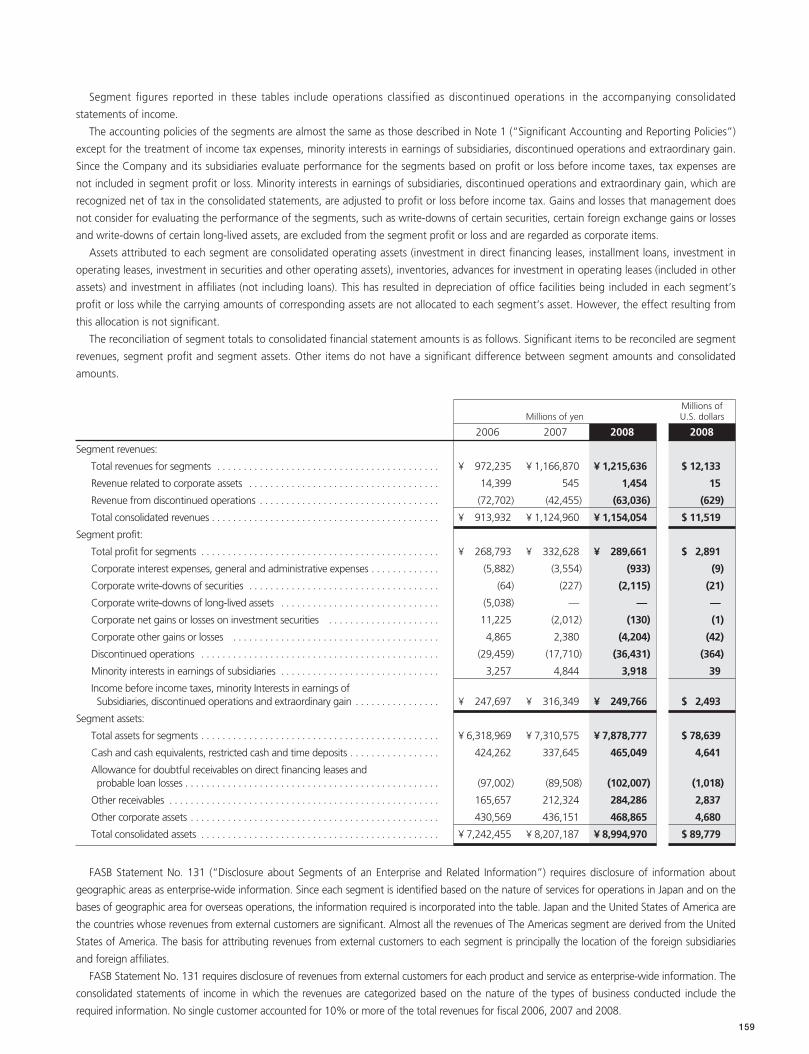
159
Segment figures reported in these tables include operations classified as discontinued operations in the accompanying consolidated
statements of income.
The accounting policies of the segments are almost the same as those described in Note 1 (“Significant Accounting and Reporting Policies”)
except for the treatment of income tax expenses, minority interests in earnings of subsidiaries, discontinued operations and extraordinary gain.
Since the Company and its subsidiaries evaluate performance for the segments based on profit or loss before income taxes, tax expenses are
not included in segment profit or loss. Minority interests in earnings of subsidiaries, discontinued operations and extraordinary gain, which are
recognized net of tax in the consolidated statements, are adjusted to profit or loss before income tax. Gains and losses that management does
not consider for evaluating the performance of the segments, such as write-downs of certain securities, certain foreign exchange gains or losses
and write-downs of certain long-lived assets, are excluded from the segment profit or loss and are regarded as corporate items.
Assets attributed to each segment are consolidated operating assets (investment in direct financing leases, installment loans, investment in
operating leases, investment in securities and other operating assets), inventories, advances for investment in operating leases (included in other
assets) and investment in affiliates (not including loans). This has resulted in depreciation of office facilities being included in each segment’s
profit or loss while the carrying amounts of corresponding assets are not allocated to each segment’s asset. However, the effect resulting from
this allocation is not significant.
The reconciliation of segment totals to consolidated financial statement amounts is as follows. Significant items to be reconciled are segment
revenues, segment profit and segment assets. Other items do not have a significant difference between segment amounts and consolidated
amounts.
Millions ofMillions of yen U.S. dollars
2006 2007 2008 2008
Segment revenues:
Total revenues for segments . . . . . . . . . . . . . . . . . . . . . . . . . . . . . . . . . . . . . . . . . . ¥ 972,235 ¥ 1,166,870 ¥ 1,215,636 $ 12,133
Revenue related to corporate assets . . . . . . . . . . . . . . . . . . . . . . . . . . . . . . . . . . . . 14,399 545 1,454 15
Revenue from discontinued operations . . . . . . . . . . . . . . . . . . . . . . . . . . . . . . . . . . (72,702) (42,455) (63,036) (629)
Total consolidated revenues . . . . . . . . . . . . . . . . . . . . . . . . . . . . . . . . . . . . . . . . . . . ¥ 913,932 ¥ 1,124,960 ¥ 1,154,054 $ 11,519
Segment profit:
Total profit for segments . . . . . . . . . . . . . . . . . . . . . . . . . . . . . . . . . . . . . . . . . . . . . ¥ 268,793 ¥ 332,628 ¥ 289,661 $ 2,891
Corporate interest expenses, general and administrative expenses . . . . . . . . . . . . . (5,882) (3,554) (933) (9)
Corporate write-downs of securities . . . . . . . . . . . . . . . . . . . . . . . . . . . . . . . . . . . . (64) (227) (2,115) (21)
Corporate write-downs of long-lived assets . . . . . . . . . . . . . . . . . . . . . . . . . . . . . . (5,038) — — —
Corporate net gains or losses on investment securities . . . . . . . . . . . . . . . . . . . . . 11,225 (2,012) (130) (1)
Corporate other gains or losses . . . . . . . . . . . . . . . . . . . . . . . . . . . . . . . . . . . . . . . 4,865 2,380 (4,204) (42)
Discontinued operations . . . . . . . . . . . . . . . . . . . . . . . . . . . . . . . . . . . . . . . . . . . . . (29,459) (17,710) (36,431) (364)
Minority interests in earnings of subsidiaries . . . . . . . . . . . . . . . . . . . . . . . . . . . . . . 3,257 4,844 3,918 39
Income before income taxes, minority Interests in earnings of Subsidiaries, discontinued operations and extraordinary gain . . . . . . . . . . . . . . . . ¥ 247,697 ¥ 316,349 ¥ 249,766 $ 2,493
Segment assets:
Total assets for segments . . . . . . . . . . . . . . . . . . . . . . . . . . . . . . . . . . . . . . . . . . . . . ¥ 6,318,969 ¥ 7,310,575 ¥ 7,878,777 $ 78,639
Cash and cash equivalents, restricted cash and time deposits . . . . . . . . . . . . . . . . . 424,262 337,645 465,049 4,641
Allowance for doubtful receivables on direct financing leases and probable loan losses . . . . . . . . . . . . . . . . . . . . . . . . . . . . . . . . . . . . . . . . . . . . . . . . (97,002) (89,508) (102,007) (1,018)
Other receivables . . . . . . . . . . . . . . . . . . . . . . . . . . . . . . . . . . . . . . . . . . . . . . . . . . . 165,657 212,324 284,286 2,837
Other corporate assets . . . . . . . . . . . . . . . . . . . . . . . . . . . . . . . . . . . . . . . . . . . . . . . 430,569 436,151 468,865 4,680
Total consolidated assets . . . . . . . . . . . . . . . . . . . . . . . . . . . . . . . . . . . . . . . . . . . . . ¥ 7,242,455 ¥ 8,207,187 ¥ 8,994,970 $ 89,779
FASB Statement No. 131 (“Disclosure about Segments of an Enterprise and Related Information”) requires disclosure of information about
geographic areas as enterprise-wide information. Since each segment is identified based on the nature of services for operations in Japan and on the
bases of geographic area for overseas operations, the information required is incorporated into the table. Japan and the United States of America are
the countries whose revenues from external customers are significant. Almost all the revenues of The Americas segment are derived from the United
States of America. The basis for attributing revenues from external customers to each segment is principally the location of the foreign subsidiaries
and foreign affiliates.
FASB Statement No. 131 requires disclosure of revenues from external customers for each product and service as enterprise-wide information. The
consolidated statements of income in which the revenues are categorized based on the nature of the types of business conducted include the
required information. No single customer accounted for 10% or more of the total revenues for fiscal 2006, 2007 and 2008.
160
ORIX Corporation — Annual Report 2008
Management’s Report on Internal Control over Financial Reporting
The management of ORIX Corporation (the Company) is responsible for establishing and maintaining adequate internal control over
financial reporting (as defined in Rules 13a-15 (f) under the Securities Exchange Act of 1934). The internal control over the financial
reporting process of the Company and its subsidiaries (the ORIX Group) was designed by, or under the supervision of, the Company’s Chief
Executive Officer, Chief Operating Officer, Chief Financial Officer and other executive officers performing similar functions, and effected by
the Company’s Board of Directors, management and other personnel, to provide reasonable assurance to the Company’s management and
Board of Directors regarding the preparation and fair presentation of financial statements for external purposes in accordance with
accounting principles generally accepted in the United States of America and includes those policies and procedures that:
• Pertain to the maintenance of records that in reasonable detail accurately and fairly reflect the transactions and dispositions of the
assets of the ORIX Group;
• Provide reasonable assurance that transactions are recorded as necessary to permit preparation of financial statements in accordance
with accounting principles generally accepted in the United States of America, and that receipts and expenditures of the ORIX Group
are being made only in accordance with authorizations of management and directors of the Company; and
• Provide reasonable assurance regarding prevention or timely detection of unauthorized acquisition, use or disposition of the ORIX
Group’s assets that could have a material effect on the financial statements.
Because of its inherent limitations, internal control over financial reporting may not prevent or detect misstatements. Also, projections
of any evaluation of effectiveness to future periods are subject to the risk that controls may become inadequate because of changes in
conditions, or that the degree of compliance with the policies or procedures may deteriorate.
The Company’s management assessed the effectiveness of the ORIX Group’s internal control over financial reporting as of March 31,
2008 by using the criteria set forth in ”Internal Control—Integrated Framework“ issued by the Committee of Sponsoring Organizations
of the Treadway Commission. Based on this assessment, the Company’s management concluded that the ORIX Group’s internal control
over financial reporting was effective as of March 31, 2008.
The effectiveness of the ORIX Group’s internal control over financial reporting has been audited by KPMG AZSA & Co., an
independent registered public accounting firm, who also audited our financial statements as of and for the year ended March 31, 2008,
as stated in their audit report appearing on page 162.
Yoshihiko MiyauchiRepresentative Executive OfficerChairman and Chief Executive Officer
Yukio YanaseRepresentative Executive OfficerPresident and Chief Operating Officer
Yasuhiko FujikiVice Chairman and Chief Financial Officer
Tadao TsuyaExecutive OfficerAccounting Department
July 2, 2008
161
ORIX Corporation — Annual Report 2008
Report of Independent Registered Public Accounting Firm
To the Shareholders and the Board of Directors of ORIX Corporation:
We have audited the accompanying consolidated balance sheets of ORIX Corporation (a Japanese corporation) and its subsidiaries as
of March 31, 2007 and 2008, and the related consolidated statements of income, shareholders’ equity and cash flows for each of the
years in the three-year period ended March 31, 2008, expressed in Japanese yen. These consolidated financial statements are the
responsibility of the Company’s management. Our responsibility is to express an opinion on these consolidated financial statements
based on our audits.
We conducted our audits in accordance with the standards of the Public Company Accounting Oversight Board (United States).
Those standards require that we plan and perform the audit to obtain reasonable assurance about whether the financial statements are
free of material misstatement. An audit includes examining, on a test basis, evidence supporting the amounts and disclosures in the
financial statements. An audit also includes assessing the accounting principles used and significant estimates made by management, as
well as evaluating the overall financial statement presentation. We believe that our audits provide a reasonable basis for our opinion.
In our opinion, the consolidated financial statements referred to above present fairly, in all material respects, the financial position of
ORIX Corporation and its subsidiaries as of March 31, 2007 and 2008, and the results of their operations and their cash flows for each
of the years in the three-year period ended March 31, 2008, in conformity with U.S. generally accepted accounting principles.
We also have audited, in accordance with the standards of the Public Company Accounting Oversight Board (United States), ORIX
Corporation’s internal control over financial reporting as of March 31, 2008, based on criteria established in Internal Control—Integrated
Framework issued by the Committee of Sponsoring Organizations of the Treadway Commission (COSO), and our report dated July 2,
2008 expressed an unqualified opinion on the effectiveness of ORIX Corporation’s internal control over financial reporting.
The accompanying consolidated financial statements as of and for the year ended March 31, 2008 have been translated into United
States dollars solely for convenience of the reader. We have audited the translation, and, in our opinion, the consolidated financial
statements, expressed in Japanese yen, have been translated into United States dollars on the basis set forth in Note 1 (ab) to the
consolidated financial statements.
Tokyo, Japan
July 2, 2008
162
ORIX Corporation — Annual Report 2008
Report of Independent Registered Public Accounting Firm
To the Shareholders and the Board of Directors of ORIX Corporation:
We have audited ORIX Corporation’s (a Japanese corporation) internal control over financial reporting as of March 31, 2008, based
on criteria established in Internal Control—Integrated Framework issued by the Committee of Sponsoring Organizations of the Treadway
Commission (COSO). The Company’s management is responsible for maintaining effective internal control over financial reporting and
for its assessment of the effectiveness of internal control over financial reporting, included in the accompanying Management’s Report
on Internal Control over Financial Reporting. Our responsibility is to express an opinion on ORIX Corporation’s internal control over
financial reporting based on our audit.
We conducted our audit in accordance with the standards of the Public Company Accounting Oversight Board (United States). Those
standards require that we plan and perform the audit to obtain reasonable assurance about whether effective internal control over
financial reporting was maintained in all material respects. Our audit included obtaining an understanding of internal control over
financial reporting, assessing the risk that a material weakness exists, and testing and evaluating the design and operating effectiveness
of internal control based on the assessed risk. Our audit also included performing such other procedures as we considered necessary in
the circumstances. We believe that our audit provides a reasonable basis for our opinion.
A company's internal control over financial reporting is a process designed to provide reasonable assurance regarding the reliability of
financial reporting and the preparation of financial statements for external purposes in accordance with generally accepted accounting
principles. A company's internal control over financial reporting includes those policies and procedures that (1) pertain to the
maintenance of records that, in reasonable detail, accurately and fairly reflect the transactions and dispositions of the assets of the
company; (2) provide reasonable assurance that transactions are recorded as necessary to permit preparation of financial statements in
accordance with generally accepted accounting principles, and that receipts and expenditures of the company are being made only in
accordance with authorizations of management and directors of the company; and (3) provide reasonable assurance regarding
prevention or timely detection of unauthorized acquisition, use, or disposition of the company’s assets that could have a material effect
on the financial statements.
Because of its inherent limitations, internal control over financial reporting may not prevent or detect misstatements. Also,
projections of any evaluation of effectiveness to future periods are subject to the risk that controls may become inadequate because of
changes in conditions, or that the degree of compliance with the policies or procedures may deteriorate.
In our opinion, ORIX Corporation maintained, in all material respects, effective internal control over financial reporting as of March
31, 2008, based on criteria established in Internal Control—Integrated Framework issued by the Committee of Sponsoring Organizations
of the Treadway Commission.
We also have audited, in accordance with the standards of the Public Company Accounting Oversight Board (United States), the
accompanying consolidated balance sheets of ORIX Corporation and its subsidiaries as of March 31, 2007 and 2008, and the related
consolidated statements of income, shareholders’ equity and cash flows for each of the years in the three-year period ended March 31,
2008, expressed in Japanese yen, and our report dated July 2, 2008 expressed an unqualified opinion on those consolidated financial
statements.
Tokyo, Japan
July 2, 2008


![CONSOLIDATED FINANCIAL STATEMENTS - Legal Mantra · 2019-10-12 · Consolidated Financial Statements [CFS] Provided that such class or classes of holding companies as may be prescribed](https://img.pdfslide.tips/doc/110x75/5f47d76a781f633d9926f084/consolidated-financial-statements-legal-mantra-2019-10-12-consolidated-financial.jpg)