Embed Size (px)
Citation preview

“Statistical Handbook of Japan 2017” by Statistics Bureau, Japan
Chapter 9
Transport
The number of foreign visitors to Japan in 2016 was 24.04 million people, which was the highest number ever since statistics came to be recorded in 1964. To achieve the goal of "[increasing] the number of foreign tourists to Japan to 40 million by 2020, and to 60 million by 2030" outlined in the "Tourism Vision to Support the Future of Japan" that was formulated by the government, approaches toward increasing air traffic capacity has been promoted, by combining "hard" aspects such as extending and installing more runways, with "soft" aspects, such as reexamining flight paths and reorganizing controlled airspace.
© Ministry of Land, Infrastructure, Transport and Tourism. Tokyo Airport Development Office, Kanto Regional Development Bureau.

TRANSPORT
95
1. Domestic Transport
Various modes of domestic transport are used in Japan; almost all passenger transport is by railway, while nearly all freight transport is by motor vehicle and cargo ship.
(1) Domestic Passenger Transport
No major changes have been observed in recent years in the volume of domestic passenger transport. Under these circumstances, a shift from private automobiles to public transportation should be promoted as a measure against global warming, along with promotion of the development and distribution of environment-friendly vehicles and measures for traffic flow improvement. Therefore, in addition to the promotion of computerization, such as adoption of IC cards (multiple-use IC [integrated
0 100 200 300 400 500 600
FY2015
FY2005
Billion passenger-km
Passengers
Figure 9.1Composition of Domestic Transport
0 100 200 300 400 500 600
FY2015
FY2005
Billion ton-km
Freight
Source: Ministry of Land, Infrastructure, Transport and Tourism.
▼ Motor vehicles
Railways 69.5
Airlines
Motor vehicles 58.6% Cargo ships 37.2 Airlines 0.2
72.4 14.9
50.2 44.3 5.3
4.0
0.3
15.0%
12.1
14.8Passengerships 0.7
Railways
0.5

TRANSPORT
96
circuit] cards) and increased convenience in public transportation through the improvement of transfers, workplace "eco-commuting" measures have been promoted.
In fiscal 2015, the number of domestic transport passengers was 30.51 billion (up 2.2 percent from the previous fiscal year). The total volume of passenger transport was 590.28 billion passenger-kilometers (up 2.4 percent).
In fiscal 2015, the Japan Railways (JR) group reported 9.31 billion passengers (up 2.4 percent from the previous fiscal year) and 269.39 billion passenger-kilometers (up 3.6 percent). Railways other than JR reported 14.98 billion passengers (up 3.2 percent) and 158.09 billion passenger-kilometers (up 2.7 percent).
To promote the use of buses, approaches to improve punctuality and speed using bus lanes and to make buses more convenient, such as by introducing a bus location system that provides locational information of buses as well as an IC card system that enables smooth bus rides, are being carried out. Commercial buses recorded an increase in passengers to 4.57 billion (up 1.4 percent from the previous fiscal year), but a decline in passenger-kilometers to 64.94 billion (down 1.1 percent) in fiscal 2015.
Table 9.1Domestic Passenger Transport
FY2014 FY2015 FY2014 FY2015Total transport volume ......... 29,838,333 30,505,204 576,235 590,284 Railways ............................. 23,599,851 24,289,894 413,970 427,486 JR (Japan Railways) ......... 9,088,121 9,308,375 260,097 269,394 Other than JR ................... 14,511,730 14,981,519 153,873 158,092 Motor vehicles .................... 6,057,426 6,031,303 72,579 71,443 Buses (Commercial use) .. 4,500,163 4,565,210 65,649 64,936 Taxis and limousine hires 1,557,263 1,466,093 6,930 6,508 Airlines ............................... 95,197 96,063 86,763 88,216 Passenger ships .................. 85,859 87,944 2,923 3,139
ItemPassengers carried
(thousands)Passenger kilometers
(millions)
Source: Ministry of Land, Infrastructure, Transport and Tourism.

TRANSPORT
97
In recent years, in order to beef up Japan's competitiveness in the global arenas of business and tourism, development of aviation networks has been carried out, such as through enhancements to the functions of the metropolitan airports, promotion of entry of LCCs that could create new demand for aviation through the expansion of domestic tourism, etc. Fiscal 2015 air transport records show that there were 96.06 million passengers (up 0.9 percent from the previous fiscal year), and passenger-kilometers amounted to 88.22 billion (up 1.7 percent).
In fiscal 2015, passenger ships reported 87.94 million passengers (up 2.4 percent from the previous fiscal year) and 3.14 billion passenger-kilometers (up 7.4 percent).
(2) Domestic Freight Transport
In the area of domestic freight, a total of 4.70 billion metric tons (down 0.7 percent from the previous fiscal year) of freight was transported for a total of 407.27 billion ton-kilometers (down 1.9 percent) in fiscal 2015. As for transport tonnage volume in fiscal 2015, motor vehicle transport accounted for more than 90 percent of the total.
Table 9.2Domestic Freight Transport
FY2014 FY2015 FY2014 FY2015Total transport volume .......................... 4,729,581 4,698,710 415,207 407,272 Railways .............................................. 43,424 43,210 21,029 21,519 Motor vehicles ..................................... 4,315,836 4,289,000 210,008 204,316 Commercial use ................................ 2,934,361 2,916,827 181,160 175,981 Non-commercial use ......................... 1,381,475 1,372,174 28,848 28,335 Cargo ships .......................................... 369,302 365,486 183,120 180,381 Airlines 1) ............................................. 1,019 1,014 1,050 1,0561) Including overweight baggage and postal mail.Source: Ministry of Land, Infrastructure, Transport and Tourism.
ItemFreight tonnage
(thousands)Ton kilometers
(millions)

TRANSPORT
98
2. International Transport
(1) International Passenger Transport
The global economic downturns after September 2008, the spread of new influenza in early 2009, and the influence of the Great East Japan Earthquake decreased international air passenger transport with Japanese airlines. In 2012, this trend reversed to an increase, and in 2015, Japanese airlines transported 18.25 million passengers (up 11.6 percent from the previous year) on international flights, and registered 82.11 billion passenger-kilometers (up 11.5 percent). Both recorded their fourth consecutive year of increase.
The number of Japanese overseas travelers in 2016 was 17.12 million (up 5.6 percent from the previous year). The number of foreign visitors to Japan in 2016 was 24.04 million, representing an increase of 21.8 percent from the previous year. The number of visitors was the highest ever since statistics came to be recorded in 1964.
Figure 9.2Japanese Overseas Travelers and Foreign Visitor Arrivals
Source: Ministry of Justice; Japan National Tourism Organization.
02468
101214161820222426
Millions
2007 08 09 10 11 12 13 14 15 16
Japanese travelers (Males)
Japanese travelers (Females)Foreign visitors

TRANSPORT
99
According to reports on arrivals by tourist offices in countries around the world, the U.S.A., China and the Republic of Korea had many Japanese visitors in 2015.
Table 9.3Japanese Travelers
Number ofarrivals
Annualchange (%)
Number ofarrivals
Annualchange (%)
Number ofarrivals
Annualchange (%)
U.S.A. 1) 2) ............... 3,730,287 0.9 3,620,224 -3.0 3,758,297 3.8China 3) .................... 2,877,533 -18.2 2,717,600 -5.6 2,497,700 -8.1Korea, Rep. of 3) ..... 2,747,750 -21.9 2,280,434 -17.0 1,837,782 -19.4Taiwan 4) ................. 1,381,142 -0.8 1,594,911 15.5 1,586,489 -0.5Thailand 2) ............... 1,515,718 13.0 1,254,858 -17.2 1,349,388 7.5Hong Kong SAR 2) .. 607,877 -21.5 636,432 4.7 632,959 -0.5Germany 4) ............... 711,529 -3.1 670,804 -5.7 647,243 -3.5France 2) ................... 660,841 -6.6 776,870 17.6 682,121 -12.2
2014 2015Country or areaof destination
1) Including territories and dependencies (Northern Mariana Islands, Guam, AmericanSamoa, Puerto Rico and United States Virgin Islands, etc.). 2) Arrivals of non-residenttourists at national borders, by country of residence. 3) Arrivals of non-resident visitors atnational borders, by nationality. 4) Arrivals of non-resident tourists in all types ofaccommodation establishments, by country of residence.Source: Japan National Tourism Organization.
2013

TRANSPORT
100
The number of foreign visitors to Japan in 2016 broken down by country/region, the number of visitors from Asian countries was highest, totaling 20.43 million (up 22.7 percent from the previous year). Among Asian countries, the number of visitors from China was highest, amounting to 6.37 million, a figure that accounted for 26.5 percent of the total number of foreign visitors to Japan.
This increase is attributed to expanding aviation networks, an increase in demand for visits to Japan by foreigners through continuous promotion of tourism, visa alleviation measures for various Southeast Asian countries, expansion of the consumption tax exemption program, etc.
In 2016, of the total number of foreign visitors to Japan, tourists numbered 21.05 million people, or 87.6 percent of total foreign visitors. The highest number of tourists came from China, with 5.53 million travelers, followed by the Republic of Korea, with 4.59 million travelers.
Table 9.4Foreign Visitors
2014 2015 2016*Number of
arrivalsPercentagedistribution
Number ofarrivals
Percentagedistribution
Number ofarrivals
Percentagedistribution
Total arrivals 1) ........ 13,413,467 100.0 19,737,409 100.0 24,039,053 100.0Asia ........................10,819,211 80.7 16,645,843 84.3 20,428,224 85.0
China ................... 2,409,158 18.0 4,993,689 25.3 6,372,948 26.5Korea, Rep. of ..... 2,755,313 20.5 4,002,095 20.3 5,090,302 21.2Taiwan ................. 2,829,821 21.1 3,677,075 18.6 4,167,504 17.3Hong Kong SAR . 925,975 6.9 1,524,292 7.7 1,839,189 7.7Thailand ............... 657,570 4.9 796,731 4.0 901,458 3.7Singapore ............. 227,962 1.7 308,783 1.6 361,804 1.5
Europe.................... 1,048,731 7.8 1,244,970 6.3 1,422,032 5.9U.K. ..................... 220,060 1.6 258,488 1.3 292,457 1.2
Africa...................... 28,336 0.2 31,918 0.2 33,770 0.1North America ....... 1,112,317 8.3 1,310,606 6.6 1,570,400 6.5
U.S.A. .................. 891,668 6.6 1,033,258 5.2 1,242,702 5.2Canada ................. 182,865 1.4 231,390 1.2 273,211 1.1
South America ....... 56,873 0.4 74,198 0.4 77,985 0.3Oceania................... 347,339 2.6 429,026 2.2 505,541 2.1
Australia .............. 302,656 2.3 376,075 1.9 445,237 1.91) Including stateless people, etc.Source: Japan National Tourism Organization.
Region, country orarea of origin

TRANSPORT
101
(2) International Freight Transport
The volume of seaborne foreign transport in 2015 was 1,056 million tons, up 2.0 percent over the previous year. Of this figure, total exports increased by 4.1 percent to 61 million tons, and total imports increased by 1.8 percent to 545 million tons.
Air-shipped international freight in 2015 totaled 1.40 million tons in terms of volume (up 0.9 percent from the previous year) and 7.95 billion tons in terms of ton-kilometers (up 3.3 percent).
Table 9.5Seaborne Foreign Transport
(Thousand tons)
1995 703,606 38,761 529,929 134,9162000 739,377 34,960 538,875 165,5422005 777,869 45,404 529,239 203,2252010 819,075 44,758 465,898 308,4192014 1,035,239 58,431 535,244 441,563
2015* 1,056,144 60,802 544,702 450,639Source: Ministry of Land, Infrastructure, Transport and Tourism.
Year Total ImportsExports Cross Transport

“Statistical Handbook of Japan 2017” by Statistics Bureau, Japan
Chapter 10
Commerce
Ouchi-juku, which is located in the mountainous area of southern Fukushima Prefecture, prospered as a post town along the highway linking the castle town of Aizu-jo (present-day Fukushima Prefecture) to Shimotsuke-no-Kuni (present-day Tochigi Prefecture) during the Edo period. A large amount of food and goods were carried on this highway, which is also where the daimyo (feudal lords), their vassals, and travelers lodged and rested. Today, there are many eating and drinking places, souvenir shops, and guesthouses along Ouchi-juku, which is approximately one kilometer in total length. According to the "2014 Economic Census for Business Frame", there were 620,000 establishments and 4.23 million persons engaged in eating and drinking places in 2014.
© HARADA Ryouhei

COMMERCE
103
1. Wholesale and Retail
The "2014 Economic Census for Business Frame" showed that 1.41 million wholesale and retail establishments were in operation in Japan. The number of persons engaged at such establishments became 12.03 million. Sales in the wholesale and retail industries amounted to 425.69 trillion yen, accounting for 30.9 percent of the total of all industries.
(1) Wholesale Trade
The number of wholesale establishments was 382,000 in 2014. Observed by size of operation in terms of persons engaged, establishments with less than 20 persons accounted for 89.4 percent of the total. A total of 87.1 percent were corporations, while 12.8 percent were individual proprietorships.
Table 10.1Establishments and Persons Engaged in the Wholesale and Retail Sector (2014)
Item Total Wholesale Retail Number of Establishments .............................................. 1,407,235 382,354 1,024,881
Size of operation (persons engaged) 1-4 persons ................................................................ 809,916 190,323 619,5935-9 ............................................................................. 298,416 96,811 201,60510-19 ......................................................................... 177,077 54,538 122,53920-29 ......................................................................... 55,568 17,187 38,38130-49 ......................................................................... 32,132 11,685 20,44750-99 ......................................................................... 19,320 6,486 12,834100 and over .............................................................. 9,141 3,366 5,775Loaned or dispatched employees only ....................... 5,665 1,958 3,707
Persons engaged ............................................................... 12,031,345 4,009,494 8,021,851Regular employees ......................................................... 10,152,342 3,485,161 6,667,181
Full-time employees ................................................. 5,340,113 2,806,083 2,534,030Other than full-time employees 1).............................. 4,812,229 679,078 4,133,151
Temporary employees .................................................... 413,291 77,218 336,073Loaned or dispatched employees from
the separately operated establishments ...................... 322,235 128,786 193,449Loaned or dispatched employees to
the separately operated establishments ...................... 117,395 87,583 29,812
Source: Statistics Bureau, MIC.
1) Among regular employees, excludes workers generally referred to as "full-time employees" and"regular members of staff" and includes those referred to as "contract employees", "non-regularmembers of staff", "part-timers", and similar appellations.

COMMERCE
104
The number of persons engaged in wholesale was 4.01 million in 2014, of which 756,000 were persons other than full-time employees (including those who are referred to as "contract employees", "non-regular members of staff", "part-timers", and similar appellations) and temporary employees, making up 18.9 percent of the total.
(2) Retail Trade
The number of retail establishments in operation totaled 1.02 million in 2014. Observed by size of operation in terms of persons engaged, establishments with less than 10 persons accounted for 80.1 percent of the total. By type of legal organization, 59.5 percent of retail establishments were corporations, while 40.3 percent were individual proprietorships. The proportion of individual proprietorships was higher in the retail sector than in the wholesale sector.
The number of persons engaged in retail was 8.02 million in 2014, of which 4.47 million were persons other than full-time employees (including those referred to as "contract employees", "non-regular members of staff", "part-timers", and similar appellations) and temporary employees, comprising 55.7 percent of the total.
2. Eating and Drinking Places
There were 620,000 eating and drinking places establishments in operation and 4.23 million persons engaged at them in 2014.
Table 10.2Eating and Drinking Places (2014)
Number Ratio (%) Number Ratio (%)Total ........................................................ 619,629 100.0 4,230,881 100.0
1-4 persons ......................................... 382,051 61.7 820,526 19.45-9 ....................................................... 119,600 19.3 777,767 18.410-19 ................................................... 69,025 11.1 938,339 22.220-29 ................................................... 27,491 4.4 649,378 15.330 and over ......................................... 20,813 3.4 1,044,871 24.7Loaned or dispatched employees only .. 649 0.1 - -
Source: Statistics Bureau, MIC.
Establishments Persons engagedSize of operation(persons engaged)

“Statistical Handbook of Japan 2017” by Statistics Bureau, Japan
Chapter 11
Trade, International Balance of Payments, and
International Cooperation
Since ancient times, the Kobe Port has been interacting with ports in mainland China and the Korean Peninsula. During the Heian Period (794 to 1192), it developed as a base for international trade. In the Edo Period under the policy of seclusion, it played an important role as a strategic point for domestic traffic. After the opening of the Port in 1868, it came to always maintain the latest facilities, as an international trade port and a base through which people, goods, and information pass, and developed into a port that is representative of the world. According to statistics by the Ministry of Land, Infrastructure, Transport and Tourism, the Kobe Port boasted the third highest container traffic in Japan in 2015, following Tokyo Port and Yokohama Port.
© Nipponkoun.co.,ltd.
TRADE, INTERNATIONAL BALANCE OF PAYMENTS, AND INTERNATIONAL COOPERATION
106
1. Trade
(1) Overview of Trade
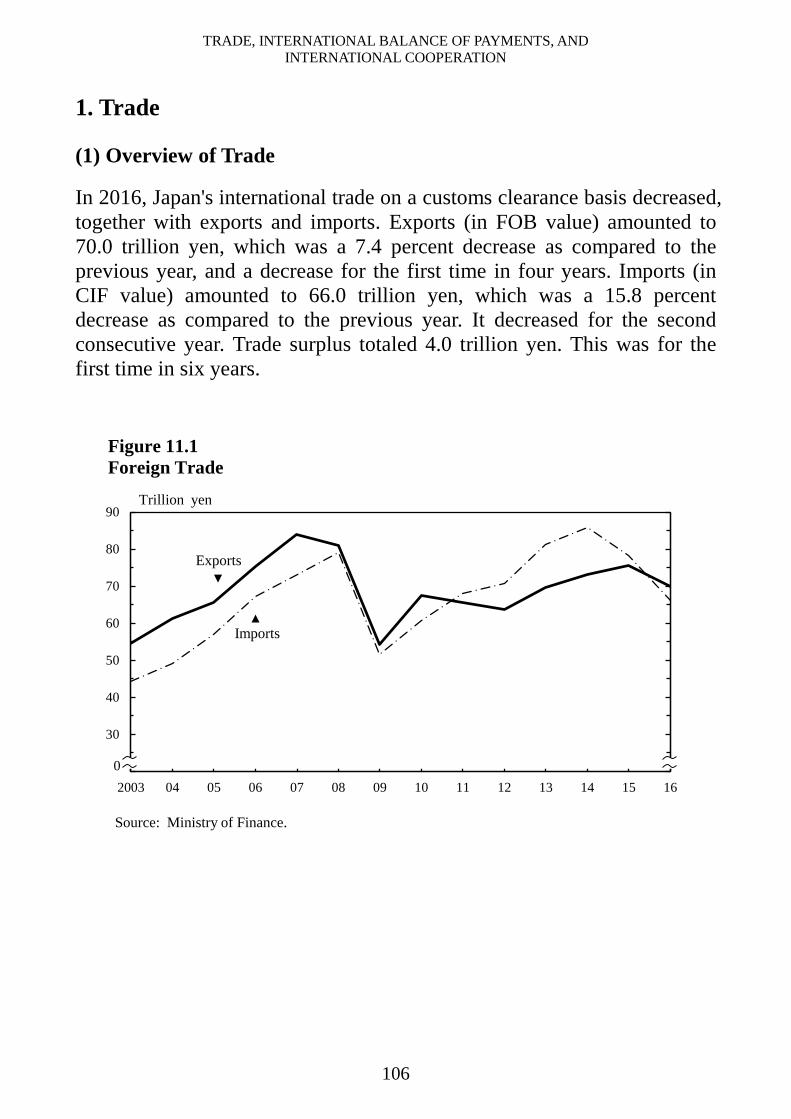
In 2016, Japan's international trade on a customs clearance basis decreased, together with exports and imports. Exports (in FOB value) amounted to 70.0 trillion yen, which was a 7.4 percent decrease as compared to the previous year, and a decrease for the first time in four years. Imports (in CIF value) amounted to 66.0 trillion yen, which was a 15.8 percent decrease as compared to the previous year. It decreased for the second consecutive year. Trade surplus totaled 4.0 trillion yen. This was for the first time in six years.
20
30
40
50
60
70
80
90
2003 04 05 06 07 08 09 10 11 12 13 14 15 16
Trillion yen
Figure 11.1Foreign Trade
Source: Ministry of Finance.
0
Imports
Exports

TRADE, INTERNATIONAL BALANCE OF PAYMENTS, AND INTERNATIONAL COOPERATION
107
Japan's 2016 exports decreased by 7.6 percent from the previous year in terms of unit value index (the first decrease in seven years), and increased by 0.2 percent from the previous year in terms of quantum index (the first increase in two years).
Japan's imports in 2016, unit value index and quantum index, decreased by 15.5 percent and 0.4 percent compared to the previous year; both indices recorded a decrease for the second consecutive year.
(2) Trade by Commodity
Japan's exports in 2016 consisted of transport equipment, which accounted for the largest portion of the total export value, 24.8 percent, followed by general machinery and electrical machinery, making up 19.4 percent and 17.6 percent, respectively. Motor vehicles, which are in the transport equipment category, constituted 16.2 percent of the total export value, down 0.7 percent in quantity and down 5.9 percent in value from the previous year. One characteristic of Japan's exports is the large proportion of high value-added products manufactured with advanced technology, such as motor vehicles, iron and steel, and integrated circuits.
Table 11.1Trends in Foreign Trade and Indices of Trade
Value (billion yen) Indices of trade (2010=100)(Customs clearance basis) Exports Imports
Year
2007 83,931 73,136 10,796 124.5 111.4 111.8 120.4 103.2 116.72008 81,018 78,955 2,063 120.2 109.7 109.6 129.9 102.5 126.72009 54,171 51,499 2,671 80.4 80.5 99.8 84.8 87.8 96.52010 67,400 60,765 6,635 100.0 100.0 100.0 100.0 100.0 100.02011 65,546 68,111 -2,565 97.3 96.2 101.1 112.1 102.6 109.32012 63,748 70,689 -6,941 94.6 91.6 103.3 116.3 105.0 110.82013 69,774 81,243 -11,468 103.5 90.2 114.8 133.7 105.3 127.02014 73,093 85,909 -12,816 108.4 90.7 119.6 141.4 106.0 133.42015 75,614 78,406 -2,792 112.2 89.8 125.0 129.0 103.0 125.32016 70,036 66,042 3,994 103.9 90.0 115.5 108.7 102.6 105.9
1) Quantum index = Value index / Unit value index × 100Source: Ministry of Finance.
Quantumindex 1)
Unitvalueindex
BalanceQuantumindex 1)
Unitvalueindex
Valueindex
Imports(CIF)
Exports(FOB)
Valueindex

TRADE, INTERNATIONAL BALANCE OF PAYMENTS, AND INTERNATIONAL COOPERATION
108
The leading import item category was mineral fuels, which represented 18.2 percent of the total value imported, followed by electrical machinery and chemicals, with 16.3 percent and 10.8 percent, respectively. Crude petroleum and partially refined petroleum, in the mineral fuels category, constituted 8.4 percent of the total import value, down 0.5 percent in quantity and down 32.4 percent in value from the previous year.
24.8%
18.2%
19.4
16.3
17.6
10.8
11.2
9.6
10.2
9.6 9.2 6.1
13.3
15.4
0% 100%
Exports70.0 trillion yen
Imports66.0 trillion yen
Mineral fuels▼ ▼▼
RawmaterialsChemicals
▼OthersChemicalsTransport equipment
Figure 11.2Component Ratios of Foreign Trade by Commodity (2016)
Electrical machinery
1) Consisting of iron and steel products, non-ferrous metals, textile yarn and fabrics, etc.Source: Ministry of Economy, Trade and Industry.
0 100 %20 40 60 80
Mineral fuels 1.3
General machinery
Manufactured goods 1)
FoodstaffsTransport equipment 4.7
Others
▼
General machinery
▼
Electrical machinery
Manufactured goods 1)
▼
Raw materials 1.4 Foodstaffs 0.9

TRADE, INTERNATIONAL BALANCE OF PAYMENTS, AND INTERNATIONAL COOPERATION
109
Table 11.2Value of Exports and Imports, by Principal Commodity
(Billion yen)
Item 2013 2014 2015 2016Annualgrowth
(%)
Exports, total ............................................ 69,774 73,093 75,614 70,036 -7.4 Foodstuffs ............................................... 436 482 599 607 1.4 Raw materials ......................................... 1,206 1,194 1,137 947 -16.7 Mineral fuels ........................................... 1,533 1,517 1,245 898 -27.9 Chemicals ............................................... 7,507 7,818 7,759 7,123 -8.2 Plastic materials ................................... 2,259 2,413 2,444 2,272 -7.1 Manufactured goods 1) ............................ 9,177 9,464 9,220 7,847 -14.9 Iron and steel products ......................... 3,793 3,958 3,668 2,843 -22.5 General machinery .................................. 13,359 14,218 14,424 13,613 -5.6 Power generating machinery ................ 2,520 2,540 2,591 2,416 -6.8 Electrical machinery ............................... 12,052 12,650 13,289 12,322 -7.3 Semiconductors and other electronic parts ......................... 3,553 3,691 3,915 3,607 -7.8 Transport equipment ............................... 16,332 16,907 18,141 17,338 -4.4 Motor vehicles ...................................... 10,413 10,919 12,046 11,333 -5.9 Others ...................................................... 8,172 8,844 9,801 9,340 -4.7 Scientific and optical instruments ........ 2,223 2,436 2,376 2,046 -13.9
Imports, total ............................................ 81,243 85,909 78,406 66,042 -15.8 Foodstuffs ............................................... 6,473 6,732 7,002 6,363 -9.1 Raw materials ......................................... 5,358 5,590 4,853 4,012 -17.3 Mineral fuels ........................................... 27,444 27,692 18,218 12,052 -33.8 Petroleum, crude and partially refined . 14,245 13,873 8,185 5,532 -32.4 Chemicals ............................................... 6,464 6,864 7,748 7,111 -8.2 Medical and pharmaceutical products .. 2,138 2,214 2,924 2,780 -4.9 Manufactured goods 1) ............................. 6,245 6,994 7,039 6,068 -13.8 Non-ferrous metals ............................... 1,541 1,692 1,683 1,344 -20.1 General machinery .................................. 5,969 6,761 7,068 6,357 -10.1 Computers and units ............................. 1,928 2,122 1,973 1,724 -12.6 Electrical machinery ............................... 10,309 11,532 12,014 10,792 -10.2 Communication equipment................... 2,679 2,865 2,933 2,722 -7.2 Transport equipment ............................... 2,788 3,056 3,126 3,094 -1.0 Others ...................................................... 10,192 10,688 11,336 10,193 -10.1 Clothing and clothing accessories ........ 3,248 3,260 3,415 2,998 -12.2
1) Consisting of iron and steel products, non-ferrous metals, textile yarn and fabrics, etc.Source: Ministry of Finance.

TRADE, INTERNATIONAL BALANCE OF PAYMENTS, AND INTERNATIONAL COOPERATION
110
15.1%
14.0
12.6
Others44.6
Motor vehicles, parts and accessories (3,668 billion
yen) China
China66.9%
Clothing(3,415 billion yen)
U.S.A36.4%
Others45.5
Motor vehicles(12,046 billion yen)
33.1%
U.A.E.26.1
Others16.3
Petroleum(8,185 billion yen)
China23.0
Taiwan35.8%
Semiconductors(2,996 billion yen)
Figure 11.3Japan's Major Export and Import Commodities (2016)
Canada 2.7
Saudi Arabia
Russia 8.9
25.4%
16.215.7
Others27.8
Semiconductors(3,915 billion yen)
China
Hong Kong SAR
Others19.5
Thailand
Taiwan 5.4 U.S.A. 6.7
Korea, Rep. of Others 16.5
Viet Nam 10.3
Taiwan
Source: Ministry of Finance.
Exports Imports
Korea, Rep. of
Malaysia 5.0
Indonesia 3.3
9.4
16.3%
14.2
13.1
Others44.3
Iron and steel(2,843 billion yen)
China
China63.6%
Clothing(2,998 billion yen)
U.S.A38.9%
Others43.6
Motor vehicles(11,333 billion yen)
Australia 6.0
35.3%
U.A.E.25.4
Others17.2
Petroleum(5,532 billion yen)
China 4.7
China20.5
Taiwan38.1%
Semiconductors(2,515 billion yen)
Figure 11.3Japan's Major Export and Import Commodities (2016)
U.A.E. 4.1
Saudi Arabia
Qatar 9.2
Iran 6.4
25.6%
17.915.4
Others26.9
Semiconductors(3,607 billion yen)
China
Hong Kong SARKorea, Rep. of 7.2
Others21.5
Thailand
Korea, Rep. of Others 15.7
Viet Nam 11.5
Taiwan
Source: Ministry of Finance.
Exports Imports
Korea, Rep. of
Malaysia 4.5
Indonesia 3.4
13.9
Russia 6.5
7.3
U.S.A 7.0
U.S.A.

TRADE, INTERNATIONAL BALANCE OF PAYMENTS, AND INTERNATIONAL COOPERATION
111
(3) Trade by Country/Region
Japan has maintained a trade surplus with Asia and the U.S.A., while having a continuous trade deficit with the Middle East and Oceania.
(A) Trade with Asia
Japan's 2016 trade balance with Asia resulted in a 3.9 trillion yen in surplus, an increase for the second consecutive year (up 98.4 percent from the previous year). Exports (in FOB value) totaled 37.1 trillion yen (down 8.0 percent), a decrease for the first time in four years; this was mainly due to the contributions for the decrease in manufactured goods and electrical machinery. Imports (in CIF value) amounted to 33.2 trillion yen (down 13.5 percent), a decrease for the second consecutive year; this was mainly attributed to the decrease in mineral fuels.
In 2016, Japan's trade with China amounted to 12.4 trillion yen in exports and 17.0 trillion yen in imports. The percentage of the total amount of Japan's imports and exports that is accounted for by imports and exports between Japan and China is approximately 20 percent, signifying that China is Japan's largest trading counterpart.
Table 11.3Trends in Exports and Imports by Country/Region
China Korea,Rep. of Taiwan
Exports from Japan2012 63,748 34,855 11,509 4,911 3,673 11,188 6,501 2,262 1,8372013 69,774 37,867 12,625 5,512 4,061 12,928 # 7,000 2,478 2,0292014 73,093 39,518 13,381 5,456 4,232 13,649 7,585 2,988 1,9582015 75,614 40,329 13,223 5,327 4,473 15,225 7,985 3,167 2,0992016 70,036 37,107 12,361 5,020 4,268 14,143 7,982 2,585 2,010
Imports to Japan2012 70,689 31,306 15,039 3,234 1,921 6,082 6,642 13,542 4,9012013 81,243 35,972 17,660 3,493 2,315 6,815 # 7,649 15,667 5,3762014 85,909 38,618 19,176 3,531 2,568 7,543 8,169 15,826 5,7062015 78,406 38,358 19,429 3,244 2,817 8,060 8,625 9,571 4,8872016 66,042 33,199 17,019 2,722 2,495 7,322 8,152 6,501 3,843
1) EU member countries were 27 countries, before July 2013.Source: Ministry of Finance.
(Billion yen)
Total OceaniaU.S.A. EU 28 1) MiddleEastAsiaYear

TRADE, INTERNATIONAL BALANCE OF PAYMENTS, AND INTERNATIONAL COOPERATION
112
(B) Trade with U.S.A.
Japan's 2016 trade balance with the U.S.A. showed a surplus of 6.8 trillion yen (down 4.8 percent from the previous year), a decrease for the first time in two years. The U.S.A. has been the biggest export counterpart for Japan for four consecutive years. Exports (in FOB value) totaled 14.1 trillion yen (down 7.1 percent), declining for the first time in five years. This was due mainly to the drops in general machinery and electrical machinery. Imports (in CIF value) totaled 7.3 trillion yen (down 9.2 percent), declining for the first time in seven years. This was due mainly to the drops in foodstuffs and chemicals.
(C) Trade with EU
In 2016, Japan's exports (in FOB value) to the EU (28 countries) decreased by 0.04 percent year-on-year, to 8.0 trillion yen. Commodities such as general machinery and electrical machinery contributed to the drop in exports. Imports (in CIF value) from the EU (28 countries) totaled 8.2 trillion yen, down 5.5 percent from the previous year. Commodities such as chemicals and general machinery contributed to the drop in imports. As a result, Japan's trade balance with the EU (28 countries) registered a deficit of 170.0 billion yen.

TRADE, INTERNATIONAL BALANCE OF PAYMENTS, AND INTERNATIONAL COOPERATION
113
0
2
4
6
8
10
12
14
16
18
20
2007 09 11 13 150
2
4
6
8
10
12
14
16
18
20
2007 09 11 13 15 16
Figure 11.4Trends in Japan's Trade by Country/Region
1) 25 countries: from May 2004 to Dec. 2006, 27 countries: from Jan. 2007 to June 2013, 28 countries: from July 2013 onward.Source: Ministry of Finance.
Imports to JapanTrillion yen
Exports from Japan
EU 1)
Taiwan
Korea, Rep. of
U.S.A.
China
Trillion yen
Taiwan
Korea, Rep. of EU 1)
16
China
U.S.A

TRADE, INTERNATIONAL BALANCE OF PAYMENTS, AND INTERNATIONAL COOPERATION
114
2. International Balance of Payments Breaking down the current account in 2016, goods and services rose by 7.2 trillion yen from the previous year to 4.4 trillion yen. This trade surplus was for the first time in six years. This was due to the trade balance turning into a surplus, and the service balance shrinking by the degree of deficit. As a result, the current account totaled 20.3 trillion yen, and its surplus bulged for the second consecutive year.
Breaking down the financial account in 2016, there was a decrease in net assets for direct investment as compared to the previous year. However, since there was an increase in net assets for portfolio investment as compared to the previous year, the financial account amounted to 28.7 trillion yen.
Table 11.4International Balance of Payments
(Billion yen)2013 2014 2015 2016
Current account .................................................. 4,456.6 3,921.5 16,235.1 20,342.1Goods and services ....................................... -12,252.1 -13,498.8 -2,816.9 4,377.1
Goods ..................................................... -8,773.4 -10,465.3 -886.2 5,525.1Exports ............................................. 67,829.0 74,074.7 75,274.2 68,979.7Imports ............................................. 76,602.4 84,540.0 76,160.4 63,454.6
Services .................................................. -3,478.6 -3,033.5 -1,930.7 -1,148.0Primary income ............................................ 17,697.8 19,414.8 21,018.9 18,101.1Secondary income ........................................ -989.2 -1,994.5 -1,966.9 -2,136.1
Capital account ................................................... -743.6 -208.9 -271.4 -743.3Financial account 1) ............................................ -408.7 6,278.2 21,592.0 28,698.5
Direct investment ......................................... 14,245.9 12,587.7 15,847.6 14,562.4Portfolio investment ..................................... -26,565.2 -4,833.0 16,029.4 30,354.3Financial derivatives (other than reserves) ... 5,551.6 3,764.4 2,143.9 -1,723.5Other investment .......................................... 2,508.5 -6,130.6 -13,053.9 -13,916.6Reserve assets ............................................... 3,850.4 889.8 625.1 -578.0
Net errors and omissions .................................... -4,121.7 2,565.6 5,628.3 9,099.71) Positive figures (+) show increase in net assets, negative figures (-) show decrease in netassets.Source: Ministry of Finance.
Item

TRADE, INTERNATIONAL BALANCE OF PAYMENTS, AND INTERNATIONAL COOPERATION
115
Japan's external assets (the balance of overseas assets held by residents in Japan) as of the end of 2016 amounted to 997.8 trillion yen, while its external liabilities (assets held in Japan by nonresidents) were 648.7 trillion yen. As a result, Japan's net external assets (external assets minus external liabilities) were 349.1 trillion yen.
Japan's foreign reserve assets remained at around 220 billion U.S. dollars during the period from 1996 to 1998. Beginning in 1999, foreign reserve assets increased continuously. At the end of 2012, however, they began to decrease, falling to 1,268.1 billion U.S. dollars (down 2.1 percent year-on-year). Moreover, at the end of 2016, they were amounted to 1,216.9 billion U.S. dollars (down 1.3 percent), marking a fifth consecutive annual decrease.
Table 11.5Trends in Japan's International Investment Position 1)
(Billion yen)2012 2013 2014 2015 2016
Assets .................................... 658,927 797,686 942,381 949,919 997,771Liabilities .............................. 359,625 471,955 578,971 610,702 648,658Net assets .............................. 299,302 325,732 363,409 339,217 349,1121) End of year.Source: Ministry of Finance.
Item
Table 11.6Reserve Assets
(Million U.S. dollars)
End of year
2012 1,268,125 1,193,077 13,697 19,911 40,939 5012013 1,266,815 1,202,443 14,202 20,129 29,560 4812014 1,260,548 1,199,651 11,993 18,895 29,504 5052015 1,233,214 1,179,004 9,531 18,048 26,134 4972016 1,216,903 1,157,790 12,019 18,087 28,516 491
1) Including securities in market value. 2) Market value. 3) Including Asian Bond Fund. Source: Ministry of Finance.
Otherreserveassets 3)
TotalForeign
currency 1)
Reservepositionin IMF
SDRs Gold 2)

TRADE, INTERNATIONAL BALANCE OF PAYMENTS, AND INTERNATIONAL COOPERATION
116
The yen was worth 83.19 yen to the U.S. dollar in May 1995. The trend subsequently shifted to a progressively weaker yen, which eventually reached 143.79 yen to the U.S. dollar in July 1998. After hovering between the 100 and 140 yen ranges for the most part, the yen began appreciating sharply in late 2008. From 2011 into 2012, the yen stayed between the higher 70 yen range and the lower 80 yen range. In April 2013, the Bank of Japan introduced quantitative and qualitative monetary easing to put an end to deflation. Based on this, the exchange rate shifted towards yen depreciation. Afterwards, after continuing to hold steady, there was a trend towards somewhat of a yen appreciation. As of April 2017, the exchange rate was 111.29 yen per U.S. dollar.
3. International Cooperation
In Japan, there are diverse international cooperation donors: official development assistance (ODA) by the government, direct investments and export credits by private corporations, grants by private nonprofit agencies, assistance activities by NGOs and volunteer citizen groups, etc. In addition, there are various forms of assistance, including bilateral assistance and assistance through multilateral institutions.
Figure 11.5Yen Exchange Rate against the U.S. Dollar
70
80
90
100
110
120
130
140
150
16096 97 98 99 00 01 02 03 04 05 06 07 08 09 10 11 12 13 14 15 16 171995
Source: Bank of Japan.
Yen

TRADE, INTERNATIONAL BALANCE OF PAYMENTS, AND INTERNATIONAL COOPERATION
117
In the ODA framework, Japan's spending (on the basis of net disbursement at current prices) in 2015 decreased by 3.0 percent over the previous year to 9.2 billion U.S. dollars. Japan has contributed to the growth of developing countries as the world's number-one ODA donor for ten consecutive years up until 2000. Recently, Japan's ODA budget has been declining because of the country's severe economic and financial situation.
In the 2015 comparison of the ODA provided by the member countries of the Development Assistance Committee (DAC) of the OECD, Japan was the fourth-largest contributor behind the U.S.A., the U.K. and Germany.
Table 11.7Net Flow of Development Cooperation 1)
(Million U.S. dollars)Item 2011 2012 2013 2014 2015
61,828 48,977 58,459 40,718 37,90913,736 15,997 12,867 8,584 8,14810,831 10,605 11,582 9,483 9,2036,943 6,402 8,611 6,129 6,1478,567 6,759 9,836 5,197 4,9915,033 3,117 7,032 2,567 2,6233,534 3,641 2,804 2,630 2,369
-1,624 -356 -1,224 932 1,1563,888 4,202 2,970 3,355 3,0552,905 5,393 1,286 -899 -1,055-622 -623 -441 -56 -66
3,889 6,829 1,946 -843 -990-362 -813 -219 - -
47,594 32,494 45,133 31,667 29,2621,853 -3,951 3,271 -736 2,694
40,315 31,215 38,715 27,329 25,8005,844 6,470 4,859 6,254 576-419 -1,241 -1,712 -1,180 193497 487 458 467 498
0.18 0.17 0.22 0.20 0.210.31 0.29 0.30 0.30 0.30
Private flows (PF) ..................................................Private export credits (over one year) ..................Direct investment .................................................
Direct investment finance, etc. ..........................
Bilateral investment in securities, etc. .................Concessional lending to multilateral institutions .......
Grants by private nonprofit agencies .....................
Concessional lending to multilateral institutions .....
Grants-in-aid 2) ...............................................
Other official flows (OOF) ..................................
Bilateral official development assistance 2) .......Grants 2) ...........................................................
Official export credits (over one year) ...............
Loans, etc. ........................................................Contributions to multilateral institutions 3) .......
Technical cooperation ....................................
Total value ...............................................................Official flows .........................................................Official development assistance (ODA) ..............
ODA as percentage of GNI (DAC average) (%) .....ODA as percentage of GNI (%) ...............................
1) Net disbursement at current prices. Negative figures (-) indicate that loan repayments, etc.,exceeded the disbursed amount. 2) Including bilateral grants through multilateralinstitutions. 3) Expenditures clearly addressing a country at the point of disbursement areconsidered as bilateral ODA.Source: Ministry of Foreign Affairs; Ministry of Finance; OECD.

TRADE, INTERNATIONAL BALANCE OF PAYMENTS, AND INTERNATIONAL COOPERATION
118
The ratio of Japan's ODA to Gross National Income (GNI) was 0.21 percent, or an increase of 0.01 percentage points compared with that of the previous year.
Of the 9.2 billion U.S. dollars in ODA provided by Japan in 2015, 6.1 billion was bilateral ODA (up 0.3 percent year-on-year), and 3.1 billion was ODA contributed through multilateral institutions (down 8.9 percent).
Bilateral ODA provided in 2015 consisted of 2.6 billion U.S. dollars in grants-in-aid, 2.4 billion in technical cooperation, and 1.2 billion in loans, etc.
By region, bilateral ODA (net disbursement at current prices, including assistance to graduated countries) was distributed as follows: Sub-Saharan Africa, 1,789 million U.S. dollars; Asia, 1,626 million U.S. dollars; Middle East and North Africa, 864 million U.S. dollars; Oceania, 112 million U.S. dollars; Europe, 48 million U.S. dollars; and Latin America and the Caribbean, -17 million U.S. dollars (the negative value indicates a larger amount of repayment received in 2015 than the amount lent in the same year).
Figure 11.6Trends in ODA by Country 1)
0
5
10
15
20
25
30
35
2002 03 04 05 06 07 08 09 10 11 12 13 14 15
Billion U.S. dollars
Japan
U.K.
1) Net disbursement at current prices. Source: OECD.
Germany
France
Sweden
Norway
U.S.A

TRADE, INTERNATIONAL BALANCE OF PAYMENTS, AND INTERNATIONAL COOPERATION
119
Bilateral ODA in 2015 (including assistance to graduated countries) was broken down by purpose (on a commitment basis) as follows: 52.9 percent for improving economic infrastructure, followed in descending order by social and administrative infrastructure (including education, water supply and sanitation), with 18.1 percent.
Table 11.8Regional Distribution of Bilateral ODA 1)
(Million U.S. dollars)Region 1990 2000 2010 2014 2015
Total .................................................. 6,940 9,640 7,428 6,085 6,116 Asia ................................................ 4,117 5,284 2,529 1,977 1,626 ASEAN 2) .................................... 2,299 # 3,126 902 807 570 Middle East and North Africa ....... 666 727 1,592 927 864 Sub-Saharan Africa ........................ 831 970 1,733 1,557 1,789 Latin America and the Caribbean .. 561 800 -344 30 -17 Oceania .......................................... 114 151 176 109 112 Europe ............................................ 158 118 181 132 48 Multiple regions, etc. ..................... 494 1,592 1,562 1,353 1,694
Source: Ministry of Foreign Affairs.
1) Net disbursement at current prices. Including assistance to graduated countries. Negativefigures (-) indicate that loan repayments, etc., exceeded the disbursed amount. 2) The data in1990: 6 countries, the data from 2000: 10 countries.
52.9%
18.1
8.9
7.4
Others12.9
Figure 11.7Distribution of Bilateral ODA by Sector 1) (2015)
19.53 billion
U.S. dollars
1) Commitment basis. Including assistance to graduated countries.Source: Ministry of Foreign Affairs.
Economic infrastructure
Social and administrative infrastructure
Multi-sector
Production

TRADE, INTERNATIONAL BALANCE OF PAYMENTS, AND INTERNATIONAL COOPERATION
120
In addition to the financial assistance described above, Japan has also been active in the areas of human resources development and technology transfer, both vital to the growth of a developing country, through its ODA activities.
Table 11.9Number of Persons Involved in Technical Cooperation by Type 1)
Type of cooperation FY2005 FY2010 FY2013 FY2014 FY2015
Total ............................................. 37,291 41,212 42,632 43,660 46,771 Trainees received ....................... 24,504 23,978 22,240 24,101 25,203 Dispatched Experts ..................................... 3,488 8,296 10,359 9,889 11,134 Research team ......................... 6,862 7,046 8,615 8,056 8,914 Japan Overseas Cooperation Volunteers ........ 1,804 1,459 1,081 1,267 1,198 Other volunteers ...................... 633 433 337 347 3221) Numbers of persons newly received/dispatched in the aforementioned fiscal year. Source: Japan International Cooperation Agency.

“Statistical Handbook of Japan 2017” by Statistics Bureau, Japan
Chapter 12
Labour
An apple orchard in Oshu City, Iwate Prefecture. The branches are heavy with bright red apples. Primary producers supply us with "food", which is essential to our lives. However, the percentage employed in the primary industry has been continually falling over the long term. The number of "agricultural, forestry and fishery workers" was 2.17 million in 2016, down 2.7 percent from the previous year's 2.23 million.
© NASUKAWA Fumio

LABOUR
122
Because of the effects of the Great East Japan Earthquake which occurred in March 2011, the data on labour in 2011 (1. Labour Force - 3. Unemployment) are supplementary estimated figures.
1. Labour Force
After the population in Japan aged 15 years and over peaked at 111.17 million people in 2011, it has been on falling trend. Since 2014, however, this population has been increasing, and reached 111.11 million people in 2016.
The labour force (among the population aged 15 years and over, the total of persons who are employed and persons who are unemployed) was decreasing in the 2000s in association with aging of the population, but shifted to an increase in 2013. The labour force numbered 66.73 million people in Japan in 2016, up 480,000 (0.7 percent) for the fourth consecutive year of increase.
The 2016 labour force participation rate (rate of the labour force to the population aged 15 years and over) was 60.0 percent (up 0.4 percentage points from the previous year). Observed by gender, the rate was 70.4 percent for men (up 0.1 percentage points) and 50.3 percent for women (up 0.7 percentage points).

LABOUR
123
The female labour force participation rate by age group shows an M-shaped curve. This curve indicates that women leave the labour force when they get married or give birth and then rejoin the labour force after their child has grown and the burden of child-rearing is reduced. A comparison with the data from twenty years ago (1996) shows that, in 2016, the 35-39 age group replaced the 30-34 age group to form the bottom of the M-shaped curve. The participation rate rose by 18.4
Table 12.1Population by Labour Force Status
(Thousands)
Total2000 108,360 67,660 64,460 3,200 40,570 4.72005 110,080 66,510 63,560 2,940 43,460 4.42010 111,110 66,320 62,980 3,340 44,730 5.12013 111,070 65,930 63,260 2,650 45,100 4.02014 111,090 66,090 63,710 2,360 44,940 3.62015 111,100 66,250 64,010 2,220 44,790 3.42016 111,110 66,730 64,650 2,080 44,320 3.1
Males2000 52,530 40,140 38,170 1,960 12,330 4.92005 53,230 39,010 37,230 1,780 14,160 4.62010 53,650 38,500 36,430 2,070 15,130 5.42013 53,620 37,830 36,200 1,630 15,760 4.32014 53,630 37,760 36,350 1,420 15,830 3.72015 53,650 37,730 36,390 1,350 15,880 3.62016 53,660 37,810 36,550 1,260 15,820 3.3
Females2000 55,830 27,530 26,290 1,230 28,240 4.52005 56,850 27,500 26,330 1,160 29,300 4.22010 57,460 27,830 26,560 1,280 29,600 4.62013 57,460 28,090 27,070 1,030 29,340 3.72014 57,460 28,320 27,370 960 29,110 3.42015 57,460 28,520 27,640 890 28,910 3.12016 57,450 28,920 28,100 820 28,500 2.8
Source: Statistics Bureau, MIC.
Labour force
Unemployed
Not in labourforce
Unemploy-ment rate
(%)Year
Total Employed
Populationaged 15 years
and over

LABOUR
124
percentage points in the 30-34 age group and by 11.0 percentage points in the 35-39 age group, resulting in the bottom of the M-shaped curve becoming flatter and more gradual. Although this is thought to be greatly affected by the progression of enhancement of the legal system with respect to establishing both work and child-rearing, and development of a work environment such as at companies, there are also effects from the trend of getting married and having children later in life.
2. Employment
The number of employed persons continued to decline continuously since 1998, but began to rise in 2004 and continued rising for four years in a row. Although a downward trend set in once again in 2008, the number of employed persons increased again starting in 2013, which led to an increase of 640,000 in 2016, from 64.01 million (57.6 percent of the population aged 15 years and over) in the previous year to 64.65 million (58.1 percent).
0
20
40
60
80
100
15|19
20|24
25|29
30|34
35|39
40|44
45|49
50|54
55|59
60|64
65|69
70+
19962016
0
20
40
60
80
100
15|19
20|24
25|29
30|34
35|39
40|44
45|49
50|54
55|59
60|64
65|69
70+
Figure 12.1Labour Force Participation Rate by Gender
%
Source: Statistics Bureau, MIC.
%
FemalesMales

LABOUR
125
(1) Employment by Industry
In 2016, the primary industry accounted for 3.5 percent of employment; the secondary industry, 24.2 percent; and the tertiary industry, 72.3 percent.
Over the long term, the percentage employed in the primary industry has been continually falling, while the percentage employed in the tertiary industry has been continually rising. The percentage employed in the secondary industry has also been trending downward. By industry, the number of persons employed in the primary industries of agriculture and forestry has been on a downward trend.
Depending on the industrial sector, a difference was seen in the employment tendency between men and women. In 2016, of male employment was highest in "electricity, gas, heat supply and water" (86.7 percent), followed by "construction" (85.0 percent) and "transport and postal activities" (80.5 percent). The percentage of female employment was highest in "medical, health care and welfare" (74.9 percent), followed by "accommodations, eating and drinking services" (61.6 percent) and "living-related and personal services and amusement services" (59.6 percent).
Figure 12.2Structure of Employment by Country
Tertiaryindustry
Primaryindustry
Secondaryindustry
100
80
60
40
20
0
%
(1980) Japan U.K. U.S.A. Poland Turkey Viet Nam
(2000) (2016) (2016) (2016)(2016) (2016) (2014)
Source: Statistics Bureau, MIC; International Labour Organization; U.S. Bureau of Labor Statistics

LABOUR
126
In the tertiary industry, which accounted for approximately 70 percent of all industry, employment increased from the previous year by 230,000 and 90,000 in the "medical, health care and welfare" and "finance and insurance" sectors, respectively. Meanwhile, employment in "information and communications" decreased by 10,000.
Table 12.2Employment by Industry
(Thousands)
Males Females
Total 1)................................................. 63,260 63,710 64,010 64,650 56.5 43.5 Primary industry ............................ 2,340 2,310 2,290 2,230 62.3 37.7
Agriculture and forestry ................. 2,180 2,100 2,090 2,030 61.6 38.4Fisheries ......................................... 160 210 200 200 70.0 30.0
Secondary industry ........................ 15,440 15,530 15,440 15,430 74.8 25.2Mining and quarrying of stone and gravel ................................. 30 30 30 30 66.7 33.3Construction ................................... 5,000 5,070 5,020 4,950 85.0 15.0Manufacturing ................................ 10,410 10,430 10,390 10,450 69.9 30.1
Tertiary industry ........................... 44,580 44,880 45,270 46,000 50.2 49.8Electricity, gas, heat supply and water .................................. 310 290 290 300 86.7 13.3Information and communications .. 1,920 2,040 2,090 2,080 73.6 26.4Transport and postal activities ....... 3,410 3,370 3,360 3,390 80.5 19.5Wholesale and retail trade .............. 10,600 10,620 10,580 10,630 48.9 51.1Finance and insurance .................... 1,650 1,550 1,540 1,630 46.0 54.0Real estate and goods rental and leasing ............................... 1,110 1,130 1,210 1,240 61.3 38.7Scientific research, professional and technical services .............. 2,070 2,120 2,150 2,210 66.1 33.9Accommodations, eating and drinking services .................. 3,850 3,860 3,840 3,910 38.4 61.6Living-related and personal services and amusement services .............. 2,420 2,380 2,300 2,340 40.4 59.6Education, learning support ........... 3,000 3,010 3,040 3,080 43.2 56.8Medical, health care and welfare ... 7,380 7,600 7,880 8,110 25.1 74.9Compound services ........................ 550 570 590 620 62.3 37.7Services, n.e.c. ............................... 4,020 3,990 4,090 4,150 60.7 39.3Government 2)................................. 2,290 2,350 2,310 2,310 73.0 27.0
Source: Statistics Bureau, MIC.
2014 20152013Percentage
1) Including "Industries unable to classify". 2) Excluding elsewhere classified.
Industries 2016

LABOUR
127
(2) Employment by Occupation
In terms of occupation, employment in the "agricultural, forestry and fishery workers", "sales workers" and "manufacturing process workers" categories has been declining in recent years. The number of "agricultural, forestry and fishery workers" was 2.17 million in 2016, down 2.7 percent from the previous year's 2.23 million. In contrast, "service workers" such as home-care workers have been on a rising trend over the past few years due to a trend toward a service-oriented economy, the aging population, and improvements to welfare services. There is also a rising trend in the number of "professional and engineering workers".
16.4
8060400 20 100
Education,learning supportTransport and postal activities
Medical, healthcare and welfare
Wholesale and retail trade
Agriculture,forestry and fisheries
Mining, quarrying of stone and gravel
Others
%
Secondary industry Tertiary industryPrimary industry
Accommodations,eating and drinking services
Manufacturing
Construction
Source: Statistics Bureau, MIC.Source: Statistics Bureau, MIC.
Figure 12.3Distribution of Employment by Industry (2016)
Industries unable to classify

LABOUR
128
In 2016, the percentages of male and female employed persons by occupation show that men were particularly prominent among "construction and mining workers" (98.0 percent) and "transport and machine operation workers" (97.7 percent). Women were prominent among "service workers" (67.6 percent) and "clerical workers" (59.6 percent).
(3) Employment by Employment Pattern
When looking at the trends in the number of employed persons by employment pattern, regular staff members have been on a slight declining trend since the early 2000s, but increased for the second consecutive year in 2016. Recently, the number of non-regular staff members, such as part-time workers and agency-dispatched workers, has also been increasing continuously for the seventh consecutive year.
In 2016, there were 53.72 million employees (excluding company executives), of whom 20.16 million, or 37.5 percent, were non-regular staff members. The ratio of non-regular staff members among all male employees was 22.1 percent, while the corresponding ratio for females was
Table 12.3Employment by Occupation
(Thousands)Percentage
Males Females
Total 1) ..................................................... 63,260 63,710 64,010 64,650 56.5 43.5Administrative and managerial workers ...... 1,430 1,420 1,450 1,470 87.1 12.9Professional and engineering workers..... 10,070 10,280 10,590 10,850 53.1 46.9Clerical workers....................................... 12,390 12,480 12,620 12,820 40.4 59.6Sales workers .......................................... 8,620 8,570 8,560 8,550 55.9 44.1Service workers....................................... 7,810 7,900 7,890 8,050 32.4 67.6Security workers ..................................... 1,260 1,270 1,260 1,270 92.9 7.1Agricultural, forestry and fishery workers ... 2,290 2,250 2,230 2,170 64.5 35.5Manufacturing process workers .............. 9,020 9,040 8,870 8,800 71.0 29.0Transport and machine operation workers ... 2,240 2,230 2,180 2,180 97.7 2.3Construction and mining workers ........... 3,030 3,050 2,990 2,990 98.0 2.0Carrying, cleaning, packaging, and related workers............................ 4,280 4,330 4,470 4,580 55.3 44.7
Source: Statistics Bureau, MIC.
2014 201620152013Occupation
1) Including figures not repoted.

LABOUR
129
55.9 percent, revealing a large difference between the genders.
When looking at the percentage of non-regular staff members to the total of regular and non-regular staff members by gender and age group, for males, the percentages of young people aged 15 to 24 years, and the elderly aged 65 or older were high. Among females, non-regular staff members accounted for more than 50 percent across all age groups, with the exception of females aged 25 to 34 years old.
Figure 12.4Employment Pattern by Gender and Age (2016)
15|
24
25|
34
35|
44
45|
54
55|
64
65+
100
80
60
40
20
0
%Males
15|
24
25|
34
35|
44
45|
54
55|
64
65+
Females
Regularstaff
Non-regularstaff
100
80
60
40
20
0
Source: Statistics Bureau, MIC.
%
Table 12.4Employment by Employment Pattern (2016)
(Thousands)
Regular staff Percentage Non-regular staff PercentageTotal ............ 53,720 33,550 62.5 20,160 37.5 Males ........ 29,260 22,780 77.9 6,480 22.1 Females ..... 24,450 10,780 44.1 13,670 55.91) Excluding company executives.Source: Statistics Bureau, MIC.
Employees1)

LABOUR
130
When looking at the main reasons for the current employment patterns of males and females who are non-regular staff members, for males, the reason "For working at convenient times" was the most popular, on average in 2016, with 1.48 million males (25.0 percent) choosing this reason, representing an increase by 100,000 people as compared to the previous year. The most popular reason among females was also "For working at convenient times", with 3.66 million females (28.1 percent) choosing this reason, representing an increase by 120,000 people.
The employment rate of new graduates had been worsening as a result of the economic slowdown since 2008, but in recent years, their employment situation has been improving continuously.

LABOUR
131
3. Unemployment
In 2016 the unemployed numbered 2.08 million people, down 6.3 percent from the previous year and representing a decline for the seventh consecutive year. The unemployment rate was 3.1 percent, down 0.3 percentage points from the previous year.
After the ratio of job openings to job seekers peaked in 2006, it has been on a falling trend in recent years. Since 2009, the ratio has been increasing. The ratio of job openings to job seekers was 1.36 times in 2016, up 0.16 points from the previous year. The ratio of job openings to job seekers in April 2017 was 1.48 times, exceeding the record high of 1.46 times during the bubble economy in July 1990. Since hitting 1.53 times in February 1974, this marked the first time in 43 years and 2 months that a high level was recorded for this ratio.
0.0
0.2
0.4
0.6
0.8
1.0
1.2
1.4
1.6
0
1
2
3
4
5
6
1986 88 90 92 94 96 98 00 02 04 06 08 10 12 14 16
% Times
Unemployment rate 1)
(left scale)▼
▲
Ratio of job openings to job seekers(right scale)
Figure 12.5Unemployment Rate and Ratio of Job Openings to Job Seekers
1) The data for 2011 indicates supplementary estimated figure.Source: Statistics Bureau, MIC; Ministry of Health, Labour and Welfare.

LABOUR
132
A breakdown by gender shows that the unemployment rate in 2016 was 3.3 percent among men, and 2.8 percent among women. The unemployment rate has been higher among men for the nineteenth consecutive year since 1998.
The unemployment rate was seen as notably higher in younger age groups than in other age groups, in men and women alike.
Analyzing the total number of unemployed in 2016 (2.08 million people), by reason for job-seeking, the major reasons were: (i) involuntarily dismissed due to corporate or business circumstances, or reaching retirement age limit, 0.58 million persons; (ii) voluntarily left a job for personal or family reasons, 0.87 million persons; (iii) new job seekers due to the necessity to earn income, 0.29 million; and (iv) new job seekers just graduated from school, 0.08 million.
In terms of the duration of unemployment, most were unemployed for "one year or more" (0.76 million persons), followed by "less than three months" (0.68 million persons).
MalesFemales
0 2 4 6 8 10
15-24
25-34
35-44
45-54
55-64
65+
Figure 12.6Unemployment Rates by Gender and Age (2016)
Source: Statistics Bureau, MIC.
%

LABOUR
133
4. Hours of Work and Wages
In 2016, the monthly average of total hours worked was 143.7 per regular employee (in establishments with five or more regular employees), down 0.6 percent from the previous year, and an annual average of 1,724 hours.
Of the total monthly hours worked, 132.9 were scheduled working hours, representing a decrease of 0.5 percent from the previous year. Non-scheduled work such as overtime work averaged 10.8 hours per month, representing a decrease of 1.5 percent from the previous year. Working days averaged 18.6 days per month in 2016.
Figure 12.7Unemployment Rates by Country
1) The data for 2011 indicates supplementary estimated figure.Source: Statistics Bureau, MIC; Cabinet Office.
0
2
4
6
8
10
12
14
2007 08 09 10 11 12 13 14 15 16
Italy
%
U.S.A.
Germany
U.K.
Korea, Rep. of
Japan 1)
France
Canada

LABOUR
134
In 2016, the monthly average of total cash earnings per regular employee (in establishments with five or more regular employees) was 315,590 yen. This total amount includes 259,737 yen in "contractual cash earnings" (which include "scheduled cash earnings" plus "non-scheduled cash earnings" for working overtime, on holidays and late at night, as well as other allowances), and 55,853 yen in "special cash earnings" (which include summer and year-end bonuses, payments to celebrate employees' marriages, etc.).
Generally, the average earnings (scheduled cash earnings) in Japan go up with age until roughly the 40s to mid-50s are reached and then decline. Into the 1990s, an increasing number of enterprises reviewed their salary system, resulting in a more widespread introduction of a merit-based pay system placing emphasis on performance. In recent years, many companies have also adopted wage determination based on job performance skills with consistency.
Table 12.5Hours of Work and Wages 1) (Monthly average)
Hours of Work Wages (1,000 yen)
Scheduled Non-scheduled Scheduled Non-
scheduled2000 20.0 154.4 144.6 9.8 355 284 265 19 722005 19.5 150.2 139.8 10.4 335 273 253 19 622010 19.0 146.2 136.2 10.0 317 263 245 18 542014 18.8 145.1 134.1 11.0 317 261 241 20 562015 18.7 144.5 133.5 11.0 314 259 240 20 552016 18.6 143.7 132.9 10.8 316 260 240 19 56
Indices (2015 average = 100) 3)
2000 - 106.9 108.1 91.3 111.7 107.9 108.9 - -2005 - 104.4 104.9 97.0 105.8 104.2 104.7 - -2010 - 101.5 102.2 93.0 101.0 101.4 102.1 - -2014 - 100.3 100.4 101.0 100.0 99.8 99.7 - -2015 - 100.0 100.0 100.0 100.0 100.0 100.0 - -2016 - 99.5 99.6 98.5 100.6 100.2 100.3 - -
1) Establishments with five or more regular employees. 2) Bonuses and other specialallowances. 3) Data was recalculated for sample adjustments.Source: Ministry of Health, Labour and Welfare.
Year Daysworked Total Total Contractual Special 2)

LABOUR
135
0
100
200
300
400
500
600
15|19
20|24
25|29
30|34
35|39
40|44
45|49
50|54
55|59
60|64
65|69
70+
1,000 and over
100-999
10-99 workers
0
100
200
300
400
500
600
15|19
20|24
25|29
30|34
35|39
40|44
45|49
50|54
55|59
60|64
65|69
70+
Females
Figure 12.8Monthly Contractual Cash Earnings by Size of Enterprise (2016)
Thousand yen Thousand yen
Males
Source: Ministry of Health, Labour and Welfare.

“Statistical Handbook of Japan 2017” by Statistics Bureau, Japan
Chapter 13
Family Budgets and Prices
It has become common to use beverage containers (personal use bottles, personal use cups) such as one’s own water bottle, tumbler, cup, etc. at school, at the office, or at the destination of one's visit, depending on the respective conditions. Personal use bottles and cups as of late have become compact and lightweight, and also stylish. Other advantages also include being able to drink your favorite beverage at any time, being able to contribute to environmental friendliness, and saving money.
© SATO Akiko

FAMILY BUDGETS AND PRICES
137
1. Family Budgets
In 2015, there were approximately 53 million households in Japan, of which about 65 percent are two-or-more-person households and about 35 percent are one-person households. Family budgets vary significantly depending on the employment situation and ages of their members. In this section, family budgets in various types of households are described on the basis of the 2016 results of the Family Income and Expenditure Survey.
(1) Income and Expenditure
(A) Two-or-more-person Households
The 2016 average monthly consumption expenditures per two-or-more-person household (the average number of household members being 2.99 and the average age of the household head being 59.2 years) was 282,188 yen. Compared to the previous year, it decreased by 1.8 percent in nominal terms and decreased by 1.7 percent in real terms. The share of food expenses to total consumption expenditures (Engel's coefficient) was 25.8 percent.
When looking at the real annual change in consumption expenditures, although the width of decrease shrank in 2016 as compared to 2015, there was a decrease in real terms for the third consecutive year.
Consumptionexpenditures
Figure 13.1Average Monthly Consumption Expenditures(Two-or-more-person households) (2016)
Source: Statistics Bureau, MIC.
806040200 100
Housing 5.9Fuel, light & water charges
Medical care 4.6Transportation & communication
Culture & recreationFurniture & household utensils 3.7
Clothing & footwear 3.9
Education 4.0
Social expenses
Food25.8% 7.5 13.8 10.0 7.4
Others13.4
282,188 yen
%

FAMILY BUDGETS AND PRICES
138
(a) Workers' Households
A workers' household means a household of which the head is employed by a company, public office, school, factory, store, etc. The average income of workers' households (the average number of household members being 3.39 and the average age of the household head being 48.5 years) was 526,973 yen in 2016, of which about 80 percent came from the household head's income.
Disposable income, calculated as income minus non-consumption expenditures such as taxes and social insurance contributions, was 428,697 yen. Of this disposable income, 309,591 yen was used for living expenses (consumption expenditures), such as food and housing expenses, while the remainder (surplus), totaling 119,106 yen, was applied to savings, life insurance premiums and repaying debt such as housing loans.
Table 13.1Average Monthly Income and Expenditures (Workers' households 1))
(Thousand yen)Item 2012 2013 2014 2015 2016
Income (A) ..................................................... 518.5 523.6 519.8 525.7 527.0 Wages and salaries ....................................... 479.6 486.6 483.3 485.6 487.9 Others .......................................................... 38.9 37.0 36.5 40.1 39.0Disposable income (A-C) .............................. 425.0 426.1 423.5 427.3 428.7
Expenditures .................................................. 407.4 416.6 415.0 413.8 407.9 Consumption expenditures (B) .................... 313.9 319.2 318.8 315.4 309.6 Non-consumption expenditures (C) 2) .......... 93.5 97.5 96.2 98.4 98.3Surplus ((A-C)-B) .......................................... 111.1 107.0 104.8 111.9 119.1Net increase in deposits and insurance .......... 77.8 74.3 77.1 84.4 91.3Average propensity to consume (%) 3) ........... 73.9 74.9 75.3 73.8 72.2Ratio of net increase in deposits and insurance (%) 4) . 18.3 17.4 18.2 19.8 21.3Engel's coefficient (%) ................................... 22.1 22.1 22.3 23.6 24.2Annual change (%) (real terms) Disposable income ....................................... 1.1 -0.2 -3.8 -0.1 0.4 Consumption expenditures .......................... 1.6 1.2 -3.3 -2.1 -1.71) Two-or-more-person households. 2) Direct taxes, social insurance contributions, etc.3) Ratio of consumption expenditures to disposable income. 4) Ratio of net increase indeposits and insurance to disposable income.Source: Statistics Bureau, MIC.

FAMILY BUDGETS AND PRICES
139
Consumptionexpenditures
309,591 yen
78.5%
12.5
7.4
428,697 yen 399,801 yen
309,591 yen 526,962 yen
Non-consumptionexpenditures 98,276 yen
Figure 13.2Balance of Income and Expenditures(Monthly average, workers' households 1)) (2016)
Disbursements993,957 yen
Receipts993,957 yen
Surplus 119,106 yen
Spouse of household heads
OthersOther householdmembers 1.7
Income526,973 yen
Disposable income
▲
Consumptionexpenditures
▲
Carry-over to nextmonth 59,128 yen
▲
Savings & debtspayments, etc.
Carry-over from previousmonth 67,183 yen
Saving deposits cashed &installment purchases, etc.
24.2%
15.8
9.7
19.8Food
Housing 6.1Culture & recreation
Fuel, light & water charges 6.7
Others
Education 6.3
Transportation& communication
Furniture & household utensils 3.5Clothing & footwear 4.2
Medical care 3.6
1) Two-or-more-person households.Source: Statistics Bureau, MIC.
Household averagePersons per household: 3.39Earners per household: 1.74Age of head: 48.5 years old
Household heads

FAMILY BUDGETS AND PRICES
140
A comparison of consumption expenditures by category showed that spending on "housing" and "medical care" increased from the previous year in real terms, while spending on "food", "clothing and footwear", etc. decreased in real terms.
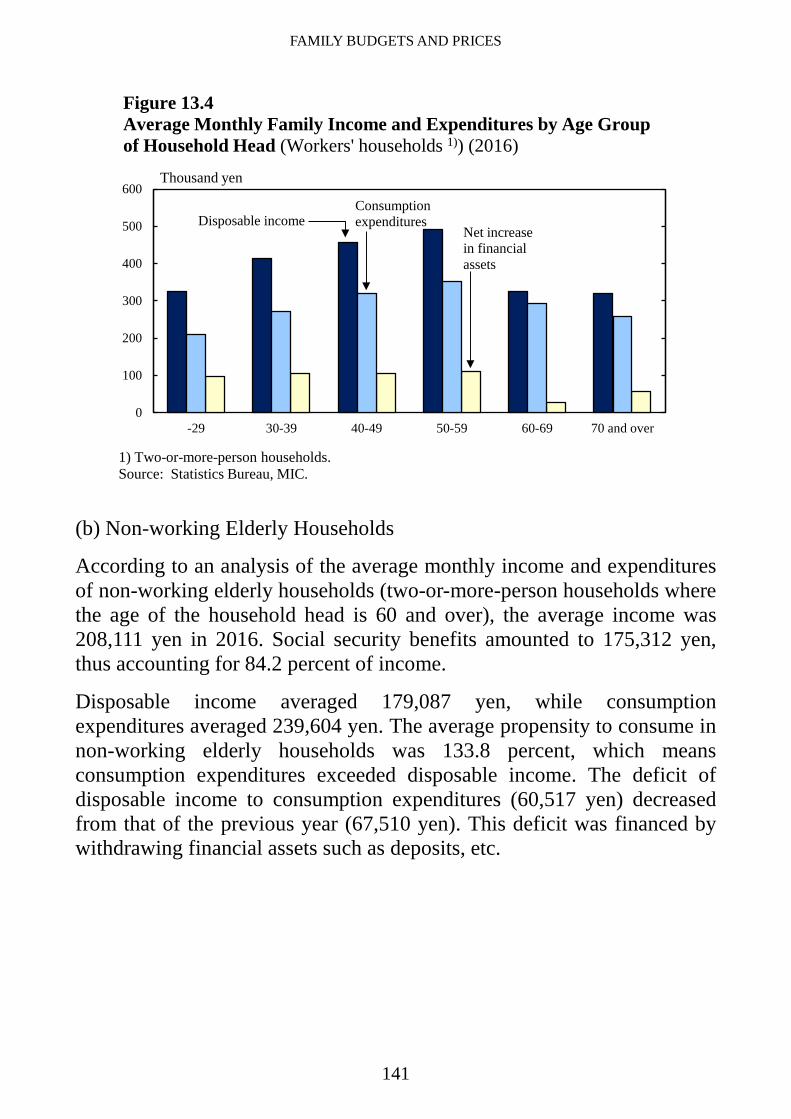
Family budgets differ among households according to their stages in life. Observed by age group of the household head, the 2016 average monthly disposable income of workers' households was the highest in households in the 50s group (490,139 yen), followed by those in the 40s group (457,970 yen) and the 30s group (414,527 yen).
The 2016 average propensity to consume (the ratio of consumption expenditures to disposable income) was the lowest in households in the under-30 group (64.6 percent). The figure was 65.4 percent for households in the 30s group, 69.8 percent in the 40s group, 72.0 percent in the 50s group, 89.6 percent in the 60s group, and 80.8 percent in the 70-and-over group. The percentage tends to be higher as the age goes up, except for the 70-and-over group. Meanwhile, a net increase in financial assets (an amount added to savings) was the highest in households in the 50s group, followed by those in the 30s group.
-4
-3
-2
-1
0
1
2
3
4
2012 13 14 15 16
Nominal termsReal terms
Income
CPI
CPI-4
-3
-2
-1
0
1
2
3
4
2012 13 14 15 16
Consumption expenditures
Nominal termsReal terms
Figure 13.3Annual Change in Household Income and Expenditures(Workers' households 1))
1) Two-or-more-person households.Source: Statistics Bureau, MIC.
%%
CPI
FAMILY BUDGETS AND PRICES
141
(b) Non-working Elderly Households
According to an analysis of the average monthly income and expenditures of non-working elderly households (two-or-more-person households where the age of the household head is 60 and over), the average income was 208,111 yen in 2016. Social security benefits amounted to 175,312 yen, thus accounting for 84.2 percent of income.
Disposable income averaged 179,087 yen, while consumption expenditures averaged 239,604 yen. The average propensity to consume in non-working elderly households was 133.8 percent, which means consumption expenditures exceeded disposable income. The deficit of disposable income to consumption expenditures (60,517 yen) decreased from that of the previous year (67,510 yen). This deficit was financed by withdrawing financial assets such as deposits, etc.
0
100
200
300
400
500
600
-29 30-39 40-49 50-59 60-69 70 and over
Figure 13.4Average Monthly Family Income and Expenditures by Age Group of Household Head (Workers' households 1)) (2016)
1) Two-or-more-person households.Source: Statistics Bureau, MIC.
Thousand yen
Disposable incomeConsumption expenditures
Net increase in financial assets

FAMILY BUDGETS AND PRICES
142
(B) One-person Households
The average monthly consumption expenditures of one-person households in 2016 was 158,911 yen, down 0.7 percent in nominal terms and down 0.6 percent in real terms from the previous year. Compared on an age-group basis to the previous year in real terms, the average monthly consumption expenditures were down 10.4 percent for the under 35-year-old group, up 3.5 percent in the 35-59 age group, and up 0.5 percent in the 60-and-over group. Spending on categories such as "fuel, light and water charges" and "medical care" tended to be larger in older age groups. Meanwhile, older age groups were found to spend increasingly less on categories such as "housing".
0% 20% 40% 60% 80% 100%
Social security benefits
10.8%25.4
7.6 9.9 9.4 9.416.7
Non-consumption expenditures (29,024 yen)
▲
Housing5.3
Fuel, light & water charges
Medical care5.5
Transportation & communication
▲
Social expenses
Culture & recreation
Consumption expenditures (239,604 yen)
Others
Income
Expenditures
Figure 13.5Average Monthly Income and Expenditures(Non-working elderly households 1) ) (2016)
806040200
1) Two-or-more-person households.Source: Statistics Bureau, MIC.
Other income
Deficit(60,517
yen)
Food
Income (208,111 yen)
Disposable income (179,087 yen)
%100

FAMILY BUDGETS AND PRICES
143
(2) Savings and Debts
Two-or-more-person households in 2016 showed that the average amount of savings per workers' household was 12.99 million yen, resulting in a ratio to yearly income (7.15 million yen) of 181.7 percent. The median value of household savings (the value of household savings that is in the middle when households are lined up in order from those with the lowest amount of savings to those with the highest amount of savings) was 7.34 million yen. On the other hand, the average amount of debt per household was 7.81 million yen, which was 109.2 percent relative to yearly income. The median value of households holding liabilities was 13.13 million yen. The portion of household debt accounted for by "housing and/or land" averaged 7.16 million yen. A total of 41.8 percent of workers' households held "debts for housing and/or land".
Table 13.2Average Monthly Consumption Expenditures by Age Group (One-person households)(2016)
Actualfigures
ratio(%)
Actualfigures
ratio(%)
Actualfigures
ratio(%)
Actualfigures
ratio(%)
158,911 100.0 150,625 100.0 183,106 100.0 149,552 100.0Food ................................ 39,808 25.1 39,580 26.3 45,620 24.9 36,982 24.7Housing .......................... 20,169 12.7 30,737 20.4 27,412 15.0 13,092 8.8Fuel, light and water charges .......................... 11,028 6.9 7,015 4.7 10,567 5.8 12,577 8.4Furniture and household utensils .......................... 5,343 3.4 3,568 2.4 6,435 3.5 5,384 3.6Clothing and footwear .... 5,554 3.5 7,604 5.0 6,268 3.4 4,522 3.0Medical care ................... 6,720 4.2 3,771 2.5 6,064 3.3 8,016 5.4Transportation and communication ............. 18,640 11.7 21,129 14.0 25,537 13.9 14,378 9.6Culture and recreation .... 19,230 12.1 20,016 13.3 21,740 11.9 17,718 11.8Others ............................. 32,406 20.4 17,205 11.4 33,464 18.3 36,862 24.6
Annual change (real terms) (%)-0.6 -10.4 3.5 0.5
Source: Statistics Bureau, MIC.
Consumption expenditures
Consumption expenditures
(Yen)
ItemAverage Under 35 years 35-59 60 and over

FAMILY BUDGETS AND PRICES
144
By age group of household head, the average amount of savings was found to be the highest in the 60s group, while debts were the highest in the 30s group.
Table 13.3Average Amount of Savings and Debts (Workers' households 1))
(Thousand yen)
Housingand/or land
2012 6,910 12,330 178.4 6,950 6,480 100.6 53.5 2013 7,080 12,440 175.7 7,400 6,870 104.5 54.0 2014 7,020 12,900 183.8 7,560 7,100 107.7 52.9 2015 7,090 13,090 184.6 7,550 6,980 106.5 53.8 2016 7,150 12,990 181.7 7,810 7,160 109.2 53.9
1) Two-or-more-person households.Source: Statistics Bureau, MIC.
Ratio ofhouseholds
holdingdebts (%)
Year Yearlyincome Savings
Ratio ofsavings to
yearlyincome (%)
Debts
Ratio ofdebts
to yearlyincome (%)
Table 13.4Amount of Savings and Debts by Age Group of Household Head
(Million yen)
Item Average -29 30-39 40-49 50-59 60-69 70 andover
Yearly income ................................. 7.15 4.90 6.31 7.36 8.44 6.26 5.91Savings ............................................ 12.99 3.07 6.13 10.40 16.96 21.18 19.87 Financial institutions .................... 12.41 3.03 5.92 9.75 15.90 20.86 19.82 Demand deposits ........................ 3.39 1.55 2.69 3.25 3.51 4.48 4.68 Time deposits ............................. 4.39 0.94 1.74 2.94 5.75 8.50 8.36 Life insurance, etc. ..................... 3.14 0.38 1.15 2.62 4.46 4.92 3.97 Securities .................................... 1.49 0.16 0.33 0.93 2.18 2.96 2.82 Non-financial institutions ............ 0.59 0.04 0.21 0.65 1.06 0.32 0.04Debts ............................................... 7.81 4.99 12.33 10.43 5.75 1.91 0.80 Housing and/or land ..................... 7.16 4.56 11.79 9.72 4.85 1.55 0.54 Other than housing and/or land .... 0.45 0.26 0.33 0.53 0.65 0.18 0.11 Monthly and yearly installments .. 0.20 0.16 0.20 0.17 0.26 0.17 0.151) Two-or-more-person households.Source: Statistics Bureau, MIC.
(Workers' households 1)) (2016)

FAMILY BUDGETS AND PRICES
145
(3) Internet Shopping by Households
Due to popularization of computers, smartphones, etc., the use of Internet shopping has been increasing in recent years. According to the Survey of Household Economy, the percentage of two-or-more-person households that utilize Internet shopping has continued to increase since 2002, reaching 27.8 percent in 2016. Total expenditures used on Internet shopping in one year amounted to an average of 102,420 yen per household.
Looking at the breakdown of total expenditures per two-or-more-person households spent on Internet shopping, "travel-related" were the highest at 21.9 percent, followed by "food" at 14.6 percent, "clothing and footwear" at 10.6 percent, "home electronics and furniture" at 10.2 percent, and "culture-related" (such as books and music software) at 9.7 percent.
Figure 13.6Proportion of Households Ordered over the Internet (Two-or-more-person households)
Source: Statistics Bureau, MIC.
0
5
10
15
20
25
30
2002 03 04 05 06 07 08 09 10 11 12 13 14 15 16
%

FAMILY BUDGETS AND PRICES
146
Travel-related21.9%
Food14.6%
Clothing &footwear10.6%
Home electronics
and Furniture10.2%
Culture-related9.7%
Gift items4.7%
Medical care4.7%
Insurance4.5%
Cosmetics4.3% Others
14.8%
Figure 13.7 Ratio of Expenditure on Goods and Services Ordered over the Internet(Two-or-more-person Households) (2016)
Annual expenditure per
household102,420 yen
1) Total accommodation services, fares and package tours. 2) Total books and other reading materials, software (music, video, personal computer, TV game), digital books, download music, video, applications and tickets. 3) Total medicines and health foods. 4) Total private transportation, other goods and services. Source: Statistics Bureau, MIC.
1)
2)
3)
4)
Figure 13.7 Ratio of Expenditure on Goods and Services Ordered over the Internet(Two-or-more-person Households) (2016)

FAMILY BUDGETS AND PRICES
147
(4) Electronic Money
Use of electronic money has been increasing, as a means for settling accounts that can be easily used at transportation facilities, convenience stores, supermarkets, etc. Based on all households in the Survey of Household Economy, the percentage of households with members who have electronic money and the percentage of households with members who have used electronic money have been on an increasing trend starting in 2008. In 2016, the percentage of households with electronic money was 48.7 percent, and the percentage of households that have used electronic money was 40.4 percent, indicating increases as compared to the previous year.
Figure 13.8Trends in Ownership and Utilization of Electronic Money (All households)
Source: Statistics Bureau, MIC.
0
10
20
30
40
50
60
2008 09 10 11 12 13 14 15 16
%
Proportion of households with members who owned electronic money
Proportion of households with memberswho used electronic money

FAMILY BUDGETS AND PRICES
148
2. Prices
Producer prices were on a downward trend starting in 1992, after the collapse of the bubble economy, and then turned upward in 2004. Producer prices are easily affected by changes in the price of imported raw materials such as crude petroleum and iron ore, due to fluctuations in the conditions of international commodity markets as well as in the exchange rate, and its impact is significant in advances and declines from 2008 to 2009 around the time of the bankruptcy of Lehman Brothers. Starting in 2010, producer prices have been fluctuating within a range of plus or minus 2 percent (as compared to the same month of the previous year). Although they continued to increase starting in the second quarter of 2013 due to a yen depreciation, the index turned downward in the second quarter of 2015, but showed an upward trend in the first quarter of 2017.
On the other hand, the width of the increase in consumer prices also shrank starting in 1992. Although the width of the increase of this index expanded temporarily when the consumption tax rate was raised from 3 percent to 5 percent in 1997, it subsequently went on a downward trend. Starting in the fourth quarter of 2007, prices were once again on an upward trend due to sharp increases in the price of imported raw materials, and in the third quarter of 2008, the increase in prices exceeded 2 percent year-on-year. Thereafter, consumer prices were affected by the fall in prices of imported raw materials, and started to decrease in the first quarter of 2009. After that, they shifted mainly downwards, but turned upward starting in the third quarter of 2013 due to a weakening of the yen. Due to the increase in the consumption tax from 5 percent to 8 percent in April 2014, the width of increase expanded, but the rate of increase shrank due to the cycle of effects of the tax increase and a drop in energy prices in the second quarter of 2015. Although it became negative starting in the first quarter of 2016, the width of increase turned positive starting in the fourth quarter of 2016.

FAMILY BUDGETS AND PRICES
149
(1) Consumer Price Index (CPI)
The all items index of consumer prices (with base year 2015 = 100) was 99.9 in 2016, down 0.1 percent from the previous year.
-10-8-6-4-202468
10
2005 06 07 08 09 10 11 12 13 14 15 16
Figure 13.9Price Trends (Percent change from previous year)
%
▲
CPI (Consumer Price Index)
Source: Statistics Bureau, MIC; Bank of Japan.
PPI (Producer Price Index)▼
17
Table 13.5CPI for Major Categories of Goods and Services
Weight 2000 2005 2010 2014 201610000 99.1 96.9 96.5 99.2 99.98501 98.6 95.9 95.6 99.0 99.9
Food ................................................... 2623 92.3 90.9 93.9 97.0 101.7Housing .............................................. 2087 101.8 101.5 100.9 100.0 99.9Fuel, light and water charges ............. 745 81.4 81.3 86.0 102.6 92.7Furniture and household utensils ....... 348 138.8 118.1 105.8 98.5 99.6Clothing and footwear ....................... 412 101.7 95.9 95.7 97.8 101.8Medical care ....................................... 430 98.9 101.3 100.1 99.1 100.9Transportation and communication ... 1476 99.4 98.1 96.5 102.0 98.0Education ........................................... 316 100.9 105.0 97.8 98.4 101.6Culture and recreation ........................ 989 119.3 109.1 101.1 98.1 101.0Miscellaneous .................................... 574 86.9 88.5 91.1 99.0 100.7
4969 99.7 95.5 95.4 99.2 99.45031 98.4 98.3 97.6 99.2 100.3
Source: Statistics Bureau, MIC.
(CY2015=100)Item
Goods ..................................................... Services .................................................
All items .................................................. All items, less imputed rent ...................

FAMILY BUDGETS AND PRICES
150
According to the general index (all items, less imputed rent) in the regional difference index of consumer prices, which compares the difference in consumer price levels by prefecture, Tokyo had the highest score in 2016, with a figure of 104.4 against the national average set at 100, followed by Kanagawa, with 104.3. On the other hand, Gunma registered the lowest score, with 95.9. The index for Tokyo was 8.9 percent higher than that of Gunma.
(2) Corporate Goods and Services Producer Price Indices
The corporate goods price index measures price changes of goods traded in the corporate sector. It is comprised of the producer price index (price index of domestically-produced and domestically-traded goods in the corporate sector), the export price index, and the import price index.
In 2016, the producer price index (2015 as the base year = 100) was 96.5, down 3.5 percent from the previous year.
90 95 100 105 110
Tokyo
Kanagawa
Kyoto
Yamagata
Tokushima
Hokkaido
Hiroshima
Aichi
Fukuoka
Gumma
Yamagata
Figure 13.10Regional Difference Index of Consumer Prices by Selected Prefectures(2016)
( Japan = 100)
Source: Statistics Bureau, MIC.
Tokyo
Kyoto
Hokkaido
Hiroshima
Gunma
Fukuoka
Aichi
Kanagawa
Tokushima

FAMILY BUDGETS AND PRICES
151
In 2016, the export price index decreased to 96.9 on a contract currency basis (down 3.1 percent from the previous year), and to 90.6 on a yen basis (down 9.4 percent from the previous year). Meanwhile, the import price index fell to 90.2 on a contract currency basis (down 9.8 percent from the previous year) and to 83.6 on a yen basis (down 16.4 percent from the previous year).
The services producer price index measures price movements of services traded between companies. In 2016, the services producer price index (CY2010 as the base year = 100) was 103.0, up 0.3 percent from the previous year.
Table 13.6Corporate Goods and Services Producer Price Indices
Item Weight 2010 2013 2014 2015 2016Corporate goods price index (CY2015=100) Producer price index ..................................... 1000.0 97.4 99.2 102.4 100.0 96.5 Manufacturing industry products ................ 888.3 99.1 99.4 102.3 100.0 97.0 Export price index (yen basis) ...................... 1000.0 89.5 95.7 98.8 100.0 90.6 Import price index (yen basis) ...................... 1000.0 88.1 108.1 112.7 100.0 83.6
Services producer price index (CY2010=100) All items ........................................................ 1000.0 100.0 99.0 101.6 102.7 103.0 Information and communications ............... 237.8 100.0 97.6 99.3 99.7 100.1 Transportation and postal activities............. 186.7 100.0 100.9 103.9 104.7 103.8 Real estate services ..................................... 72.1 100.0 93.5 95.5 96.3 97.5 Advertising services .................................... 63.4 100.0 102.3 105.0 105.7 107.0Source: Bank of Japan.

“Statistical Handbook of Japan 2017” by Statistics Bureau, Japan
Chapter 14
Environment and Life
GOSAT-2 is a joint project by the three agencies of JAXA, Ministry of the Environment (MOE), and National Institute for Environmental Studies (NIES), and is the successor to the greenhouses gases observing satellite “IBUKI” (GOSAT) that was launched in 2009. GOSAT-2 is equipped with more advanced observation sensors, and its objectives are to aim for further improvement in observation accuracy of greenhouse gases and to newly specify the sink and emission source of carbon monoxide. By estimating the concentration of PM2.5 and black carbon in the atmosphere from the transmittance of light by wavelength in the atmosphere, GOSAT-2 will also contribute to monitoring of atmospheric pollution.
© JAXA
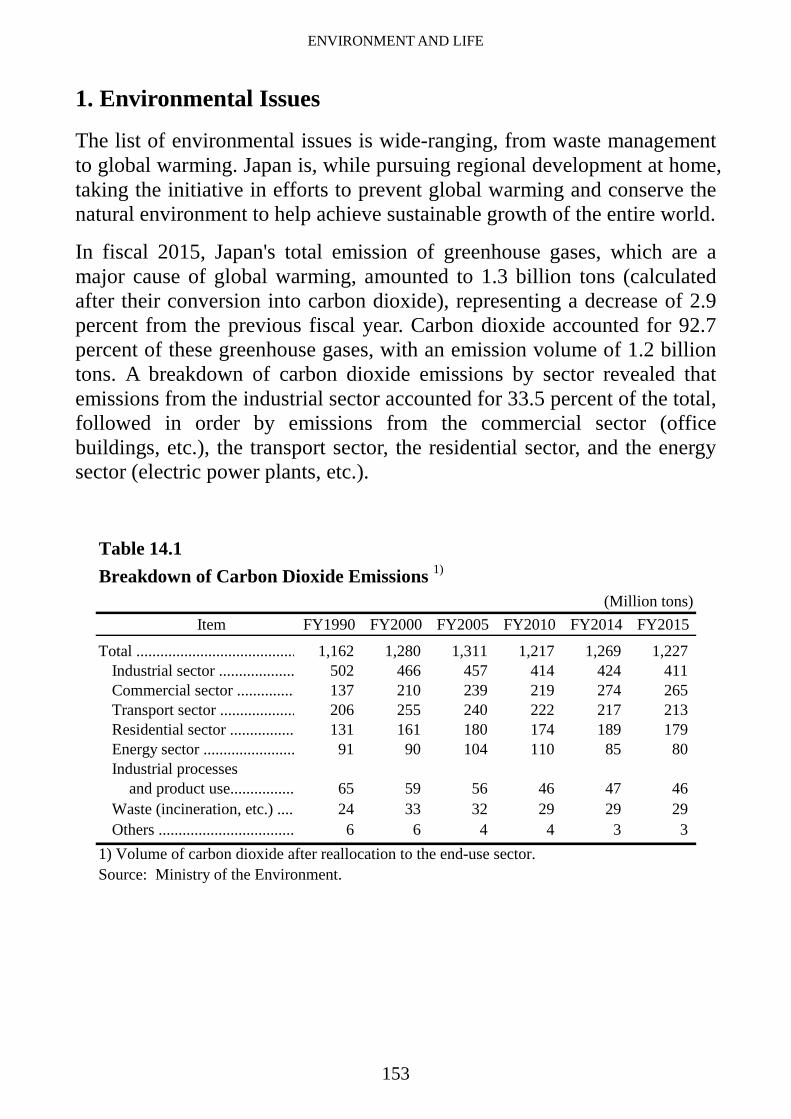
ENVIRONMENT AND LIFE
153
1. Environmental Issues
The list of environmental issues is wide-ranging, from waste management to global warming. Japan is, while pursuing regional development at home, taking the initiative in efforts to prevent global warming and conserve the natural environment to help achieve sustainable growth of the entire world.
In fiscal 2015, Japan's total emission of greenhouse gases, which are a major cause of global warming, amounted to 1.3 billion tons (calculated after their conversion into carbon dioxide), representing a decrease of 2.9 percent from the previous fiscal year. Carbon dioxide accounted for 92.7 percent of these greenhouse gases, with an emission volume of 1.2 billion tons. A breakdown of carbon dioxide emissions by sector revealed that emissions from the industrial sector accounted for 33.5 percent of the total, followed in order by emissions from the commercial sector (office buildings, etc.), the transport sector, the residential sector, and the energy sector (electric power plants, etc.).
Table 14.1Breakdown of Carbon Dioxide Emissions 1)
(Million tons)Item FY1990 FY2000 FY2005 FY2010 FY2014 FY2015
Total ........................................ 1,162 1,280 1,311 1,217 1,269 1,227Industrial sector ................... 502 466 457 414 424 411Commercial sector ............... 137 210 239 219 274 265Transport sector ................... 206 255 240 222 217 213Residential sector ................ 131 161 180 174 189 179Energy sector ....................... 91 90 104 110 85 80Industrial processes
and product use................ 65 59 56 46 47 46Waste (incineration, etc.) ..... 24 33 32 29 29 29Others .................................. 6 6 4 4 3 3
1) Volume of carbon dioxide after reallocation to the end-use sector.Source: Ministry of the Environment.

ENVIRONMENT AND LIFE
154
The state of waste management in Japan had remained grave due to the shrinking remaining capacity of final disposal sites and increased illegal dumping. This led to the Basic Act on Establishing a Sound Material-Cycle Society (brought into force in January 2001), which defines basic principles for the creation of a sound material-cycle society. This Act has established a legal framework to address issues such as waste disposal and automobile and electrical appliance recycling. Another ongoing effort is the promotion of the "3R" (reduce, reuse and recycle) in waste management, including appropriate management of hazardous materials and R&D on waste recycling technology.
33.5 %
21.6
17.4
14.6
6.56.4 Industrial sector
Transport sector
Residential sector
Energy sector
Others
Figure 14.1Sources of Carbon Dioxide Emissions 1) (FY2015)
1) Volume of carbon dioxide after reallocation to the end-use sector.Source: Ministry of the Environment.
1.23billion tons of
CO2
Commercial sector

ENVIRONMENT AND LIFE
155
Of various types of waste generated as a result of business activities, 20 of them, including sludge, waste oil, and soot and dust, are designated as "industrial waste". The fiscal 2014 nationwide industrial waste generation totaled 393 million tons. Sludge, animal waste and debris, which account for approximately 80 percent of the total industrial waste, are now increasingly recycled into construction materials, fertilizers, and other materials. Thanks to this development, the volume of final disposal (to be put into landfills) fell from 90 million tons in fiscal 1990 to 10 million tons in fiscal 2014.
Meanwhile, a total of 44 million tons of "nonindustrial waste" (household waste and also shop, office and restaurant waste) was generated in fiscal 2014. This translates to 947 grams per person per day. In terms of nonindustrial waste disposal in fiscal 2014, the total volume processed was 42 million tons. The total volume of recycled waste was 9 million tons, with the recycling rate at 20.6 percent.
Table 14.2Waste Generation and Disposal
(Thousand tons)Item FY1990 FY2000 FY2005 FY2010 FY2014
Industrial wasteTotal volume of waste generation .............. 394,736 406,037 421,677 385,988 392,840
Recycling ................................................ 150,568 184,237 218,888 204,733 209,676Treatment for waste reduction ................ 154,443 176,933 178,560 167,000 172,764Final disposal .......................................... 89,725 44,868 24,229 14,255 10,399
Nonindustrial waste 1)
Total volume of waste generation .............. 50,257 54,834 52,720 45,359 44,317Municipally scheduled and collected ...... 42,495 46,695 44,633 38,827 38,095Directly brought to waste treatment facilities .................... 6,776 5,373 5,090 3,803 3,718Recyclable waste collected by community ...................... 986 2,765 2,996 2,729 2,503
Waste generated daily per person (in grams) ................... 1,120 1,185 1,131 976 947
Total volume of processed waste ............... 49,282 52,090 49,754 42,791 41,841Direct incineration .................................. 36,192 40,304 38,486 33,799 33,470Intermediate treatment for recycling, etc. ... 6,479 7,283 6,161 5,770Direct recycling ....................................... 2,224 2,541 2,170 2,076Direct final disposal ................................ 9,790 3,084 1,444 662 525
Source: Ministry of the Environment.
3,300
1) Due to the Great East Japan Earthquake, figures for FY2010 exclude those forMinamisanriku Town, Miyagi Prefecture. Figures for FY 2014 exclude disaster waste.

ENVIRONMENT AND LIFE
156
2. Housing
According to the "Housing and Land Survey" conducted in October 2013, the total number of dwellings (in the case of apartment buildings, counting the number of individual units) in Japan was 61 million, up by 3 million, 5.3 percent from 2008. The number of households was 52 million, representing the excess in number of dwellings over households by 8 million.
Source: Ministry of the Environment.
1) Due to the Great East Japan Earthquake, figures for FY2010 exclude those for MinamisanrikuTown, Miyagi Prefecture. Figures after FY2011 exclude disaster waste.
0
5
10
15
20
25
0
3
6
9
12
15
FY1990 92 94 96 98 00 02 04 06 08 10 12 14
Collection by community
Recycling by municipality
Recycling rate (%)
Figure 14.2Recycling of Nonindustrial Waste 1)
Million tons %
(left scale)
(right scale)
Total volume of recycled waste
Volume of recycling by municipality
= + Volume of collection by community
+ Volume of collection by community
× 100Total volume of processed waste
=Total volume of recycled waste
Recycling rate(%)

ENVIRONMENT AND LIFE
157
In 2013, the number of occupied dwellings (where people usually live) amounted to 52 million, accounting for 85.9 percent of the total number of dwellings. Of these, the number of dwellings used exclusively for living totaled 51 million, accounting for 97.8 percent of the occupied dwellings. Meanwhile, the number of vacant dwellings increased by 0.6 million, 8.3 percent from 2008, to 8 million. That vacancy rate represented 13.5 percent of the total number of dwellings, the highest-ever ratio.
A breakdown of occupied dwellings by class of ownership showed that owned houses totaled 32 million, accounting for 61.7 percent of the total, which represented an increase of 0.6 percentage points from the figure of 61.1 percent in 2008. Rented houses, on the other hand, numbered 19 million, accounting for 35.5 percent of the total.
Figure 14.3Trends in Dwellings, Vacant Dwellings and Vacancy Rate
0
5
10
15
0
10
20
30
40
50
60
70
1973 1978 1983 1988 1993 1998 2003 2008 2013
Total number of dwellings
Number of vacant dwellings
Vacancy rate
5.5
7.68.6
9.4 9.8
11.5
31.06
12.213.1 13.5
million
Source: Statistics Bureau, MIC.
(left scale)
(right scale)
%
35.45 38.61 42.01 45.8 50.2 53.8 57.59 60.63

ENVIRONMENT AND LIFE
158
Occupied dwellings by building type showed that 29 million or 54.9 percent were detached houses, and 22 million or 42.4 percent were apartments. The proportion of apartments has consistently increased in recent years.
In terms of construction materials, 26 million or 92.2 percent of the detached houses were wood-frame houses (including fire-resistant ones). On the other hand, 16 million or 73.8 percent of the component apartments were steel-framed concrete structures.
Table 14.4Occupied Dwellings by Type of Building
(Thousands)
1983 34,705 22,306 2,882 9,329 1871988 37,413 23,311 2,490 11,409 2031993 40,773 24,141 2,163 14,267 2021998 43,922 25,269 1,828 16,601 2242003 46,863 26,491 1,483 18,733 1562008 49,598 27,450 1,330 20,684 1342013 52,102 28,599 1,289 22,085 130
Source: Statistics Bureau, MIC.
Total Apartments OthersYear Detachedhouses
Tenementhouses
Table 14.3Housing Conditions
(Thousands)
Owned RentedFloor spaceper dwelling
(m2)
1983 35,197 38,607 34,705 21,650 12,951 31,935 81.61988 37,812 42,007 37,413 22,948 14,015 34,701 85.01993 41,159 45,879 40,773 24,376 15,691 38,457 88.41998 44,360 50,246 43,922 26,468 16,730 41,744 89.62003 47,255 53,891 46,863 28,666 17,166 45,258 92.52008 49,973 57,586 49,598 30,316 17,770 48,281 92.42013 52,453 60,629 52,102 32,166 18,519 50,982 93.0
1) Including tenure of dwelling "Not reported".Source: Statistics Bureau, MIC.
Totalnumber ofdwellings
Occupieddwellings
1)Year
Dwellingsexclusivelyfor living
Totalhouseholds
Ownership
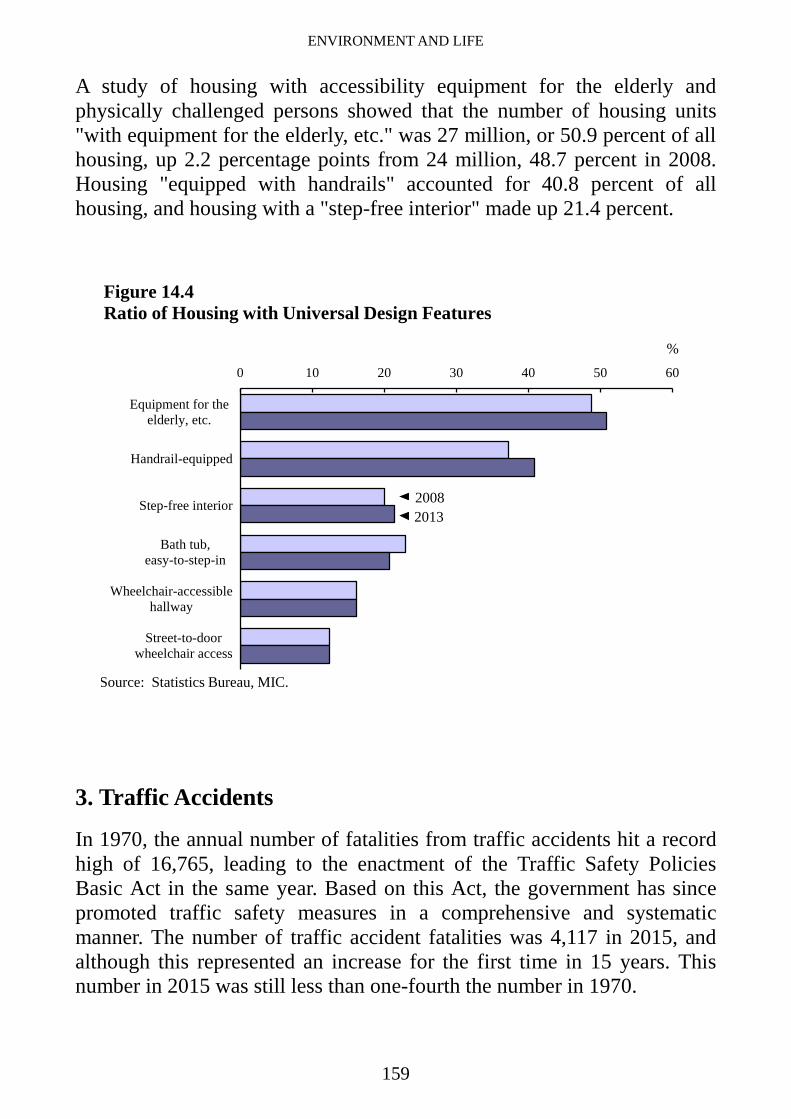
ENVIRONMENT AND LIFE
159
A study of housing with accessibility equipment for the elderly and physically challenged persons showed that the number of housing units "with equipment for the elderly, etc." was 27 million, or 50.9 percent of all housing, up 2.2 percentage points from 24 million, 48.7 percent in 2008. Housing "equipped with handrails" accounted for 40.8 percent of all housing, and housing with a "step-free interior" made up 21.4 percent.
3. Traffic Accidents
In 1970, the annual number of fatalities from traffic accidents hit a record high of 16,765, leading to the enactment of the Traffic Safety Policies Basic Act in the same year. Based on this Act, the government has since promoted traffic safety measures in a comprehensive and systematic manner. The number of traffic accident fatalities was 4,117 in 2015, and although this represented an increase for the first time in 15 years. This number in 2015 was still less than one-fourth the number in 1970.
0 10 20 30 40 50 60
Equipment for theelderly, etc.
Handrail-equipped
Step-free interior
Bath tub,easy-to-step-in
Wheelchair-accessiblehallway
Street-to-doorwheelchair access
%
20132008
Source: Statistics Bureau, MIC.
Figure 14.4Ratio of Housing with Universal Design Features

ENVIRONMENT AND LIFE
160
In 2015, traffic deaths per 100,000 population were 3.2 persons, while the number of persons killed per 10,000 motor vehicles was 0.5 persons.
4. Crime
In 2016, the reported number of penal code offenses (excluding cases related to traffic accidents) was 1 million, a decrease of 102,849, or 9.4 percent compared to the previous year. The proportion of thefts was the highest, accounting for 72.6 percent, or 723,148 cases (down 10.5 percent from the previous year).
The number of persons arrested for penal code offenses was 226,376 in 2016, a decrease of 12,979, or 5.4 percent compared to the previous year, marking a decline for the twelfth consecutive year.
The ratio of arrests to reported number of offenses marked a post-World War II low, at 19.8 percent, in 2001. From 2002 to 2007, this ratio increased, and levelled off afterwards. In 2016, it was 33.8 percent, an increase of 1.3 point from the previous year.
Table 14.5Traffic Accidents and Casualties
per 10,000 per 100,000motor vehicles population
1970 718,080 981,096 16,765 9.0 16.21980 476,677 598,719 8,760 2.2 7.51990 643,097 790,295 11,227 1.9 9.12000 931,950 1,155,707 9,073 1.2 7.12010 725,924 896,297 4,948 0.6 3.92014 573,842 711,374 4,113 0.5 3.22015 536,899 666,023 4,117 0.5 3.2
1) Death within 24 hours of the accident.Source: National Police Agency.
Trafficaccidents
Trafficdeaths 1)Year Injuries

ENVIRONMENT AND LIFE
161
Various kinds of computers and computer networks are currently playing an essential role as a social foundation. In line with this, crimes utilizing computer networks are becoming increasingly diversified. The number of arrests for cybercrime (violation of the Unauthorized Computer Access Act, offenses involving computers or electromagnetic records, offenses related to unauthorized commands for electromagnetic records, offenses using cyber networks) in 2016 was 8,324, up 2.8 percent from the previous year. This represented about a nine-fold increase from the 913 cases registered in 2000.
The police organization consists of the National Public Safety Commission and the National Police Agency, both of which are state organizations, as well as the Prefectural Public Safety Commission and prefectural police, both of which are organizations under the authority of individual prefectures. As of April 1, 2016, the prefectural police operated police headquarters, police academies, 1,166 police stations, 6,248 police boxes and 6,431 police substations in 47 prefectures.
Local police officers at their respective police boxes/substations are engaged in standing guard over their communities, patrolling, and dealing with criminal cases and accidents to prevent crime and catch criminals.
Table 14.6Trends in Crime 1) (Penal code offenses)
1980 1,357,461 811,189 392,113 59.8 1159.61985 1,607,697 1,032,879 432,250 64.2 1328.11990 1,636,628 692,593 293,264 42.3 1324.01995 1,782,944 753,174 293,252 42.2 1419.92000 2,443,470 576,771 309,649 23.6 1925.12005 2,269,293 649,503 386,955 28.6 1775.72010 1,604,019 497,356 322,620 31.0 1252.22015 1,098,969 357,484 239,355 32.5 864.62016 996,120 337,066 226,376 33.8 784.8
1) Excluding traffic offenses. 2) The ratio of arrests to reported number of offenses.Source: National Police Agency.
Year Reportedoffenses
Resultantarrests
Personsarrested
Crime rate per 100,000 population
Arrest rate 2)
(%)
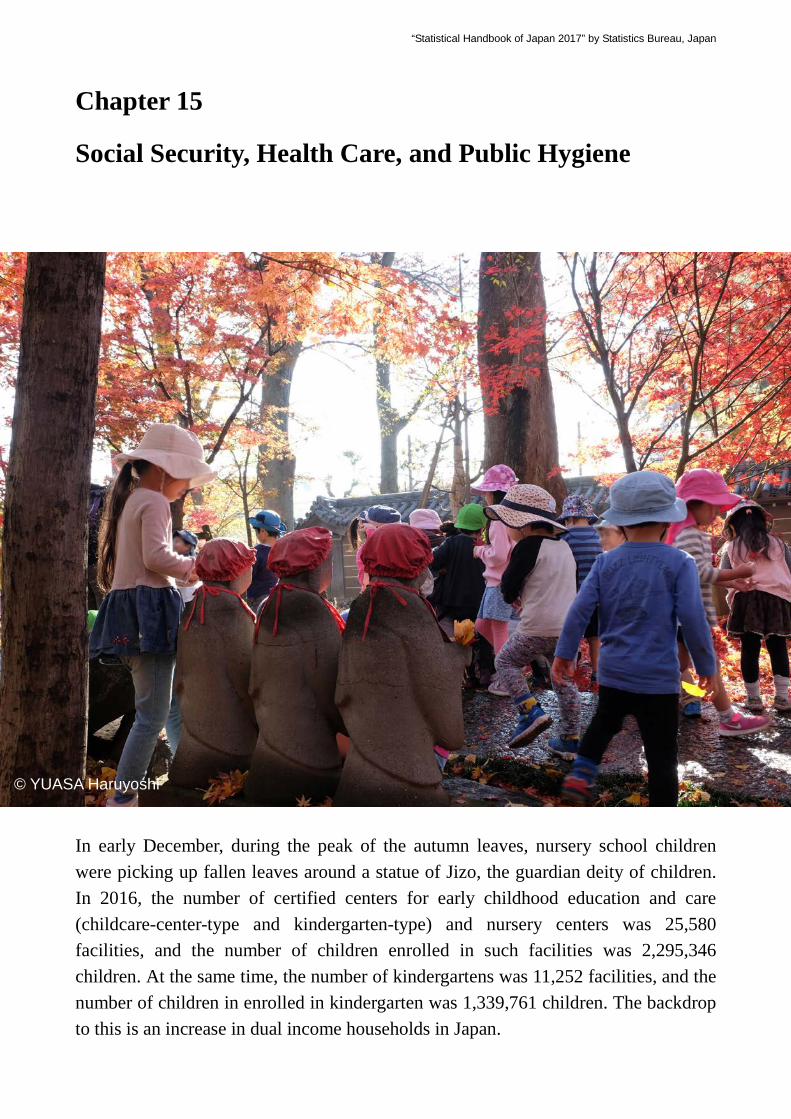
“Statistical Handbook of Japan 2017” by Statistics Bureau, Japan
Chapter 15
Social Security, Health Care, and Public Hygiene
In early December, during the peak of the autumn leaves, nursery school children were picking up fallen leaves around a statue of Jizo, the guardian deity of children. In 2016, the number of certified centers for early childhood education and care (childcare-center-type and kindergarten-type) and nursery centers was 25,580 facilities, and the number of children enrolled in such facilities was 2,295,346 children. At the same time, the number of kindergartens was 11,252 facilities, and the number of children in enrolled in kindergarten was 1,339,761 children. The backdrop to this is an increase in dual income households in Japan.
© YUASA Haruyoshi

SOCIAL SECURITY, HEALTH CARE, AND PUBLIC HYGIENE
163
1. Social Security
In Japan, the birth rate has been falling, while the number of elderly people has been growing. Meanwhile, its social security system is required to address various changes in the socioeconomic environment.
In April 2000, a long-term care insurance system was launched. When the system was first established, there were 2.18 million people certified as needing care or needing support. This number grew by approximately 2.7-fold, to 5.86 million people as of April 2014, and the long-term care insurance system has become anchored in society. Today, there are approaches aimed at enhancing services for promoting integrated community care systems (system where medical care, nursing care, preventive care, and livelihood support are provided integrally in regions where one is used to living), as well as realizing a local, inclusive society.
The number of monthly users of long-term care insurance services totaled, on average, 5.03 million per month in fiscal 2014, and increased by approximately 2.7-fold over 14 years in comparison to the approximately 1.84 million users in fiscal 2000, when the system was initiated. In addition, the amount of nursing care costs in fiscal 2014 (including allowances for high-cost long-term care service, for high-cost medical care and long-term care service, and for long-term care service to a person admitted to a specified facility), totaled 9.6 trillion yen.

SOCIAL SECURITY, HEALTH CARE, AND PUBLIC HYGIENE
164
In fiscal 2014, social security benefit expenditures totaled 112.1 trillion yen (up 1.3 percent from the previous fiscal year), a figure which amounted to 882,100 yen per person. The ratio of Japan's social security benefit expenditures to national income registered 30.8 percent. Benefits for the aged accounted for approximately 70 percent of total social security benefit expenditures.
Table 15.1Trends in Social Security Benefit Expenditures by Institutional Scheme
(Billion yen)FY2000 FY2005 FY2010 FY2013 FY2014
Total ............................................................ 78,399 88,852 105,361 110,705 112,102
Medical insurance ................................... 14,797 16,417 19,059 20,004 20,344Health and medical services for the aged ....... 10,447 10,754 11,718 13,135 13,429Long-term care insurance ....................... 3,262 5,815 7,434 8,702 9,098Pension benefits ...................................... 39,173 45,214 51,755 53,610 53,413Employment insurance 1) ........................ 2,665 1,522 2,460 1,886 1,805Workers' accident compensation insurance .... 1,054 990 952 938 936Family allowance 2) ................................. 712 1,158 3,042 2,898 2,961Public assistance ..................................... 1,939 2,594 3,330 3,629 3,681Social welfare ......................................... 2,186 2,635 3,404 4,057 4,636Public health ........................................... 555 548 1,388 1,242 1,281Gratuities for retired public employees .. 1,420 1,059 702 498 438Aid for war victims ................................. 188 146 116 106 81
Source: Ministry of Health, Labour and Welfare.
Item
for single parent families and families with challenged children.1) Including unemployment benefits for Seamen's insurance. 2) Including income support
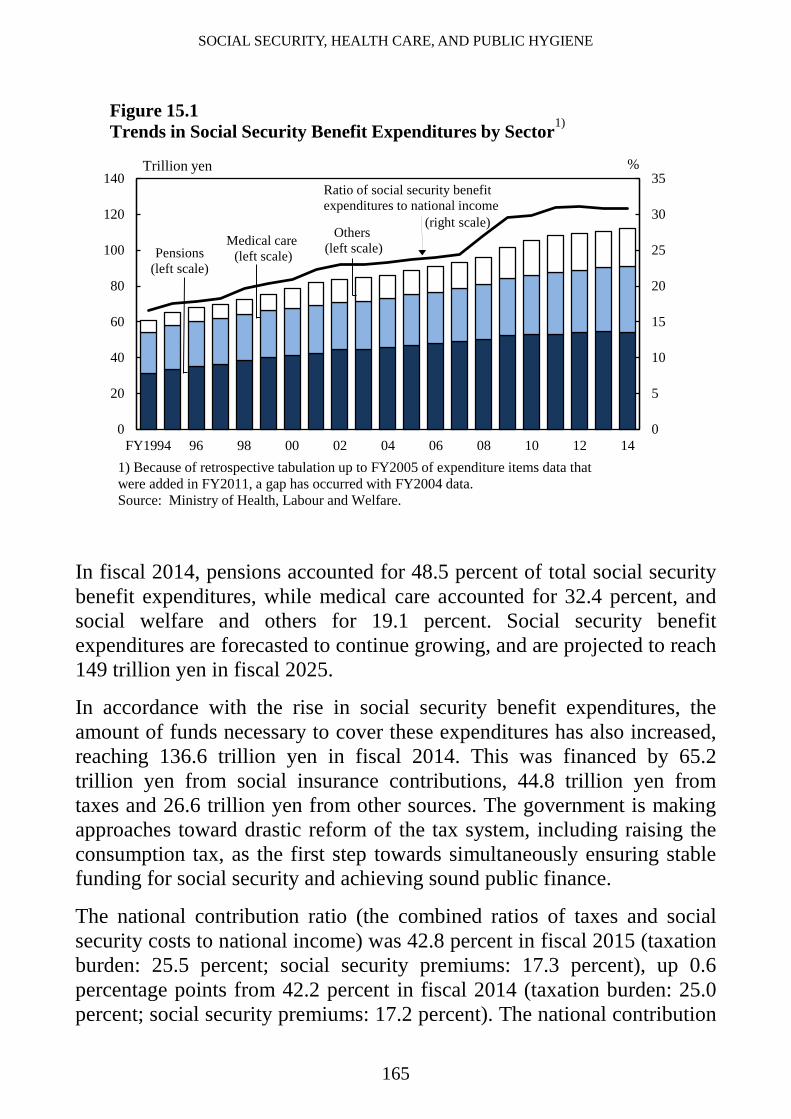
SOCIAL SECURITY, HEALTH CARE, AND PUBLIC HYGIENE
165
In fiscal 2014, pensions accounted for 48.5 percent of total social security benefit expenditures, while medical care accounted for 32.4 percent, and social welfare and others for 19.1 percent. Social security benefit expenditures are forecasted to continue growing, and are projected to reach 149 trillion yen in fiscal 2025.
In accordance with the rise in social security benefit expenditures, the amount of funds necessary to cover these expenditures has also increased, reaching 136.6 trillion yen in fiscal 2014. This was financed by 65.2 trillion yen from social insurance contributions, 44.8 trillion yen from taxes and 26.6 trillion yen from other sources. The government is making approaches toward drastic reform of the tax system, including raising the consumption tax, as the first step towards simultaneously ensuring stable funding for social security and achieving sound public finance.
The national contribution ratio (the combined ratios of taxes and social security costs to national income) was 42.8 percent in fiscal 2015 (taxation burden: 25.5 percent; social security premiums: 17.3 percent), up 0.6 percentage points from 42.2 percent in fiscal 2014 (taxation burden: 25.0 percent; social security premiums: 17.2 percent). The national contribution
0
5
10
15
20
25
30
35
0
20
40
60
80
100
120
140
FY1994 96 98 00 02 04 06 08 10 12 14
Trillion yen
Figure 13.1Trends in Social Security Expenditures
%
Ratio of social security benefitexpenditures to national income
(right scale)
Figure 15.1Trends in Social Security Benefit Expenditures by Sector
1) Because of retrospective tabulation up to FY2005 of expenditure items data that were added in FY2011, a gap has occurred with FY2004 data.Source: Ministry of Health, Labour and Welfare.
1)
Others(left scale)Medical care
(left scale)Pensions(left scale)

SOCIAL SECURITY, HEALTH CARE, AND PUBLIC HYGIENE
166
ratio in 2014 was 32.7 percent in the U.S.A., 45.9 percent in the U.K., and 68.2 percent in France. While the ratio in Japan was higher than that of the U.S.A., it was lower than European countries.
2. Health Care and Public Hygiene Japan has a universal health insurance regime to ensure that anyone can receive necessary medical treatment. Under this regime, every citizen enters a publicly regulated medical insurance system, such as employees' health insurance or national health insurance.
This medical care system has contributed to Japan's achieving the highest life expectancy in the world, as well as a high standard of healthcare along with improvements in the living environment and better nutrition. Currently, reform of the whole system is being undertaken in order to preserve the stability of this medical insurance system in the future.
Life expectancy at birth was 87.1 years for women and 80.8 years for men in 2015. Japan's life expectancy remains the highest level in the world. Even with regard to healthy life expectancy, which is the "period during which one can lead a daily life without being restricted by health
25.5 24.435.5 30.3
50.240.9
17.38.3
10.4 22.1
5.7 27.3
0
10
20
30
40
50
60
70
80
90
Figure 15.2National Contribution Ratio by Country
Ratio of social security premiums burden
Ratio of taxation burden
National contribution ratio
42.8
32.7
45.952.5
56.0
Japan(FY2015)
U.S.A.(2014)
U.K.(2014)
Germany(2014)
France(2014)
%
Sweden(2014)
68.2
Source: Ministry of Finance.

SOCIAL SECURITY, HEALTH CARE, AND PUBLIC HYGIENE
167
problems", Japan had the world's highest as of 2013, with 74.2 years for women and 71.2 years for men. Japan's infant mortality rate was 2.0 per 1,000 births in 2016.
The death rate was 1,046.0 per 100,000 population in 2016. The leading cause of death was malignant neoplasms (298.2 per 100,000 population), followed by lifestyle diseases such as heart diseases (158.2; excluding hypertensive diseases), in which people's daily diet and behavior are significant factors, and pneumonia (95.3). Malignant neoplasms became the leading cause of death in 1981. The death rate by malignant neoplasms has continued to increase since, reaching 28.5 percent of all deaths in 2016.
The number of deaths caused by suicide in Japan hovered at around 30,000 annually in 1998 and onwards, but for 7 consecutive years, this number has been below 30,000, and the number of annual suicides has also been decreasing for the last 7 years. The number of suicides in 2016 was 20,984. In 2016, suicide became the leading cause of deaths for people aged between 15 and 39.
0
50
100
150
200
250
300
1986 91 96 01 06 11 16
Figure 15.3Death by Leading Cause
Per 100,000 population
Cerebrovascular diseases
Malignant neoplasms▼
Heart diseases▼
Pneumonia▼
Figure 15.3Death Rates by Major Cause
Accidents▼
1) Excluding hypertensive diseases.Source: Ministry of Health, Labour and Welfare.
Suicide
1)

SOCIAL SECURITY, HEALTH CARE, AND PUBLIC HYGIENE
168
In the past, humanity has faced the threat of various epidemic diseases, including new strains of influenza. In 2014, cases of infection from Dengue fever in Japan were confirmed for the first time in approximately 70 years. Currently, in Japan, infection control measures are being advanced, such as through the implementation of vaccinations, with the objective of preventing the occurrence and spread of infectious diseases.
In terms of healthcare provision, Japan had 308,651 physicians engaged in medical care, or 242.9 physicians per 100,000 population, in 2014. While the number of physicians providing healthcare is increasing nationwide, their uneven distribution has become a problem due to the lack of physicians specializing in certain areas of medicine and the lack of physicians operating in regional parts of the country.
Table 15.2Medical Personnel at Work
Personnel 2006 2008 2010 2012 2014Number Physicians ....................................... 275,127 283,915 292,338 300,664 308,651 Dentists ........................................... 95,944 98,063 100,161 101,110 102,534 Pharmacists ..................................... 234,429 249,251 258,713 262,520 271,364 Nurses and Assistant nurses ........... 1,194,121 1,252,224 1,320,871 1,373,521 1,426,932
Rates per 100,000 population Physicians ....................................... 215.1 221.7 228.3 235.8 242.9 Dentists ........................................... 75.0 76.6 78.2 79.3 80.7 Pharmacists ..................................... 183.3 194.6 202.0 205.9 213.5 Nurses and Assistant nurses ........... 933.6 977.7 1,031.5 1,077.1 1,122.8Source: Statistics Bureau, MIC; Ministry of Health, Labour and Welfare.

SOCIAL SECURITY, HEALTH CARE, AND PUBLIC HYGIENE
169
As of October 1, 2015, the number of hospitals in Japan (excluding medical clinics and dental clinics) totaled 8,480. The number of hospital beds amounted to 1,565,968 (1232.1 per 100,000 population).
National medical care expenditures have been increasing gradually. In fiscal 2014, the expenditures totaled 40.8 trillion yen or 11.20 percent of Japan's national income. The cost of medical care per person averaged 321,100 yen in fiscal 2014.
Medical costs for treating the latter-stage elderly in fiscal 2014 were 14.5 trillion yen, or about one-third of national medical care expenditure, and accounted for 3.83 percent of the national income. The per-capita cost of medical care for the latter-stage elderly averaged 932,290 yen for the year. The percentage of national medical care expenditures accounted for by medical care costs for the late-stage elderly decreased when the age of
Table 15.3Medical Care Institutions and Beds
Type of Institution 2005 2008 2011 2014 2015Institutions Total ............................................ 173,200 175,656 176,308 177,546 178,212 Hospitals ................................ 9,026 8,794 8,605 8,493 8,480 Medical clinics ....................... 97,442 99,083 99,547 100,461 100,995 Dental clinics ......................... 66,732 67,779 68,156 68,592 68,737
Rates per 100,000 population Total ......................................... 135.6 137.6 138.0 139.7 140.2 Hospitals ................................ 7.1 6.9 6.7 6.7 6.7 Medical clinics ....................... 76.3 77.6 77.9 79.1 79.5 Dental clinics ......................... 52.2 53.1 53.3 54.0 54.1
Beds Total ......................................... 1,798,637 1,756,115 1,712,539 1,680,712 1,673,669 Hospitals ................................ 1,631,473 1,609,403 1,583,073 1,568,261 1,565,968 Medical clinics ....................... 167,000 146,568 129,366 112,364 107,626 Dental clinics ......................... 164 144 100 87 75
Rates per 100,000 population Total ......................................... 1,407.7 1,375.3 1,340.0 1,335.9 1,316.9 Hospitals ................................ 1,276.9 1,260.4 1,238.7 1,234.0 1,232.1 Medical clinics ....................... 130.7 114.8 101.2 88.4 84.7 Dental clinics ......................... 0.1 0.1 0.1 0.1 0.1Source: Ministry of Health, Labour and Welfare.

SOCIAL SECURITY, HEALTH CARE, AND PUBLIC HYGIENE
170
persons eligible to receive later-stage elderly medical care was raised in a phased manner over 5 years from 70 years to 75 years old in October 2002, but in recent years, there has been a slight uptrend.
0
2
4
6
8
10
12
0
10
20
30
40
50
FY1987 90 93 96 99 02 05 08 11 14
%
Ratio of national medical care expenditures to national income (right scale)
Trillion yen
1) Excluding medical care expenditures pertaining to the Great East Japan Earthquake (4.5 billion yen in total, combining the payment for estimated billing and the medical care expenditures of unidentified insurers).Source: Ministry of Health, Labour and Welfare.
Figure 15.4Trends in Medical Care Expenditures
Medical carefor the latter-stage elderly(left scale)
1)

“Statistical Handbook of Japan 2017” by Statistics Bureau, Japan
Chapter 16
Education and Culture
The Takayama Festival popularly refers to two festivals in Takayama: the Sanno Matsuri held in April and the Hachiman Matsuri held in October. The main attractions of the Takayama Festival are the magnificent floats, which are beautifully decorated with carvings, dolls, elaborately-woven fabrics, and lacquerware. In 2016, a total of 33 float festivals in Japan, including the Takayama Festival, were registered collectively as a UNESCO Intangible Cultural Heritage, as "Yama, Hoko, Yatai, float festivals in Japan".
© City of Takayama

EDUCATION AND CULTURE
172
1. School-Based Education
Japan's primary and secondary education is based on a 6-3-3 system: 6 years in elementary school, 3 years in lower secondary school, and 3 years in upper secondary school. The period of compulsory schooling is the 9 years at elementary and lower secondary schools. Higher education institutions are universities, junior colleges, and colleges of technology. Other education establishments include kindergartens, which provide pre-school education, and schools for special needs education. There are also specialized training colleges and miscellaneous schools for a wide range of vocational and other practical skills learning. In order to promote diversity of the school education system, unified lower-upper secondary schooling began at some schools in 1999. Furthermore, in 2016, compulsory education schools, where compulsory education for elementary schools to lower secondary schools is carried out consistently, were established. On an additional note, the school year in Japan starts in April and ends in March of the following year.
Table 16.1Educational Institutions in Japan (as of May 1, 2016)
Schools Students (1,000)
Total National Public Private Males FemalesKindergartens ............................. 11,252 49 4,127 7,076 100 679 661Integrated centers for earlychildhood education and care ..... 2,822 - 452 2,370 57 204 194Elementary schools .................... 20,313 72 20,011 230 417 3,317 3,167Lower secondary schools ........... 10,404 73 9,555 776 252 1,742 1,664Compulsory education schools .. 22 - 22 - 1 7 6Upper secondary schools ........... 4,925 15 3,589 1,321 235 1,668 1,641Secondary schools ...................... 52 4 31 17 3 16 16Schools for special needs education 1) ............................... 1,125 45 1,067 13 82 91 48Colleges of technology ............... 57 51 3 3 4 47 10Junior colleges ........................… 341 - 17 324 8 14 114Universities ................................ 777 86 91 600 184 1,626 1,248 Graduate schools ..................... 627 86 79 462 107 171 79Specialized training colleges ..... 3,183 9 189 2,985 41 291 366Miscellaneous schools................ 1,200 - 6 1,194 9 64 561) Schools for mentally and/or physically challenged children, inclusive of kindergarten to upper secondary school levels.Source: Ministry of Education, Culture, Sports, Science and Technology.
Full-timeteachers(1,000)
Type of institution
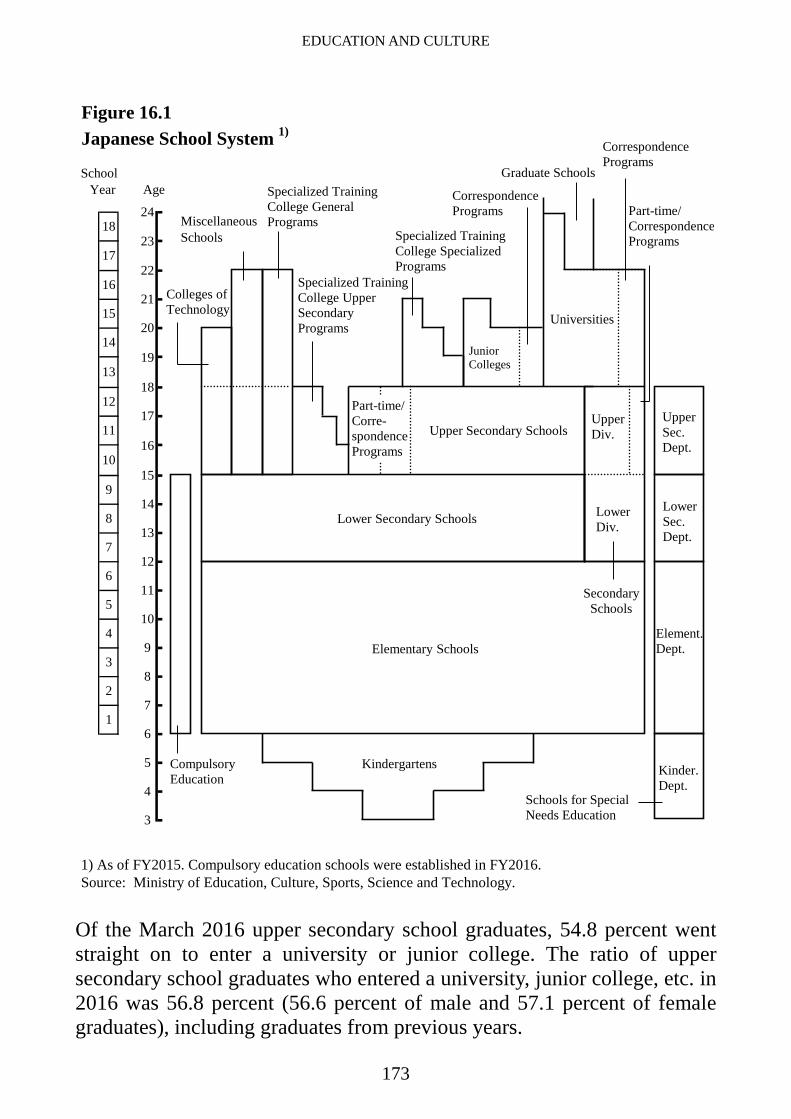
EDUCATION AND CULTURE
173
Of the March 2016 upper secondary school graduates, 54.8 percent went straight on to enter a university or junior college. The ratio of upper secondary school graduates who entered a university, junior college, etc. in 2016 was 56.8 percent (56.6 percent of male and 57.1 percent of female graduates), including graduates from previous years.
Figure 16.1Japanese School System 1)
SchoolYear Age
1) As of FY2015. Compulsory education schools were established in FY2016.Source: Ministry of Education, Culture, Sports, Science and Technology.
3
2
1
3
5
4
8
7
6
9
7
6
5
4
11
10
9
8
1318
24
23
22
21
20
19
12
18
17
16
15
14
13
12
11
10
17
16
15
14
Specialized TrainingCollege Specialized Programs
Lower Secondary Schools
Elementary Schools
Kindergartens Kinder.Dept.
Element. Dept.
Lower Sec.Dept.
Upper Sec.Dept.
Compulsory Education
Colleges ofTechnology
Lower Div.
Upper Div.
JuniorColleges
Universities
Graduate Schools
Specialized TrainingCollege Upper Secondary Programs
MiscellaneousSchools
Part-time/ Corre-spondence Programs
Upper Secondary Schools
Correspondence Programs
Correspondence Programs
Secondary Schools
Part-time/CorrespondencePrograms
Specialized TrainingCollege General Programs
Schools for Special Needs Education

EDUCATION AND CULTURE
174
As of May 1, 2015, a total of 110,282 foreign students were enrolled in Japanese junior colleges, universities, and graduate schools. Of the total foreign students, 89.0 percent were from Asia, including 61,249 from China, 11,366 from the Republic of Korea and 7,412 from Vietnam.
Table 16.2Number of University Students (as of May 1)
2005 2010 2014 2015 2016Total ............................... 2,865,051 2,887,414 2,855,529 2,860,210 2,873,624Undergraduate ................ 2,508,088 2,559,191 2,552,022 2,556,062 2,567,030Graduate schools ............ 254,480 271,454 251,013 249,474 249,588Others 1) .......................... 102,483 56,769 52,494 54,674 57,006 Females ....................... 1,124,900 1,185,580 1,220,091 1,231,868 1,247,726 Undergraduate ............. 1,009,217 1,077,782 1,117,778 1,127,372 1,141,425 Graduate schools ......... 75,734 82,133 77,645 77,831 78,603 Others 1) ....................... 39,949 25,665 24,668 26,665 27,698
National .......................... 627,850 625,048 612,509 610,802 610,401Public .............................. 124,910 142,523 148,042 148,766 150,513Private ............................ 2,112,291 2,119,843 2,094,978 2,100,642 2,112,7101) Non-degree students, auditing students and research students.Source: Ministry of Education, Culture, Sports, Science and Technology.
Humanities14.3%
Socialscience
32.3
Science3.1
Engineering15.0 Agriculture
3.0
Medicine and dentistry
2.8
Education and teacher
training7.4
Others22.1
Figure 16.2University Students by Major Subject (as of May 1, 2016)
Humanities6.8%
Socialscience
10.0
Science8.5
Engineering41.4
Agriculture5.5
Medicine and
dentistry1.0
Education and teacher
training5.8
Others21.0
Undergraduate2,567,030students
Graduate249,588students
Source: Ministry of Education, Culture, Sports, Science and Technology.

EDUCATION AND CULTURE
175
Fiscal 2014 public expenditure on education in Japan was 23 trillion yen, which is equivalent to 14.0 percent of the net expenditure of national and local governments.
Fiscal 2014 school expenditure by households with children attending public school averaged 59,228 yen per elementary school pupil, 128,964 yen per lower-secondary school student and 242,692 yen per upper-secondary school student.
Educational administration(left scale)
6
8
10
12
14
16
12
14
16
18
20
22
24
26
28
30
FY2010 11 12 13 14
Figure 16.3Public Expenditures on Education
Source: Ministry of Education, Culture, Sports, Science and Technology.
Trillion yen %
Percentage of public expenditure on education to net national and local government expenditure (right scale)
0 0
Schooleducation
Socialeducation
~~
~~
Educational administration(left scale)

EDUCATION AND CULTURE
176
Table 16.3Social Education Facilities and Users
2011 2015 2010 2014Citizens' public halls 1).................... 15,399 14,841 204,517 193,464Libraries ......................................... 3,274 3,331 187,562 181,364Museums ........................................ 1,262 1,256 122,831 129,579 General museums ........................ 143 152 7,692 8,499 Science museums ........................ 109 106 14,491 16,439 Historical museums ..................... 448 451 20,754 22,950 Art museums ............................... 452 441 33,395 30,724 Outdoor museums ....................... 18 16 3,111 2,601 Zoological gardens ...................... 32 35 17,083 20,631 Botanical gardens ........................ 10 10 885 860 Zoological and botanical gardens .... 8 7 4,456 4,498 Aquariums ................................... 42 38 20,964 22,377Centers for children and youths ..... 1,048 941 20,043 20,058Women's education centers ............ 375 367 10,172 9,716Public Sports Facilities .................. 47,571 47,536 486,283 501,557Theaters, Concert halls, etc. ........... 1,866 1,851 … …Lifelong learning centers ............... 409 449 26,483 26,218
1) Includes similar facility. 2) As of October 1. 3) Total of fiscal year.Source: Ministry of Education, Culture, Sports, Science and Technology.
Facilities Number 2) Users (1,000) 3)
2. Lifelong Learning In recent years, people's demand for learning has been increasing and the contents are becoming more diverse and advanced. This has raised more and more expectations for the realization of a "Lifelong Learning Society" in which people are able to freely select learning opportunities during their life, and their learning outcomes are evaluated appropriately.
Today, in order to develop a society where people have the freedom to continue learning throughout their lives, efforts are being made to develop learning opportunities such as school education, social education, cultural activities, sports activities, recreational activities, volunteer activities, and corporate in-house education. In providing places and opportunities for such lifelong learning, educational institutions, social education facilities (public halls, libraries, museums, and sports facilities, etc.) play a vital role.

EDUCATION AND CULTURE
177
3. Leisure Activities
The results of the 2011 Survey on Time Use and Leisure Activities conducted with people aged 10 and over show that the per-day average amount of free time was 6 hours and 27 minutes, which was the time remaining after activities that were physiologically necessary (sleeping, eating, etc.) and societally essential (work, housework, etc.). It was found that 1 hour and 14 minutes of free time was spent on hobbies, sports, learning for personal development, volunteer activities, etc.
The participation rate for "sports" was 63.0 percent (percentage of people who engaged in the activity within the past 12 months). The most popular sport for both genders was "walking or light physical exercise" (men: 31.1 percent; women: 39.2 percent). Other popular sports for men were "bowling" (15.1 percent) and "golf (including golf practice range)" (13.7 percent). For women, such sports were "bowling" (10.6 percent) and "swimming" (9.7 percent). The participation rate for "learning, self-education, and training (excluding school and professional activities)" was 35.2 percent. Men preferred "computing etc." (14.8 percent) and "foreign language" (11.0 percent), while women preferred "cooking, sewing or home management, etc." (12.6 percent), as well as "arts and culture" (12.3 percent).
Table 16.4Major Leisure Activities by Gender (10 years old and over) (2011)
Total Males FemalesFree time per day (hours and minutes) .......................... 6:27 6:38 6:16 Active leisure time (hours and minutes) ..................... 1:14 1:28 1:04Participation rate (%) 1)
Hobbies and amusements ............................................ 84.8 84.8 84.9 Sports 2) ....................................................................... 63.0 67.9 58.3 Learning, self-education and training 2) ....................... 35.2 34.3 36.1 Travel (domestic) 3) ..................................................... 57.9 57.2 58.6 Travel (abroad) 3) ......................................................... 8.9 8.5 9.2 Volunteer activities ..................................................... 26.3 24.5 27.91) Total participants / Population (10 years old and over) × 100 2) Excluding school andprofessional activities. 3) Excluding day trips.Source: Statistics Bureau, MIC.
Leisure Activities

EDUCATION AND CULTURE
178
4. Publishing and Mass Media
The total number of books and magazines published in Japan during 2015 was 1,163 million and 2,523 million, respectively. Of the latter, 1,641 million were monthlies and 882 million were weeklies.
A total of 80,048 new book titles were released in 2015. The number of magazine titles published was 3,674 (including 1,996 monthlies and 92 weeklies) as of the end of March 2016. In recent years, there has been an increasing trend in the popularization of the Internet and e-books.
0
500
1,000
1,500
2,000
2,500
3,000
3,500
1995 97 99 01 03 05 07 09 11 13 15
Figure 16.4Trends in Number of Publications
Millions
Source: Shuppan News Co., Ltd.
Monthly magazines▼
Weekly magazines▼
▲
Books

EDUCATION AND CULTURE
179
A total of 117 daily newspapers were in circulation, and the penetration rate was 0.78 newspapers per household as of October 2016.
Table 16.5Number of New Publications
(Titles)Subject 2000 2005 2010 2014 2015
Total .......................................... 65,065 78,304 77,773 80,954 80,048 General works ........................ 2,587 2,551 2,080 1,924 1,715 Philosophy ............................. 2,997 3,763 4,381 4,255 4,275 General history ....................... 4,634 5,102 4,969 4,876 5,233 Social sciences ....................... 14,099 16,201 15,757 15,858 15,598 Natural sciences ..................... 5,218 6,226 6,780 7,007 7,079 Technology and engineering .. 6,105 8,104 8,499 8,736 8,333 Industry and commerce .......... 3,000 3,337 3,478 3,427 3,175 Art .......................................... 8,895 10,884 11,535 13,063 12,972 Languages .............................. 1,766 2,063 1,884 1,751 1,796 Literature ................................ 11,484 13,595 12,879 13,484 13,390 Children's books .................... 3,334 5,064 4,675 5,160 4,801 School textbooks ................... 946 1,414 856 1,413 1,681Source: Shuppan News Co., Ltd.
Figure 16.5Newspaper Circulation by Country (2015)
Source: World Association of Newspapers and News Publishers.
Japan
Canada
Germany
Brazil
South Africa(2013)
Australia
60 40 20 0
Total
0 200 400 600
Per 1,000 adult population
Millions

EDUCATION AND CULTURE
180
Japan has a public broadcasting network (NHK: Nippon Hoso Kyokai, or Japan Broadcasting Corporation), as well as commercial networks. NHK is the pioneer broadcasting station in Japan, and has been funded through fees paid by subscribers.
Major broadcasting services can be divided roughly into three categories: terrestrial, satellite, and cable television. Terrestrial digital broadcasting was launched in some areas of the Kanto, Kinki and Chukyo regions in December 2003 and then also in other areas, including all prefectural capitals, in December 2006. By March 31, 2012, analog broadcasting ended and was completely replaced with terrestrial digital broadcasting in all parts of Japan. Currently, examinations are being conducted towards an early start of broadcasting services in 4K and 8K, which have 8 and 16 times the pixel number of existing full high-definition.
In 2016, advertising expenditures in the four major mass media types in Japan (newspapers, magazines, radio and television) totaled 2.9 trillion yen, down compared with the previous year. This accounted for 45.5 percent of total advertising expenditures, which were 6.3 trillion yen. Spending on Internet advertising reached 1.3 trillion yen (up 13.0 percent from the previous year), maintaining a double-digit growth rate. This amounted to 20.8 percent of the total advertising expenditures.
Table 16.6Advertising Expenditures by Medium
News- Maga- Tele-papers zines vision a)
Advertising expenditures (billion yen)2005 6,823.5 1,037.7 484.2 177.8 2,041.1 48.7 377.7 2,656.32010 5,842.7 639.6 273.3 129.9 1,732.1 78.4 774.7 2,214.72014 6,152.2 605.7 250.0 127.2 1,956.4 - 1,051.9 2,161.02015 6,171.0 567.9 244.3 125.4 1,932.3 - 1,159.4 2,141.72016 6,288.0 543.1 222.3 128.5 1,965.7 - 1,310.0 2,118.4
Percentage distribution (%)2005 100.0 15.2 7.1 2.6 29.9 0.7 5.6 38.92010 100.0 11.0 4.7 2.2 29.6 1.3 13.3 37.92014 100.0 9.8 4.1 2.1 31.8 - 17.1 35.12015 100.0 9.2 4.0 2.0 31.3 - 18.8 34.72016 100.0 8.6 3.5 2.1 31.3 - 20.8 33.7
a) Television including Satellite Media-Related advertising after 2013.Source: Dentsu Inc.
Internet OthersYear Total RadioSatellitemedia-related

EDUCATION AND CULTURE
181
5. Cultural Assets
Throughout the long history, Japan has been endowed with an abundance of valuable cultural assets, including works of art, historic landmarks, and many natural monuments. To pass on this cultural heritage to future generations, the Japanese government has accorded many of the most important assets as national treasures, designated important cultural properties, historic sites, places of scenic beauty, or natural monuments, based on the Act on Protection of Cultural Properties. In addition to preserving cultural assets, measures to utilize such assets are being established, such as expansion of viewing opportunities through exhibitions.
Table 16.7Cultural Properties Designated by the National Government(as of June 1, 2017)
Type of cultural propertiesDesignated important cultural properties ........................................... 13,119 a) 1,101 Fine arts and crasts .......................................................................... 10,654 a) 878 Structures ......................................................................................... 2,465 a) 223Historic sites, places of scenic beauty and natural monuments .......... 3,210 b) 172 Historic sites .................................................................................... 1,784 b) 61 Places of scenic beauty .................................................................... 402 b) 36 Natural monuments ......................................................................... 1,024 b) 75Important tangible folk cultural properties ......................................... 220Important intangible folk cultural properties ...................................... 303Important intangible cultural properties Recognized individuals ................................................................... 76 Performing arts ............................................................................. 37 Craft techniques ............................................................................ 39 Recognized holding groups ............................................................. 27 Performing arts ............................................................................. 13 Craft techniques ............................................................................ 14Traditional building preservation areas 114a) National treasures only. b) Specially designated places only.Source: Ministry of Education, Culture, Sports, Science and Technology.
Number

EDUCATION AND CULTURE
182
As of June 1, 2017, 13,119 items were assigned as designated important cultural properties, of which 1,101 were classified as national treasures. In addition, the government has provided support for such activities as theatrical performances, music, handicrafts, and other important intangible cultural properties. It also has worked to preserve important folk-cultural properties, such as annual cultural events and folk performing arts, as well as to train people to carry on such traditions.
Japan ratified the UNESCO World Heritage Convention (the Convention Concerning the Protection of World Cultural and Natural Heritage) in 1992.
In July 2016, 17 assets located in the 7 countries of Japan, France, Germany, Argentina, Belgium, India, and Switzerland, including the National Museum of Western Art, were registered collectively as Japan's 20th world heritage as "architectural works of Le Corbusier". The main building of the National Museum of Western Art is the only building designed by Le Corbusier in Japan, and is considered as being a representative work that shows Le Corbusier's characteristic design elements. Such a world heritage that extends over different continents is the first of its kind.
In July 2017, "Sacred Island" of Okinoshima and Associated Sites in the Munakata Region were registered as Japan’s 21st World Heritage, as a unique "repository" of ancient sacrifices, and as evidence indicating what sacrifices called for in praying for safety of maritime navigation associated with active exchanges among the Japanese archipelago, Korean Peninsula, and Asian Continent that were carried out from the 4th century to the end of the 9th century.

EDUCATION AND CULTURE
183
In 2006, the UNESCO Convention for the safeguarding of intangible cultural heritage entered into force. As of December 2016, Japan has 21 entries on its list, including: Nogaku Theater, Ningyo Johruri Bunraku Puppet Theater, Kabuki Theater (the kind of Kabuki performed using a traditional method of acting and directing), and Washoku, the traditional dietary culture of Japan.
Table 16.8Heritage Sites Inscribed on the World Heritage List 1)
Type ofheritage
1993 Cultural Buddhist Monuments in the Horyu-ji Area NaraCultural Himeji-jo (castle) HyogoNatural Yakushima (island) KagoshimaNatural Shirakami-Sanchi (mountains) Aomori, Akita
1994 Cultural Historic Monuments of Ancient Kyoto Kyoto, Shiga1995 Cultural Historic Villages of Shirakawa-go and Gokayama Gifu, Toyama1996 Cultural Hiroshima Peace Memorial (Genbaku Dome) Hiroshima
Cultural Itsukushima Shinto Shrine Hiroshima1998 Cultural Historic Monuments of Ancient Nara Nara1999 Cultural Shrines and Temples of Nikko Tochigi2000 Cultural Gusuku Sites and Related Properties of the Okinawa
Kingdom of Ryukyu2004 Cultural Sacred Sites and Pilgrimage Routes in the Kii Mie, Nara,
Mountain Range Wakayama2005 Natural Shiretoko (peninsula) Hokkaido2007 Cultural Iwami Ginzan Silver Mine and its Shimane
Cultural Landscape2011 Natural Ogasawara Islands Tokyo
Cultural Hiraizumi-Temples, Gardens and Archaeological IwateSites Representing the Buddhist Pure Land
2013 Cultural Fujisan, Sacred Place and Source of Aristic Shizuoka, YamanashiInspiration
2014 Cultural Tomioka Silk Mill and Related Sites Gunma2015 Cultural Sites of Japan’s Meiji Industrial Revolution: Yamaguchi, Fukuoka,
Iron and Steel, Shipbuilding and Coal Mining Saga, Kumamoto,Nagasaki, Kagoshima,Iwate, Shizuoka
2016 Cultural Main building of the National Museum of Western TokyoArt - The Architectural Work of Le Corbusier
2017 Cultural Sacred Island of Okinoshima and FukuokaAssociated Sites in the Munakata Region
1) As of July, 2017. Source: Ministry of Education, Culture, Sports, Science and Technology.
Year World heritage Prefecture

“Statistical Handbook of Japan 2017” by Statistics Bureau, Japan
Chapter 17
Government System
The Cabinet Office government office building is where the Cabinet Secretariat and Cabinet Office carry out plan proposals and general coordination related to specific issues that are important in national politics. Thus, it has undergone seismic isolation retrofitting (aseismatic repair method to improve aseismatic performance, by reducing the seismic force on a building during large earthquake motions through base isolation of existing buildings and without having to reinforce the existing structural skeleton, for the most part) to enable for maintenance of functions even when there is an earthquake, and aseismatic performance necessary as a base facility for disaster prevention is ensured. The south side of the premises is adjacent to Central Government Building No. 8.
© Government Buildings Department, Minister’s Secretariat, Ministry of Land, Infrastructure and Transport

GOVERNMENT SYSTEM
185
1. Separation of Powers
The Constitution of Japan, which went into effect on May 3, 1947, is based on three core principles: sovereignty of the people, respect for fundamental human rights and pacifism. To control governmental power effectively through checks and balances, governmental power is separated into three independent branches: legislative, executive and judicial, and each contains a separate set of agencies and personnel.
Figure 17.1Separation of Powers under the Constitution of Japan
Diet
Cabinet Supreme Court
(Legislative Branch)
(Executive Branch) (Judicial Branch)
Election
National Review of the JudgesAdministration
Source: Prime Minister of Japan and His Cabinet.
Judgement on the Constitutionality of Laws
ImpeachmentTrial
Judgement on the Lawfulness of Statutes, Rules and Dispositions
Designation of the Chief Judge ofthe Supreme Court / Appointment
of the Judges of the Supreme Court
Designation of the Prime Minister /
Cabinet Non-Confidence Resolution
Dissolution of the House of
Representatives / Convocation of
the Diet
People(Sovereign)
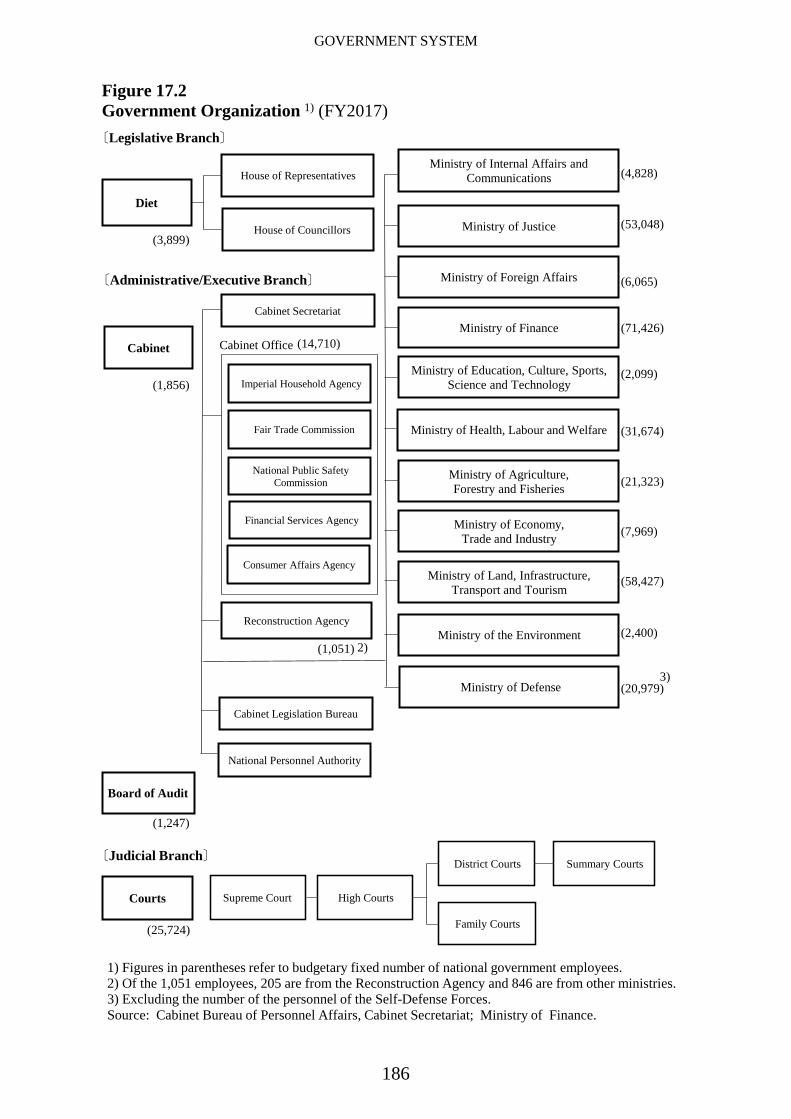
GOVERNMENT SYSTEM
186
(31,674)
(21,323)
(58,427)
(53,048)
(2,099)
(3,899)
(4,828)
(6,065)
(71,426)(14,710)
(2,400)
(7,969)
(20,979)
(1,856)
(25,724)
(1,247)
(0)
(1,051)
〔Administrative/Executive Branch〕
Figure 17.2Government Organization 1) (FY2017)
Cabinet Secretariat
Cabinet
Ministry of Health, Labour and Welfare
1) Figures in parentheses refer to budgetary fixed number of national government employees. 2) Of the 1,051 employees, 205 are from the Reconstruction Agency and 846 are from other ministries.3) Excluding the number of the personnel of the Self-Defense Forces.Source: Cabinet Bureau of Personnel Affairs, Cabinet Secretariat; Ministry of Finance.
〔Judicial Branch〕
Cabinet Office
〔Legislative Branch〕
House of Councillors
Diet
House of Representatives
High CourtsSupreme Court
District Courts Summary Courts
Family Courts
Courts
Board of Audit
Cabinet Legislation Bureau
National Personnel Authority
Ministry of Education, Culture, Sports, Science and Technology
Ministry of Finance
Ministry of Foreign Affairs
Ministry of Justice
Ministry of Internal Affairs and Communications
Ministry of Agriculture, Forestry and Fisheries
Ministry of Economy,Trade and Industry
Ministry of Land, Infrastructure, Transport and Tourism
Ministry of the Environment
Imperial Household Agency
Fair Trade Commission
National Public Safety Commission
Ministry of Defense
Financial Services Agency
Consumer Affairs Agency
Reconstruction Agency
2)
3)

GOVERNMENT SYSTEM
187
2. Legislative Branch
The Diet is the highest organ of state power, and is the sole law-making organ of the State. The Diet consists of the House of Representatives and the House of Councillors. Both Houses consist of elected members, representative of all the people.
The most important responsibility of the Diet is to enact legislation. The Diet also has the authority to fulfill a number of additional functions, including the deliberation and passage of the budget and other matters of fiscal importance, the approval of treaties, the designation of the Prime Minister and the initiation of motions to amend the Constitution. Each House may conduct investigations relating to the government, and demand the presence and testimony of witnesses, and the production of records. For the Diet to pass a resolution, the agreement of both Houses of the Diet is necessary. However, when the two Houses differ in their resolutions regarding legislative bills, draft budgets, the approval of treaties or the designation of the Prime Minister, under the terms of the Constitution, the decision of the House of Representatives overrides that of the House of Councillors.
The term of office for Diet members is set by the Constitution. Members of the House of Representatives serve a four-year term, while members of the House of Councillors, six years. Elections for the latter are held every three years, so that one half of the seats are contested in each election.
The House of Representatives has 465 members. Of these, 289 are elected under a single-seat constituency system, while 176 are elected under a proportional representation system in which the nation is divided into 11 regions. The last general election was held in December 2014. The House of Councillors has 242 members, of whom 96 are elected through proportional representation, and 146 are elected as representatives from 45 electoral districts of the nation, i.e. prefectures. The last regular election was held in July 2016.
In June 2015, revisions to the Public Offices Election Law, which consist mainly of lowering the voting age from 20 to 18 years or older, were established and promulgated. The revisions were applied starting with the abovementioned House of Councillors election, which was officially announced in June 2016. Furthermore, both men and women above the qualifying age are eligible to run in elections. The qualifying age for

GOVERNMENT SYSTEM
188
members of the House of Representatives is 25 years or older, while the qualifying age for members of the House of Councillors is 30 years or older.
3. Executive Branch
The Cabinet exercises its executive power on the basis of the laws and budgets adopted by the Diet. The Cabinet, composed of the Prime Minister and other Ministers of State, is collectively responsible to the Diet, regarding the exercise of the executive power. The Prime Minister is elected in the Diet from among its members. The majority of the ministers of state to be appointed by the Prime Minister must be Diet members. Thus, Japan adopts the parliamentary Cabinet system, in which the organization and existence of the Cabinet rest on the confidence in the Diet.
The Cabinet's powers include the following: (i) implementing laws; (ii) engaging in foreign diplomacy; (iii) signing treaties; (iv) overseeing the operational affairs of public officers; (v) formulating a budget and submitting it to the Diet; (vi) enacting Cabinet orders; and (vii) deciding
Table 17.1Diet Members by Political Group
Name Males Females Name Males Females
Incumbents ........................................ 430 44 Incumbents ........................................ 192 50 Liberal Democratic Party ............... 267 25 Liberal Democratic Party and The Democratic Party The Party for Japanese Kokoro .... 106 20 and Club of Independents ........... 86 9 The Democratic Party Komeito .......................................... 32 3 and The Shin-Ryokufukai ............ 38 12 Japanese Communist Party ............ 15 6 Komeito ......................................... 20 5 Nippon Ishin Japanese Communist Party ............ 9 5 (Japan Innovation Party) .............. 15 0 Nippon Ishin Liberal Party ................................... 2 0 (Japan Innovation Party) .............. 10 2 Social Democratic Party ................. 2 0 Hope Coalition (Kibou) ................. 3 3
Independents Club ......................... 2 2 Okinawa Whirlwind ....................... 1 1
Independents .................................. 11 1 Independents .................................. 3 0
Source: House of Representatives; House of Councillors.
House of Representatives (as of April 21, 2017) House of Councillors (as of June 18, 2017)Membership 1) 474, Vacancies 1 Membership 242, Vacancies 0
1) Due to the revision to the Public Offices Election Law in July 2017, the constant number ofseats is 465, which are applied from the next general election for the House of Representatives.

GOVERNMENT SYSTEM
189
amnesty. In addition, the Cabinet powers also include naming the Chief Justice of the Supreme Court and appointing other judges. The Cabinet also gives advice and approval to the Emperor in matters of state, and bears the responsibility for this.
4. Judicial Branch
Judicial power resides in the courts and is independent from the executive branch and the legislative branch.
The Constitution provides for the establishment of the Supreme Court as the highest court with final judgment, while the Court Act provides for four lower-level courts (High Court, District Court, Family Court and Summary Court). At present, there are eight High Courts, 50 District Courts, 50 Family Courts, and 438 Summary Courts throughout the nation.
To ensure fair judgments, Japan uses a three-tiered judicial system. The first courts in the court hierarchy are the District Courts, the second are the High Courts, and the highest court is the Supreme Court. The system allows a case to be heard and ruled on up to three times in principle, should a party involved in the case so desire. The Summary Courts and Family Courts handle simple cases, domestic relations and cases involving juveniles as first instances.
The Supreme Court has the authority to deliver the final judgment on the legitimacy of any law, ordinance, regulation, or disposition. It is chaired by the Chief Justice and 14 judges.
Table 17.2Successive Prime Ministers
Date 1) Name Date 1) NameDec. 26, 2012 Shinzo ABE Apr. 26, 2001 Junichiro KOIZUMISep. 2, 2011 Yoshihiko NODA Apr. 5, 2000 Yoshiro MORIJun. 8, 2010 Naoto KAN Jul. 30, 1998 Keizo OBUCHISep. 16, 2009 Yukio HATOYAMA Jan. 11, 1996 Ryutaro HASHIMOTOSep. 24, 2008 Taro ASO Jun. 30, 1994 Tomiichi MURAYAMASep. 26, 2007 Yasuo FUKUDA Apr. 28, 1994 Tsutomu HATASep. 26, 2006 Shinzo ABE Aug. 9, 1993 Morihiro HOSOKAWA
1) Date of initial cabinet formation.Source: Prime Minister of Japan and His Cabinet.
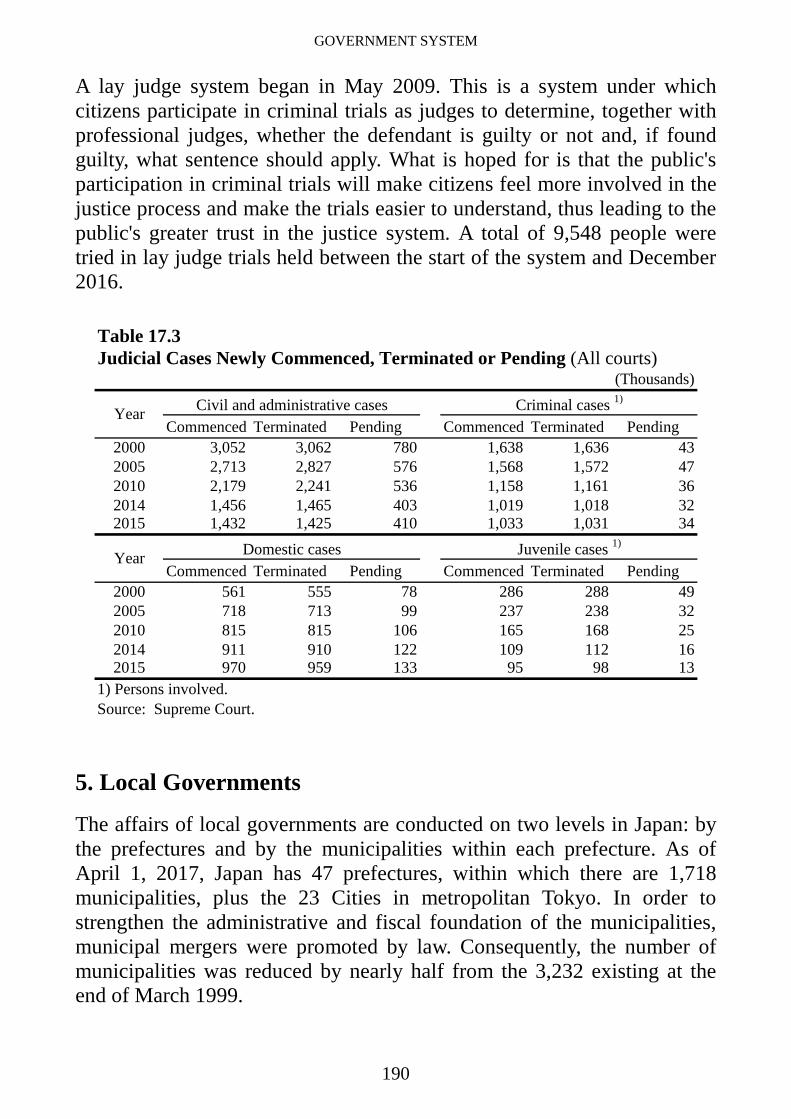
GOVERNMENT SYSTEM
190
A lay judge system began in May 2009. This is a system under which citizens participate in criminal trials as judges to determine, together with professional judges, whether the defendant is guilty or not and, if found guilty, what sentence should apply. What is hoped for is that the public's participation in criminal trials will make citizens feel more involved in the justice process and make the trials easier to understand, thus leading to the public's greater trust in the justice system. A total of 9,548 people were tried in lay judge trials held between the start of the system and December 2016.
5. Local Governments
The affairs of local governments are conducted on two levels in Japan: by the prefectures and by the municipalities within each prefecture. As of April 1, 2017, Japan has 47 prefectures, within which there are 1,718 municipalities, plus the 23 Cities in metropolitan Tokyo. In order to strengthen the administrative and fiscal foundation of the municipalities, municipal mergers were promoted by law. Consequently, the number of municipalities was reduced by nearly half from the 3,232 existing at the end of March 1999.
Table 17.3Judicial Cases Newly Commenced, Terminated or Pending (All courts)
(Thousands)Civil and administrative cases Criminal cases 1)
Commenced Terminated Pending Commenced Terminated Pending 2000 3,052 3,062 780 1,638 1,636 432005 2,713 2,827 576 1,568 1,572 472010 2,179 2,241 536 1,158 1,161 362014 1,456 1,465 403 1,019 1,018 322015 1,432 1,425 410 1,033 1,031 34
Domestic cases Juvenile cases 1)
Commenced Terminated Pending Commenced Terminated Pending 2000 561 555 78 286 288 492005 718 713 99 237 238 322010 815 815 106 165 168 252014 911 910 122 109 112 162015 970 959 133 95 98 13
1) Persons involved.Source: Supreme Court.
Year
Year

GOVERNMENT SYSTEM
191
Municipalities that satisfy certain population criteria (i.e., 500,000 people or more) are eligible for designation as "Ordinance-designated cities". This designation gives them administrative and fiscal authority equivalent to those of prefectures. With the addition of Kumamoto City in April 2012, there are presently 20 cities that have earned this designation. See the map on the inside back cover.
Employedpersons
Figure 17.4Local Government Employees by Type of Administrative Services(as of April 1, 2016)
Source: Ministry of Internal Affairs and Communications.
806040200 100
General administrative services
Social welfare and public hygiene
Transportation 0.9
Fire services 5.8
Hospitals 7.4Water and sewerage 2.6
Education 37.3 % 20.0 13.3 Police10.5
Others 2.2
2,737,263
%
1) Figures in parentheses indicate number. Source: Ministry of Internal Affairs and Communications.
National level Local level
National government
Cities (771)
Prefectures (47) Wards
Towns (744)
Municipalities
Villages (183)
Figure 17.3Government System by Level 1) (as of October 10, 2016)
23 Cities of Tokyo Metropolis
Ordinance-designated cities
(20)
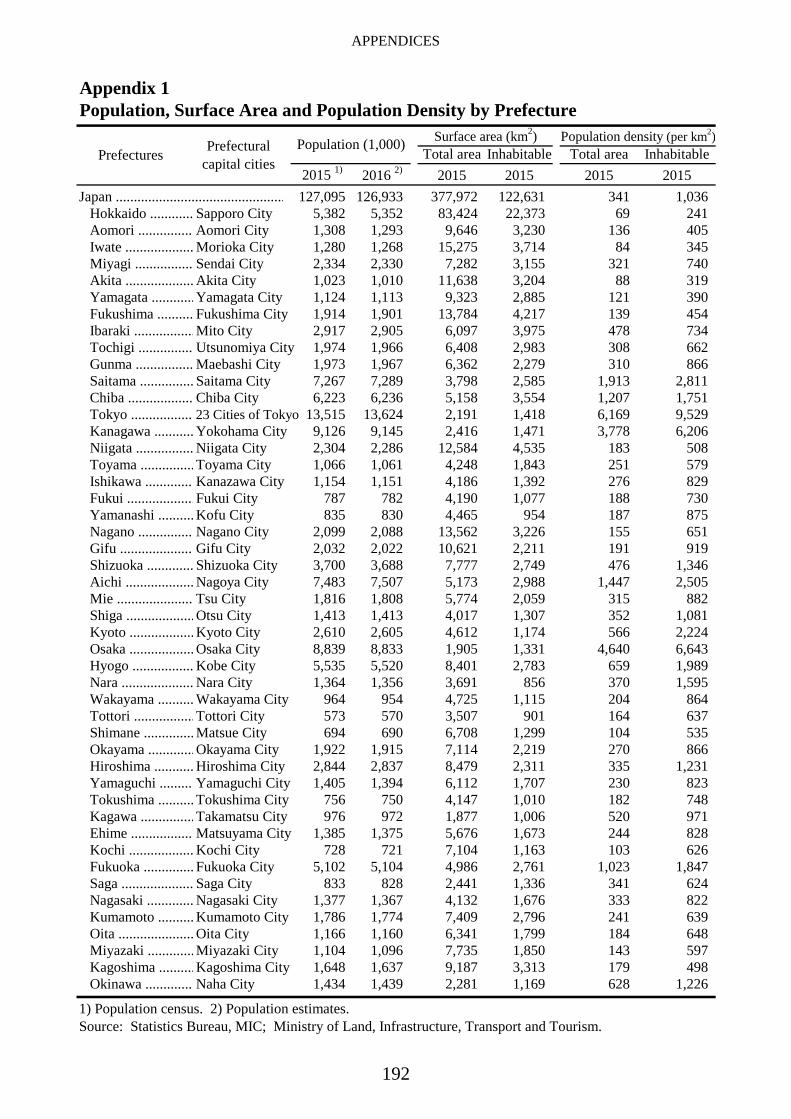
APPENDICES
192
Appendix 1Population, Surface Area and Population Density by Prefecture
Total area Inhabitable Total area Inhabitable2016 2) 2015 2015 2015 2015
Japan ............................................... 126,933 377,972 122,631 341 1,036 Hokkaido ............ Sapporo City 5,382 5,352 83,424 22,373 69 241 Aomori ............... Aomori City 1,308 1,293 9,646 3,230 136 405 Iwate ................... Morioka City 1,280 1,268 15,275 3,714 84 345 Miyagi ................ Sendai City 2,334 2,330 7,282 3,155 321 740 Akita ................... Akita City 1,023 1,010 11,638 3,204 88 319 Yamagata ............Yamagata City 1,124 1,113 9,323 2,885 121 390 Fukushima .......... Fukushima City 1,914 1,901 13,784 4,217 139 454 Ibaraki .................Mito City 2,917 2,905 6,097 3,975 478 734 Tochigi ............... Utsunomiya City 1,974 1,966 6,408 2,983 308 662 Gunma ................ Maebashi City 1,973 1,967 6,362 2,279 310 866 Saitama ............... Saitama City 7,267 7,289 3,798 2,585 1,913 2,811 Chiba .................. Chiba City 6,223 6,236 5,158 3,554 1,207 1,751 Tokyo ................. 23 Cities of Tokyo 13,515 13,624 2,191 1,418 6,169 9,529 Kanagawa ........... Yokohama City 9,126 9,145 2,416 1,471 3,778 6,206 Niigata ................ Niigata City 2,304 2,286 12,584 4,535 183 508 Toyama ...............Toyama City 1,066 1,061 4,248 1,843 251 579 Ishikawa ............. Kanazawa City 1,154 1,151 4,186 1,392 276 829 Fukui ...................Fukui City 787 782 4,190 1,077 188 730 Yamanashi .......... Kofu City 835 830 4,465 954 187 875 Nagano ............... Nagano City 2,099 2,088 13,562 3,226 155 651 Gifu .................... Gifu City 2,032 2,022 10,621 2,211 191 919 Shizuoka ............. Shizuoka City 3,700 3,688 7,777 2,749 476 1,346 Aichi ................... Nagoya City 7,483 7,507 5,173 2,988 1,447 2,505 Mie ..................... Tsu City 1,816 1,808 5,774 2,059 315 882 Shiga ...................Otsu City 1,413 1,413 4,017 1,307 352 1,081 Kyoto ..................Kyoto City 2,610 2,605 4,612 1,174 566 2,224 Osaka .................. Osaka City 8,839 8,833 1,905 1,331 4,640 6,643 Hyogo ................. Kobe City 5,535 5,520 8,401 2,783 659 1,989 Nara .................... Nara City 1,364 1,356 3,691 856 370 1,595 Wakayama .......... Wakayama City 964 954 4,725 1,115 204 864 Tottori .................Tottori City 573 570 3,507 901 164 637 Shimane .............. Matsue City 694 690 6,708 1,299 104 535 Okayama .............Okayama City 1,922 1,915 7,114 2,219 270 866 Hiroshima ........... Hiroshima City 2,844 2,837 8,479 2,311 335 1,231 Yamaguchi ......... Yamaguchi City 1,405 1,394 6,112 1,707 230 823 Tokushima .......... Tokushima City 756 750 4,147 1,010 182 748 Kagawa ...............Takamatsu City 976 972 1,877 1,006 520 971 Ehime ................. Matsuyama City 1,385 1,375 5,676 1,673 244 828 Kochi .................. Kochi City 728 721 7,104 1,163 103 626 Fukuoka .............. Fukuoka City 5,102 5,104 4,986 2,761 1,023 1,847 Saga .................... Saga City 833 828 2,441 1,336 341 624 Nagasaki ............. Nagasaki City 1,377 1,367 4,132 1,676 333 822 Kumamoto .......... Kumamoto City 1,786 1,774 7,409 2,796 241 639 Oita ..................... Oita City 1,166 1,160 6,341 1,799 184 648 Miyazaki .............Miyazaki City 1,104 1,096 7,735 1,850 143 597 Kagoshima ..........Kagoshima City 1,648 1,637 9,187 3,313 179 498 Okinawa ............. Naha City 1,434 1,439 2,281 1,169 628 1,226
1) Population census. 2) Population estimates.Source: Statistics Bureau, MIC; Ministry of Land, Infrastructure, Transport and Tourism.
127,095
Population density (per km2)
2015 1)
Prefecturalcapital citiesPrefectures
Surface area (km2)Population (1,000)

APPENDICES
193
Appendix 2Main Economic Indicators of Selected Countries
Item Year Japan Argentina Australia Brazil CanadaPopulation (thousands) 2014 127,083 42,980 23,622 206,078 35,588
2015 127,095 43,417 23,969 207,848 35,9402016 126,838 43,847 24,309 209,568 36,286
Projection (medium variant) 2050 101,923 55,445 33,496 238,270 44,136
Employed persons (1,000) 2015 a 6,465 b 15,686 11,752 91,726 17,947Unemployed persons (1,000) 2015 a 208 b 1,184 758 8,432 1,331Unemployment rates (%) 2015 a 3.1 b 7.2 6.2 8.6 7.0Hours of work per week 2015 a 41.6 b 43.0 … 40.0 40.0 (manufacturing)
Industrial production index 2015 98.2 … 109.8 89.1 111.7 (2010=100) 2016 97.4 … 111.2 83.1 113.3
Gross domestic product 2014 4,853 571 1,451 2,417 1,793 (US$ billion) 2015 4,384 632 1,231 1,773 1,553
Producer Price index 2015 102.7 ... 107.5 136.1 110.3 (2010=100) 2016 99.1 ... 106.9 151.8 110.1
Consumer price index 2015 103.6 ... 112.0 138.4 108.7 (2010=100) 2016 103.5 ... 113.5 150.5 110.2
Broad money Percent changes from End of 2015 2.5 37.3 6.0 11.2 9.1 the previous year (%) End of 2016 ... 37.5 6.9 10.6 8.4
Exports, FOB (US$ billion) 2016 624.8 59.7 187.7 191.1 409.0Imports, CIF (US$ billion) 2016 644.9 57.7 191.1 185.3 389.4
Gold and foreign End of 2016 1,189,485 36,410 52,214 362,606 82,718 exchange reserves (US$ million)
Foreign exchange rates Australian Canadian (national currency per US$) dollars dollars End of year 2016 117.11 15.9000 1.3820 3.2585 1.3427 Period average 2016 108.84 14.7582 1.3452 3.4901 1.3254
Reais
a) 2016. b) 2014. Urban areas only.
Yen Pesos
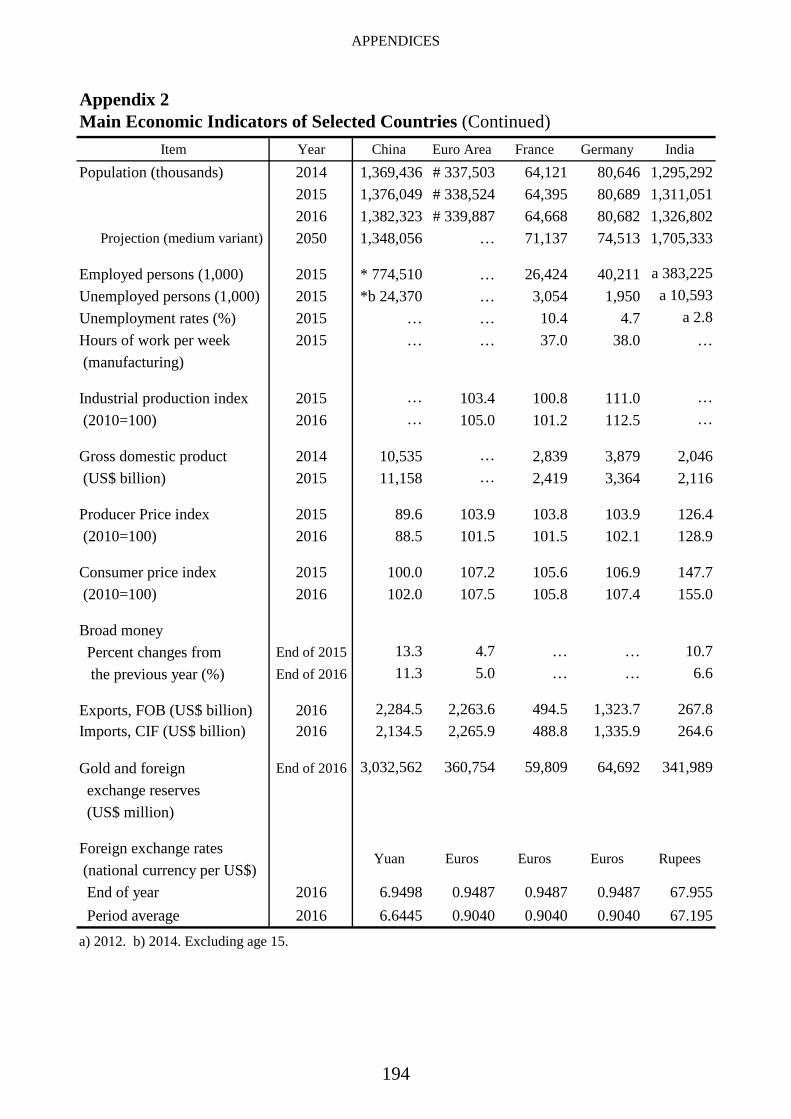
APPENDICES
194
Appendix 2Main Economic Indicators of Selected Countries (Continued)
Item Year China Euro Area France Germany IndiaPopulation (thousands) 2014 1,369,436 # 337,503 64,121 80,646 1,295,292
2015 1,376,049 # 338,524 64,395 80,689 1,311,0512016 1,382,323 # 339,887 64,668 80,682 1,326,802
Projection (medium variant) 2050 1,348,056 … 71,137 74,513 1,705,333
Employed persons (1,000) 2015 * 774,510 … 26,424 40,211 a 383,225Unemployed persons (1,000) 2015 *b 24,370 … 3,054 1,950 a 10,593Unemployment rates (%) 2015 … … 10.4 4.7 a 2.8Hours of work per week 2015 … … 37.0 38.0 … (manufacturing)
Industrial production index 2015 … 103.4 100.8 111.0 … (2010=100) 2016 … 105.0 101.2 112.5 …
Gross domestic product 2014 10,535 … 2,839 3,879 2,046 (US$ billion) 2015 11,158 … 2,419 3,364 2,116
Producer Price index 2015 89.6 103.9 103.8 103.9 126.4 (2010=100) 2016 88.5 101.5 101.5 102.1 128.9
Consumer price index 2015 100.0 107.2 105.6 106.9 147.7 (2010=100) 2016 102.0 107.5 105.8 107.4 155.0
Broad money Percent changes from End of 2015 13.3 4.7 … … 10.7 the previous year (%) End of 2016 11.3 5.0 … … 6.6
Exports, FOB (US$ billion) 2016 2,284.5 2,263.6 494.5 1,323.7 267.8Imports, CIF (US$ billion) 2016 2,134.5 2,265.9 488.8 1,335.9 264.6
Gold and foreign End of 2016 3,032,562 360,754 59,809 64,692 341,989 exchange reserves (US$ million)
Foreign exchange rates (national currency per US$) End of year 2016 6.9498 0.9487 0.9487 0.9487 67.955 Period average 2016 6.6445 0.9040 0.9040 0.9040 67.195
Euros Euros Euros
a) 2012. b) 2014. Excluding age 15.
Yuan Rupees
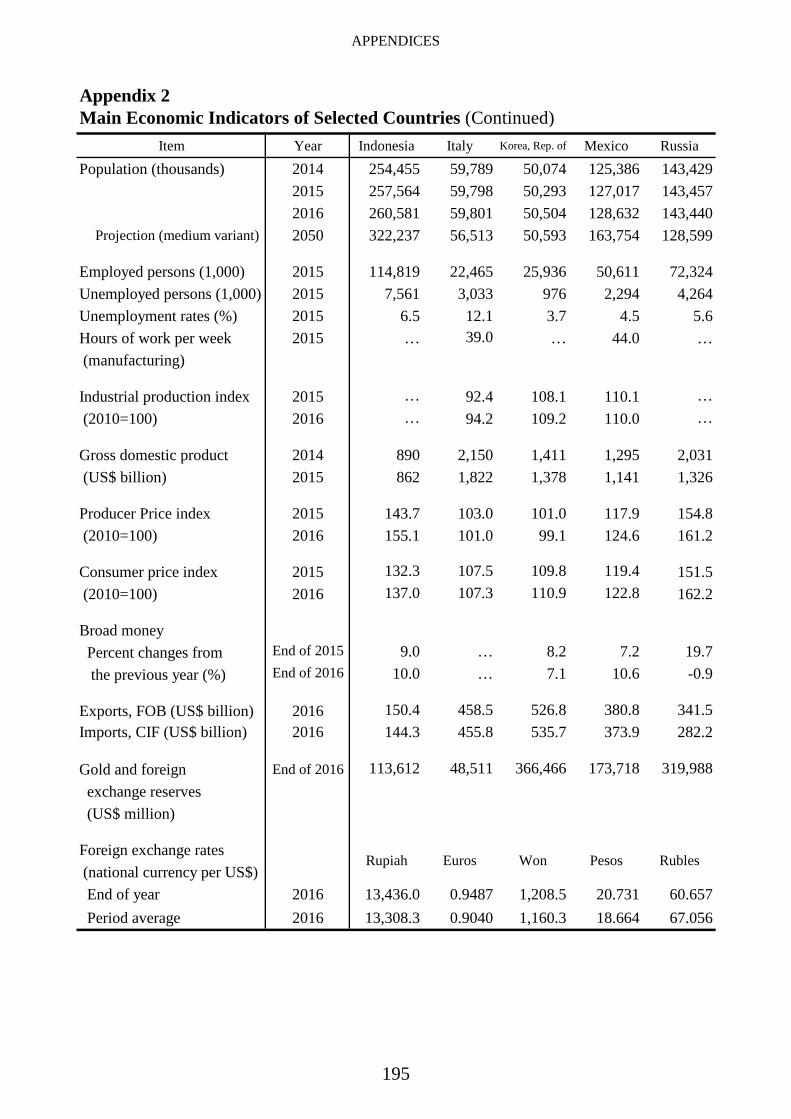
APPENDICES
195
Appendix 2Main Economic Indicators of Selected Countries (Continued)
Item Year Indonesia Italy Korea, Rep. of Mexico RussiaPopulation (thousands) 2014 254,455 59,789 50,074 125,386 143,429
2015 257,564 59,798 50,293 127,017 143,4572016 260,581 59,801 50,504 128,632 143,440
Projection (medium variant) 2050 322,237 56,513 50,593 163,754 128,599
Employed persons (1,000) 2015 114,819 22,465 25,936 50,611 72,324Unemployed persons (1,000) 2015 7,561 3,033 976 2,294 4,264Unemployment rates (%) 2015 6.5 12.1 3.7 4.5 5.6Hours of work per week 2015 … 39.0 … 44.0 … (manufacturing)
Industrial production index 2015 … 92.4 108.1 110.1 … (2010=100) 2016 … 94.2 109.2 110.0 …
Gross domestic product 2014 890 2,150 1,411 1,295 2,031 (US$ billion) 2015 862 1,822 1,378 1,141 1,326
Producer Price index 2015 143.7 103.0 101.0 117.9 154.8 (2010=100) 2016 155.1 101.0 99.1 124.6 161.2
Consumer price index 2015 132.3 107.5 109.8 119.4 151.5 (2010=100) 2016 137.0 107.3 110.9 122.8 162.2
Broad money Percent changes from End of 2015 9.0 … 8.2 7.2 19.7 the previous year (%) End of 2016 10.0 … 7.1 10.6 -0.9
Exports, FOB (US$ billion) 2016 150.4 458.5 526.8 380.8 341.5Imports, CIF (US$ billion) 2016 144.3 455.8 535.7 373.9 282.2
Gold and foreign End of 2016 113,612 48,511 366,466 173,718 319,988 exchange reserves (US$ million)
Foreign exchange rates (national currency per US$) End of year 2016 13,436.0 0.9487 1,208.5 20.731 60.657 Period average 2016 13,308.3 0.9040 1,160.3 18.664 67.056
PesosEuros Won RublesRupiah
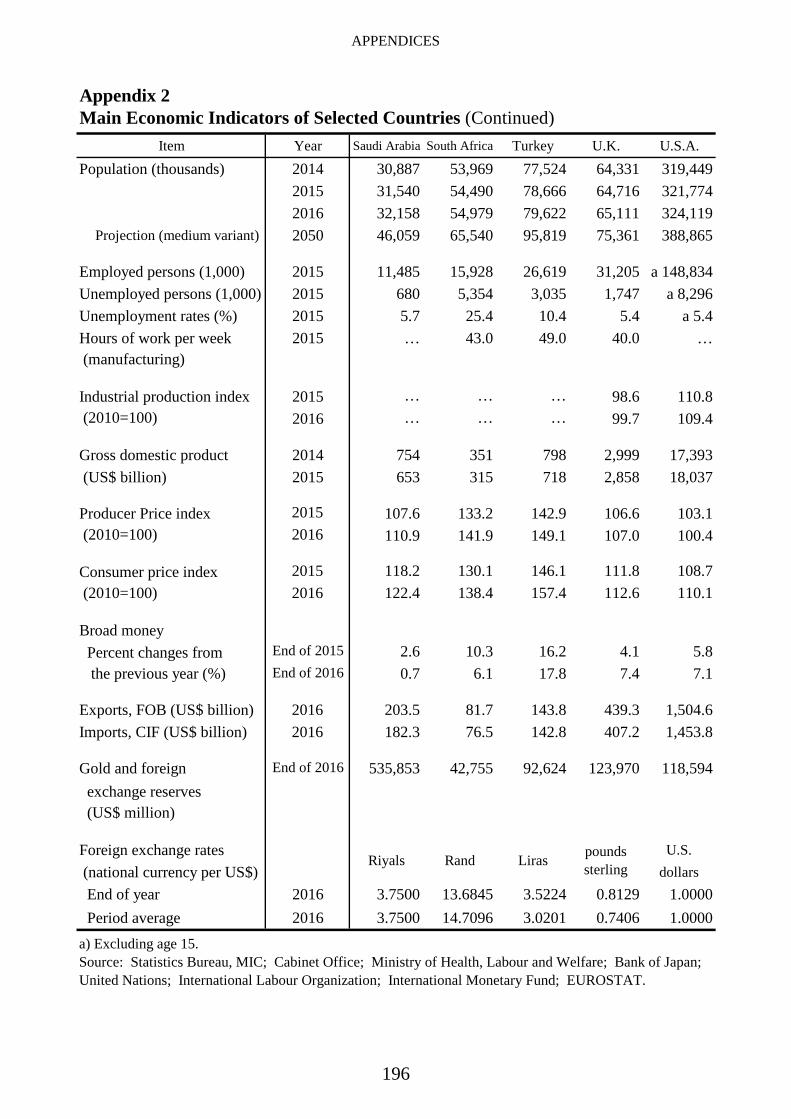
APPENDICES
196
Appendix 2Main Economic Indicators of Selected Countries (Continued)
Item Year Saudi Arabia South Africa Turkey U.K. U.S.A.Population (thousands) 2014 30,887 53,969 77,524 64,331 319,449
2015 31,540 54,490 78,666 64,716 321,7742016 32,158 54,979 79,622 65,111 324,119
Projection (medium variant) 2050 46,059 65,540 95,819 75,361 388,865
Employed persons (1,000) 2015 11,485 15,928 26,619 31,205 a 148,834Unemployed persons (1,000) 2015 680 5,354 3,035 1,747 a 8,296Unemployment rates (%) 2015 5.7 25.4 10.4 5.4 a 5.4Hours of work per week 2015 … 43.0 49.0 40.0 … (manufacturing)
Industrial production index 2015 … … … 98.6 110.8 (2010=100) 2016 … … … 99.7 109.4
Gross domestic product 2014 754 351 798 2,999 17,393 (US$ billion) 2015 653 315 718 2,858 18,037
Producer Price index 2015 107.6 133.2 142.9 106.6 103.1 (2010=100) 2016 110.9 141.9 149.1 107.0 100.4
Consumer price index 2015 118.2 130.1 146.1 111.8 108.7 (2010=100) 2016 122.4 138.4 157.4 112.6 110.1
Broad money Percent changes from End of 2015 2.6 10.3 16.2 4.1 5.8 the previous year (%) End of 2016 0.7 6.1 17.8 7.4 7.1
Exports, FOB (US$ billion) 2016 203.5 81.7 143.8 439.3 1,504.6Imports, CIF (US$ billion) 2016 182.3 76.5 142.8 407.2 1,453.8
Gold and foreign End of 2016 535,853 42,755 92,624 123,970 118,594 exchange reserves (US$ million)
Foreign exchange rates U.S. (national currency per US$) dollars End of year 2016 3.7500 13.6845 3.5224 0.8129 1.0000 Period average 2016 3.7500 14.7096 3.0201 0.7406 1.0000
poundssterling
a) Excluding age 15.Source: Statistics Bureau, MIC; Cabinet Office; Ministry of Health, Labour and Welfare; Bank of Japan;United Nations; International Labour Organization; International Monetary Fund; EUROSTAT.
Riyals Rand Liras

APPENDICES
197
Appendix 3Foreign Exchange Rates 1)
(Yen per U.S. dollar)Year Average End of year1990 144.88 135.401995 94.06 102.912000 107.77 114.902001 121.53 131.472002 125.31 119.372003 115.93 106.972004 108.18 103.782005 110.16 117.482006 116.31 118.922007 117.76 113.122008 103.37 90.282009 93.54 92.132010 87.78 81.512011 79.81 77.572012 79.81 86.322013 97.63 105.372014 105.85 119.802015 121.03 120.422016 108.84 117.11
1) Midpoint rate in the interbank foreign exchange market in Tokyo.Source: Bank of Japan.
Appendix 4Conversion Factors
Metric units British Imperial and U.S. equivalents
Length: 1 centimeter (cm) ............................ 0.39370 inches3.28084 feet1.09361 yards
1 kilometer (km) .............................. 0.62139 miles10.76392 square feet
1.19599 square yards1 square kilometer (km2) ................. 0.38610 square miles
10,000 square meters (m2)
35.31073 cubic feet1.30795 cubic yards
35.27337 ounces2.20459 pounds0.98416 long tons1.10229 short tons0.87951 imp. Quarts1.05669 U.S. liq. Quarts
Temperature: centigrade (℃) ................................ 5 / 9 ×(Fahrenheit - 32)
2.47103 acres
Capacity:
1 square meter (m2) .........................
1 cubic meter (m3) ...........................
1 kilogram (kg) ................................
1 ton (t) ............................................
1 liter (L) .........................................
Volume:
Weight:
1 meter (m) ......................................
1 hectare (ha) .........
Area:


![[CM2015] Chapter 8 - Chemistry Transport Model](https://img.pdfslide.tips/doc/110x75/5889cd711a28abca448b703f/cm2015-chapter-8-chemistry-transport-model.jpg)