1
Characteristics of Heavy Ice Precipitation in Extratropical Cyclones Observed by GPM/DPR Shizuka Akiyama, Shoichi Shige, Munehisa K. Yamamoto (Kyoto Univ.), Toshio Iguchi (NICT), Mike Bauer (Columbia Univ.) Summary Iguchi et al. (2018) introduced flags of HeavyIcePrecip(HIP) based on the analysis for hail storms and heavy snow cases using measured Dual frequency ratio (DFRm) from DPR products. In winter, HIPs often occur over extratropical ocean, where cyclones play the important role of preipitation. This study revealed that: HIP’s distribution in midlatitude were associated with cyclone centers and were devided from the centers to the polar part and equator-west part. In a case study of a cyclone, we found HIP band along with bent-back front and scattered HIP behind its cold front. For HIP band, the average density of particles decreases from storm top toward the surface probably due to aggregation of snowflakes in the lower layer. For scattered HIP, the value of DFRm and measured radar reflectivity of Ku-Band Zm Ku near the storm top is relatively high. This may be caused by updrafts raising a large size of snowflakes. Statistical analysis for HIP bands show that the HIP band of the case study is not a special case, but there are some HIP bands with the same feature of aggregate as ice particles falling. 1. Cyclone-centered Compositing Analysis of HeavyIcePrecip (HIP) Global HIP Frequency (color, Iguchi et al., 2018) These figures are frequencies of HIP (color) over 100km×100km boxes relative to cyclone centers indicated by (0, 0). HIP often occurs poleward of the centers far within 500km and also spread from the centers to equator-west part. HIP is more often seen with cyclones over NAO. HIP Band Scattered HIP HIP (red), precipitation area (cyan), observed area (yellow) and T 850hPa (light green contours) are superimposed over infrared satellite image of a extratropical cyclone. 2. Case Study: HIP in a Extratropical Cyclone March 3 2015 (Orbit number: 005738) Cf. Hail Storm (Sep 5 2015 Iguchi et al. 2018) [ −3 ] Scattered HIP HIP Band Hail Storm HIP Band Scattered HIP Average height (color), PDF(contour) HIP Band 3. Distribution in Zm(Ku)-DFRm plane for HIP Bands CFADs of Zm(Ku) CFADs of DFRm Data GPM.DPR.Level 2 version 5 We used KaPR’s measured radar reflectivity by interpolating high sensitivity beams of KaPR in onto inner swath grid of KuNS. MCMS (Map of Climatology of Mid-latitude Storminess, Bauer et al. 2016) This data contain the location of cyclone centers based on ERA-interim (provided by M. Bauer) Analysis period is from April 2014 to March 2016. We averaged HIP distribution relative to cyclone centers over North Atlantic Ocean (NAO; yellow box), North Pacific Ocean (NPO; blue box), ocean in southern hemisphere (SH; green box), respectively. a. Horizontal structure Two different horizontal types of HIP are seen in the case such as following; This has the wide of 15~40 km along the bent-back front direction. These HIP are located behind the cold front. b. Particle density structure Liao and Meneghini (2011) simulated Ze(Ku)-DFR relation for different values of average bulk density assuming that the sizes of snow before melting follow Gunn-Marshall distribution and those of rain follow Marshall-Palmer distribution. These theoretical curves are overplotted on following 2-dimensional probability density functions (PDFs) of Zm(Ku) and DFRm above -10layer over HIP pixels. The values are normalized by dividing by each maximum count number. Comparing the peaks of frequency and curves of isodensity on Zm(Ku)- DFRm plane, particle density is large in the order of HIP in hail storm, HIP band and scattered HIP. c. Vertical structure We defined and detected HIP Band in the way that we fitted ellipse to continuous HIP and examined if fitted ellipse’s major axis is longer than 23 pixels (the length of inner swath of DPR). To research the statistical feature of HIP band as mentioned above, we analysed cases with surface temperature lower than 0among them (72 cases). These figures resulted from the statistical analysis for HIP band under cold situation. Particle density decreases as the altitude decreasing. Over HIP bands under cold environment, pure ice particles near the top of precipitation may aggregate each other as they fall. Following Contoured Frequency by Altitude Distributions (CFADs) and average height on Zm(Ku)-DFRm plane on which the PDF overplotted indicate that: Particle density decreases from the relatively high altitude toward the surface Relatively high value of DFRm and Zm(Ku) near the storm top Average height (color, plotted if PDF>5%), PDF(contour) PDF(contour)

Characteristics of Heavy Ice Precipitation in

  • Upload
    others

  • View
    3

  • Download
    0

Embed Size (px)

Citation preview

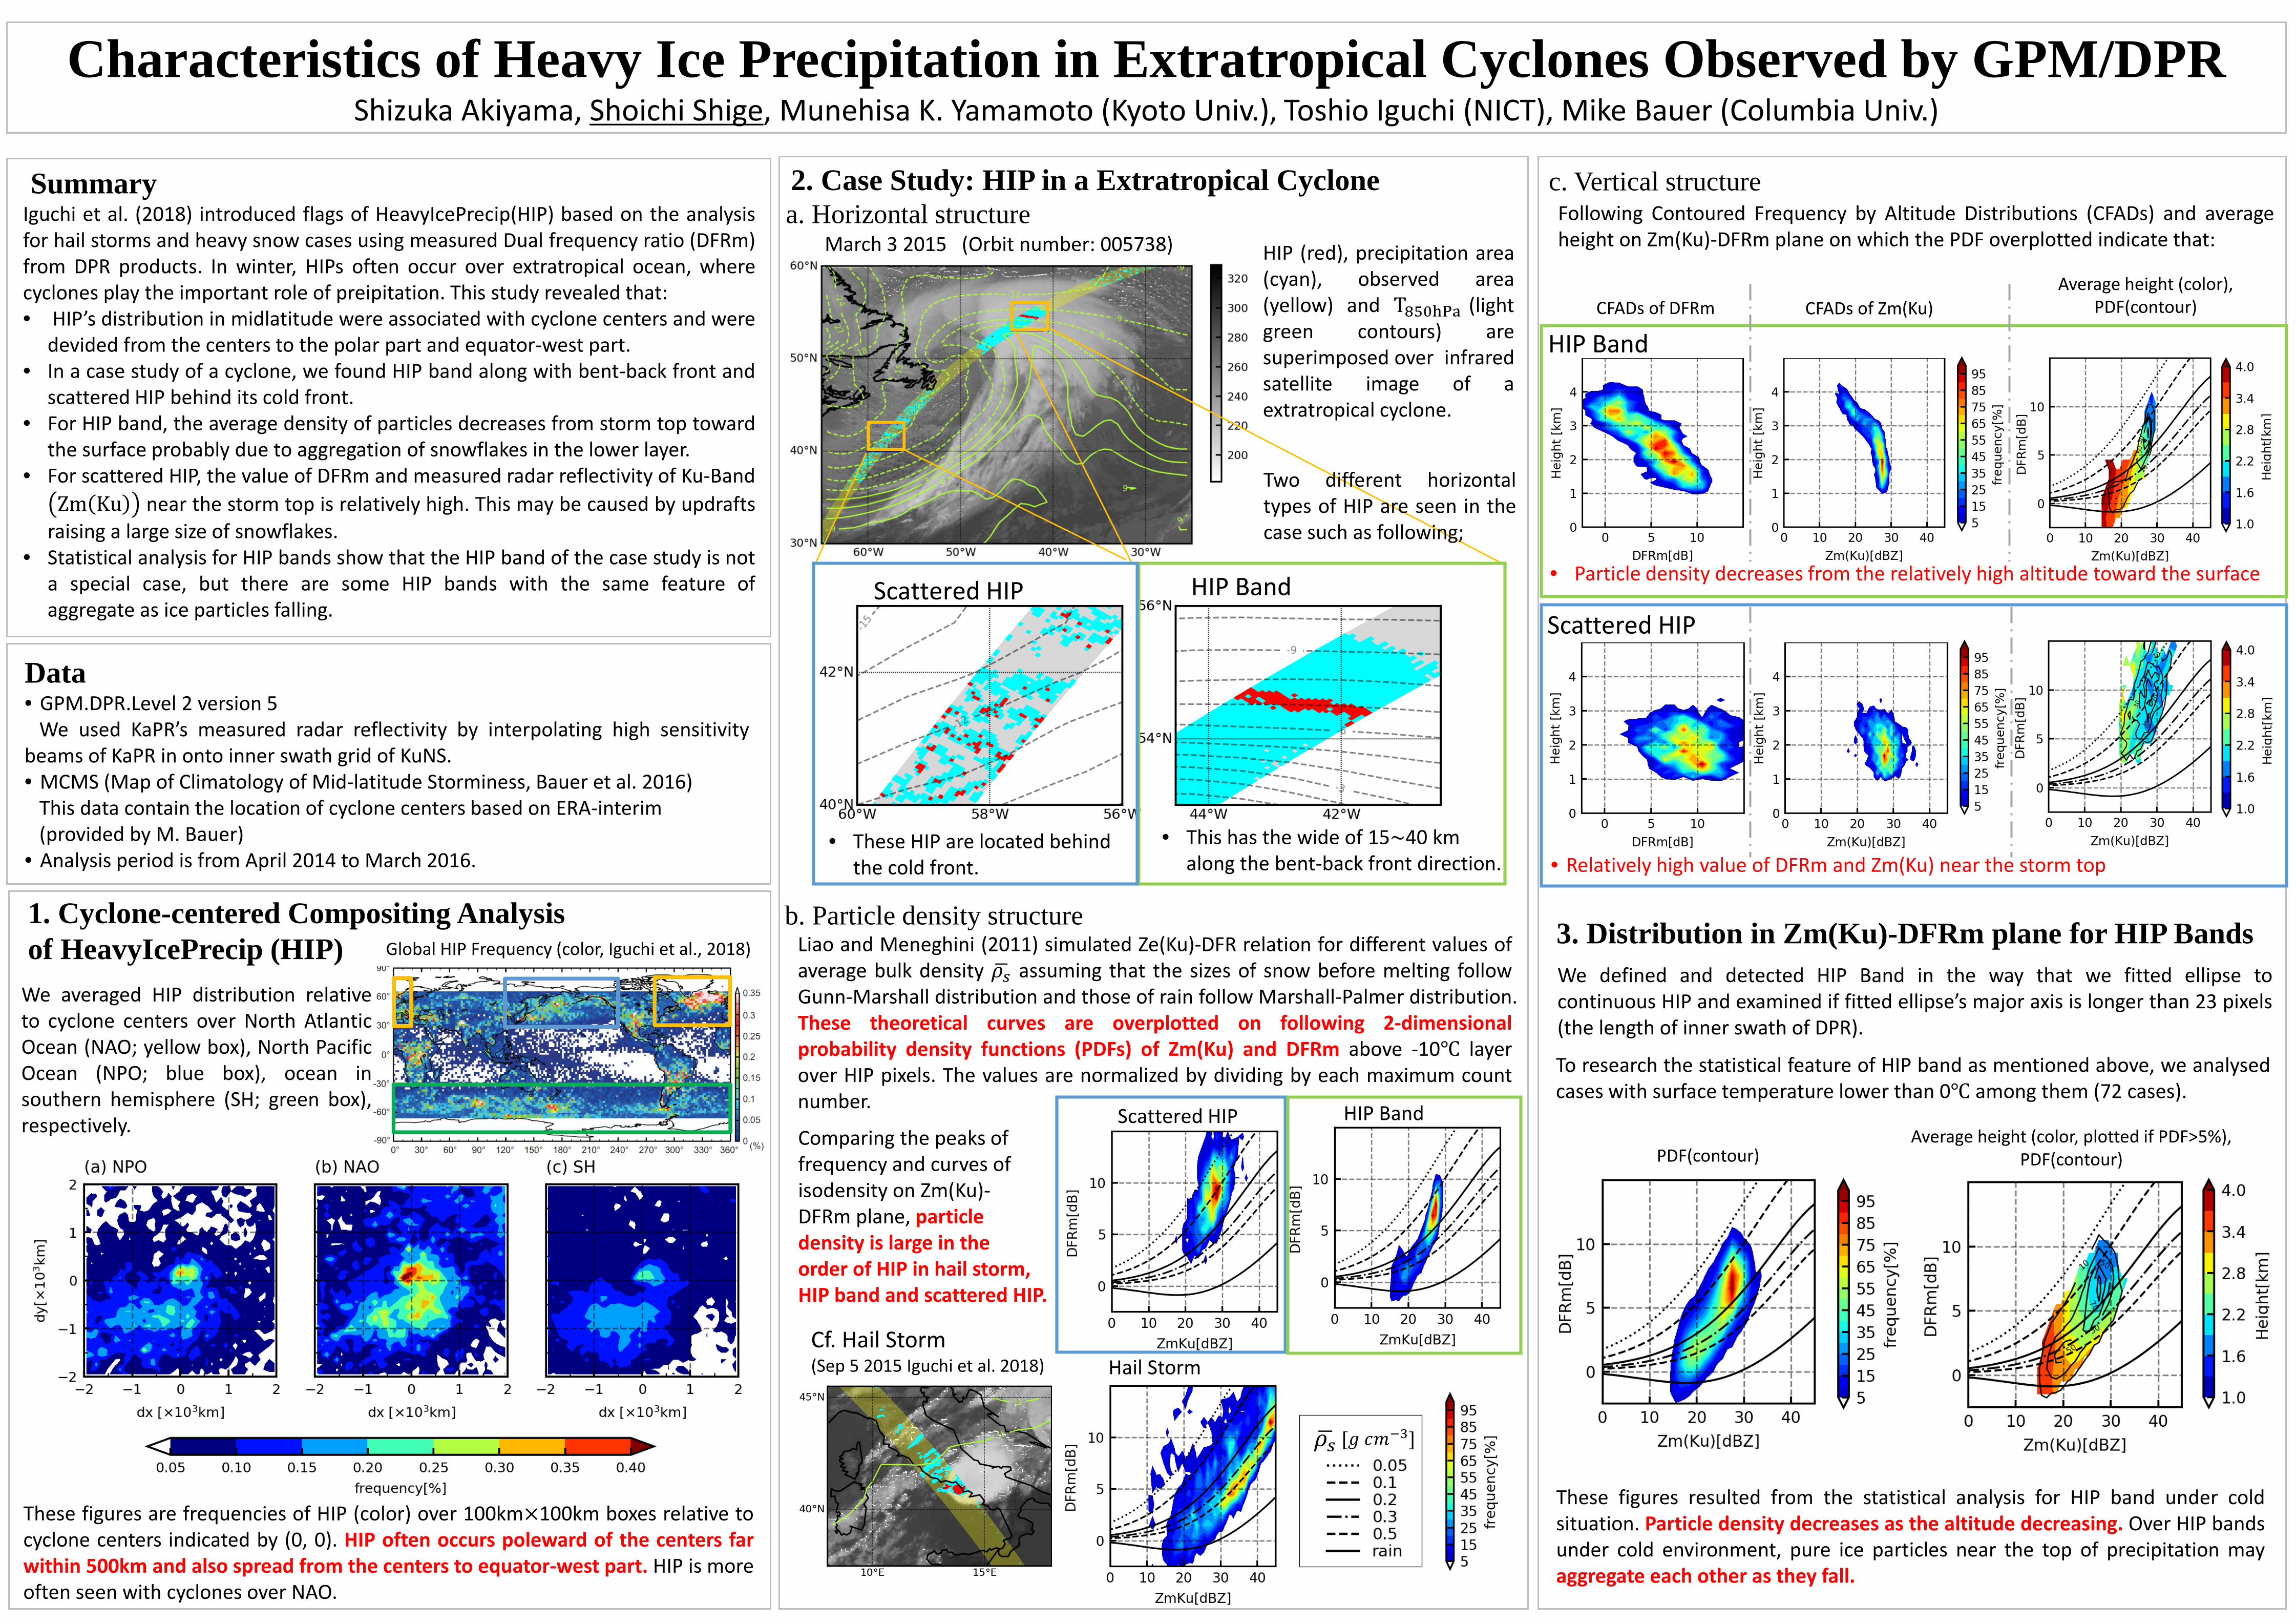
Characteristics of Heavy Ice Precipitation in Extratropical Cyclones Observed by GPM/DPRShizuka Akiyama, Shoichi Shige, Munehisa K. Yamamoto (Kyoto Univ.), Toshio Iguchi (NICT), Mike Bauer (Columbia Univ.)

SummaryIguchi et al. (2018) introduced flags of HeavyIcePrecip(HIP) based on the analysisfor hail storms and heavy snow cases using measured Dual frequency ratio (DFRm)from DPR products. In winter, HIPs often occur over extratropical ocean, wherecyclones play the important role of preipitation. This study revealed that:• HIP’s distribution in midlatitude were associated with cyclone centers and were

devided from the centers to the polar part and equator-west part.• In a case study of a cyclone, we found HIP band along with bent-back front and

scattered HIP behind its cold front.• For HIP band, the average density of particles decreases from storm top toward

the surface probably due to aggregation of snowflakes in the lower layer.• For scattered HIP, the value of DFRm and measured radar reflectivity of Ku-Band

Zm Ku near the storm top is relatively high. This may be caused by updraftsraising a large size of snowflakes.

• Statistical analysis for HIP bands show that the HIP band of the case study is nota special case, but there are some HIP bands with the same feature ofaggregate as ice particles falling.

1. Cyclone-centered Compositing Analysis of HeavyIcePrecip (HIP) Global HIP Frequency (color, Iguchi et al., 2018)

These figures are frequencies of HIP (color) over 100km×100km boxes relative tocyclone centers indicated by (0, 0). HIP often occurs poleward of the centers farwithin 500km and also spread from the centers to equator-west part. HIP is moreoften seen with cyclones over NAO.

HIP BandScattered HIP

HIP (red), precipitation area(cyan), observed area(yellow) and T850hPa (lightgreen contours) aresuperimposed over infraredsatellite image of aextratropical cyclone.

2. Case Study: HIP in a Extratropical Cyclone

March 3 2015 (Orbit number: 005738)

Cf. Hail Storm (Sep 5 2015 Iguchi et al. 2018)

�𝜌𝜌𝑠𝑠 [𝑔𝑔 𝑐𝑐𝑚𝑚−3]

Scattered HIP HIP Band

Hail Storm

HIP Band

Scattered HIP

Average height (color), PDF(contour)

HIP Band

3. Distribution in Zm(Ku)-DFRm plane for HIP Bands

CFADs of Zm(Ku)CFADs of DFRm

Data• GPM.DPR.Level 2 version 5

We used KaPR’s measured radar reflectivity by interpolating high sensitivitybeams of KaPR in onto inner swath grid of KuNS.• MCMS (Map of Climatology of Mid-latitude Storminess, Bauer et al. 2016)

This data contain the location of cyclone centers based on ERA-interim(provided by M. Bauer)

• Analysis period is from April 2014 to March 2016.

We averaged HIP distribution relativeto cyclone centers over North AtlanticOcean (NAO; yellow box), North PacificOcean (NPO; blue box), ocean insouthern hemisphere (SH; green box),respectively.

a. Horizontal structure

Two different horizontaltypes of HIP are seen in thecase such as following;

• This has the wide of 15~40 km along the bent-back front direction.

• These HIP are located behind the cold front.

b. Particle density structureLiao and Meneghini (2011) simulated Ze(Ku)-DFR relation for different values ofaverage bulk density �𝜌𝜌𝑠𝑠 assuming that the sizes of snow before melting followGunn-Marshall distribution and those of rain follow Marshall-Palmer distribution.These theoretical curves are overplotted on following 2-dimensionalprobability density functions (PDFs) of Zm(Ku) and DFRm above -10℃ layerover HIP pixels. The values are normalized by dividing by each maximum countnumber.

Comparing the peaks of frequency and curves of isodensity on Zm(Ku)-DFRm plane, particle density is large in the order of HIP in hail storm, HIP band and scattered HIP.

c. Vertical structure

We defined and detected HIP Band in the way that we fitted ellipse tocontinuous HIP and examined if fitted ellipse’s major axis is longer than 23 pixels(the length of inner swath of DPR).

To research the statistical feature of HIP band as mentioned above, we analysedcases with surface temperature lower than 0℃ among them (72 cases).

These figures resulted from the statistical analysis for HIP band under coldsituation. Particle density decreases as the altitude decreasing. Over HIP bandsunder cold environment, pure ice particles near the top of precipitation mayaggregate each other as they fall.

Following Contoured Frequency by Altitude Distributions (CFADs) and averageheight on Zm(Ku)-DFRm plane on which the PDF overplotted indicate that:

• Particle density decreases from the relatively high altitude toward the surface

• Relatively high value of DFRm and Zm(Ku) near the storm top

Average height (color, plotted if PDF>5%), PDF(contour) PDF(contour)