Embed Size (px)
Citation preview

CHCANYS Data Warehouse: Center for Primary Care Informatics (CPCI)
NYS HIMSS Chapter ConferenceApril 23, 2014
Amy Grandov, Managing Director NYS‐HCCN, CHCANYSJeff Brandes, CEO, Azara Healthcare

Agenda
• CHCANYS’ CPCI Program Overview• CPCI Key Features• Beyond New York – Azara DRVS roadmap

CHCANYS CPCI Program Overview

About CHCANYS• Community Health Care Association of New York State
(CHCANYS) is the state’s Primary Care Association (PCA)• Mission to ensure that all New Yorkers have access to high
quality community‐based primary health care services • Serve all Federally Qualified Health Centers (FQHCs) across
the state; 61 member organizations operating over 500 sites
• Supports FQHCs through advocacy, policy leadership, education, programs and initiatives across broad functional areas, including Health IT and Quality Improvement
4

• Federally designated and regulated primary care programs located in all 50 states and US territories
• Serving 1.6 million patients, 7 million + visits; comprehensive model of care; high performing₋ 23% uninsured; 52% covered by Medicaid or CHPlus₋ 70% at or below 100% Federal Poverty Line₋ 115,000 homeless or migrant/seasonal workers; 100,000
over 65 yrs₋ 3/4ths are racial and ethnic minorities₋ 1 in 4 best served in language other than English
5
About FQHCs in NYS ‐ 2013

• Federal and State health reform require expanded primary care capacity which addresses population health goals in fully integrated settings• In New York State, FQHCs are expected to double capacity to serve
nearly 3 million New Yorkers by 2015
• New York’s FQHCs have one of the highest adoption rates for EHRs in the country (97%) – but technology is not a guarantee that quality outcomes will improve
• New models of care delivery and payment (e.g., accountable care organizations/ACOs)
Healthcare Landscape
6

• CHCANYS has developed the New York State Center for Primary Care Informatics (CPCI) – Priority goal in CHCANYS Strategic Plan– Supports improvements in quality, patient and population health outcomes
– Supports growth & success in a changing environment
Center for Primary Care Informatics
7
CPCI: Three Components1. A statewide reporting and analytics solution for NY’s FQHCs
– Collects and normalizes data from multiple sources to create an integrated database for enhanced analysis & reporting.
– Provides actionable data and valuable reporting at individual health centers.
2. Program of technical assistance delivered by CHCANYS staff ‐ Supported through several high profile partnerships‐ Federal, state and private funding
3. Planning toolkit with centralized access to geographically‐relevant data
8

Phase 1 Phase 2Practice managementHealth records (EHR)
PayerFederal (e.g., census, labor)State (e.g., SPARCS)
Analysis and reporting for:Quality Improvement Care Management ToolsPatient Centered Medical Home (PCMH)Health HomesMeaningful UseUDS (Uniform Data System)
Analysis & reporting for:Pay‐for‐Performance (P4P)Partnerships, New Care ModelsPlanning for growthFund developmentAdvocacyDemonstration of VALUE delivered by the FQHC model ‐ the Triple Aim: higher quality, better outcomes, lower cost
Scope
Benefits
9

CPCI TechnologyPre‐built set of 50+ “one click” reportsMandated & Regulatory (UDS, Meaningful Use, Quality Measures)Grants (Cancer and Preventative Health Screening)PCMH SupportChronic Disease ManagementUser driven dashboards and charting
Wide range of data views Enterprise LevelHealth CenterIndividual Care ProviderPatient Level detail
SaaS Model (Software as a Service)Browser based User Interface, No on‐premise infrastructure Regular updates keep reporting criteria current and evolve to support changing needs
Site Comparisons
Individual Site
Provider Benchmarks
Actionable Patient Detail
10

BenefitsEasy and Efficient
– Free up analyst time for analysis vs. data collection
Quality Improvement Tools & Reports–Benchmark & collaborate with peers– Identify best practices & areas of opportunity
11

BenefitsTools to Improve Population Health
–Patient Registries
Care Coordination and Care Management–Visit planning tools to make care team more efficient & support providers
12
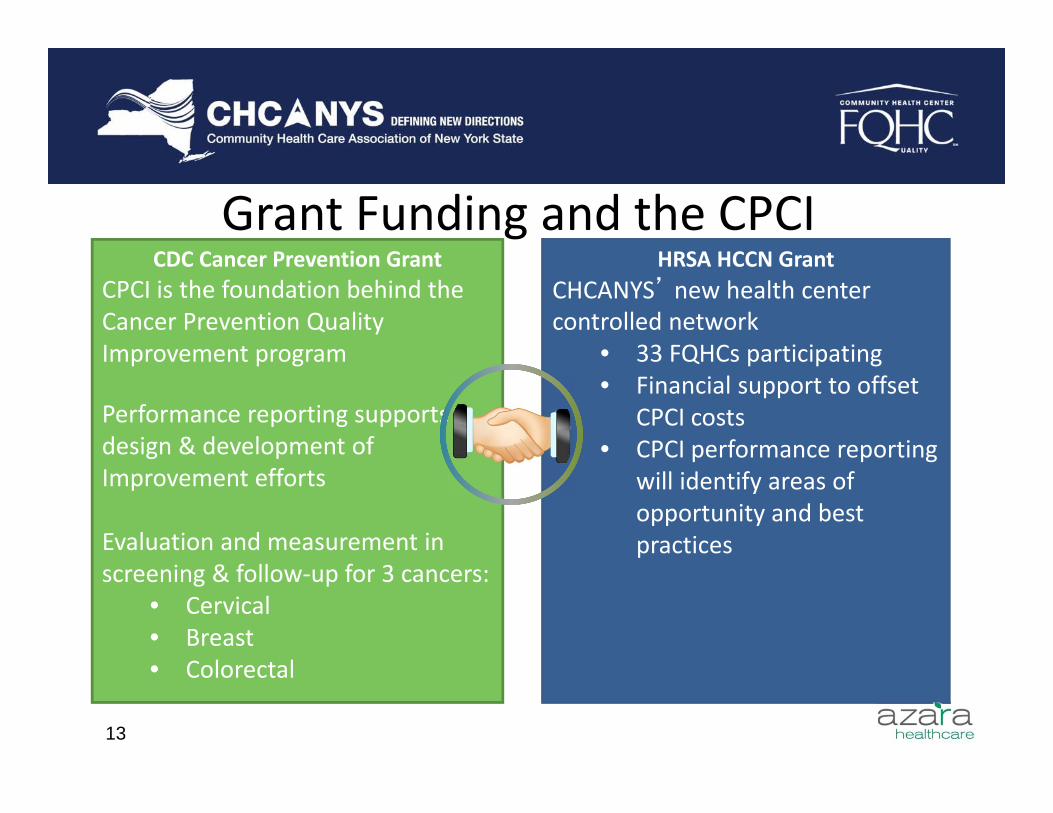
Grant Funding and the CPCICDC Cancer Prevention Grant
CPCI is the foundation behind the Cancer Prevention Quality Improvement program
Performance reporting supports design & development of Improvement efforts
Evaluation and measurement in screening & follow‐up for 3 cancers:
• Cervical• Breast • Colorectal
HRSA HCCN GrantCHCANYS’ new health center controlled network
• 33 FQHCs participating• Financial support to offset
CPCI costs• CPCI performance reporting
will identify areas of opportunity and best practices
13

NYS Cancer Screening Registry of the CPCI:Project Overview
• A collaborative demonstration project of the NYS Department of Health/Community Health Care Association of New York State/IPRO
• NYS DOH one of only two health departments in the nation to receive this five‐year grant
• Working in collaboration with NYSDOH and IPRO to develop a cancer screening registry within CPCI
• Implementing a large‐scale, innovative demonstration project to contribute to building organized cancer screening efforts that impact population level cancer screening rates.
• Funding for connections to CPCI
14
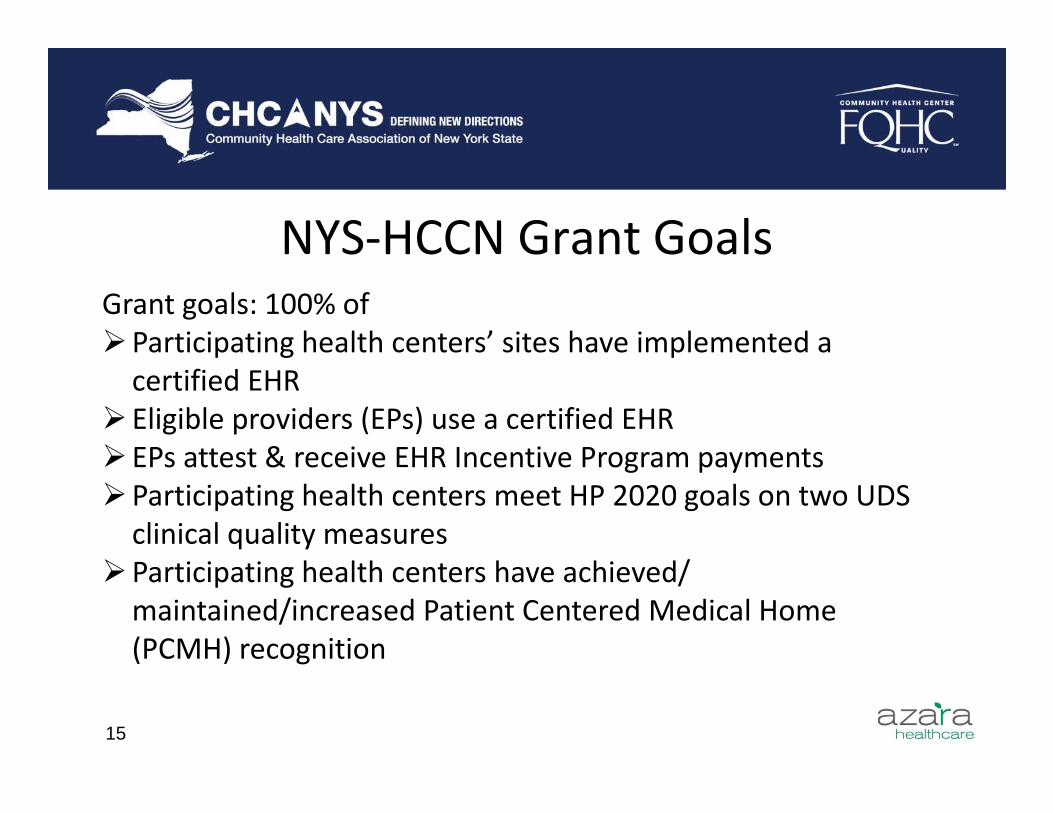
NYS‐HCCN Grant GoalsGrant goals: 100% ofParticipating health centers’ sites have implemented a certified EHREligible providers (EPs) use a certified EHREPs attest & receive EHR Incentive Program paymentsParticipating health centers meet HP 2020 goals on two UDS clinical quality measuresParticipating health centers have achieved/ maintained/increased Patient Centered Medical Home (PCMH) recognition
15
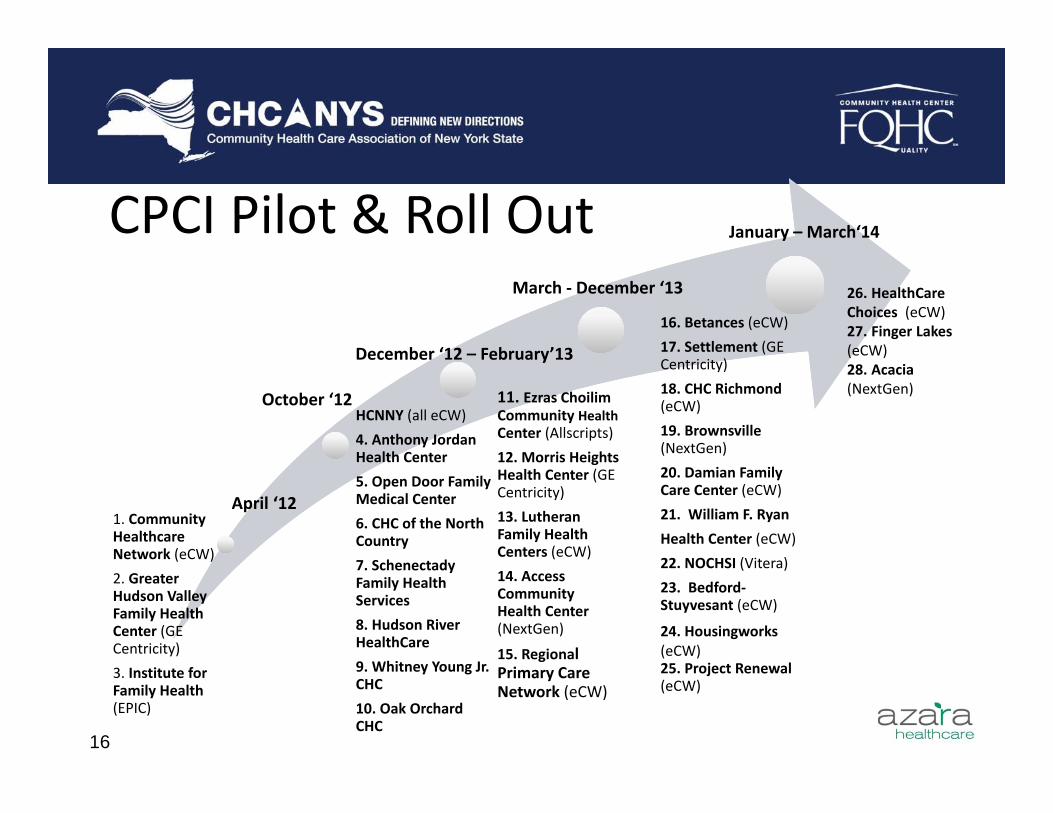
1. Community Healthcare Network (eCW)2. Greater Hudson Valley Family Health Center (GE Centricity)3. Institute for Family Health (EPIC)
HCNNY (all eCW) 4. Anthony Jordan Health Center5. Open Door Family Medical Center6. CHC of the North Country7. Schenectady Family Health Services8. Hudson River HealthCare 9. Whitney Young Jr. CHC10. Oak Orchard CHC
11. Ezras Choilim Community HealthCenter (Allscripts) 12. Morris Heights Health Center (GE Centricity)13. Lutheran Family Health Centers (eCW)14. Access Community Health Center (NextGen)
15. Regional Primary Care Network (eCW)
16. Betances (eCW) 17. Settlement (GE Centricity) 18. CHC Richmond (eCW)19. Brownsville (NextGen)20. Damian Family Care Center (eCW)21. William F. Ryan Health Center (eCW)22. NOCHSI (Vitera)23. Bedford‐Stuyvesant (eCW)
24. Housingworks(eCW)25. Project Renewal (eCW)
CPCI Pilot & Roll Out
April ‘12
October ‘12
December ‘12 – February’13
March ‐ December ‘13
January – March‘14
26. HealthCare Choices (eCW)27. Finger Lakes (eCW) 28. Acacia (NextGen)
16
17
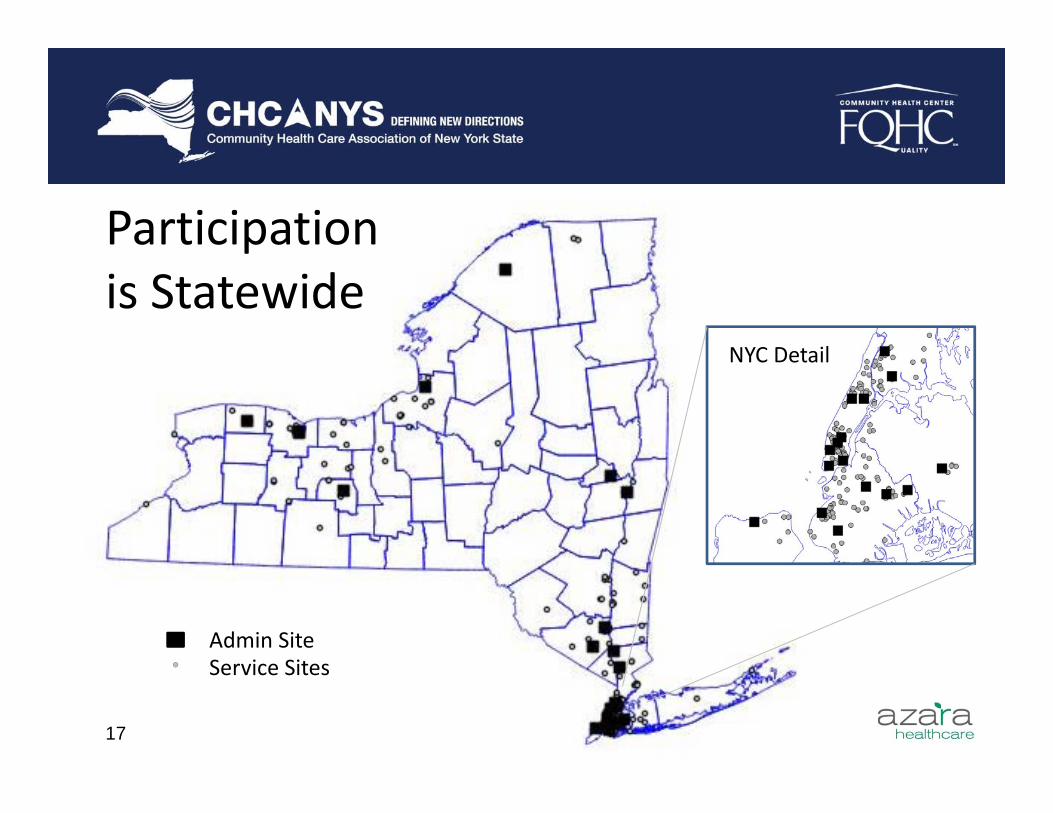
Participationis Statewide
NYC Detail
Admin SiteService Sites

Architectural Overview
18
• Data from disparate EHR and EPM systems refreshed daily
• Extensive data quality analysis
• Data unified in EHR‐agnostic Data Warehouse for apples to apples comparison
• Simple, web‐based reporting interface from any major browser
• User role differentiation and data blinding
• Graphical and text based depictions of datasets
• External data links geographic characteristics to patients & providers
18

Challenge: Data quality
19
This measure doesn’t seem
right…”
Data missing in EHR
Data not captured in structured fields in EHR
Mapping incomplete or not updated Measure
specifications vary between
reports
Connectivity issues

Response: Data Quality Initiative• CHCANYS launched a Data Quality Initiative to explain and
improve clinical data quality for all CHCANYS health centers connected or preparing to connect to the CPCI– “Data Validation 101” curriculum & webinar– Data Quality Collaborative
• Data Validation process an unexpected benefit of connecting to CPCI– Quality of Documentation = Quality of Clinical Care
20

CPCI Key Features

Types of Reporting
DA
SH
BO
AR
DS
ME
AS
UR
EA
NA
LYZE
R
RE
GIS
TRY
RE
PO
RTS
VIS
ITP
LAN
NIN
G
Data represents a fictitious environment of 4 health centers. No PHI is being revealed.22

CPCI Home Screen
Data represents a fictitious environment of 4 health centers. No PHI is being revealed.
23
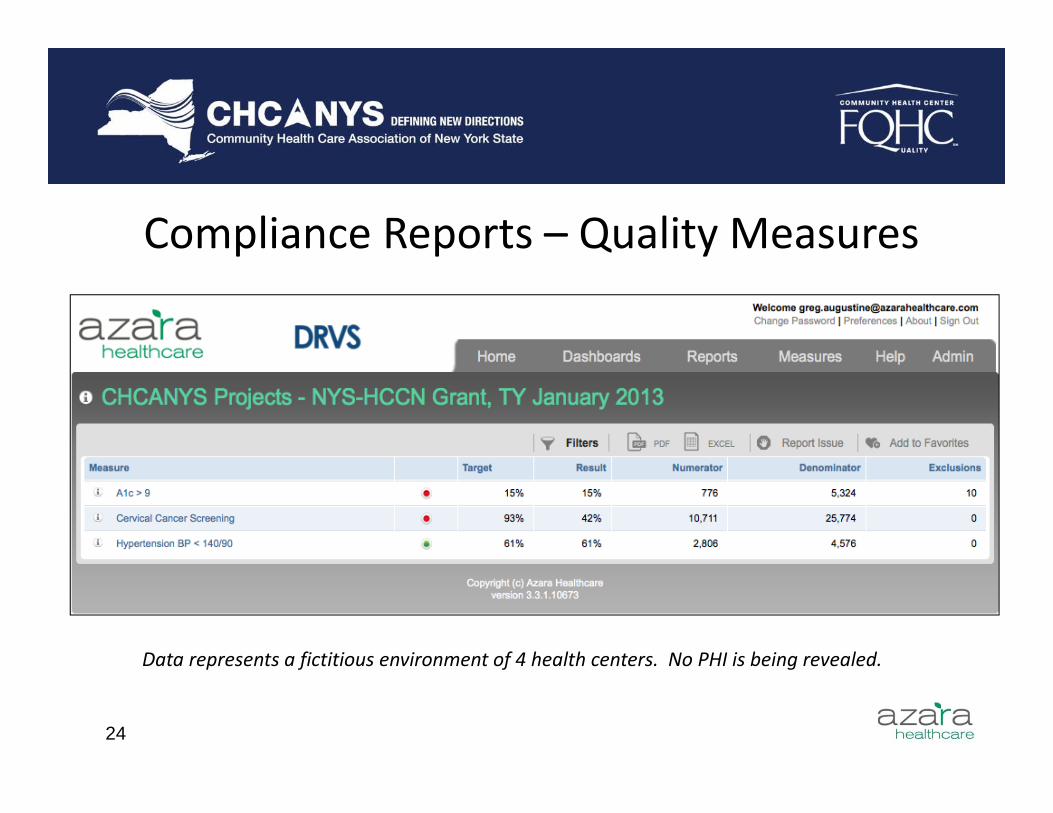
Compliance Reports – Quality Measures
Data represents a fictitious environment of 4 health centers. No PHI is being revealed.
24

Compliance Reports ‐Meaningful Use
Data represents a fictitious environment of 4 health centers. No PHI is being revealed.
25

Measure Analyzer• View details of any measure including report parameters, measure
specification, provider‐level detail, patient detail and more• Launch the Measure Analyzer by selecting the measure name or selecting
from the Measures menu
26
Measures
26

27
Drill down in OWN data only
Green line = target
Measure Analyzer
Blue line = results
Benchmark against other centers
Data represents a fictitious environment of 4 health centers. No PHI is being revealed.

Patient‐Level Detail
• To further understand a provider’s performance on a particular measure, select the Detail List button from the Measure Analyzer menu to drill into the patient level details
28
Display patient‐level detail for this providerDisplay patient‐level detail for this provider
28

Patient‐Level Detail Spot‐Check• Spot check about 10 patients against data in EHR
• 5 patients in the numerator ( ‘1’ in the Numerator column)• 5 patients in the denominator only (‘0’ in the Numerator column)• Consider exclusions if applicable (‘1’ in the Exclusion column)
• Export to Excel for further analysis
29
Export list to Excel
Page through results
Hover over a name to display patient
details
29

Dashboards
30
Data represents a fictitious environment of 4 health centers. No PHI is being revealed.

Registry Reports.
31
Data represents a fictitious environment of 4 health centers. No PHI is being revealed.
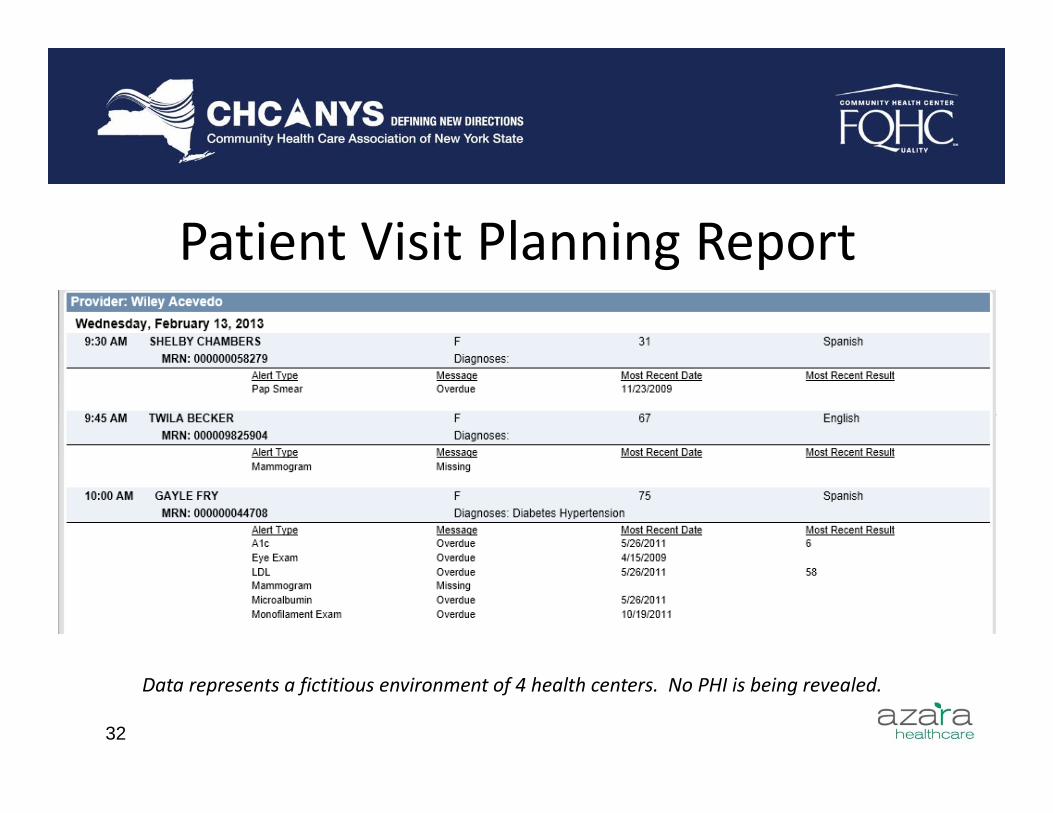
Patient Visit Planning Report
32
Data represents a fictitious environment of 4 health centers. No PHI is being revealed.

Provider Report Card
33
Data represents a fictitious environment of 4 health centers. No PHI is being revealed.

Azara DRVS Beyond New York

Azara Healthcare Our History
– Large investments via formal partnership with Mass League – Specialty in large scale data reporting & analytics
Customers and Patients– Data on 9 million+ patients– Nearly 100 CHC’s live
Key Relationships– 4 Primary Care Associations– 6 Networks– 12 states
Focus on Community Health– Set up specifically to deliver DRVS to the Community Health marketplace
using a Software as a Service (SaaS) model
35
420
4142342
41
428
41
47
35
42
41 41
35

Our PerspectiveThe future leaders in healthcare will be successful in aggregating and organizing clinical, operation and financial data to quantitatively demonstrate the value and
efficacy of their care.
• The depth, quality and accessibility of your data is critical to your success• EHR will always be the system of record
36

Driving Performance at the CenterAppetite for Data ‐ Shift perspective from data creation for external requirements to regularinternal consumption
37

DRVS
• Compliance• Quality • Visit Planning• Efficiency
PatientExperience
• P4P• Cost/Risk• Provider Continuity
• Transition of Care
• Risk Stratification
DRVSReporting &Analytics
Clinical, Financial and Operational Data from Health
Center EHR
Inpatient and Emergency ADT
Data
Claims Data from Payers
Patient Survey Data
Azara’s Vision for DRVS
38
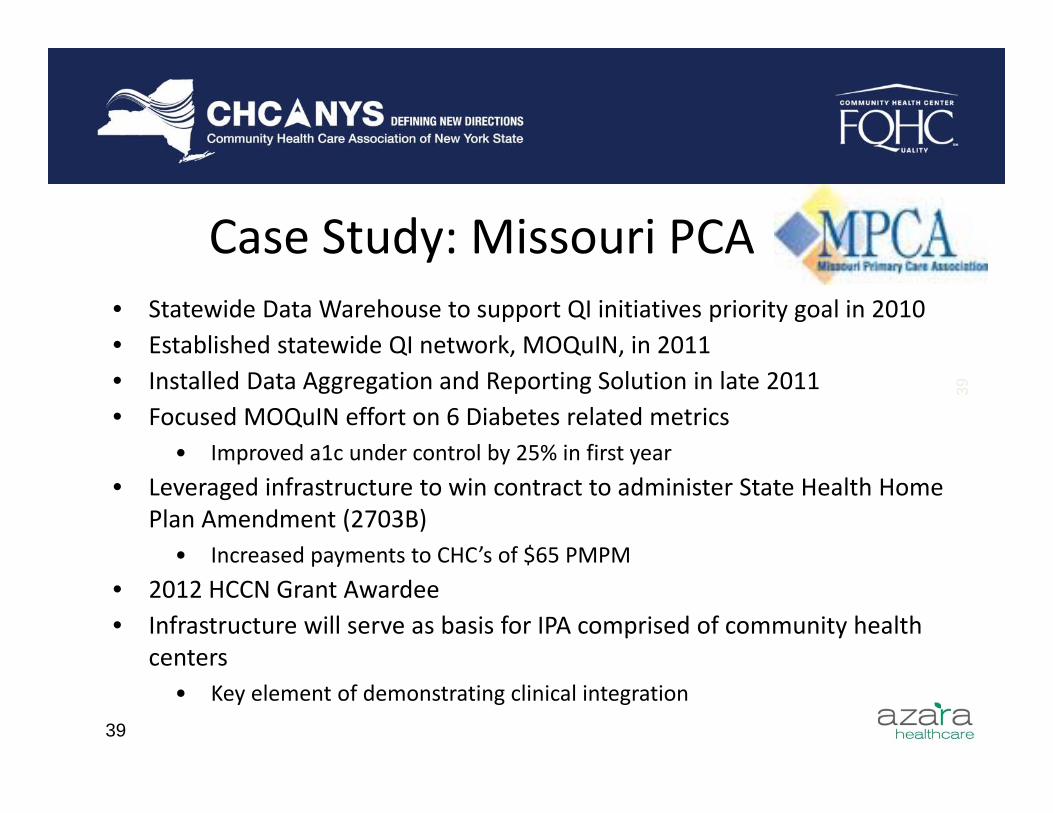
• Statewide Data Warehouse to support QI initiatives priority goal in 2010 • Established statewide QI network, MOQuIN, in 2011• Installed Data Aggregation and Reporting Solution in late 2011• Focused MOQuIN effort on 6 Diabetes related metrics
• Improved a1c under control by 25% in first year• Leveraged infrastructure to win contract to administer State Health Home
Plan Amendment (2703B)• Increased payments to CHC’s of $65 PMPM
• 2012 HCCN Grant Awardee• Infrastructure will serve as basis for IPA comprised of community health
centers• Key element of demonstrating clinical integration
Case Study: Missouri PCA
39
39

Case Study: Indian Health Center• Strategic Goals for Data Usage
• PATIENT CENTERED Health Care• Manage Population Health• Manage Patient Health• Identify Access Issues• Identify Disparity Issues• Regional, State & Federal Reporting • Quality Management
• Meaningful Results in a short time across a variety of areas• Chronic Disease Management
• Diabetes Foot Exams increased 19% over 120 day period
• Preventative Cancer Screenings increased 7‐15%• Providers teams lagging the average were identified and assisted
40

Leveraging the Platform
• Immunization Registry• MA Payment Reform CQI Reporting• Integrating Acute Care Data• Centralized Countywide Reporting
41


Questions or Further InformationCHCANYS Health IT ProgramLisa Perry, Senior VP Quality and Technology Initiatives
[email protected] Grandov, Managing Directory NYS‐HCCN [email protected] website: www.chcanys.org
Azara HealthcareJeff Brandes, CEO Azara Healthcare [email protected] website: www.azarahealthcare.com
43