Embed Size (px)
Citation preview
First Quarter 2016Fixed Income Investor Review
April 21, 2016
Citi | Fixed Income Investor Relations
John GerspachChief Financial Officer
James von MoltkeTreasurer

2
Agenda
1Q’16 Results• $3.5B of net income in a challenging environment• 60% efficiency ratio, 0.79% ROA and 7.3% RoTCE(1)
• Utilized approximately $1.6B of DTA
Balance Sheet
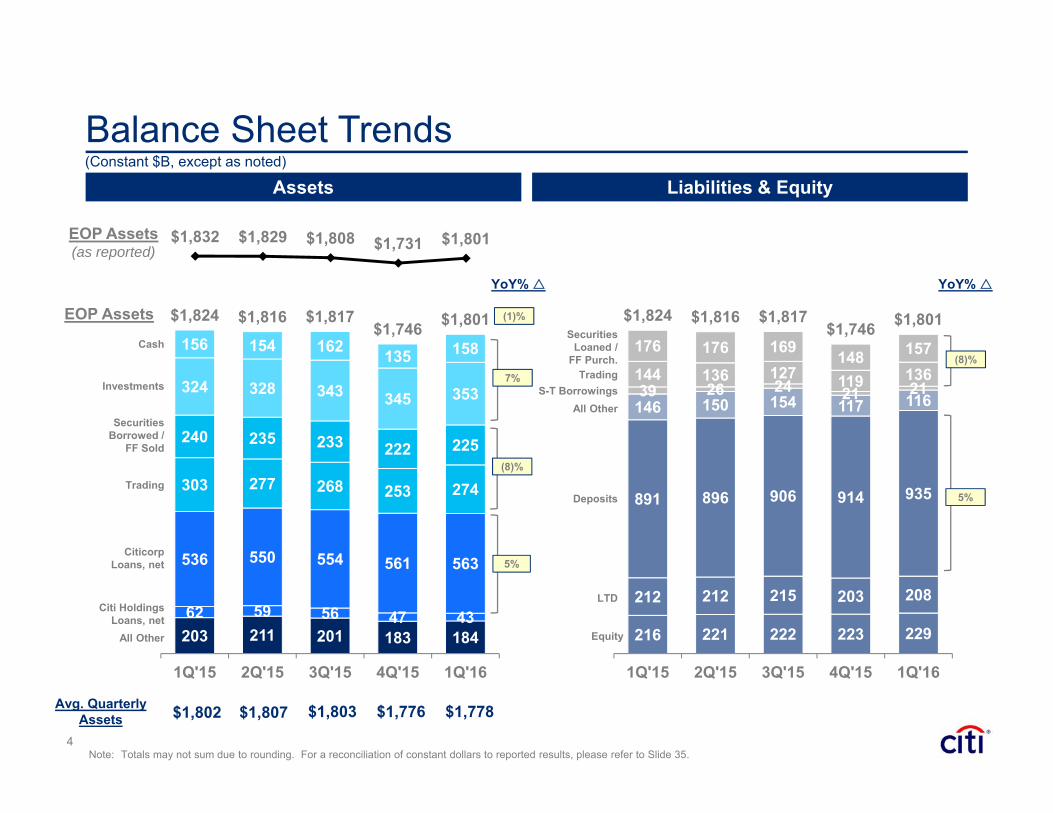
• $1,801B of GAAP assets at 1Q’16• Net interest margin of 2.92% for 1Q’16• Credit quality broadly stable – year-over-year increase in credit costs
primarily driven by energy
Funding• $935B of deposits at 1Q’16• Long-term debt issuance and redemptions• Updated TLAC estimates
Regulatory Metrics(2)• 12.3% Common Equity Tier 1 (CET1) Capital Ratio• 7.4% Supplementary Leverage Ratio (SLR)• 120% Liquidity Coverage Ratio (LCR)
Note: (1) Return on Tangible Common Equity (RoTCE) is a non-GAAP financial measure. For additional information, please refer to Slides 33 and 34. (2) Preliminary. CET1 Capital ratio and SLR, which reflect full implementation of the U.S. Basel III rules, are non-GAAP financial measures. For additional information, please
refer to Slides 32 and 33.
1Q'16 4Q'15 QoQ % 1Q'15 YoY %
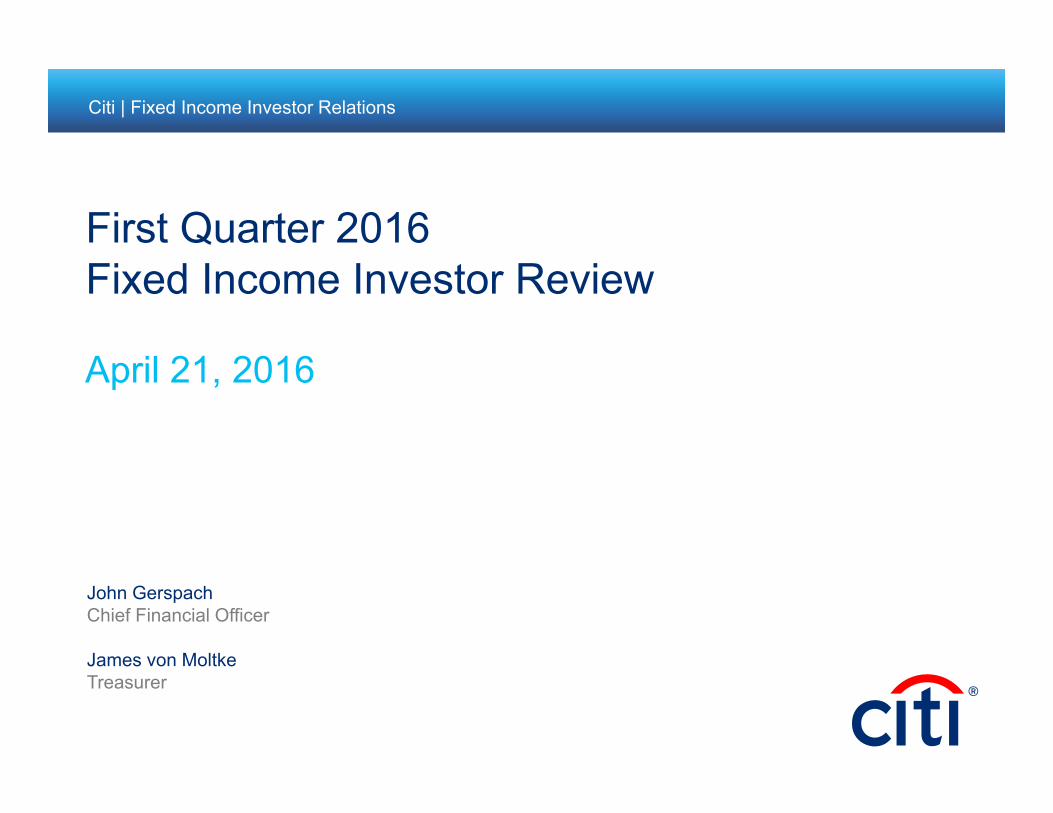
Net Interest Revenue $11,227 $11,463 (2)% $11,572 (3)%Net Interest Margin 2.92% 2.92% 2.92%
Non-Interest Revenue 6,328 7,174 (12)% 8,237 (23)%Revenues 17,555 18,637 (6)% 19,809 (11)%
Core Operating 9,867 10,409 (5)% 10,481 (6)%Legal & Repositioning 656 725 (9)% 403 63%
Operating Expenses 10,523 11,134 (5)% 10,884 (3)%
Cost of Credit 2,045 2,514 (19)% 1,915 7%
EBT 4,987 4,989 (0)% 7,010 (29)%
Net Income $3,501 $3,449 2% $4,817 (27)%Return on Assets 0.79% 0.77% 1.05%Return on Tangible Common Equity 7.3% 7.1% 11.0%
Diluted EPS $1.10 $1.06 4% $1.52 (28)%
EOP Assets (Constant $B) $1,801 $1,746 3% $1,824 (1)%EOP Loans (Constant $B) 619 621 (0)% 613 1%EOP Deposits (Constant $B) 935 914 2% 891 5%
3
Citigroup – Summary Financial Results(1) ($MM, except EPS and as otherwise noted)
Note: Totals may not sum due to rounding. EBT: Earnings before tax. (1) Results exclude CVA / DVA in 4Q’15 and 1Q’15. 4Q’15 and 1Q’15 results as adjusted are non-GAAP financial measures. Please refer to Slide 34 for additional information
and a reconciliation of this information to reported results. (2) For additional information on this measure, please refer to Slides 33 and 34.(3) Constant dollar excludes the impact of foreign exchange translation into U.S. dollars for reporting purposes. Constant dollar basis is a non-GAAP financial measure. For a
reconciliation of constant dollars to reported results, please refer to Slide 35.
(2)
(3)
(3)
(3)
4
203 211 201 183 18462 59 56 47 43
536 550 554 561 563
303 277 268 253 274
240 235 233 222 225
324 328 343 345 353
156 154 162 135 158
$1,824 $1,816 $1,817$1,746 $1,801
1Q'15 2Q'15 3Q'15 4Q'15 1Q'16
$1,832 $1,829 $1,808 $1,731 $1,801
216 221 222 223 229
212 212 215 203 208
891 896 906 914 935
146 150 154 117 11639 26 24 21 21144 136 127 119 136
176 176 169 148 157
$1,824 $1,816 $1,817$1,746 $1,801
1Q'15 2Q'15 3Q'15 4Q'15 1Q'16
YoY%
Balance Sheet Trends
EOP Assets
Liabilities & Equity
Cash
Investments
Trading
Citicorp Loans, net
All Other
Securities Borrowed /
FF Sold
Securities Loaned /
FF Purch.Trading
Deposits
LTD
Equity
S-T BorrowingsAll Other
Citi HoldingsLoans, net
EOP Assets(as reported)
Note: Totals may not sum due to rounding. For a reconciliation of constant dollars to reported results, please refer to Slide 35.
(Constant $B, except as noted)
5%
(1)%
YoY%
Avg. QuarterlyAssets $1,802 $1,807 $1,803 $1,776 $1,778
Assets
7%
5%
(8)%
(8)%
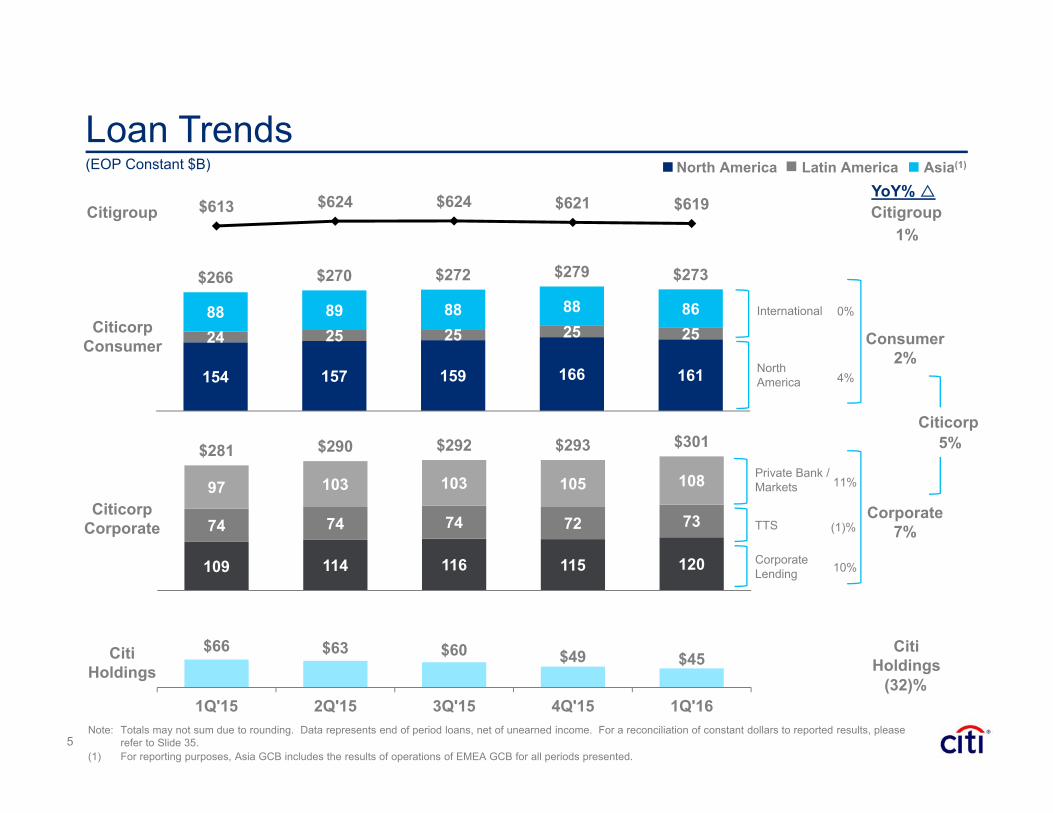
154 157 159 166 161
24 25 25 25 2588 89 88 88 86
$266 $270 $272 $279 $273
$613 $624 $624 $621 $619
$66 $63 $60 $49 $45
1Q'15 2Q'15 3Q'15 4Q'15 1Q'16
109 114 116 115 120
74 74 74 72 73
97 103 103 105 108
$281 $290 $292 $293 $301
5
Private Bank / Markets
Loan TrendsNorth America
Corporate7%
Consumer2%
Note: Totals may not sum due to rounding. Data represents end of period loans, net of unearned income. For a reconciliation of constant dollars to reported results, please refer to Slide 35.
(1) For reporting purposes, Asia GCB includes the results of operations of EMEA GCB for all periods presented.
Citi Holdings
YoY%
Citi Holdings
Citicorp Corporate
Citicorp Consumer
North America
0%
4%
Citigroup1%
Citigroup
(EOP Constant $B)
(1)%
10%
TTS
Corporate Lending
Latin America Asia(1)
International
(32)%
11%
5%Citicorp
6
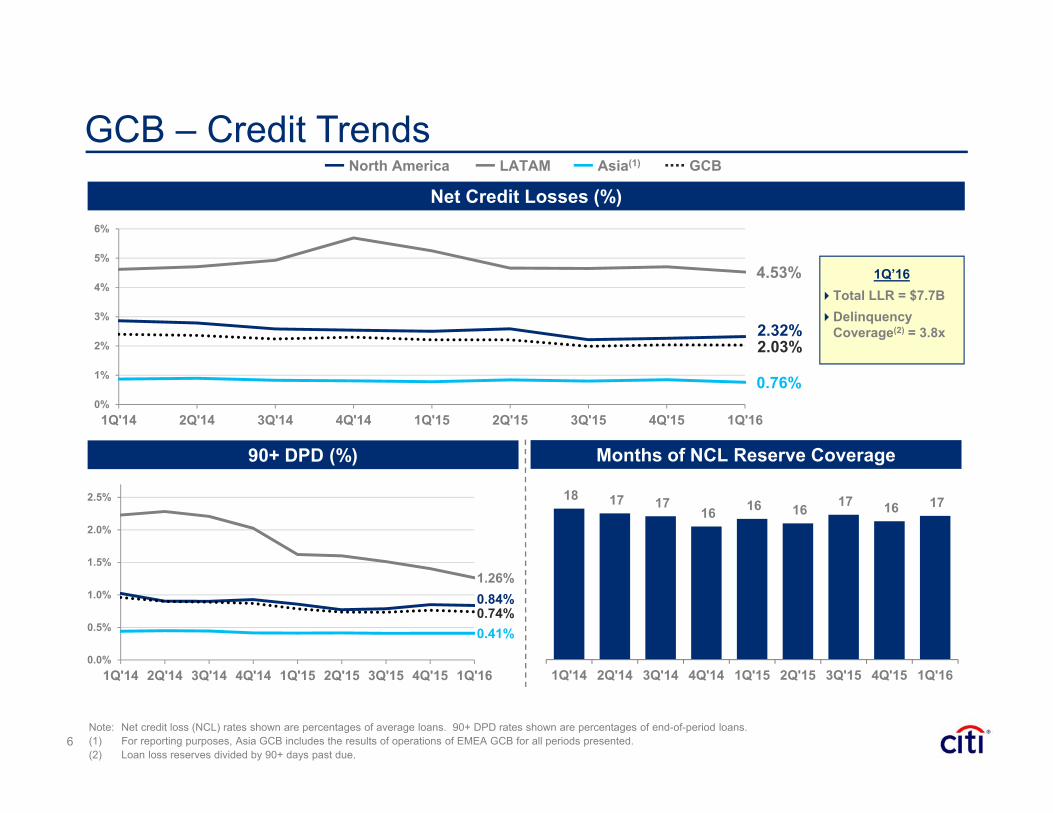
GCB – Credit TrendsNet Credit Losses (%)
Note: Net credit loss (NCL) rates shown are percentages of average loans. 90+ DPD rates shown are percentages of end-of-period loans.(1) For reporting purposes, Asia GCB includes the results of operations of EMEA GCB for all periods presented.(2) Loan loss reserves divided by 90+ days past due.
1Q’16Total LLR = $7.7BDelinquency
Coverage(2) = 3.8x
North America LATAM Asia(1) GCB
2.32%
4.53%
0.76%
2.03%
0%
1%
2%
3%
4%
5%
6%
1Q'14 2Q'14 3Q'14 4Q'14 1Q'15 2Q'15 3Q'15 4Q'15 1Q'16
90+ DPD (%)
0.84%1.26%
0.41%0.74%
0.0%
0.5%
1.0%
1.5%
2.0%
2.5%
1Q'14 2Q'14 3Q'14 4Q'14 1Q'15 2Q'15 3Q'15 4Q'15 1Q'16
Months of NCL Reserve Coverage
18 17 17 16 16 16 17 16 17
1Q'14 2Q'14 3Q'14 4Q'14 1Q'15 2Q'15 3Q'15 4Q'15 1Q'16
7
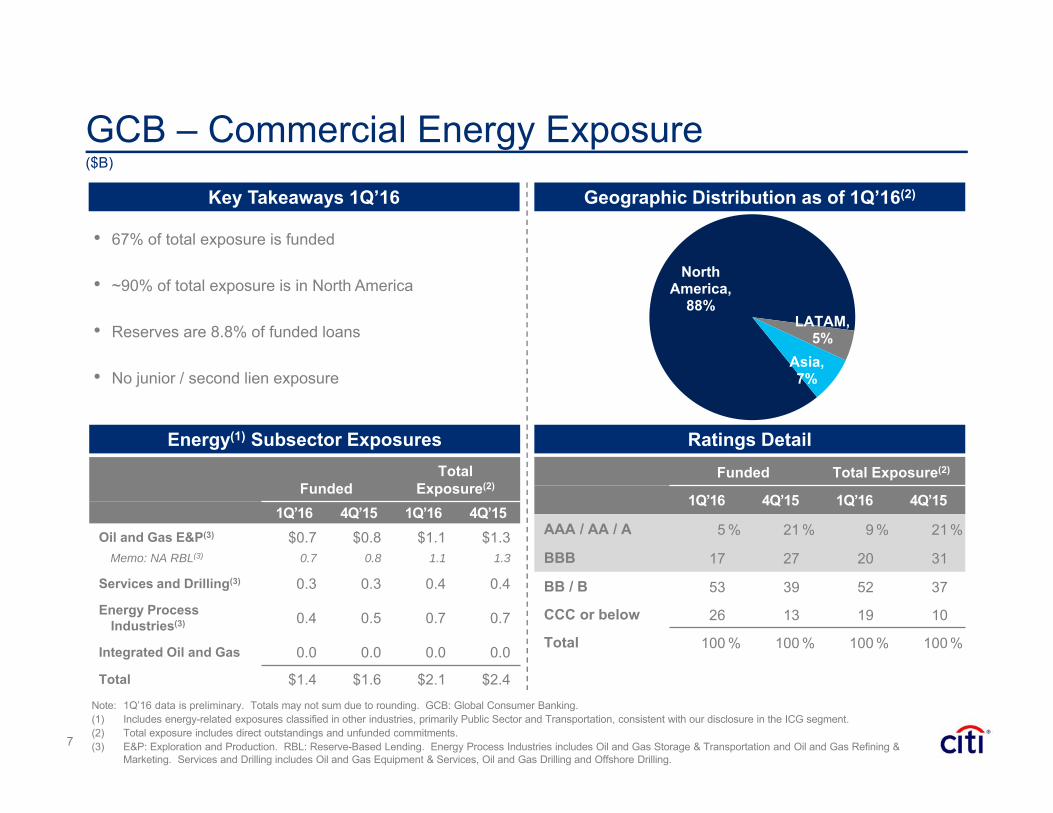
GCB – Commercial Energy Exposure Key Takeaways 1Q’16
Energy(1) Subsector Exposures
Geographic Distribution as of 1Q’16(2)
Ratings Detail
Note: 1Q’16 data is preliminary. Totals may not sum due to rounding. GCB: Global Consumer Banking.(1) Includes energy-related exposures classified in other industries, primarily Public Sector and Transportation, consistent with our disclosure in the ICG segment.(2) Total exposure includes direct outstandings and unfunded commitments.(3) E&P: Exploration and Production. RBL: Reserve-Based Lending. Energy Process Industries includes Oil and Gas Storage & Transportation and Oil and Gas Refining &
Marketing. Services and Drilling includes Oil and Gas Equipment & Services, Oil and Gas Drilling and Offshore Drilling.
Funded Total Exposure(2)
1Q’16 4Q’15 1Q’16 4Q’15
AAA / AA / A 5 % 21 % 9 % 21 %
BBB 17 27 20 31
BB / B 53 39 52 37
CCC or below 26 13 19 10
Total 100 % 100 % 100 % 100 %
North America,
88%LATAM,
5%Asia, 7%
($B)
FundedTotal
Exposure(2)
1Q’16 4Q’15 1Q’16 4Q’15Oil and Gas E&P(3) $0.7 $0.8 $1.1 $1.3
Memo: NA RBL(3) 0.7 0.8 1.1 1.3
Services and Drilling(3) 0.3 0.3 0.4 0.4
Energy Process Industries(3) 0.4 0.5 0.7 0.7
Integrated Oil and Gas 0.0 0.0 0.0 0.0
Total $1.4 $1.6 $2.1 $2.4
• 67% of total exposure is funded
• ~90% of total exposure is in North America
• Reserves are 8.8% of funded loans
• No junior / second lien exposure

8
ICG – Credit Trends
Note: ICG: Institutional Clients Group.(1) Non-accrual loans shown as percentages of end-of-period loans. Non-accrual loans as defined in Citigroup’s 2015 Form 10-K.
Corporate Credit Overview
1.00%
0.67%
0.96%
0.19%
0.76%
0.0%
0.5%
1.0%
1.5%
1Q'14 2Q'14 3Q'14 4Q'14 1Q'15 2Q'15 3Q'15 4Q'15 1Q'16
North America EMEA LATAM Asia ICG
ICG Loan Loss Reserve Trends
Non-Accrual Loans(1) as % of Loans
• ICG cost of credit of $390 million in 1Q’16 o Includes $115 million of NCLs and $260 million
reserve build related to energy• Non-accrual loan increase of ~$730 million in 1Q’16
driven primarily by an increase of ~$500 million in energy-related non-accrual loans
• Increase in non-accrual loans outside of energy did not result in material cost of credit due to collateral coverage
$2.5 $2.4 $2.6 $2.8 $2.9
1Q'15 2Q'15 3Q'15 4Q'15 1Q'16
LLR / NAL: 1.3x in 1Q’16
($B)

9
ICG – Corporate Energy Exposure Energy / Energy-Related Exposure
Energy(1) Subsector Exposures
Geographic Distribution as of 1Q’16(2)
Ratings Detail
Note: 1Q’16 data is preliminary. Totals may not sum due to rounding. ICG: Institutional Clients Group.(1) Includes energy-related exposures classified in other industries on Slide 25, primarily Public Sector and Transportation.(2) Total exposure includes direct outstandings (loans) and unfunded commitments.(3) E&P: Exploration and Production. RBL: Reserve-Based Lending. Energy Process Industries includes Oil and Gas Storage & Transportation and Oil and Gas Refining &
Marketing. Services and Drilling includes Oil and Gas Equipment & Services, Oil and Gas Drilling and Offshore Drilling.
Funded Total Exposure(2)
1Q’16 4Q’15 1Q’16 4Q’15
AAA / AA / A 20 % 23 % 36 % 42 %
BBB 43 45 37 37
BB / B 20 17 17 13
CCC or below 17 15 10 7
Total 100 % 100 % 100 % 100 %
North America,
57%
LATAM, 6% UK,
15%
Other EMEA, 9%
Asia, 13%
Funded Total Exposure(2)
1Q’16 4Q’15 1Q’16 4Q’15
Energy $18.4 $16.7 $51.7 $51.8
Energy-Related(1) 3.9 3.8 5.6 6.3
Total $22.3 $20.5 $57.2 $58.0
($B)
FundedTotal
Exposure(2)
1Q’16 4Q’15 1Q’16 4Q’15Oil and Gas E&P(3) $6.9 $6.2 $16.2 $16.1
Memo: NA RBL(3) 1.4 1.4 3.0 2.7
Services and Drilling(3) 3.3 3.5 9.8 10.4
Energy Process Industries(3) 5.3 4.2 15.1 14.2
Integrated Oil and Gas 5.6 5.6 13.8 15.1
Other 1.1 1.1 2.3 2.3
Total $22.3 $20.5 $57.2 $58.0
~79% of unfunded exposures as of 1Q’16 are investment grade
4.2% Funded Reserve Ratio

10
ICG – Unfunded Corporate Energy Exposure(1)
Facility Structure Ratings Detail
Subsector Ratings Detail Unfunded Exposures
Key Takeaways 1Q’16
Note: 1Q’16 data is preliminary. Totals may not sum due to rounding. ICG: Institutional Clients Group. (1) Represents unfunded commitments. Includes energy-related exposures classified in other industries on Slide 25, primarily Public Sector and Transportation. (2) E&P: Exploration and Production. RBL: Reserve-Based Lending. Energy Process Industries includes Oil and Gas Storage & Transportation and Oil and Gas Refining &
Marketing. Services and Drilling includes Oil and Gas Equipment & Services, Oil and Gas Drilling and Offshore Drilling.
AAA / AA / A BBB BB / B
CCC or
belowTotal
Oil and Gas E&P(2) $2.9 $2.9 $2.6 $0.9 $9.3
Services and Drilling(2) 3.0 1.8 0.9 0.7 6.4
Energy Process Industries(2) 4.3 4.1 1.1 0.2 9.8
Integrated Oil and Gas 5.7 2.1 0.5 - 8.2
Other 0.3 0.4 0.3 0.1 1.2
Total $16.3 $11.4 $5.3 $1.9 $34.9
($B)
• Fronting exposure represents advances to borrowers on behalf of participating banks
• Letters of credit are generally short term and trade-related
• Revolving exposures rated A or higher include, as an example, commercial paper backstops
• Non-investment grade exposures are generally protected by maintenance covenants; 25% of exposures are secured
AAA / AA / A BBB BB / B
CCC or
belowTotal
Fronting Exposure $5.6 $0.8 $0.3 - $6.7
Letters of Credit 1.9 1.1 0.7 0.4 4.1
Revolving Facility & Other 8.8 9.5 4.3 1.5 24.1
Total $16.3 $11.4 $5.3 $1.9 $34.9
AB
C D
A
B
C
D
11
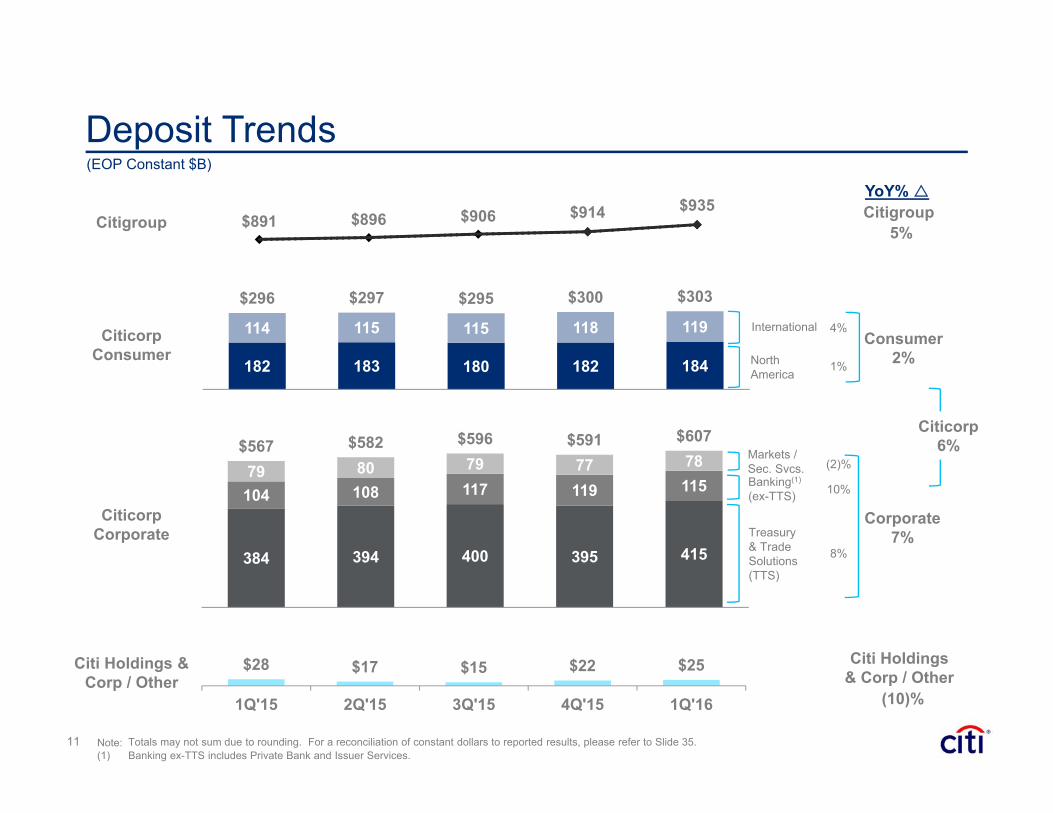
$28 $17 $15 $22 $25
1Q'15 2Q'15 3Q'15 4Q'15 1Q'16
384 394 400 395 415
104 108 117 119 11579 80 79 77 78
$567 $582 $596 $591 $607
182 183 180 182 184
114 115 115 118 119
$296 $297 $295 $300 $303
$891 $896 $906 $914 $935
Note: Totals may not sum due to rounding. For a reconciliation of constant dollars to reported results, please refer to Slide 35.(1) Banking ex-TTS includes Private Bank and Issuer Services.
5%Citigroup
Corporate7%
YoY%
Citicorp Corporate
Citicorp Consumer
Citi Holdings & Corp / Other
Consumer2%
Citigroup
(EOP Constant $B)
Treasury & Trade Solutions(TTS)
North America
International 4%
1%
(2)%
8%
Citi Holdings& Corp / Other
(10)%
Markets / Sec. Svcs.Banking(1)
(ex-TTS) 10%
Deposit Trends
Citicorp6%
12
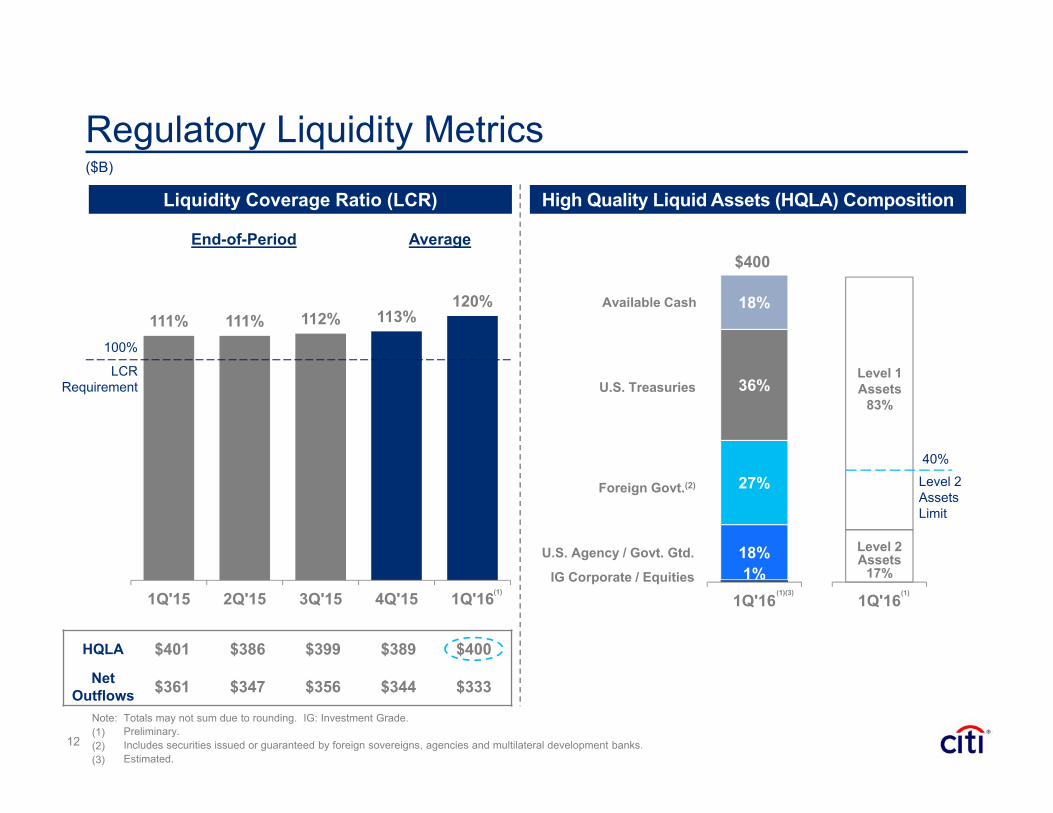
111% 111% 112% 113%120%
1Q'15 2Q'15 3Q'15 4Q'15 1Q'16
Regulatory Liquidity Metrics
Note: Totals may not sum due to rounding. IG: Investment Grade.(1) Preliminary. (2) Includes securities issued or guaranteed by foreign sovereigns, agencies and multilateral development banks.(3) Estimated.
High Quality Liquid Assets (HQLA) CompositionLiquidity Coverage Ratio (LCR)
LCR Requirement
100%
(1)
($B)
HQLA $401 $386 $399 $389 $400
NetOutflows $361 $347 $356 $344 $333
End-of-Period Average
1Q'161%
18%
27%
36%
18%
1Q'16
Level 1 Assets
83%
Level 2 Assets
17%
Level 2 AssetsLimit
40%
Available Cash
Foreign Govt.(2)
U.S. Treasuries
U.S. Agency / Govt. Gtd.
IG Corporate / Equities(1)(3) (1)
$400

13
1%
2.92% 2.95% 2.94% 2.92% 2.92%
Net Interest Margin & RevenueNet Interest Margin
Note: Totals may not sum due to rounding. For a reconciliation of constant dollars to reported results, please refer to Slide 34. (1) Net Interest Revenue (NIR) excludes the taxable equivalent adjustments (based on the U.S. federal statutory tax rate of 35%) and discontinued operations. (2) Excludes deposit insurance and FDIC assessment. Includes effect of non-interest-bearing deposits.
Citicorp NIR(1) (Constant $B)
9.9 10.3 10.5 10.5 10.6
1.2 1.2 1.1 0.8 0.6 $11.1 $11.4 $11.6 $11.3 $11.2
1Q'15 2Q'15 3Q'15 4Q'15 1Q'16
Net Interest Revenue / Day (Constant $MM)$124 $125 $126 $123 $123 (1)%
Cost of Total Average Deposits(2)
0.46% 0.44% 0.42% 0.42% 0.43% (3) bpsCost of Long-Term Debt
2.37% 2.37% 2.39% 2.38% 2.35% (2) bps
YoY
0 bps
Citi Holdings NIR(1) (Constant $B)
(50)%
7%
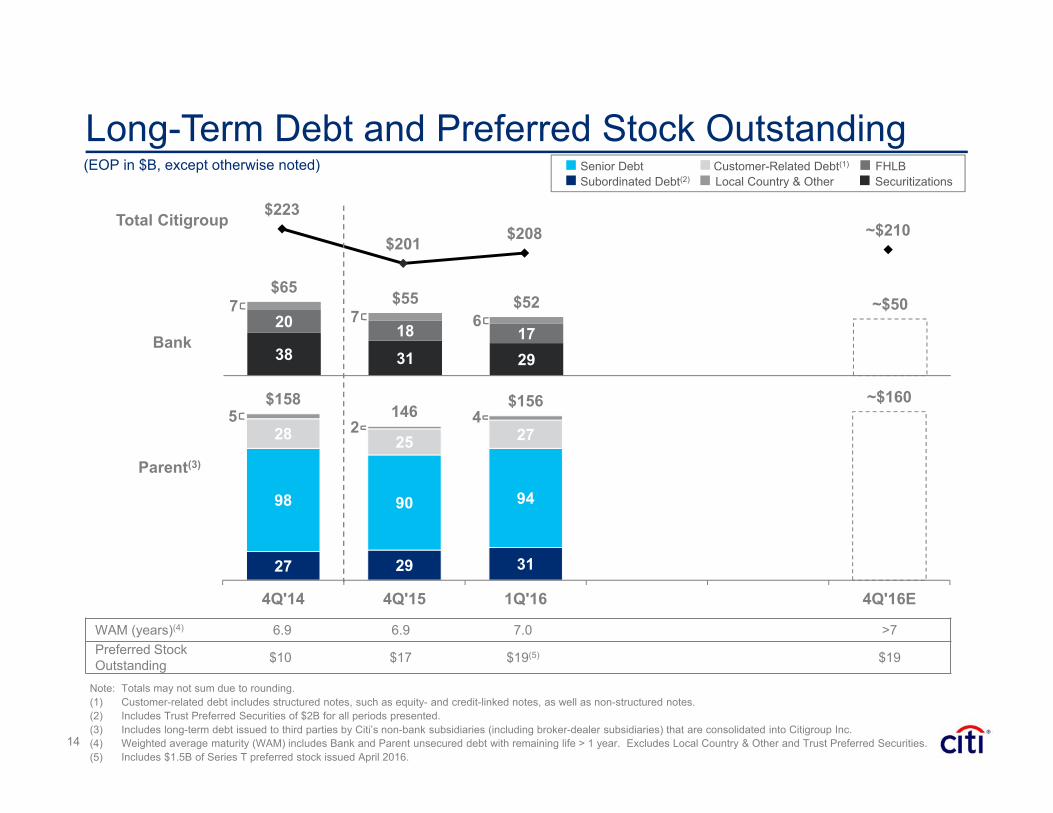
38 31 29
20 18 17
$65$55 $52 ~$50
$223
$201 $208 ~$210
27 29 31
98 90 94 160
28 25 27
$158146 $156 ~$160
4Q'14 4Q'15 1Q'16 4Q'16E
14
Long-Term Debt and Preferred Stock Outstanding
Note: Totals may not sum due to rounding.(1) Customer-related debt includes structured notes, such as equity- and credit-linked notes, as well as non-structured notes. (2) Includes Trust Preferred Securities of $2B for all periods presented.(3) Includes long-term debt issued to third parties by Citi’s non-bank subsidiaries (including broker-dealer subsidiaries) that are consolidated into Citigroup Inc.(4) Weighted average maturity (WAM) includes Bank and Parent unsecured debt with remaining life > 1 year. Excludes Local Country & Other and Trust Preferred Securities.(5) Includes $1.5B of Series T preferred stock issued April 2016.
WAM (years)(4) 6.9 6.9 7.0 >7Preferred Stock Outstanding $10 $17 $19(5) $19
Senior Debt Customer-Related Debt(1)
Subordinated Debt(2)FHLB
Local Country & Other
Parent(3)
Bank
Total Citigroup
(EOP in $B, except otherwise noted)Securitizations
5 2 4
7 7 6
15
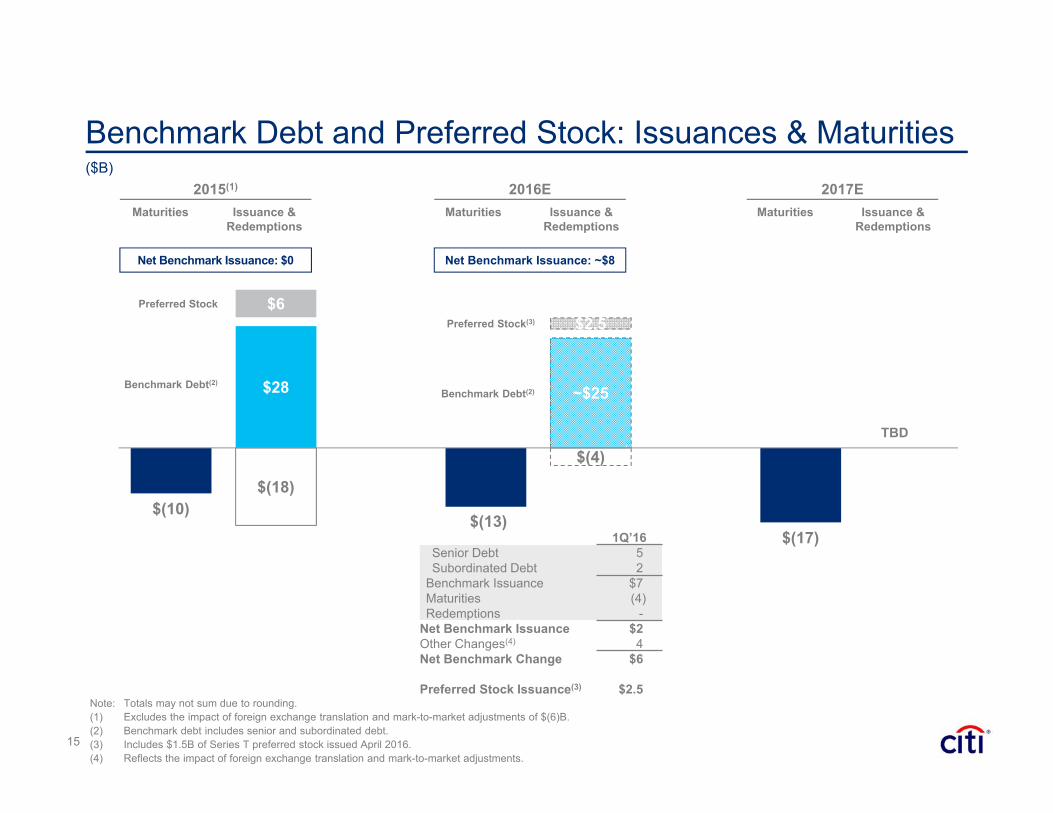
$28 ~$25
$6 $2.5
$(18)
$(4)
$(10)$(13)
$(17)
Benchmark Debt and Preferred Stock: Issuances & Maturities
Issuance & Redemptions
Maturities
Net Benchmark Issuance: $0 Net Benchmark Issuance: ~$8
2017E2015(1) 2016E
Benchmark Debt(2)
Note: Totals may not sum due to rounding.(1) Excludes the impact of foreign exchange translation and mark-to-market adjustments of $(6)B.(2) Benchmark debt includes senior and subordinated debt.(3) Includes $1.5B of Series T preferred stock issued April 2016.(4) Reflects the impact of foreign exchange translation and mark-to-market adjustments.
Preferred Stock
($B)
Preferred Stock(3)
Issuance & Redemptions
Maturities Issuance & Redemptions
Maturities
Benchmark Debt(2)
TBD
1Q’16Senior Debt 5Subordinated Debt 2
Benchmark Issuance $7Maturities (4)Redemptions -
Net Benchmark Issuance $2Other Changes(4) 4Net Benchmark Change $6
Preferred Stock Issuance(3) $2.5
16
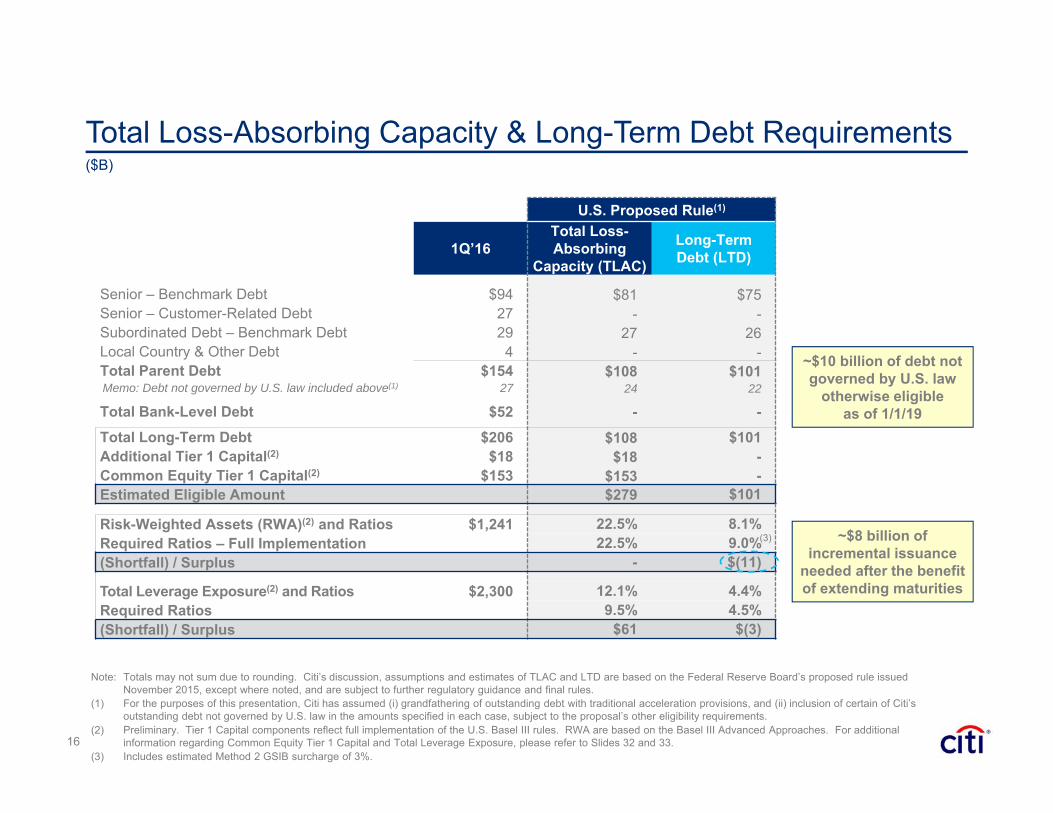
Total Loss-Absorbing Capacity & Long-Term Debt Requirements
Note: Totals may not sum due to rounding. Citi’s discussion, assumptions and estimates of TLAC and LTD are based on the Federal Reserve Board’s proposed rule issuedNovember 2015, except where noted, and are subject to further regulatory guidance and final rules.
(1) For the purposes of this presentation, Citi has assumed (i) grandfathering of outstanding debt with traditional acceleration provisions, and (ii) inclusion of certain of Citi’s outstanding debt not governed by U.S. law in the amounts specified in each case, subject to the proposal’s other eligibility requirements.
(2) Preliminary. Tier 1 Capital components reflect full implementation of the U.S. Basel III rules. RWA are based on the Basel III Advanced Approaches. For additional information regarding Common Equity Tier 1 Capital and Total Leverage Exposure, please refer to Slides 32 and 33.
(3) Includes estimated Method 2 GSIB surcharge of 3%.
($B)
U.S. Proposed Rule(1)
1Q’16Total Loss-Absorbing
Capacity (TLAC)
Long-TermDebt (LTD)
Senior – Benchmark Debt $94 $81 $75 Senior – Customer-Related Debt 27 - -Subordinated Debt – Benchmark Debt 29 27 26 Local Country & Other Debt 4 - -Total Parent Debt $154 $108 $101 Memo: Debt not governed by U.S. law included above(1) 27 24 22
Total Bank-Level Debt $52 - -Total Long-Term Debt $206 $108 $101 Additional Tier 1 Capital(2) $18 $18 -Common Equity Tier 1 Capital(2) $153 $153 -Estimated Eligible Amount $279 $101
Risk-Weighted Assets (RWA)(2) and Ratios $1,241 22.5% 8.1% Required Ratios – Full Implementation 22.5% 9.0%(Shortfall) / Surplus - $(11)
Total Leverage Exposure(2) and Ratios $2,300 12.1% 4.4%Required Ratios 9.5% 4.5%(Shortfall) / Surplus $61 $(3)
~$8 billion of incremental issuance
needed after the benefit of extending maturities
~$10 billion of debt not governed by U.S. law
otherwise eligible as of 1/1/19
(3)
17
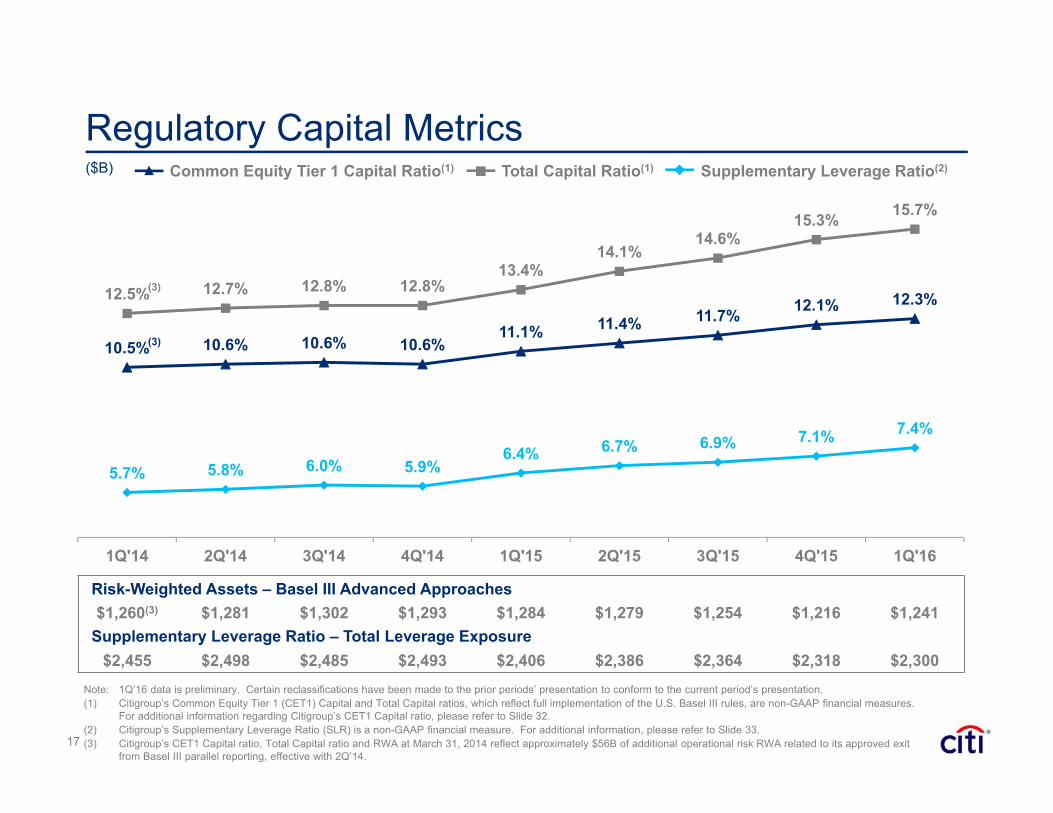
Risk-Weighted Assets – Basel III Advanced Approaches$1,260(3) $1,281 $1,302 $1,293 $1,284 $1,279 $1,254 $1,216 $1,241
Supplementary Leverage Ratio – Total Leverage Exposure$2,455 $2,498 $2,485 $2,493 $2,406 $2,386 $2,364 $2,318 $2,300
5.7% 5.8% 6.0% 5.9%6.4% 6.7% 6.9% 7.1% 7.4%
10.5% 10.6% 10.6% 10.6%11.1% 11.4% 11.7% 12.1% 12.3%12.5% 12.7% 12.8% 12.8%13.4%
14.1%14.6%
15.3% 15.7%
1Q'14 2Q'14 3Q'14 4Q'14 1Q'15 2Q'15 3Q'15 4Q'15 1Q'16
Regulatory Capital Metrics
Note: 1Q’16 data is preliminary. Certain reclassifications have been made to the prior periods’ presentation to conform to the current period’s presentation.(1) Citigroup’s Common Equity Tier 1 (CET1) Capital and Total Capital ratios, which reflect full implementation of the U.S. Basel III rules, are non-GAAP financial measures.
For additional information regarding Citigroup’s CET1 Capital ratio, please refer to Slide 32.(2) Citigroup’s Supplementary Leverage Ratio (SLR) is a non-GAAP financial measure. For additional information, please refer to Slide 33.(3) Citigroup’s CET1 Capital ratio, Total Capital ratio and RWA at March 31, 2014 reflect approximately $56B of additional operational risk RWA related to its approved exit
from Basel III parallel reporting, effective with 2Q’14.
($B) Common Equity Tier 1 Capital Ratio(1) Supplementary Leverage Ratio(2)Total Capital Ratio(1)
(3)
(3)

18
Conclusions
Earnings Results
Stable Funding
Strong Regulatory Capital & Liquidity(1)
Active Balance Sheet Management
• $3.5B 1Q’16 net income• Approximately $1.6B of DTA utilized• Continued progress de-risking the firm
• $935B of deposits• Long-term debt issuance
• $1,801B of GAAP assets at 1Q’16 • Net interest margin of 2.92% for 1Q’16• Actively managed credit exposure
• 12.3% CET1 Capital Ratio• 7.4% SLR• 120% average LCR, $400B HQLA
Note:(1) Preliminary.
Certain statements in this presentation, including without limitation estimates of credit risks and exposures in the energy and energy-related sectors in Citicorp and eligible TLAC and Long-Term Debt under the Federal Reserve Board’s TLAC proposal, are “forward-looking statements” within the meaning of the U.S. Private Securities Litigation Reform Act of 1995. These statements are based on management’s current expectations and are subject to uncertainty and changes in circumstances. These statements are not guarantees of future results or occurrences. Actual results and capital and other financial condition may differ materially from those included in these statements due to a variety of factors, including, among others, the final TLAC rules adopted by the Federal Reserve Board and the precautionary statements included in this presentation and those contained in Citigroup’s filings with the U.S. Securities and Exchange Commission, including without limitation the “Risk Factors” section of Citigroup’s 2015 Form 10-K. Any forward-looking statements made by or on behalf of Citigroup speak only as to the date they are made, and Citi does not undertake to update forward-looking statements to reflect the impact of circumstances or events that arise after the date the forward-looking statements were made.
19

21
Appendix
22. Regulatory Landscape Update23. Citicorp – Regional Credit Portfolio24. Citigroup – Consumer Credit25. ICG – Corporate Credit Exposure ex-
Private Bank26. Citi Holdings – Asset Detail27. Benchmark Debt and Preferred Stock:
Liability Management & Issuance28. Select Additional Tier 1 Capital Securities29. Citigroup – Preferred Stock Dividend
Schedule
30. OCI and Other Effects on Capital31. Rating Agency Perspectives32. Basel III Common Equity Tier 1 Capital
Reconciliation33. Basel III Supplementary Leverage Ratio
Disclosure & Tangible Common Equity Reconciliation
34. Adjusted Results Reconciliation & FX Impact Reconciliation on Net Interest Revenue
35. FX Impact Reconciliation on Balance Sheet Items
Table of Contents
22
Capital Requirements
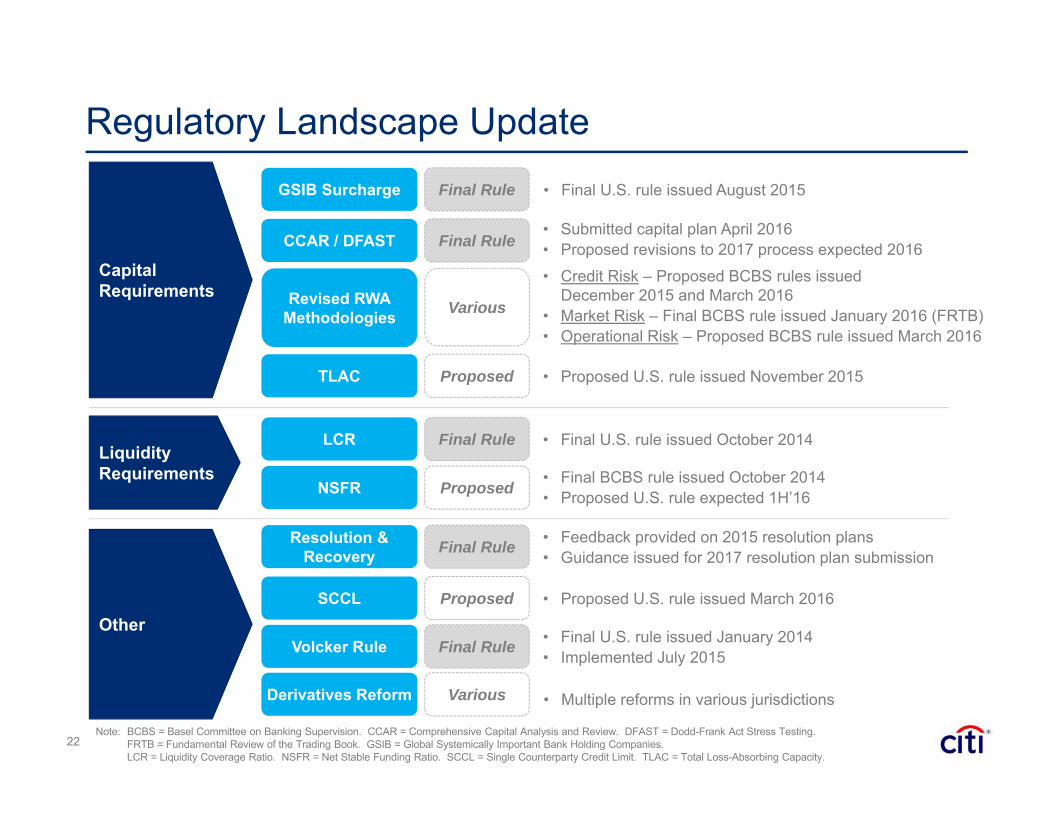
Regulatory Landscape Update
CCAR / DFAST• Submitted capital plan April 2016• Proposed revisions to 2017 process expected 2016
• Final U.S. rule issued October 2014LCR
NSFR • Final BCBS rule issued October 2014• Proposed U.S. rule expected 1H’16
Note: BCBS = Basel Committee on Banking Supervision. CCAR = Comprehensive Capital Analysis and Review. DFAST = Dodd-Frank Act Stress Testing.FRTB = Fundamental Review of the Trading Book. GSIB = Global Systemically Important Bank Holding Companies. LCR = Liquidity Coverage Ratio. NSFR = Net Stable Funding Ratio. SCCL = Single Counterparty Credit Limit. TLAC = Total Loss-Absorbing Capacity.
• Feedback provided on 2015 resolution plans• Guidance issued for 2017 resolution plan submission
Resolution & Recovery
Volcker Rule
Final Rule
Final Rule
Proposed
Final Rule
Final Rule
TLAC Proposed • Proposed U.S. rule issued November 2015
Derivatives Reform Various
Liquidity Requirements
Other• Final U.S. rule issued January 2014• Implemented July 2015
• Credit Risk – Proposed BCBS rules issued December 2015 and March 2016
• Market Risk – Final BCBS rule issued January 2016 (FRTB)• Operational Risk – Proposed BCBS rule issued March 2016
GSIB Surcharge Final Rule • Final U.S. rule issued August 2015
Revised RWA Methodologies Various
• Multiple reforms in various jurisdictions
SCCL • Proposed U.S. rule issued March 2016Proposed
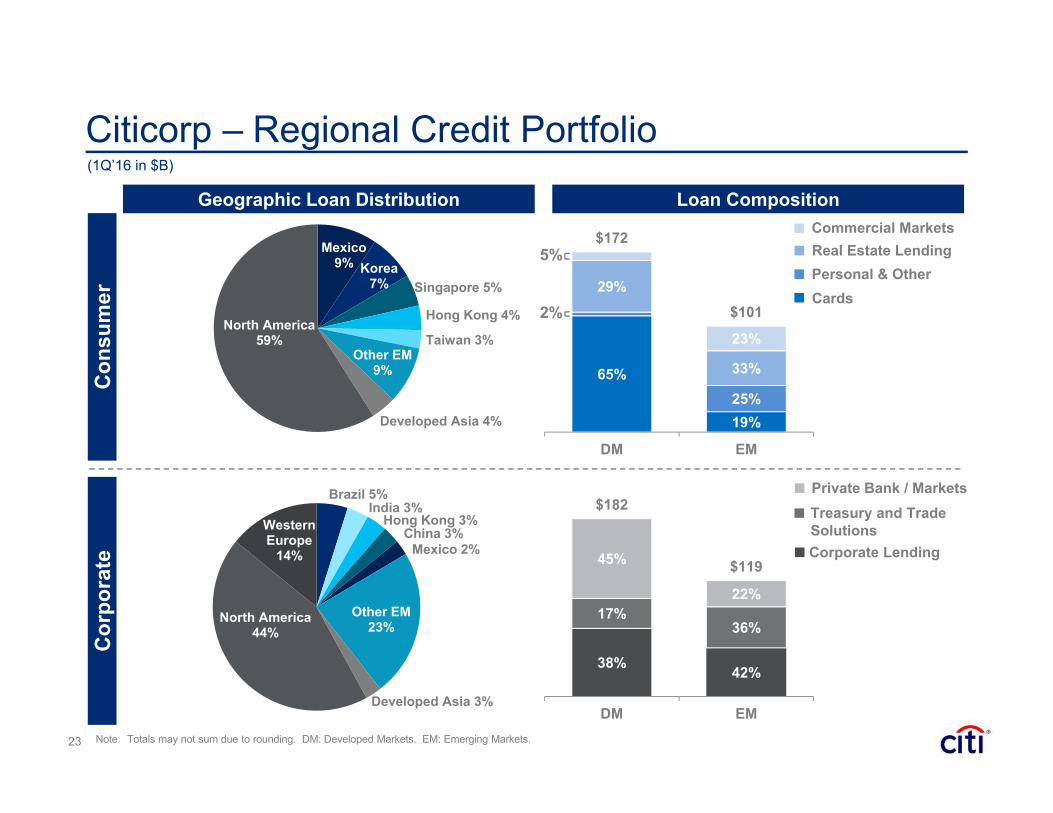
38% 42%
17%36%
45%
22%
$182
$119
DM EM
65%
19%25%
29%
33%
23%
$172
$101
DM EM
Mexico9% Korea
7% Singapore 5%
Hong Kong 4%
Taiwan 3%Other EM
9%
Developed Asia 4%
North America59%
Citicorp – Regional Credit Portfolio(1Q’16 in $B)
Brazil 5%India 3%
Hong Kong 3%China 3%
Mexico 2%
Other EM23%
Developed Asia 3%
North America44%
Western Europe
14%
Con
sum
erC
orpo
rate
Geographic Loan Distribution Loan Composition
Note: Totals may not sum due to rounding. DM: Developed Markets. EM: Emerging Markets.23
Private Bank / MarketsTreasury and Trade SolutionsCorporate Lending
Commercial MarketsReal Estate Lending
CardsPersonal & Other
5%
2%

Citigroup – Consumer Credit
24Note: Totals may not sum due to rounding. DPD: Days past due.
(Constant $B)
Growth($B) (%) YoY % 1Q'16 4Q'15 1Q'15 1Q'16 4Q'15 1Q'15
Korea 19.8 7.2% (5.8)% 0.2% 0.2% 0.3% 0.4% 0.4% 0.6%Singapore 13.4 4.9% (4.6)% 0.1% 0.1% 0.1% 0.3% 0.3% 0.2%Australia 10.7 3.9% (5.5)% 0.7% 0.6% 0.6% 1.2% 1.2% 1.3%Hong Kong 10.4 3.8% (2.0)% 0.1% 0.2% 0.1% 0.3% 0.7% 0.4%Taiwan 7.8 2.9% 8.6% 0.2% 0.1% 0.1% 0.4% 0.4% 0.2%India 6.2 2.3% 5.8% 0.7% 0.7% 0.6% 0.7% 0.8% 0.7%Malaysia 4.9 1.8% (1.2)% 1.0% 1.0% 1.0% 0.7% 0.7% 0.7%China 4.7 1.7% 1.3% 0.2% 0.3% 0.2% 0.5% 0.8% 1.0%Thailand 1.9 0.7% 1.2% 1.5% 1.6% 1.7% 2.8% 3.2% 2.8%Indonesia 1.2 0.4% (4.4)% 1.3% 1.2% 1.0% 3.0% 7.9% 2.2%All Other 1.2 0.4% 15.9% 1.5% 1.4% 1.7% 3.1% 3.4% 4.3%
Asia 82.2 30.2% (1.9)% 0.4% 0.4% 0.4% 0.7% 0.8% 0.7%Poland 1.6 0.6% 6.1% 0.5% 0.5% 0.6% 0.7% (1.4)% 0.5%UAE 1.3 0.5% 9.6% 1.3% 1.3% 1.0% 4.0% 3.3% 2.2%Russia 0.9 0.3% (4.9)% 1.0% 1.1% 0.9% 3.2% 3.2% 3.0%All Other 0.2 0.1% 12.5% 0.7% 1.3% 1.2% 3.6% 2.2% 1.9%
EMEA 4.1 1.5% 4.8% 0.9% 0.9% 0.8% 2.5% 1.4% 1.7%Latin America 25.4 9.3% 4.5% 1.3% 1.4% 1.8% 4.5% 4.7% 5.3%Total International 111.7 41.0% (0.3)% 0.6% 0.6% 0.7% 1.6% 1.7% 1.7%North America 160.9 59.0% 4.5% 0.8% 0.9% 0.9% 2.3% 2.3% 2.5%Total Citicorp Consumer 272.6 100.0% 2.5% 0.7% 0.8% 0.9% 2.0% 2.0% 2.2%
Citi Holdings Consumer:North America 38.6 NM (31.8)% 2.1% 2.0% 3.0% 0.7% 1.1% 2.1%International 6.4 NM (31.1)% 2.3% 2.0% 1.9% 4.7% 5.9% 3.4%
1Q'16 Loans 90+ DPD Ratio NCL Ratio
25
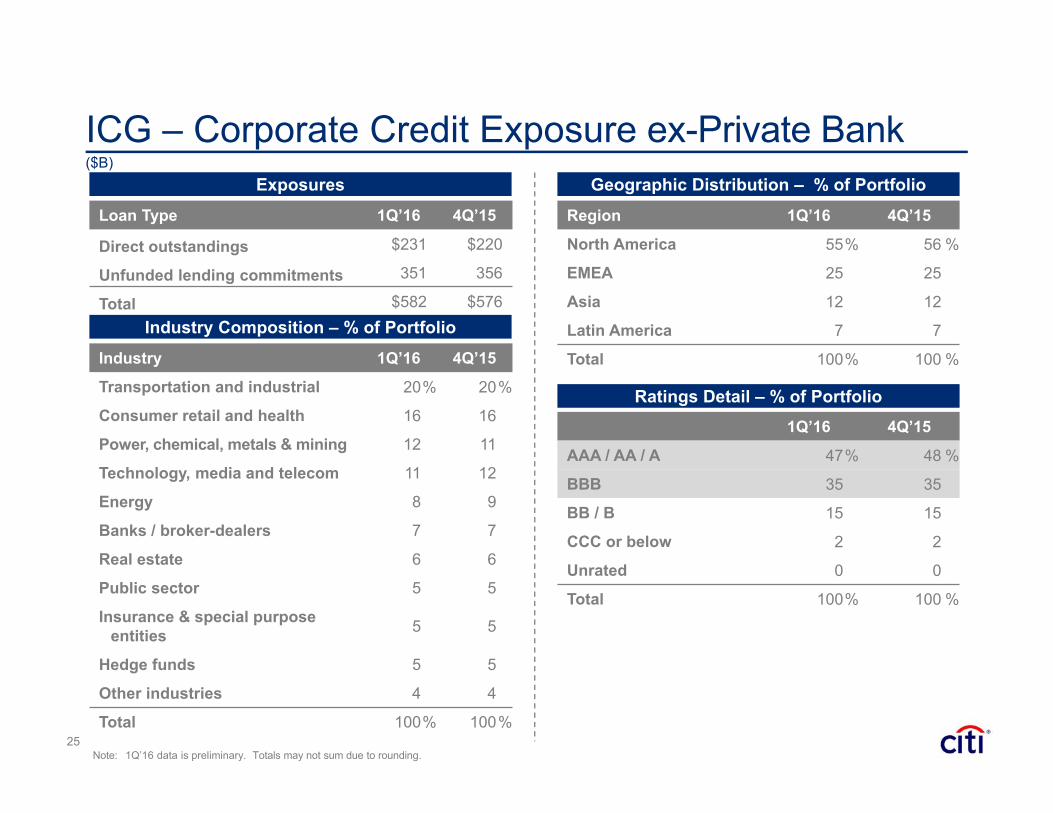
Region 1Q’16 4Q’15
North America 55% 56 %
EMEA 25 25
Asia 12 12
Latin America 7 7
Total 100% 100 %
ICG – Corporate Credit Exposure ex-Private BankExposures
Industry Composition – % of Portfolio
Geographic Distribution – % of Portfolio
Ratings Detail – % of Portfolio
Note: 1Q’16 data is preliminary. Totals may not sum due to rounding.
Loan Type 1Q’16 4Q’15
Direct outstandings $231 $220
Unfunded lending commitments 351 356
Total $582 $576
1Q’16 4Q’15
AAA / AA / A 47% 48 %
BBB 35 35
BB / B 15 15
CCC or below 2 2
Unrated 0 0
Total 100% 100 %
Industry 1Q’16 4Q’15
Transportation and industrial 20% 20%
Consumer retail and health 16 16
Power, chemical, metals & mining 12 11
Technology, media and telecom 11 12
Energy 8 9
Banks / broker-dealers 7 7
Real estate 6 6
Public sector 5 5
Insurance & special purpose entities 5 5
Hedge funds 5 5
Other industries 4 4
Total 100% 100%
($B)
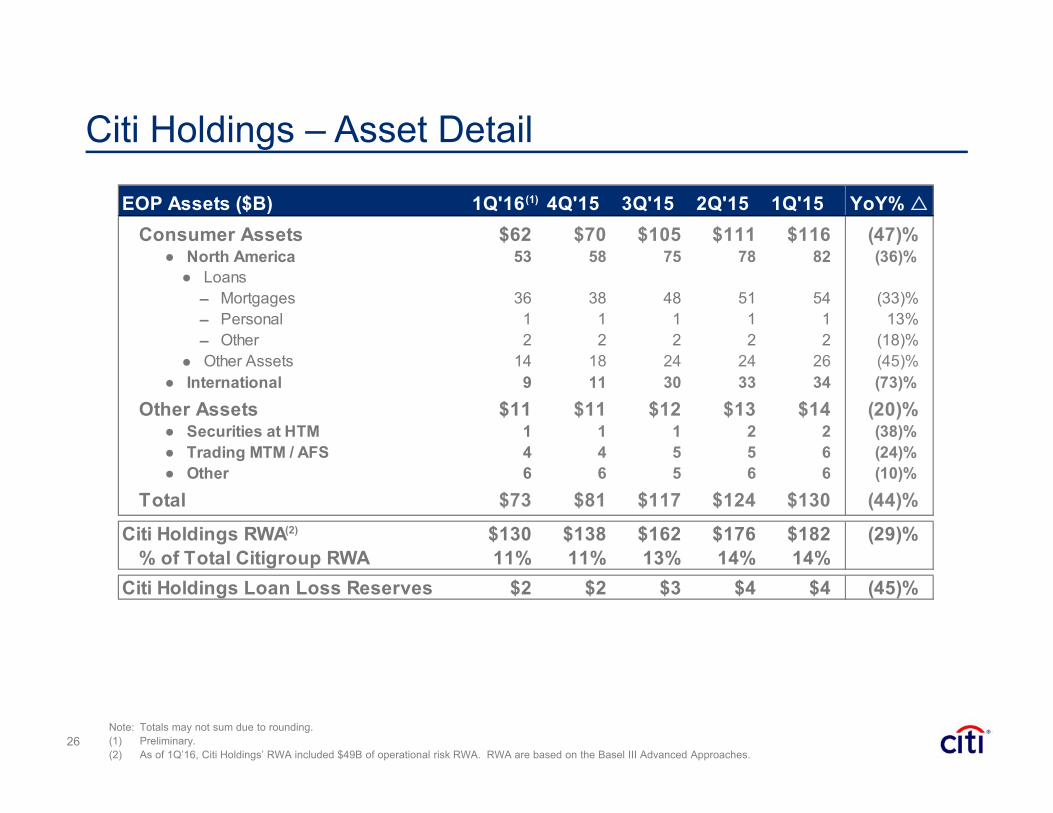
EOP Assets ($B) 1Q'16 4Q'15 3Q'15 2Q'15 1Q'15Consumer Assets $62 $70 $105 $111 $116 (47)%
● North America 53 58 75 78 82 (36)%● Loans
– Mortgages 36 38 48 51 54 (33)%– Personal 1 1 1 1 1 13%– Other 2 2 2 2 2 (18)%
● Other Assets 14 18 24 24 26 (45)%● International 9 11 30 33 34 (73)%
Other Assets $11 $11 $12 $13 $14 (20)%● Securities at HTM 1 1 1 2 2 (38)%● Trading MTM / AFS 4 4 5 5 6 (24)%● Other 6 6 5 6 6 (10)%
Total $73 $81 $117 $124 $130 (44)%
Citi Holdings RWA $130 $138 $162 $176 $182 (29)%% of Total Citigroup RWA 11% 11% 13% 14% 14%
Citi Holdings Loan Loss Reserves $2 $2 $3 $4 $4 (45)%
YoY%
26
Citi Holdings – Asset Detail
Note: Totals may not sum due to rounding. (1) Preliminary.(2) As of 1Q’16, Citi Holdings’ RWA included $49B of operational risk RWA. RWA are based on the Basel III Advanced Approaches.
(2)
(1)

27
$2.9 $2.6$0.9
$11.3
1Q'15 2Q'15 3Q'15 4Q'15 1Q'16
Benchmark Debt and Preferred Stock: Liability Management & Issuance
Liability Management Activity – Benchmark Debt
Issuance Volumes
($B)
Note: Totals may not sum due to rounding.
Tenders / Buybacks
6.1 5.4 3.4 5.2 5.2
1.0 3.0
2.0 1.5 1.5
1.5 2.0
1.3 1.5 1.0
$8.6$10.4
$6.7$8.2 $7.7
1Q'15 2Q'15 3Q'15 4Q'15 1Q'16
Senior Unsecured Preferred StockSubordinated Debt
Benchmark:
Benchmark & Preferred Stock:
$7.1$8.4
$5.4$6.7 $6.7
28
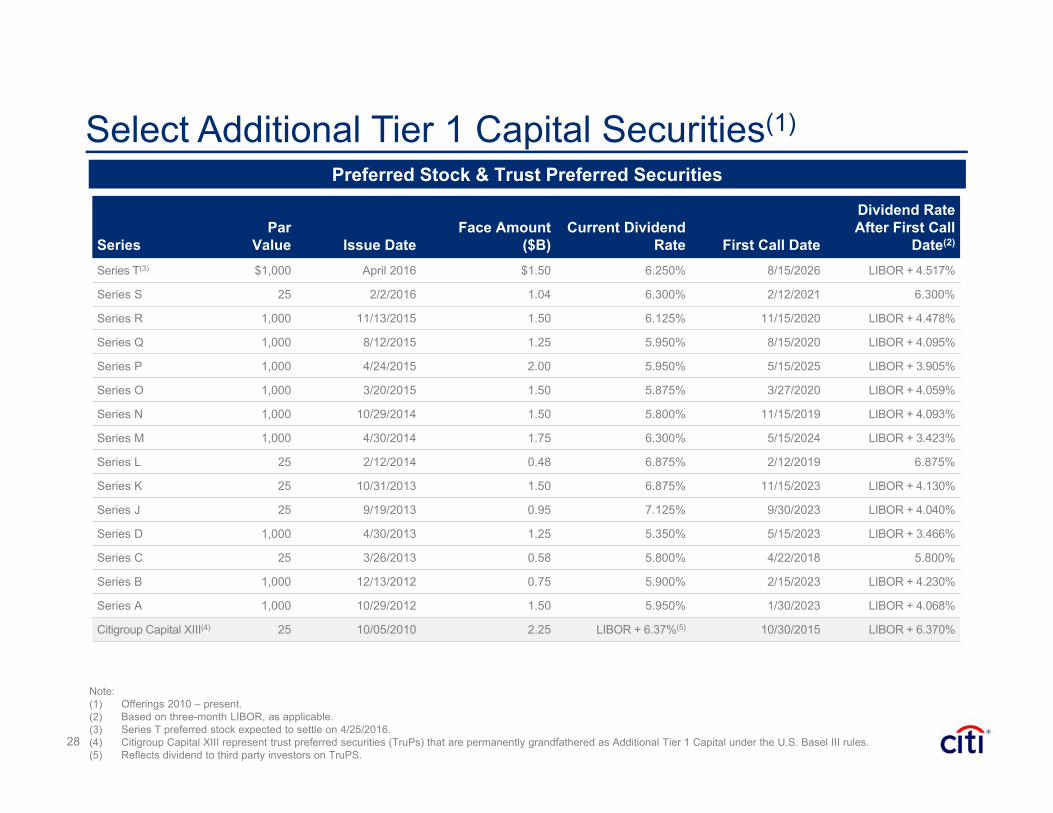
Note:(1) Offerings 2010 – present.(2) Based on three-month LIBOR, as applicable. (3) Series T preferred stock expected to settle on 4/25/2016.(4) Citigroup Capital XIII represent trust preferred securities (TruPs) that are permanently grandfathered as Additional Tier 1 Capital under the U.S. Basel III rules.(5) Reflects dividend to third party investors on TruPS.
Select Additional Tier 1 Capital Securities(1)
Preferred Stock & Trust Preferred Securities
SeriesPar
Value Issue DateFace Amount
($B)Current Dividend
Rate First Call Date
Dividend Rate After First Call
Date(2)
Series T(3) $1,000 April 2016 $1.50 6.250% 8/15/2026 LIBOR + 4.517%
Series S 25 2/2/2016 1.04 6.300% 2/12/2021 6.300%
Series R 1,000 11/13/2015 1.50 6.125% 11/15/2020 LIBOR + 4.478%
Series Q 1,000 8/12/2015 1.25 5.950% 8/15/2020 LIBOR + 4.095%
Series P 1,000 4/24/2015 2.00 5.950% 5/15/2025 LIBOR + 3.905%
Series O 1,000 3/20/2015 1.50 5.875% 3/27/2020 LIBOR + 4.059%
Series N 1,000 10/29/2014 1.50 5.800% 11/15/2019 LIBOR + 4.093%
Series M 1,000 4/30/2014 1.75 6.300% 5/15/2024 LIBOR + 3.423%
Series L 25 2/12/2014 0.48 6.875% 2/12/2019 6.875%
Series K 25 10/31/2013 1.50 6.875% 11/15/2023 LIBOR + 4.130%
Series J 25 9/19/2013 0.95 7.125% 9/30/2023 LIBOR + 4.040%
Series D 1,000 4/30/2013 1.25 5.350% 5/15/2023 LIBOR + 3.466%
Series C 25 3/26/2013 0.58 5.800% 4/22/2018 5.800%
Series B 1,000 12/13/2012 0.75 5.900% 2/15/2023 LIBOR + 4.230%
Series A 1,000 10/29/2012 1.50 5.950% 1/30/2023 LIBOR + 4.068%
Citigroup Capital XIII(4) 25 10/05/2010 2.25 LIBOR + 6.37%(5) 10/30/2015 LIBOR + 6.370%
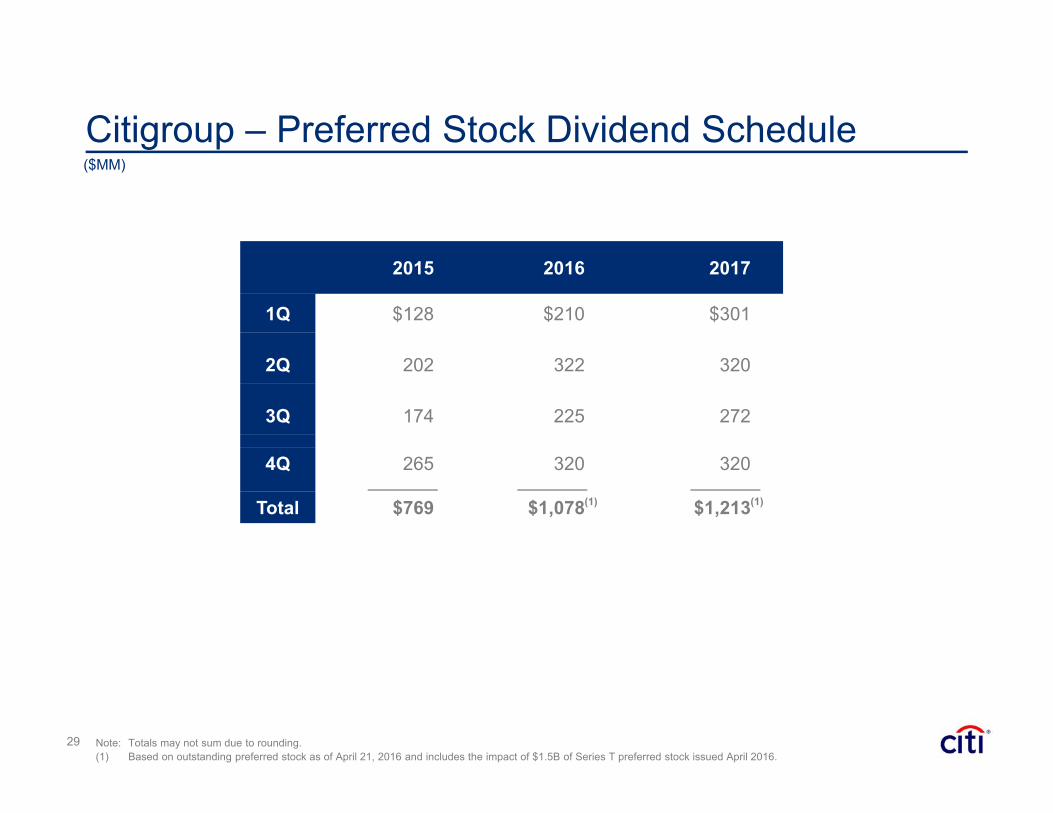
Citigroup – Preferred Stock Dividend Schedule
29
($MM)
Note: Totals may not sum due to rounding. (1) Based on outstanding preferred stock as of April 21, 2016 and includes the impact of $1.5B of Series T preferred stock issued April 2016.
2015 2016 2017
1Q $128 $210 $301
2Q 202 322 320
3Q 174 225 272
4Q 265 320 320
Total $769 $1,078 $1,213(1)(1)
30
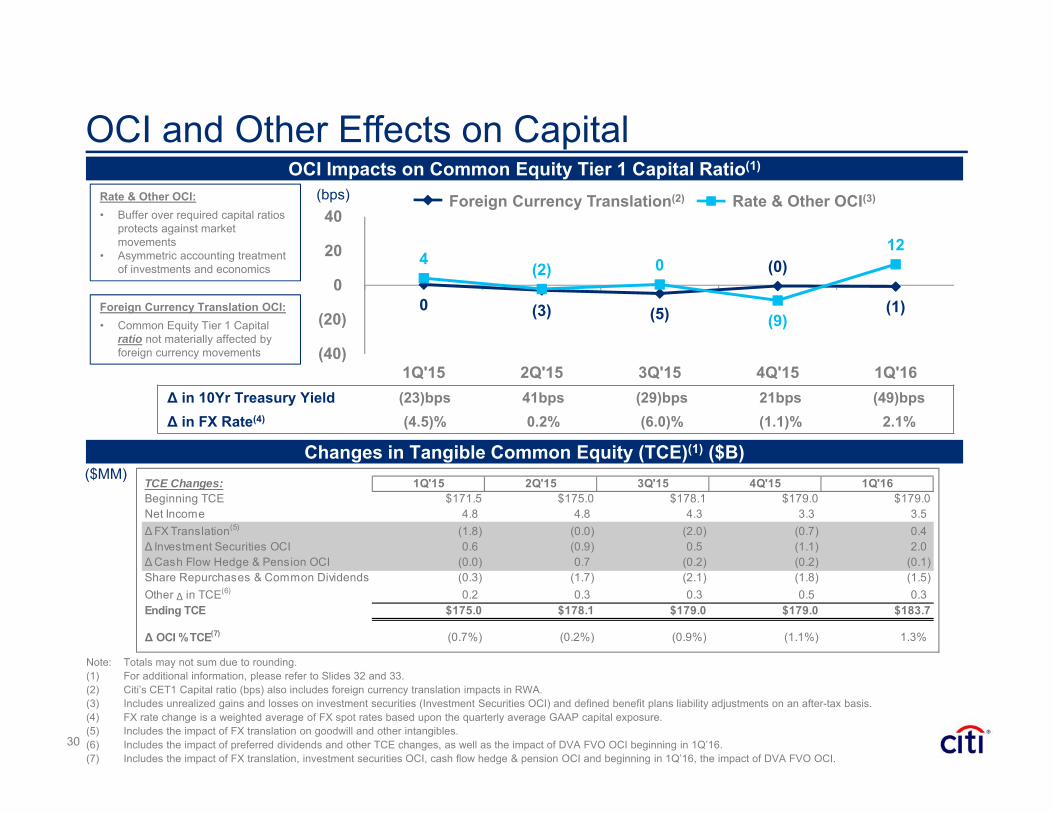
OCI and Other Effects on Capital
Note: Totals may not sum due to rounding.(1) For additional information, please refer to Slides 32 and 33.(2) Citi’s CET1 Capital ratio (bps) also includes foreign currency translation impacts in RWA.(3) Includes unrealized gains and losses on investment securities (Investment Securities OCI) and defined benefit plans liability adjustments on an after-tax basis.(4) FX rate change is a weighted average of FX spot rates based upon the quarterly average GAAP capital exposure.(5) Includes the impact of FX translation on goodwill and other intangibles.(6) Includes the impact of preferred dividends and other TCE changes, as well as the impact of DVA FVO OCI beginning in 1Q’16.(7) Includes the impact of FX translation, investment securities OCI, cash flow hedge & pension OCI and beginning in 1Q’16, the impact of DVA FVO OCI.
OCI Impacts on Common Equity Tier 1 Capital Ratio(1)
Foreign Currency Translation OCI:• Common Equity Tier 1 Capital
ratio not materially affected by foreign currency movements
Rate & Other OCI:• Buffer over required capital ratios
protects against market movements
• Asymmetric accounting treatment of investments and economics
Changes in Tangible Common Equity (TCE)(1) ($B)
Foreign Currency Translation(2) Rate & Other OCI(3)(bps)
0 (3) (5)
(0)
(1)
4 (2) 0
(9)
12
(40)
(20)
0
20
40
1Q'15 2Q'15 3Q'15 4Q'15 1Q'16∆ in 10Yr Treasury Yield (23)bps 41bps (29)bps 21bps (49)bps∆ in FX Rate(4) (4.5)% 0.2% (6.0)% (1.1)% 2.1%
($MM)TCE Changes: 1Q'15 2Q'15 3Q'15 4Q'15 1Q'16Beginning TCE $171.5 $175.0 $178.1 $179.0 $179.0 Net Income 4.8 4.8 4.3 3.3 3.5 ∆ FX Translation(5) (1.8) (0.0) (2.0) (0.7) 0.4 ∆ Investment Securities OCI 0.6 (0.9) 0.5 (1.1) 2.0 ∆ Cash Flow Hedge & Pension OCI (0.0) 0.7 (0.2) (0.2) (0.1) Share Repurchases & Common Dividends (0.3) (1.7) (2.1) (1.8) (1.5) Other Δ in TCE(6) 0.2 0.3 0.3 0.5 0.3 Ending TCE $175.0 $178.1 $179.0 $179.0 $183.7
∆ OCI % TCE(7) (0.7%) (0.2%) (0.9%) (1.1%) 1.3%
31
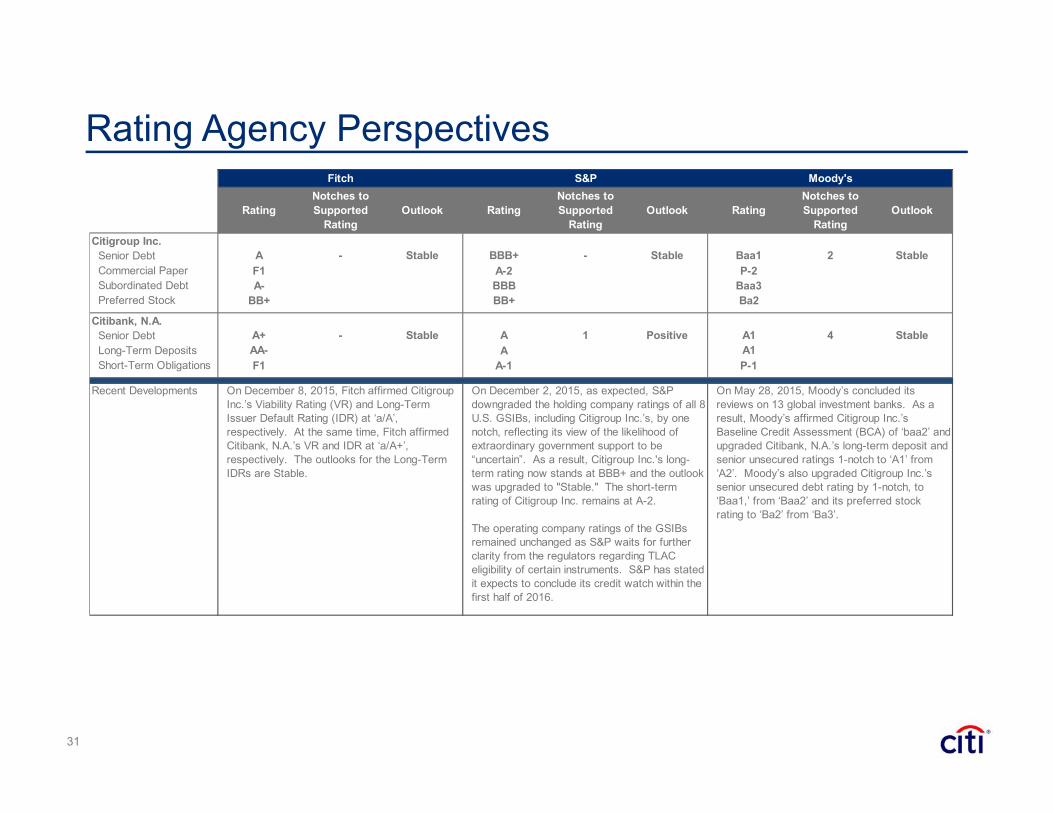
Rating Agency Perspectives
RatingNotches to Supported
RatingOutlook Rating
Notches to Supported
RatingOutlook Rating
Notches to Supported
RatingOutlook
Citigroup Inc.Senior Debt A - Stable BBB+ - Stable Baa1 2 StableCommercial Paper F1 A-2 P-2Subordinated Debt A- BBB Baa3Preferred Stock BB+ BB+ Ba2
Citibank, N.A.Senior Debt A+ - Stable A 1 Positive A1 4 StableLong-Term Deposits AA- A A1Short-Term Obligations F1 A-1 P-1
Fitch S&P Moody's
Recent Developments On December 8, 2015, Fitch affirmed Citigroup Inc.’s Viability Rating (VR) and Long-Term Issuer Default Rating (IDR) at ‘a/A’, respectively. At the same time, Fitch affirmed Citibank, N.A.’s VR and IDR at ‘a/A+’, respectively. The outlooks for the Long-Term IDRs are Stable.
On December 2, 2015, as expected, S&P downgraded the holding company ratings of all 8 U.S. GSIBs, including Citigroup Inc.’s, by one notch, reflecting its view of the likelihood of extraordinary government support to be “uncertain”. As a result, Citigroup Inc.'s long-term rating now stands at BBB+ and the outlook was upgraded to "Stable." The short-term rating of Citigroup Inc. remains at A-2.
The operating company ratings of the GSIBs remained unchanged as S&P waits for further clarity from the regulators regarding TLAC eligibility of certain instruments. S&P has stated it expects to conclude its credit watch within the first half of 2016.
On May 28, 2015, Moody’s concluded its reviews on 13 global investment banks. As a result, Moody’s affirmed Citigroup Inc.’s Baseline Credit Assessment (BCA) of ‘baa2’ and upgraded Citibank, N.A.’s long-term deposit and senior unsecured ratings 1-notch to ‘A1’ from ‘A2’. Moody’s also upgraded Citigroup Inc.’s senior unsecured debt rating by 1-notch, to ‘Baa1,’ from ‘Baa2’ and its preferred stock rating to ‘Ba2’ from ‘Ba3’.
Non-GAAP Financial Measures – Reconciliations
32
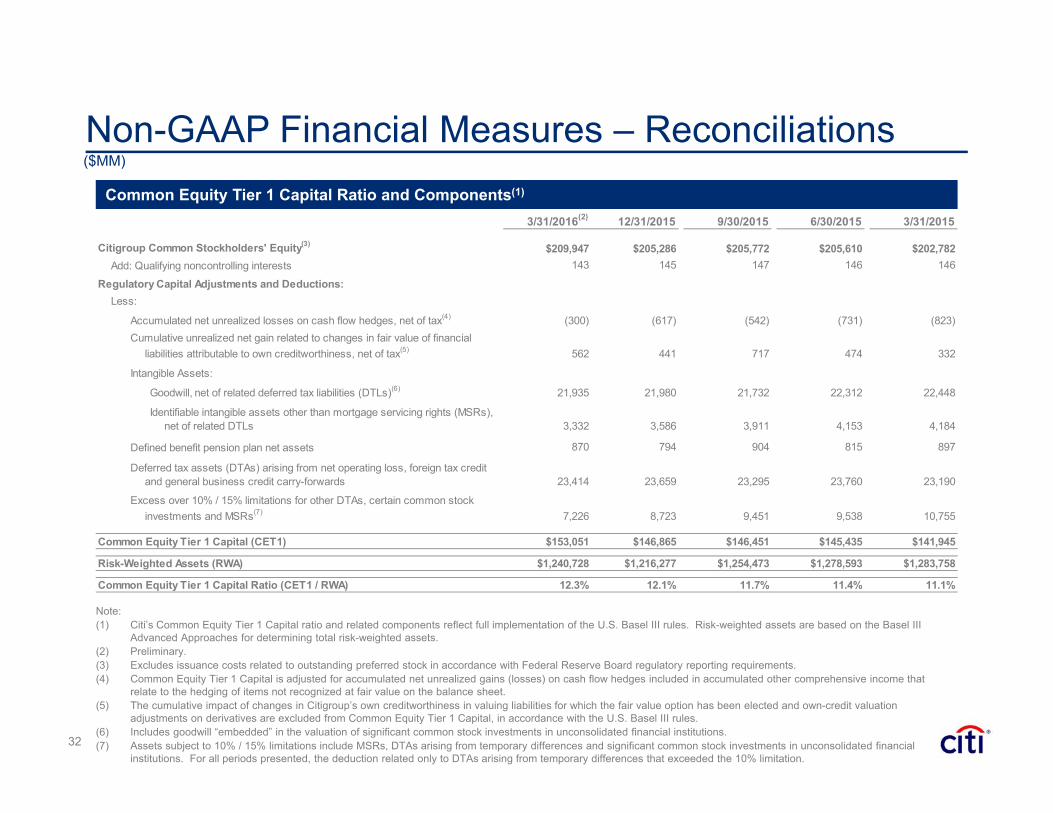
Common Equity Tier 1 Capital Ratio and Components(1)
($MM)
Note:(1) Citi’s Common Equity Tier 1 Capital ratio and related components reflect full implementation of the U.S. Basel III rules. Risk-weighted assets are based on the Basel III
Advanced Approaches for determining total risk-weighted assets.(2) Preliminary.(3) Excludes issuance costs related to outstanding preferred stock in accordance with Federal Reserve Board regulatory reporting requirements.(4) Common Equity Tier 1 Capital is adjusted for accumulated net unrealized gains (losses) on cash flow hedges included in accumulated other comprehensive income that
relate to the hedging of items not recognized at fair value on the balance sheet. (5) The cumulative impact of changes in Citigroup’s own creditworthiness in valuing liabilities for which the fair value option has been elected and own-credit valuation
adjustments on derivatives are excluded from Common Equity Tier 1 Capital, in accordance with the U.S. Basel III rules.(6) Includes goodwill “embedded” in the valuation of significant common stock investments in unconsolidated financial institutions.(7) Assets subject to 10% / 15% limitations include MSRs, DTAs arising from temporary differences and significant common stock investments in unconsolidated financial
institutions. For all periods presented, the deduction related only to DTAs arising from temporary differences that exceeded the 10% limitation.
3/31/2016(2) 12/31/2015 9/30/2015 6/30/2015 3/31/2015
Citigroup Common Stockholders' Equity(3) $209,947 $205,286 $205,772 $205,610 $202,782 Add: Qualifying noncontrolling interests 143 145 147 146 146
Regulatory Capital Adjustments and Deductions:Less:
Accumulated net unrealized losses on cash flow hedges, net of tax(4) (300) (617) (542) (731) (823)Cumulative unrealized net gain related to changes in fair value of financial liabilities attributable to own creditworthiness, net of tax(5) 562 441 717 474 332
Intangible Assets:
Goodwill, net of related deferred tax liabilities (DTLs)(6) 21,935 21,980 21,732 22,312 22,448
Identifiable intangible assets other than mortgage servicing rights (MSRs), net of related DTLs 3,332 3,586 3,911 4,153 4,184
Defined benefit pension plan net assets 870 794 904 815 897
Deferred tax assets (DTAs) arising from net operating loss, foreign tax credit and general business credit carry-forwards 23,414 23,659 23,295 23,760 23,190
Excess over 10% / 15% limitations for other DTAs, certain common stock investments and MSRs(7) 7,226 8,723 9,451 9,538 10,755
Common Equity Tier 1 Capital (CET1) $153,051 $146,865 $146,451 $145,435 $141,945
Risk-Weighted Assets (RWA) $1,240,728 $1,216,277 $1,254,473 $1,278,593 $1,283,758
Common Equity Tier 1 Capital Ratio (CET1 / RWA) 12.3% 12.1% 11.7% 11.4% 11.1%
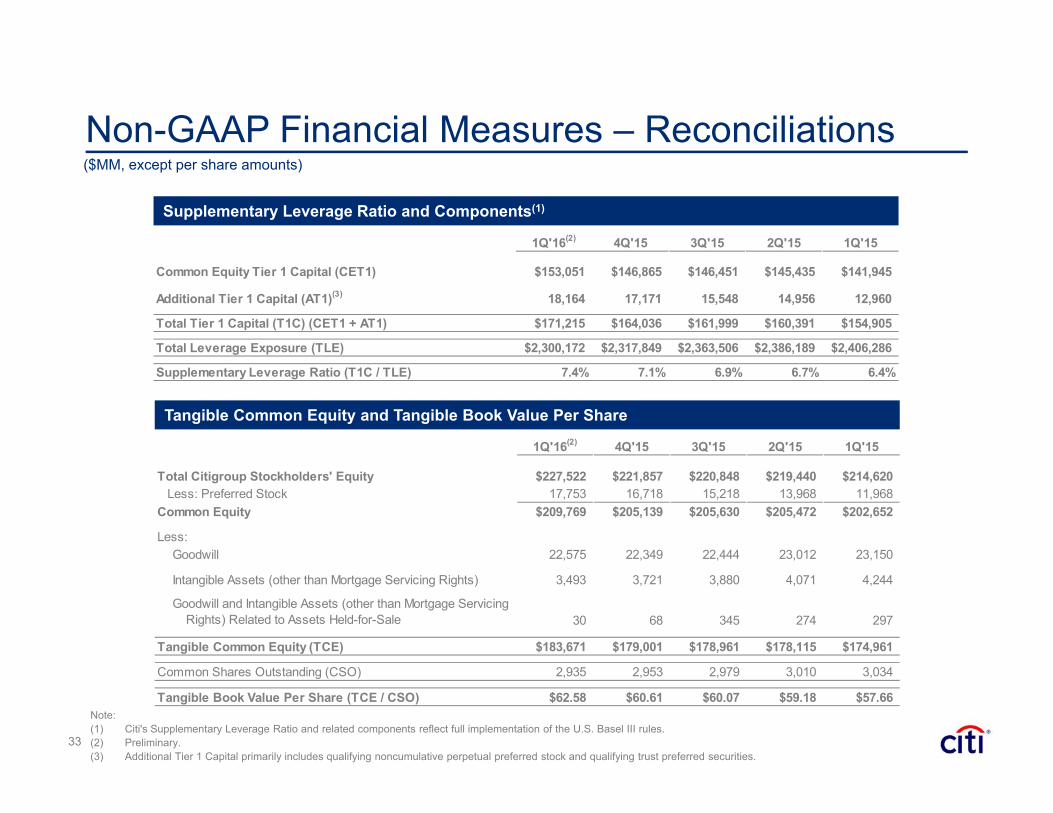
Supplementary Leverage Ratio and Components(1)
Tangible Common Equity and Tangible Book Value Per Share
Non-GAAP Financial Measures – Reconciliations
33
($MM, except per share amounts)
Note:(1) Citi's Supplementary Leverage Ratio and related components reflect full implementation of the U.S. Basel III rules.(2) Preliminary.(3) Additional Tier 1 Capital primarily includes qualifying noncumulative perpetual preferred stock and qualifying trust preferred securities.
1Q'16(2) 4Q'15 3Q'15 2Q'15 1Q'15
Common Equity Tier 1 Capital (CET1) $153,051 $146,865 $146,451 $145,435 $141,945
Additional Tier 1 Capital (AT1)(3) 18,164 17,171 15,548 14,956 12,960
Total Tier 1 Capital (T1C) (CET1 + AT1) $171,215 $164,036 $161,999 $160,391 $154,905
Total Leverage Exposure (TLE) $2,300,172 $2,317,849 $2,363,506 $2,386,189 $2,406,286
Supplementary Leverage Ratio (T1C / TLE) 7.4% 7.1% 6.9% 6.7% 6.4%
1Q'16(2) 4Q'15 3Q'15 2Q'15 1Q'15
Total Citigroup Stockholders' Equity $227,522 $221,857 $220,848 $219,440 $214,620 Less: Preferred Stock 17,753 16,718 15,218 13,968 11,968Common Equity $209,769 $205,139 $205,630 $205,472 $202,652
Less:Goodwill 22,575 22,349 22,444 23,012 23,150
Intangible Assets (other than Mortgage Servicing Rights) 3,493 3,721 3,880 4,071 4,244
Goodwill and Intangible Assets (other than Mortgage Servicing Rights) Related to Assets Held-for-Sale 30 68 345 274 297
Tangible Common Equity (TCE) $183,671 $179,001 $178,961 $178,115 $174,961
Common Shares Outstanding (CSO) 2,935 2,953 2,979 3,010 3,034
Tangible Book Value Per Share (TCE / CSO) $62.58 $60.61 $60.07 $59.18 $57.66

Citigroup 1Q'16 4Q'15 3Q'15 2Q'15 1Q'15Reported Net Interest Revenue(2) $11,227 $11,463 $11,773 $11,822 $11,572
Impact of FX Translation - (131) (190) (415) (451)Net Interest Revenue in Constant Dollars(2) $11,227 $11,332 $11,583 $11,407 $11,121
34
Non-GAAP Financial Measures – Reconciliations($MM)
Note: Totals may not sum due to rounding. (1) Credit Valuation Adjustments (CVA) on derivatives (counterparty and own-credit), net of hedges; Funding Valuation Adjustments (FVA) on derivatives; and Debt Valuation
Adjustments (DVA) on Citigroup's fair value option liabilities (collectively, CVA / DVA). 1Q’16 reflects Citi’s early adoption on a prospective basis of the FASB’s ASU No. 2016-01, pursuant to which changes in DVA are reflected as a component of Accumulated Other Comprehensive Income; previously these amounts were recognized in Citigroup’s revenues and net income. For all periods prior to 1Q’16, adjusted results exclude the impact of CVA/DVA, as noted, consistent with previous presentations.
(2) NIR excludes the taxable equivalent adjustments (based on the U.S. federal statutory tax rate of 35%).
Citigroup 1Q'16 4Q'15 1Q'15Reported Revenues (GAAP) $17,555 $18,456 $19,736
Impact of CVA / DVA - (181) (73)Adjusted Revenues $17,555 $18,637 $19,809
Reported Net Income (GAAP) $3,501 $3,335 $4,770Impact of CVA / DVA - (114) (47)
Adjusted Net Income $3,501 $3,449 $4,817Preferred Dividends 210 265 128
Adjusted Net Income to Common $3,291 $3,184 $4,689
Average Assets ($B) $1,778 $1,784 $1,853
Adjusted ROA 0.79% 0.77% 1.05%
Average TCE $181,336 $178,981 $173,225
Adjusted RoTCE 7.3% 7.1% 11.0%
(1)
(1)

35
Non-GAAP Financial Measures – Reconciliations($B)
Note: Preliminary. Totals may not sum due to rounding.
Citigroup Assets 1Q'16 4Q'15 3Q'15 2Q'15 1Q'15Reported EOP Assets $1,801 $1,731 $1,808 $1,829 $1,832
Impact of FX Translation - 14 8 (14) (7)EOP Assets in Constant Dollars $1,801 $1,746 $1,817 $1,816 $1,824
Reported EOP Fed Funds Sold / Rev. Repos $225 $220 $232 $237 $239Impact of FX Translation - 2 1 (2) 1
EOP Fed Funds Sold / Rev. Repos in Constant Dollars $225 $222 $233 $235 $240
Reported EOP Trading Account Assets $274 $250 $267 $279 $303Impact of FX Translation - 3 1 (3) 0
EOP Trading Account Assets in Constant Dollars $274 $253 $268 $277 $303
Reported EOP Loans $619 $618 $622 $632 $621Impact of FX Translation - 4 2 (8) (8)
EOP Loans in Constant Dollars $619 $621 $624 $624 $613
Citigroup Liabilities 1Q'16 4Q'15 3Q'15 2Q'15 1Q'15Reported EOP Fed Funds Purch. / Repos $157 $146 $169 $177 $175
Impact of FX Translation - 1 0 (1) 1EOP Fed Funds Purch. / Repos in Constant Dollars $157 $148 $169 $176 $176
Reported EOP Trading Account Liabilities $136 $118 $126 $136 $142Impact of FX Translation - 2 1 (1) 2
EOP Trading Account Liabilities in Constant Dollars $136 $119 $127 $136 $144
Reported EOP Deposits $935 $908 $904 $908 $900Impact of FX Translation - 6 2 (12) (9)
EOP Deposits in Constant Dollars $935 $914 $906 $896 $891
Citicorp 1Q'16 4Q'15 3Q'15 2Q'15 1Q'15Reported EOP Loans $573 $569 $563 $568 $554
Impact of FX Translation - 3 2 (7) (7)EOP Loans in Constant Dollars $573 $572 $565 $561 $547
Reported EOP Deposits $925 $898 $894 $896 $884Impact of FX Translation - 6 3 (10) (8)
EOP Deposits in Constant Dollars $925 $903 $896 $886 $876


![03 Global Fixed Income Strategy...3| 2020 글로벌자산배분 MiraeAsset Daewoo Research [요약] Global Fixed Income Strategy 자료: 미래에셋대우리서치센터 소순환사이클개선확인,](https://img.pdfslide.tips/doc/110x75/5e2806abe3475652ca28e76c/03-global-fixed-income-strategy-3-2020-eeoeeoeee-miraeasset-daewoo.jpg)