Embed Size (px)
Citation preview
C C COMPREHENSIVEOMPREHENSIVEOMPREHENSIVE A A ANNUALNNUALNNUAL FFFINANCIALINANCIALINANCIAL R R REPORTEPORTEPORT
FFFISCALISCALISCAL Y Y YEAREAREAR E E ENDEDNDEDNDED S S SEPTEMBEREPTEMBEREPTEMBER 30, 2007 30, 2007 30, 2007
CCCITYITYITY OFOFOF N N NORTHORTHORTH P P PORTORTORT,,, FFFLORIDALORIDALORIDA

CCoommpprreehheennssiivvee AAnnnnuuaall
FFiinnaanncciiaall RReeppoorrtt
For the Fiscal Year Ended
September 30, 2007
CCIITTYY OOFF NNOORRTTHH PPOORRTT,, FFLLOORRIIDDAA
PPrreeppaarreedd bbyy tthhee FFiinnaannccee DDeeppaarrttmmeenntt
TTeerrrrii AA.. GGoouulldd,, DDiirreeccttoorr
CITY OF NORTH PORT, FLORIDACOMPREHENSIVE ANNUAL FINANCIAL REPORT
FOR THE FISCAL YEAR ENDED SEPTEMBER 30, 2007
TABLE OF CONTENTS
INTRODUCTORY SECTION Page
Letter of Transmittal……………………………………………………………………………… i-iv
Certificate of Achievement……………………………………………………………………… v
List of Principal Officers………………………………………………………………………… vi
Organization Chart……………………………………………………………………………… vii
FINANCIAL SECTION
Independent Auditor's Report…………………………………………………………………… 1-2
Management's Discussion and Analysis……………………………………………………… 3A-3L
Basic Financial Statements:
Government-wide Financial Statements: Statement of Net Assets………………………………………………………………… 6 Statement of Activities…………………………………………………………………… 7-8
Fund Financial Statements:
Balance Sheet - Governmental Funds………………………………………………… 9-10
Reconciliation of the Governmental Funds Balance Sheet to the Statement of Net Assets………………………………………………………… 12
Statement of Revenues, Expenditures and Changes in Fund Balances - Governmental Funds…………………………………………………… 13-14
Reconciliation of the Statement of Revenues, Expenditures and Changes in Fund Balances of Governmental Funds to the Statement of Activities………………………………………………… 15
Statement of Net Assets - Proprietary Fund…………………………………………… 16
Statement of Revenues, Expenses and Changes in Fund Net Assets - Proprietary Fund…………………………………………………………… 17
Statement of Cash Flows - Proprietary Fund………………………………………… 18-19
Statement of Fiduciary Net Assets - Fiduciary Funds………………………………… 20
CITY OF NORTH PORT, FLORIDACOMPREHENSIVE ANNUAL FINANCIAL REPORT
FOR THE FISCAL YEAR ENDED SEPTEMBER 30, 2007
TABLE OF CONTENTS
FINANCIAL SECTION (continued) Page
Statement of Changes in Fiduciary Net Assets - Fiduciary Funds………………. 21
Notes to the Financial Statements………………………………………………………… 22-55
Required Supplementary Information:
Budgetary Comparison Schedules - General Fund and Major Special Revenue Funds:
General Fund………………………………………………………………….……… 57-58 Road and Drainage District Special Revenue Fund……………………………… 59 Fire Rescue District Special Revenue Fund……………………………………… 60 Solid Waste District Special Revenue Fund……………………………………… 61 Escheated Lots - Roads Special Revenue Fund………………………………… 62 Transportation Impact Fees Special Revenue Fund……………………………… 63
GASB Statements 25 and 27 Pension Trust Information………………………………… 64-67
Combining and Individual Fund Statements and Schedules:
Combining Balance Sheet - Nonmajor Governmental Funds…………………………… 69-72
Combining Statement of Revenues, Expenditures and Changes in Fund Balances - Nonmajor Governmental Funds………………………………… 73-76
Budgetary Comparison Schedules:
Inspector Education Special Revenue Fund…………………………………………… 77 Police Education Special Revenue Fund……………………………………………… 78 Tree Replacement Special Revenue Fund…………………………………………… 79 Escheated Lots - Land and Future Projects Special Revenue Fund…………….. 80 Escheated Lots - Parks Special Revenue Fund……………………….……………… 81 Law Enforcement Impact Fees Special Revenue Fund……………………………… 82 Fire Impact Fees Special Revenue Fund……………………………………………… 83 Parks and Recreation Impact Fees Special Revenue Fund………………………… 84 Solid Waste Impact Fees Special Revenue Fund…………………………………… 85 General Government Impact Fees Special Revenue Fund………………………… 86 Building Department Special Revenue Fund………………………………………… 87 Fleet Maintenance Special Revenue Fund…………………………………………… 88 Environmental Management Special Revenue Fund………………………………… 89 One Cent Sales Tax Capital Projects Fund…………………………………………… 90 Municipal Buildings Construction Capital Projects Fund…………………………… 91
Combining Statement of Plan Net Assets - Fiduciary Funds…………………………… 93
CITY OF NORTH PORT, FLORIDACOMPREHENSIVE ANNUAL FINANCIAL REPORT
FOR THE FISCAL YEAR ENDED SEPTEMBER 30, 2007
TABLE OF CONTENTS
FINANCIAL SECTION (continued) Page
Combining Statement of Changes in Plan Net Assets - Fiduciary Funds…………… 94
Combining Statement of Changes in Assets and Liabilities - Agency Funds………………………….……………………………….………………… 95
STATISTICAL SECTION
Net Assets by Component - Last Five Fiscal Years……………………………………… 97
Changes in Net Assets - Last Five Fiscal Years…………………………………...…… 98-99
Fund Balances of Governmental Funds - Last Ten Fiscal Years……………………… 100
Changes in Fund Balances, Governmental Funds - Last Ten Fiscal Years……………….……………….……………….…………………………… 101-102
Assessed Value and Actual Value of Taxable Property - Last Eight Fiscal Years……………….……………….……………….…………………………… 103
Direct and Overlapping Property Tax Rates - Last Ten Fiscal Years……………….……………….……………….…………………………… 104
Principal Property Tax Payers - Current Year and Nine Years Ago…………...……. 105
Property Tax Levies and Tax Collections - Last Ten Fiscal Years…………...……… 106
Ratios of Outstanding Debt by Type - Last Ten Fiscal Years…………..……...…….. 107
Ratios of General Bonded Debt Outstanding - Last Four Fiscal Years…..………. 108
Direct and Overlapping Governmental Activities Debt…………………………………… 109
Legal Debt Margin Information…………………………………………………..………… 110
Pledged-Revenue Coverage - Last Ten Fiscal Years…………………………………… 111
Demographic and Economic Statistics - Last Ten Calendar Years……………….……………….……………….………………………… 112
Principal Employers - Current Year and Nine Years Ago…...……………………..…… 113
CITY OF NORTH PORT, FLORIDACOMPREHENSIVE ANNUAL FINANCIAL REPORT
FOR THE FISCAL YEAR ENDED SEPTEMBER 30, 2007
TABLE OF CONTENTS
STATISTICAL SECTION (continued) Page
Full-time Equivalent City Government Employees by Function/Program - Last Ten Fiscal Years……………………….…………...……………………………… 114
Operating Indicators by Function/Program - Last Ten Fiscal Years……………….. 115
Capital Asset Statistics by Function/Program - Last Ten Fiscal Years…………… 116
City of North Port 4970 City Hall Boulevard
North Port, Florida 34286-4100 (941) 429-7000
www.cityofnorthport.com
August 1, 2008 To the Members of the City Commission and Citizens of the City of North Port, Florida: We are pleased to submit the Comprehensive Annual Financial Report (CAFR) of the City of North Port, Florida (the City) for the fiscal year ended September 30, 2007. The purpose of this report is to provide City Commission, citizens, financial institutions and others with detailed information concerning the financial condition and performance of the City of North Port. This report meets Florida Statute requirements that each local government entity publish within twelve months of the close of each fiscal year a complete set of financial statements presented in conformity with generally accepted accounting principles (GAAP) and audited in accordance with generally accepted auditing standards by a firm of licensed independent certified public accountants. In addition, the audit was also designed to meet the requirements of the Florida Single Audit Act. This report consists of management’s representations concerning the finances of the City of North Port. Consequently, management assumes full responsibility for the completeness and reliability of all the information presented in this report. To provide a reasonable basis for making these representations, management of the City has established a comprehensive internal control framework that is designed both to protect the City’s assets from loss, theft, or misuse, and to compile sufficient reliable information for the preparation of the City’s financial statements in conformity with GAAP. The City of North Port has designed internal controls to provide reasonable, not absolute, assurance that the financial statements are free from any material misstatement. The concept of reasonable assurance recognizes that: (1) the cost of control should not exceed the benefits likely to be derived; and (2) that the evaluation of the costs and benefits requires estimates and judgments by management. We believe the data, as presented, is accurate in all material respects, that it is presented in a manner designed to fairly set forth the financial position and the results of operations of the City, and that all disclosures necessary to enable the reader to obtain a comprehensive understanding of the City’s financial activity have been included. The City’s financial statements for the year ended September 30, 2007 have been audited by CPA Associates, a firm of licensed certified public accountants. The audit involved examining, on a test basis, evidence supporting the amounts and disclosures in the financial statements, assessing the accounting principles used and significant estimates made by management, and evaluating the overall financial statement presentation. In addition to meeting the requirements of the state statutes, the audit was also designed to meet the requirements of the Florida Single Audit Act. The independent auditor’s report on the basic financial statements and combining and individual fund statements and the schedules is presented as the first component of the
financial section. The independent auditor’s report related specifically to the single audit is included in a separate single audit report. Profile of the City The City of North Port was incorporated on June 18, 1959. The City is managed under a Commission-City Manager form of government. The legislative and governing body of the City, led by a Commission Chairperson, consists of five elected citizens who are qualified voters in the City. Each commissioner is elected to a four year staggered term. There is a limit of two consecutive terms that any commissioner may serve. The Commission appoints the City Manager, who is the chief administrative officer of the City and directs the business of the City and its various departments. The Commission determines policy, adopts legislation, approves the City’s budget, sets taxes and fees, and appoints the City Auditor, City Clerk, Deputy City Clerk and the City Attorney. The City of North Port provides a range of municipal services. The public safety operation includes police and fire protection, as well as building, code enforcement and zoning. Recreational services include neighborhood parks, skate park facility and a recreational center. Public Works provides essential street and highway maintenance, drainage, traffic signalization, landscape maintenance, as well as solid waste collection. The Public Utilities provides water and sewer service and reuse water for irrigation. Other services provided include planning, engineering, economic development, as well as general administrative services. The annual budget serves as the foundation for the City’s financial planning and control. All departments of the City are required to submit requests for appropriation to the City Manager each year. The City Manager uses these requests as the starting point for developing a recommended budget. The City Manager then presents this proposed budget to the Commission for review during the month of June. The Commission is required to hold public hearings on the proposed budget and adopt a final budget no later than September 30, the close of the City of North Port’s fiscal year. The appropriated budget is prepared by fund, function and department. Budget-to-actual comparisons are provided in this report for each individual governmental fund for which an appropriated annual budget has been adopted. For the General Fund and major special revenue funds, the comparisons are presented as part of the required supplementary information. The other governmental budget-to-actual presentations are presented in the combining and individual fund subsection. Local Economy The City of North Port is the southernmost city in Sarasota County, midway between the cities of Sarasota and Fort Myers, near the Gulf of Mexico. The City is comprised of 103 square miles and 813 miles of paved road and has 95 miles of freshwater canals. As of the 2008 census data, North Port is Sarasota County’s largest municipality in population.
The population of North Port has steadily increased over the past five years from 27,448 in 2002 to an estimated 53,732 in 2007. In conjunction with the population growth, the taxable value on the real property increased 14.1% during the year. This trend in growth has slowed considerably
ii
as the housing market in the state and nation continues to experience down turns. In Sarasota County, housing prices have fallen an estimated 18% which may impact the upcoming fiscal year operations.
For the fiscal year ended 2006-07, the City decreased the tax rate to 2.9805 mills. Local taxes make up approximately 62% of the General Fund revenues, excluding transfers and fund balance.
Long-term Financial Planning The City of North Port’s Capital Improvement Program (CIP) consists of capital projects that reflect the City’s infrastructure needs over a five-year time frame and includes assets with long term value, such as buildings, roads, bridges and parks. The CIP not only includes on-going capital requirements but also includes capital additions that are necessary to comply with the Growth Management Act of 1985, as amended. The Growth Management Act requires the adoption of the Comprehensive Plan, which details the additional infrastructure necessary to handle project population increases. The CIP differentiates these capital projects from those of an on-going nature by designating them as level of service projects. The primary objective of the City’s investment program is the preservation of capital. Investment transactions are managed so as to avoid loss of principal, whether by security default or by erosion of market value. Generally, a minimum amount of operating capital is kept at the local bank, which also provides compensating balances for services. An overnight repurchase arrangement is used to earn interest on the local funds. The remainders of our funds are invested according to the City’s investment policy, which is adopted by the Commission and can only be amended by the Commission. Additionally, the General Fund, dependent special district funds and enterprise funds seek to maintain a 20% reserve of annual expenditure budget in its fund balance. These reserves are designed to be used in the event of significant financial emergency. Appropriations of fund balances may be set aside for specific purposes, such as capital projects, for known significant future cost items or one-time, non-recurring expenditures and are not to be used for operating purposes. For operating budgets, the fund balance shall be maintained such that emergency needs may be met and sufficient funds are available to operate before tax proceeds are received. Major Initiatives
Expansion of Sumter Blvd. and Toledo Blade Blvd. to four-lane roads in order to maintain the adopted transportation level of service.
Construction of several pedestrian bridges. Building of three new fire stations to meet the City’s public safety needs. Construction of a Social Services building. Garden of the Five Senses Park. Construction of a community park east of Toledo Blade Blvd. Expansion of waste water treatment plant.
iii
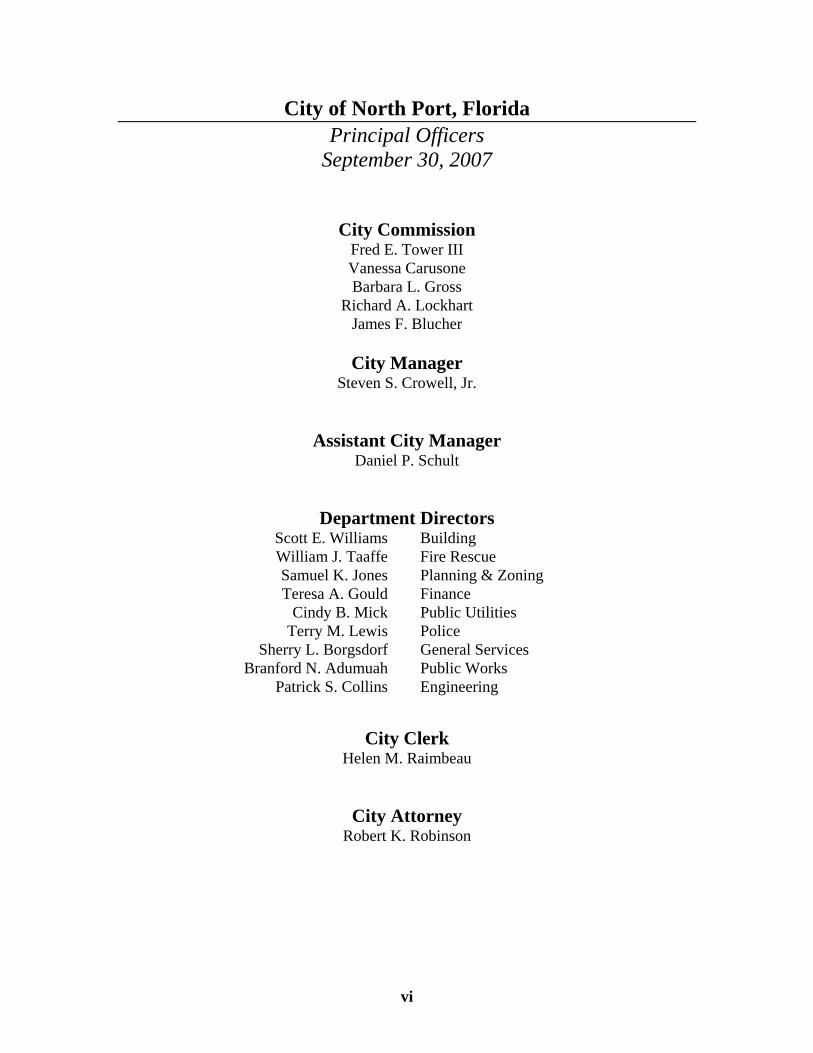
City of North Port, Florida Principal Officers
September 30, 2007
vi
City Commission Fred E. Tower III Vanessa Carusone Barbara L. Gross
Richard A. Lockhart James F. Blucher
City Manager
Steven S. Crowell, Jr.
Assistant City Manager Daniel P. Schult
Department Directors Scott E. Williams Building William J. Taaffe Fire Rescue Samuel K. Jones Planning & Zoning Teresa A. Gould Finance
Cindy B. Mick Public Utilities Terry M. Lewis Police
Sherry L. Borgsdorf General Services Branford N. Adumuah Public Works
Patrick S. Collins Engineering
City Clerk Helen M. Raimbeau
City Attorney Robert K. Robinson

City of North Port, FloridaOrganization ChartSeptember 30, 2007
vii
CITIZENS OF NORTH PORT
CITY COMMISSIONERS
CITY ATTORNEY CITY AUDITOR CITY MANAGER CITY CLERK
BUILDING POLICE
PUBLIC WORKS GENERAL SERVICES
FINANCE PUBLIC UTILITIES
ENGINEERING PLANNING & ZONING
FIRE RESCUE

City of North Port
viii

City of North Port, Florida Management’s Discussion and Analysis September 30, 2007
3-A
Management’s Discussion and Analysis As management of the City of North Port (the “City”), we offer readers of the City’s financial statements this narrative overview and analysis of the financial activities of the City for the fiscal year ended September 30, 2007. We encourage readers to consider the information presented here in conjunction with additional information that we have furnished in our letter of transmittal, which can be found on pages i-iv of this report and the City’s financial statements beginning on page 6. Financial Highlights
• The assets of the City exceeded its liabilities at the close of the most recent fiscal year by $362,119,545 (net assets). Of this amount, $68,743,563 (unrestricted net assets) may be used to meet the government’s ongoing obligations to citizens and creditors.
• Total net assets increased by $140,769,495, due mainly to the restatement of beginning
net assets in the amount of $108,767,430 for GASB 34 infrastructure.
• As of the close of the current fiscal year, the City’s governmental funds reported combined ending fund balances of $119,079,633, an increase of $6,068,147 in comparison with the prior year. Approximately 98% of this total amount, $117,072,500, is available for spending at the City’s discretion within the specified purposes of the individual governmental funds (unreserved fund balance).
• At the end of the current fiscal year, unreserved fund balance for the general fund was
$24,479,688 or 73% of total general fund expenditures.
• Excluding the special item escheated lots revenue of $32.9 million received in fiscal year 2006, total governmental activities revenues increased $15,087,266, or 19% in comparison to the prior year.
• Total governmental activities expenses increased $21,434,398, or 44% in comparison to
the prior year. Overview of the Financial Statements This discussion and analysis is intended to serve as an introduction to the City’s basic financial statements. The City’s basic financial statements are comprised of three components: 1) government-wide financial statements, 2) fund financial statements, and 3) notes to the financial statements. This report also contains other supplementary information in addition to the basic financial statements themselves. Government-wide financial statements. The government-wide financial statements are designed to provide readers with a broad overview of the City’s finances, in a manner similar to private-sector financial statements. The Statement of Net Assets presents information on all the City’s assets and liabilities, with the difference between the two reported as net assets. Over time, increases or decreases in net assets
City of North Port, Florida Management’s Discussion and Analysis September 30, 2007
3-B
may serve as a useful indicator of whether the financial position of the City is improving or deteriorating. The Statement of Activities presents revenue and expenses and shows how the government’s net assets changed during the most recent fiscal year. All changes in net assets are reported in a manner similar to the approach used by private sector business in that revenues are recognized when earned or established criteria are satisfied and expenses are reported when incurred. Accordingly, revenues are reported even when they may not be collected for several months after the end of the accounting period and expenses are recorded even though they may not have used cash during the current period. Both of the government-wide financial statements distinguish functions of the City that are principally supported by taxes and intergovernmental revenues (governmental activities) from other functions that are intended to recover all or a significant portion of their costs through user fees and charges (business-type activities). The governmental activities of the City include general government, public safety, physical environment, transportation, culture and recreation, human services and economic environment. The business-type activities of the City include the water and sewer utilities. The City’s government-wide financial statements can be found on pages 6-8 of this report. Fund Financial Statements. A fund is a grouping of related accounts that is used to maintain control over resources that have been segregated for specific activities or objectives. The City of North Port, like other state and local governments, uses fund accounting to ensure and demonstrate compliance with finance-related legal requirements. All of the funds of the City can be divided into three categories: governmental funds, proprietary funds, and fiduciary funds. Governmental Funds. Governmental funds are used to account for essentially the same functions reported as governmental activities in the government-wide financial statements. However, unlike the government-wide financial statements, governmental fund financial statements focus on near-term inflows and outflows of spendable resources, as well as on balances of spendable resources available at the end of the fiscal year. Such information may be useful in evaluating a government’s near-term financing requirements. Because the focus of governmental funds is narrower than that of the government-wide financial statements, it is useful to compare the information presented for governmental funds with similar information presented for governmental activities in the government-wide financial statements. By doing so, readers may better understand the long-term impact of the government’s near-term financing decisions. Both the governmental fund balance sheet and the governmental fund statement of revenues, expenditures, and changes in fund balances provide a reconciliation to facilitate this comparison between governmental funds and governmental activities. The City of North Port maintains many individual governmental funds. Information is presented separately in the governmental fund balance sheet and in the governmental fund statement of revenues, expenditures, and changes in fund balances for the General Fund, the Road and Drainage District Special Revenue Fund, the Fire Rescue District Special Revenue Fund, the Solid Waste District Special Revenue Fund, the Escheated Lots - Roads Special Revenue Fund, the Transportation Impact Fees Special Revenue Fund and the One Cent Sales Tax Capital Projects Fund, all of which are considered to be major funds. Data from the remaining

City of North Port, Florida Management’s Discussion and Analysis September 30, 2007
3-C
governmental funds are combined in a single, aggregated presentation. Individual fund data for each of these nonmajor governmental funds is provided in the form of combining statements elsewhere in this report. The City adopts an annual budget as described in Note B to the financial statements. A budgetary comparison statement has been provided for the General Fund and each major special revenue fund with a legally adopted budget in order to demonstrate compliance with this budget. Budgetary comparison schedules for nonmajor governmental funds and major capital projects funds are presented in the combining and individual fund statements and schedules section elsewhere in this report. The basic governmental fund financial statements can be found on pages 9-15 of this report. Proprietary Funds. The City maintains one type of proprietary fund. An enterprise fund is used to report the same functions presented as business-type activities in the government-wide financial statements. The City uses an enterprise fund to account for its Water and Sewer Utilities. Proprietary funds provide the same type of information as reported as business-type activities in the government-wide financial statements, only in more detail. The proprietary fund financial statements provide information for the Water and Sewer Utility System, which is considered to be a major fund of the City. The basic proprietary fund financial statements can be found on pages 16-19. Fiduciary Funds. Fiduciary funds are used to account for resources held for the benefit of parties outside the government. Fiduciary funds are not reflected in the government-wide financial statements because the resources of those funds are not available to support the City’s own programs. The accounting used for fiduciary funds is much like that used for proprietary funds. The fiduciary fund financial statements can be found on pages 20-21 of this report. Notes to the Financial Statements. The notes provide additional information that is essential to a full understanding of the data provided in the government-wide and fund financial statements. The notes to the financial statements can be found on pages 22-55 of this report. Other information. In addition to the basic financial statements and accompanying notes, this report also presents certain required and other supplementary information. Required and other supplementary information can be found on pages 57-95 of this report. Government-wide Financial Analysis As noted earlier, net assets may serve over time as a useful indicator of a government’s financial position. Assets exceeded liabilities by $362,119,545 at the close of the most recent fiscal year for the City of North Port.
City of North Port, Florida Management’s Discussion and Analysis September 30, 2007
3-D
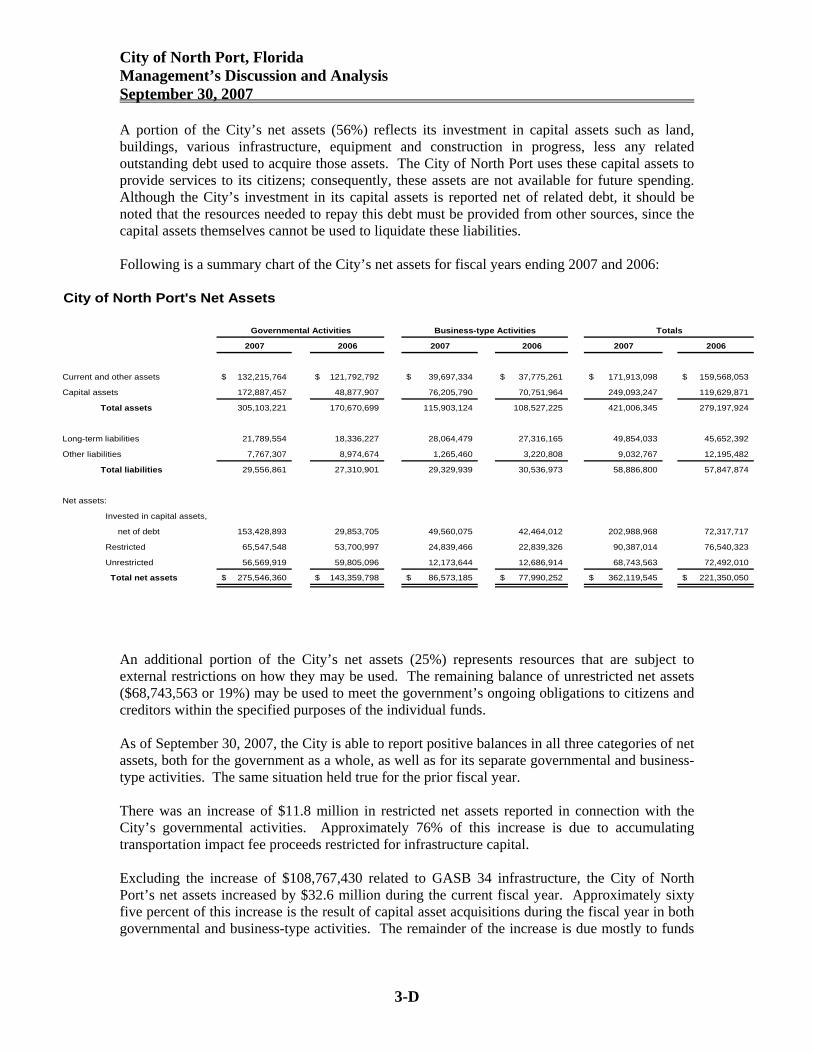
A portion of the City’s net assets (56%) reflects its investment in capital assets such as land, buildings, various infrastructure, equipment and construction in progress, less any related outstanding debt used to acquire those assets. The City of North Port uses these capital assets to provide services to its citizens; consequently, these assets are not available for future spending. Although the City’s investment in its capital assets is reported net of related debt, it should be noted that the resources needed to repay this debt must be provided from other sources, since the capital assets themselves cannot be used to liquidate these liabilities. Following is a summary chart of the City’s net assets for fiscal years ending 2007 and 2006:
2007 2006 2007 2006 2007 2006
Current and other assets 132,215,764$ 121,792,792$ 39,697,334$ 37,775,261$ 171,913,098$ 159,568,053$
Capital assets 172,887,457 48,877,907 76,205,790 70,751,964 249,093,247 119,629,871
Total assets 305,103,221 170,670,699 115,903,124 108,527,225 421,006,345 279,197,924
Long-term liabilities 21,789,554 18,336,227 28,064,479 27,316,165 49,854,033 45,652,392
Other liabilities 7,767,307 8,974,674 1,265,460 3,220,808 9,032,767 12,195,482
Total liabilities 29,556,861 27,310,901 29,329,939 30,536,973 58,886,800 57,847,874
Net assets:
Invested in capital assets,
net of debt 153,428,893 29,853,705 49,560,075 42,464,012 202,988,968 72,317,717
Restricted 65,547,548 53,700,997 24,839,466 22,839,326 90,387,014 76,540,323
Unrestricted 56,569,919 59,805,096 12,173,644 12,686,914 68,743,563 72,492,010
Total net assets 275,546,360$ 143,359,798$ 86,573,185$ 77,990,252$ 362,119,545$ 221,350,050$
Governmental Activities Business-type Activities Totals
City of North Port's Net Assets
An additional portion of the City’s net assets (25%) represents resources that are subject to external restrictions on how they may be used. The remaining balance of unrestricted net assets ($68,743,563 or 19%) may be used to meet the government’s ongoing obligations to citizens and creditors within the specified purposes of the individual funds. As of September 30, 2007, the City is able to report positive balances in all three categories of net assets, both for the government as a whole, as well as for its separate governmental and business-type activities. The same situation held true for the prior fiscal year. There was an increase of $11.8 million in restricted net assets reported in connection with the City’s governmental activities. Approximately 76% of this increase is due to accumulating transportation impact fee proceeds restricted for infrastructure capital. Excluding the increase of $108,767,430 related to GASB 34 infrastructure, the City of North Port’s net assets increased by $32.6 million during the current fiscal year. Approximately sixty five percent of this increase is the result of capital asset acquisitions during the fiscal year in both governmental and business-type activities. The remainder of the increase is due mostly to funds
City of North Port, Florida Management’s Discussion and Analysis September 30, 2007
3-E
accumulating (i.e. - ongoing revenues exceeding ongoing expenses) in the Transportation Impact Fees Fund, the One Cent Sales Tax Fund, and the Water & Sewer Utilities Fund. Governmental Activities. Governmental activities were responsible for $23,982,942 or 74% of the total increase in net assets as the result of current fiscal year activities.
• Property tax revenues increased by $1.8 million (13%) during the current fiscal year due to the increases in the number of developed properties and the increases in assessed property values.
• Charges for services increased by $1.7 million (5%) during the current fiscal year. This
increase mainly reflects the rising number of developed properties, thus an increase in District non-advalorem revenues collected.
• Capital grants and contributions revenues increased by $7.3 million (61%) primarily as a
result of a $6.4 million grant to four-lane a portion of Sumter Boulevard.
• The City had a $3.2 million (77%) increase of investment income during the fiscal year as cash balances available for investing increased along with investment return rates.
Expenditures in governmental activities increased approximately 44% overall, or $21.4 million. Over half of the increase is due to personnel costs increasing by $11 million, or 42%. There were two main reasons for the rise in expenses in comparison with the previous year. First, our growing City continued to hire additional employees to accommodate the increased need for City services. Secondly, fiscal year 2007 contained the first full year of salary increases that occurred as a result of a comprehensive pay plan study. The remainder of the overall increase in governmental expenditures is related to an increase in operating costs. This includes a $2.6 million increase in depreciation expense as we added our GASB 34 infrastructure assets in fiscal year 2007 and $5.4 million in increased transportation costs for a road rehabilitation program.
City of North Port, Florida Management’s Discussion and Analysis September 30, 2007
3-F
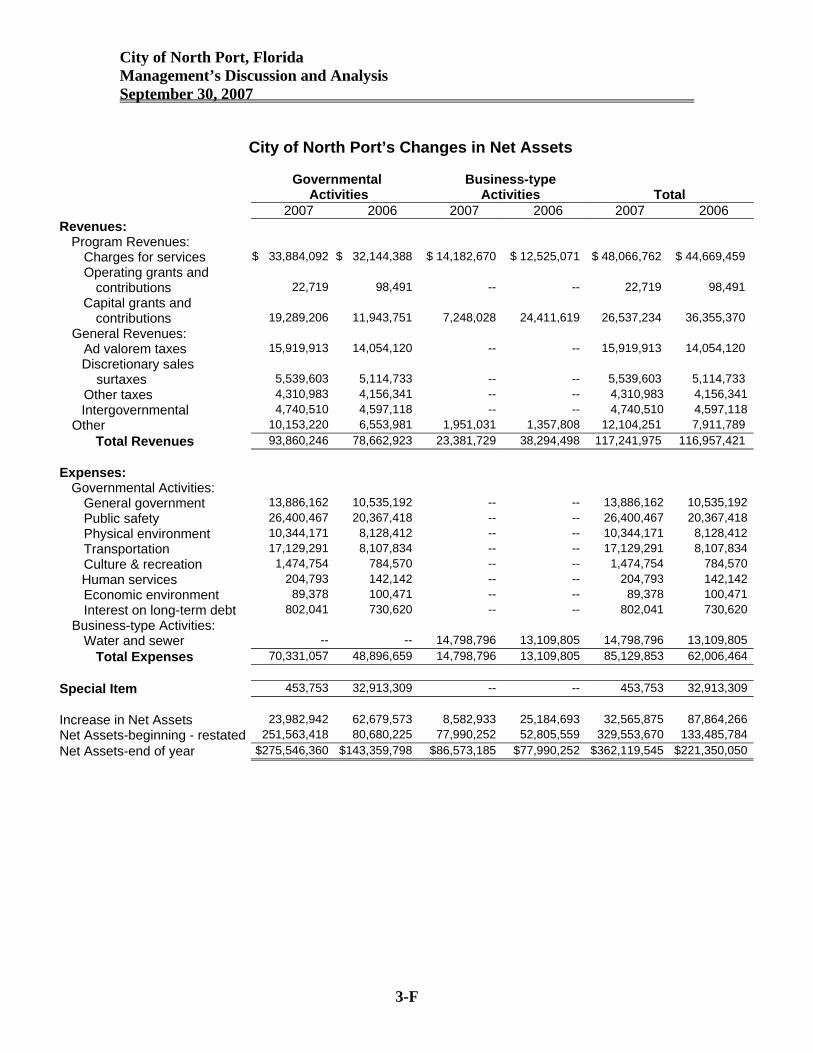
City of North Port’s Changes in Net Assets
Governmental
Activities Business-type
Activities
Total 2007 2006 2007 2006 2007 2006
Revenues: Program Revenues: Charges for services $ 33,884,092 $ 32,144,388 $ 14,182,670 $ 12,525,071 $ 48,066,762 $ 44,669,459 Operating grants and contributions 22,719 98,491 -- -- 22,719 98,491 Capital grants and contributions 19,289,206 11,943,751 7,248,028 24,411,619 26,537,234 36,355,370 General Revenues: Ad valorem taxes 15,919,913 14,054,120 -- -- 15,919,913 14,054,120
Discretionary sales surtaxes 5,539,603 5,114,733 -- -- 5,539,603 5,114,733 Other taxes 4,310,983 4,156,341 -- -- 4,310,983 4,156,341 Intergovernmental 4,740,510 4,597,118 -- -- 4,740,510 4,597,118 Other 10,153,220 6,553,981 1,951,031 1,357,808 12,104,251 7,911,789 Total Revenues 93,860,246 78,662,923 23,381,729 38,294,498 117,241,975 116,957,421 Expenses: Governmental Activities: General government 13,886,162 10,535,192 -- -- 13,886,162 10,535,192 Public safety 26,400,467 20,367,418 -- -- 26,400,467 20,367,418 Physical environment 10,344,171 8,128,412 -- -- 10,344,171 8,128,412 Transportation 17,129,291 8,107,834 -- -- 17,129,291 8,107,834 Culture & recreation 1,474,754 784,570 -- -- 1,474,754 784,570
Human services 204,793 142,142 -- -- 204,793 142,142 Economic environment 89,378 100,471 -- -- 89,378 100,471 Interest on long-term debt 802,041 730,620 -- -- 802,041 730,620 Business-type Activities: Water and sewer -- -- 14,798,796 13,109,805 14,798,796 13,109,805 Total Expenses 70,331,057 48,896,659 14,798,796 13,109,805 85,129,853 62,006,464 Special Item 453,753 32,913,309 -- -- 453,753 32,913,309 Increase in Net Assets 23,982,942 62,679,573 8,582,933 25,184,693 32,565,875 87,864,266Net Assets-beginning - restated 251,563,418 80,680,225 77,990,252 52,805,559 329,553,670 133,485,784Net Assets-end of year $275,546,360 $143,359,798 $86,573,185 $77,990,252 $362,119,545 $221,350,050
City of North Port, Florida Management’s Discussion and Analysis September 30, 2007
3-G
$0
$2,000,000
$4,000,000
$6,000,000
$8,000,000
$10,000,000
$12,000,000
$14,000,000
$16,000,000
$18,000,000
$20,000,000
$22,000,000
$24,000,000
$26,000,000
$28,000,000
Generalgovernment
Public safety Physicalenvironment
Transportation Culture andrecreation
Human services Economicenvironment
Interest on long-term debt
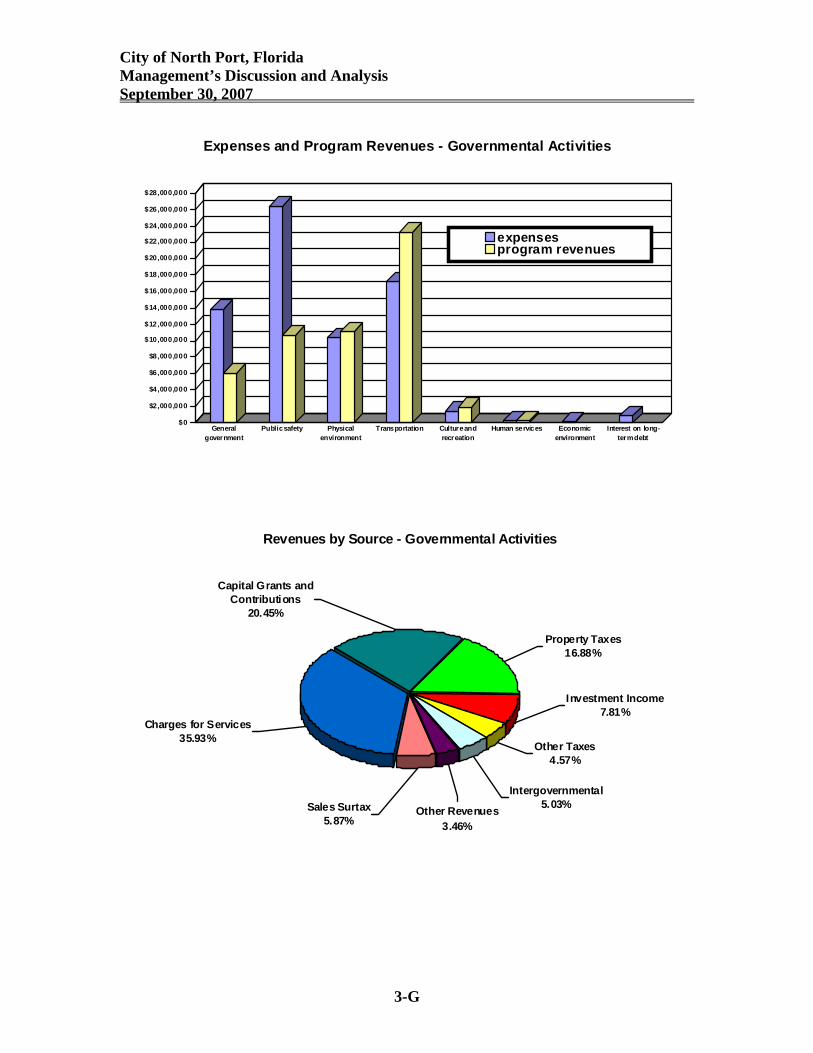
Expenses and Program Revenues - Governmental Activities
expensesprogram revenues
Revenues by Source - Governmental Activities
Intergovernmental5.03%Other Revenues
3.46%
Sales Surtax5.87%
Charges for Services35.93%
Capital Grants and Contributions
20.45%
Property Taxes16.88%
Investment Income7.81%
Other Taxes4.57%

City of North Port, Florida Management’s Discussion and Analysis September 30, 2007
3-H
Business-type Activities. Business-type activities increased the City’s net assets by $8,582,933, accounting for 26% of the total growth in the City’s net assets. Key elements causing the increase in the current year are:
• Impact fee revenues in the amount of $2.9 million were collected due to ongoing residential and commercial construction growth within the City.
• Operating revenues increased by 13%, which also reflects the continuing population and demand increases.
• Developer contributed assets in the amount of $4.2 million were capitalized during the fiscal year.
$0
$5,000,000
$10,000,000
$15,000,000
$20,000,000
$25,000,000
Water & Sewer Utilities
Expenses and Program Revenues - Business-type Activities
expenses
programrevenues
Revenues by Source - Business-type Activities
Charges for Services60.66%
Investment Income8.34%
Capital Grants and Contributions
31.00%
City of North Port, Florida Management’s Discussion and Analysis September 30, 2007
3-I
Financial Analysis of the City’s Funds As noted earlier, the City uses fund accounting to ensure and demonstrate compliance with finance-related legal requirements. Governmental funds. The focus of the City’s governmental funds is to provide information on near-term inflows, outflows and balances of spendable resources. Such information is useful in assessing the City’s financing requirements. In particular, unreserved fund balance may serve as a useful measure of a government’s net resources available for spending at the end of the fiscal year. At the end of the current fiscal year, the City’s governmental funds reported combined ending fund balances of $119,079,633, an increase of $6,068,147 in comparison with the prior year. Approximately 98% of this amount ($117,072,500) constitutes unreserved fund balance, which is available for spending at the City’s discretion, subject to budgetary constraints and within the specified purposes of the individual governmental funds. The remainder of the fund balance is reserved to indicate that it is not available for new spending because it has already been committed for: 1) advances due from other funds ($1,990,049), and 2) for inventory balances ($17,084). The General Fund is the chief operating fund of the City. At the end of the current fiscal year, unreserved fund balance of the General Fund was $24,479,688, while the total fund balance was $26,469,737. As a measure of the General Fund’s liquidity, it may be useful to compare both unreserved fund balance and total fund balance to total fund expenditures. Unreserved fund balance represents 73% of total General Fund expenditures, while total fund balance represents 79% of that same amount. The fund balance of the City’s General Fund decreased by $1,597,386 during the current fiscal year. Key factors for this decrease are:
• Licenses and permits revenue decreased by $4,031,994 due in part to the Building Fund being set up and also due to a general decrease in licenses and permits.
• Transfers out increased $2,273,131 due to the transfer of accumulated fund balance to set
up the Building and Tree funds. In the current year, the City transferred $26,000,000 from the Escheated Lots Fund into two new funds, the Escheated Lots – Roads received $18,000,000 and the Escheated Lots – Parks received $8,000,000. These funds will be used to pay for future projects. The Transportation Impact Fees fund balance increased by 27%, or $5.6 million, during the year. Revenues continue to exceed expenditures as many of the large scale road projects that will be constructed with these funds are in the design phase. Similar to the Transportation Impact Fee Fund, the One Cent Sales Tax Fund is accumulating revenues at a rate faster than project expenditures are being made. The fund balance increased $3.3 million to a year-end fund balance of approximately $16.3 million.
City of North Port, Florida Management’s Discussion and Analysis September 30, 2007
3-J
Proprietary funds. The fund financial statements for the City’s proprietary funds provide essentially the same type of information found in the business-type activities of the government-wide financial statements, but in a little more detail. Unrestricted net assets of the Water and Sewer Utilities decreased by $513,270 to $12.1 million at the end of the current fiscal year. Other factors concerning the finances of the proprietary funds have been addressed in the discussion of the City’s business-type activities. General Fund Budgetary Highlights During the current fiscal year there was a $5,597,093 increase in appropriations between the original and final amended budget. Following are the main components of the increase that were adopted using available fund balance:
• Transfers were made during the year of $2,279,131 to set up the Building Fund and the Tree Fund.
• The PBA contract was approved during the year with the police union resulting in an
increase in expenditures of $1,406,754.
• An increase of $500,000 was made for landscaping of the Toledo Blade Boulevard Project.
• The City is building a new social services building resulting in an increase of $400,000.
The favorable budget to actual variance of $1,794,838 in the Police Department is due to open positions that were budgeted for that was not filled. The favorable budget to actual variance of $2,533,839 in capital outlay is due to the entire project for the new Social Services building being budgeted in the current year and only $245,392 being spent. Capital Asset and Debt Administration Capital assets. The City’s investment in capital assets for its governmental and business-type activities as of September 30, 2007 amounts to $249,093,248 (net of accumulated depreciation). This investment in capital assets includes land, construction in process, buildings, improvements, various infrastructure, utility systems and equipment. The overall total increase in the City’s capital assets for the current fiscal year was 9% (a 9.7% increase for governmental activities and a 7.7% increase for business-type activities). Some of the major capital asset additions during the current fiscal year included the following:
• Infrastructure. • Traffic signals. • Sidewalks along various portions of Salford Blvd. • Numerous computer replacements within various departments. • Sumter Blvd. widening project (ongoing).
City of North Port, Florida Management’s Discussion and Analysis September 30, 2007
3-K
• Public Works dump trucks. • Excavator. • Refuse and recycle trucks. • Pedestrian bridges (ongoing).
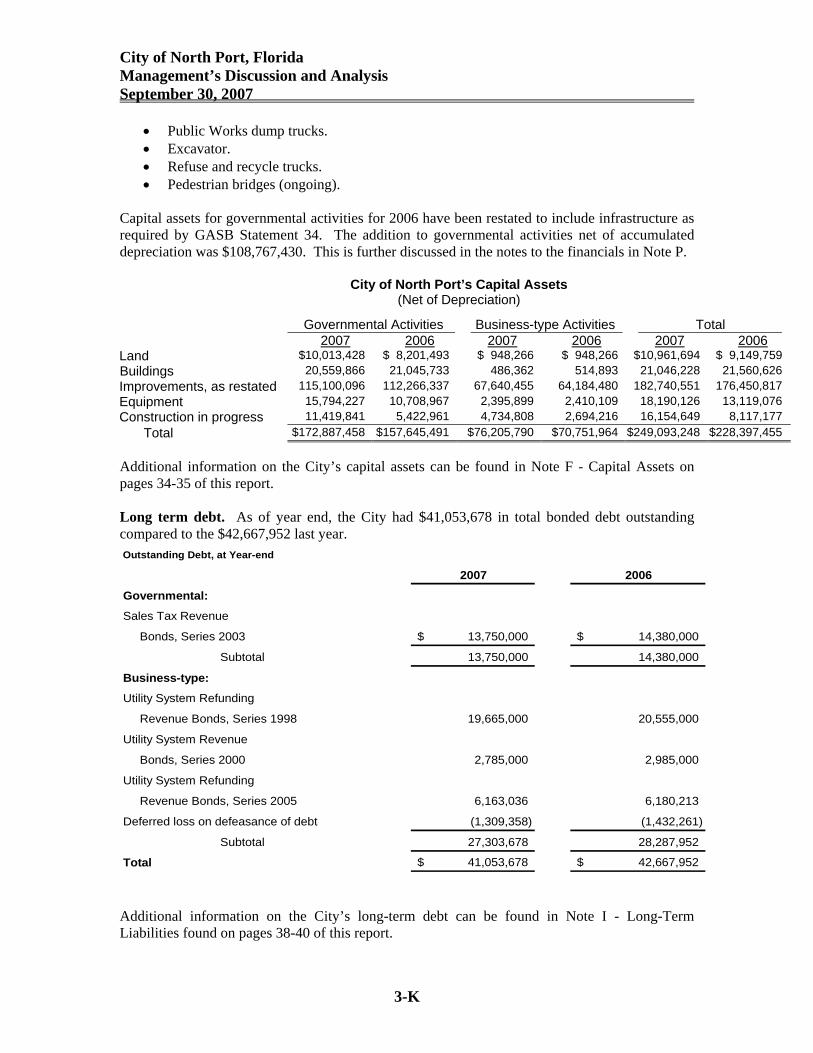
Capital assets for governmental activities for 2006 have been restated to include infrastructure as required by GASB Statement 34. The addition to governmental activities net of accumulated depreciation was $108,767,430. This is further discussed in the notes to the financials in Note P.
City of North Port’s Capital Assets (Net of Depreciation)
Governmental Activities Business-type Activities Total 2007 2006 2007 2006 2007 2006
Land $10,013,428 $ 8,201,493 $ 948,266 $ 948,266 $10,961,694 $ 9,149,759 Buildings 20,559,866 21,045,733 486,362 514,893 21,046,228 21,560,626 Improvements, as restated 115,100,096 112,266,337 67,640,455 64,184,480 182,740,551 176,450,817 Equipment 15,794,227 10,708,967 2,395,899 2,410,109 18,190,126 13,119,076 Construction in progress 11,419,841 5,422,961 4,734,808 2,694,216 16,154,649 8,117,177 Total $172,887,458 $157,645,491 $76,205,790 $70,751,964 $249,093,248 $228,397,455 Additional information on the City’s capital assets can be found in Note F - Capital Assets on pages 34-35 of this report. Long term debt. As of year end, the City had $41,053,678 in total bonded debt outstanding compared to the $42,667,952 last year. Outstanding Debt, at Year-end
2007 2006
Governmental:
Sales Tax Revenue
Bonds, Series 2003 13,750,000$ 14,380,000$
Subtotal 13,750,000 14,380,000
Business-type:
Utility System Refunding
Revenue Bonds, Series 1998 19,665,000 20,555,000
Utility System Revenue
Bonds, Series 2000 2,785,000 2,985,000
Utility System Refunding
Revenue Bonds, Series 2005 6,163,036 6,180,213
Deferred loss on defeasance of debt (1,309,358) (1,432,261)
Subtotal 27,303,678 28,287,952
Total 41,053,678$ 42,667,952$
Additional information on the City’s long-term debt can be found in Note I - Long-Term Liabilities found on pages 38-40 of this report.
City of North Port, Florida Management’s Discussion and Analysis September 30, 2007
3-L
Economic Factors and Next Year’s Budgets and Rates
• Sarasota County, the county that the City of North Port is located in, had an average unemployment rate of 5.9% during the current fiscal year. Unemployment rates exclusively for the City of North Port are not available. The Sarasota County unemployment rate is higher compared against unemployment rates for the State of Florida and the nation during the same time period.
• The General Fund property tax millage remained at 3.3 mills for fiscal year 2007 and was lowered by 0.3195 to 2.9805 mills for fiscal year 2008.
• The City’s population increased by 12.5% during fiscal year 2007 to approximately 53,732.
• The taxable value of real estate located in the City grew to $5.6 billion in the current fiscal year, which is an increase of over $600 million or 14.1% over the prior fiscal year.
• The construction industry in North Port, as in the rest of the state and country, has slowed down significantly. This has resulted in a reduction in the permits fees for the City.
• Subsequent to year-end, the State Board of Administration’s Local Government Surplus Funds Trust Fund and Investment Pool implemented a temporary freeze on investments. The City had over $73 million invested and when the funds were available, the City chose to pay a redemption fee of $678,290 to withdraw all available funds. See Note S for discussion of this event.
• Also subsequent to year-end, Constitutional Amendment 1 was passed by the voters in the state. This Amendment will become effective October 1, 2008 and will affect the taxes that the City will collect. See Note S for detailed discussion of the Amendment.
All of these factors were considered in preparing the City’s budget for the 2008 fiscal year. Financial Contact This financial report is designed to provide a general overview of the City’s finances for all those with an interest. Questions concerning any of the information provided in this report or requests for additional financial information may be addressed to:
City of North Port, Florida Finance Department
4970 City Hall Boulevard North Port, FL 34286-4100
Or visit our website:
http://www.cityofnorthport.com
4
BASIC
FINANCIAL STATEMENTS

City of North Port
5
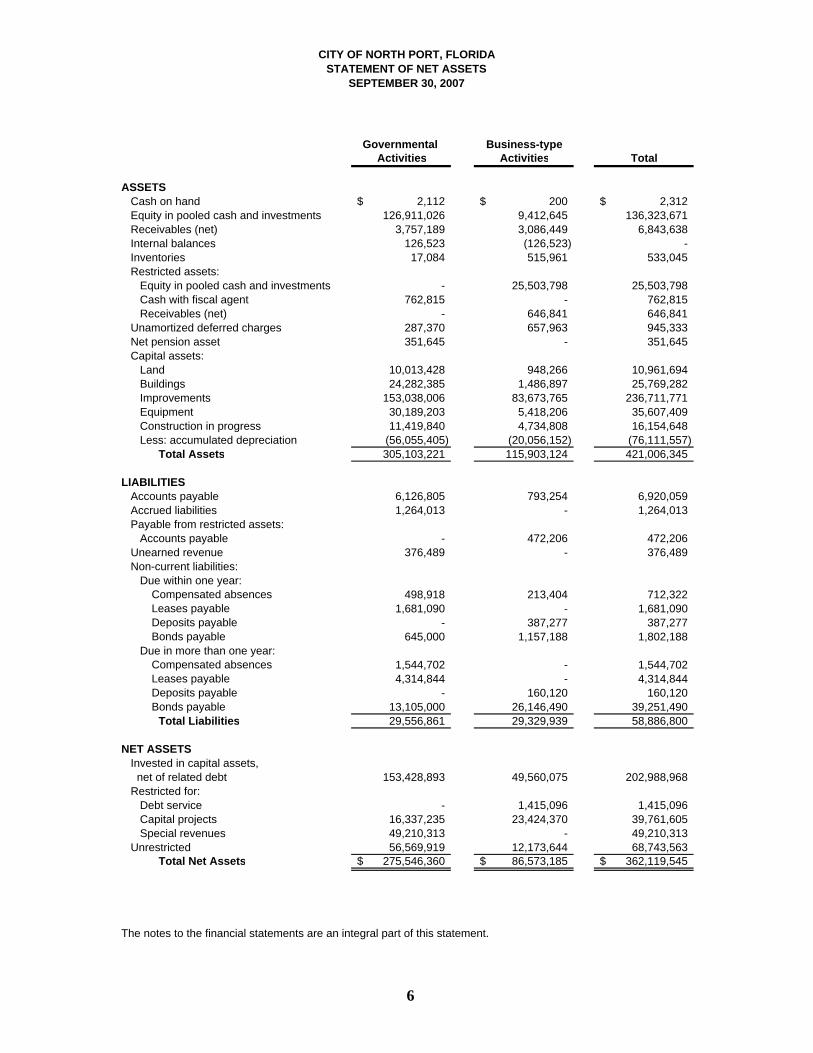
CITY OF NORTH PORT, FLORIDASTATEMENT OF NET ASSETS
SEPTEMBER 30, 2007
Governmental Business-typeActivities Activities Total
ASSETS Cash on hand 2,112$ 200$ 2,312$ Equity in pooled cash and investments 126,911,026 9,412,645 136,323,671 Receivables (net) 3,757,189 3,086,449 6,843,638 Internal balances 126,523 (126,523) - Inventories 17,084 515,961 533,045 Restricted assets: Equity in pooled cash and investments - 25,503,798 25,503,798 Cash with fiscal agent 762,815 - 762,815 Receivables (net) - 646,841 646,841 Unamortized deferred charges 287,370 657,963 945,333 Net pension asset 351,645 - 351,645 Capital assets: Land 10,013,428 948,266 10,961,694 Buildings 24,282,385 1,486,897 25,769,282 Improvements 153,038,006 83,673,765 236,711,771 Equipment 30,189,203 5,418,206 35,607,409 Construction in progress 11,419,840 4,734,808 16,154,648 Less: accumulated depreciation (56,055,405) (20,056,152) (76,111,557) Total Assets 305,103,221 115,903,124 421,006,345
LIABILITIES Accounts payable 6,126,805 793,254 6,920,059 Accrued liabilities 1,264,013 - 1,264,013 Payable from restricted assets: Accounts payable - 472,206 472,206 Unearned revenue 376,489 - 376,489 Non-current liabilities: Due within one year: Compensated absences 498,918 213,404 712,322 Leases payable 1,681,090 - 1,681,090 Deposits payable - 387,277 387,277 Bonds payable 645,000 1,157,188 1,802,188 Due in more than one year: Compensated absences 1,544,702 - 1,544,702 Leases payable 4,314,844 - 4,314,844 Deposits payable - 160,120 160,120 Bonds payable 13,105,000 26,146,490 39,251,490 Total Liabilities 29,556,861 29,329,939 58,886,800
NET ASSETS Invested in capital assets, net of related debt 153,428,893 49,560,075 202,988,968 Restricted for: Debt service - 1,415,096 1,415,096 Capital projects 16,337,235 23,424,370 39,761,605 Special revenues 49,210,313 - 49,210,313 Unrestricted 56,569,919 12,173,644 68,743,563 Total Net Assets 275,546,360$ 86,573,185$ 362,119,545$
The notes to the financial statements are an integral part of this statement.
6
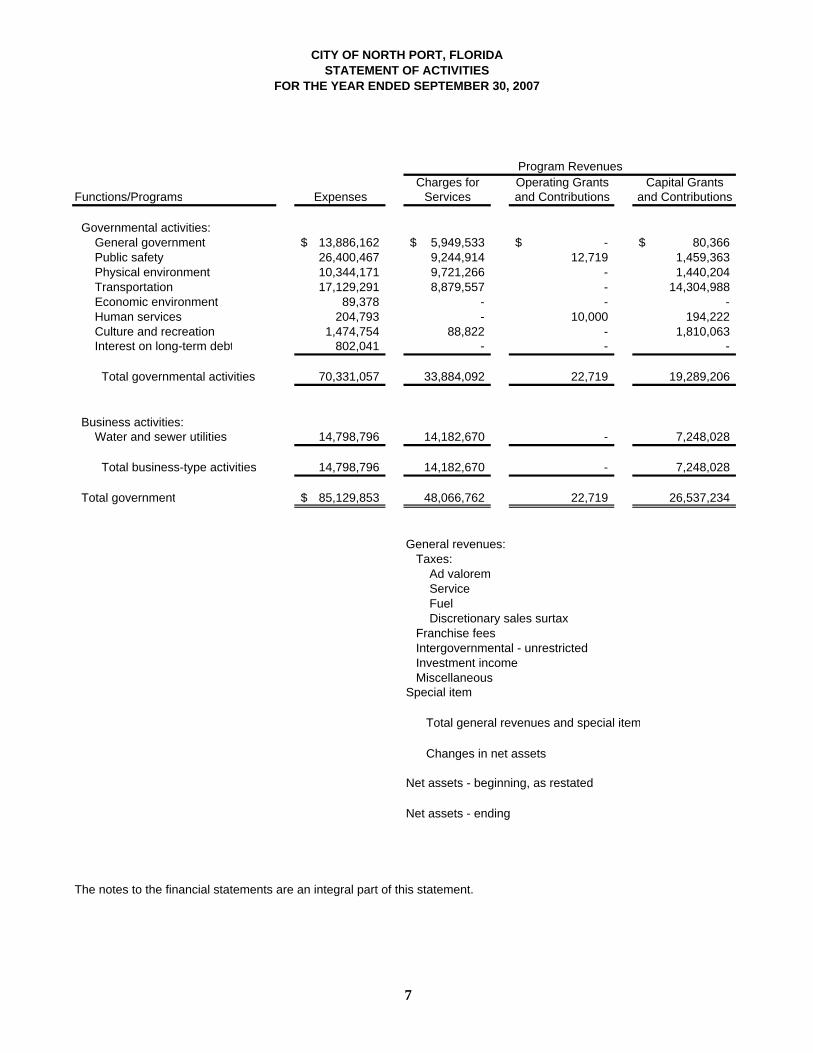
CITY OF NORTH PORT, FLORIDASTATEMENT OF ACTIVITIES
FOR THE YEAR ENDED SEPTEMBER 30, 2007
Charges for Operating Grants Capital GrantsFunctions/Programs Expenses Services and Contributions and Contributions
Governmental activities: General government 13,886,162$ 5,949,533$ -$ 80,366$ Public safety 26,400,467 9,244,914 12,719 1,459,363 Physical environment 10,344,171 9,721,266 - 1,440,204 Transportation 17,129,291 8,879,557 - 14,304,988 Economic environment 89,378 - - - Human services 204,793 - 10,000 194,222 Culture and recreation 1,474,754 88,822 - 1,810,063 Interest on long-term debt 802,041 - - -
Total governmental activities 70,331,057 33,884,092 22,719 19,289,206
Business activities: Water and sewer utilities 14,798,796 14,182,670 - 7,248,028
Total business-type activities 14,798,796 14,182,670 - 7,248,028
Total government 85,129,853$ 48,066,762 22,719 26,537,234
General revenues: Taxes: Ad valorem Service Fuel Discretionary sales surtax Franchise fees Intergovernmental - unrestricted Investment income MiscellaneousSpecial item
Total general revenues and special item
Changes in net assets
Net assets - beginning, as restated
Net assets - ending
The notes to the financial statements are an integral part of this statement.
Program Revenues
7
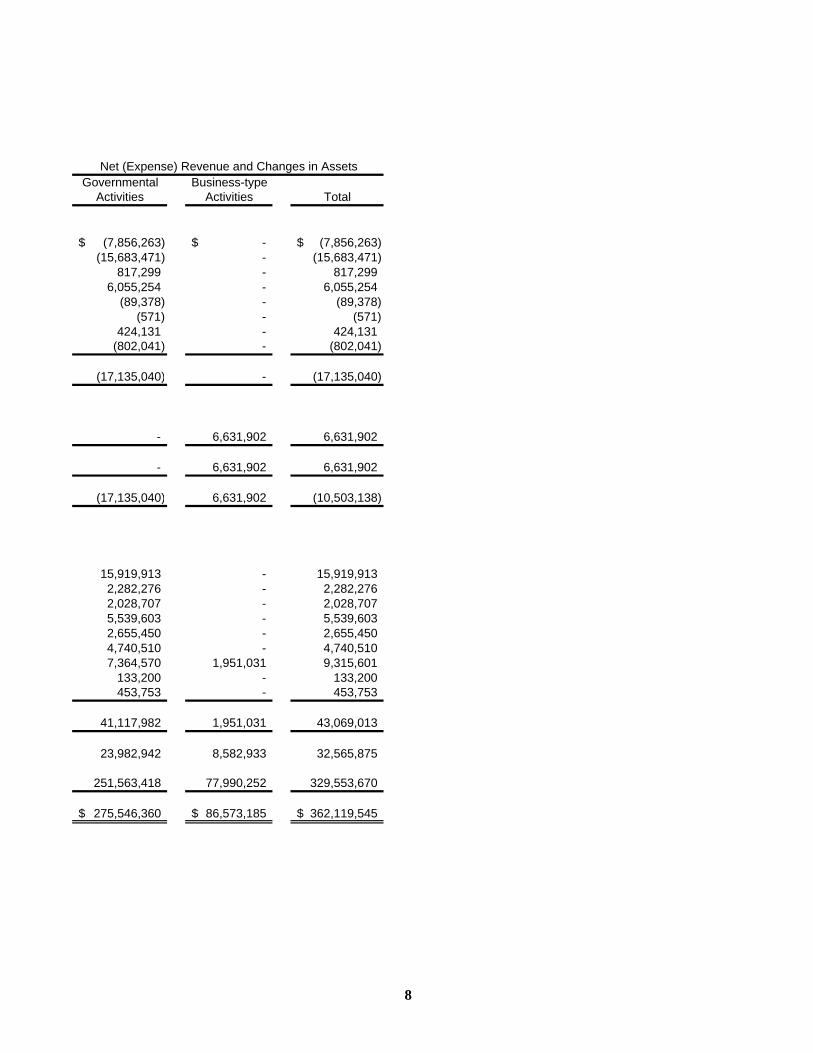
Governmental Business-typeActivities Activities Total
(7,856,263)$ -$ (7,856,263)$ (15,683,471) - (15,683,471)
817,299 - 817,299 6,055,254 - 6,055,254
(89,378) - (89,378) (571) - (571)
424,131 - 424,131 (802,041) - (802,041)
(17,135,040) - (17,135,040)
- 6,631,902 6,631,902
- 6,631,902 6,631,902
(17,135,040) 6,631,902 (10,503,138)
15,919,913 - 15,919,913 2,282,276 - 2,282,276 2,028,707 - 2,028,707 5,539,603 - 5,539,603 2,655,450 - 2,655,450 4,740,510 - 4,740,510 7,364,570 1,951,031 9,315,601
133,200 - 133,200 453,753 - 453,753
41,117,982 1,951,031 43,069,013
23,982,942 8,582,933 32,565,875
251,563,418 77,990,252 329,553,670
275,546,360$ 86,573,185$ 362,119,545$
Net (Expense) Revenue and Changes in Assets
8

CITY OF NORTH PORT, FLORIDABALANCE SHEET
GOVERNMENTAL FUNDSSEPTEMBER 30, 2007
General Fund
Road and Drainage District
Fire Rescue District
Solid Waste District
ASSETS:Cash on hand 2,062$ -$ 50$ -$ Equity in pooled cash and investments 24,869,577 9,286,833 3,860,797 1,898,337 Cash with fiscal agent - 727,449 - 35,366 Receivables (net of allowance for uncollectibles) 814,113 2,383 400 14,912 Note Receivable 220,886 - - - Due from other funds 2,139,495 500,000 - 74 Due from other governments 629,971 683,632 - - Inventories - - - - Advances to other funds 1,990,049 - - -
Total assets 30,666,153$ 11,200,297$ 3,861,247$ 1,948,689$
LIABILITIES:Accounts payable 748,491$ 743,756$ 47,441$ 244,320$ Due to other funds 1,919,054 159,755 123,779 40,992 Accrued liabilities 1,236,623 - - 27,390 Deferred revenue 292,248 504,723 - - Advances from other funds - - - 1,336,649
Total liabilities 4,196,416 1,408,234 171,220 1,649,351
FUND BALANCES:Reserved for: Inventories - - - - Advances to other funds 1,990,049 - - - Unreserved, reported in: General fund 24,479,688 - - - Special revenue funds - 9,792,063 3,690,027 299,338 Capital projects fund - - - -
Total fund balances 26,469,737 9,792,063 3,690,027 299,338
Total liabilities and fund balances 30,666,153$ 11,200,297$ 3,861,247$ 1,948,689$
The notes to the financial statements are an integral part of this statement.
9
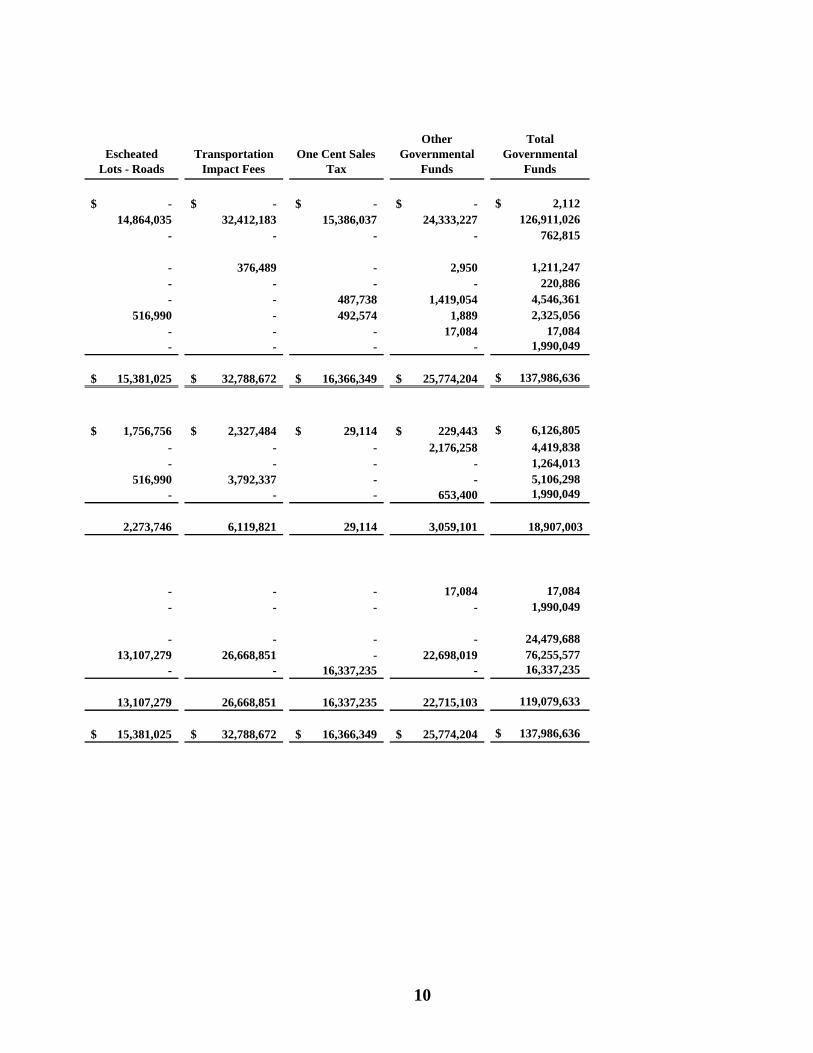
Escheated Lots - Roads
Transportation Impact Fees
One Cent Sales Tax
Other Governmental
Funds
Total Governmental
Funds
-$ -$ -$ -$ $ 2,112 14,864,035 32,412,183 15,386,037 24,333,227 126,911,026
- - - - 762,815
- 376,489 - 2,950 1,211,247 - - - - 220,886 - - 487,738 1,419,054 4,546,361
516,990 - 492,574 1,889 2,325,056 - - - 17,084 17,084 - - - - 1,990,049
15,381,025$ 32,788,672$ 16,366,349$ 25,774,204$ $ 137,986,636
1,756,756$ 2,327,484$ 29,114$ 229,443$ $ 6,126,805 - - - 2,176,258 4,419,838 - - - - 1,264,013
516,990 3,792,337 - - 5,106,298 - - - 653,400 1,990,049
2,273,746 6,119,821 29,114 3,059,101 18,907,003
- - - 17,084 17,084 - - - - 1,990,049
- - - - 24,479,688 13,107,279 26,668,851 - 22,698,019 76,255,577
- - 16,337,235 - 16,337,235
13,107,279 26,668,851 16,337,235 22,715,103 119,079,633
15,381,025$ 32,788,672$ 16,366,349$ 25,774,204$ $ 137,986,636
10
City of North Port
11

CITY OF NORTH PORT, FLORIDARECONCILIATION OF THE GOVERNMENTAL FUNDS BALANCE SHEET
TO THE STATEMENT OF NET ASSETSSEPTEMBER 30, 2007
Fund balances - total governmental funds 119,079,633$
Amounts reported for governmental activities in the statement of net assets are different because:
Capital assets used in governmental activities are not financial resources and therefore are not reported in the governmental funds. Governmental capital assets 228,942,862 Less accumulated depreciation (56,055,405) 172,887,457
Long-term liabilities, including bonds payable, are not due and payable in the current period and therefore are not reported in the governmental funds. Special revenue bonds (13,750,000) Leases payable (5,995,934) Compensated absences payable (2,043,620) Unamortized bond discount and issue costs 287,370 (21,502,184)
Certain deferred revenue in governmental funds is susceptible to full accrual on the entity-wide statements. 4,729,809
Net pension asset 351,645
Net assets of governmental activities 275,546,360$
The notes to the financial statements are an integral part of this statement.
12
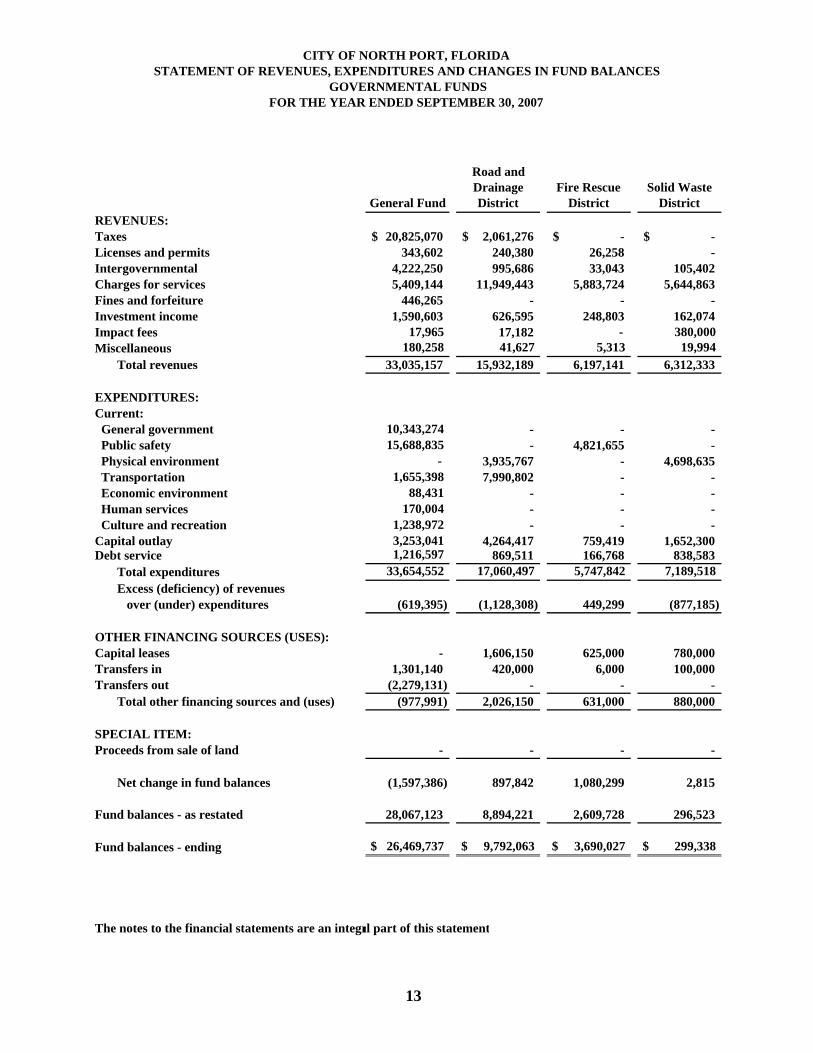
CITY OF NORTH PORT, FLORIDA STATEMENT OF REVENUES, EXPENDITURES AND CHANGES IN FUND BALANCES
GOVERNMENTAL FUNDSFOR THE YEAR ENDED SEPTEMBER 30, 2007
REVENUES:TaxesLicenses and permitsIntergovernmentalCharges for servicesFines and forfeitureInvestment incomeImpact feesMiscellaneous
Total revenues
EXPENDITURES:Current: General government Public safety Physical environment Transportation Economic environment Human services Culture and recreationCapital outlayDebt service
Total expendituresExcess (deficiency) of revenues over (under) expenditures
OTHER FINANCING SOURCES (USES):Capital leasesTransfers inTransfers out
Total other financing sources and (uses)
SPECIAL ITEM:Proceeds from sale of land
Net change in fund balances
Fund balances - as restated
Fund balances - ending
The notes to the financial statements are an integr
General Fund
Road and Drainage District
Fire Rescue District
Solid Waste District
20,825,070$ 2,061,276$ -$ -$ 343,602 240,380 26,258 -
4,222,250 995,686 33,043 105,402 5,409,144 11,949,443 5,883,724 5,644,863
446,265 - - - 1,590,603 626,595 248,803 162,074
17,965 17,182 - 380,000 180,258 41,627 5,313 19,994
33,035,157 15,932,189 6,197,141 6,312,333
10,343,274 - - - 15,688,835 - 4,821,655 - - 3,935,767 - 4,698,635 1,655,398 7,990,802 - - 88,431 - - - 170,004 - - - 1,238,972 - - - 3,253,041 4,264,417 759,419 1,652,300 1,216,597 869,511 166,768 838,583 33,654,552 17,060,497 5,747,842 7,189,518
(619,395) (1,128,308) 449,299 (877,185)
- 1,606,150 625,000 780,000 1,301,140 420,000 6,000 100,000
(2,279,131) - - - (977,991) 2,026,150 631,000 880,000
- - - -
(1,597,386) 897,842 1,080,299 2,815
28,067,123 8,894,221 2,609,728 296,523
$ 26,469,737 $ 9,792,063 $ 3,690,027 $ 299,338
al part of this statement
13

Escheated Lots - Roads
Transportation Impact Fees
One Cent Sales Tax
Other Governmental
Funds
Total Governmental
Funds
-$ -$ 5,539,603$ -$ $ 28,425,949 - - - 1,778,743 2,388,983 - 2,984,152 100,000 280 8,440,813 - - - 1,868,900 30,756,074 - - - 57,184 503,449
512,710 1,639,896 792,513 1,791,376 7,364,570 - 7,879,841 - 3,478,623 11,773,611
- - - 49,585 296,777 512,710 12,503,889 6,432,116 9,024,691 89,950,226
- - - 2,296,907 12,640,181 - - - 2,945,380 23,455,870 - - - - 8,634,402
5,405,431 - 20,000 - 15,071,631 - - - - 88,431 - - - - 170,004 - - 2,800 7,500 1,249,272 - 6,909,826 1,761,120 4,345,609 22,945,732 - - - - 3,091,459
5,405,431 6,909,826 1,783,920 9,595,396 87,346,982
(4,892,721) 5,594,063 4,648,196 (570,705) 2,603,244
- - - - 3,011,150 18,000,000 - 487,738 10,273,131 30,588,009
- - (1,821,140) (26,487,738) (30,588,009)18,000,000 - (1,333,402) (16,214,607) 3,011,150
- - - 453,753 453,753
13,107,279 5,594,063 3,314,794 (16,331,559) 6,068,147
- 21,074,788 13,022,441 39,046,662 113,011,486
$ 13,107,279 $ 26,668,851 $ 16,337,235 $ 22,715,103 $ 119,079,633
14
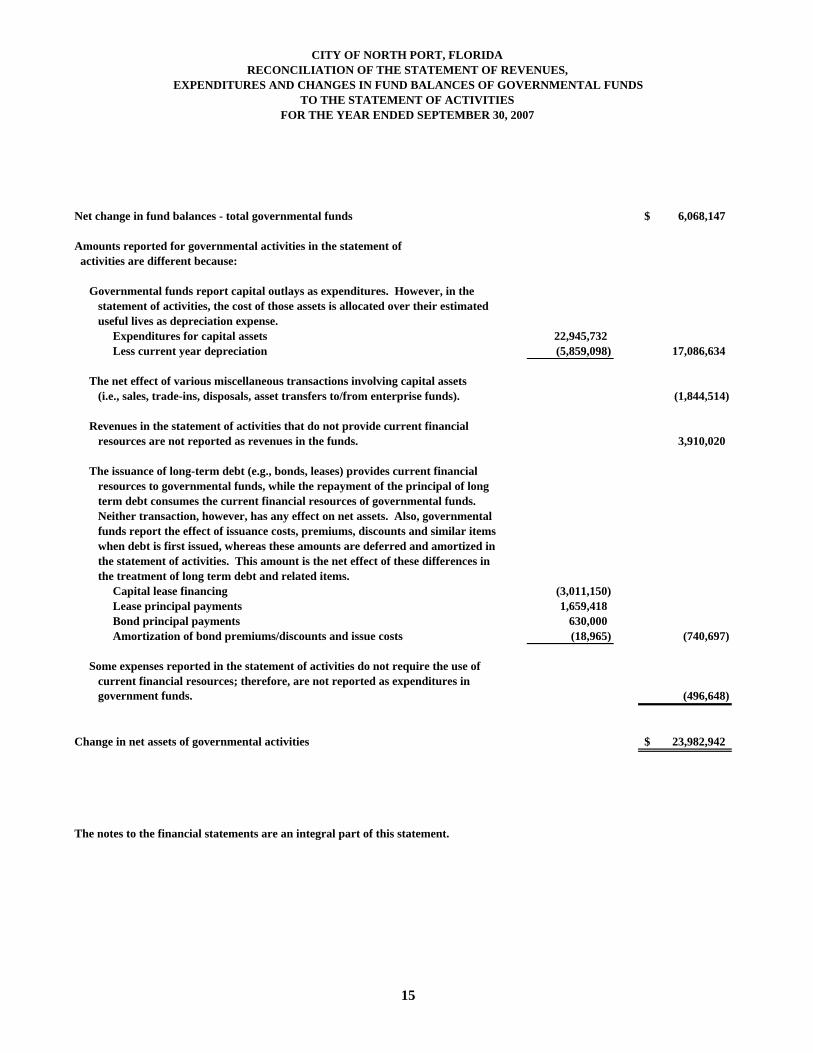
CITY OF NORTH PORT, FLORIDARECONCILIATION OF THE STATEMENT OF REVENUES,
EXPENDITURES AND CHANGES IN FUND BALANCES OF GOVERNMENTAL FUNDSTO THE STATEMENT OF ACTIVITIES
FOR THE YEAR ENDED SEPTEMBER 30, 2007
Net change in fund balances - total governmental funds 6,068,147$
Amounts reported for governmental activities in the statement of activities are different because:
Governmental funds report capital outlays as expenditures. However, in the statement of activities, the cost of those assets is allocated over their estimated useful lives as depreciation expense. Expenditures for capital assets 22,945,732 Less current year depreciation (5,859,098) 17,086,634
The net effect of various miscellaneous transactions involving capital assets (i.e., sales, trade-ins, disposals, asset transfers to/from enterprise funds). (1,844,514)
Revenues in the statement of activities that do not provide current financial resources are not reported as revenues in the funds. 3,910,020
The issuance of long-term debt (e.g., bonds, leases) provides current financial resources to governmental funds, while the repayment of the principal of long term debt consumes the current financial resources of governmental funds. Neither transaction, however, has any effect on net assets. Also, governmental funds report the effect of issuance costs, premiums, discounts and similar items when debt is first issued, whereas these amounts are deferred and amortized in the statement of activities. This amount is the net effect of these differences in the treatment of long term debt and related items. Capital lease financing (3,011,150) Lease principal payments 1,659,418 Bond principal payments 630,000 Amortization of bond premiums/discounts and issue costs (18,965) (740,697)
Some expenses reported in the statement of activities do not require the use of current financial resources; therefore, are not reported as expenditures in government funds. (496,648)
Change in net assets of governmental activities 23,982,942$
The notes to the financial statements are an integral part of this statement.
15
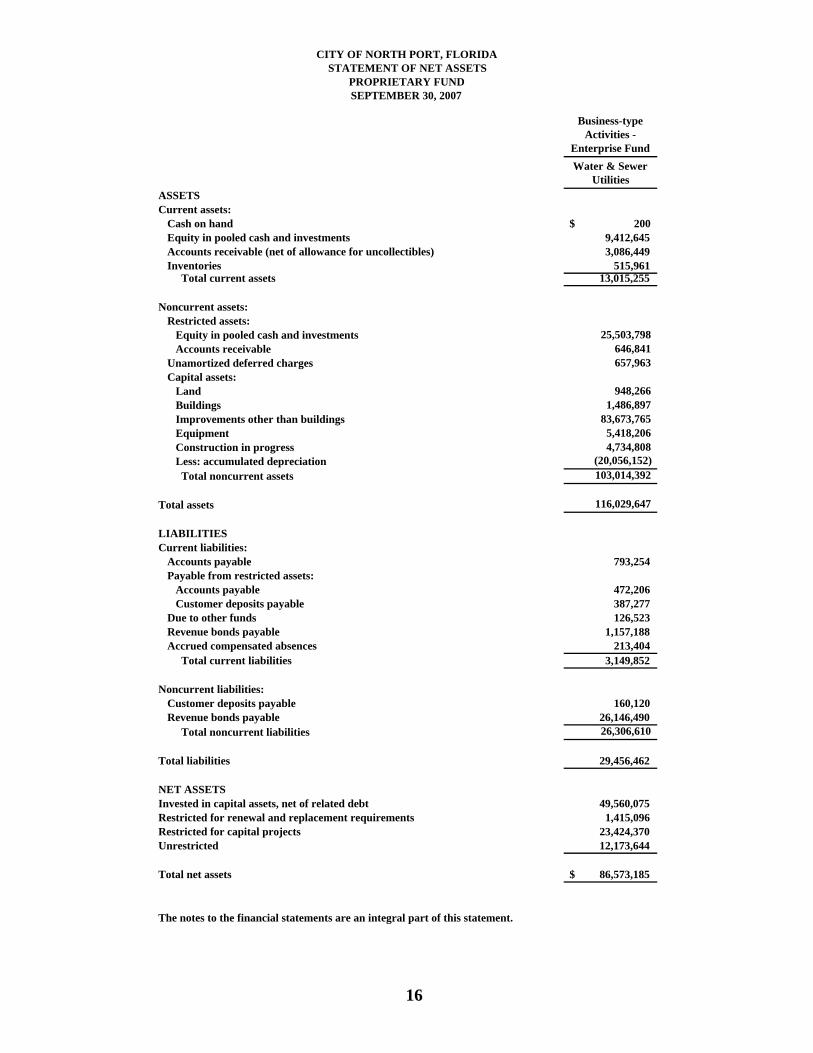
CITY OF NORTH PORT, FLORIDASTATEMENT OF NET ASSETS
PROPRIETARY FUNDSEPTEMBER 30, 2007
Business-type Activities -
Enterprise FundWater & Sewer
UtilitiesASSETSCurrent assets:
Cash on hand 200$ Equity in pooled cash and investments 9,412,645 Accounts receivable (net of allowance for uncollectibles) 3,086,449 Inventories 515,961 Total current assets 13,015,255
Noncurrent assets:Restricted assets: Equity in pooled cash and investments 25,503,798 Accounts receivable 646,841 Unamortized deferred charges 657,963 Capital assets: Land 948,266 Buildings 1,486,897 Improvements other than buildings 83,673,765 Equipment 5,418,206 Construction in progress 4,734,808 Less: accumulated depreciation (20,056,152) Total noncurrent assets 103,014,392
Total assets 116,029,647
LIABILITIESCurrent liabilities:
Accounts payable 793,254 Payable from restricted assets: Accounts payable 472,206 Customer deposits payable 387,277 Due to other funds 126,523 Revenue bonds payable 1,157,188 Accrued compensated absences 213,404 Total current liabilities 3,149,852
Noncurrent liabilities:Customer deposits payable 160,120 Revenue bonds payable 26,146,490 Total noncurrent liabilities 26,306,610
Total liabilities 29,456,462
NET ASSETSInvested in capital assets, net of related debt 49,560,075 Restricted for renewal and replacement requirements 1,415,096 Restricted for capital projects 23,424,370 Unrestricted 12,173,644
Total net assets 86,573,185$
The notes to the financial statements are an integral part of this statement.
16
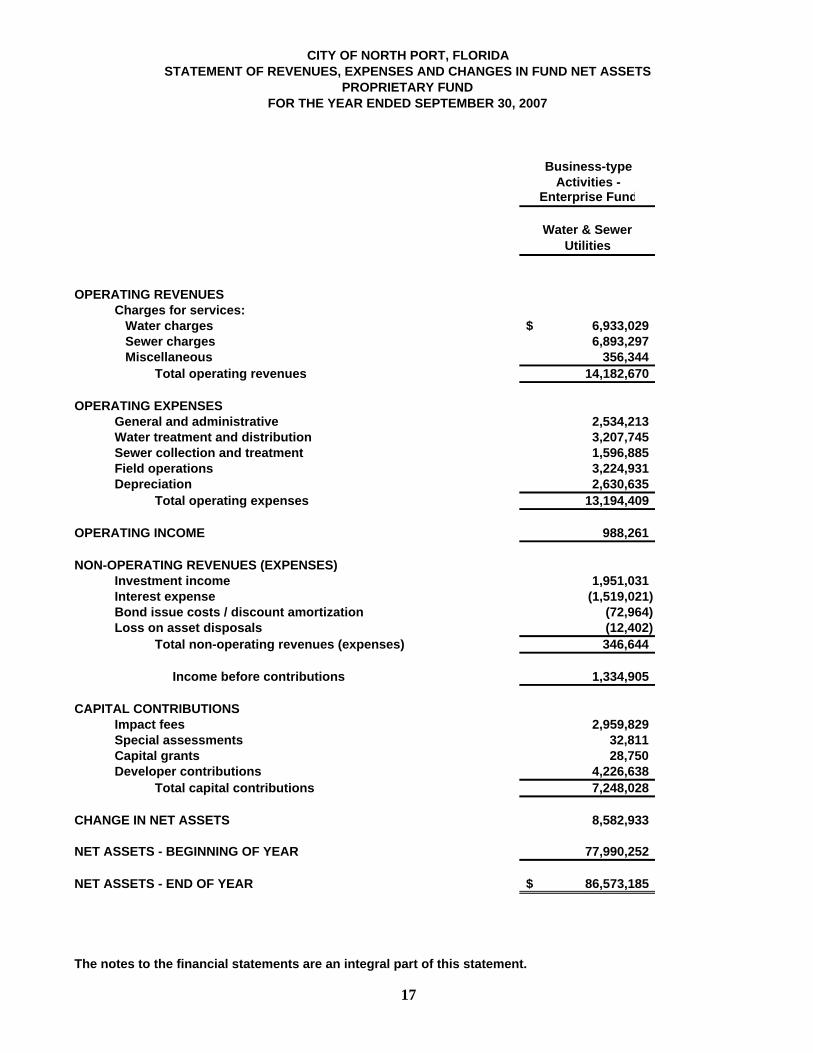
CITY OF NORTH PORT, FLORIDASTATEMENT OF REVENUES, EXPENSES AND CHANGES IN FUND NET ASSETS
PROPRIETARY FUND FOR THE YEAR ENDED SEPTEMBER 30, 2007
Business-typeActivities -
Enterprise Fund
Water & Sewer Utilities
OPERATING REVENUESCharges for services: Water charges 6,933,029$ Sewer charges 6,893,297 Miscellaneous 356,344
Total operating revenues 14,182,670
OPERATING EXPENSESGeneral and administrative 2,534,213Water treatment and distribution 3,207,745Sewer collection and treatment 1,596,885Field operations 3,224,931Depreciation 2,630,635
Total operating expenses 13,194,409
OPERATING INCOME 988,261
NON-OPERATING REVENUES (EXPENSES)Investment income 1,951,031Interest expense (1,519,021)Bond issue costs / discount amortization (72,964)Loss on asset disposals (12,402)
Total non-operating revenues (expenses) 346,644
Income before contributions 1,334,905
CAPITAL CONTRIBUTIONSImpact fees 2,959,829Special assessments 32,811Capital grants 28,750Developer contributions 4,226,638
Total capital contributions 7,248,028
CHANGE IN NET ASSETS 8,582,933
NET ASSETS - BEGINNING OF YEAR 77,990,252
NET ASSETS - END OF YEAR 86,573,185$
The notes to the financial statements are an integral part of this statement.
17
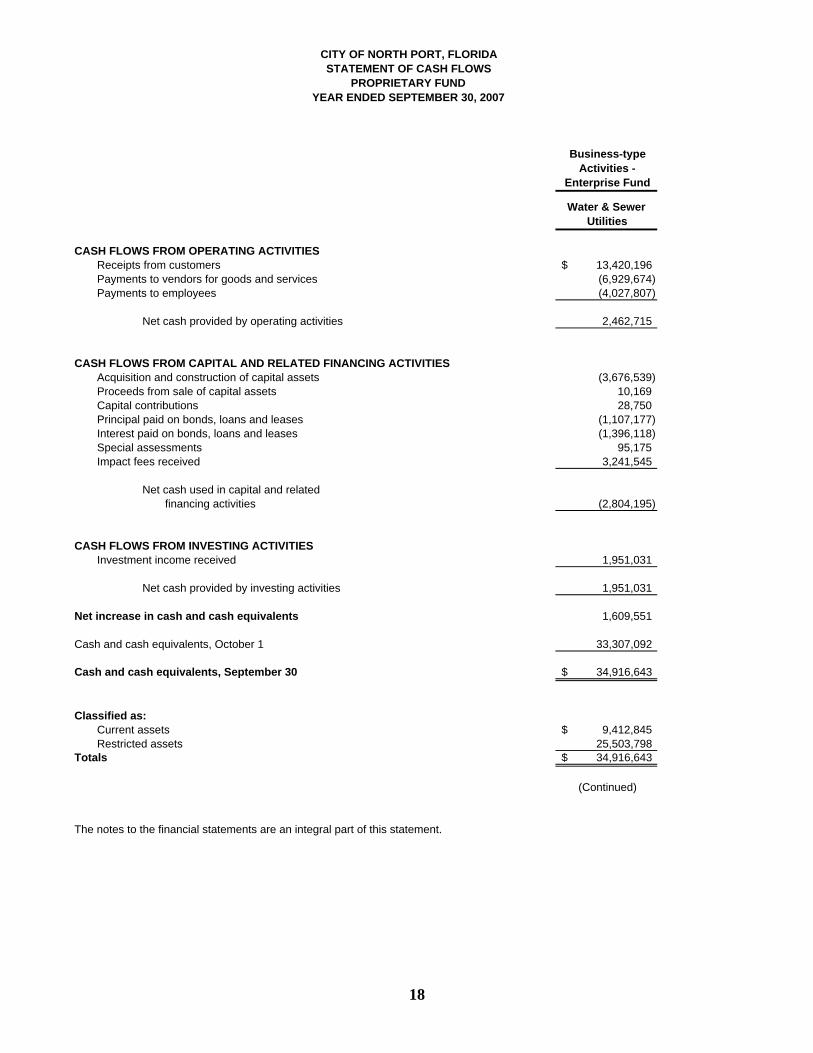
CITY OF NORTH PORT, FLORIDASTATEMENT OF CASH FLOWS
PROPRIETARY FUND YEAR ENDED SEPTEMBER 30, 2007
Business-type Activities -
Enterprise Fund
Water & Sewer Utilities
CASH FLOWS FROM OPERATING ACTIVITIESReceipts from customers 13,420,196$ Payments to vendors for goods and services (6,929,674) Payments to employees (4,027,807)
Net cash provided by operating activities 2,462,715
CASH FLOWS FROM CAPITAL AND RELATED FINANCING ACTIVITIESAcquisition and construction of capital assets (3,676,539) Proceeds from sale of capital assets 10,169 Capital contributions 28,750 Principal paid on bonds, loans and leases (1,107,177) Interest paid on bonds, loans and leases (1,396,118) Special assessments 95,175 Impact fees received 3,241,545
Net cash used in capital and relatedfinancing activities (2,804,195)
CASH FLOWS FROM INVESTING ACTIVITIESInvestment income received 1,951,031
Net cash provided by investing activities 1,951,031
Net increase in cash and cash equivalents 1,609,551
Cash and cash equivalents, October 1 33,307,092
Cash and cash equivalents, September 30 34,916,643$
Classified as:Current assets 9,412,845$ Restricted assets 25,503,798
Totals 34,916,643$
(Continued)
The notes to the financial statements are an integral part of this statement.
18
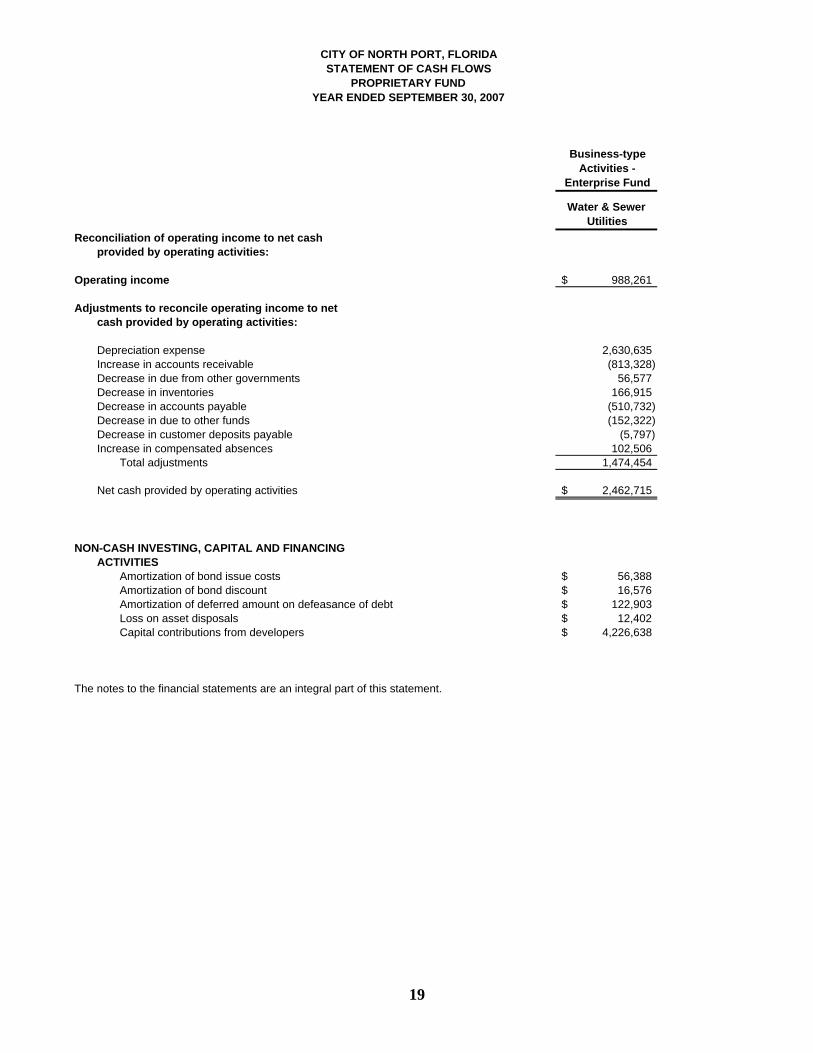
CITY OF NORTH PORT, FLORIDASTATEMENT OF CASH FLOWS
PROPRIETARY FUND YEAR ENDED SEPTEMBER 30, 2007
Business-type Activities -
Enterprise Fund
Water & Sewer Utilities
Reconciliation of operating income to net cashprovided by operating activities:
Operating income 988,261$
Adjustments to reconcile operating income to netcash provided by operating activities:
Depreciation expense 2,630,635Increase in accounts receivable (813,328)Decrease in due from other governments 56,577Decrease in inventories 166,915Decrease in accounts payable (510,732)Decrease in due to other funds (152,322)Decrease in customer deposits payable (5,797)Increase in compensated absences 102,506
Total adjustments 1,474,454
Net cash provided by operating activities 2,462,715$
NON-CASH INVESTING, CAPITAL AND FINANCINGACTIVITIES
Amortization of bond issue costs 56,388$ Amortization of bond discount 16,576$ Amortization of deferred amount on defeasance of debt 122,903$ Loss on asset disposals 12,402$ Capital contributions from developers 4,226,638$
The notes to the financial statements are an integral part of this statement.
19
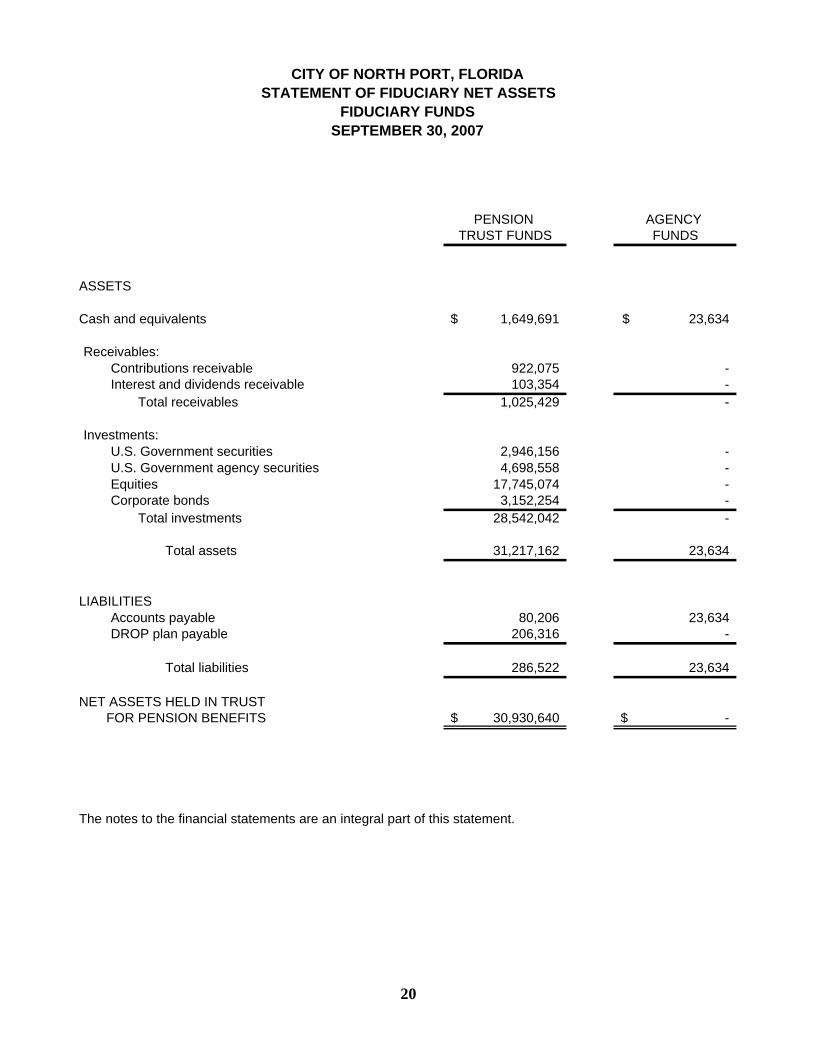
CITY OF NORTH PORT, FLORIDASTATEMENT OF FIDUCIARY NET ASSETS
FIDUCIARY FUNDSSEPTEMBER 30, 2007
PENSION AGENCY TRUST FUNDS FUNDS
ASSETS
Cash and equivalents 1,649,691$ 23,634$
Receivables:Contributions receivable 922,075 - Interest and dividends receivable 103,354 -
Total receivables 1,025,429 -
Investments:U.S. Government securities 2,946,156 - U.S. Government agency securities 4,698,558 - Equities 17,745,074 - Corporate bonds 3,152,254 -
Total investments 28,542,042 -
Total assets 31,217,162 23,634
LIABILITIESAccounts payable 80,206 23,634 DROP plan payable 206,316 -
Total liabilities 286,522 23,634
NET ASSETS HELD IN TRUST FOR PENSION BENEFITS 30,930,640$ -$
The notes to the financial statements are an integral part of this statement.
20
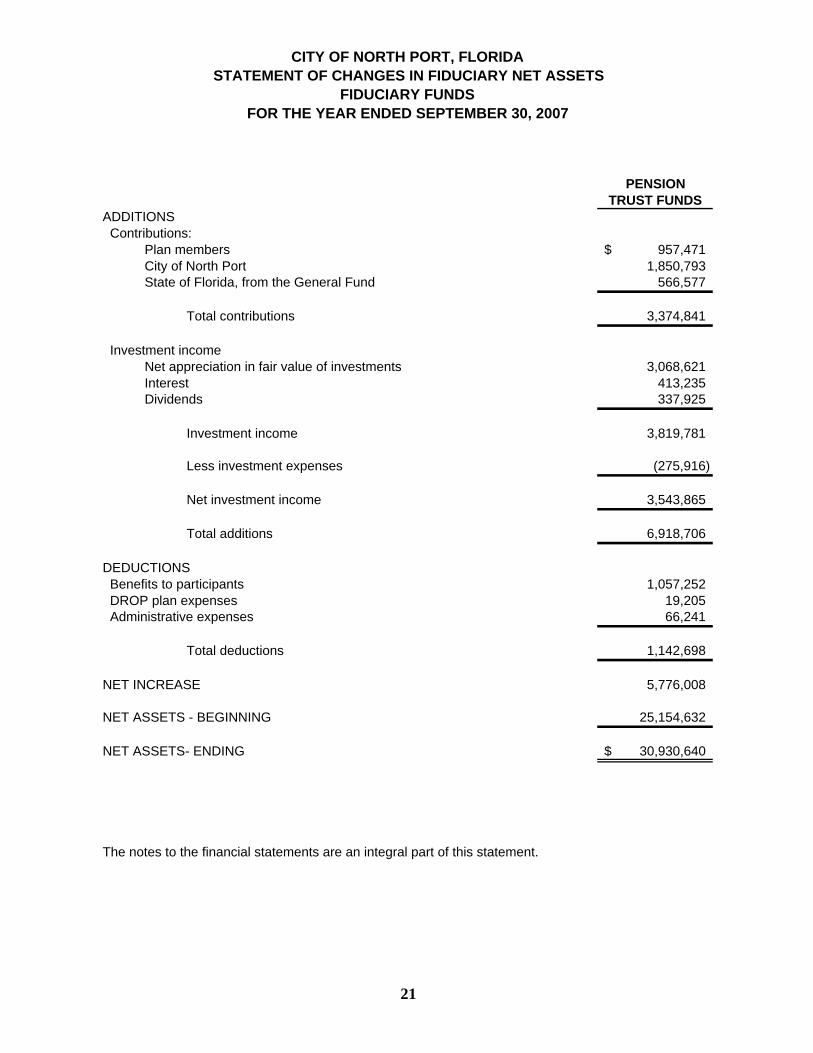
CITY OF NORTH PORT, FLORIDASTATEMENT OF CHANGES IN FIDUCIARY NET ASSETS
FIDUCIARY FUNDSFOR THE YEAR ENDED SEPTEMBER 30, 2007
PENSIONTRUST FUNDS
ADDITIONS Contributions:
Plan members 957,471$ City of North Port 1,850,793 State of Florida, from the General Fund 566,577
Total contributions 3,374,841
Investment incomeNet appreciation in fair value of investments 3,068,621 Interest 413,235 Dividends 337,925
Investment income 3,819,781
Less investment expenses (275,916)
Net investment income 3,543,865
Total additions 6,918,706
DEDUCTIONS Benefits to participants 1,057,252 DROP plan expenses 19,205 Administrative expenses 66,241
Total deductions 1,142,698
NET INCREASE 5,776,008
NET ASSETS - BEGINNING 25,154,632
NET ASSETS- ENDING 30,930,640$
The notes to the financial statements are an integral part of this statement.
21
CITY OF NORTH PORT, FLORIDA NOTES TO THE FINANCIAL STATEMENTS
SEPTEMBER 30, 2007
22
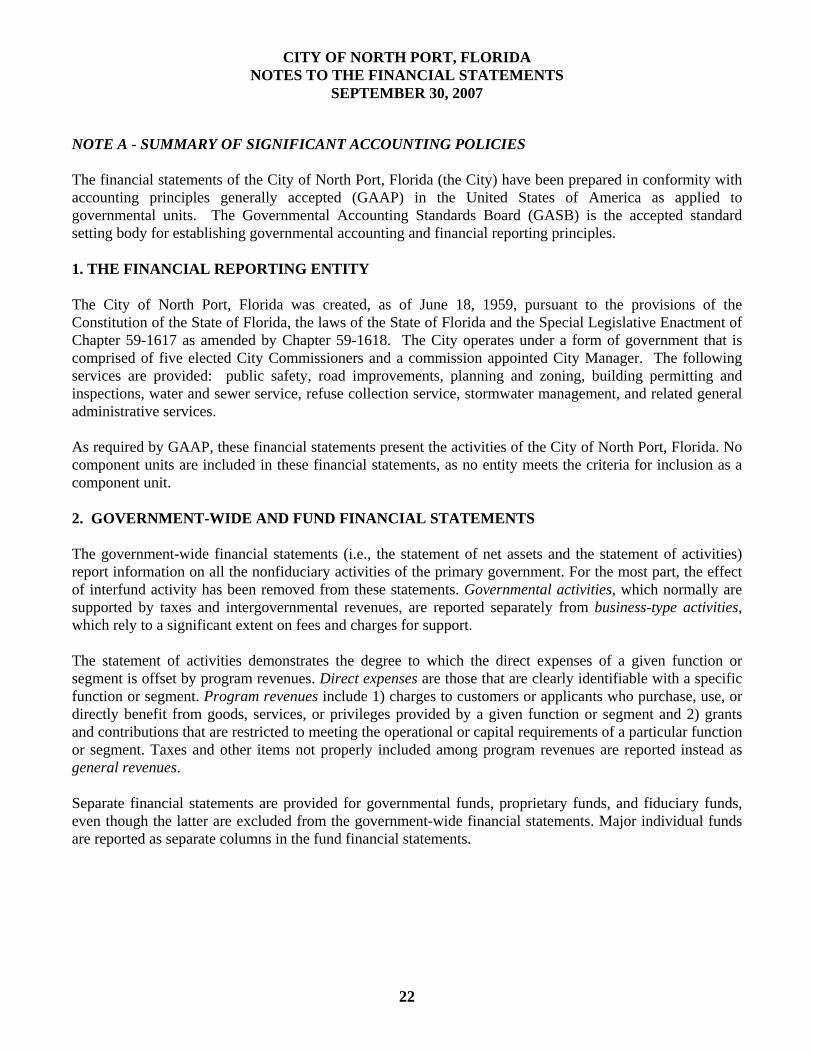
NOTE A - SUMMARY OF SIGNIFICANT ACCOUNTING POLICIES The financial statements of the City of North Port, Florida (the City) have been prepared in conformity with accounting principles generally accepted (GAAP) in the United States of America as applied to governmental units. The Governmental Accounting Standards Board (GASB) is the accepted standard setting body for establishing governmental accounting and financial reporting principles. 1. THE FINANCIAL REPORTING ENTITY The City of North Port, Florida was created, as of June 18, 1959, pursuant to the provisions of the Constitution of the State of Florida, the laws of the State of Florida and the Special Legislative Enactment of Chapter 59-1617 as amended by Chapter 59-1618. The City operates under a form of government that is comprised of five elected City Commissioners and a commission appointed City Manager. The following services are provided: public safety, road improvements, planning and zoning, building permitting and inspections, water and sewer service, refuse collection service, stormwater management, and related general administrative services. As required by GAAP, these financial statements present the activities of the City of North Port, Florida. No component units are included in these financial statements, as no entity meets the criteria for inclusion as a component unit. 2. GOVERNMENT-WIDE AND FUND FINANCIAL STATEMENTS The government-wide financial statements (i.e., the statement of net assets and the statement of activities) report information on all the nonfiduciary activities of the primary government. For the most part, the effect of interfund activity has been removed from these statements. Governmental activities, which normally are supported by taxes and intergovernmental revenues, are reported separately from business-type activities, which rely to a significant extent on fees and charges for support. The statement of activities demonstrates the degree to which the direct expenses of a given function or segment is offset by program revenues. Direct expenses are those that are clearly identifiable with a specific function or segment. Program revenues include 1) charges to customers or applicants who purchase, use, or directly benefit from goods, services, or privileges provided by a given function or segment and 2) grants and contributions that are restricted to meeting the operational or capital requirements of a particular function or segment. Taxes and other items not properly included among program revenues are reported instead as general revenues. Separate financial statements are provided for governmental funds, proprietary funds, and fiduciary funds, even though the latter are excluded from the government-wide financial statements. Major individual funds are reported as separate columns in the fund financial statements.
23
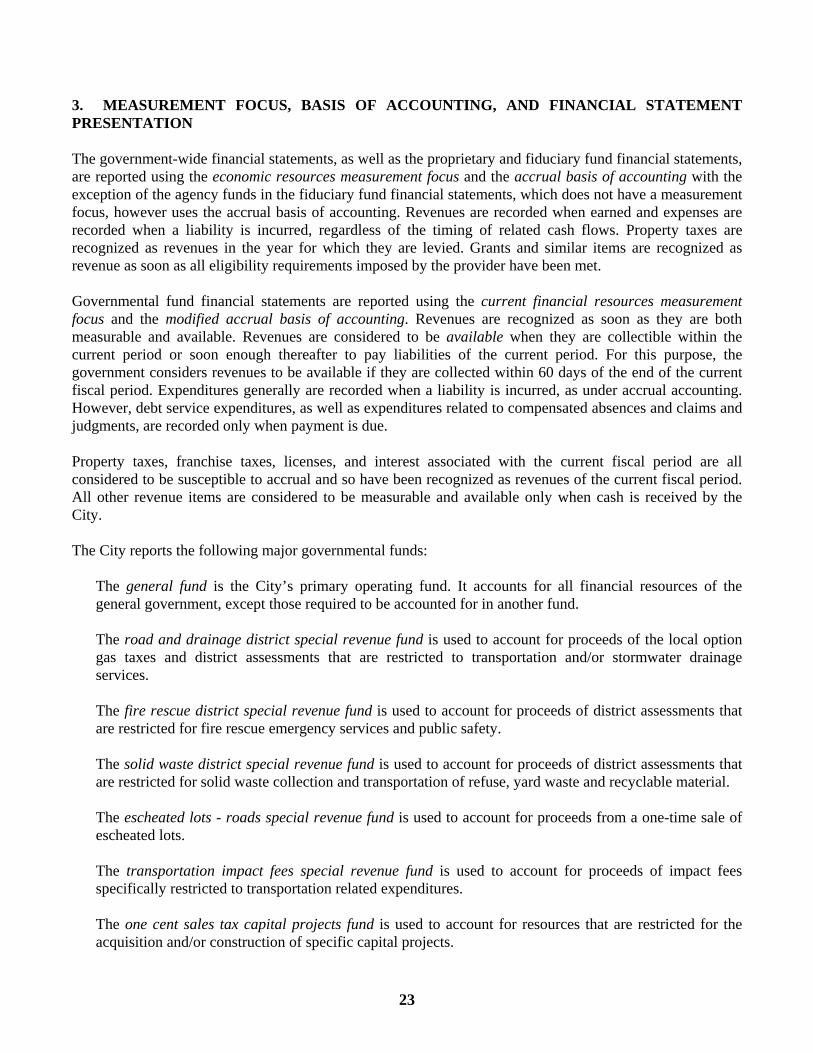
3. MEASUREMENT FOCUS, BASIS OF ACCOUNTING, AND FINANCIAL STATEMENT PRESENTATION The government-wide financial statements, as well as the proprietary and fiduciary fund financial statements, are reported using the economic resources measurement focus and the accrual basis of accounting with the exception of the agency funds in the fiduciary fund financial statements, which does not have a measurement focus, however uses the accrual basis of accounting. Revenues are recorded when earned and expenses are recorded when a liability is incurred, regardless of the timing of related cash flows. Property taxes are recognized as revenues in the year for which they are levied. Grants and similar items are recognized as revenue as soon as all eligibility requirements imposed by the provider have been met. Governmental fund financial statements are reported using the current financial resources measurement focus and the modified accrual basis of accounting. Revenues are recognized as soon as they are both measurable and available. Revenues are considered to be available when they are collectible within the current period or soon enough thereafter to pay liabilities of the current period. For this purpose, the government considers revenues to be available if they are collected within 60 days of the end of the current fiscal period. Expenditures generally are recorded when a liability is incurred, as under accrual accounting. However, debt service expenditures, as well as expenditures related to compensated absences and claims and judgments, are recorded only when payment is due. Property taxes, franchise taxes, licenses, and interest associated with the current fiscal period are all considered to be susceptible to accrual and so have been recognized as revenues of the current fiscal period. All other revenue items are considered to be measurable and available only when cash is received by the City. The City reports the following major governmental funds: The general fund is the City’s primary operating fund. It accounts for all financial resources of the
general government, except those required to be accounted for in another fund. The road and drainage district special revenue fund is used to account for proceeds of the local option
gas taxes and district assessments that are restricted to transportation and/or stormwater drainage services.
The fire rescue district special revenue fund is used to account for proceeds of district assessments that
are restricted for fire rescue emergency services and public safety. The solid waste district special revenue fund is used to account for proceeds of district assessments that
are restricted for solid waste collection and transportation of refuse, yard waste and recyclable material.
The escheated lots - roads special revenue fund is used to account for proceeds from a one-time sale of escheated lots.
The transportation impact fees special revenue fund is used to account for proceeds of impact fees
specifically restricted to transportation related expenditures. The one cent sales tax capital projects fund is used to account for resources that are restricted for the
acquisition and/or construction of specific capital projects.

24
The City reports the following major proprietary fund: The water and sewer utility fund accounts for the activities associated with providing water and sewer
services to the residents of the City. The City operates a sewage treatment plant, sewage pumping stations and collection systems, and a water treatment/distribution plant.
Additionally, the City reports the following fiduciary fund types: The pension trust funds account for the activities of the City’s firefighters’ and police officers’ pension
trust funds, which accumulate resources for pension benefit payments to qualified pension participants. The county road impact fees agency fund accounts for the impact fees collected for and disbursed to
Sarasota County.
The education impact fees agency fund accounts for the impact fees collected for and disbursed to Sarasota County School Board.
Private-sector standards and financial reporting issued prior to December 1, 1989 are followed in both the government-wide and proprietary fund financial statements to the extent that those standards do not conflict with or contradict guidance of the Governmental Accounting Standards Board. Governments also have the option of following subsequent private-sector guidance for their business-type activities and enterprise funds, subject to this same limitation. The City has elected not to follow subsequent private-sector guidance. As a general rule, the effect of interfund activity has been eliminated from the government-wide financial statements. Exceptions to this general rule are charges for services between the City’s various funds. Elimination of these charges would distort the direct costs and program revenues reported for the functions concerned. Amounts reported as program revenues include 1) charges to customers or applicants for goods, services, or privileges provided, 2) operating grants and contributions and 3) capital grants and contributions, including special assessments. Internally dedicated resources are reported as general revenues rather than as program revenues. Likewise, general revenues include all taxes. Proprietary funds distinguish operating revenues and expenses from nonoperating items. Operating revenues and expenses generally result from providing services and producing and delivering goods in connection with a proprietary fund’s principal ongoing operations. The principal operating revenues of the water and sewer enterprise fund are charges to customers for sales and services. Operating expenses for enterprise funds include the cost of sales and services, administrative expenses, and depreciation on capital assets. All revenues and expenses not meeting this definition are reported as nonoperating revenues and expenses. When both restricted and unrestricted resources are available for use, it is the City’s policy to use restricted resources first, then unrestricted resources as they are needed.
25
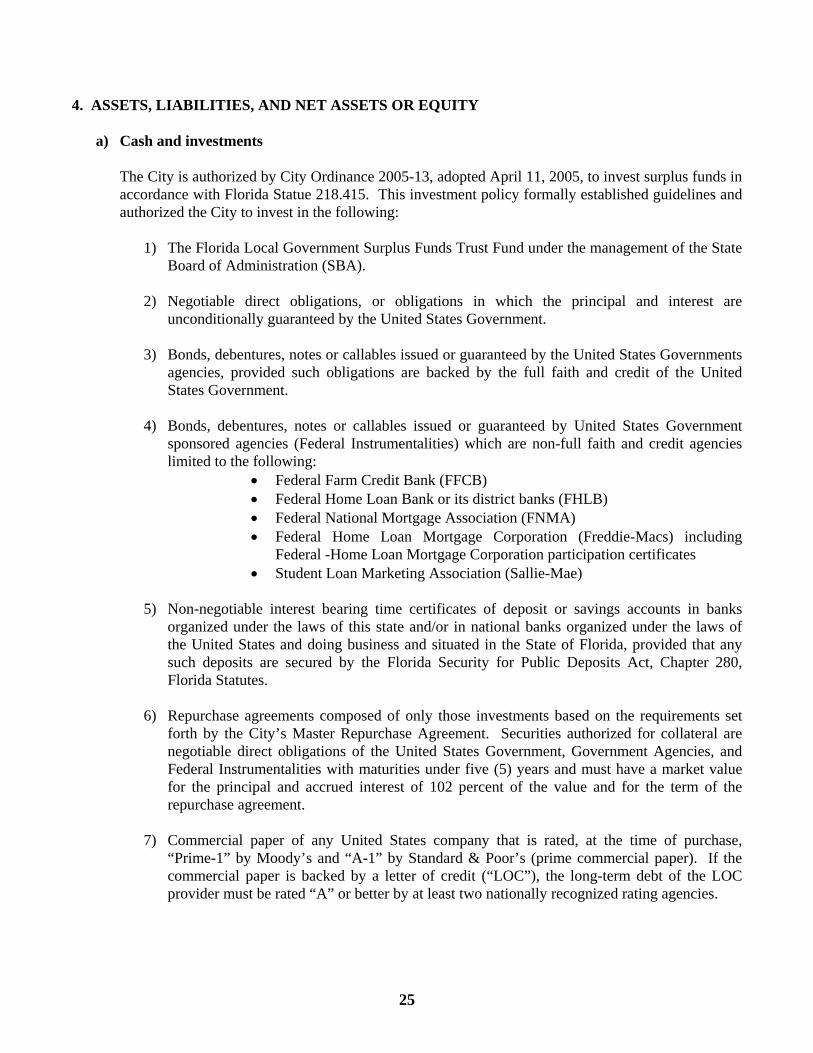
4. ASSETS, LIABILITIES, AND NET ASSETS OR EQUITY
a) Cash and investments The City is authorized by City Ordinance 2005-13, adopted April 11, 2005, to invest surplus funds in accordance with Florida Statue 218.415. This investment policy formally established guidelines and authorized the City to invest in the following:
1) The Florida Local Government Surplus Funds Trust Fund under the management of the State Board of Administration (SBA).
2) Negotiable direct obligations, or obligations in which the principal and interest are
unconditionally guaranteed by the United States Government.
3) Bonds, debentures, notes or callables issued or guaranteed by the United States Governments agencies, provided such obligations are backed by the full faith and credit of the United States Government.
4) Bonds, debentures, notes or callables issued or guaranteed by United States Government
sponsored agencies (Federal Instrumentalities) which are non-full faith and credit agencies limited to the following:
• Federal Farm Credit Bank (FFCB) • Federal Home Loan Bank or its district banks (FHLB) • Federal National Mortgage Association (FNMA) • Federal Home Loan Mortgage Corporation (Freddie-Macs) including
Federal -Home Loan Mortgage Corporation participation certificates • Student Loan Marketing Association (Sallie-Mae)
5) Non-negotiable interest bearing time certificates of deposit or savings accounts in banks
organized under the laws of this state and/or in national banks organized under the laws of the United States and doing business and situated in the State of Florida, provided that any such deposits are secured by the Florida Security for Public Deposits Act, Chapter 280, Florida Statutes.
6) Repurchase agreements composed of only those investments based on the requirements set
forth by the City’s Master Repurchase Agreement. Securities authorized for collateral are negotiable direct obligations of the United States Government, Government Agencies, and Federal Instrumentalities with maturities under five (5) years and must have a market value for the principal and accrued interest of 102 percent of the value and for the term of the repurchase agreement.
7) Commercial paper of any United States company that is rated, at the time of purchase,
“Prime-1” by Moody’s and “A-1” by Standard & Poor’s (prime commercial paper). If the commercial paper is backed by a letter of credit (“LOC”), the long-term debt of the LOC provider must be rated “A” or better by at least two nationally recognized rating agencies.
26
8) Bankers’ acceptances issued by a domestic bank or a federally chartered domestic office of a
foreign bank, which are eligible for purchase by the Federal Reserve System, at the time of purchase, the short-term paper is rated, at a minimum, “P-1” by Moody's Investors Services and “A-1” Standard & Poor's.
9) State and/or local government taxable and/or tax-exempt debt, general obligation and/or
revenue bonds, rated at least “Aa” by Moody’s and “AA” by Standard & Poor’s for long-term debt, or rated at least “MIG-2” by Moody’s and “SP-2” by Standard & Poor’s for short-term debt.
10) Registered investment companies (mutual funds) shares in open-end, no-load provided such
funds are registered under the Federal Investment Company Act of 1940 and operated in accordance with 17 C.F.R. § 270.2a-7.
11) Intergovernmental investment pools that are authorized pursuant to the Florida Interlocal
Cooperation Act, as provided in Section 163.01, Florida Statutes and provided that said funds contain no derivatives.
All funds participate in the pooled cash investment program. Investment income and loss is allocated to individual funds based upon their average daily balance in the cash pool. Each fund’s individual equity in the City’s investment pool is considered to be a cash equivalent, since the funds can deposit or withdraw cash at any time without prior notice or penalty. Investments for the City are reported at fair value based upon quoted market prices. If quoted market prices are not available, fair values are based on quoted market prices of comparable instruments or values obtained from independent pricing services. The reported value of the City’s investment in the Florida Local Government Surplus Funds Trust Fund external investment pool (2a7-like pool) is the same as the fair value of the pool shares.
b) Receivables and payables
Activity between funds that are representative of lending/borrowing arrangements outstanding at the end of the fiscal year are referred to as either “due to/from other funds” (i.e., the current portion of interfund loans) or “advances to/from other funds” (i.e., the non-current portion of interfund loans.) All other outstanding balances between funds are reported as “due to/from other funds.” Any residual balances outstanding between the governmental activities and business-type activities are reported in the government-wide financial statements as “internal balances.” Advances between funds, as reported in the fund financial statements, are offset by a fund balance reserve account in applicable governmental funds to indicate that they are not available for appropriation and are not expendable available financial resources. All trade receivables are shown net of an allowance for uncollectibles.
27
c) Inventories
Inventories are adjusted to annual counts and are valued at cost, using the first-in/first-out method. Inventories of governmental funds are recorded as expenditures when consumed rather than when purchased.
d) Restricted assets
Certain proceeds of the City’s enterprise fund revenue bonds, as well as certain resources set aside for their repayment, are classified as restricted assets on the balance sheet because their use is limited by applicable bond covenants. District revenues and impact fee revenues are set aside to be used for their respective purposes in accordance with state statutes, regulations, and City ordinances.
e) Capital assets
Capital assets, which include property, plant, and equipment, are reported in the applicable governmental or business-type activities columns in the government-wide financial statements. Capital assets are defined by the City as assets with an initial, individual cost of more than $1,000 (amount not rounded) and an estimated useful life in excess of one year. Such assets are recorded at historical cost or estimated historical cost if purchased or constructed. Donated capital assets are recorded at estimated fair market value at the date of donation. The costs of normal maintenance and repairs that do not add to the value of the asset or materially extend assets lives are not capitalized. Property, plant, and equipment of the City are depreciated using the straight line method over the following estimated useful lives: Assets Years Buildings 40 Improvements 5-50 Furniture and fixtures 5-10 Equipment 7-30 Vehicles 5
f) Compensated absences
It is the City’s policy to permit employees to accumulate earned but unused vacation, sick pay and other employee benefit amounts. These amounts are accrued when incurred in the government-wide and proprietary fund financial statements. In the case of governmental funds, the only portion of the liability reported would be the amount of reimbursable unused leave payable to employees who had terminated their employment as of the end of the fiscal year.

28
g) Long-term obligations
In the government-wide financial statements and propriety fund types in the fund financial statements, long-term debt and other long-term obligations are reported as liabilities in the applicable governmental activities, business-type activities, or proprietary fund type statement of net assets. Bond premiums and discounts, as well as issuance costs, are deferred and amortized over the life of the bonds. Bonds payable are reported net of the applicable bond premium or discount. Bond issuance costs are reported as deferred charges and amortized over the term of the related debt. In the fund financial statements, governmental fund types recognize debt proceeds, including capital leases, during the current period. The face amount of debt issued is reported as “other financing sources.”
h) Fund equity
In the fund financial statements, governmental funds report reservations of fund balance for amounts that are not available for appropriation (such as prepaid items or inventory) or are legally restricted by outside parties for use for a specific purpose. Designations of fund balance represent tentative management plans that are subject to change. Unreserved fund balances in the non-major governmental funds in the amount of $618,279 have been designated for Myakka Creek preservation efforts.
5. ACCOUNTING ESTIMATES
The preparation of financial statements in conformity with accounting principles generally accepted in the United States of America as applied to governmental units requires management to make estimates and assumptions that affect the reported amounts of assets and liabilities and disclosure of contingent assets and liabilities at the date of the financial statements and the reported amounts of revenues and expenses during the reporting period. Actual results could differ from the estimates. NOTE B – STEWARDSHIP, COMPLIANCE, AND ACCOUNTABILITY
1. Budgetary information
The City follows these procedures in establishing the budgetary data reflected in the financial statements:
1. During the month of June, the City Manager submits to the City Commission a proposed operating budget for the fiscal year commencing October 1st for the purpose of determining millage requirements. The operating budget includes proposed expenditures and the means of financing them.
2. Public hearings are conducted at City Hall to obtain taxpayer comments during September.
3. On or before September 30th, the budget is legally enacted for funds through passage of an ordinance.
4. The City Commission must approve any revisions altering the budgeted amounts of total expenditures of any fund.
29
5. Budgets have been adopted for the governmental and enterprise funds on a basis consistent with generally accepted accounting principals (GAAP), with the exception of the Special Law Enforcement Fund, which is consistent with Florida Statute 932.7055. Expenditures may not legally exceed appropriations plus accumulated fund equity at the fund level. All annual appropriations lapse at year-end.
Encumbrance accounting, under which purchase orders, contracts and other commitments for the expenditure of monies are recorded as a reservation of budget, is employed as an extension of the statutorily required budgetary process. All encumbrances lapse at year-end. Therefore, encumbrances are not compared to authorized appropriations, and no portion of fund balances is reserved. Budgeted amounts are as originally adopted or amended by the City. Supplemental appropriations made during the fiscal year are included in the “Final Budgeted Amount” columns on the Budgetary Comparison Schedules. Supplemental budgetary appropriations for major funds made during the year included the following:
• The General Fund expenditure budget was increased $5,597,093 including $2,279,931 for transfers to set up the building and tree funds, $1,406,754 to fund the PBA contract that was negotiated with the police union, $500,000 for landscaping for Toledo Blade Boulevard Expansion Project and $400,000 for the Social Services building.
• The Road & Drainage Fund expenditure budget was increased $4,928,585 for reappropriations for various projects that were budgeted in the previous fiscal year. This included $2,103,776 for road resurfacing and $1,638,353 for pedestrian bridges and sidewalk construction.
• The Solid Waste Fund expenditure budget was increased $873,247 for reappropriations for refuse trucks that were budgeted in the previous year.
• The Escheated Lots – Roads Fund revenue and expenditure budget was increased by the transfer-in amount of $18,000,000 to fund $13,000,000 of road rehabilitation costs and $5,000,000 in Toledo Blade Boulevard upgrades.
• The Transportation Impact Fee Fund expenditure budget was increased $10,484,235 for reappropriations for various ongoing road projects, including improvements to the intersections of Price Boulevard/Sumter Boulevard ($2,500,000), Toledo Blade Boulevard/Price Boulevard ($2,486,000), Price Boulevard/Chamberlain Boulevard ($1,213,340), Price Boulevard/Cranberry Boulevard ($1,100,000) and the Sumter Boulevard widening project ($1,993,856). The fund’s budget was additionally increased during the fiscal year in the amount of $6,400,000 for the Sumter Boulevard widening project.
• The One Cent Sales Tax Fund expenditure budget was increased $1,640,069 for reappropriations for various projects that were budgeted in the previous fiscal year. This primarily included $1,233,846 for fire station construction.
All other supplementary budgetary appropriations in the major funds were not material in relation to the original budget.
2. Deficit fund equity
The Fleet Maintenance Special Revenue Fund had a deficit balance of ($1,274,726) as of September 30, 2007.
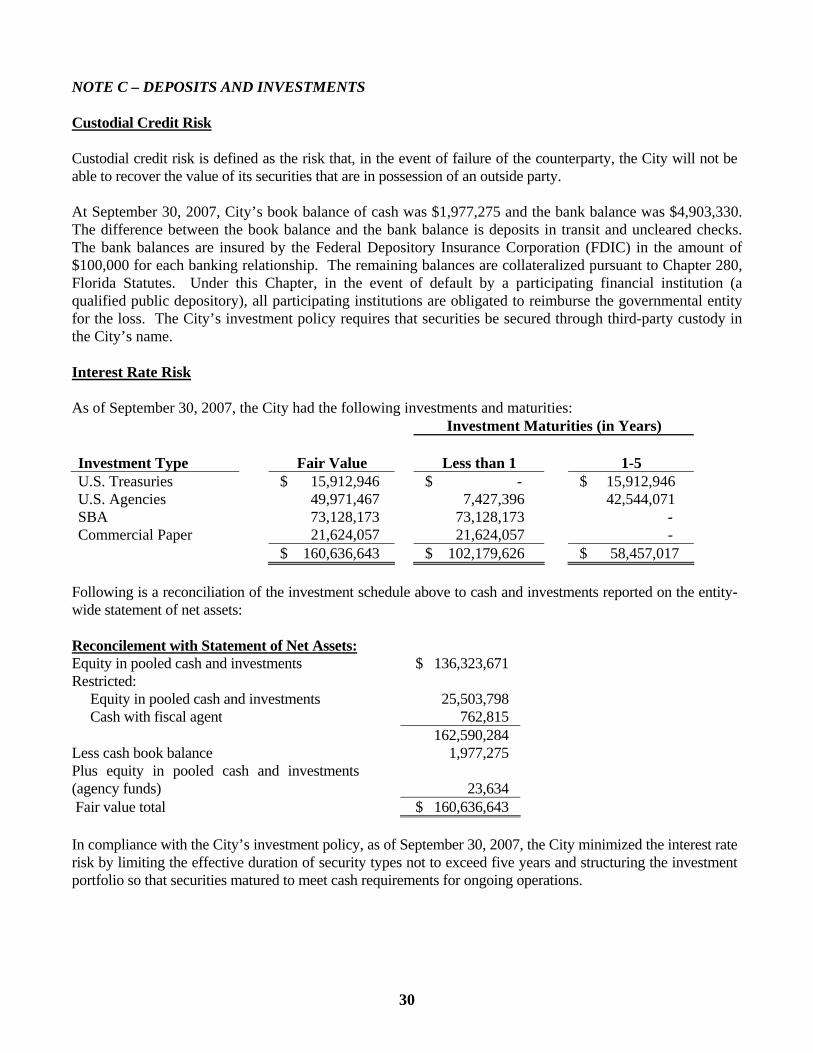
30
NOTE C – DEPOSITS AND INVESTMENTS Custodial Credit Risk Custodial credit risk is defined as the risk that, in the event of failure of the counterparty, the City will not be able to recover the value of its securities that are in possession of an outside party. At September 30, 2007, City’s book balance of cash was $1,977,275 and the bank balance was $4,903,330. The difference between the book balance and the bank balance is deposits in transit and uncleared checks. The bank balances are insured by the Federal Depository Insurance Corporation (FDIC) in the amount of $100,000 for each banking relationship. The remaining balances are collateralized pursuant to Chapter 280, Florida Statutes. Under this Chapter, in the event of default by a participating financial institution (a qualified public depository), all participating institutions are obligated to reimburse the governmental entity for the loss. The City’s investment policy requires that securities be secured through third-party custody in the City’s name. Interest Rate Risk As of September 30, 2007, the City had the following investments and maturities: Investment Maturities (in Years) Investment Type Fair Value Less than 1 1-5 U.S. Treasuries $ 15,912,946 $ - $ 15,912,946 U.S. Agencies 49,971,467 7,427,396 42,544,071 SBA 73,128,173 73,128,173 - Commercial Paper 21,624,057 21,624,057 - $ 160,636,643 $ 102,179,626 $ 58,457,017
Following is a reconciliation of the investment schedule above to cash and investments reported on the entity-wide statement of net assets: Reconcilement with Statement of Net Assets: Equity in pooled cash and investments $ 136,323,671 Restricted: Equity in pooled cash and investments 25,503,798 Cash with fiscal agent 762,815 162,590,284 Less cash book balance 1,977,275 Plus equity in pooled cash and investments (agency funds)
23,634
Fair value total $ 160,636,643 In compliance with the City’s investment policy, as of September 30, 2007, the City minimized the interest rate risk by limiting the effective duration of security types not to exceed five years and structuring the investment portfolio so that securities matured to meet cash requirements for ongoing operations.

31
Credit Risk The City’s investment policy limits credit risk by restricting the authorized investments to those stated in Note A, Section 4(a). The following table illustrates the credit quality distribution with credit exposure as a percentage of the City’s investment securities:
Investment Type Credit Rating
Percent of Portfolio
U.S. Treasuries * - 10% U.S. Agencies: Federal National Mortgage Association AAA 7% Federal Farm Credit Bank AAA 2% Federal Home Loan Mortgage Corporation AAA 8% Federal Home Loan Bank (Disc Notes) A-1+ 4% Federal Home Loan Bank AAA 11% SBA Unrated 45% Commercial paper A-1+ 13% * Unconditionally guaranteed by the U.S. Government
The City’s investment policy establishes limitations on portfolio composition by investment type in order to control concentration of credit risk. The following maximum limits are guidelines established for diversification by instrument: SBA 100%U.S. Government Securities 95%U.S. Government Agencies 50%Federal Instrumentalities 75%Interest Bearing Time Deposit or Savings Accounts 50%Repurchase Agreements 50%Commercial Paper 25%Bankers Acceptances 25%State and/or Local Government Taxable and/or Tax Exempt Debt 20%Registered Investment Companies (Mutual Funds) 25%Intergovernmental Investment Pools 25%
See the disclosures in Note J for the investments held in the City’s Fire and Police pension funds.
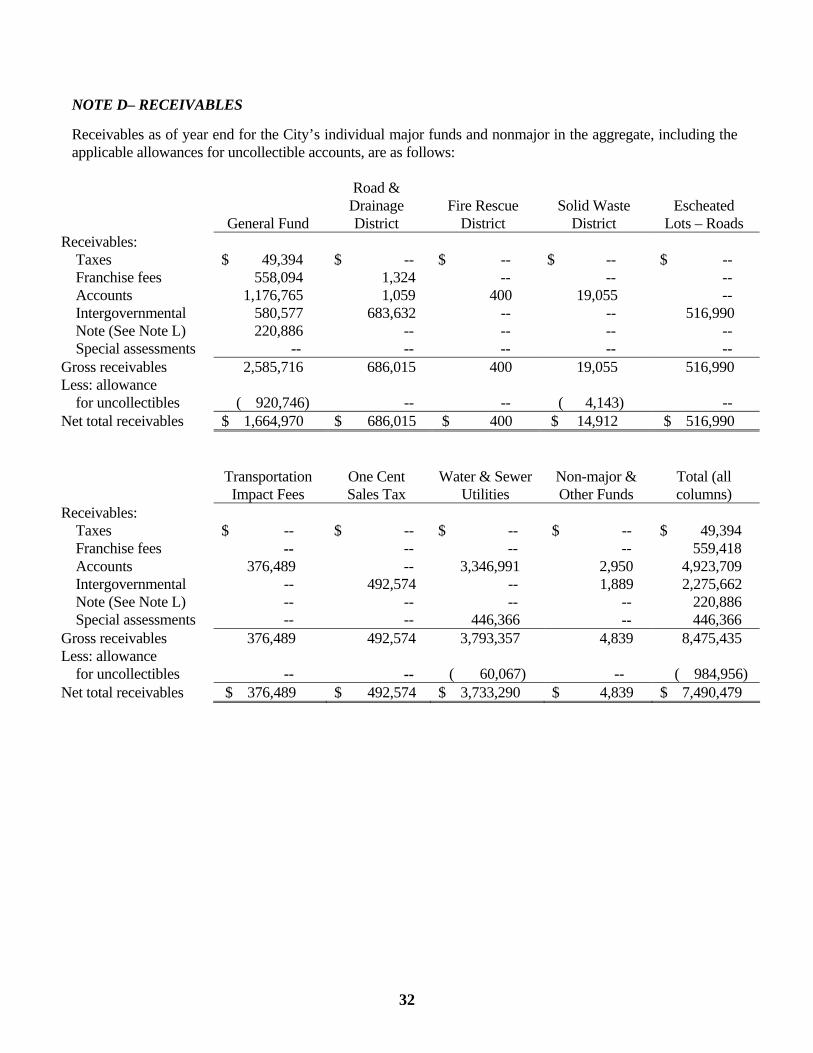
32
NOTE D– RECEIVABLES Receivables as of year end for the City’s individual major funds and nonmajor in the aggregate, including the applicable allowances for uncollectible accounts, are as follows:
General Fund
Road & Drainage District
Fire Rescue
District
Solid Waste
District
Escheated
Lots – Roads Receivables: Taxes $ 49,394 $ -- $ -- $ -- $ -- Franchise fees 558,094 1,324 -- -- -- Accounts 1,176,765 1,059 400 19,055 -- Intergovernmental 580,577 683,632 -- -- 516,990 Note (See Note L) 220,886 -- -- -- -- Special assessments -- -- -- -- -- Gross receivables 2,585,716 686,015 400 19,055 516,990 Less: allowance for uncollectibles ( 920,746) -- -- ( 4,143) -- Net total receivables $ 1,664,970 $ 686,015 $ 400 $ 14,912 $ 516,990
Transportation Impact Fees
One Cent Sales Tax
Water & Sewer
Utilities
Non-major & Other Funds
Total (all columns)
Receivables: Taxes $ -- $ -- $ -- $ -- $ 49,394 Franchise fees -- -- -- -- 559,418 Accounts 376,489 -- 3,346,991 2,950 4,923,709 Intergovernmental -- 492,574 -- 1,889 2,275,662 Note (See Note L) -- -- -- -- 220,886 Special assessments -- -- 446,366 -- 446,366 Gross receivables 376,489 492,574 3,793,357 4,839 8,475,435 Less: allowance for uncollectibles -- -- ( 60,067) -- ( 984,956) Net total receivables $ 376,489 $ 492,574 $ 3,733,290 $ 4,839 $ 7,490,479
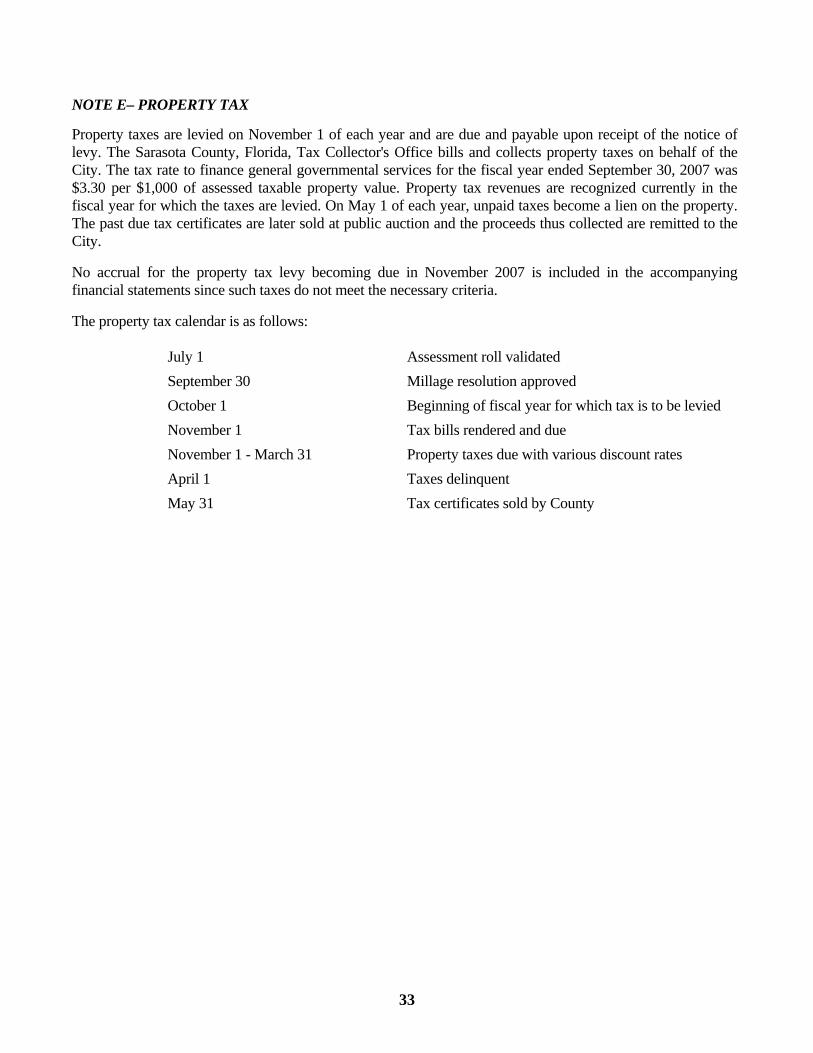
33
NOTE E– PROPERTY TAX Property taxes are levied on November 1 of each year and are due and payable upon receipt of the notice of levy. The Sarasota County, Florida, Tax Collector's Office bills and collects property taxes on behalf of the City. The tax rate to finance general governmental services for the fiscal year ended September 30, 2007 was $3.30 per $1,000 of assessed taxable property value. Property tax revenues are recognized currently in the fiscal year for which the taxes are levied. On May 1 of each year, unpaid taxes become a lien on the property. The past due tax certificates are later sold at public auction and the proceeds thus collected are remitted to the City. No accrual for the property tax levy becoming due in November 2007 is included in the accompanying financial statements since such taxes do not meet the necessary criteria. The property tax calendar is as follows: July 1 Assessment roll validated September 30 Millage resolution approved October 1 Beginning of fiscal year for which tax is to be levied November 1 Tax bills rendered and due November 1 - March 31 Property taxes due with various discount rates April 1 Taxes delinquent May 31 Tax certificates sold by County
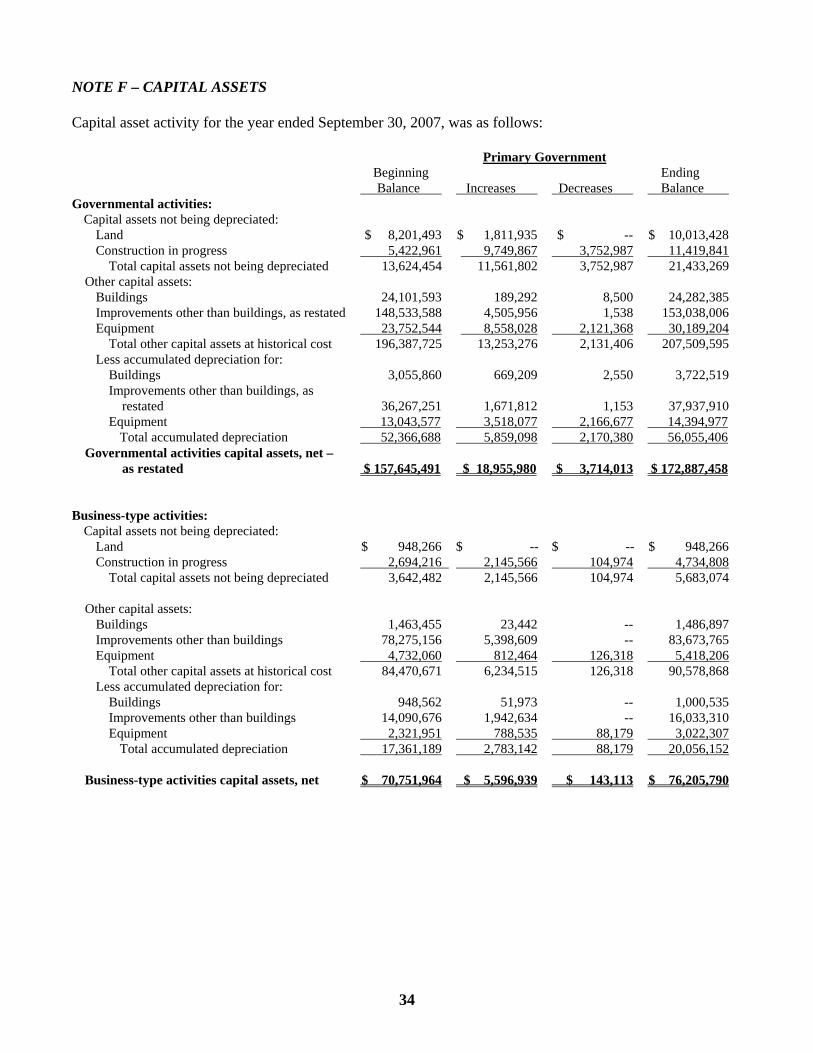
34
NOTE F – CAPITAL ASSETS Capital asset activity for the year ended September 30, 2007, was as follows: Primary Government Beginning Ending Balance Increases Decreases Balance Governmental activities: Capital assets not being depreciated: Land $ 8,201,493 $ 1,811,935 $ -- $ 10,013,428 Construction in progress 5,422,961 9,749,867 3,752,987 11,419,841 Total capital assets not being depreciated 13,624,454 11,561,802 3,752,987 21,433,269 Other capital assets: Buildings 24,101,593 189,292 8,500 24,282,385 Improvements other than buildings, as restated 148,533,588 4,505,956 1,538 153,038,006 Equipment 23,752,544 8,558,028 2,121,368 30,189,204 Total other capital assets at historical cost 196,387,725 13,253,276 2,131,406 207,509,595 Less accumulated depreciation for: Buildings 3,055,860 669,209 2,550 3,722,519 Improvements other than buildings, as restated
36,267,251
1,671,812
1,153
37,937,910
Equipment 13,043,577 3,518,077 2,166,677 14,394,977 Total accumulated depreciation 52,366,688 5,859,098 2,170,380 56,055,406 Governmental activities capital assets, net – as restated $ 157,645,491 $ 18,955,980 $ 3,714,013 $ 172,887,458 Business-type activities: Capital assets not being depreciated: Land $ 948,266 $ -- $ -- $ 948,266 Construction in progress 2,694,216 2,145,566 104,974 4,734,808 Total capital assets not being depreciated 3,642,482 2,145,566 104,974 5,683,074 Other capital assets:
Buildings 1,463,455 23,442 -- 1,486,897 Improvements other than buildings 78,275,156 5,398,609 -- 83,673,765 Equipment 4,732,060 812,464 126,318 5,418,206 Total other capital assets at historical cost 84,470,671 6,234,515 126,318 90,578,868 Less accumulated depreciation for: Buildings 948,562 51,973 -- 1,000,535 Improvements other than buildings 14,090,676 1,942,634 -- 16,033,310 Equipment 2,321,951 788,535 88,179 3,022,307 Total accumulated depreciation 17,361,189 2,783,142 88,179 20,056,152
Business-type activities capital assets, net $ 70,751,964 $ 5,596,939 $ 143,113 $ 76,205,790

35
Depreciation expense was charged to functions as follows:
Governmental activities: General government $ 726,546 Public safety 1,904,350 Physical environment 1,349,168 Transportation 1,672,235 Economic environment 947 Human services 9,546 Culture and recreation 196,306
Total governmental activities depreciation expense $ 5,859,098 Business-type activities Water and sewer utility $ 2,630,635
Total business-type activities depreciation expense $ 2,630,635 Commitments Commitments under uncompleted construction projects at September 30, 2007 consist of the following: Remaining Project Spent-to Date Commitment Social Services construction $ 320,713 $ 1,497,814 Roads and drainage construction 6,815,108 13,629,006 Fire station construction 2,619,957 295,049 Parks & recreation construction 1,634,948 1,371,225 Water and sewer operations construction 4,763,922 2,083,056 Total $ 16,154,648 $ 18,876,150
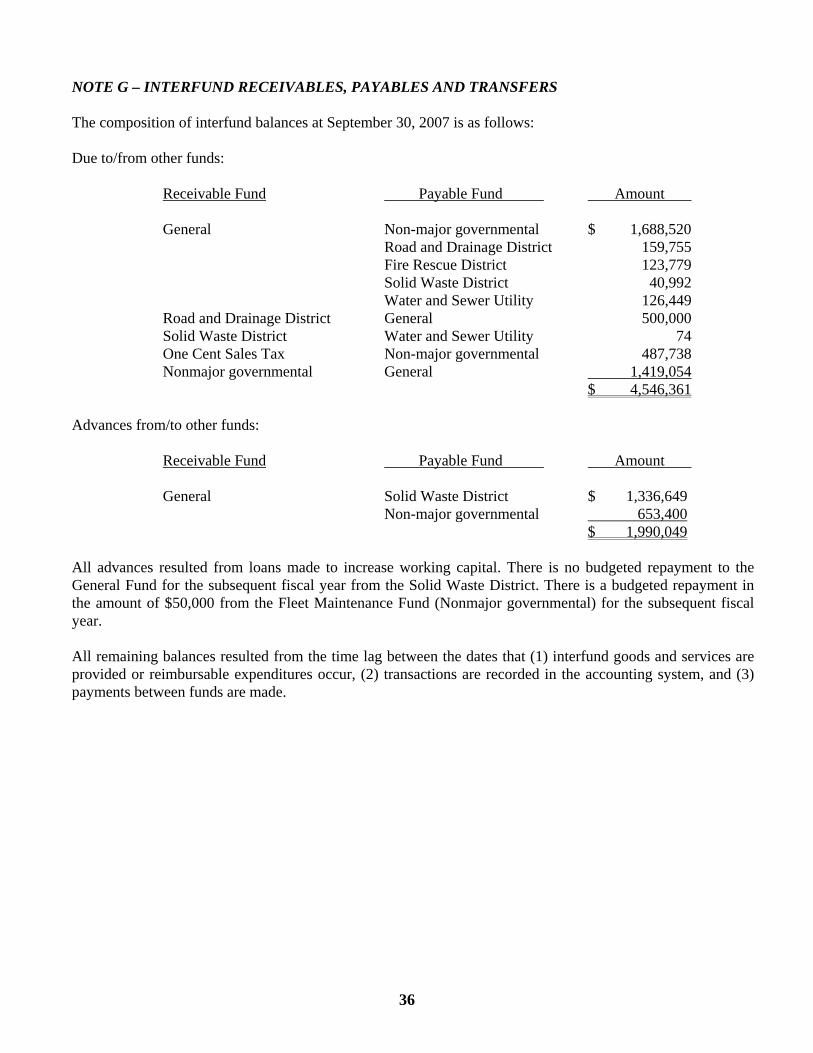
36
NOTE G – INTERFUND RECEIVABLES, PAYABLES AND TRANSFERS The composition of interfund balances at September 30, 2007 is as follows: Due to/from other funds:
Receivable Fund Payable Fund Amount General Non-major governmental $ 1,688,520 Road and Drainage District 159,755 Fire Rescue District 123,779 Solid Waste District 40,992 Water and Sewer Utility 126,449 Road and Drainage District General 500,000 Solid Waste District Water and Sewer Utility 74 One Cent Sales Tax Non-major governmental 487,738 Nonmajor governmental General 1,419,054 $ 4,546,361
Advances from/to other funds:
Receivable Fund Payable Fund Amount General Solid Waste District $ 1,336,649 Non-major governmental 653,400 $ 1,990,049
All advances resulted from loans made to increase working capital. There is no budgeted repayment to the General Fund for the subsequent fiscal year from the Solid Waste District. There is a budgeted repayment in the amount of $50,000 from the Fleet Maintenance Fund (Nonmajor governmental) for the subsequent fiscal year. All remaining balances resulted from the time lag between the dates that (1) interfund goods and services are provided or reimbursable expenditures occur, (2) transactions are recorded in the accounting system, and (3) payments between funds are made.
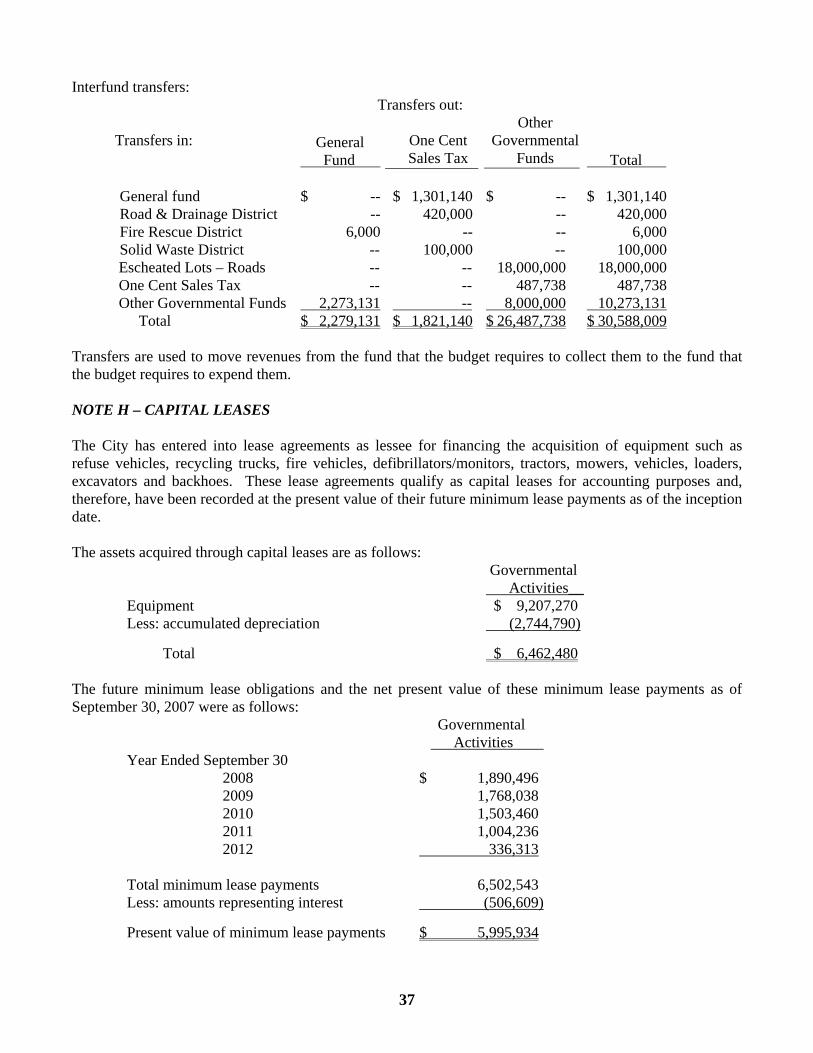
37
Interfund transfers: Transfers out: Transfers in: General
Fund
One Cent Sales Tax
Other Governmental
Funds Total General fund $ -- $ 1,301,140 $ -- $ 1,301,140 Road & Drainage District -- 420,000 -- 420,000 Fire Rescue District 6,000 -- -- 6,000 Solid Waste District -- 100,000 -- 100,000 Escheated Lots – Roads -- -- 18,000,000 18,000,000 One Cent Sales Tax -- -- 487,738 487,738 Other Governmental Funds 2,273,131 -- 8,000,000 10,273,131 Total $ 2,279,131 $ 1,821,140 $ 26,487,738 $ 30,588,009
Transfers are used to move revenues from the fund that the budget requires to collect them to the fund that the budget requires to expend them. NOTE H – CAPITAL LEASES The City has entered into lease agreements as lessee for financing the acquisition of equipment such as refuse vehicles, recycling trucks, fire vehicles, defibrillators/monitors, tractors, mowers, vehicles, loaders, excavators and backhoes. These lease agreements qualify as capital leases for accounting purposes and, therefore, have been recorded at the present value of their future minimum lease payments as of the inception date. The assets acquired through capital leases are as follows:
Governmental Activities__
Equipment $ 9,207,270 Less: accumulated depreciation (2,744,790)
Total $ 6,462,480 The future minimum lease obligations and the net present value of these minimum lease payments as of September 30, 2007 were as follows:
Governmental Activities Year Ended September 30 2008 $ 1,890,496 2009 1,768,038 2010 1,503,460 2011 1,004,236 2012 336,313 Total minimum lease payments 6,502,543 Less: amounts representing interest (506,609)
Present value of minimum lease payments $ 5,995,934
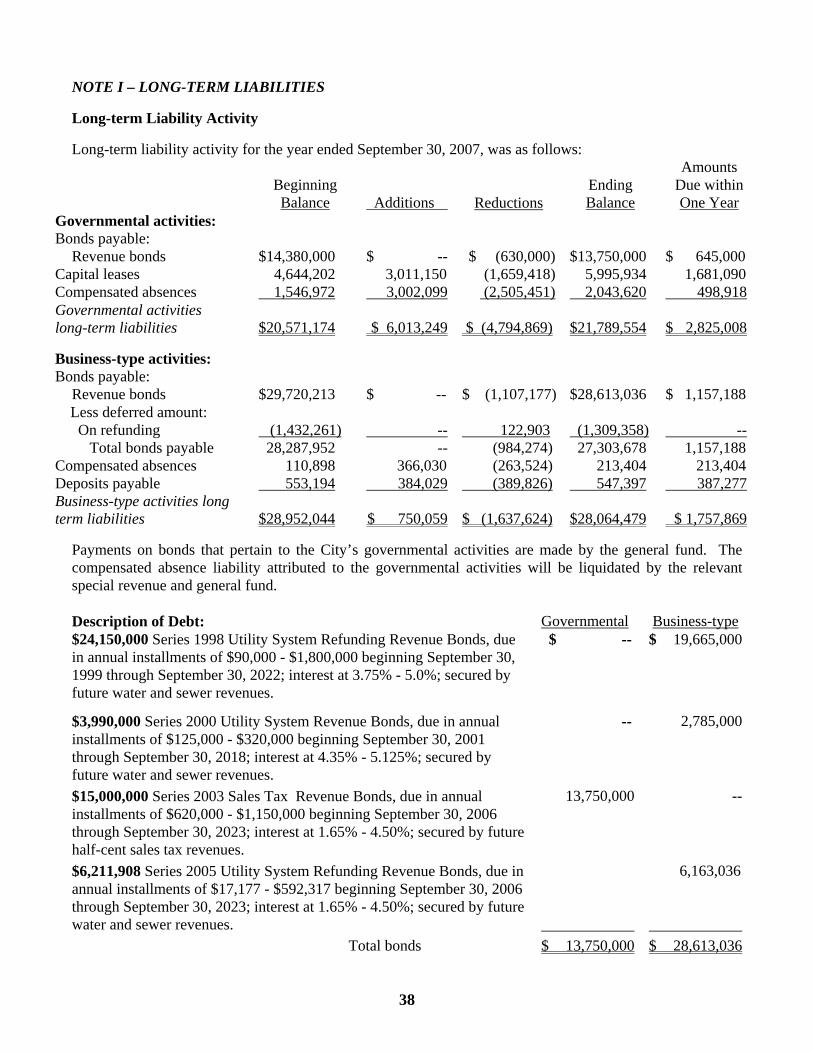
38
NOTE I – LONG-TERM LIABILITIES Long-term Liability Activity Long-term liability activity for the year ended September 30, 2007, was as follows:
Amounts Beginning Ending Due within Balance Additions Reductions Balance One Year Governmental activities: Bonds payable: Revenue bonds $14,380,000 $ -- $ (630,000) $13,750,000 $ 645,000 Capital leases 4,644,202 3,011,150 (1,659,418) 5,995,934 1,681,090 Compensated absences 1,546,972 3,002,099 (2,505,451) 2,043,620 498,918 Governmental activities long-term liabilities
$20,571,174 $ 6,013,249 $ (4,794,869)
$21,789,554 $ 2,825,008
Business-type activities: Bonds payable: Revenue bonds $29,720,213 $ -- $ (1,107,177) $28,613,036 $ 1,157,188 Less deferred amount: On refunding (1,432,261) -- 122,903 (1,309,358) -- Total bonds payable 28,287,952 -- (984,274) 27,303,678 1,157,188 Compensated absences 110,898 366,030 (263,524) 213,404 213,404 Deposits payable 553,194 384,029 (389,826) 547,397 387,277 Business-type activities long term liabilities $28,952,044 $ 750,059 $ (1,637,624) $28,064,479 $ 1,757,869
Payments on bonds that pertain to the City’s governmental activities are made by the general fund. The compensated absence liability attributed to the governmental activities will be liquidated by the relevant special revenue and general fund. Description of Debt: Governmental Business-type $24,150,000 Series 1998 Utility System Refunding Revenue Bonds, due in annual installments of $90,000 - $1,800,000 beginning September 30, 1999 through September 30, 2022; interest at 3.75% - 5.0%; secured by future water and sewer revenues.
$ --
$ 19,665,000
$3,990,000 Series 2000 Utility System Revenue Bonds, due in annual installments of $125,000 - $320,000 beginning September 30, 2001 through September 30, 2018; interest at 4.35% - 5.125%; secured by future water and sewer revenues.
--
2,785,000
$15,000,000 Series 2003 Sales Tax Revenue Bonds, due in annual installments of $620,000 - $1,150,000 beginning September 30, 2006 through September 30, 2023; interest at 1.65% - 4.50%; secured by future half-cent sales tax revenues.
13,750,000
--
$6,211,908 Series 2005 Utility System Refunding Revenue Bonds, due in annual installments of $17,177 - $592,317 beginning September 30, 2006 through September 30, 2023; interest at 1.65% - 4.50%; secured by future water and sewer revenues.
6,163,036
Total bonds $ 13,750,000 $ 28,613,036

39
Debt Maturity: Debt service requirements at September 30, 2007 were as follows:
Governmental Activities – Revenue Bonds Sales Tax Revenue Bonds
Year Ended Principal Interest September 30
2008 $ 645,000 $ 558,540 2009 660,000 543,221 2010 680,000 520,121 2011 710,000 494,621 2012 735,000 467,996
2013 – 2017 4,115,000 1,893,107 2018 – 2022 5,055,000 957,506
2023 1,150,000 51,750 Total $ 13,750,000 $ 5,486,862
Business-type Activities – Revenue Bonds Water and Sewer Utility
Year Ended Principal Interest September 30
2008 $ 1,157,188 $ 1,348,743 2009 1,208,577 1,297,705 2010 1,259,334 1,243,122 2011 1,320,122 1,478,177 2012 1,380,263 1,416,696
2013 – 2017 7,982,387 6,003,297 2018 – 2022 10,167,935 2,512,916 2023 – 2027 2,428,383 653,163 2028– 2030 1,708,847 141,281
Total $ 28,613,036 $ 16,095,100 Bond Issue Costs and Refunding Losses Bond issuance costs of $1,037,225 and original issue discounts of $314,269 incurred in conjunction with the issuance of the Utility System Refunding Revenue Bonds, Series 1998, are being amortized over the life of the bonds (25 years) using the bonds outstanding method. Amortization of issuance costs and discounts on the Series 1992 and 1998 bonds totaled $70,344 for the year ended September 30, 2007. The unamortized balance at September 30, 2007 is $597,709. A refunding loss of $1,335,510 incurred in conjunction with the issuance of the Utility System Refunding Revenue Bonds, Series 1998, is being amortized over the life of the bonds (25 years) using the bonds outstanding method. Amortization of the refunding loss on the Series 1998 bonds was $70,439 for the year ended September 30, 2007, and is included as a component of interest expense. Unamortized refunding loss of $598,516 is netted against bonds payable on the statements of net assets.
40
Bond issuance costs of $333,874 and an original issue discount of $29,255 incurred in conjunction with the issuance of the Sales Tax Revenue Bonds, Series 2003, are being amortized over the life of the bonds (20 years) using the straight-line method for the issuance costs and the bonds outstanding method for the discount. Amortization of issuance costs and discount on the Series 2003 bonds was $18,965 for the year ended September 30, 2007. The unamortized balance at September 30, 2007 is $287,370. Bond issuance costs of $65,494 incurred in conjunction with the issuance of the Utility System Refunding Revenue Bonds, Series 2005, are being amortized over the life of the bonds (25 years) using the straight line method. Amortization of issuance costs on the Series 2005 bonds was $2,620 for the year ended September 30, 2007. The unamortized balance at September 30, 2007 is $60,254. A refunding loss of $817,039 incurred in conjunction with the issuance of the Utility System Refunding Revenue Bonds, Series 2005, is being amortized over the life of the bonds (25 years) using the bonds outstanding method. Amortization of the refunding loss on the Series 2005 bonds was $52,464 for the year ended September 30, 2007, and is included as a component of interest expense. Unamortized refunding loss of $710,842 is netted against bonds payable on the statements of net assets. Deposits Payable Before rendering water or wastewater service, the City may require an applicant for service to satisfactorily establish credit by paying a cash deposit. The amount of the initial deposit shall be according to customer class and meter size. After the customer has established continuous utility service for a period of twenty-four months and met the following requirements, the customer’s security deposit will be refunded as a credit to their utility account: 1) customer has not been disconnected for nonpayment; 2) customer has not had a returned payment in the last six months; 3) customer has not tampered with the meter; and 4) customer has not used service in a fraudulent or unauthorized manner. Other Long Term Debt Information In prior years, the City defeased certain revenue bonds by placing the proceeds of new bonds in an irrevocable trust to provide for all future debt service payments on the old bonds. Accordingly, the trust account assets and the liability for the defeased bonds are not included in the City’s financial statements. On September 30, 2007, $5.84 million of bonds outstanding are considered defeased. Total interest paid for the year ended September 30, 2007 was $802,041 in the governmental funds and $1,519,021 in the enterprise fund. No interest costs were capitalized.

41
NOTE J – EMPLOYEE RETIREMENT SYSTEMS General Information - The City has three pension plans covering all full-time employees after meeting appropriate age and service requirements. They are the Florida Retirement System, the Municipal Police Officers’ Pension Trust Fund and the Municipal Firefighters’ Pension Trust Fund. The Florida Retirement System is a cost-sharing multiple-employer public employee retirement plan administered by the State of Florida and available to the City’s non-uniform (general) employees. The Police Officers’ and Firefighters’ Pension Plans, which are defined benefit, single-employer pension trust funds, issue financial reports that include financial statements and required supplementary information. The reports may be obtained from the City of North Port Finance Department. The North Port Police Officers’ and the North Port Firefighters’ Pension Plans have adopted Governmental Accounting Standards Board (GASB) Statement No. 25, Financial Reporting for Defined Benefit Pension Plans and Statement No. 27, Accounting for Pensions by State and Local Governmental Employers. In addition to other disclosures, the GASB requires for the current year and each of the two preceding years, annual pension cost, percentage of annual pension cost contributed and the net pension obligation at the end of the year. This information is presented later in this note. A schedule of funding progress and a schedule of employer contributions that include historical trend information about the annual required contributions of the employer are included as required supplementary information to the financial statements. FLORIDA RETIREMENT SYSTEM Plan Description - All full-time, non-uniform (general) employees are participants in the statewide Florida Retirement System under the authority of Florida Statutes, Chapter 121. The primary system is a defined benefit plan for all state, county, district school board, community college and university employees. Employees are eligible for normal retirement at or after age 62 with six years of creditable service, 25 years of special risk service at age 52, or 30 years of service regardless of age. Employees meeting these criteria are entitled to an annual retirement benefit in an amount equal to 1.6% to 3.0% of their average final compensation (AFC) times years of creditable service, depending on the class of employee (regular, special risk, etc.). The AFC is defined as the average of the five highest paid years preceding retirement. Benefits vest after six years of credited service. Vested employees may retire anytime after 6 years of service and receive a 5% benefit reduction for each year prior to normal retirement age or date. Disability and survivor benefits are also offered. Benefits are established by state statute. In 1987, the Legislature passed a bill that provides a constant 3% cost-of-living adjustment for retirees. The adjustment was formerly based on the Consumer Price Index with a maximum of 3%. The system publishes an annual financial report that includes financial statements and required supplementary information. The most recent available report is for the plan year ended June 30, 2007. That report may be obtained by writing to Division of Retirement, PO Box 9000, Tallahassee, FL 32315-9000, by calling (877) 377-1737, or accessing their Internet site at www.frs.state.fl.us/. Description of Funding Policy - This is a cost-sharing multi-employer plan available to governmental units within the state. Participating employers are required by statute to pay monthly contributions at actuarially determined rates that, expressed as percentages of annual covered payroll, are adequate to accumulate sufficient assets to pay benefits when due. Employees make no contributions to the Plan.
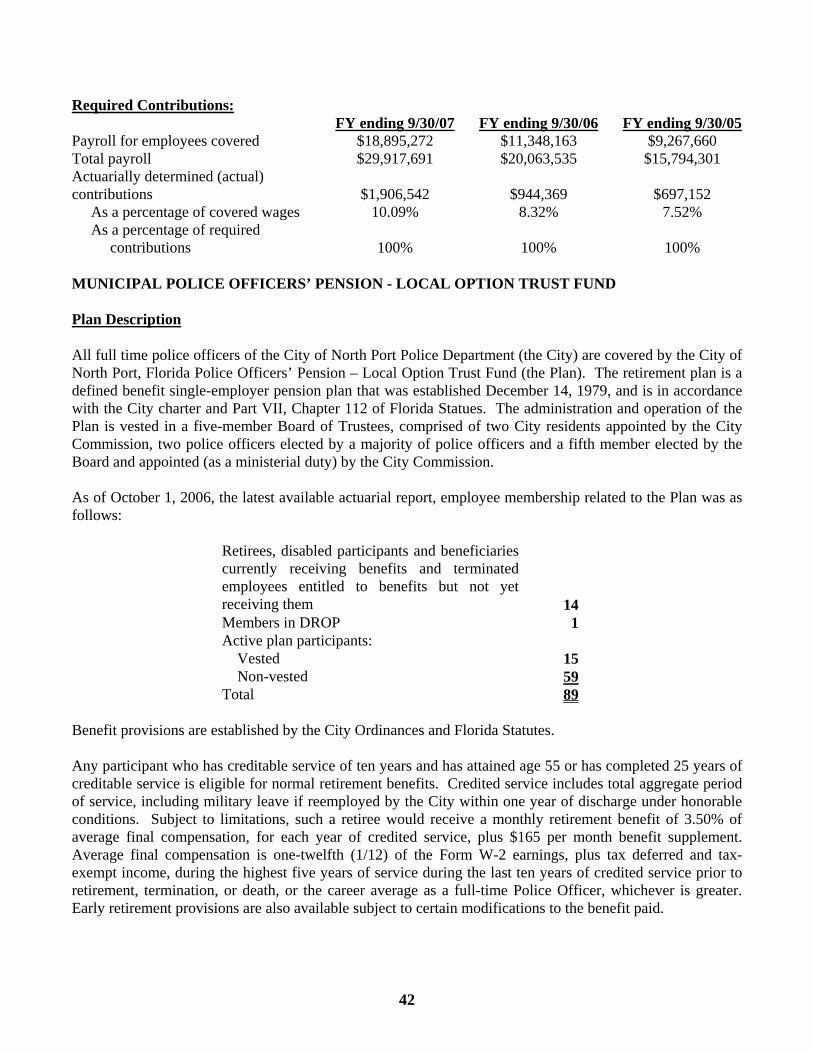
42
Required Contributions: FY ending 9/30/07 FY ending 9/30/06 FY ending 9/30/05 Payroll for employees covered $18,895,272 $11,348,163 $9,267,660 Total payroll $29,917,691 $20,063,535 $15,794,301 Actuarially determined (actual) contributions $1,906,542 $944,369
$697,152
As a percentage of covered wages 10.09% 8.32% 7.52% As a percentage of required contributions 100% 100% 100% MUNICIPAL POLICE OFFICERS’ PENSION - LOCAL OPTION TRUST FUND Plan Description All full time police officers of the City of North Port Police Department (the City) are covered by the City of North Port, Florida Police Officers’ Pension – Local Option Trust Fund (the Plan). The retirement plan is a defined benefit single-employer pension plan that was established December 14, 1979, and is in accordance with the City charter and Part VII, Chapter 112 of Florida Statues. The administration and operation of the Plan is vested in a five-member Board of Trustees, comprised of two City residents appointed by the City Commission, two police officers elected by a majority of police officers and a fifth member elected by the Board and appointed (as a ministerial duty) by the City Commission. As of October 1, 2006, the latest available actuarial report, employee membership related to the Plan was as follows:
Retirees, disabled participants and beneficiaries currently receiving benefits and terminated employees entitled to benefits but not yet receiving them
14 Members in DROP 1 Active plan participants: Vested 15 Non-vested 59 Total 89
Benefit provisions are established by the City Ordinances and Florida Statutes. Any participant who has creditable service of ten years and has attained age 55 or has completed 25 years of creditable service is eligible for normal retirement benefits. Credited service includes total aggregate period of service, including military leave if reemployed by the City within one year of discharge under honorable conditions. Subject to limitations, such a retiree would receive a monthly retirement benefit of 3.50% of average final compensation, for each year of credited service, plus $165 per month benefit supplement. Average final compensation is one-twelfth (1/12) of the Form W-2 earnings, plus tax deferred and tax-exempt income, during the highest five years of service during the last ten years of credited service prior to retirement, termination, or death, or the career average as a full-time Police Officer, whichever is greater. Early retirement provisions are also available subject to certain modifications to the benefit paid.
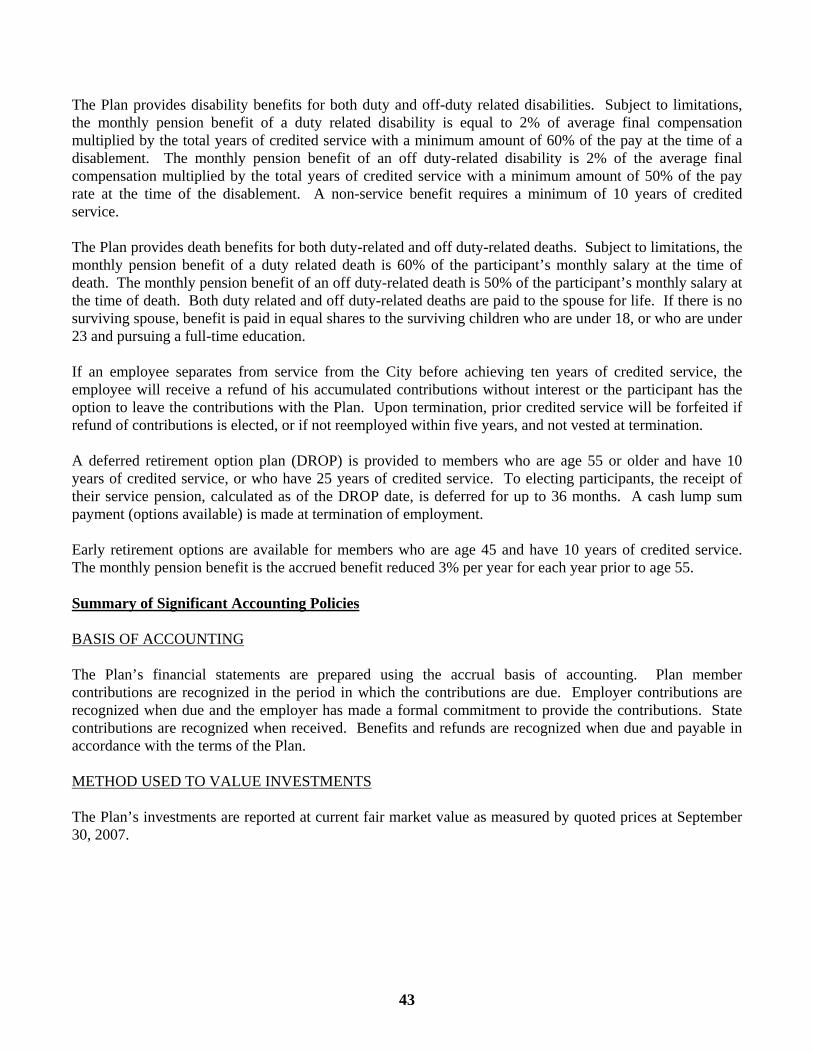
43
The Plan provides disability benefits for both duty and off-duty related disabilities. Subject to limitations, the monthly pension benefit of a duty related disability is equal to 2% of average final compensation multiplied by the total years of credited service with a minimum amount of 60% of the pay at the time of a disablement. The monthly pension benefit of an off duty-related disability is 2% of the average final compensation multiplied by the total years of credited service with a minimum amount of 50% of the pay rate at the time of the disablement. A non-service benefit requires a minimum of 10 years of credited service. The Plan provides death benefits for both duty-related and off duty-related deaths. Subject to limitations, the monthly pension benefit of a duty related death is 60% of the participant’s monthly salary at the time of death. The monthly pension benefit of an off duty-related death is 50% of the participant’s monthly salary at the time of death. Both duty related and off duty-related deaths are paid to the spouse for life. If there is no surviving spouse, benefit is paid in equal shares to the surviving children who are under 18, or who are under 23 and pursuing a full-time education. If an employee separates from service from the City before achieving ten years of credited service, the employee will receive a refund of his accumulated contributions without interest or the participant has the option to leave the contributions with the Plan. Upon termination, prior credited service will be forfeited if refund of contributions is elected, or if not reemployed within five years, and not vested at termination. A deferred retirement option plan (DROP) is provided to members who are age 55 or older and have 10 years of credited service, or who have 25 years of credited service. To electing participants, the receipt of their service pension, calculated as of the DROP date, is deferred for up to 36 months. A cash lump sum payment (options available) is made at termination of employment. Early retirement options are available for members who are age 45 and have 10 years of credited service. The monthly pension benefit is the accrued benefit reduced 3% per year for each year prior to age 55. Summary of Significant Accounting Policies BASIS OF ACCOUNTING The Plan’s financial statements are prepared using the accrual basis of accounting. Plan member contributions are recognized in the period in which the contributions are due. Employer contributions are recognized when due and the employer has made a formal commitment to provide the contributions. State contributions are recognized when received. Benefits and refunds are recognized when due and payable in accordance with the terms of the Plan. METHOD USED TO VALUE INVESTMENTS The Plan’s investments are reported at current fair market value as measured by quoted prices at September 30, 2007.

44
Funding Policy and Contributions CONTRIBUTIONS Plan members are required to contribute 8% of their annual covered salary. The payments are deducted from the employees’ wages or salary and remitted by the City to the Plan at the end of each pay period. The City contributes an amount to make the Fund actuarially sound, but not less than 18% of total salary. Administrative costs of the plan are financed through investment earnings. In addition, the Plan receives an annual distribution of casualty insurance premium tax monies from the State of Florida pursuant to Chapter 185, Florida Statutes (the state contribution). The actuarially determined employer contribution may be reduced by the amount that the actual state contribution exceeds a certain amount specified in the actuarial valuation. For the year ended September 30, 2007, that amount was $146,546. Payments of fringe benefits and salaries on-behalf of the City’s employees are recognized as revenues and expenditure/expense during the period. The annual required contribution for the year ended September 30, 2007, was determined based on an actuarial valuation conducted as of October 1, 2006, and was adjusted for the actual state contribution as follows:
October 1, 2006Original Valuation
Total required contribution 1,051,181$ Expected member contribution (271,042) Required employer contribution 780,139 State contribution (146,546)
Required net city contribution 633,593$
The required City contribution for the year ended September 30, 2007, would be the greater of $633,593 or 18% of covered payroll. Covered payroll refers to all compensation paid by the City to active employees covered by the Plan on which contributions to the Plan are based. On the accrual basis, total covered police officers’ payroll amounted to $5,063,496 and the City contribution was $911,429. The actuarial valuation which determined the annual required contribution for the 2007 fiscal year used the entry age normal cost method. The actuarial assumptions in the October 1, 2006, valuation included: (a) 8.0% investment rate of return (net of administrative expenses); (b) projected salary increases of 7.5%; and (c) 3% rate of inflation. The actuarial value of assets was determined using techniques that smooth the effects of short-term volatility in the market value of investments over a four year period. The unfunded actuarial accrued liability is being amortized as a level percentage of projected payroll on a closed basis. The remaining amortization period at October 1, 2006, was 30 years. The significant actuarial assumptions used to determine the actuarially determined employer contribution requirement are the same as those used to compute the actuarial accrued liability. There were no changes in the current year in the actuarial funding method or benefit provisions.

45
Following is three-year trend information on annual pension cost: Three Year Trend Information
Year Ending
Annual
Pension Cost (APC)
Percentage
of APC Contributed
Net Pension Obligation
(Asset) 9/30/06 $ 530,079 126% $ (137,014) 9/30/05 564,258 100% -- 9/30/04 490,174 100% --
Cash and Investments The cost and market value of investments of the Plan at September 30, 2007 are as follows:
Cost Market Value Money market funds $ 704,845 $ 704,845U.S. Government securities 1,100,867 1,123,005U.S. Government agency securities 1,976,511 1,978,263Equities 6,795,291 7,436,490Corporate bonds 1,427,268 1,418,990Total Investments $ 12,004,782 $ 12,661,593
The Plan recognizes mutual funds that are invested in money market funds as cash equivalents for financial reporting purposes. Investments are held by a custodian and managed by investment managers. The investment managers provide quarterly reports of the investment portfolio and its performance to the Board of Trustees.
Fair Less Than Years Years Years MoreInvestment Type Market 1 Year 1-5 6-10 Than 10
Cash equivalent money market fund 704,845$ 704,845$ -$ -$ -$ U.S. Government securities 1,123,005 - 508,580 614,425 - U.S. Government agencies 1,978,263 - 646,612 150,609 1,181,042 Corporate securities 7,436,490 7,436,490 - - - Corporate bonds 1,418,990 124,058 696,559 598,373 - Total fair value 12,661,593$ 8,265,393$ 1,851,751$ 1,363,407$ 1,181,042$
Interest rate risk is the risk that changes in interest rates will adversely affect the fair value of an investment. The Plan realizes that reasonable consistency of return and protection of assets against the inroads of inflation are paramount. However, the volatility of interest rates and securities markets make it necessary to judge results within the context of several years rather than over short periods of one or two years or less.
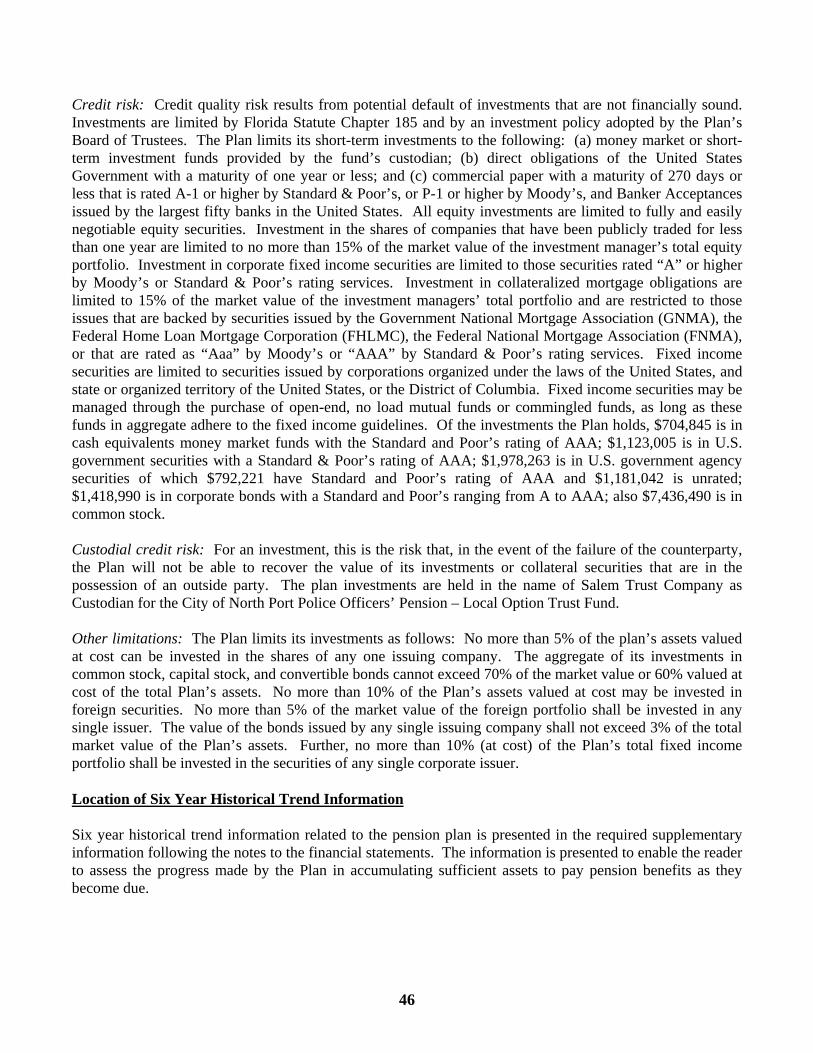
46
Credit risk: Credit quality risk results from potential default of investments that are not financially sound. Investments are limited by Florida Statute Chapter 185 and by an investment policy adopted by the Plan’s Board of Trustees. The Plan limits its short-term investments to the following: (a) money market or short-term investment funds provided by the fund’s custodian; (b) direct obligations of the United States Government with a maturity of one year or less; and (c) commercial paper with a maturity of 270 days or less that is rated A-1 or higher by Standard & Poor’s, or P-1 or higher by Moody’s, and Banker Acceptances issued by the largest fifty banks in the United States. All equity investments are limited to fully and easily negotiable equity securities. Investment in the shares of companies that have been publicly traded for less than one year are limited to no more than 15% of the market value of the investment manager’s total equity portfolio. Investment in corporate fixed income securities are limited to those securities rated “A” or higher by Moody’s or Standard & Poor’s rating services. Investment in collateralized mortgage obligations are limited to 15% of the market value of the investment managers’ total portfolio and are restricted to those issues that are backed by securities issued by the Government National Mortgage Association (GNMA), the Federal Home Loan Mortgage Corporation (FHLMC), the Federal National Mortgage Association (FNMA), or that are rated as “Aaa” by Moody’s or “AAA” by Standard & Poor’s rating services. Fixed income securities are limited to securities issued by corporations organized under the laws of the United States, and state or organized territory of the United States, or the District of Columbia. Fixed income securities may be managed through the purchase of open-end, no load mutual funds or commingled funds, as long as these funds in aggregate adhere to the fixed income guidelines. Of the investments the Plan holds, $704,845 is in cash equivalents money market funds with the Standard and Poor’s rating of AAA; $1,123,005 is in U.S. government securities with a Standard & Poor’s rating of AAA; $1,978,263 is in U.S. government agency securities of which $792,221 have Standard and Poor’s rating of AAA and $1,181,042 is unrated; $1,418,990 is in corporate bonds with a Standard and Poor’s ranging from A to AAA; also $7,436,490 is in common stock. Custodial credit risk: For an investment, this is the risk that, in the event of the failure of the counterparty, the Plan will not be able to recover the value of its investments or collateral securities that are in the possession of an outside party. The plan investments are held in the name of Salem Trust Company as Custodian for the City of North Port Police Officers’ Pension – Local Option Trust Fund. Other limitations: The Plan limits its investments as follows: No more than 5% of the plan’s assets valued at cost can be invested in the shares of any one issuing company. The aggregate of its investments in common stock, capital stock, and convertible bonds cannot exceed 70% of the market value or 60% valued at cost of the total Plan’s assets. No more than 10% of the Plan’s assets valued at cost may be invested in foreign securities. No more than 5% of the market value of the foreign portfolio shall be invested in any single issuer. The value of the bonds issued by any single issuing company shall not exceed 3% of the total market value of the Plan’s assets. Further, no more than 10% (at cost) of the Plan’s total fixed income portfolio shall be invested in the securities of any single corporate issuer. Location of Six Year Historical Trend Information Six year historical trend information related to the pension plan is presented in the required supplementary information following the notes to the financial statements. The information is presented to enable the reader to assess the progress made by the Plan in accumulating sufficient assets to pay pension benefits as they become due.

47
Summary information as of the latest actuarial valuation follows:
Valuation date 10/1/06 Actuarial cost method Entry age normal Amortization method Level percentage of pay - closed Remaining amortization period 30 years Asset valuation method 4 year smooth Actuarial assumptions: Real investment return 8.0% Projected salary increases * 7.5% * Includes inflation rate of 3.0%
MUNICIPAL FIREFIGHTERS’ PENSION - LOCAL OPTION TRUST FUND Plan Description All full time firefighters of the City of North Port Fire Department are covered by the City of North Port, Florida Firefighters’ Pension - Local Option Trust Fund (the Plan). The Plan is a single-employer defined benefit pension plan that was established November 5, 1974, pursuant to Florida Statutes, Chapter 175, and City Ordinance 74-13. The Plan was amended most recently by Ordinance 07-03. This Ordinance amended the definition of credited service, the deferred option plan and other various administrative topics. The administration and operation of the Plan is vested in a five-member Board of Trustees made up of two City Commission appointees, two members of the Fire Department elected by the membership, and a fifth member elected by the other four trustees and appointed by the City Commission. As of October 1, 2006, membership consisted of:
Retirees and Beneficiaries Currently Receiving Benefits
7
Terminated Employees Entitled to Benefits, But Not Yet Receiving Them
3
Member in DROP 1 Active plan participants: Vested 28 Non-vested 47 Total 86
Benefit provisions are established by the City Ordinances and Florida Statutes. Firefighters’ are eligible for normal retirement at the earlier of ten years of credited service and attainment of age 55 or 25 years of credited service and attainment of age 52. Firefighters meeting these criteria are entitled to an annual retirement benefit, payable monthly, in an amount equal to 3.5% of their average final monthly compensation (AFC) times years of creditable service. The AFC is defined as the average of the five highest paid years during the last ten years preceding retirement. Ten year certain and life annuity options are available for the payment of retirement benefits. Service retirees, vested terminated members and their beneficiaries receive annual 3% benefit increases beginning at age 55 and ceasing at age 63.

48
The Plan also provides death and disability benefits. Firefighters with ten or more years of credited service are eligible for death benefits equal to their monthly accrued benefit payable to the beneficiary for ten years. Disability benefits provided by the Plan are equal to 3.5% of AFC times AFC years of credited services, and no less than 42% of the AFC for service incurred disabilities and 3.5% of AFC times years of credited service for non-service incurred disabilities, with a minimum required ten years credited service. If an employee leaves the employment of the City before attaining ten years of service, the accumulated contributions made by the employee are refunded. If an employee leaves the employment of the City after ten years of service, but before reaching retirement age, the employee is entitled to a monthly retirement benefit determined in the same manner as for normal or early retirement provided the employee does not withdraw their contributions. A deferred retirement option plan (DROP) is provided to members who are age 55 and have ten years of credited service, or age 52 with 25 years of credited service. To electing participants, the receipt of their service pension, calculated as of the DROP date, is deposited into a DROP account for up to 60 months. A cash lump-sum payment or other optional form of payment is made at termination of employment. Summary of Significant Accounting Policies BASIS OF ACCOUNTING The City of North Port, Florida Firefighters’ Pension – Local Option Trust Fund financial statements are prepared on the accrual basis of accounting. Plan member contributions are recognized in the period in which the contributions are due. Employer contributions are recognized when due and the employer has made a formal commitment to provide the contributions. State contributions are recognized when received. Benefits and refunds are recognized when due and payable in accordance with the terms of the Plan. METHOD USED TO VALUE INVESTMENTS The Plan’s investments are reported at current fair market value as measured by quoted prices at September 30, 2007. Funding Policy and Contributions Plan members are required to contribute 10.3% of their annual covered salary. The payments are deducted from the employees’ wages or salary and remitted by the City to the Plan at the end of each pay period.

49
The City makes quarterly contributions to the Plan based on an actuarially determined employer contribution, as adjusted, or the minimum percentage specified by City ordinance, whichever is greater. In addition, the Plan receives an annual distribution of property insurance premium tax monies from the State of Florida pursuant to Chapter 175, Florida Statutes (the “state contribution”). The actuarially determined employer contribution may be reduced by the amount the actual state contribution exceeds a certain amount specified in the actuarial valuation. For the year ended September 30, 2007, that amount was $170,286. Payments of fringe benefits and salaries on-behalf of the City’s employees are recognized as revenues and expenditure/expense during the period. The annual required contribution for the year ended September 30, 2007, was determined based on an actuarial valuation conducted as of October 1, 2006:
October 1, 2006Original Valuation
Total required contribution 1,273,278$ Expected member contribution (410,761) Required employer contribution 862,517 State contribution (170,286)
Required net City contribution 692,231$
The City is required by ordinance to contribute a minimum of 18% of covered payroll. The required City contribution for the year ended September 30, 2007, therefore, was the greater of $692,231 or 18% of covered payroll. Covered payroll refers to all compensation paid by the City to active employees covered by the Plan on which contributions to the Plan are based. On the accrual basis, total covered firefighters’ payroll amounted to $5,217,862 and the City contribution was $939,364. The actuarial valuation which determined the annual required contribution for the 2007 fiscal year used the entry age normal cost method. The actuarial assumptions in the valuation and statement included: (a) 8.0% investment rate of return (net of administrative expenses); (b) projected salary increases of 7.5%; (c) 3.0% rate of inflation and (d) 3.0% per year postretirement benefit increase for retirees from 55 through 63 years of age. The actuarial value of assets were determined using techniques that smooth the effects of short-term volatility in the market value of investments over a four-year period. The unfunded actuarial accrued liability is being amortized as a level percentage of projected payroll on a closed basis. The remaining amortization period at October 1, 2006 was 30 years. The significant actuarial assumptions used to determine the actuarially determined employer contribution requirement are the same as those used to compute the actuarial accrued liability. There were no changes in the current year in the actuarial funding method or benefit provisions. The following is three-year trend information on annual pension cost: Three Year Trend Information
Year
Ending
Annual Pension Cost
(APC)*
Percentage of APC
Contributed
Net Pension Obligation
(Asset) 9/30/06 $ 815,315 136% $ (214,631) 9/30/05 672,097 100% -- 9/30/04 567,395 100% --
* Excludes State of Florida contribution under Chapter 175, Florida statues.

50
Investments The cost and market value of the investments of the Plan at September 30, 2007, are as follows (investments that represent 5% or more of the Plan’s net assets are separately identified):
Cost Market Value Money market funds $ 944,846 $ 944,846U.S. Government securities 1,791,422 1,823,151U.S. Government agency securities 2,718,387 2,720,295Equities 8,921,760 10,308,584Corporate bonds 1,731,184 1,733,264 Total Investments $ 16,107,599 $ 17,530,140
Investments are held by a custodian and managed by investment managers. The investment managers provide quarterly reports of the investment portfolio and its performance to the Board of Trustees. Performance is evaluated quarterly by Trusco, MBI, Snow, CMA, & Wentworth.
Fair Less Than Years Years Years MoreInvestment Type Market 1 Year 1-5 6-10 Than 10
Cash equivalent money market fund 944,846$ 944,846$ -$ -$ -$ U.S. Government securities 1,823,151 - 670,532 915,490 237,129 U.S. Government agencies 2,720,295 99,719 330,837 199,562 2,090,177 Corporate bonds 1,733,264 39,537 1,187,314 - 506,413 Corporate securities 10,308,584 10,308,584 - - - Total fair value 17,530,140$ 11,392,686$ 2,188,683$ 1,115,052$ 2,833,719$
The Plan has adopted an investment policy pursuant to Chapter 175, Florida Statutes that establishes permitted investments, asset allocation limits and issuer limits, credit rating requirements, and maturity limits, to protect the Plan’s cash and investment assets. The Plan recognizes mutual finds that are invested in money market funds as cash equivalents for financial reporting purposes. Interest rate risk is the risk that changes in interest rates will adversely affect the fair value of an investment. The Plan realizes that reasonable consistency of return and protection of assets against the inroads of inflation are paramount. However, the volatility of interest rates and securities markets make it necessary to judge results within the context of several years rather than over short periods. Credit Risk – Credit quality risk results from potential default of investments that are not financially sound. Investments are limited by Florida Statute, Chapter 175, and by an investment policy adopted by the Plan’s Board of Trustees. The Plan limits its short-term investments to the following: (a) time, savings and money market accounts insured by the FDIC providing the amount deposited does not exceed insured amounts; (b) obligations insured by the United States Government or obligations guaranteed as to principal and interest by the United State Government or by an agency of the United State Government; and (c) stocks, commingled funds and bonds or other evidences of indebtedness, issued or guaranteed by a corporation organized under

51
the laws of the United States, any state or organized territory of the United States or the District of Columbia, bonds issued by U.S. Corporations, structured mortgage products issued by the United States Government, and mortgage related or asset backed securities not issued by the United States Government, government agency or instrumentality, and bonds issued by municipal issuers, provided the securities meet the following criteria: for fixed income investments, all securities issued by a corporation shall hold a rating in one of the three highest classifications by a major rating service and the total fixed income portfolio shall have a weighted average of credit quality of Standard & Poor’s “AA” or Moody’s “P1”; equity securities must be traded on a national exchange; and money market investments must be Standard & Poor’s “A1” or Moody’s “P1”. Of the investments the Plan holds, $944,846 is in cash equivalents money market funds with a Standard and Poor’s rating of AAA; $1,586,022 is in Treasury Notes with a Moody rating of Aaa; U.S. government agency notes of $630,117 with a Standard and Poor’s rating of AAA; $2,327,308 of unrated U.S. government agency investments; $1,673,204 is in corporate bonds rated by Standard and Poor’s with a range of A+ through AAA; $60,059 is in foreign bonds with a Standard and Poor’s A rating; $10,308,584 is in common stock. Concentration of Credit Risk – Concentration of credit risk is the risk of loss attributable to the quantity of the Plan’s investment in a single issuer. Not more than 5% of the Plan’s assets shall be invested in the common stock of any one issuing company, nor shall the aggregate investment in any one issuing company exceed 5% of the outstanding capital stock of the company. The value of bonds issued by any single corporation shall not exceed 3% of the Plan’s assets. Investments in corporate common stock and convertible bonds shall not exceed 60% of the Plan’s investments at cost, or 70% of the Plan’s investments at market value. For foreign equities, no more than 5% of the market value of the international portfolio shall be invested in any single issuer. Foreign securities shall not exceed 10% of the value of the Plan’s investments at cost. Custodial Credit Risk – For an investment, custodial credit risk is the risk that, in the event of the failure of the counterparty, the Plan will be able to recover the value of its investments or collateral securities that are in the possession of an obligated third party. The Plan investments are held in the name of Salem Trust Company as custodian for the City of North Port Firefighters’ Pension – Local Option Trust Fund. Location of Six Year Historical Trend Information Six-year historical trend information is designed to provide information regarding the Plan’s progress made in accumulating sufficient assets to pay benefits when due. The trend information that is currently available is presented in the required supplementary information following the notes to the financial statements. Summary information as of the latest actuarial valuation follows:
Valuation date 10/1/06 Actuarial cost method Entry age normal Amortization method Level percentage of pay - closed Remaining amortization period 30 years Asset valuation method 4 year smooth Actuarial assumptions: Real investment return 8.0% Projected salary increases * 7.5% Post Retirement COLA 3.0% (Age 55-63) * Includes inflation rate of 3.0%
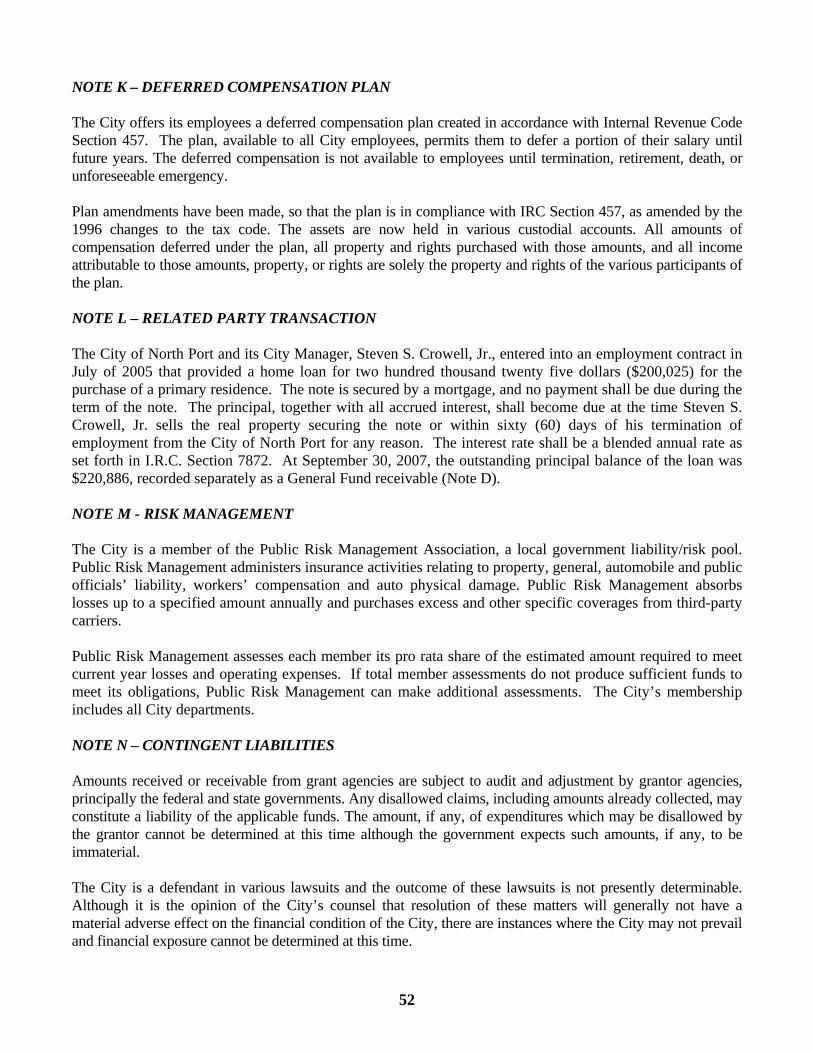
52
NOTE K – DEFERRED COMPENSATION PLAN The City offers its employees a deferred compensation plan created in accordance with Internal Revenue Code Section 457. The plan, available to all City employees, permits them to defer a portion of their salary until future years. The deferred compensation is not available to employees until termination, retirement, death, or unforeseeable emergency. Plan amendments have been made, so that the plan is in compliance with IRC Section 457, as amended by the 1996 changes to the tax code. The assets are now held in various custodial accounts. All amounts of compensation deferred under the plan, all property and rights purchased with those amounts, and all income attributable to those amounts, property, or rights are solely the property and rights of the various participants of the plan. NOTE L – RELATED PARTY TRANSACTION The City of North Port and its City Manager, Steven S. Crowell, Jr., entered into an employment contract in July of 2005 that provided a home loan for two hundred thousand twenty five dollars ($200,025) for the purchase of a primary residence. The note is secured by a mortgage, and no payment shall be due during the term of the note. The principal, together with all accrued interest, shall become due at the time Steven S. Crowell, Jr. sells the real property securing the note or within sixty (60) days of his termination of employment from the City of North Port for any reason. The interest rate shall be a blended annual rate as set forth in I.R.C. Section 7872. At September 30, 2007, the outstanding principal balance of the loan was $220,886, recorded separately as a General Fund receivable (Note D). NOTE M - RISK MANAGEMENT The City is a member of the Public Risk Management Association, a local government liability/risk pool. Public Risk Management administers insurance activities relating to property, general, automobile and public officials’ liability, workers’ compensation and auto physical damage. Public Risk Management absorbs losses up to a specified amount annually and purchases excess and other specific coverages from third-party carriers. Public Risk Management assesses each member its pro rata share of the estimated amount required to meet current year losses and operating expenses. If total member assessments do not produce sufficient funds to meet its obligations, Public Risk Management can make additional assessments. The City’s membership includes all City departments. NOTE N – CONTINGENT LIABILITIES Amounts received or receivable from grant agencies are subject to audit and adjustment by grantor agencies, principally the federal and state governments. Any disallowed claims, including amounts already collected, may constitute a liability of the applicable funds. The amount, if any, of expenditures which may be disallowed by the grantor cannot be determined at this time although the government expects such amounts, if any, to be immaterial. The City is a defendant in various lawsuits and the outcome of these lawsuits is not presently determinable. Although it is the opinion of the City’s counsel that resolution of these matters will generally not have a material adverse effect on the financial condition of the City, there are instances where the City may not prevail and financial exposure cannot be determined at this time.
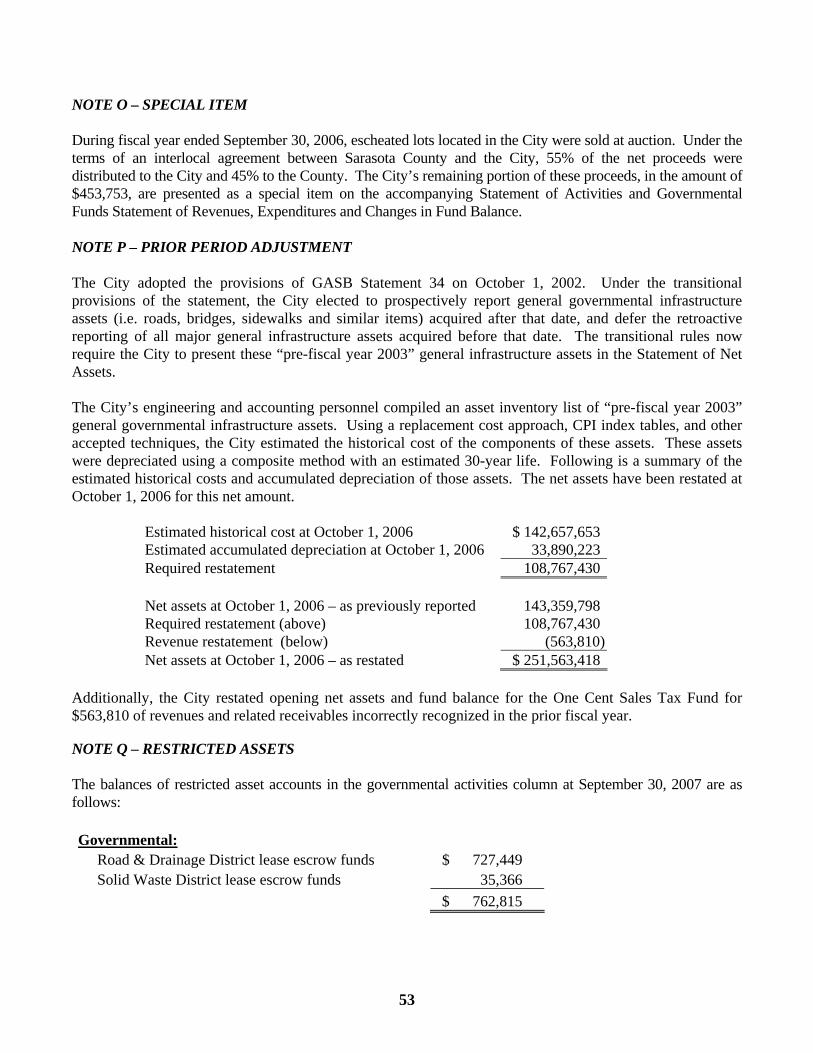
53
NOTE O – SPECIAL ITEM During fiscal year ended September 30, 2006, escheated lots located in the City were sold at auction. Under the terms of an interlocal agreement between Sarasota County and the City, 55% of the net proceeds were distributed to the City and 45% to the County. The City’s remaining portion of these proceeds, in the amount of $453,753, are presented as a special item on the accompanying Statement of Activities and Governmental Funds Statement of Revenues, Expenditures and Changes in Fund Balance. NOTE P – PRIOR PERIOD ADJUSTMENT The City adopted the provisions of GASB Statement 34 on October 1, 2002. Under the transitional provisions of the statement, the City elected to prospectively report general governmental infrastructure assets (i.e. roads, bridges, sidewalks and similar items) acquired after that date, and defer the retroactive reporting of all major general infrastructure assets acquired before that date. The transitional rules now require the City to present these “pre-fiscal year 2003” general infrastructure assets in the Statement of Net Assets. The City’s engineering and accounting personnel compiled an asset inventory list of “pre-fiscal year 2003” general governmental infrastructure assets. Using a replacement cost approach, CPI index tables, and other accepted techniques, the City estimated the historical cost of the components of these assets. These assets were depreciated using a composite method with an estimated 30-year life. Following is a summary of the estimated historical costs and accumulated depreciation of those assets. The net assets have been restated at October 1, 2006 for this net amount.
Estimated historical cost at October 1, 2006 $ 142,657,653 Estimated accumulated depreciation at October 1, 2006 33,890,223 Required restatement 108,767,430 Net assets at October 1, 2006 – as previously reported 143,359,798 Required restatement (above) 108,767,430 Revenue restatement (below) (563,810) Net assets at October 1, 2006 – as restated $ 251,563,418
Additionally, the City restated opening net assets and fund balance for the One Cent Sales Tax Fund for $563,810 of revenues and related receivables incorrectly recognized in the prior fiscal year. NOTE Q – RESTRICTED ASSETS The balances of restricted asset accounts in the governmental activities column at September 30, 2007 are as follows: Governmental: Road & Drainage District lease escrow funds $ 727,449 Solid Waste District lease escrow funds 35,366 $ 762,815
54
The balances of restricted asset accounts in the business-type activities column at September 30, 2007 are as follows: Water and Sewer Enterprise: Renewal and replacement funds $ 1,415,096 Water impact fees 10,086,454 Sewer impact fees 14,101,692 Customer deposits 547,397 $ 26,150,639
NOTE R – POSTEMPLOYMENT BENEFITS OTHER THAN PENSIONS Pursuant to City personnel policies, the City offers all retiring employees the opportunity to continue participating in the group health and dental insurance plan. Retirees who do not choose to continue participation lose eligibility to participate in the future. Participating retirees pay 100% (employer and employee portion) of the premium cost applicable to an active employee. Expenditures for these benefits are recognized as premiums become due. Approximately ten retirees participate in the program. The costs for retiree claims are included with active employee participants in calculating the insurance carrier’s premium amounts. The liability for postemployment health care and dental benefits cannot be reasonably estimated without separating the retirees from the active employees; therefore, no liability for postemployment benefits has been accrued or funded at September 30, 2007. NOTE S – SUBSEQUENT EVENTS State Board of Administration’s Local Government Surplus Funds Trust Fund Investment Pool: As discussed in Note C, at September 30, 2007, the City had $73,128,173 invested in the State Board of Administration’s Local Government Surplus Funds Trust Fund Investment Pool (Pool). On November 29, 2007 the State Board of Administration implemented a temporary freeze on the assets held in the Pool due to an unprecedented amount of withdrawals from the Fund coupled with the absence of market liquidity for certain securities within the Pool. The significant amount of withdrawals followed reports that the Pool held asset-backed commercial paper that was subject to sub prime mortgage risk. On December 4, 2007, based on recommendations from an outside financial advisor, the State Board of Administration restructured the Pool into two separate pools. Pool A consisted of all money market appropriate assets, which was approximately $12 billion or 86% of Pool assets. Pool B consisted of assets that either defaulted on a payment, paid more slowly than expected, and/or had any significant credit and liquidity risk, which was approximately $2 billion or 14% of Pool assets. At the time of the restructuring, all current pool participants had their existing balances proportionately allocated into Pool A and Pool B. Currently, Pool A participants may withdraw 50% of their balance or $8 million, whichever is greater, without penalty. Withdrawals from Pool A in excess of the above limit are subject to a 2% redemption fee. New investments in Pool A are not subject to the redemption fee or withdrawal restrictions. Future withdrawal provisions from Pool A will be subject to further evaluation based on the maturities of existing investments and the liquidity requirements of the Pool. On December 21, 2007, Standard and Poor’s Ratings Services assigned its “AAAM” principal stability fund rating to Pool A. Currently, Pool B participants are prohibited from withdrawing any amount from the Pool and a formal withdrawal policy has not yet been developed. Market valuations of the assets held in Pool B are not readily determinable.
55
On February 11, 2008, the City Commission elected to remove all funds invested in Fund A and pay the 2% redemption fee of $678,290. As of June 30, 2008, the City has $2,917,526 invested in Pool B. Additional information regarding the Local Government Surplus Funds Trust Fund may be obtained from the State Board of Administration. Constitutional Amendment 1: On January 29, 2008, the Florida electorate approved an amendment to the Florida Constitution relative to property taxation. This amendment (referred to as Amendment 1) was placed on the ballot by the Florida Legislature at a special session held in October 2007. With respect to homestead property, Amendment 1 increases the current $25,000 homestead exemption by another $25,000 (for property values between $50,000 - $75,000), except for school district taxes. Since the new $25,000 homestead exemption does not apply to school district taxes, this effectively amounts to a $15,000 increase to the existing homestead exemption, resulting in an estimated annual savings of $240 for an average homeowner. Amendment 1 also allows property owners to transfer (make portable) up to $500,000 of their Save Our Homes benefits to their next homestead when they move. Save Our Homes became effective in 1995 and limits (caps) the annual increase in assessed value for homestead property to three percent (3%) or the percentage change in the Consumer Price Index, whichever is less. With respect to non-homestead property, Amendment 1 limits (caps) the annual increase in assessed value for non-homestead property (businesses, industrial property, rental property, second homes, etc.) to ten percent (10%), except for school district taxes. The Amendment also provides a $25,000 exemption for tangible personal property. Amendment 1 becomes effective on October 1, 2008, with the exception of the ten percent (10%) assessment cap on non-homestead property which becomes effective on January 1, 2009.

56
REQUIRED
SUPPLEMENTARY
INFORMATION
Required supplementary information includes financial information and disclosures that are required by the Governmental Accounting Standards Board but are not considered a part of the basic financial statements.
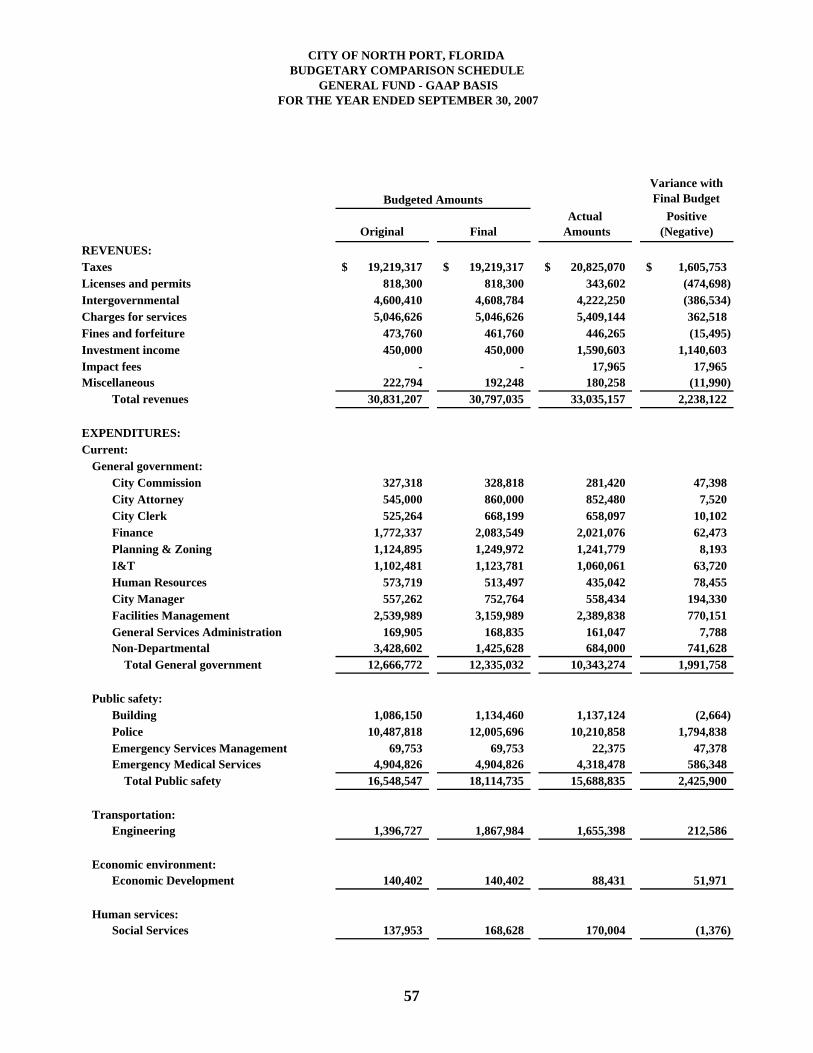
CITY OF NORTH PORT, FLORIDABUDGETARY COMPARISON SCHEDULE
GENERAL FUND - GAAP BASIS FOR THE YEAR ENDED SEPTEMBER 30, 2007
Variance withFinal Budget
Actual PositiveOriginal Final Amounts (Negative)
REVENUES:Taxes 19,219,317$ 19,219,317$ 20,825,070$ 1,605,753$ Licenses and permits 818,300 818,300 343,602 (474,698) Intergovernmental 4,600,410 4,608,784 4,222,250 (386,534) Charges for services 5,046,626 5,046,626 5,409,144 362,518 Fines and forfeiture 473,760 461,760 446,265 (15,495) Investment income 450,000 450,000 1,590,603 1,140,603 Impact fees - - 17,965 17,965 Miscellaneous 222,794 192,248 180,258 (11,990)
Total revenues 30,831,207 30,797,035 33,035,157 2,238,122
EXPENDITURES:Current: General government:
City Commission 327,318 328,818 281,420 47,398 City Attorney 545,000 860,000 852,480 7,520 City Clerk 525,264 668,199 658,097 10,102 Finance 1,772,337 2,083,549 2,021,076 62,473 Planning & Zoning 1,124,895 1,249,972 1,241,779 8,193 I&T 1,102,481 1,123,781 1,060,061 63,720 Human Resources 573,719 513,497 435,042 78,455 City Manager 557,262 752,764 558,434 194,330 Facilities Management 2,539,989 3,159,989 2,389,838 770,151 General Services Administration 169,905 168,835 161,047 7,788 Non-Departmental 3,428,602 1,425,628 684,000 741,628 Total General government 12,666,772 12,335,032 10,343,274 1,991,758
Public safety:Building 1,086,150 1,134,460 1,137,124 (2,664) Police 10,487,818 12,005,696 10,210,858 1,794,838 Emergency Services Management 69,753 69,753 22,375 47,378 Emergency Medical Services 4,904,826 4,904,826 4,318,478 586,348 Total Public safety 16,548,547 18,114,735 15,688,835 2,425,900
Transportation:Engineering 1,396,727 1,867,984 1,655,398 212,586
Economic environment:Economic Development 140,402 140,402 88,431 51,971
Human services:Social Services 137,953 168,628 170,004 (1,376)
Budgeted Amounts
57

CITY OF NORTH PORT, FLORIDABUDGETARY COMPARISON SCHEDULE
GENERAL FUND - GAAP BASIS FOR THE YEAR ENDED SEPTEMBER 30, 2007
(Continued)
Culture and recreation:Parks & Recreation 1,420,909 1,499,715 1,238,972 260,743
Capital outlay 4,278,905 5,786,881 3,253,041 2,533,840 Debt service: 1,216,832 1,216,832 1,216,597 235
Total expenditures 37,807,047 41,130,209 33,654,552 7,475,657 Excess (deficiency) of revenues over (under) expenditures (6,975,840) (10,333,174) (619,395) 9,713,779
OTHER FINANCING SOURCES (USES):Transfers in 1,301,370 1,301,370 1,301,140 (230) Transfers out (6,000) (2,279,931) (2,279,131) 800
Total other financing sources and (uses) 1,295,370 (978,561) (977,991) 570
Net change in fund balances (5,680,470) (11,311,735) (1,597,386) 9,714,349
Fund balances - beginning 28,067,123 28,067,123 28,067,123 -
Fund balances - ending 22,386,653$ 16,755,388$ 26,469,737$ 9,714,349$
58

CITY OF NORTH PORT, FLORIDABUDGETARY COMPARISON SCHEDULE
ROAD AND DRAINAGE DISTRICT SPECIAL REVENUE FUND - GAAP BASISFOR THE YEAR ENDED SEPTEMBER 30, 2007
Variance withFinal Budget
Actual PositiveOriginal Final Amounts (Negative)
REVENUES:Taxes 2,012,586$ 2,012,586$ 2,061,276$ 48,690$ Licenses and permits 916,000 916,000 240,380 (675,620) Intergovernmental 347,640 347,640 995,686 648,046 Charges for services 19,125,002 19,125,002 11,949,443 (7,175,559) Investment income 250,000 250,000 626,595 376,595 Impact fees - - 17,182 17,182 Miscellaneous 34,500 34,500 41,627 7,127
Total revenues 22,685,728 22,685,728 15,932,189 (6,753,539)
EXPENDITURES:Current: Physical environment 6,090,301 4,689,422 3,935,767 753,655 Transportation 12,365,157 16,667,215 7,990,802 8,676,413
Capital outlay 3,819,150 5,846,556 4,264,417 1,582,139 Debt service 1,030,122 1,030,122 869,511 160,611
Total expenditures 23,304,730 28,233,315 17,060,497 11,172,818 Deficiency of revenues under expenditures (619,002) (5,547,587) (1,128,308) 4,419,279
OTHER FINANCING SOURCES:Capital leases 1,606,150 1,606,150 1,606,150 - Transfers in 420,000 420,000 420,000 -
Total other financing sources 2,026,150 2,026,150 2,026,150 -
Net change in fund balances 1,407,148 (3,521,437) 897,842 4,419,279
Fund balances - beginning 8,894,221 8,894,221 8,894,221 -
Fund balances - ending 10,301,369$ 5,372,784$ 9,792,063$ 4,419,279$
Budgeted Amounts
59
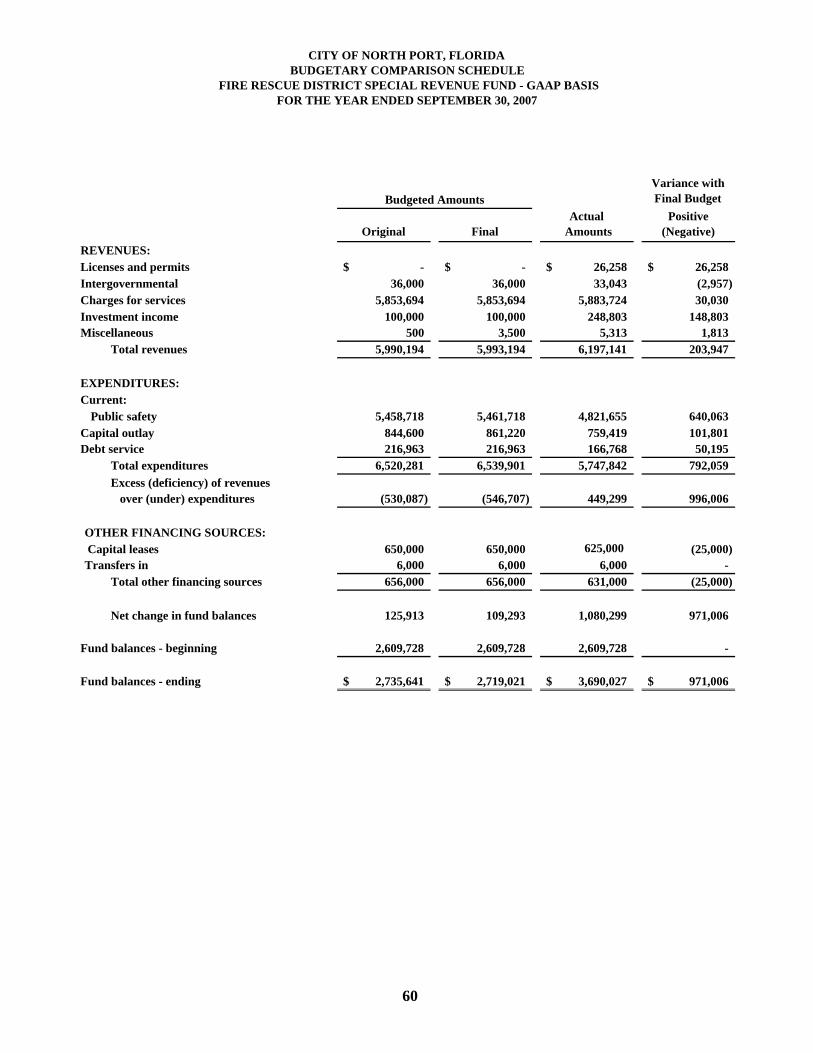
CITY OF NORTH PORT, FLORIDABUDGETARY COMPARISON SCHEDULE
FIRE RESCUE DISTRICT SPECIAL REVENUE FUND - GAAP BASISFOR THE YEAR ENDED SEPTEMBER 30, 2007
Variance withFinal Budget
Actual PositiveOriginal Final Amounts (Negative)
REVENUES:Licenses and permits -$ -$ 26,258$ 26,258$ Intergovernmental 36,000 36,000 33,043 (2,957) Charges for services 5,853,694 5,853,694 5,883,724 30,030 Investment income 100,000 100,000 248,803 148,803 Miscellaneous 500 3,500 5,313 1,813
Total revenues 5,990,194 5,993,194 6,197,141 203,947
EXPENDITURES:Current: Public safety 5,458,718 5,461,718 4,821,655 640,063
Capital outlay 844,600 861,220 759,419 101,801 Debt service 216,963 216,963 166,768 50,195
Total expenditures 6,520,281 6,539,901 5,747,842 792,059 Excess (deficiency) of revenues over (under) expenditures (530,087) (546,707) 449,299 996,006
OTHER FINANCING SOURCES: Capital leases 650,000 650,000 625,000 (25,000) Transfers in 6,000 6,000 6,000 -
Total other financing sources 656,000 656,000 631,000 (25,000)
Net change in fund balances 125,913 109,293 1,080,299 971,006
Fund balances - beginning 2,609,728 2,609,728 2,609,728 -
Fund balances - ending 2,735,641$ 2,719,021$ 3,690,027$ 971,006$
Budgeted Amounts
60
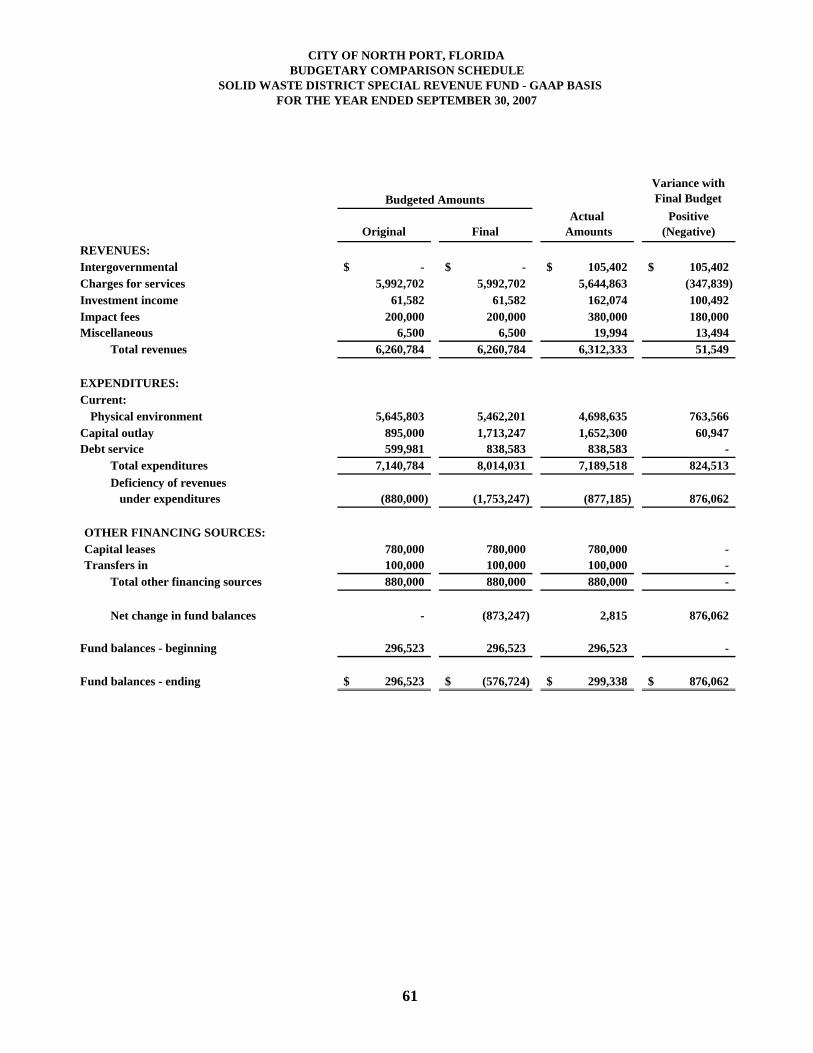
CITY OF NORTH PORT, FLORIDABUDGETARY COMPARISON SCHEDULE
SOLID WASTE DISTRICT SPECIAL REVENUE FUND - GAAP BASISFOR THE YEAR ENDED SEPTEMBER 30, 2007
Variance withFinal Budget
Actual PositiveOriginal Final Amounts (Negative)
REVENUES:Intergovernmental -$ -$ 105,402$ 105,402$ Charges for services 5,992,702 5,992,702 5,644,863 (347,839) Investment income 61,582 61,582 162,074 100,492 Impact fees 200,000 200,000 380,000 180,000 Miscellaneous 6,500 6,500 19,994 13,494
Total revenues 6,260,784 6,260,784 6,312,333 51,549
EXPENDITURES:Current: Physical environment 5,645,803 5,462,201 4,698,635 763,566
Capital outlay 895,000 1,713,247 1,652,300 60,947 Debt service 599,981 838,583 838,583 -
Total expenditures 7,140,784 8,014,031 7,189,518 824,513 Deficiency of revenues under expenditures (880,000) (1,753,247) (877,185) 876,062
OTHER FINANCING SOURCES:Capital leases 780,000 780,000 780,000 - Transfers in 100,000 100,000 100,000 -
Total other financing sources 880,000 880,000 880,000 -
Net change in fund balances - (873,247) 2,815 876,062
Fund balances - beginning 296,523 296,523 296,523 -
Fund balances - ending 296,523$ (576,724)$ 299,338$ 876,062$
Budgeted Amounts
61

CITY OF NORTH PORT, FLORIDABUDGETARY COMPARISON SCHEDULE
ESCHEATED LOTS - ROADS SPECIAL REVENUE FUND - GAAP BASISFOR THE YEAR ENDED SEPTEMBER 30, 2007
Variance withFinal Budget
Actual PositiveOriginal Final Amounts (Negative)
REVENUES:Investment income -$ -$ 512,710$ 512,710$
Total revenues - - 512,710 512,710
EXPENDITURES:Current: Transportation - 13,000,000 5,405,431 7,594,569 Capital outlay - 5,000,000 - 5,000,000
Total expenditures - 18,000,000 5,405,431 12,594,569 Deficiency of revenues under expenditures - (18,000,000) (4,892,721) 13,107,279
OTHER FINANCING SOURCES:Transfers in - 18,000,000 18,000,000 -
Total other financing sources - 18,000,000 18,000,000 -
Net change in fund balances - - 13,107,279 13,107,279
Fund balances - beginning - - - -
Fund balances - ending -$ -$ 13,107,279$ 13,107,279$
Budgeted Amounts
62

CITY OF NORTH PORT, FLORIDABUDGETARY COMPARISON SCHEDULE
TRANSPORTATION IMPACT FEES SPECIAL REVENUE FUND - GAAP BASISFOR THE YEAR ENDED SEPTEMBER 30, 2007
Variance withFinal Budget
Actual PositiveOriginal Final Amounts (Negative)
REVENUES:Intergovernmental -$ -$ 2,984,152$ 2,984,152$ Investment income 282,928 282,928 1,639,896 1,356,968 Impact fees 13,169,794 13,169,794 7,879,841 (5,289,953)
Total revenues 13,452,722 13,452,722 12,503,889 (948,833)
EXPENDITURES:Current: Capital outlay 20,169,794 37,054,029 6,909,826 30,144,203
Total expenditures 20,169,794 37,054,029 6,909,826 30,144,203 Excess (deficiency) of revenues over (under) expenditures (6,717,072) (23,601,307) 5,594,063 29,195,370
Net change in fund balances (6,717,072) (23,601,307) 5,594,063 29,195,370
Fund balances - beginning 21,074,788 21,074,788 21,074,788 -
Fund balances - ending 14,357,716$ (2,526,519)$ 26,668,851$ 29,195,370$
Budgeted Amounts
63
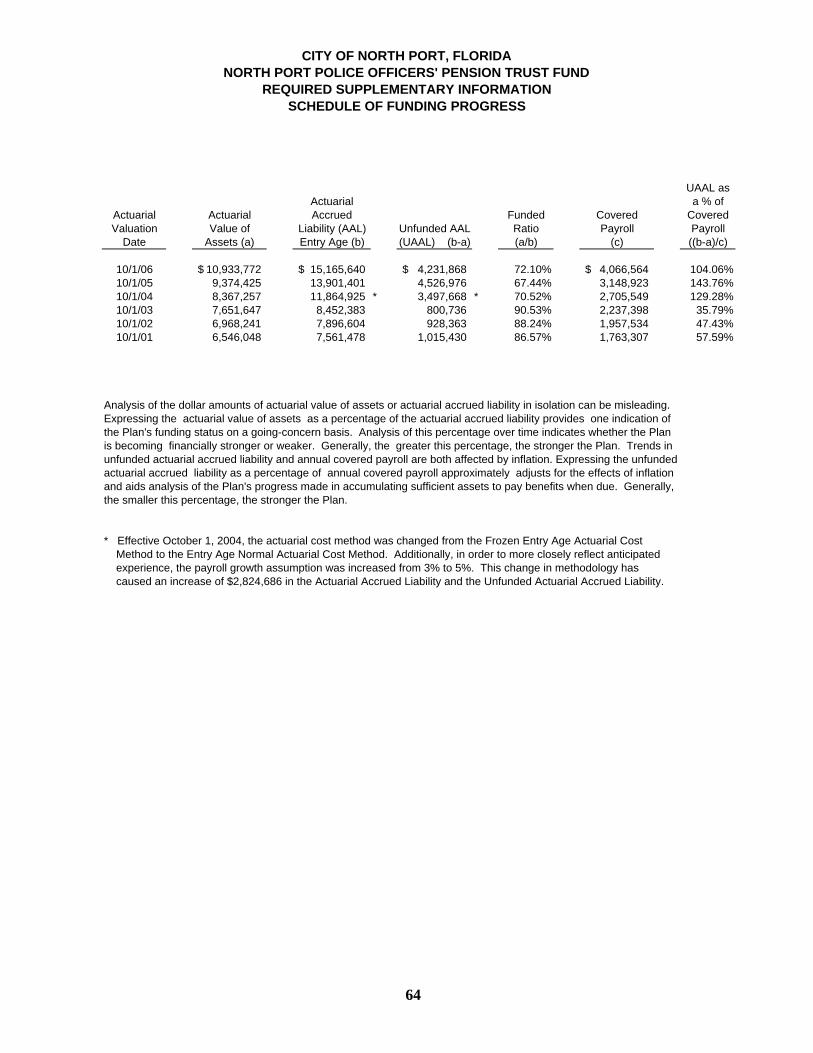
CITY OF NORTH PORT, FLORIDANORTH PORT POLICE OFFICERS' PENSION TRUST FUND
REQUIRED SUPPLEMENTARY INFORMATIONSCHEDULE OF FUNDING PROGRESS
Actuarial Valuation
Date
Actuarial Value of
Assets (a)
Actuarial Accrued
Liability (AAL) Entry Age (b)
Unfunded AAL (UAAL) (b-a)
Funded Ratio (a/b)
Covered Payroll
(c)
UAAL as a % of
Covered Payroll ((b-a)/c)
10/1/06 10,933,772$ 15,165,640$ 4,231,868$ 72.10% 4,066,564$ 104.06%10/1/05 9,374,425 13,901,401 4,526,976 67.44% 3,148,923 143.76%10/1/04 8,367,257 11,864,925 * 3,497,668 * 70.52% 2,705,549 129.28%10/1/03 7,651,647 8,452,383 800,736 90.53% 2,237,398 35.79%10/1/02 6,968,241 7,896,604 928,363 88.24% 1,957,534 47.43%10/1/01 6,546,048 7,561,478 1,015,430 86.57% 1,763,307 57.59%
Analysis of the dollar amounts of actuarial value of assets or actuarial accrued liability in isolation can be misleading.Expressing the actuarial value of assets as a percentage of the actuarial accrued liability provides one indication of the Plan's funding status on a going-concern basis. Analysis of this percentage over time indicates whether the Planis becoming financially stronger or weaker. Generally, the greater this percentage, the stronger the Plan. Trends in unfunded actuarial accrued liability and annual covered payroll are both affected by inflation. Expressing the unfunded actuarial accrued liability as a percentage of annual covered payroll approximately adjusts for the effects of inflation and aids analysis of the Plan's progress made in accumulating sufficient assets to pay benefits when due. Generally, the smaller this percentage, the stronger the Plan.
* Effective October 1, 2004, the actuarial cost method was changed from the Frozen Entry Age Actuarial Cost Method to the Entry Age Normal Actuarial Cost Method. Additionally, in order to more closely reflect anticipated experience, the payroll growth assumption was increased from 3% to 5%. This change in methodology has caused an increase of $2,824,686 in the Actuarial Accrued Liability and the Unfunded Actuarial Accrued Liability.
64

CITY OF NORTH PORT, FLORIDANORTH PORT POLICE OFFICERS' PENSION TRUST FUND
REQUIRED SUPPLEMENTARY INFORMATIONSCHEDULE OF CONTRIBUTIONS FROM THE EMPLOYER
AND OTHER CONTRIBUTING ENTITIES
Actuarial Ended
September 30
Required Contribution
City Contribution
State Contribution
Percentage Contributed**
2006 676,625$ 667,093$ 146,546$ * 120.25%2005 627,386 564,258 146,546 * 113.30%2004 503,095 490,174 132,825 123.83%2003 358,800 394,458 88,977 134.74%2002 333,768 353,986 76,779 129.06%2001 259,722 318,695 56,481 144.45%
* Frozen per Chapter 185, Florida Statues, as amended.
** The percentage contributed exceeded the required contribution ineach year because the City is required to contribute a minimumpercentage of covered payroll, per ordinance.
65
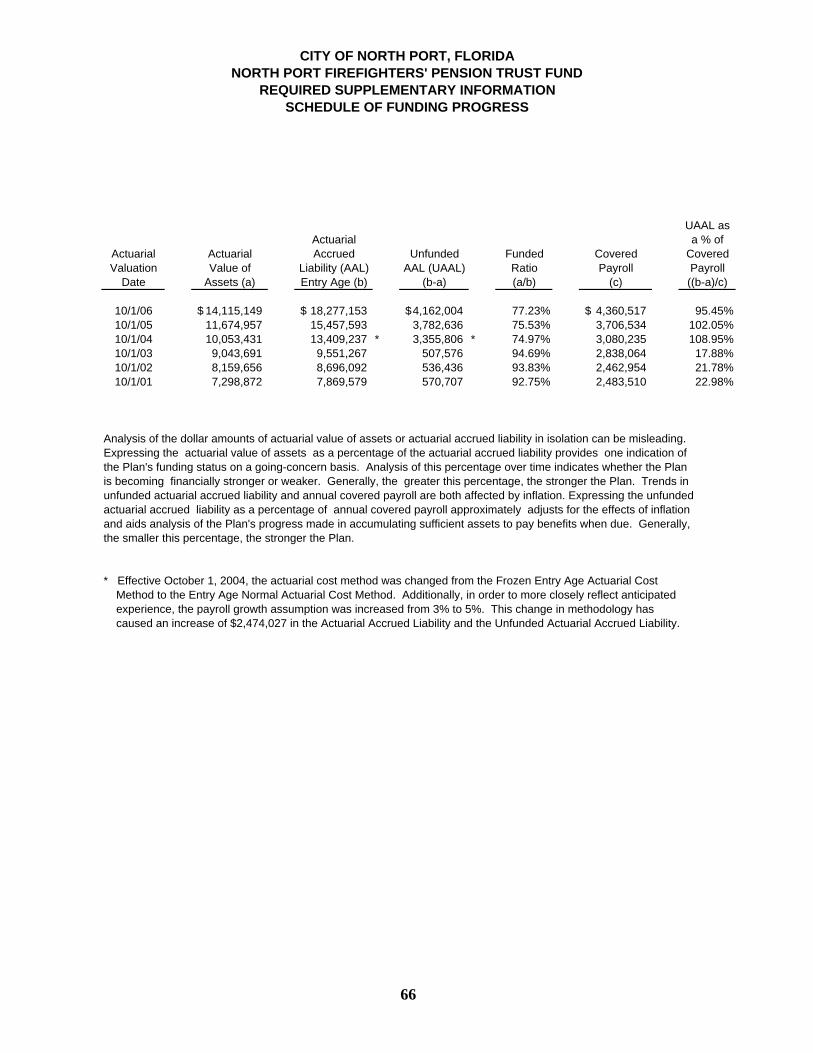
CITY OF NORTH PORT, FLORIDANORTH PORT FIREFIGHTERS' PENSION TRUST FUND
REQUIRED SUPPLEMENTARY INFORMATIONSCHEDULE OF FUNDING PROGRESS
Actuarial Valuation
Date
Actuarial Value of
Assets (a)
Actuarial Accrued
Liability (AAL) Entry Age (b)
Unfunded AAL (UAAL)
(b-a)
Funded Ratio (a/b)
Covered Payroll
(c)
UAAL as a % of
Covered Payroll ((b-a)/c)
10/1/06 14,115,149$ 18,277,153$ 4,162,004$ 77.23% 4,360,517$ 95.45%10/1/05 11,674,957 15,457,593 3,782,636 75.53% 3,706,534 102.05%10/1/04 10,053,431 13,409,237 * 3,355,806 * 74.97% 3,080,235 108.95%10/1/03 9,043,691 9,551,267 507,576 94.69% 2,838,064 17.88%10/1/02 8,159,656 8,696,092 536,436 93.83% 2,462,954 21.78%10/1/01 7,298,872 7,869,579 570,707 92.75% 2,483,510 22.98%
Analysis of the dollar amounts of actuarial value of assets or actuarial accrued liability in isolation can be misleading.Expressing the actuarial value of assets as a percentage of the actuarial accrued liability provides one indication of the Plan's funding status on a going-concern basis. Analysis of this percentage over time indicates whether the Planis becoming financially stronger or weaker. Generally, the greater this percentage, the stronger the Plan. Trends in unfunded actuarial accrued liability and annual covered payroll are both affected by inflation. Expressing the unfunded actuarial accrued liability as a percentage of annual covered payroll approximately adjusts for the effects of inflation and aids analysis of the Plan's progress made in accumulating sufficient assets to pay benefits when due. Generally, the smaller this percentage, the stronger the Plan.
* Effective October 1, 2004, the actuarial cost method was changed from the Frozen Entry Age Actuarial Cost Method to the Entry Age Normal Actuarial Cost Method. Additionally, in order to more closely reflect anticipated experience, the payroll growth assumption was increased from 3% to 5%. This change in methodology has caused an increase of $2,474,027 in the Actuarial Accrued Liability and the Unfunded Actuarial Accrued Liability.
66

CITY OF NORTH PORT, FLORIDANORTH PORT FIREFIGHTERS' PENSION TRUST FUND
REQUIRED SUPPLEMENTARY INFORMATIONSCHEDULE OF CONTRIBUTIONS FROM THE EMPLOYER
AND OTHER CONTRIBUTING ENTITIES
Actuarial Ended September 30,
Required Contribution City Contribution
State Contribution
Percentage Contributed**
2006 770,969$ 815,315$ 170,286$ * 127.84%2005 732,989 672,097 166,534 114.41%2004 580,425 567,395 127,555 119.73%2003 576,393 497,053 101,562 103.86%2002 536,180 476,954 92,515 106.21%2001 394,522 447,032 68,311 130.62%
* Frozen per Chapter 175, Florida Statutes, as amended.
** The percentage contributed exceeded the required contribution in each year because the City is required to contribute a minimumpercentage of covered payroll, per ordinance.
67
COMBINING & INDIVIDUAL
FUND STATEMENTS AND SCHEDULES
This section includes financial statements and schedules which are not part of the basic financial statements, but are presented for purposes of additional analysis.
68

CITY OF NORTH PORT, FLORIDACOMBINING BALANCE SHEET
NONMAJOR GOVERNMENTAL FUNDSSEPTEMBER 30, 2007
Inspector Education
Special Law Enforcement
Police Education
Tree Replacement
ASSETS:Equity in pooled cash and investments 175,397$ 12,363$ 87,747$ 1,055,940$ Receivables (net of allowance for uncollectibles) - - - 1,100 Due from other funds - - - - Due from other governments - - 1,758 - Inventories - - - -
Total assets 175,397$ 12,363$ 89,505$ 1,057,040$
LIABILITIES:Accounts payable 1,670$ -$ -$ 904$ Due to other funds - - - - Advances from other funds - - - -
Total liabilities 1,670 - - 904
FUND BALANCES:Reserved for inventories - - - - Unreserved: Designated for Myakka Creek preservation - - - - Undesignated 173,727 12,363 89,505 1,056,136
Total fund balances 173,727 12,363 89,505 1,056,136
Total liabilities and fund balances 175,397$ 12,363$ 89,505$ 1,057,040$
Special Revenue
69
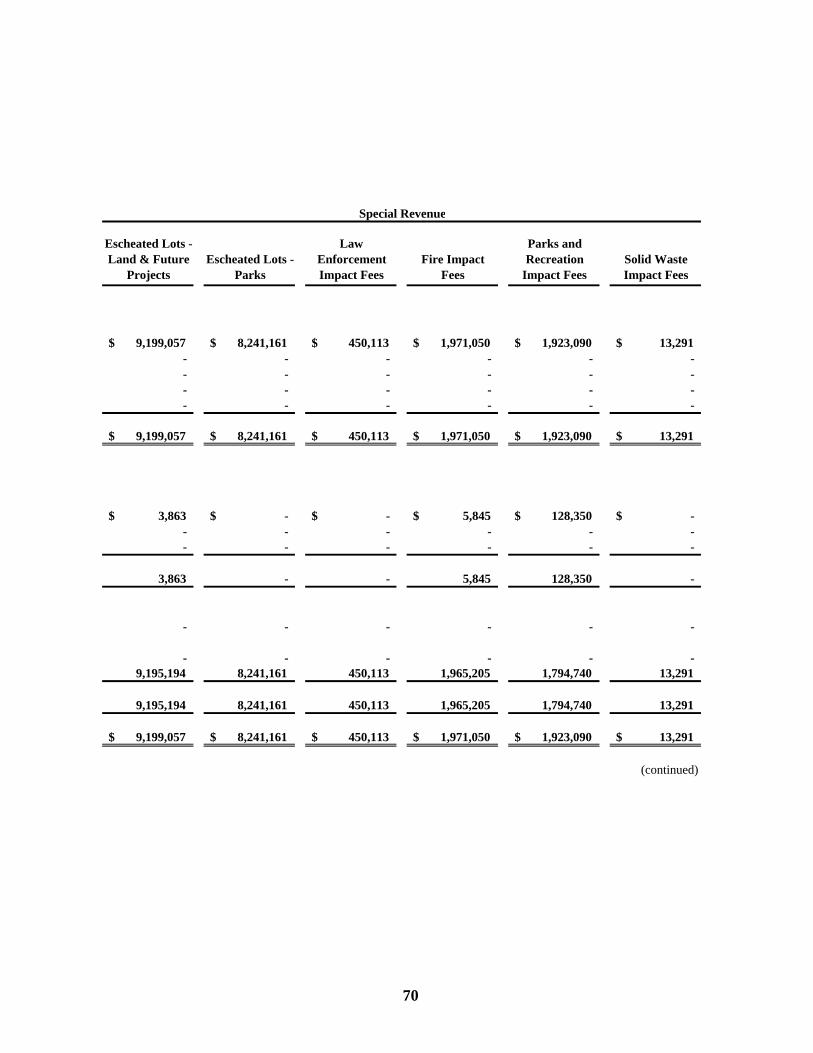
Escheated Lots - Land & Future
ProjectsEscheated Lots -
Parks
Law Enforcement Impact Fees
Fire Impact Fees
Parks and Recreation
Impact FeesSolid Waste Impact Fees
9,199,057$ 8,241,161$ 450,113$ 1,971,050$ 1,923,090$ 13,291$ - - - - - - - - - - - - - - - - - - - - - - - -
9,199,057$ 8,241,161$ 450,113$ 1,971,050$ 1,923,090$ 13,291$
3,863$ -$ -$ 5,845$ 128,350$ -$ - - - - - - - - - - - -
3,863 - - 5,845 128,350 -
- - - - - -
- - - - - - 9,195,194 8,241,161 450,113 1,965,205 1,794,740 13,291
9,195,194 8,241,161 450,113 1,965,205 1,794,740 13,291
9,199,057$ 8,241,161$ 450,113$ 1,971,050$ 1,923,090$ 13,291$
(continued)
Special Revenue
70
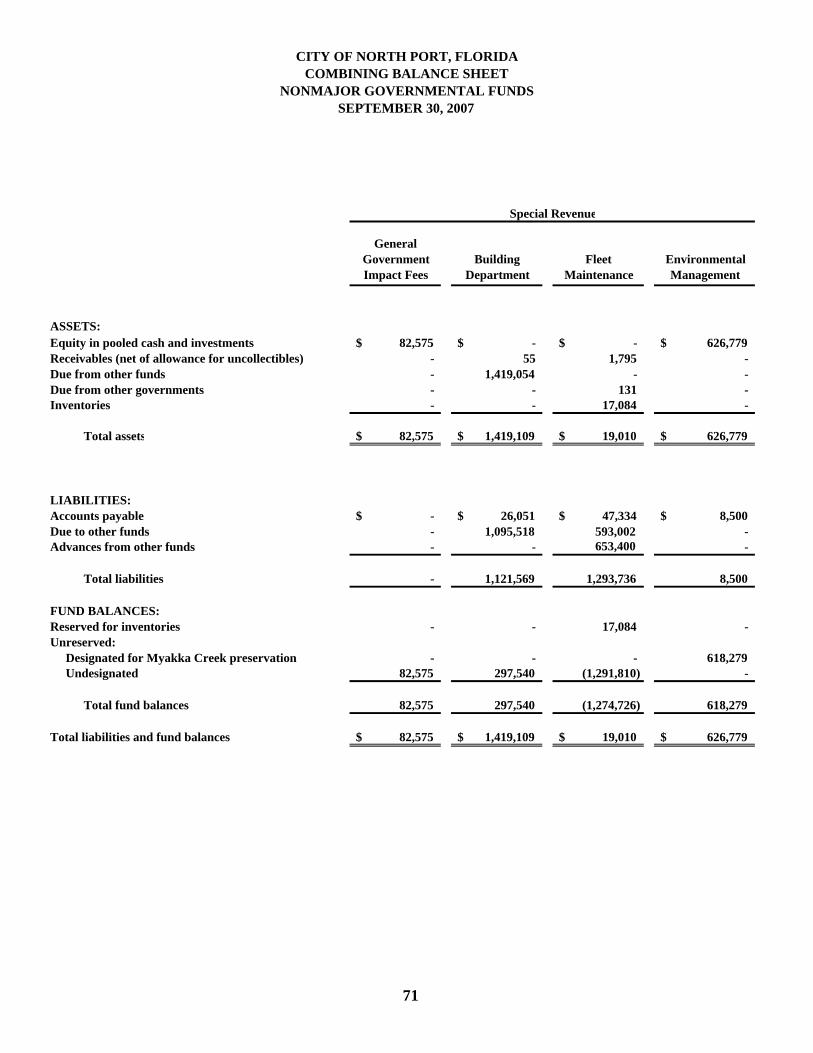
CITY OF NORTH PORT, FLORIDACOMBINING BALANCE SHEET
NONMAJOR GOVERNMENTAL FUNDSSEPTEMBER 30, 2007
ASSETS:Equity in pooled cash and investmentsReceivables (net of allowance for uncollectibles)Due from other fundsDue from other governmentsInventories
Total assets
LIABILITIES:Accounts payableDue to other fundsAdvances from other funds
Total liabilities
FUND BALANCES:Reserved for inventoriesUnreserved: Designated for Myakka Creek preservation Undesignated
Total fund balances
Total liabilities and fund balances
General Government Impact Fees
Building Department
Fleet Maintenance
Environmental Management
82,575$ -$ -$ 626,779$ - 55 1,795 - - 1,419,054 - - - - 131 - - - 17,084 -
82,575$ 1,419,109$ 19,010$ 626,779$
-$ 26,051$ 47,334$ 8,500$ - 1,095,518 593,002 - - - 653,400 -
- 1,121,569 1,293,736 8,500
- - 17,084 -
- - - 618,279 82,575 297,540 (1,291,810) -
82,575 297,540 (1,274,726) 618,279
82,575$ 1,419,109$ 19,010$ 626,779$
Special Revenue
71

CapitalProjects
Municipal Buildings
Construction
Total Nonmajor Governmental
Funds
494,664$ $ 24,333,227 - 2,950 - 1,419,054 - 1,889 - 17,084
494,664$ $ 25,774,204
6,926$ $ 229,443 487,738 2,176,258
- 653,400
494,664 3,059,101
- 17,084
- 618,279 - 22,079,740
- 22,715,103
494,664$ $ 25,774,204
72
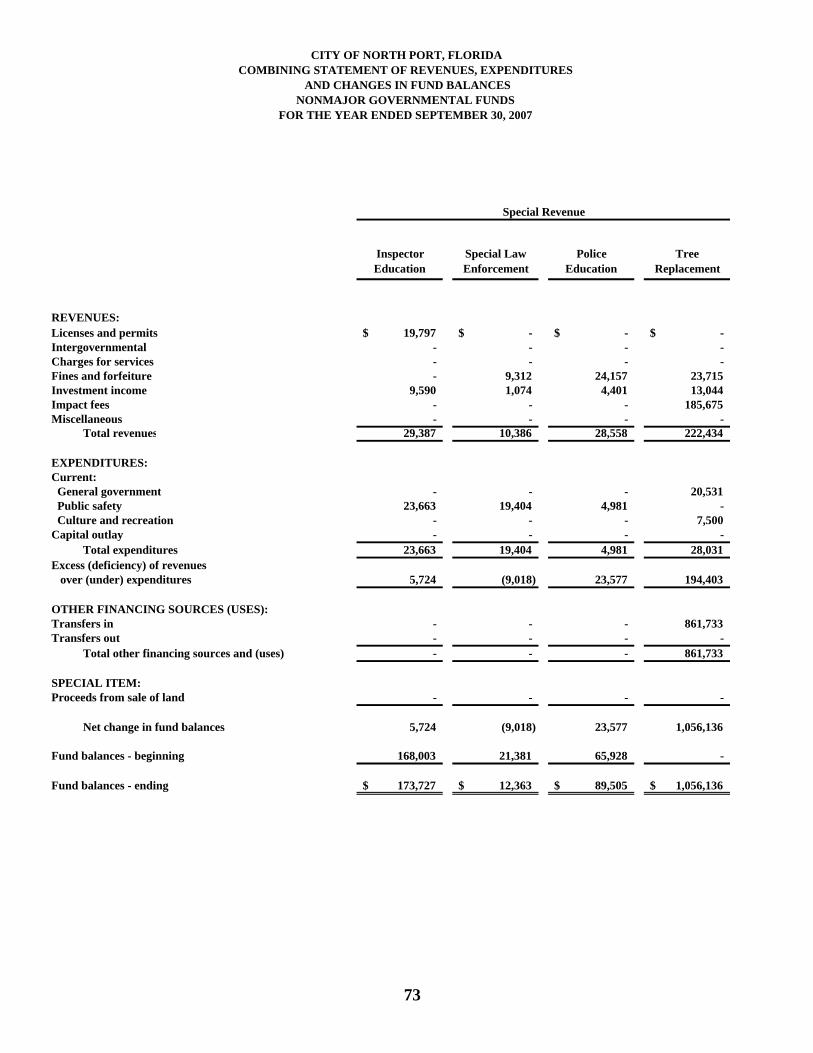
CITY OF NORTH PORT, FLORIDACOMBINING STATEMENT OF REVENUES, EXPENDITURES
AND CHANGES IN FUND BALANCESNONMAJOR GOVERNMENTAL FUNDS
FOR THE YEAR ENDED SEPTEMBER 30, 2007
Inspector Education
Special Law Enforcement
Police Education
Tree Replacement
REVENUES:Licenses and permits 19,797$ -$ -$ -$ Intergovernmental - - - - Charges for services - - - - Fines and forfeiture - 9,312 24,157 23,715 Investment income 9,590 1,074 4,401 13,044 Impact fees - - - 185,675 Miscellaneous - - - -
Total revenues 29,387 10,386 28,558 222,434
EXPENDITURES:Current: General government - - - 20,531 Public safety 23,663 19,404 4,981 - Culture and recreation - - - 7,500 Capital outlay - - - -
Total expenditures 23,663 19,404 4,981 28,031Excess (deficiency) of revenues over (under) expenditures 5,724 (9,018) 23,577 194,403
OTHER FINANCING SOURCES (USES):Transfers in - - - 861,733 Transfers out - - - -
Total other financing sources and (uses) - - - 861,733
SPECIAL ITEM:Proceeds from sale of land - - - -
Net change in fund balances 5,724 (9,018) 23,577 1,056,136
Fund balances - beginning 168,003 21,381 65,928 -
Fund balances - ending 173,727$ 12,363$ 89,505$ 1,056,136$
Special Revenue
73
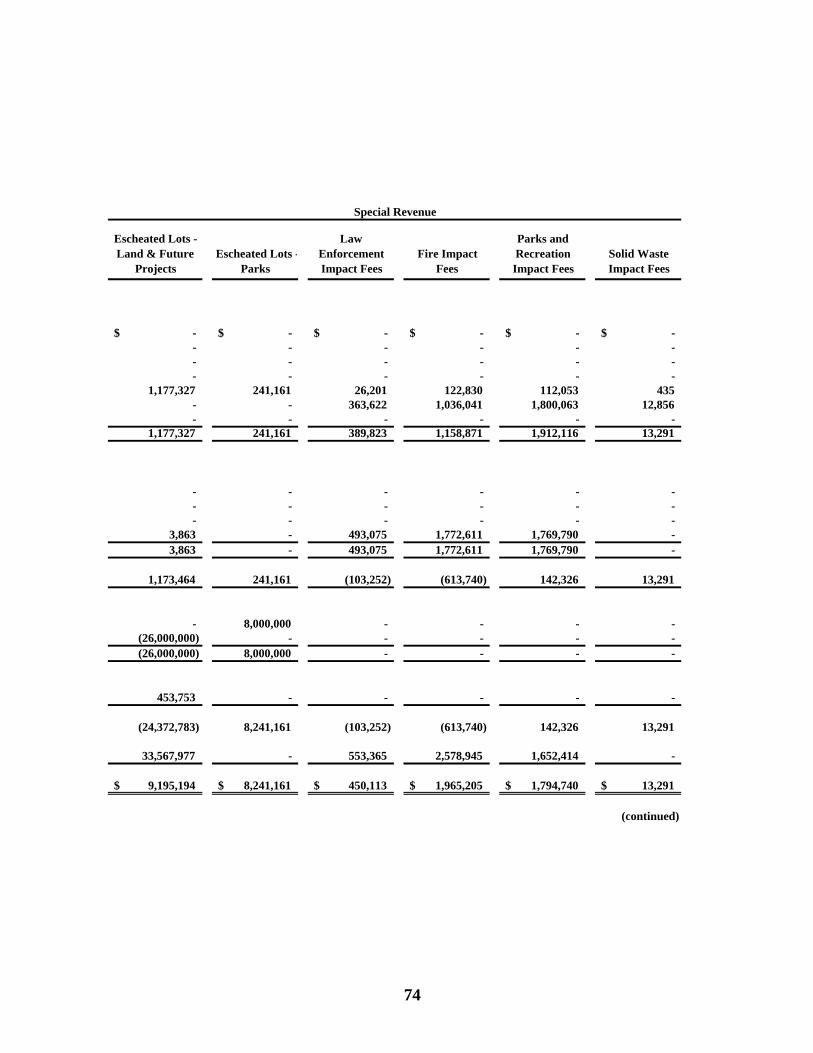
Escheated Lots - Land & Future
ProjectsEscheated Lots -
Parks
Law Enforcement Impact Fees
Fire Impact Fees
Parks and Recreation Impact Fees
Solid Waste Impact Fees
-$ -$ -$ -$ -$ -$ - - - - - - - - - - - - - - - - - -
1,177,327 241,161 26,201 122,830 112,053 435 - - 363,622 1,036,041 1,800,063 12,856 - - - - - -
1,177,327 241,161 389,823 1,158,871 1,912,116 13,291
- - - - - - - - - - - - - - - - - -
3,863 - 493,075 1,772,611 1,769,790 - 3,863 - 493,075 1,772,611 1,769,790 -
1,173,464 241,161 (103,252) (613,740) 142,326 13,291
- 8,000,000 - - - - (26,000,000) - - - - - (26,000,000) 8,000,000 - - - -
453,753 - - - - -
(24,372,783) 8,241,161 (103,252) (613,740) 142,326 13,291
33,567,977 - 553,365 2,578,945 1,652,414 -
9,195,194$ 8,241,161$ 450,113$ 1,965,205$ 1,794,740$ 13,291$
(continued)
Special Revenue
74

CITY OF NORTH PORT, FLORIDACOMBINING STATEMENT OF REVENUES, EXPENDITURES
AND CHANGES IN FUND BALANCESNONMAJOR GOVERNMENTAL FUNDS
FOR THE YEAR ENDED SEPTEMBER 30, 2007
REVENUES:Licenses and permitsIntergovernmentalCharges for servicesFines and forfeitureInvestment incomeImpact feesMiscellaneous
Total revenues
EXPENDITURES:Current: General government Public safety Culture and recreationCapital outlay
Total expendituresExcess (deficiency) of revenues over (under) expenditures
OTHER FINANCING SOURCES (USES):Transfers inTransfers out
Total other financing sources and (uses)
SPECIAL ITEM:Proceeds from sale of land
Net change in fund balances
Fund balances - beginning
Fund balances - ending
General Government Impact Fees
Building Department
Fleet Maintenance
Environmental Management
-$ 1,758,946$ -$ -$ - - 280 - - 235 1,868,665 - - - - -
2,209 - - 36,051 80,366 - - -
- 48,514 1,071 - 82,575 1,807,695 1,870,016 36,051
- - 2,275,702 - - 2,897,332 - - - - - - - 24,221 7,851 48,660 - 2,921,553 2,283,553 48,660
82,575 (1,113,858) (413,537) (12,609)
- 1,411,398 - - - - - - - 1,411,398 - -
- - - -
82,575 297,540 (413,537) (12,609)
- - (861,189) 630,888
82,575$ 297,540$ (1,274,726)$ 618,279$
Special Revenue
75
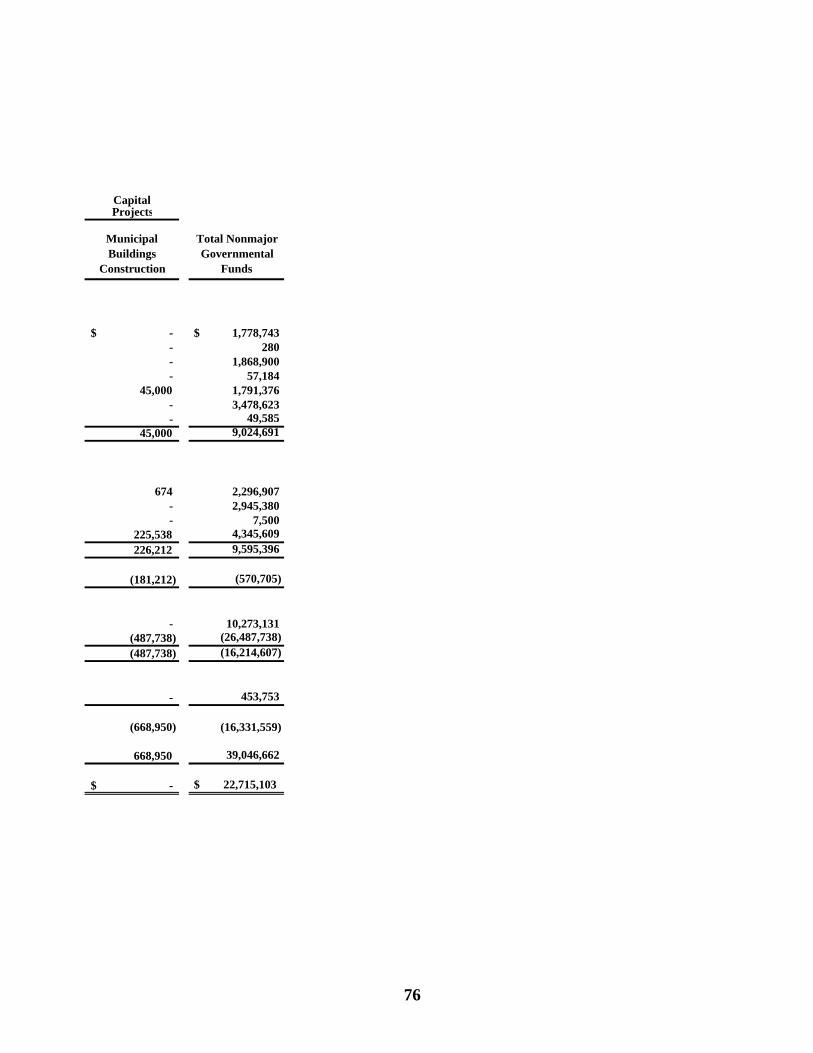
CapitalProjects
Municipal Buildings
Construction
Total Nonmajor Governmental
Funds
-$ $ 1,778,743 - 280 - 1,868,900 - 57,184
45,000 1,791,376 - 3,478,623 - 49,585
45,000 9,024,691
674 2,296,907 - 2,945,380 - 7,500
225,538 4,345,609 226,212 9,595,396
(181,212) (570,705)
- 10,273,131 (487,738) (26,487,738)(487,738) (16,214,607)
- 453,753
(668,950) (16,331,559)
668,950 39,046,662
-$ $ 22,715,103
76

CITY OF NORTH PORT, FLORIDABUDGETARY COMPARISON SCHEDULE
INSPECTOR EDUCATION SPECIAL REVENUE FUND FOR THE YEAR ENDED SEPTEMBER 30, 2007
Variance withFinal Budget
Actual PositiveOriginal Final Amounts (Negative)
REVENUES:Licenses and permits 77,000$ 77,000$ 19,797$ (57,203)$ Investment income 3,000 3,000 9,590 6,590
Total revenues 80,000 80,000 29,387 (50,613)
EXPENDITURES:Current: Public safety 25,000 25,000 23,663 1,337
Total expenditures 25,000 25,000 23,663 1,337 Excess of revenues over expenditures 55,000 55,000 5,724 (49,276)
Net change in fund balances 55,000 55,000 5,724 (49,276)
Fund balances - beginning 168,003 168,003 168,003 -
Fund balances - ending 223,003$ 223,003$ 173,727$ (49,276)$
Budgeted Amounts
77

CITY OF NORTH PORT, FLORIDABUDGETARY COMPARISON SCHEDULE
POLICE EDUCATION SPECIAL REVENUE FUNDFOR THE YEAR ENDED SEPTEMBER 30, 2007
Variance withFinal Budget
Actual PositiveOriginal Final Amounts (Negative)
REVENUES:Fines and forfeiture 15,000$ 15,000$ 24,157$ 9,157$ Investment income 1,000 1,000 4,401 3,401
Total revenues 16,000 16,000 28,558 12,558
EXPENDITURES:Current: Public safety 16,000 16,000 4,981 11,019
Total expenditures 16,000 16,000 4,981 11,019 Excess (deficiency) of revenues over (under) expenditures - - 23,577 23,577
Net change in fund balances - - 23,577 23,577
Fund balances - beginning 65,928 65,928 65,928 -
Fund balances - ending 65,928$ 65,928$ 89,505$ 23,577$
Budgeted Amounts
78
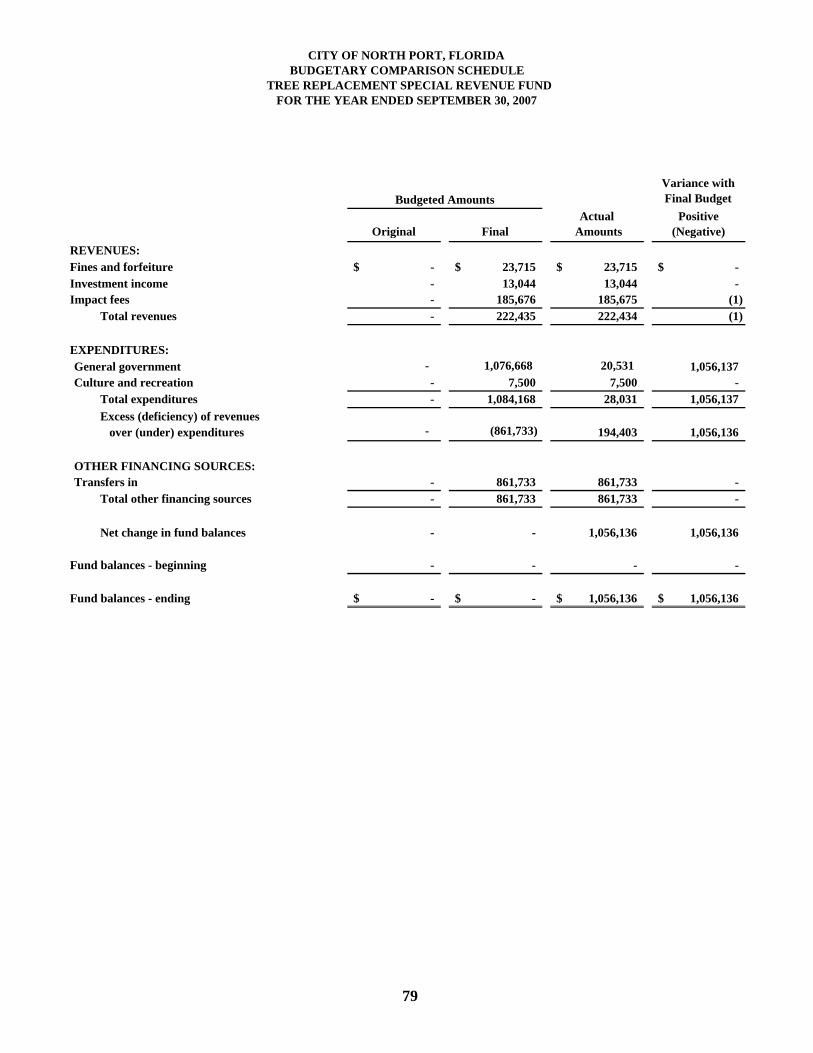
CITY OF NORTH PORT, FLORIDABUDGETARY COMPARISON SCHEDULE
TREE REPLACEMENT SPECIAL REVENUE FUNDFOR THE YEAR ENDED SEPTEMBER 30, 2007
Variance withFinal Budget
Actual PositiveOriginal Final Amounts (Negative)
REVENUES:Fines and forfeiture -$ 23,715$ 23,715$ -$ Investment income - 13,044 13,044 - Impact fees - 185,676 185,675 (1)
Total revenues - 222,435 222,434 (1)
EXPENDITURES:General government - 1,076,668 20,531 1,056,137 Culture and recreation - 7,500 7,500 -
Total expenditures - 1,084,168 28,031 1,056,137 Excess (deficiency) of revenues over (under) expenditures - (861,733) 194,403 1,056,136
OTHER FINANCING SOURCES:Transfers in - 861,733 861,733 -
Total other financing sources - 861,733 861,733 -
Net change in fund balances - - 1,056,136 1,056,136
Fund balances - beginning - - - -
Fund balances - ending -$ -$ 1,056,136$ 1,056,136$
Budgeted Amounts
79

CITY OF NORTH PORT, FLORIDABUDGETARY COMPARISON SCHEDULE
ESCHEATED LOTS - LAND AND FUTURE PROJECTS SPECIAL REVENUE FUNDFOR THE YEAR ENDED SEPTEMBER 30, 2007
Variance withFinal Budget
Actual PositiveOriginal Final Amounts (Negative)
REVENUES:Investment income -$ -$ 1,177,327$ 1,177,327$
Total revenues - - 1,177,327 1,177,327
EXPENDITURES:Capital outlay - 4,391,088 3,863 4,387,225
Total expenditures - 4,391,088 3,863 4,387,225 Excess (deficiency) of revenues over (under) expenditures - (4,391,088) 1,173,464 5,564,552
OTHER FINANCING USES:Transfers out - (26,000,000) (26,000,000) -
Total other financing uses - (26,000,000) (26,000,000) -
Net change in fund balances - (30,391,088) (24,826,536) 5,564,552
SPECIAL ITEM:Proceeds from sale of land - - 453,753 453,753
Fund balances - beginning 33,567,977 33,567,977 33,567,977 -
Fund balances - ending 33,567,977$ 3,176,889$ 9,195,194$ 6,018,305$
Budgeted Amounts
80

CITY OF NORTH PORT, FLORIDABUDGETARY COMPARISON SCHEDULE
ESCHEATED LOTS - PARKS SPECIAL REVENUE FUNDFOR THE YEAR ENDED SEPTEMBER 30, 2007
Variance withFinal Budget
Actual PositiveOriginal Final Amounts (Negative)
REVENUES:Investment income -$ -$ 241,161$ 241,161$
Total revenues - - 241,161 241,161
EXPENDITURES:Capital outlay - 600,000 - 600,000
Total expenditures - 600,000 - 600,000 Excess (deficiency) of revenues over (under) expenditures - (600,000) 241,161 841,161
OTHER FINANCING SOURCES:Transfers in - 8,000,000 8,000,000 -
Total other financing sources - 8,000,000 8,000,000 -
Net change in fund balances - 7,400,000 8,241,161 841,161
Fund balances - beginning - - - -
Fund balances - ending -$ 7,400,000$ 8,241,161$ 841,161$
Budgeted Amounts
81
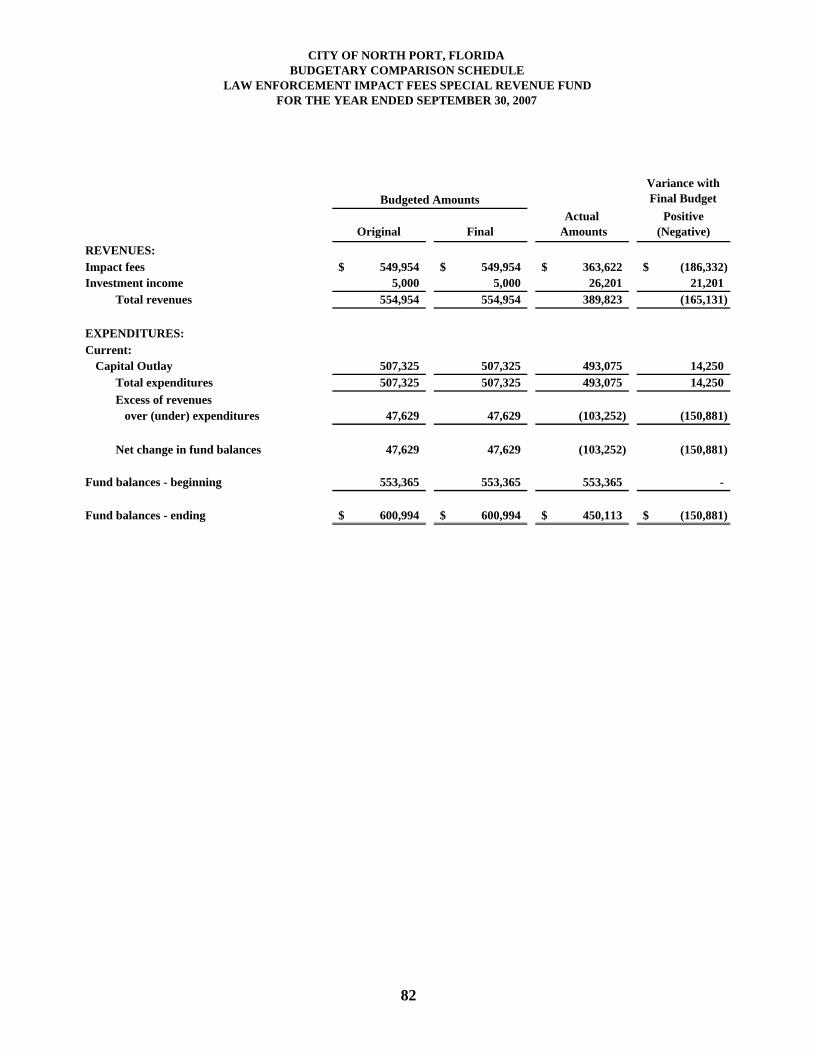
CITY OF NORTH PORT, FLORIDABUDGETARY COMPARISON SCHEDULE
LAW ENFORCEMENT IMPACT FEES SPECIAL REVENUE FUNDFOR THE YEAR ENDED SEPTEMBER 30, 2007
Variance withFinal Budget
Actual PositiveOriginal Final Amounts (Negative)
REVENUES:Impact fees 549,954$ 549,954$ 363,622$ (186,332)$ Investment income 5,000 5,000 26,201 21,201
Total revenues 554,954 554,954 389,823 (165,131)
EXPENDITURES:Current: Capital Outlay 507,325 507,325 493,075 14,250
Total expenditures 507,325 507,325 493,075 14,250 Excess of revenues over (under) expenditures 47,629 47,629 (103,252) (150,881)
Net change in fund balances 47,629 47,629 (103,252) (150,881)
Fund balances - beginning 553,365 553,365 553,365 -
Fund balances - ending 600,994$ 600,994$ 450,113$ (150,881)$
Budgeted Amounts
82
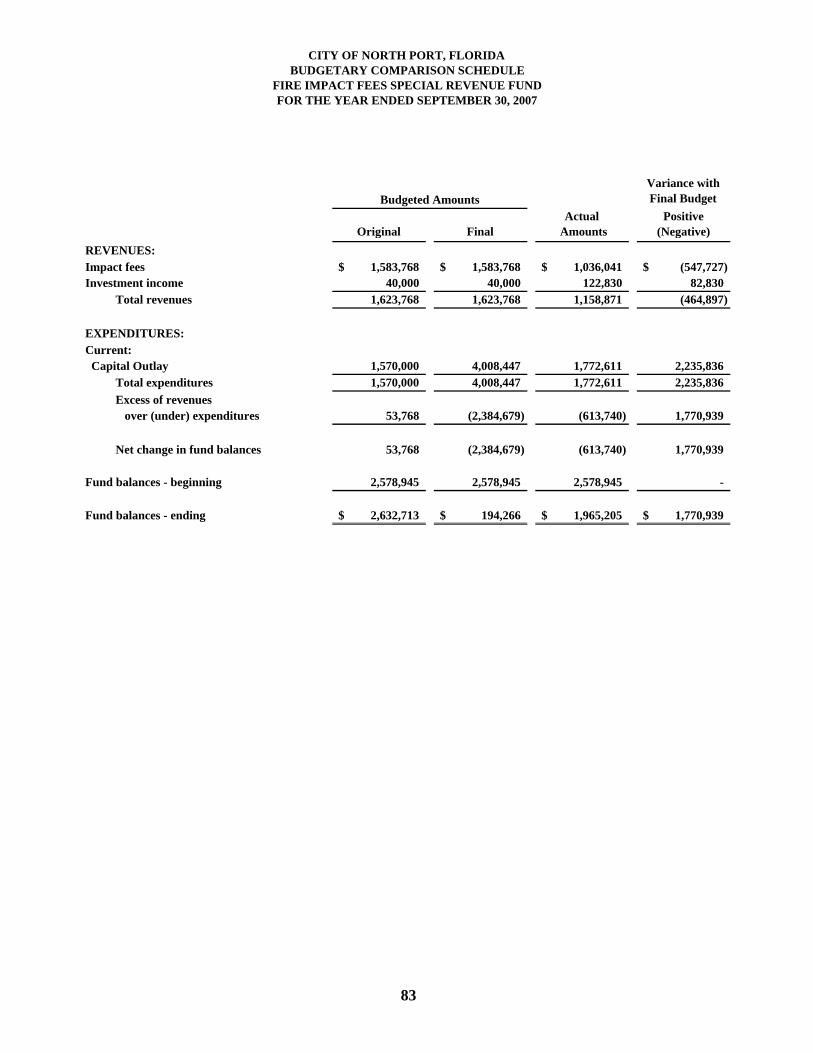
CITY OF NORTH PORT, FLORIDABUDGETARY COMPARISON SCHEDULE
FIRE IMPACT FEES SPECIAL REVENUE FUNDFOR THE YEAR ENDED SEPTEMBER 30, 2007
Variance withFinal Budget
Actual PositiveOriginal Final Amounts (Negative)
REVENUES:Impact fees 1,583,768$ 1,583,768$ 1,036,041$ (547,727)$ Investment income 40,000 40,000 122,830 82,830
Total revenues 1,623,768 1,623,768 1,158,871 (464,897)
EXPENDITURES:Current: Capital Outlay 1,570,000 4,008,447 1,772,611 2,235,836
Total expenditures 1,570,000 4,008,447 1,772,611 2,235,836 Excess of revenues over (under) expenditures 53,768 (2,384,679) (613,740) 1,770,939
Net change in fund balances 53,768 (2,384,679) (613,740) 1,770,939
Fund balances - beginning 2,578,945 2,578,945 2,578,945 -
Fund balances - ending 2,632,713$ 194,266$ 1,965,205$ 1,770,939$
Budgeted Amounts
83
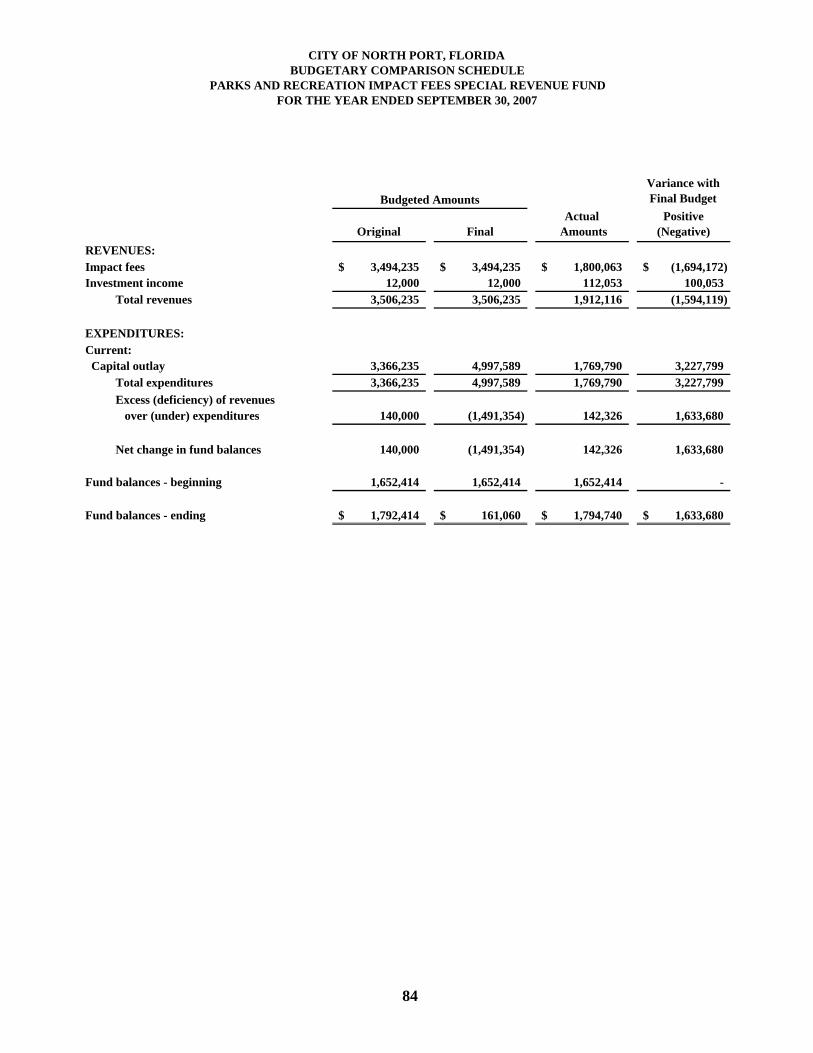
CITY OF NORTH PORT, FLORIDABUDGETARY COMPARISON SCHEDULE
PARKS AND RECREATION IMPACT FEES SPECIAL REVENUE FUNDFOR THE YEAR ENDED SEPTEMBER 30, 2007
Variance withFinal Budget
Actual PositiveOriginal Final Amounts (Negative)
REVENUES:Impact fees 3,494,235$ 3,494,235$ 1,800,063$ (1,694,172)$ Investment income 12,000 12,000 112,053 100,053
Total revenues 3,506,235 3,506,235 1,912,116 (1,594,119)
EXPENDITURES:Current: Capital outlay 3,366,235 4,997,589 1,769,790 3,227,799
Total expenditures 3,366,235 4,997,589 1,769,790 3,227,799 Excess (deficiency) of revenues over (under) expenditures 140,000 (1,491,354) 142,326 1,633,680
Net change in fund balances 140,000 (1,491,354) 142,326 1,633,680
Fund balances - beginning 1,652,414 1,652,414 1,652,414 -
Fund balances - ending 1,792,414$ 161,060$ 1,794,740$ 1,633,680$
Budgeted Amounts
84
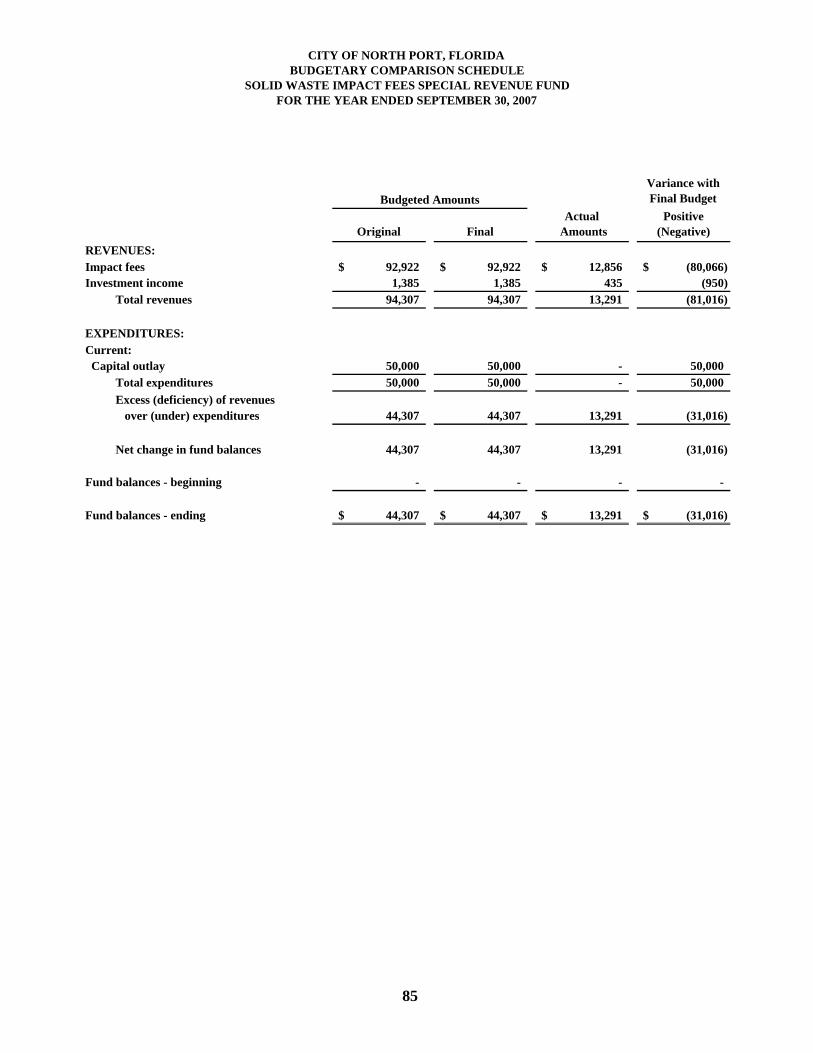
CITY OF NORTH PORT, FLORIDABUDGETARY COMPARISON SCHEDULE
SOLID WASTE IMPACT FEES SPECIAL REVENUE FUNDFOR THE YEAR ENDED SEPTEMBER 30, 2007
Variance withFinal Budget
Actual PositiveOriginal Final Amounts (Negative)
REVENUES:Impact fees 92,922$ 92,922$ 12,856$ (80,066)$ Investment income 1,385 1,385 435 (950)
Total revenues 94,307 94,307 13,291 (81,016)
EXPENDITURES:Current: Capital outlay 50,000 50,000 - 50,000
Total expenditures 50,000 50,000 - 50,000 Excess (deficiency) of revenues over (under) expenditures 44,307 44,307 13,291 (31,016)
Net change in fund balances 44,307 44,307 13,291 (31,016)
Fund balances - beginning - - - -
Fund balances - ending 44,307$ 44,307$ 13,291$ (31,016)$
Budgeted Amounts
85

CITY OF NORTH PORT, FLORIDABUDGETARY COMPARISON SCHEDULE
GENERAL GOVERNMENT IMPACT FEES SPECIAL REVENUE FUNDFOR THE YEAR ENDED SEPTEMBER 30, 2007
Variance withFinal Budget
Actual PositiveOriginal Final Amounts (Negative)
REVENUES:Impact fees 350,648$ 350,648$ 80,366$ (270,282)$ Investment income - - 2,209 2,209
Total revenues 350,648 350,648 82,575 (268,073)
EXPENDITURES:Current: Capital outlay 350,000 350,000 - 350,000
Total expenditures 350,000 350,000 - 350,000 Excess (deficiency) of revenues over (under) expenditures 648 648 82,575 81,927
Net change in fund balances 648 648 82,575 81,927
Fund balances - beginning - - - -
Fund balances - ending 648$ 648$ 82,575$ 81,927$
Budgeted Amounts
86
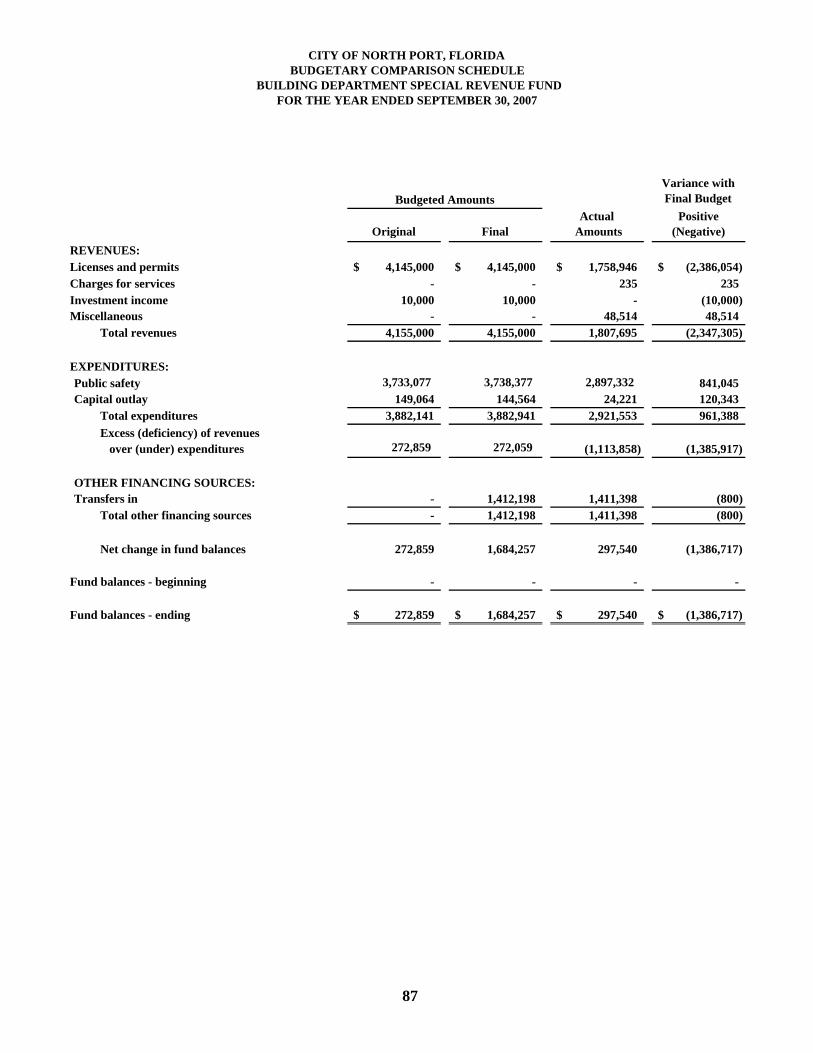
CITY OF NORTH PORT, FLORIDABUDGETARY COMPARISON SCHEDULE
BUILDING DEPARTMENT SPECIAL REVENUE FUNDFOR THE YEAR ENDED SEPTEMBER 30, 2007
Variance withFinal Budget
Actual PositiveOriginal Final Amounts (Negative)
REVENUES:Licenses and permits 4,145,000$ 4,145,000$ 1,758,946$ (2,386,054)$ Charges for services - - 235 235 Investment income 10,000 10,000 - (10,000) Miscellaneous - - 48,514 48,514
Total revenues 4,155,000 4,155,000 1,807,695 (2,347,305)
EXPENDITURES:Public safety 3,733,077 3,738,377 2,897,332 841,045 Capital outlay 149,064 144,564 24,221 120,343
Total expenditures 3,882,141 3,882,941 2,921,553 961,388 Excess (deficiency) of revenues over (under) expenditures 272,859 272,059 (1,113,858) (1,385,917)
OTHER FINANCING SOURCES:Transfers in - 1,412,198 1,411,398 (800)
Total other financing sources - 1,412,198 1,411,398 (800)
Net change in fund balances 272,859 1,684,257 297,540 (1,386,717)
Fund balances - beginning - - - -
Fund balances - ending 272,859$ 1,684,257$ 297,540$ (1,386,717)$
Budgeted Amounts
87

CITY OF NORTH PORT, FLORIDABUDGETARY COMPARISON SCHEDULE
FLEET MAINTENANCE SPECIAL REVENUE FUND FOR THE YEAR ENDED SEPTEMBER 30, 2007
Variance withFinal Budget
Actual PositiveOriginal Final Amounts (Negative)
REVENUES:Intergovernmental -$ -$ 280$ 280$ Charges for services 2,230,318 2,230,318 1,868,665 (361,653) Miscellaneous - - 1,071 1,071
Total revenues 2,230,318 2,230,318 1,870,016 (360,302)
EXPENDITURES:Current: General government 2,209,218 2,209,218 2,275,702 (66,484)
Capital outlay 21,100 21,100 7,851 13,249 Total expenditures 2,230,318 2,230,318 2,283,553 (53,235) Excess (deficiency) of revenues over (under) expenditures - - (413,537) (413,537)
Net change in fund balances - - (413,537) (413,537)
Fund balances - beginning (861,189) (861,189) (861,189) -
Fund balances - ending (861,189)$ (861,189)$ (1,274,726)$ (413,537)$
Budgeted Amounts
88

CITY OF NORTH PORT, FLORIDABUDGETARY COMPARISON SCHEDULE
ENVIRONMENTAL MANAGEMENT SPECIAL REVENUE FUNDFOR THE YEAR ENDED SEPTEMBER 30, 2007
Variance withFinal Budget
Actual PositiveOriginal Final Amounts (Negative)
REVENUES:Investment income -$ -$ 36,051$ 36,051$
Total revenues - - 36,051 36,051
EXPENDITURES:Current: Capital outlay - 598,187 48,660 549,527
Total expenditures - 598,187 48,660 549,527 Excess (deficiency) of revenues over (under) expenditures - (598,187) (12,609) 585,578
Net change in fund balances - (598,187) (12,609) 585,578
Fund balances - beginning 630,888 630,888 630,888 -
Fund balances - ending 630,888$ 32,701$ 618,279$ 585,578$
Budgeted Amounts
89
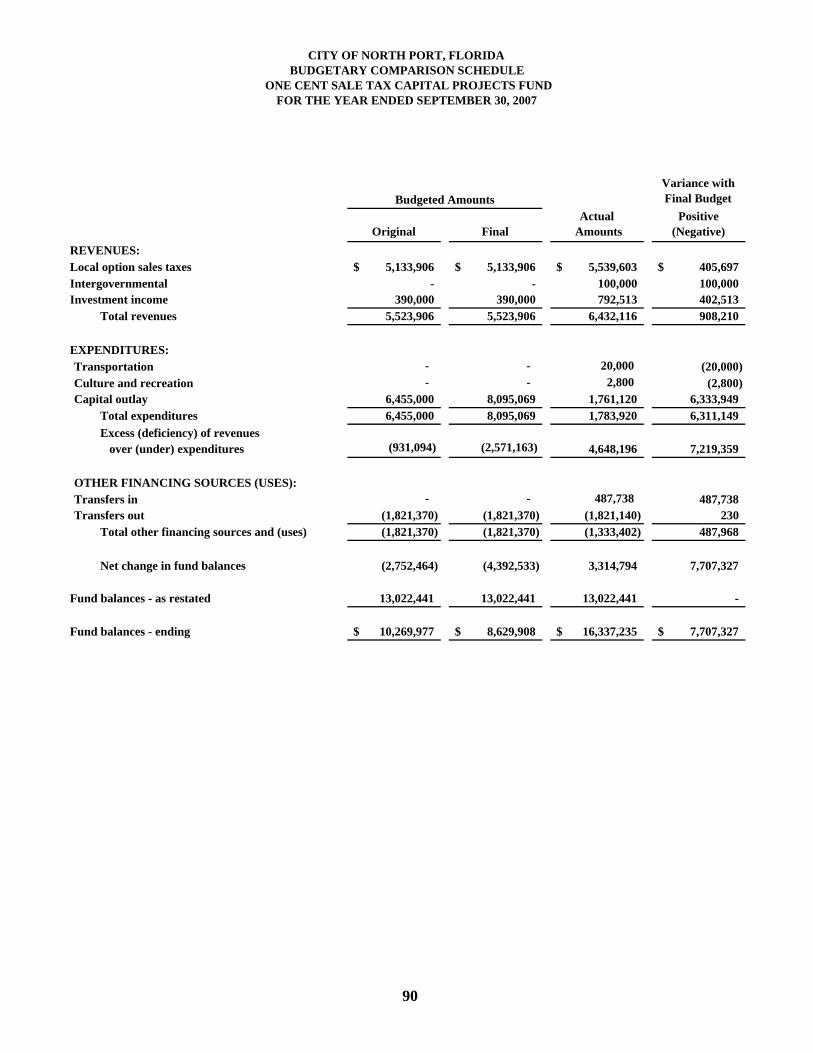
CITY OF NORTH PORT, FLORIDABUDGETARY COMPARISON SCHEDULE
ONE CENT SALE TAX CAPITAL PROJECTS FUNDFOR THE YEAR ENDED SEPTEMBER 30, 2007
Variance withFinal Budget
Actual PositiveOriginal Final Amounts (Negative)
REVENUES:Local option sales taxes 5,133,906$ 5,133,906$ 5,539,603$ 405,697$ Intergovernmental - - 100,000 100,000 Investment income 390,000 390,000 792,513 402,513
Total revenues 5,523,906 5,523,906 6,432,116 908,210
EXPENDITURES:Transportation - - 20,000 (20,000) Culture and recreation - - 2,800 (2,800) Capital outlay 6,455,000 8,095,069 1,761,120 6,333,949
Total expenditures 6,455,000 8,095,069 1,783,920 6,311,149 Excess (deficiency) of revenues over (under) expenditures (931,094) (2,571,163) 4,648,196 7,219,359
OTHER FINANCING SOURCES (USES):Transfers in - - 487,738 487,738 Transfers out (1,821,370) (1,821,370) (1,821,140) 230
Total other financing sources and (uses) (1,821,370) (1,821,370) (1,333,402) 487,968
Net change in fund balances (2,752,464) (4,392,533) 3,314,794 7,707,327
Fund balances - as restated 13,022,441 13,022,441 13,022,441 -
Fund balances - ending 10,269,977$ 8,629,908$ 16,337,235$ 7,707,327$
Budgeted Amounts
90

CITY OF NORTH PORT, FLORIDABUDGETARY COMPARISON SCHEDULE
MUNICIPAL BUILDINGS CONSTRUCTION CAPITAL PROJECTS FUNDFOR THE YEAR ENDED SEPTEMBER 30, 2007
Variance withFinal Budget
Actual PositiveOriginal Final Amounts (Negative)
REVENUES:Investment income -$ -$ 45,000$ 45,000$
Total revenues - - 45,000 45,000
EXPENDITURES:General government - 5,000 674 4,326 Capital outlay - 1,532,641 225,538 1,307,103
Total expenditures - 1,537,641 226,212 1,311,429 Excess (deficiency) of revenues over (under) expenditures - (1,537,641) (181,212) 1,356,429
OTHER FINANCING USES:Transfers out - - (487,738) 487,738
Total other financing uses (487,738) 487,738
Net change in fund balances - (1,537,641) (668,950) 868,691
Fund balances - beginning 668,950 668,950 668,950 -
Fund balances - ending 668,950$ (868,691)$ -$ 868,691$
Budgeted Amounts
91
TRUST AND AGENCY FUNDS
Trust funds are used to administer resources reserved and held by a governmental unit as the trustee or as the agent for others. Use of these trust funds facilitates the discharge of responsibilities placed upon the governmental unit by virtue of law or other authority. Agency funds are used to account for assets held by the government as an agent for individuals, private organizations, other governments and/or other funds. PENSION TRUST FUNDS POLICE OFFICERS’ PENSION TRUST FUND - This fund is used to account for receipts and disbursements, as authorized by the respective pension board. FIREFIGHTERS’ PENSION TRUST FUND - This fund is used to account for receipts and disbursements, as authorized by the respective pension board. AGENCY FUNDS COUNTY ROAD IMPACT FEES FUND - This fund is used to account for county road impact fees collected for and disbursed to Sarasota County. EDUCATION IMPACT FEES FUND - This fund is used to account for education impact fees collected for and disbursed to the Sarasota County School Board.
92

CITY OF NORTH PORT, FLORIDACOMBINING STATEMENT OF PLAN NET ASSETS
FIDUCIARY FUNDSSEPTEMBER 30, 2007
Police Officers' Pension Trust
Fund
Firefighters' Pension Trust
Fund Totals
ASSETS
Cash and equivalents 704,845$ 944,846$ 1,649,691$
ReceivablesContributions receivable 567,018 355,057 922,075 Interest and dividends receivable 53,331 50,023 103,354
Total receivables 620,349 405,080 1,025,429
InvestmentsU.S. Government securities 1,123,005 1,823,151 2,946,156 U.S. Government agency securities 1,978,263 2,720,295 4,698,558 Equities 7,436,490 10,308,584 17,745,074 Corporate bonds 1,418,990 1,733,264 3,152,254
Total investments 11,956,748 16,585,294 28,542,042
Total assets 13,281,942 17,935,220 31,217,162
LIABILITIESAccounts payable 43,154 37,052 80,206 DROP plan payable 187,386 18,930 206,316
Total liabilities 230,540 55,982 286,522
NET ASSETS HELD IN TRUSTFOR PENSION BENEFITS 13,051,402$ 17,879,238$ 30,930,640$
Pension Trust Funds
93
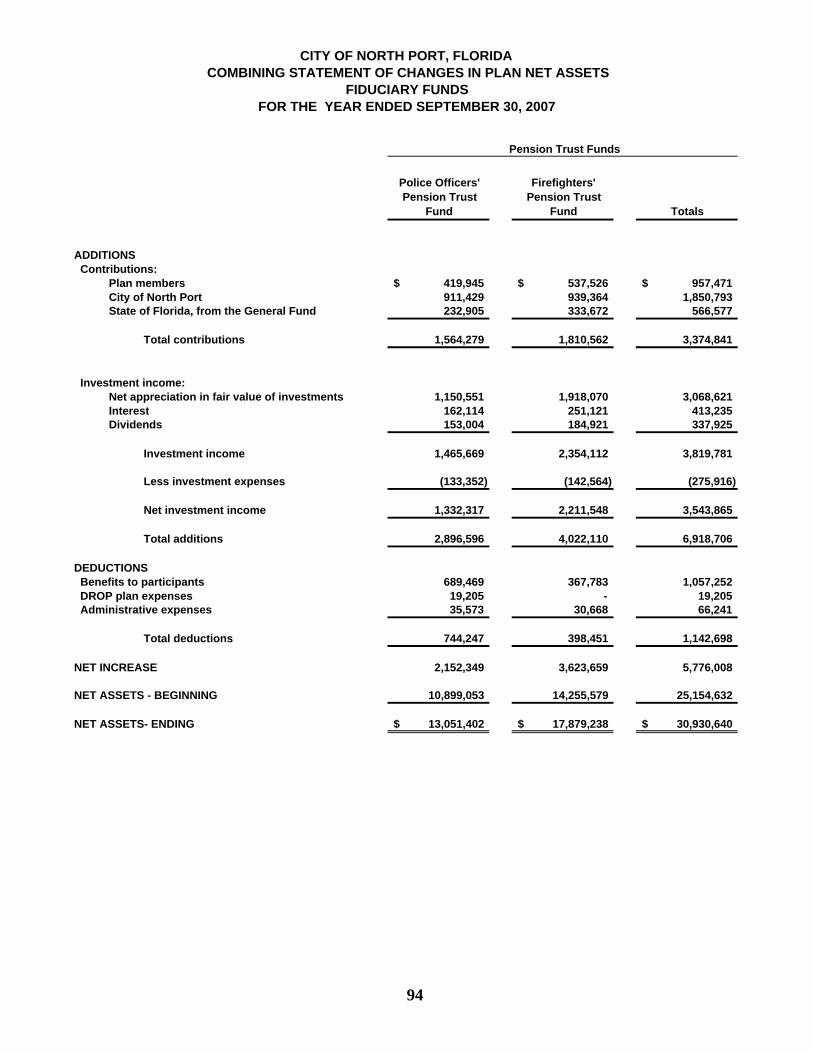
CITY OF NORTH PORT, FLORIDA COMBINING STATEMENT OF CHANGES IN PLAN NET ASSETS
FIDUCIARY FUNDSFOR THE YEAR ENDED SEPTEMBER 30, 2007
Police Officers' Pension Trust
Fund
Firefighters' Pension Trust
Fund Totals
ADDITIONS Contributions:
Plan members 419,945$ 537,526$ 957,471$ City of North Port 911,429 939,364 1,850,793 State of Florida, from the General Fund 232,905 333,672 566,577
Total contributions 1,564,279 1,810,562 3,374,841
Investment income:Net appreciation in fair value of investments 1,150,551 1,918,070 3,068,621 Interest 162,114 251,121 413,235 Dividends 153,004 184,921 337,925
Investment income 1,465,669 2,354,112 3,819,781
Less investment expenses (133,352) (142,564) (275,916)
Net investment income 1,332,317 2,211,548 3,543,865
Total additions 2,896,596 4,022,110 6,918,706
DEDUCTIONS Benefits to participants 689,469 367,783 1,057,252 DROP plan expenses 19,205 - 19,205 Administrative expenses 35,573 30,668 66,241
Total deductions 744,247 398,451 1,142,698
NET INCREASE 2,152,349 3,623,659 5,776,008
NET ASSETS - BEGINNING 10,899,053 14,255,579 25,154,632
NET ASSETS- ENDING 13,051,402$ 17,879,238$ 30,930,640$
Pension Trust Funds
94
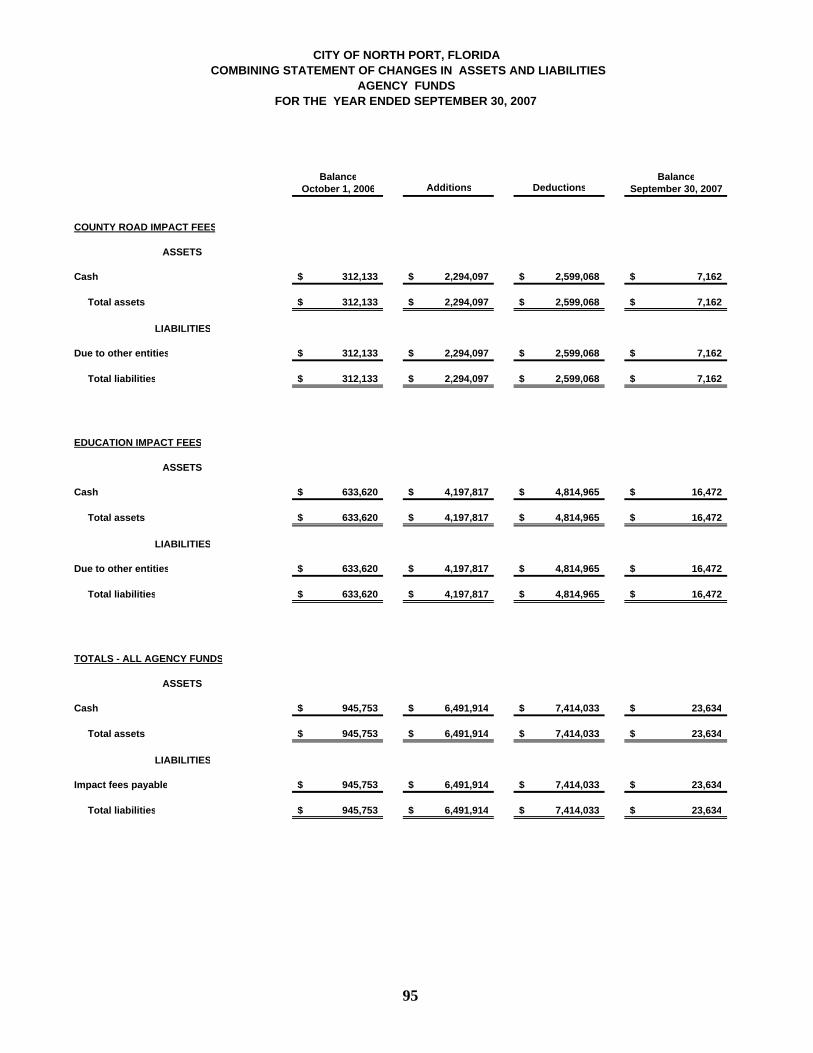
CITY OF NORTH PORT, FLORIDA COMBINING STATEMENT OF CHANGES IN ASSETS AND LIABILITIES
AGENCY FUNDSFOR THE YEAR ENDED SEPTEMBER 30, 2007
Balance BalanceOctober 1, 2006 Additions Deductions September 30, 2007
COUNTY ROAD IMPACT FEES
ASSETS
Cash 312,133$ 2,294,097$ 2,599,068$ 7,162$
Total assets 312,133$ 2,294,097$ 2,599,068$ 7,162$
LIABILITIES
Due to other entities 312,133$ 2,294,097$ 2,599,068$ 7,162$
Total liabilities 312,133$ 2,294,097$ 2,599,068$ 7,162$
EDUCATION IMPACT FEES
ASSETS
Cash 633,620$ 4,197,817$ 4,814,965$ 16,472$
Total assets 633,620$ 4,197,817$ 4,814,965$ 16,472$
LIABILITIES
Due to other entities 633,620$ 4,197,817$ 4,814,965$ 16,472$
Total liabilities 633,620$ 4,197,817$ 4,814,965$ 16,472$
TOTALS - ALL AGENCY FUNDS
ASSETS
Cash 945,753$ 6,491,914$ 7,414,033$ 23,634$
Total assets 945,753$ 6,491,914$ 7,414,033$ 23,634$
LIABILITIES
Impact fees payable 945,753$ 6,491,914$ 7,414,033$ 23,634$
Total liabilities 945,753$ 6,491,914$ 7,414,033$ 23,634$
95

This part of the City of North Port, Florida's (the City) Comprehensive Annual Financial Report presents detailedinformation as a context for understanding what the information in the financial statements, note disclosures and requiredsupplementary information says about the City's overall financial health.
Pages
Financial Trends Information 97-102 These schedules contain trend information to help the reader understand how the City's financial performance and well-being have changed over time.
Revenue Capacity Information 103-106 These schedules contain information to help the reader assess the City's local revenue source.
Debt Capacity Information 107-111 These schedules present information to help the reader assess the City's debt burden and its ability to issue additional debt in the future.
Demographic and Economic Information 112-113 These schedules offer demographic and economic indicators to help the reader understand the environment in which the City's financial activities take place.
Operating Information 114-116 These schedules contain service and infrastructure data to help the reader understand how the information in the City's financial report relates to the services the City provides and the activities it performs.
Source: Unless otherwise noted, the information in these schedules was obtained from theComprehensive Annual Financial Reports for the relevant year. The City implemented GASB StatementNo. 34 in 2003; schedules presenting government-wide information include information beginning in that year.
Statistical Section(Unaudited)
Contents
96

Schedule 1City of North Port, FloridaNet Assets by ComponentLast Five Fiscal Years(accrual basis of accounting)
2003 2004 2005 2006 2007Governmental activities Invested in capital assets, net of related debt 20,815,594$ 10,949,488$ 21,853,839$ 29,853,705$ 153,428,893$ Restricted 20,095,133 39,765,421 40,034,103 53,700,997 65,547,548 Unrestricted 9,771,905 12,719,280 18,792,283 59,805,096 56,569,919 Total governmental activities net assets 50,682,632$ 63,434,189$ 80,680,225$ 143,359,798$ 275,546,360$
Business-type activities Invested in capital assets, net of related debt 4,557,463$ 23,222,757$ 24,677,890$ 42,464,012$ 49,560,075$ Restricted 11,993,980 9,785,727 15,091,003 22,839,326 24,839,466 Unrestricted 7,456,204 12,794,292 13,036,666 12,686,914 12,173,644 Total business-type activities net assets 24,007,647$ 45,802,776$ 52,805,559$ 77,990,252$ 86,573,185$
Primary government Invested in capital assets, net of related debt 25,373,057$ 34,172,245$ 46,531,729$ 72,317,717$ 202,988,968$ Restricted 32,089,113 49,551,148 55,125,106 76,540,323 90,387,014 Unrestricted 17,228,109 25,513,572 31,828,949 72,492,010 68,743,563 Total primary government net assets 74,690,279$ 109,236,965$ 133,485,784$ 221,350,050$ 362,119,545$
Note: GASB 34 implemented fiscal year ended 9/30/03.
Fiscal Year
97
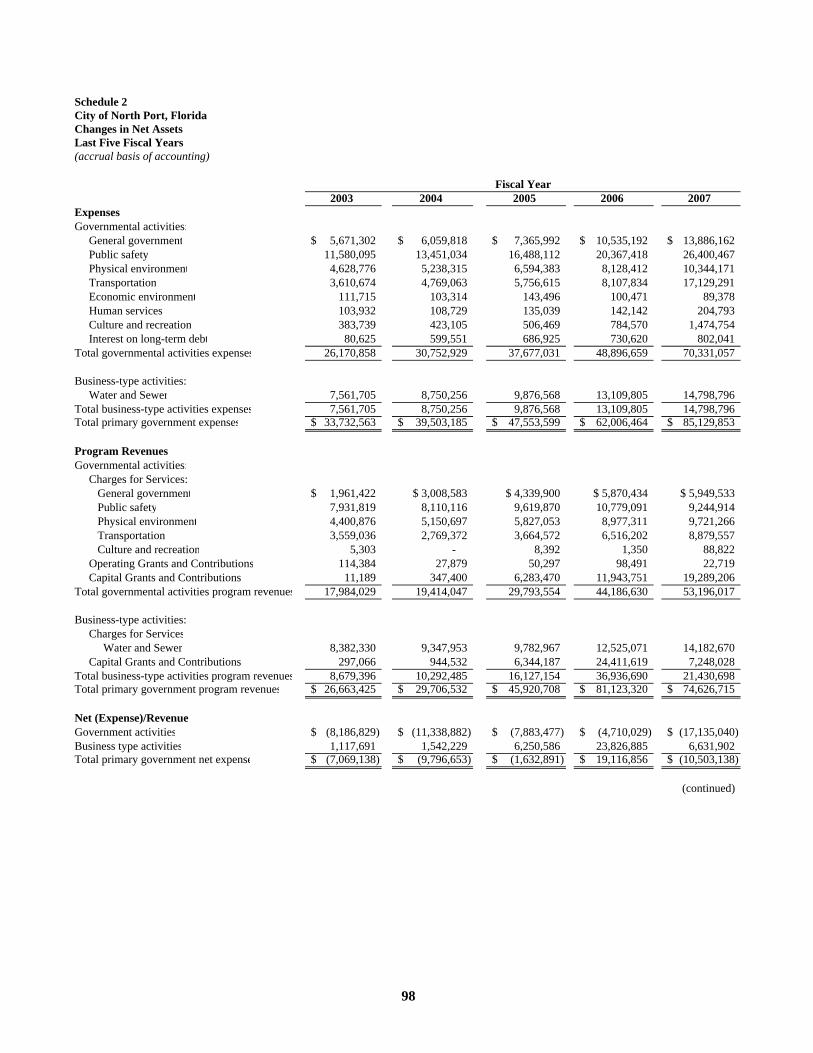
Schedule 2City of North Port, FloridaChanges in Net AssetsLast Five Fiscal Years(accrual basis of accounting)
2003 2004 2005 2006 2007ExpensesGovernmental activities: General government 5,671,302$ 6,059,818$ 7,365,992$ 10,535,192$ 13,886,162$ Public safety 11,580,095 13,451,034 16,488,112 20,367,418 26,400,467 Physical environment 4,628,776 5,238,315 6,594,383 8,128,412 10,344,171 Transportation 3,610,674 4,769,063 5,756,615 8,107,834 17,129,291 Economic environment 111,715 103,314 143,496 100,471 89,378 Human services 103,932 108,729 135,039 142,142 204,793 Culture and recreation 383,739 423,105 506,469 784,570 1,474,754 Interest on long-term debt 80,625 599,551 686,925 730,620 802,041 Total governmental activities expenses 26,170,858 30,752,929 37,677,031 48,896,659 70,331,057
Business-type activities: Water and Sewer 7,561,705 8,750,256 9,876,568 13,109,805 14,798,796 Total business-type activities expenses 7,561,705 8,750,256 9,876,568 13,109,805 14,798,796 Total primary government expenses 33,732,563$ 39,503,185$ 47,553,599$ 62,006,464$ 85,129,853$
Program RevenuesGovernmental activities: Charges for Services: General government 1,961,422$ $ 3,008,583 $ 4,339,900 $ 5,870,434 $ 5,949,533 Public safety 7,931,819 8,110,116 9,619,870 10,779,091 9,244,914 Physical environment 4,400,876 5,150,697 5,827,053 8,977,311 9,721,266 Transportation 3,559,036 2,769,372 3,664,572 6,516,202 8,879,557 Culture and recreation 5,303 - 8,392 1,350 88,822 Operating Grants and Contributions 114,384 27,879 50,297 98,491 22,719 Capital Grants and Contributions 11,189 347,400 6,283,470 11,943,751 19,289,206 Total governmental activities program revenues 17,984,029 19,414,047 29,793,554 44,186,630 53,196,017
Business-type activities: Charges for Services Water and Sewer 8,382,330 9,347,953 9,782,967 12,525,071 14,182,670 Capital Grants and Contributions 297,066 944,532 6,344,187 24,411,619 7,248,028 Total business-type activities program revenues 8,679,396 10,292,485 16,127,154 36,936,690 21,430,698 Total primary government program revenues 26,663,425$ 29,706,532$ 45,920,708$ 81,123,320$ 74,626,715$
Net (Expense)/RevenueGovernment activities (8,186,829)$ (11,338,882)$ (7,883,477)$ (4,710,029)$ (17,135,040)$ Business type activities 1,117,691 1,542,229 6,250,586 23,826,885 6,631,902 Total primary government net expense (7,069,138)$ (9,796,653)$ (1,632,891)$ 19,116,856$ (10,503,138)$
(continued)
Fiscal Year
98
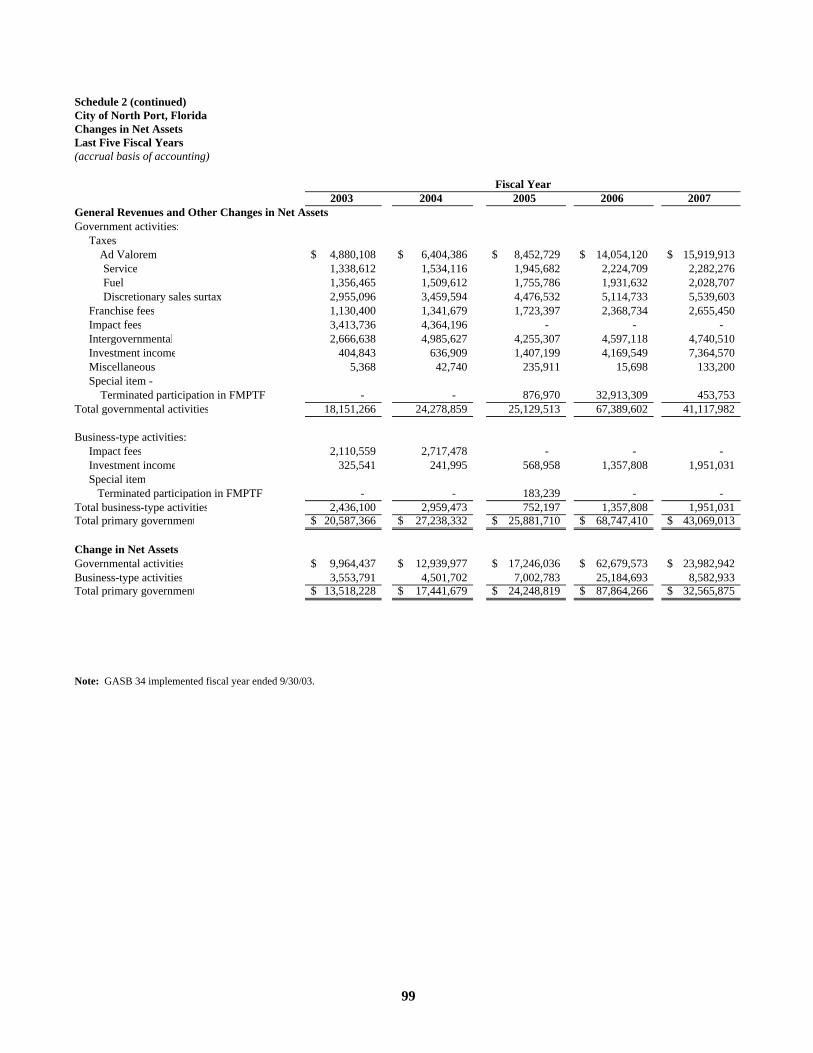
Schedule 2 (continued)City of North Port, FloridaChanges in Net Assets Last Five Fiscal Years (accrual basis of accounting)
2003 2004 2005 2006 2007General Revenues and Other Changes in Net AssetsGovernment activities: Taxes
4,880,108$ 6,404,386$ 8,452,729$ 14,054,120$ 15,919,913$ Service 1,338,612 1,534,116 1,945,682 2,224,709 2,282,276 Fuel 1,356,465 1,509,612 1,755,786 1,931,632 2,028,707 Discretionary sales surtax 2,955,096 3,459,594 4,476,532 5,114,733 5,539,603 Franchise fees 1,130,400 1,341,679 1,723,397 2,368,734 2,655,450 Impact fees 3,413,736 4,364,196 - - - Intergovernmental 2,666,638 4,985,627 4,255,307 4,597,118 4,740,510 Investment income 404,843 636,909 1,407,199 4,169,549 7,364,570 Miscellaneous 5,368 42,740 235,911 15,698 133,200 Special item - Terminated participation in FMPTF - - 876,970 32,913,309 453,753 Total governmental activities 18,151,266 24,278,859 25,129,513 67,389,602 41,117,982
Business-type activities: Impact fees 2,110,559 2,717,478 - - - Investment income 325,541 241,995 568,958 1,357,808 1,951,031 Special item Terminated participation in FMPTF - - 183,239 - - Total business-type activities 2,436,100 2,959,473 752,197 1,357,808 1,951,031 Total primary government 20,587,366$ 27,238,332$ 25,881,710$ 68,747,410$ 43,069,013$
Change in Net AssetsGovernmental activities 9,964,437$ 12,939,977$ 17,246,036$ 62,679,573$ 23,982,942$ Business-type activities 3,553,791 4,501,702 7,002,783 25,184,693 8,582,933 Total primary government 13,518,228$ 17,441,679$ 24,248,819$ 87,864,266$ 32,565,875$
Note: GASB 34 implemented fiscal year ended 9/30/03.
Ad Valorem
Fiscal Year
99

Schedule 3City of North Port, FloridaFund Balances of Governmental FundsLast Ten Fiscal Years(modified accrual basis of accounting)
1998 1999 2000 2001 2002 2003 2004 2005 2006 2007General Fund Reserved -$ 74,611$ 54,355$ -$ -$ 720,041$ 739,856$ 2,040,049$ 2,938,126$ 1,990,049$ Unreserved 4,221,244 4,595,033 5,216,506 6,818,323 8,199,469 10,290,279 12,390,992 18,166,856 25,128,997 24,479,688 Total general fund 4,221,244$ 4,669,644$ 5,270,861$ 6,818,323$ 8,199,469$ 11,010,320$ 13,130,848$ 20,206,905$ 28,067,123$ 26,469,737$
All Other Governmental Funds Reserved 3,674,174$ 2,844,953$ 2,841,260$ 3,670,907$ 147,879$ 117,316$ 17,570$ 14,652$ 26,261$ 17,084$ Unreserved, reported in: Special revenue funds 2,545,560 1,312,526 1,767,095 4,208,894 7,879,719 12,879,843 18,309,831 24,511,187 71,226,711 76,255,577 Capital projects funds - - - - 5,399,967 6,465,937 19,838,328 14,068,850 14,255,201 16,337,235 Total all other governmental funds 6,219,734$ 4,157,479$ 4,608,355$ 7,879,801$ 13,427,565$ 19,463,096$ 38,165,729$ 38,594,689$ 85,508,173$ 92,609,896$
100
Fiscal Year
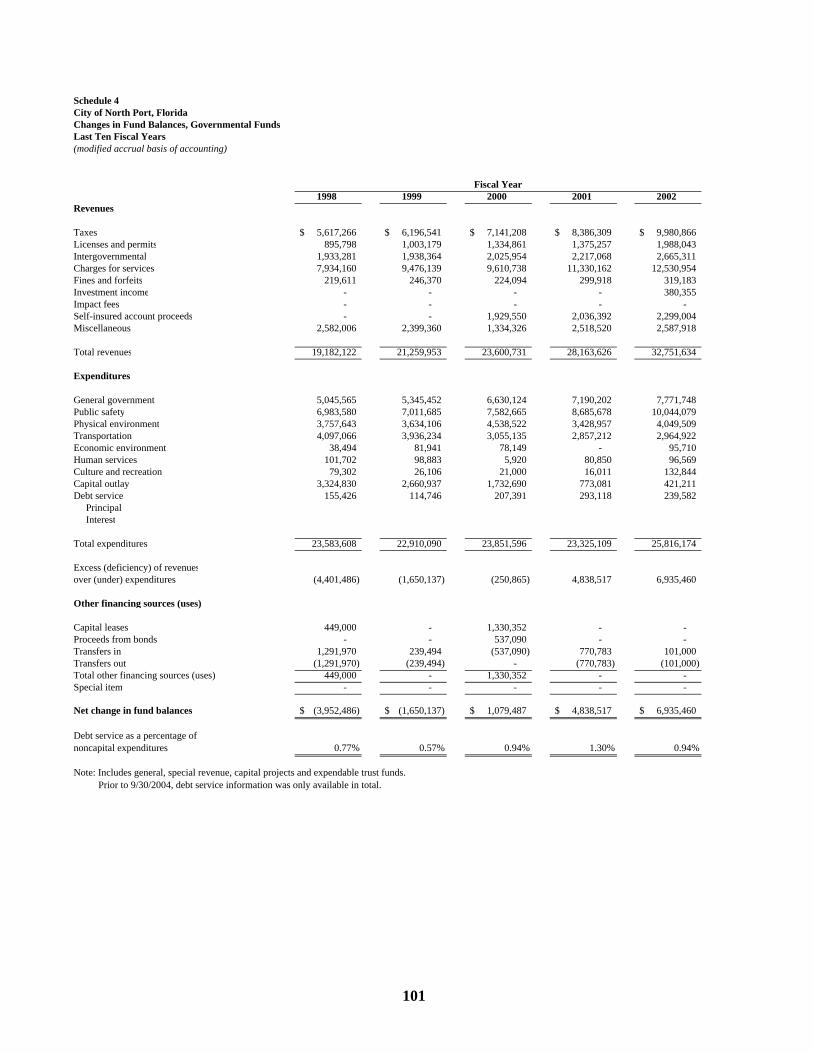
Schedule 4City of North Port, FloridaChanges in Fund Balances, Governmental FundsLast Ten Fiscal Years(modified accrual basis of accounting)
1998 1999 2000 2001 2002Revenues
Taxes 5,617,266$ 6,196,541$ 7,141,208$ 8,386,309$ 9,980,866$ Licenses and permits 895,798 1,003,179 1,334,861 1,375,257 1,988,043 Intergovernmental 1,933,281 1,938,364 2,025,954 2,217,068 2,665,311 Charges for services 7,934,160 9,476,139 9,610,738 11,330,162 12,530,954 Fines and forfeits 219,611 246,370 224,094 299,918 319,183 Investment income - - - - 380,355 Impact fees - - - - - Self-insured account proceeds - - 1,929,550 2,036,392 2,299,004 Miscellaneous 2,582,006 2,399,360 1,334,326 2,518,520 2,587,918
Total revenues 19,182,122 21,259,953 23,600,731 28,163,626 32,751,634
Expenditures
General government 5,045,565 5,345,452 6,630,124 7,190,202 7,771,748Public safety 6,983,580 7,011,685 7,582,665 8,685,678 10,044,079Physical environment 3,757,643 3,634,106 4,538,522 3,428,957 4,049,509Transportation 4,097,066 3,936,234 3,055,135 2,857,212 2,964,922Economic environment 38,494 81,941 78,149 - 95,710 Human services 101,702 98,883 5,920 80,850 96,569Culture and recreation 79,302 26,106 21,000 16,011 132,844Capital outlay 3,324,830 2,660,937 1,732,690 773,081 421,211Debt service 155,426 114,746 207,391 293,118 239,582 Principal Interest
Total expenditures 23,583,608 22,910,090 23,851,596 23,325,109 25,816,174
Excess (deficiency) of revenuesover (under) expenditures (4,401,486) (1,650,137) (250,865) 4,838,517 6,935,460
Other financing sources (uses)
Capital leases 449,000 - 1,330,352 - - Proceeds from bonds - - 537,090 - - Transfers in 1,291,970 239,494 (537,090) 770,783 101,000 Transfers out (1,291,970) (239,494) - (770,783) (101,000) Total other financing sources (uses) 449,000 - 1,330,352 - - Special item - - - - -
Net change in fund balances (3,952,486)$ (1,650,137)$ 1,079,487$ 4,838,517$ 6,935,460$
Debt service as a percentage ofnoncapital expenditures 0.77% 0.57% 0.94% 1.30% 0.94%
Note: Includes general, special revenue, capital projects and expendable trust funds. Prior to 9/30/2004, debt service information was only available in total.
Fiscal Year
101
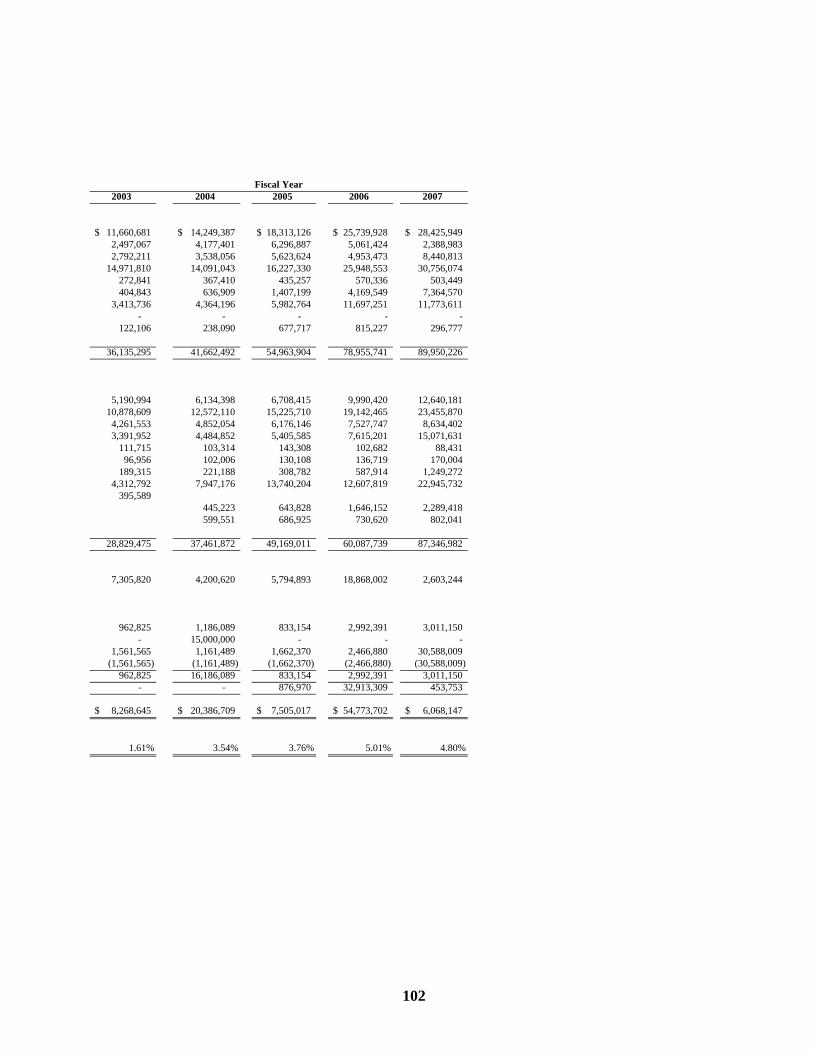
2003 2004 2005 2006 2007
11,660,681$ 14,249,387$ 18,313,126$ 25,739,928$ 28,425,949$ 2,497,067 4,177,401 6,296,887 5,061,424 2,388,983 2,792,211 3,538,056 5,623,624 4,953,473 8,440,813
14,971,810 14,091,043 16,227,330 25,948,553 30,756,074 272,841 367,410 435,257 570,336 503,449 404,843 636,909 1,407,199 4,169,549 7,364,570
3,413,736 4,364,196 5,982,764 11,697,251 11,773,611 - - - - -
122,106 238,090 677,717 815,227 296,777
36,135,295 41,662,492 54,963,904 78,955,741 89,950,226
5,190,994 6,134,398 6,708,415 9,990,420 12,640,181 10,878,609 12,572,110 15,225,710 19,142,465 23,455,870
4,261,553 4,852,054 6,176,146 7,527,747 8,634,402 3,391,952 4,484,852 5,405,585 7,615,201 15,071,631
111,715 103,314 143,308 102,682 88,431 96,956 102,006 130,108 136,719 170,004
189,315 221,188 308,782 587,914 1,249,272 4,312,792 7,947,176 13,740,204 12,607,819 22,945,732
395,589445,223 643,828 1,646,152 2,289,418 599,551 686,925 730,620 802,041
28,829,475 37,461,872 49,169,011 60,087,739 87,346,982
7,305,820 4,200,620 5,794,893 18,868,002 2,603,244
962,825 1,186,089 833,154 2,992,391 3,011,150 - 15,000,000 - - -
1,561,565 1,161,489 1,662,370 2,466,880 30,588,009 (1,561,565) (1,161,489) (1,662,370) (2,466,880) (30,588,009)
962,825 16,186,089 833,154 2,992,391 3,011,150- - 876,970 32,913,309 453,753
8,268,645$ 20,386,709$ 7,505,017$ 54,773,702$ 6,068,147$
1.61% 3.54% 3.76% 5.01% 4.80%
Fiscal Year
102

Schedule 5City of North Port, FloridaAssessed Value and Actual Value of Taxable PropertyLast Eight Fiscal Years
Fiscal Year Less: Total Taxable Total
Ended Residential Commercial Industrial Personal Tax-Exempt Assessed Direct
September 30,a Property Property Property b Property Property Value Tax Rate
2000 875,691,730$ 69,607,620$ 78,561,621$ 45,466,753$ 291,232,979$ 778,094,745 $4.802001 - - - - - - $4.652002 - - - - - - $4.552003 1,421,459,462 104,782,400 176,123,085 73,055,955 456,733,915 1,318,686,987 $4.502004 1,995,243,394 124,640,500 223,080,926 72,362,507 625,218,116 1,790,109,211 $5.002005 3,288,067,713 172,819,700 342,853,528 72,815,996 919,599,648 2,956,957,289 $4.902006 5,584,415,062 274,285,900 418,069,574 105,641,248 1,451,274,746 4,931,137,038 $4.902007 5,964,293,322 331,319,400 484,345,742 135,343,082 1,288,064,060 5,627,237,486 $3.30
Source: Sarasota County Property Appraiser
Note: Property is assessed at market value. The Save Our Homes Amendment caps homesteaded property at a maximum increase in the taxable value of 3% per year. Tax rate is per $1,000 of assessed value.
a Data for 2001-2002 was unavailable due to inconsistent run times between recapitulation and property values CD; information for years prior to 2000 was not available. b Industrial property amount includes railroad properties classified as centrally assessed property.
Real Property
103

Schedule 6City of North Port, FloridaDirect and Overlapping Property Tax Rates,Last Ten Fiscal Years(Per $1,000 of Assessed Value)
Fiscal YearEnded Operating Total Sarasota School Board Total Direct and
September 30, Miliage City Millage County of Sarasota County Overlapping Rates
1998 5.0000 5.0000 4.9173 8.9470 18.86431999 4.9000 4.9000 5.2042 9.2290 19.33322000 4.8000 4.8000 5.5794 8.5370 18.91642001 4.6500 4.6500 5.5758 8.5440 18.76982002 4.5500 4.5500 5.5653 8.4880 18.60332003 4.5000 4.5000 5.5489 9.2870 19.33592004 5.0000 5.0000 5.6228 8.7930 19.41582005 4.9000 4.9000 5.5639 8.3660 18.82992006 4.9000 4.9000 6.1759 7.8610 18.93692007 3.3000 3.3000 5.9759 7.2100 16.4859
Source: Sarasota County Tax Collector
Note: a Overlapping rates are those of county governments that apply to property owners within the City of North Port.
City of North Port Overlapping Rates a
104
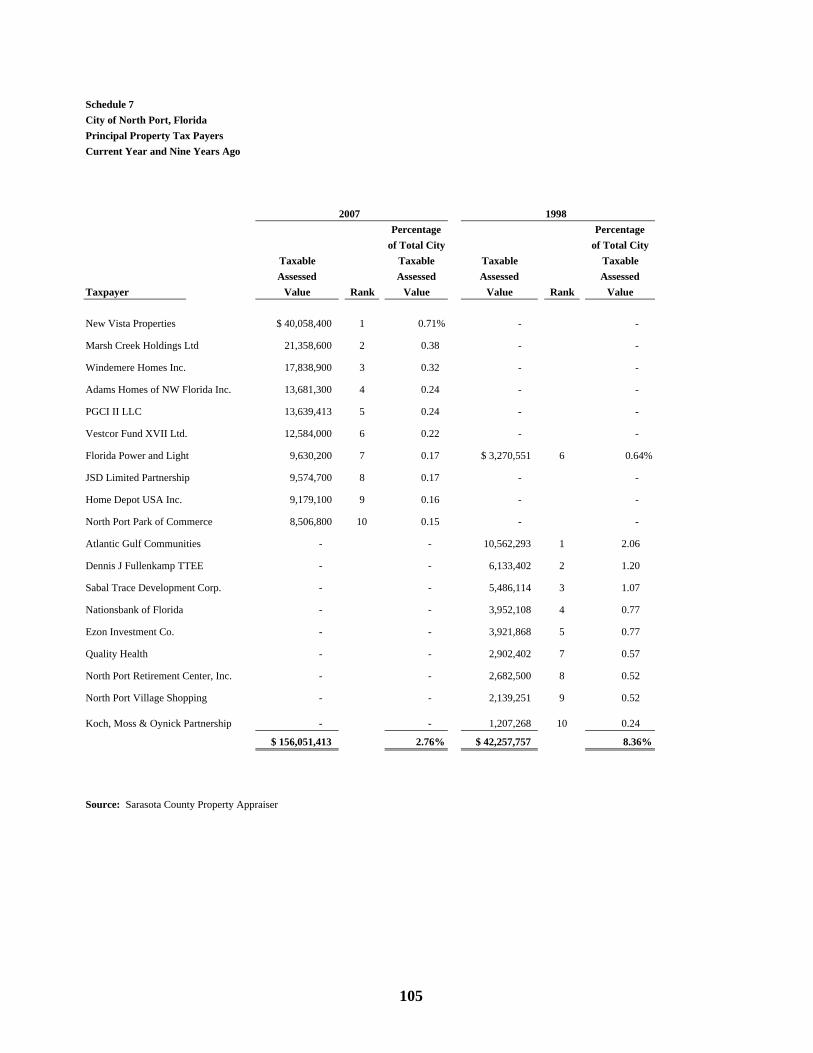
Schedule 7City of North Port, FloridaPrincipal Property Tax PayersCurrent Year and Nine Years Ago
Percentage Percentage of Total City of Total City
Taxable Taxable Taxable Taxable Assessed Assessed Assessed AssessedTaxpayer Value Rank Value Value Rank Value
New Vista Properties $ 40,058,400 1 0.71% - -
Marsh Creek Holdings Ltd 21,358,600 2 0.38 - -
Windemere Homes Inc. 17,838,900 3 0.32 - -
Adams Homes of NW Florida Inc. 13,681,300 4 0.24 - -
PGCI II LLC 13,639,413 5 0.24 - -
Vestcor Fund XVII Ltd. 12,584,000 6 0.22 - -
Florida Power and Light 9,630,200 7 0.17 $ 3,270,551 6 0.64%
JSD Limited Partnership 9,574,700 8 0.17 - -
Home Depot USA Inc. 9,179,100 9 0.16 - -
North Port Park of Commerce 8,506,800 10 0.15 - -
Atlantic Gulf Communities - - 10,562,293 1 2.06
Dennis J Fullenkamp TTEE - - 6,133,402 2 1.20
Sabal Trace Development Corp. - - 5,486,114 3 1.07
Nationsbank of Florida - - 3,952,108 4 0.77
Ezon Investment Co. - - 3,921,868 5 0.77
Quality Health - - 2,902,402 7 0.57
North Port Retirement Center, Inc. - - 2,682,500 8 0.52
North Port Village Shopping - - 2,139,251 9 0.52
Koch, Moss & Oynick Partnership - - 1,207,268 10 0.24
$ 156,051,413 2.76% $ 42,257,757 8.36%
Source: Sarasota County Property Appraiser
2007 1998
105

Schedule 8City of North Port, FloridaProperty Tax Levies and Tax CollectionsLast Ten Fiscal Years
Fiscal Year Taxes Levied CollectionsEnded for the in Subsequent
September 30, Fiscal Year Amount a Years Amount
1998 2,685,878 2,564,125 95.47 47,781 2,611,906 97.25
1999 2,927,833 2,745,667 93.78 66,509 2,812,176 96.05
2000 3,258,250 3,041,015 93.33 58,169 3,099,184 95.12
2001 3,598,196 3,466,833 96.35 106,502 3,573,335 99.31
2002 4,205,584 3,953,196 94.00 135,686 4,088,882 97.23
2003 4,815,831 4,675,206 97.08 204,902 4,880,108 101.33
2004 6,607,028 6,383,592 96.62 20,794 6,404,386 96.93
2005 8,935,418 8,430,651 94.35 22,078 8,452,729 94.60
2006 14,490,734 14,039,019 96.88 15,101 14,054,120 96.99
2007 16,443,468 15,885,252 96.61 34,661 15,919,913 96.82
Source: Sarasota County Property AppraiserNote: (a) Includes discount taken for early payment of property taxes.
Percentageof Levy
Total Collections to Date
Percentageof Levy
106
Collected within theFiscal Year of the Levy
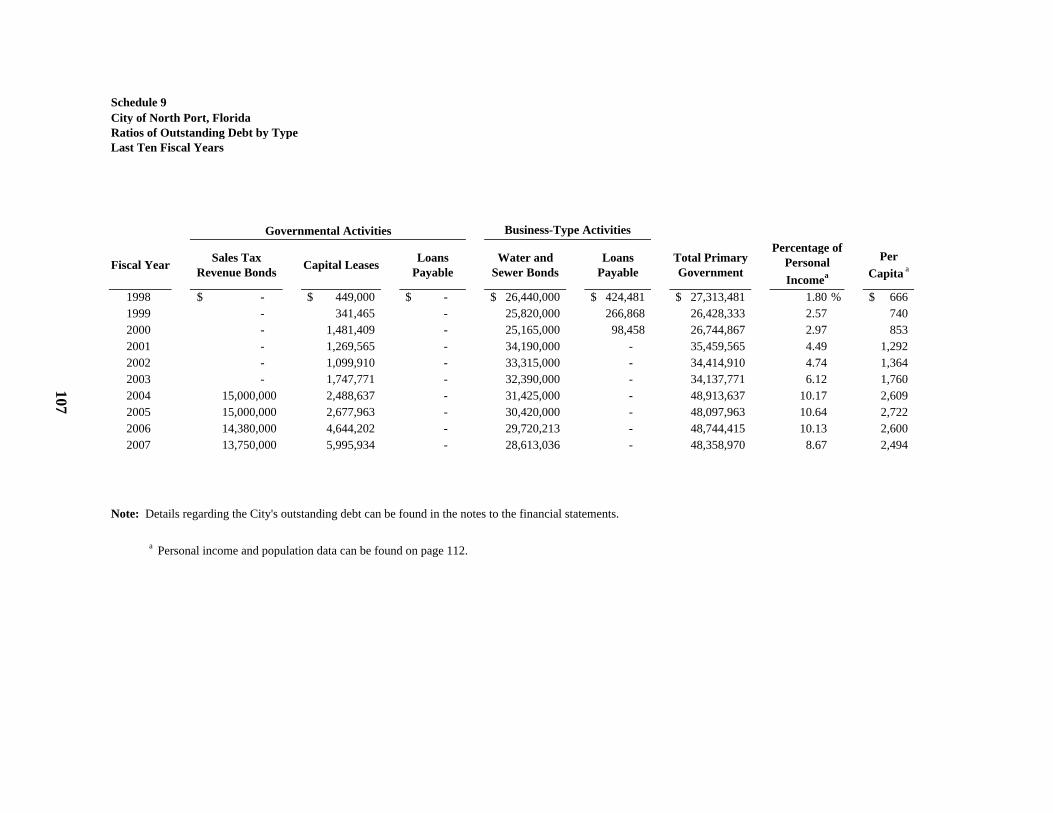
Schedule 9City of North Port, FloridaRatios of Outstanding Debt by TypeLast Ten Fiscal Years
Fiscal Year Sales Tax Revenue Bonds Capital Leases Loans
PayableWater and
Sewer BondsLoans
PayableTotal Primary Government
Per Capita a
1998 -$ 449,000$ -$ 26,440,000$ 424,481$ 27,313,481$ 1.80 % 666$ 1999 - 341,465 - 25,820,000 266,868 26,428,333 2.57 740 2000 - 1,481,409 - 25,165,000 98,458 26,744,867 2.97 853 2001 - 1,269,565 - 34,190,000 - 35,459,565 4.49 1,292 2002 - 1,099,910 - 33,315,000 - 34,414,910 4.74 1,364 2003 - 1,747,771 - 32,390,000 - 34,137,771 6.12 1,760 2004 15,000,000 2,488,637 - 31,425,000 - 48,913,637 10.17 2,609 2005 15,000,000 2,677,963 - 30,420,000 - 48,097,963 10.64 2,722 2006 14,380,000 4,644,202 - 29,720,213 - 48,744,415 10.13 2,600 2007 13,750,000 5,995,934 - 28,613,036 - 48,358,970 8.67 2,494
Note: Details regarding the City's outstanding debt can be found in the notes to the financial statements.
a Personal income and population data can be found on page 112.
Governmental Activities Business-Type Activities
107
Percentage of Personal Incomea
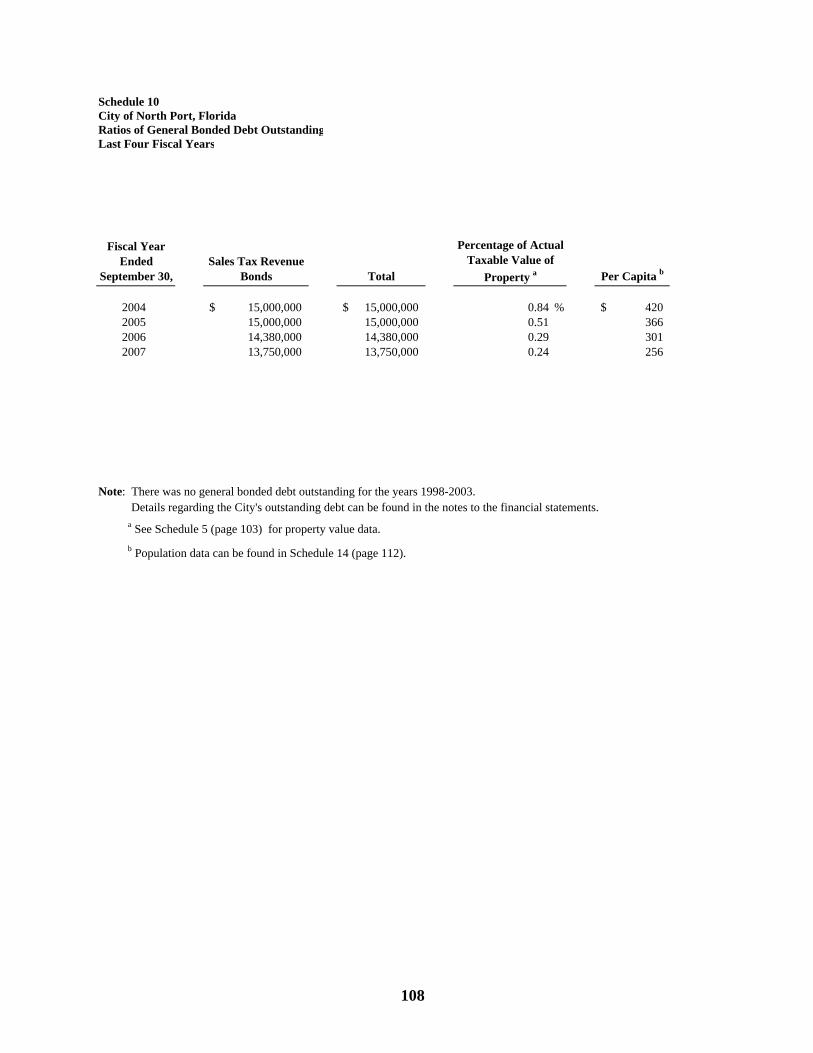
Schedule 10City of North Port, FloridaRatios of General Bonded Debt OutstandingLast Four Fiscal Years
Fiscal Year Ended
September 30,Sales Tax Revenue
Bonds Total Per Capita b
2004 15,000,000$ 15,000,000$ 0.84 % 420$ 2005 15,000,000 15,000,000 0.51 366 2006 14,380,000 14,380,000 0.29 301 2007 13,750,000 13,750,000 0.24 256
Note: There was no general bonded debt outstanding for the years 1998-2003. Details regarding the City's outstanding debt can be found in the notes to the financial statements. a See Schedule 5 (page 103) for property value data. b Population data can be found in Schedule 14 (page 112).
Percentage of Actual Taxable Value of
Property a
108
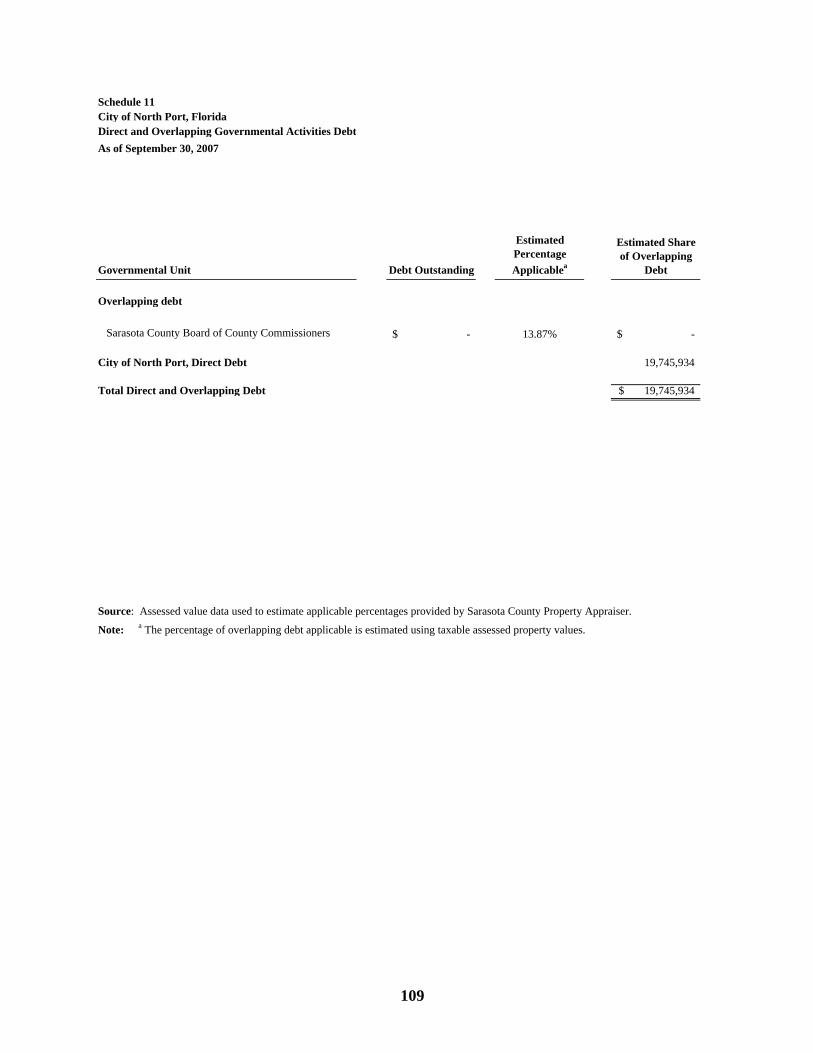
Schedule 11City of North Port, FloridaDirect and Overlapping Governmental Activities DebtAs of September 30, 2007
Governmental Unit Debt Outstanding
Estimated Percentage Applicablea
Estimated Share of Overlapping
Debt
Overlapping debt
Sarasota County Board of County Commissioners -$ 13.87% -$
City of North Port, Direct Debt 19,745,934
Total Direct and Overlapping Debt 19,745,934$
Source: Assessed value data used to estimate applicable percentages provided by Sarasota County Property Appraiser.
Note: a The percentage of overlapping debt applicable is estimated using taxable assessed property values.
109

Schedule 12City of North Port, FloridaLegal Debt Margin Information
No general obligation bonds have been issued on behalf of the City of North Port, Florida.
110

Schedule 13City of North Port, FloridaPledged-Revenue CoverageLast Ten Fiscal Years
Fiscal Year Utility Less: Net Half-Cent
Ended Service Operating Available Debt Service Sales Tax Debt Service c
September 30, Charges a Expenses b Revenue Principal Interest Coverage Revenues Principal Interest Coverage
1998 7,071,809 3,583,443 3,488,366 510,000 1,649,095 1.62 1,089,530 - - -
1999 7,084,761 3,633,696 3,451,065 620,000 1,265,797 1.83 1,198,156 - - -
2000 7,345,566 3,764,433 3,581,133 655,000 1,236,452 1.89 1,359,245 - - -
2001 7,473,747 3,998,296 3,475,451 805,000 1,608,687 1.44 1,506,179 - - -
2002 7,986,236 4,151,625 3,834,611 875,000 1,648,532 1.52 1,896,355 - - -
2003 8,382,330 4,629,355 3,752,975 925,000 1,603,747 1.48 2,085,307 - - -
2004 9,347,953 5,196,232 4,151,721 965,000 1,565,355 1.64 2,511,301 - - -
2005 9,782,967 6,198,707 3,584,260 1,005,000 1,524,783 1.42 2,997,055 - 581,370 5.16
2006 12,525,071 9,127,058 3,398,013 1,071,695 1,429,754 1.36 3,390,103 620,000 581,370 2.82
2007 14,182,670 10,490,810 3,691,860 1,107,177 1,396,118 1.47 3,212,980 630,000 571,140 2.67
Details regarding the City's outstanding debt can be found in the notes to financial statements.Note: a Excludes any extraordinary gains. b Excludes depreciation and includes bond issues expense. c No data prior to 2005 because no sales tax revenue bonds were issued until 2003. Principal payments did not begin until 2006.
Water Revenue Bonds Sales Tax Revenue Bonds
111

Schedule 14City of North Port, FloridaDemographic and Economic StatisticsLast Ten Calendar Years
Year Population a Personal Income
Per Capita Personal Incomeb
Unemployment Ratec
1998 17,672 451,961,400$ 25,575$ 2.9%
1999 18,749 480,968,097 25,653 2.6%
2000 19,392 557,733,312 28,761 3.6%
2001 25,234 725,755,074 28,761 4.0%
2002 27,448 789,431,928 28,761 4.9%
2003 31,352 901,714,872 28,761 4.8%
2004 35,721 1,027,371,681 28,761 4.2%
2005 41,000 1,521,633,000 37,113 3.3%
2006 47,770 2,243,518,050 46,965 3.6%
2007 53,732 2,835,545,104 52,772 5.9%
Source:a City of North Port Planning & Zoning Departmentb Bureau of Economic and Business Research, University of Florida; County data is used due
to no City data being available.c U.S. Bureau of Labor Statistics
112

Schedule 15City of North Port, FloridaPrincipal Employers,Current Year and Nine Years Ago
Employer Employees Rank
Percentage of Total County Employment Employees Rank
Percentage of Total County Employment
School Board of Sarasota County 5,447 1 3.08% 3,848 1 2.63%Sarasota Memorial Hospital 4,128 2 2.33% 3,000 4 2.05%Sarasota County Government 3,552 3 2.01% 3,192 2 2.18%Publix Supermarkets 3,042 4 1.72% 3,107 3 2.13%PGT Industries (Vinyl Tech) 1,780 5 1.01% 721 8 0.49%Wal-Mart 1,277 6 0.72% - - 0.00%Venice Regional Medical Center 927 7 0.52% Bon Secours - Venice Hospital 2,900 5 1.98%Nielsen Media Research 700 8 0.40% - - 0.00%Target 659 9 0.37% - - 0.00%Sarasota Herald Tribune 533 10 0.30% 575 10 0.39%HCA Doctors Hospital - - 0.00% 1,200 6 0.82%Winn Dixie Stores - - 0.00% 750 7 0.51%City of Sarasota - - 0.00% 739 9 0.51%Total 22,045 12.46% 20,032 13.69%
Source: Florida Agency for Workforce Innovation, Labor Market Statistics
Statistics are for Sarasota County; not available for City of North Port
2007 1998
113
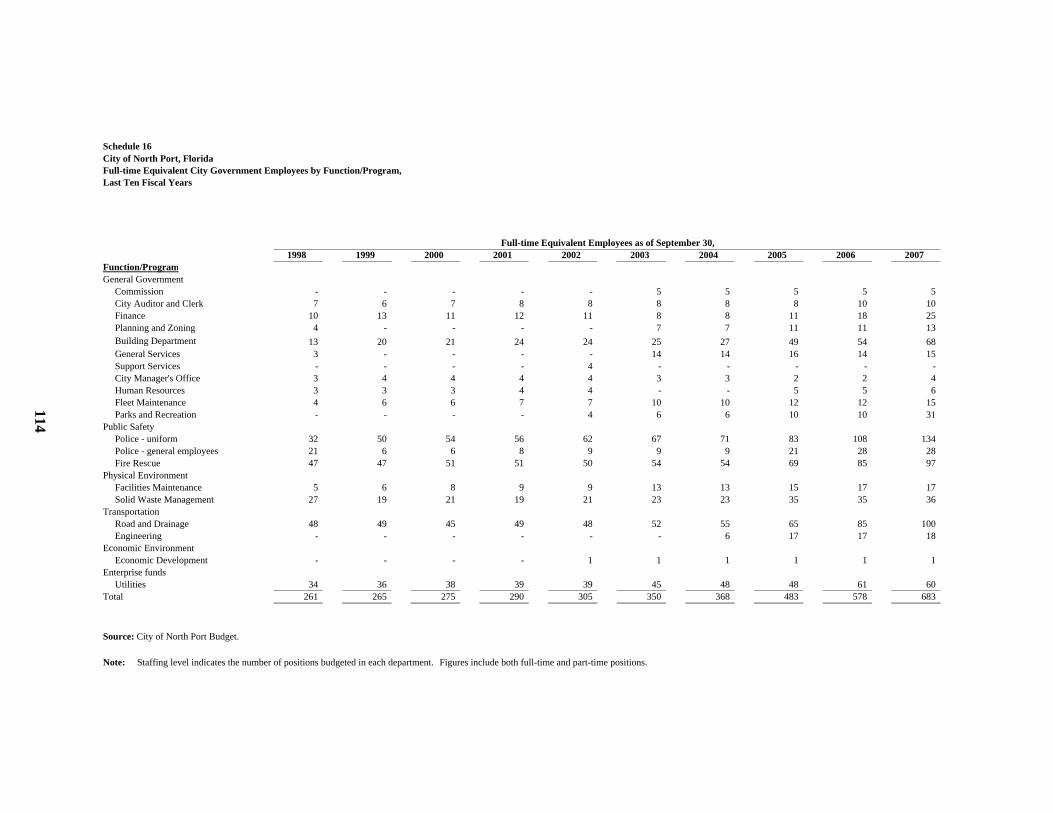
Schedule 16City of North Port, FloridaFull-time Equivalent City Government Employees by Function/Program,Last Ten Fiscal Years
1998 1999 2000 2001 2002 2003 2004 2005 2006 2007Function/ProgramGeneral Government Commission - - - - - 5 5 5 5 5 City Auditor and Clerk 7 6 7 8 8 8 8 8 10 10 Finance 10 13 11 12 11 8 8 11 18 25 Planning and Zoning 4 - - - - 7 7 11 11 13 Building Department 13 20 21 24 24 25 27 49 54 68 General Services 3 - - - - 14 14 16 14 15 Support Services - - - - 4 - - - - - City Manager's Office 3 4 4 4 4 3 3 2 2 4 Human Resources 3 3 3 4 4 - - 5 5 6 Fleet Maintenance 4 6 6 7 7 10 10 12 12 15 Parks and Recreation - - - - 4 6 6 10 10 31 Public Safety Police - uniform 32 50 54 56 62 67 71 83 108 134 Police - general employees 21 6 6 8 9 9 9 21 28 28 Fire Rescue 47 47 51 51 50 54 54 69 85 97 Physical Environment Facilities Maintenance 5 6 8 9 9 13 13 15 17 17 Solid Waste Management 27 19 21 19 21 23 23 35 35 36 Transportation Road and Drainage 48 49 45 49 48 52 55 65 85 100 Engineering - - - - - - 6 17 17 18 Economic Environment Economic Development - - - - 1 1 1 1 1 1 Enterprise funds Utilities 34 36 38 39 39 45 48 48 61 60 Total 261 265 275 290 305 350 368 483 578 683
Source: City of North Port Budget.
Full-time Equivalent Employees as of September 30,
114
Note: Staffing level indicates the number of positions budgeted in each department. Figures include both full-time and part-time positions.
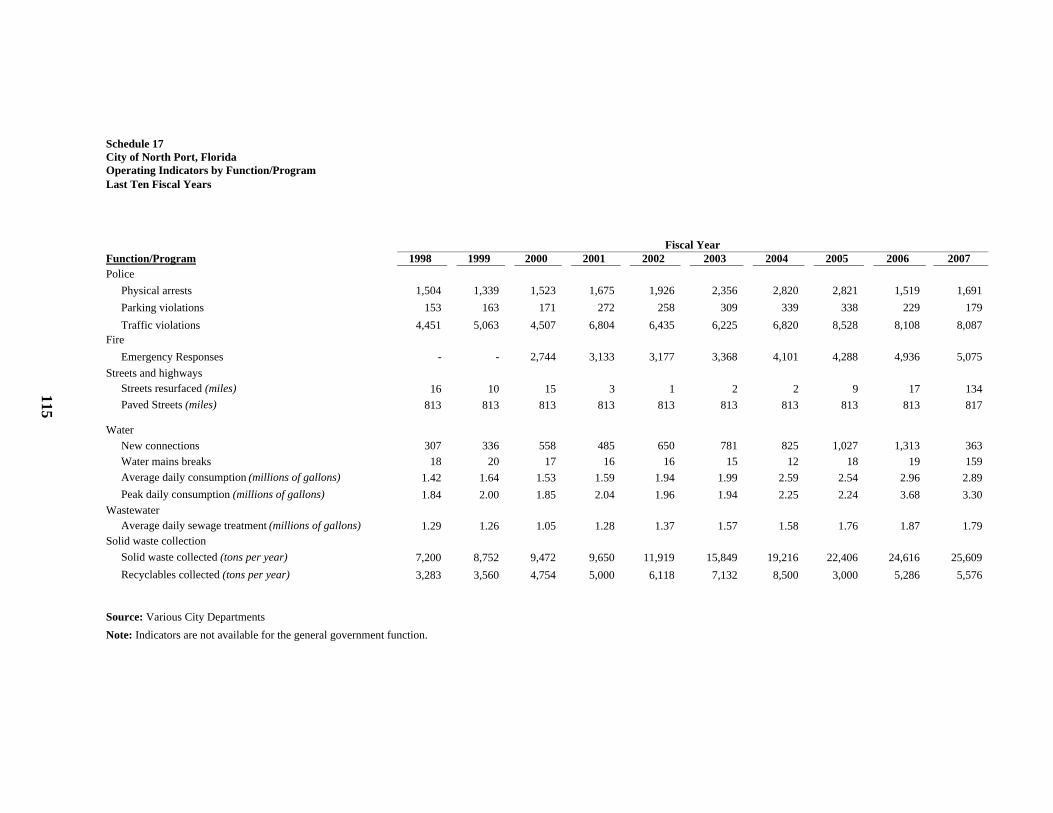
Schedule 17City of North Port, FloridaOperating Indicators by Function/ProgramLast Ten Fiscal Years
Function/Program 1998 1999 2000 2001 2002 2003 2004 2005 2006 2007Police
Physical arrests 1,504 1,339 1,523 1,675 1,926 2,356 2,820 2,821 1,519 1,691 Parking violations 153 163 171 272 258 309 339 338 229 179 Traffic violations 4,451 5,063 4,507 6,804 6,435 6,225 6,820 8,528 8,108 8,087
FireEmergency Responses - - 2,744 3,133 3,177 3,368 4,101 4,288 4,936 5,075
Streets and highways Streets resurfaced (miles) 16 10 15 3 1 2 2 9 17 134
Paved Streets (miles) 813 813 813 813 813 813 813 813 813 817
WaterNew connections 307 336 558 485 650 781 825 1,027 1,313 363 Water mains breaks 18 20 17 16 16 15 12 18 19 159 Average daily consumption (millions of gallons) 1.42 1.64 1.53 1.59 1.94 1.99 2.59 2.54 2.96 2.89 Peak daily consumption (millions of gallons) 1.84 2.00 1.85 2.04 1.96 1.94 2.25 2.24 3.68 3.30
WastewaterAverage daily sewage treatment (millions of gallons) 1.29 1.26 1.05 1.28 1.37 1.57 1.58 1.76 1.87 1.79
Solid waste collectionSolid waste collected (tons per year) 7,200 8,752 9,472 9,650 11,919 15,849 19,216 22,406 24,616 25,609 Recyclables collected (tons per year) 3,283 3,560 4,754 5,000 6,118 7,132 8,500 3,000 5,286 5,576
Source: Various City DepartmentsNote: Indicators are not available for the general government function.
115
Fiscal Year
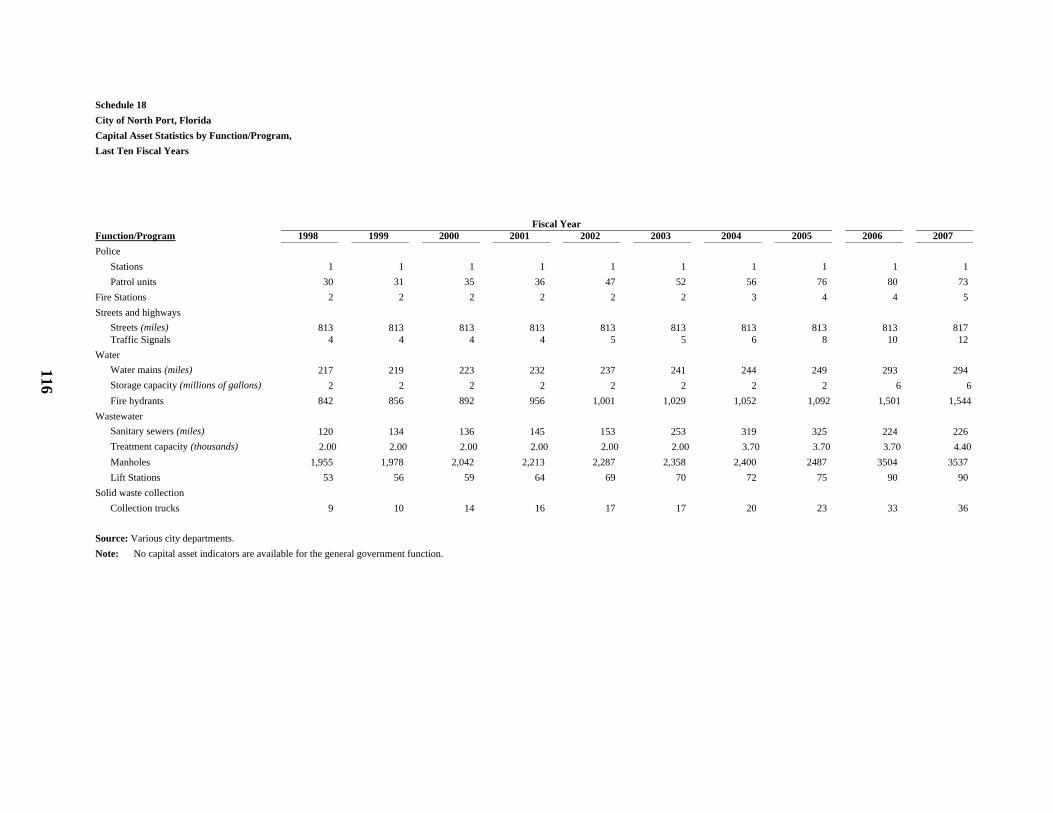
Schedule 18City of North Port, FloridaCapital Asset Statistics by Function/Program,Last Ten Fiscal Years
Function/Program 1998 1999 2000 2001 2002 2003 2004 2005 2006 2007Police
Stations 1 1 1 1 1 1 1 1 1 1Patrol units 30 31 35 36 47 52 56 76 80 73
Fire Stations 2 2 2 2 2 2 3 4 4 5Streets and highways
Streets (miles) 813 813 813 813 813 813 813 813 813 817Traffic Signals 4 4 4 4 5 5 6 8 10 12
WaterWater mains (miles) 217 219 223 232 237 241 244 249 293 294Storage capacity (millions of gallons) 2 2 2 2 2 2 2 2 6 6Fire hydrants 842 856 892 956 1,001 1,029 1,052 1,092 1,501 1,544
WastewaterSanitary sewers (miles) 120 134 136 145 153 253 319 325 224 226Treatment capacity (thousands) 2.00 2.00 2.00 2.00 2.00 2.00 3.70 3.70 3.70 4.40Manholes 1,955 1,978 2,042 2,213 2,287 2,358 2,400 2487 3504 3537Lift Stations 53 56 59 64 69 70 72 75 90 90
Solid waste collectionCollection trucks 9 10 14 16 17 17 20 23 33 36
Source: Various city departments.Note: No capital asset indicators are available for the general government function.
Fiscal Year
116