Embed Size (px)
Citation preview
1
CLIMATE PLAN FOR THE QUILEUTE TRIBE OF THE QUILEUTE RESERVATION
La Push, Washington, 9/30/2016
Prepared by Katherine Krueger, Quileute Natural Resources, B.S., M.S., J.D.
in Performance of US EPA Grant Funds FYs 2015‐2016
TABLE of CONTENTS
Preface 2
Executive Summary 4
Introduction to Geography and Governance 6
Risk Assessment 8
Scope of the Plan 10
Assessment of Resources and Threats, with Recommendations
Metadata and Tools
Sea Level Change
Terrestrial (Land) Environment
Fresh Water (Lakes, Rivers, Wetlands)
Marine Environment
Impact on Infrastructure/Facilities
Cultural Impacts
14
14
15
19
21
32
46
49
Appendix
Recommendations Summarized
Maps
Research to Correct the Planet
Hazard Work Sheets
Resources and Acknowledgements
50
50
52
56
57
59
2
Preface: It is important to understand the difference between weather and climate. Weather forecasts cover perhaps two weeks, and if extending into a season, a few months, or even a few years, but climate is weather over decades or even centuries. The National Academies of Sciences put on a slide show about this in March of 2016, in anticipation of their book to be published later this year entitled Next Generation Earth System Prediction. Researchers want to extend weather forecasting capacity, based on modeling, using vast accumulations of prior data, because weather affects so many aspects of our economy. So when we have a summer of unusual drought or a year of constant rain that extends all summer long, it is premature to call this climate change. But when we measure increases of global temperature averages over decades, or see planet‐wide loss of continental ice over decades, we can make statements about climate. Weather is the acute: a tornado or a hurricane. Climate is the chronic: long changes over time, creating a new normal, if you will.
Before even reading or acting on a climate plan, two questions must be addressed:
1) Is the climate changing?
2) Did humans cause this?
The answer to both questions is Yes and Yes (in the opinion of most researchers). You may have been under the impression that some natural increase in temperature of the planet is underway and any anthropogenic (caused by humans) changes are minimal in the face of such global changes. We are in an interglacial or postglacial meltdown, right? No; actually natural forces would be placing us in mild global cooling presently, based on astronomical, planetary factors. Because atmospheric changes are critical to ocean chemistry and health, they are addressed in greater detail in the section on marine life. But initially it is important to bring the reader on board. Humans are creating a greenhouse effect that outweighs natural planetary forces, as will be demonstrated, below; this is more than a “natural cycle”.
Earth always has had a natural greenhouse effect because gases naturally occurring (kinds and percents) in our planet’s atmosphere trap some solar heat while allowing the rest to escape. Without it we would have a global temperature average of ‐18 degrees C (= 0.4 degrees F)—this is around freezing. So greenhouse effects provide for life as we know it. But in the past century the greenhouse effect has escalated because of human production of certain gases, changing the percentage of these, most notably, carbon dioxide (CO2) and methane (CH4). The first is naturally produced by animal exhalation and volcanic eruptions. CO2 is a byproduct of combustion of fossil fuel (human activity). Methane is found with coal and petroleum deposits—this is natural gas—and is released when they are produced, a human activity. It also emits from wetlands, digestion by livestock, and decay (plants and animals). Livestock can be a significant source.
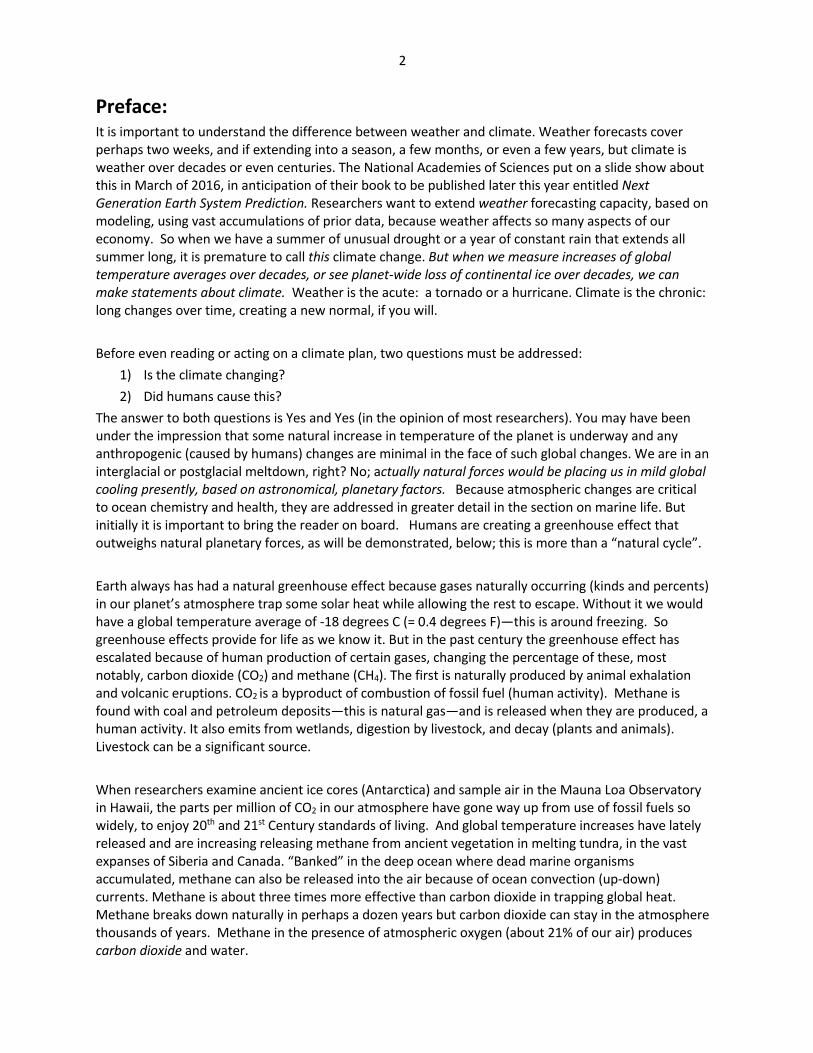
When researchers examine ancient ice cores (Antarctica) and sample air in the Mauna Loa Observatory in Hawaii, the parts per million of CO2 in our atmosphere have gone way up from use of fossil fuels so widely, to enjoy 20th and 21st Century standards of living. And global temperature increases have lately released and are increasing releasing methane from ancient vegetation in melting tundra, in the vast expanses of Siberia and Canada. “Banked” in the deep ocean where dead marine organisms accumulated, methane can also be released into the air because of ocean convection (up‐down) currents. Methane is about three times more effective than carbon dioxide in trapping global heat. Methane breaks down naturally in perhaps a dozen years but carbon dioxide can stay in the atmosphere thousands of years. Methane in the presence of atmospheric oxygen (about 21% of our air) produces carbon dioxide and water.
3
The slide that follows is from NOAA research at the Mauna Loa observatory in Hawaii. http://www.esrl.noaa.gov/gmd/ccgg/trends/weekly.html is a sobering website. See also http://nas‐sites.org/americasclimatechoices/sample‐page/panel‐reports/87‐2/, National Academy of Sciences.
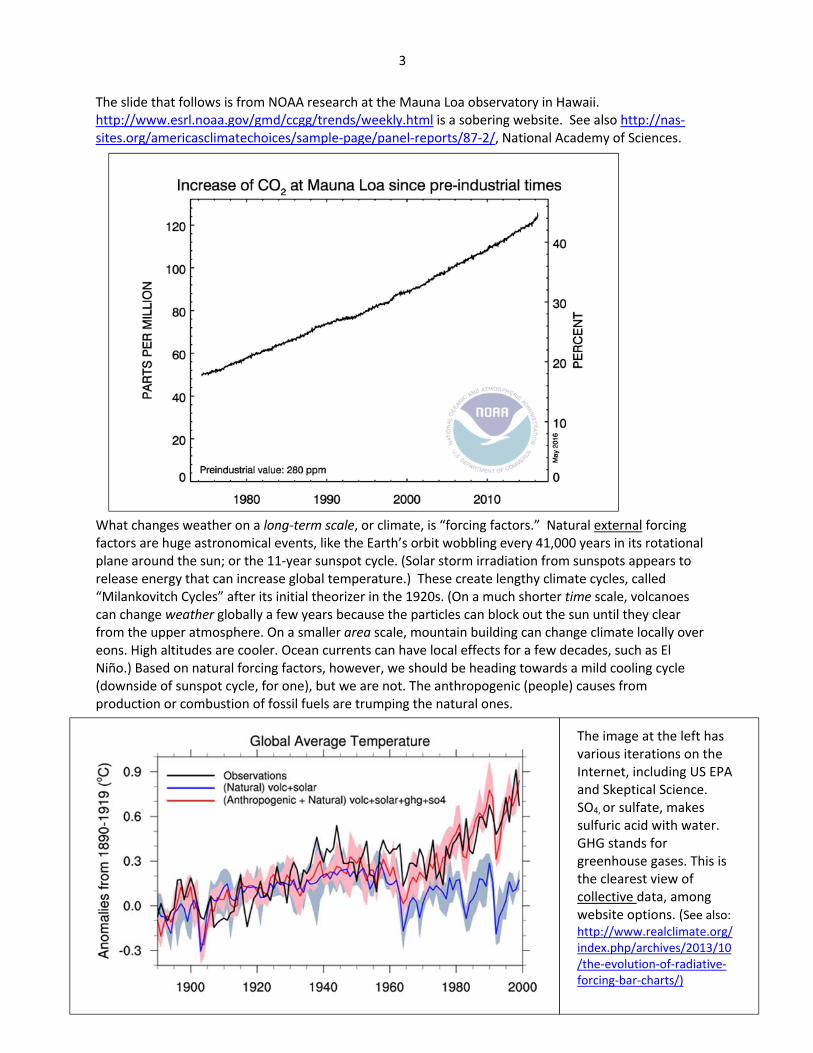
What changes weather on a long‐term scale, or climate, is “forcing factors.” Natural external forcing factors are huge astronomical events, like the Earth’s orbit wobbling every 41,000 years in its rotational plane around the sun; or the 11‐year sunspot cycle. (Solar storm irradiation from sunspots appears to release energy that can increase global temperature.) These create lengthy climate cycles, called “Milankovitch Cycles” after its initial theorizer in the 1920s. (On a much shorter time scale, volcanoes can change weather globally a few years because the particles can block out the sun until they clear from the upper atmosphere. On a smaller area scale, mountain building can change climate locally over eons. High altitudes are cooler. Ocean currents can have local effects for a few decades, such as El Niño.) Based on natural forcing factors, however, we should be heading towards a mild cooling cycle (downside of sunspot cycle, for one), but we are not. The anthropogenic (people) causes from production or combustion of fossil fuels are trumping the natural ones.
The image at the left has various iterations on the Internet, including US EPA and Skeptical Science. SO4, or sulfate, makes sulfuric acid with water. GHG stands for greenhouse gases. This is the clearest view of collective data, among website options. (See also: http://www.realclimate.org/index.php/archives/2013/10/the‐evolution‐of‐radiative‐forcing‐bar‐charts/)
4
Executive Summary
This Climate Plan is prepared pursuant to a grant from the U.S. Environmental Protection Agency, from
October 1, 2014 through September 30, 2016, with an update from the same fund planned for 2017.
While the focus is on treaty natural resources, both because of the funding agency and this writer’s being housed
in Quileute Natural Resources (hereinafter, sometimes, “QNR”), some sections will address the reservation needs
as a whole, including infrastructure and ideas to sustain power, food, and water. Of necessity this Plan is
limited by the information available up to the closing date. It will need to be updated to be of optimum
use.1 A number of entities have already prepared climate vulnerability assessments and the Quileute
Tribe has partnered with the Quinault Indian Nation and the Hoh Tribe through Bureau of Indian Affairs
funding to have a similar study for its affected natural resources under the Treaty of Olympia.2 This is
being followed up by the same contractors for all three treaty tribes, regarding infrastructure, to be
completed by 2017. However, funding differences create disparity in the level of detail and data analysis
used for such studies.3 A large number of analyses by federal agencies and research institutions have
also been made available to the public, and these will be addressed within the document. Some agencies,
notably EPA, have made climate projection computer tools, which will also be discussed.
There are several kinds of climate plans: vulnerability assessment, adaptation plan, implementation
plan, and down the pike, even an effectiveness study. Some of these can overlap. This plan will focus on
the first two kinds, with some suggestions towards implementation. Implementation ideas will be two‐
fold: the next 30 years, and 7 generations forward. This is because our remote area appears to have a
grace period of some 30 years, before major changes to our local ecosystem and resource habitats
occur.
The following limitations to making predictions for the Quileute Tribe have been observed:
1) Studies in other areas are not always helpful for Quileute because its location is geographically
and ecologically different from those studies. But our remote location and low population lead
to research initially being focused on areas of greater population and greater access.
2) The time period for which humans have had the technology to keep records and make
projections is historic, not geological. Computer analysis of this data is even more recent. And as
OCCRI concluded in its 2016 report (fn. 2), the scale and manifestations of climate change we
are seeing now have no historic correlative or example.
3) Factors beyond human control, such as sunspot activity, melting of tundra (with vast amounts of
banked methane), and methyl hydrate banks stored in the ocean, have enormous potential effect
on climate. 4
1 Subsequent EPA General Assistance Program capacity funding can be used to update this plan. This plan will be uploaded to http://www.quileutenation.org under Natural Resources. 2 Oregon Climate Change Research Institute, or OCCRI, “Climate Change Vulnerability Assessment for the Treaty of
Olympia Tribes. February 2016. This will be uploaded to http://www.quileutenation.org/natural‐resources. 3 Our study had $100,000 available. Others we have reviewed used well over $400,000 and had a wider number of
partners (Puget Sound, Strait of Juan de Fuca). 4 Circa 75 years of no sunspots created “the Little Ice Age” in the 1700s (usual sunspot cycle is 11 years). Methane
gas is considered 20‐30 times more powerful greenhouse gas than carbon dioxide.
5
4) Our own vulnerability assessment, being of limited funds, is of necessity generalized and based
on existing data; it did not involve any new studies, with the exception of projections of coastal
storm damage (contractor’s area of expertise).
The following impacts may occur to affect Quileute lives:
1) Changes in sea level or storm action may threaten coastal structures, such as our marina and
resort. By the next century we can expect about one meter (39 inches,) of sea level rise but this
is subject to change, based on the pace at which ice melts from glaciers and Antarctica. This
should impact all low‐lying coastal facilities and may cause salt‐water intrusion into Smith
Creek and Lonesome Creek, which our hatchery uses. It will also erode the dunes in front of
our resort.
2) Changes in precipitation patterns may adversely impact communities through flooding and
salmon fisheries through stream levels or water quality that don’t support certain parts of their
life cycle.
3) Flooding streams carry chemical loads to the ocean; e.g. nutrients that lead to more harmful
algal blooms, and chemical discharge that can add to ocean acidification.
4) Food supplies—target fisheries‐‐in the ocean may change as the habitat or ocean chemistry for
prey changes.
5) Food supplies on land‐‐ game, plants‐‐may be impacted by invasive species or altered climate.
6) Access to community services (hospitals, schools) may be altered by storm damage.
The following have been evaluated in making recommendations in this Plan, for future action:
1) Risk Assessment (methods);
2) Traditional Ecological Knowledge (“TEK”), often referred to as native resiliency;
3) Tools made available by federal agencies (both climate projections and risk assessment);
4) Predictions and Recommendations made by other vulnerability assessments and
implementation plans (again, limited by our unique geography and ecology); and
5) This writer’s own assessments based on research of the literature and practices reviewed to date (referenced).
While politics and governance of necessity play an integral role in approach and what can be achieved,
this document will put considerable emphasis on the natural sciences.
The climate will change in ways for the Quileute that may require new choices and changes from some
cherished traditions, especially certain presently available foods. There will be some loss of coastal
lowland, although not immediately. There may be increased violent weather. Protective infrastructure
may need to be developed. Some independence from neighboring services may be advisable.
However, in light of so many uncertainties regarding the timing and degree of change, it is important to
develop a process for addressing the changes. Therefore, a risk assessment process is a critical part of
this plan. If one has the tools for prioritizing action, one has a leg up in response to the challenges that
will be coming. Above all, acting sooner rather than later to develop alternative recourses will be
provident, because no solution will come cheap. Funding is almost always premised on having a plan
and it is the goal of this document to provide the kind of structure that granting agencies require.
Throughout the document, a recommendation may be made, and will be italicized. At the end, these will
be collected and presented in a final section. Recommendations are the seeds for future grants.
6
Introduction to Geography and Governance
The Quileute Tribe of the Quileute Reservation (hereinafter, “Quileute Tribe”) is a federally recognized
Indian tribe5 and a signatory to the Treaty of Quinault River of July, 1955, reauthorized just six months
later to include omitted parties, as the Treaty of Olympia in January, 1856.6 The Quinault Indian Nation
and Hoh Tribe are treaty partners.7 This is one of the “Stevens Treaties” negotiated by Isaac Stevens on
behalf of the United States and all such treaties notably have the right to fish in Usual and Accustomed
Grounds and Stations (“U&A”) and to hunt and gather in Open and Unclaimed Lands well beyond the
boundaries the their reservations. This includes oceans, fresh water, and terrestrial habitat. A map of
the treaty boundary and discussion of the Quileute U&A are in the appendix. It is understood that EPA
funding is limited to addressing waters that flow into the reservation (or clean air and solid waste);
however, this plan is designed to enable funding from other sources as well, so will be more inclusive
from a geographic standpoint.
Originally the Quileute people were included in the Quinault’s reservation. When the federal agencies
realized that these were different people, exclusive reservation land in the 1880s was set aside for Hoh
(then a band of Quileute) and the Quileute at the Hoh and Quillayute Rivers, respectively. These were
extremely small parcels, although certain reserved off‐reservation reserved treaty rights to natural
resources continues throughout the full treaty area and Hoh and Quileute family members even retained
property rights within the Quinault reservation (“allotments”). It will explain why a climate vulnerability
assessment referred to in this document covers all three tribes.
The Quileute Tribe’s government is in La Push, at the mouth of the Quillayute River, on the shores of the
Pacific Ocean (maps in Appendix). La Push is in Clallam County, Washington, and the Quillayute’s 5.5‐
river‐mile mainstem is part of an enormous drainage system fed by four rivers (clockwise): the Dickey,
the Sol Duc, the Calawah, and the Bogachiel. This drainage basin includes some 800 square miles and the
headwaters and stream channels of these four rivers are quite different— the Dickey originates in
relative lowlands, while the other three originate high in the Olympic Mountains. In historic time, no
glacier is known to have been at the headwaters, but snowpack has played an important role in
providing regular sources of water, to date.
The Quileute have had their U&A adjudicated in federal court under the case known as United States v.
Washington.8 This case included some 20 other Stevens Treaty Tribes of Western Washington, as well as
the Yakama Nation at one point. It is an injunction against the State of Washington for having limited
tribal access to the treaty fishery and in order for the tribes to constitutionally sue the state (a
sovereign), the federal government stepped in and took the lead as the trustee. In the seminal decision
by Judge Boldt, upheld in appeals, the court found that tribes had a right to 50% of the harvestable fish
5 81 Fed. Reg. No. 19, pp. 5019‐5025; Jan. 29, 2016 6 See, e.g., http://www.fws.gov/pacific/ea/tribal/treaties/documents/1856TreatyofOlympia.pdf 7 While Hoh and Quileute were one tribe until administratively separated in 1972, their language is
Chimakuan, while Quinault’s is Salish. The federal treaty negotiators in 1855 did not realize these important differences when unifying these three tribes under one treaty. 8 United States v. Washington, 384 F. Supp. 312, (W.D. Wash. 1974); aff’d. in Washington v. Washington State Commercial Passenger Fishing Vessel Ass’n, 443 U.S. 658 (1979); subproceedings continue into the present day, notably subproceeding 2009‐1 regarding Quileute and Quinault’s ocean boundaries.
7
passing through their treaty respective treaty area, that they co‐managed these resources with the
state, and that the parties had a duty to manage the fishery and share the management data
cooperatively. This case uniquely set up a paragraph at the end to continuously address the complex
area of treaty rights. Initially it only covered wild salmon and steelhead, but later in the 1980s evolved to
include hatchery fish, to acknowledge that tribes were not limited to 1800s fishing methods, and in the
1990s, that all aquatic animals the tribes might have been able to harvest in the 1850s were included in
present treaty rights; e.g., marine mammals, other fish than salmonids, and shellfish or other
invertebrates. In 2013 the court affirmed a habitat management role, for which the tribes had longed
argued (without which, the assurance of fish is hollow).9 That is a critical decision for climate planning.
On land, there has been no definitive federal case regarding tribal hunting and gathering. Case law has
been limited to state decisions (and the state was not a treaty partner) or to individuals, and such
decisions do not bind tribes (as sovereign governments and not party to the suit).10 Some federal and
state agencies have developed regulations or policies that seek to limit hunting or gathering.11 Since
these are not founded in federal court decisions and the treaties are the highest law of the land,12 tribes
contend their management and harvest rights extend at least as far as their respective treaty boundaries
(peer‐reviewed quality anthropology must be used to determine whether rights extend beyond.)
Within the Quileute Tribe, climate issues are largely addressed by two departments: the Planning
Department, which addresses infrastructure planning, roads, and hazard mitigation with emphasis on
floods and tsunamis13, and the Natural Resources Department, which addresses management of treaty
resources: fish, game, plants, and their habitat. This department also has a regulatory role, and staff are
advised by an elected committee of 7 tribal members: Quileute Natural Resources Committee. The
Quileute Tribal Council oversees both departments and has the voting power regarding adoption of
ordinances, regulations, resolutions, and approval of contracts and policies.14 This plan is being prepared
by Natural Resources through EPA funding, as noted above.
Although a sovereign government, the tribe recognizes the importance of cooperative management
with neighboring governments and in addition to co‐management with the state of Washington in a
number of forums, also participates in federal, interstate and intertribal processes.15 Climate change
will not stop at our reservation or treaty boundary lines. What happens anywhere in the California
Current affects our ocean fishery. However, as noted in the Executive Summary, geographic or geologic
features will create some unique impacts. What happens even as close as Puget Sound may not be
applicable in La Push, and vice versa.
9 Citation for culvert case, which required state to maintain fish passages’ functionality 10 Hicks, Buchanan citations 11 Draft ONP gathering regulations, USFS policies (may not leave this in the document…) 12 U.S. Constitution, Article VI Section 2 13 The Quileute Tribe Hazard Mitigation Plan of 2015 prepared by Northwest Tribal Communications; its design has been responsive to FEMA requirements for post‐disaster damage funding; e.g., floods, and climate change is not discussed, although a student paper for the MS degree from Evergreen University is in the references. 14 Quileute Tribe of the Quileute Reservation Constitution, approved 11/11/1936 per 1934 Act of Congress 15 Including but not limited to: Pacific Fisheries Management Council, Pacific Salmon Treaty, International Pacific
Halibut Commission, West Coast Regional Planning Body (National Ocean Policy), West Coast Ocean Partnership,
Intergovernmental Policy Council, Northwest Indian Fisheries Commission, or Affiliated Tribes of Northwest Indians.
8
Risk Assessment
Risk assessment may be summarized as frequency of an event multiplied by impact or magnitude (size).
Example: how often does the Quillayute River flood the reservation lands, and to what extent? There
are two aspects to risk assessment: the staff structure and process for making decisions, and the plug
and play software by which one inserts data sets to see what results ensue (either known or
hypotheticals). We will address the first, and provide options for the second.
The process: The U.S. Forest Service in 2015 invited the local tribes, local government (Clallam County
and City of Forks) and the state (WA Dept. of Natural Resources) to attend a training for its own staff on
risk assessment in the event of forest fires. What was instructive from Quileute’s standpoint is the
importance of having training in protocol and a line of command, to deal with the emergency. The
Quileute Tribe already has this for tsunamis (the acute). It is suggested herein to have this for climate
change (the chronic), as well. This may include but not be limited to newly seasonal increases in flooding,
windstorms, or loss of connective infrastructure to communities with essential services. It may have to
do with loss of access to food or water supplies, or access to medical services. It may involve loss of
telephone services (if solar flares increase). Bonneville Dam is our source of power, seemingly infinite.
But if snowpack throughout the Columbia Basin declines, we may have brownouts from episodic low
water. Quileute may become isolated from sufficient power, for brief periods.
For each eventuality, a protocol is recommended. The staffing flow chart may differ or may not, for these
eventualities. But it should be developed. One simply does not know in 2016 what will be included in
this parade of potential events in 2061. But one can plan for how to address it all.
This writer’s recommendation is to build a team that addresses climate change and how to prepare for it,
as an interdepartmental and active committee. Are there too many committees? Yes. Is this one vital to
the future? Probably.
What is risk assessment?
In searching for a well‐designed short course for the non‐professional eye, this writer discovered the
website http://mitigationguide.org/ , which combines the efforts of the Department of Homeland
Security, the Coastal Resilience Center, the Center for Sustainable Community Design, and the Institute
for Sustainable Communities. These are east coast and Gulf Coast entities, where sea level change and
stronger hurricanes are more immediate threats. So they’ve done our homework for us. From their
homepage: “The website is based on the FEMA Handbook “Local Mitigation Planning Handbook”. Like
the FEMA Handbook, the website is intended to be used by emergency managers, planners, consultants
and others who are updating an existing hazard mitigation plan or preparing a new one.” We know
climate change is slow and disasters are fast, but there IS a relationship, because climate change is likely
to lead to more extreme weather. The way to plan for it is not dissimilar to planning for a crisis, and the
web developers agree.
The website is based on the FEMA Handbook “Local Mitigation Planning Handbook”. Like the FEMA
Handbook, the website is intended to be used by emergency managers, planners, consultants and
others who are updating an existing hazard mitigation plan or preparing a new one. You could not find
a more useful tool for non‐professionals, and there is a page designed expressly for climate change
in general and one for social vulnerability. Go to mitigationguide.org/climate‐change or
mitigation.org/social‐vulnerability to get specific worksheets, but here are, broadly, ten tasks:
9
1) Determine the Planning Area and Resources
2) Build the Planning Team
3) Create an Outreach Strategy
4) Review Community Capabilities
5) Conduct a Risk Assessment16
6) Develop a Mitigation Strategy (steps built into that, and Quileute has done this for storm
hazards)
7) Keep the Plan Current
8) Review and Adopt the Plan
9) Create a Safe and Resilient Community
The page cited above include not just links to worksheets, but also example plans, research, and
resources. If one links into the Worksheet for Risk Assessment (fn. 16), a laundry list of every type of
risk one could imagine is provided as an example. There are 21. Quileute can probably remove dam
failure. Additional Rows might be Invasive Weeds, or Disease. It might be instructive to add a fifth
column, describing potential impacts, such as loss of phone communication, or loss of road access to
hospitals. These will help in planning for the worst case scenario.
The USFS really emphasizes the planning team and training of staff. A great deal of its course was given
over to failure and analysis of why people and property were lost in forest fires, and how these losses
might be reduced or avoided entirely by appropriate response in accordance with training.
Overconfidence on the part of one individual was often the weak link (thinking everything was ok
without going through the mandatory checks). Demeanor of the supervisor to his/her team was another
potential weakness. The supporting players need to have full confidence in the leader(s) and to expect
respectful treatment, so there is no hesitancy in asking questions when something appears unusual.
What software is out there for the ordinary person (not academia) to use? EPA has made one available
to tribes for some time now, called CREAT. 17 Other agencies have as well. 18 In fact, the most difficult
task is to be on top of all the documents that have emerged in the past several years at every level of
government and to find what works for us, in our unique location.
16 http://mitigationguide.org/wp‐content/uploads/2013/05/Worksheet‐5.1.pdf for risk assessment 17 https://www.epa.gov/crwu/assess‐water‐utility‐climate‐risks‐climate‐resilience‐evaluation‐and‐awareness‐tool 18 http://www.globalchange.gov/what‐we‐do/assessment; US Forest Service: http://www.fs.usda.gov/ccrc/; http://www.fema.gov/government/tribal/training.shtm; King County Guidebook for local, regional and state governments: http://cses.washington.edu/db/pdf/snoveretalgb574.pdf; USFWS Guide to federal adaptation programs for state F&W: http://www.fishwildlife.org/index.php?section=climate_change&activator=50
10
Scope of this Plan
While most of the federal strategies or toolkits19 for climate assessment have been reviewed, our
primary reference is from a very recently completed study on vulnerability of our treaty natural
resources and to some extent, physical threats such as flooding and wave/storm damage on the coast.
The Oregon Climate Change Research Institute (OCCRI), based in Corvallis at Oregon State University,
prepared an assessment of vulnerability for the treaty natural resources of the Quileute and Hoh Tribes,
and Quinault Indian Nation, completed February 2016 (http://www.quileutenation.org/natural‐
resources). They were selected by personnel from all three tribes, after interviewing 14 candidates
responding to a Request for Proposals. A modest grant from BIA funded the work. (We found no one
contractor that provided all the skills in depth, and partitioning the grant would have reduced the
chances for a cohesive report.) Like most of the applicants, OCCRI built its team using scientists not just
across fields of study, but also across universities and agencies, to get a broad picture and use the best
possible participants. University of Washington climate scientists are a part of their program, as well as
federal agencies like the US Forest Service. OCCRI did not work in isolation and consulted with natural
resources staff from Quinault, Hoh and Quileute to prepare the chapters.
Focusing on climate, which combines many physical sciences (e.g., weather, ocean currents, rain or
snow, temperature, or chemistry) and biological ones (e.g., plants, animals, habitat, food supply,
predators, or disease) is relatively new—maybe the past fifteen years or so. Grant money for planners
(as opposed to researchers) has surfaced only in the past few years. To estimate climate change, single‐
study data assemblages from other specific disciplines of science need to be viewed collectively to draw
conclusions, and not over just a few years, but over as many as possible. It is a massive task and still
ongoing by major research institutions operated by academia and government across the world.
The OCCRI study was limited by the level of funding, lack of research on many of our species of concern
(most work has been done where there are larger human populations at risk), and lack of research on
how weather impacts the Pacific Coast of Washington in particular (initial research has focused on
higher population areas). This is changing, but not in time for this Plan. The final OCCRI report covers the
following habitats and the animals and plants that use them: terrestrial, freshwater (streams, bogs,
wetlands and lakes), and marine. It also covered regional climate change and coastal hazards. Whenever
species data was available, a vulnerability assessment was made, using the Climate Change Sensitivity
Database20 and Species Range Projections21. These are regional but can be applied to smaller areas. The
first is publically available (online database); the second has more information categories and relates
largely to land‐ based ecosystems and is a combined effort of the University of Washington, USFWS,
Florida International University, and The Nature Conservancy (assuredly with input from colleagues). For
species on land (deer, elk, bear, various birds), a formula was used to assess Vulnerability (degree a
species succumbs to a climate threat), by calculating Sensitivity (how resilient the species is at various
19 https://toolkit.climate.gov/ (largely NOAA); http://www.fws.gov/home/climatechange/strategy.html;
https://nccwsc.usgs.gov/sites/default/files/files/NW%20CSC%20Tribal%20Engagement%20Strategy%20ADOPTED
%2029AUG13.pdf; https://www.epa.gov/crwu/climate‐resilience‐evaluation‐and‐awareness‐tool‐fact‐sheet‐water‐ utilities
The above are only selections. See References, at end. 20 http://climatechangesensitivity.org/ 21 http://www.climatevulnerability.org/
11
stages of its life cycle), Exposure (degree to which a species is facing climate changes), and Adaptive
Capacity (can it move, can it disperse its seeds or offspring).
Vulnerability = Sensitivity + Exposure - Adaptive Capacity22
Unfortunately, each chapter was prepared by different experts so the way vulnerability was assessed for
land animals and plants was not identical to the way it was evaluated for, say, salmonid or camas (in the
freshwater ecosystem), elk (in the terrestrial section) or clams (in the marine system). But general threats
to these species and their respective resilience were discussed in their chapters.
Thanks must be offered to the Swinomish, Jamestown S’Klallam, and Nooksack Tribes, for making their
completed climate plans publicly available. While the natural resources applications and the
recommendations for them are not always transferable to us on the Pacific Coast, their approach to
working through these complex problems of long‐term prediction and community response are
nevertheless most helpful. And some commonalities do exist, simply to different degrees and faced
possibly in different decades of the 21st Century.
Specific to Quileute: This document will be evaluating the important species from a number of
perspectives, which overlap in our discussion: 1) what have Quileute traditionally used; 2) what are the
Quileute still using today; 3) what role is climate likely to play in their availability, and 4) what role does
Tribal Ecologic Knowledge play in this plan? Finally: 5) recommendations will be made in italics.
Important Food Species: 23
Berries (salmonberry, blackberries in particular), Labrador tea
Deer and elk game animals
10 runs of salmonids in our rivers (chinook, coho, steelhead, sockeye)
Smelt (river ones now scarce; surf smelt still present)
Dungeness crab, black cod (sablefish), and halibut (most important commercial catches)
Culturally important species: (all of the above, but in addition)
Eagles and ravens
Whales, seals and sea lions (used in past for food, fur, and tools, but not presently)
A broad spectrum of medicinal plants (less so presently)
Cedar (canoes when large trees are available, otherwise bark for weaving)
All conifers (spruce, hemlock, fir, cedar) when downed, for firewood
Alder (smoking fish)
22 From page 44 of the OCCRI Vulnerability Assessment of Feb. 2016. 23 This writer has based the short list on what our tribal regulations mention (hunting, gathering, and fishing) as
well as a host of cultural documents developed in defense of our treaty rights in federal and state court. There are too many to put in a footnote. An entire section of References will be described by the category called “Quileute cultural and biological references” specific to just this tribe, as opposed to more regional or generic references on climate prediction.
12
Traditional Ecological Knowledge (hereafter, “TEK”). TEK is being evaluated in a separate document from political, biological, and cultural standpoints as part
of our contract with EPA; an outside contractor has prepared it with oversight by QNR, both legal and
technical (http://www.quileutenation.org/natural‐resources). Politically, tribes are justifiably concerned
that major decisions regarding planning for climate change, and how to protect their communities from it
as much as possible, are being made in state and federal legislatures without their input, despite
centuries of tribes’ having lived off the land (and waters) and having a strong familiarity with species
behavior and habitat. They learned how to harvest wisely and by what means they can best perpetuate
the species (e.g., only strip one third of cedar bark from trunk circumference, so as to not kill the tree).
So a concept has emerged known as Tribal Knowledge, or sometimes, Traditional Ecological Knowledge,
and federal agencies have been willing to fund the development and recordation of this information
insofar as it may relate to climate change. Often what tribes can bring to the table is a special knowledge
of plants or animals, or weather, that may inform resiliency to long‐term weather phenomena, or what
food sources are available despite such long‐term changes, or where do these species prefer to grow,
range, or swim. Some of the documents that have emerged have dealt with the political need to be
involved in decisions, while others have dealt with how to plan food for the future, based on past
knowledge.
With respect to the political need to be involved, this is critical and many tribes in the U.S. don’t have
the advantage of treaties like those of the Stevens Treaty Tribes, which create co‐management with
the state or off‐reservation access to fish, game, and plants. The Quileute Tribe is often shut out of
discourse because of its remote location and smaller economy, which can foreclose interaction,
although webinars, Internet meetings, and improved transportation improve our lot. Even so, we go to
Olympia or Washington DC less than some bigger tribes. But the fact remains that we have that
“treaty co‐manager” legal entrée and can exercise it when needed. There are quite a number of
committees at which the tribe is present and in which it participates.
So the recommendation for the future is to keep our toe in the political water as much as time and
funds permit, to be sure our needs are politically addressed. We do have the access, on paper, already,
because of our treaty.
From a biological standpoint (how to manage our species at risk), however, this writer finds less TEK
application. This is because the recordation of what Quileute did to harvest natural resources only goes
back to mid‐19th century times. In fact, when Isaac Stevens was negotiating the Treaty of Quinault River,
he did not realize all the parties that should be present (leading to a subsequent Treaty of Olympia). Our
area was largely unexplored. There were mapping errors such as omission of Lake Ozette.
Contemporaries had different accounts of what Quileute did and where they went. In the 19th Century,
the climate was not so different that we can be instructed by cultural references, how to respond to
change. This is less so for some southwestern tribes, or tribes on the East Coast or Great Plains. But for
Quileute, there is nothing instructive towards the changes in precipitation, sea level, or migration of fish
to new latitudes (“phenology”), in our cultural literature. (Ancestors did know to follow the fish or
marine mammals or elk to where they lived, and this could change to some degree; but if major latitude
ranges or lack of food supply locally take them out of our treaty area today, what are we to do?) The
best we can say is what species were prevalent in the past that still are around today to use. Their
13
numerical decline in the past several decades is not due to climate change but rather to industrial or real
estate development on land, or overfishing in the ocean. Only in the past several years have fisheries
managers recognized that the species such as coho are now crashing from ocean conditions (loss of
forage for juveniles), rather than from fisheries management, or destruction of river basin habitat. So
for us, Quileute TEK is a minimal part of this climate plan; it offers little guidance as to how to prepare
for future climate change.
Culturally, it is important to note what species important to Quileute may be at risk and what if anything can be done about it. We have less control over the ocean fishery, which is essentially wild, than over the rivers and land, so recommendations will be made as to ideas to continue access to culturally important foods. To the extent that we can work to extend the life of wild ocean fisheries, we have done so vigorously in meetings such as Pacific Fisheries Management Council, North of Falcon, and Pacific Salmon Commission and will certainly continue to do so.
Recommendation: in the new village built to Move to Higher Ground, public gardens or greenhouses can
be established to maintain native plants important for food or medicinal purposes, and people can be
encouraged to have such plants in their own yards, as well. Tulalip Tribes do this at their Hibulb cultural
center. Northwest Indian College in Bellingham, Washington, is also engaged in tribal gardening for
cultural, medicinal and subsistence purposes.
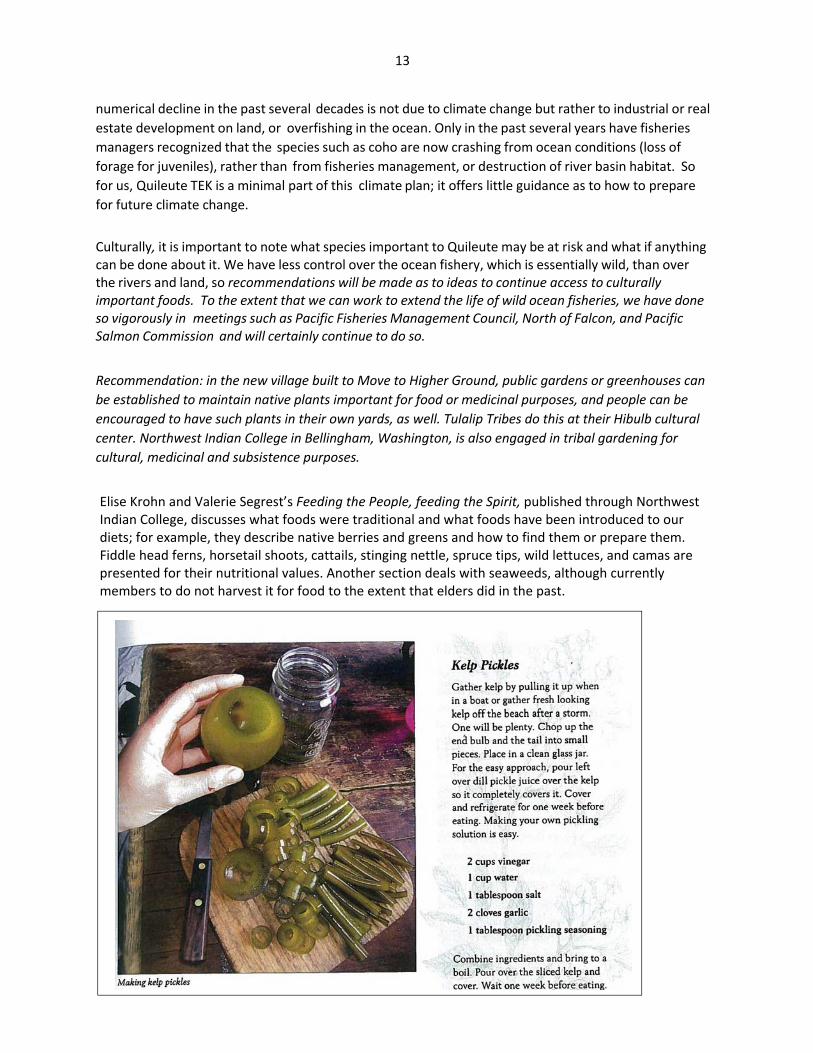
Elise Krohn and Valerie Segrest’s Feeding the People, feeding the Spirit, published through Northwest Indian College, discusses what foods were traditional and what foods have been introduced to our diets; for example, they describe native berries and greens and how to find them or prepare them. Fiddle head ferns, horsetail shoots, cattails, stinging nettle, spruce tips, wild lettuces, and camas are presented for their nutritional values. Another section deals with seaweeds, although currently members to do not harvest it for food to the extent that elders did in the past.
14
See also Elise Krohn’s Wild Rose and Western Red Cedar, the Gifts of the Northwest Plants, which describes a wide variety of edible native plants, and recipes (pictured above), as well as medicinal plants and how to prepare balms or salves from them (with pictures). Instructions are also provided, with diagrams and photos, and how to establish gardens of these plants. The list of medicinal uses for native and non‐native plants (e.g., plantain) is astonishing: cauterize wounds, chew for toothache, cleans and disinfect mucus membranes/use for coughs, or washing wounds (alleged antibiotic activities). Boiled and steeped leaves make a tea or eat them fresh, like chard. Skunk cabbage leaves can wrap food for steaming, or use the large leaves for trays. The root can be a tea used for coughs.
Assessment of Resources and Threats, with Recommendations
Metadata and Tools
An enormous amount of assessment and planning tools can be found on the Internet, because both
before and after the Executive Order 1365324 requiring federal agencies to plan for climate change, some
had begun. Smaller tasks specific to very local situations or to very short time periods are not always on
line. Some material is in the form of webinars. In some cases, the Power Points or instructive manuals
are made public, but not always.
It is said so well in the Swinomish Assessment report; this writer could not do better. From page 14 of
that document25: “There is an escalating volume of scientific data, reports, and models to survey when
reviewing climate change data. For this assessment, the Tribe elected to rely upon a combination of
peer‐reviewed reports of global climate change and those reports that focused specifically on impacts to
the Pacific North west. The climate change reports, sources, and associated models/scenarios evaluated
for this project, including this impact assessment, are cited in the References.” Quileute is also relying on
the OCCRI assessment cited above. This Plan can be amended to include Infrastructure when OCCRI
prepares that report, presuming it is available at least in draft in the first half of FY 2017.
OCCRI used the mathematical models referenced by Swinomish as well as others, such as the Climate
Impact Group out of University of Washington. In addition, this writer has looked at state (largely
Washington’s Department of Fish and Wildlife and Department of Ecology; WDFW and WDOE,
respectively) and federal reports on ocean acidification and expected impact on marine resources, beach
subsidence and how that plays into sea level rise, and studies we have been involved with regarding
noxious weeds, which adversely impact salmon habitat along rivers and wetlands, and forage for elk and
deer. Quileute staff is also involved in fisheries planning with the state co‐manager, including how
harvest may be curtailed to provide optimal success for future generations in the face of changing ocean
conditions. Most of the salmon strategies prepared locally and regionally have paragraphs dedicated to
climate change, but the topic is still new. The strategies focus largely on freshwater habitat.
The projections of climate‐driven events to come may be off by one or two decades but the events are absolutely coming and some faster than we might expect, such as the crash of salmon fisheries this past year and the failure of fish to return from the ocean at harvestable levels, leading to closures of fisheries we have harvested since time immemorial. In the spring of 2016, the Quileute Tribe and
24 EO 13653 of 11/1/2013, in Federal Register, v. 78, No. 215, pp. 66819; also https://www.whitehouse.gov/the‐
press‐office/2013/11/01/executive‐order‐preparing‐united‐states‐impacts‐climate‐change 25 Swinomish Climate Change Initiative Impact Assessment Technical Report, October 2009;
http://www.swinomish.org/climate_change/project/reports.html
15
WDFW signed an agreement to close peak return weeks of the fall coho fishery in the Quillayute River. That 2015 return was almost certainly due to poor ocean conditions during the 75% of the time that salmon live in the ocean, of their entire life cycle. See in particular the discussion on ocean acidification, below.
Sea Level Change
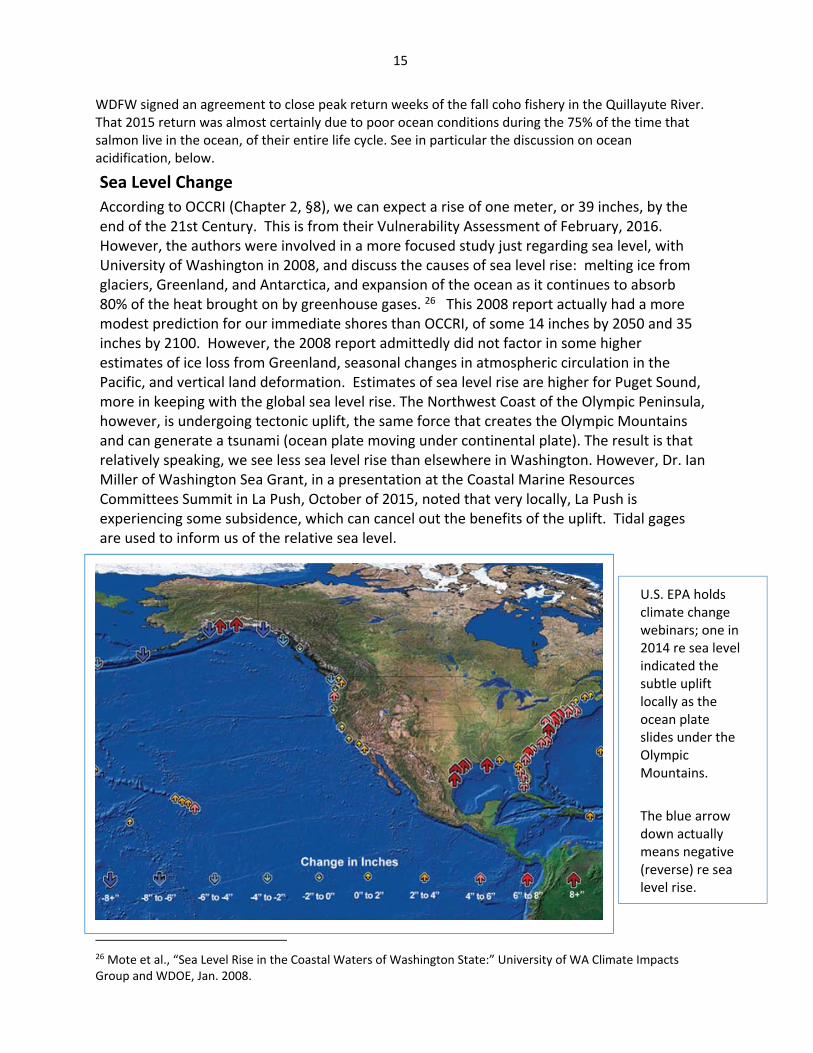
According to OCCRI (Chapter 2, §8), we can expect a rise of one meter, or 39 inches, by the end of the 21st Century. This is from their Vulnerability Assessment of February, 2016. However, the authors were involved in a more focused study just regarding sea level, with University of Washington in 2008, and discuss the causes of sea level rise: melting ice from glaciers, Greenland, and Antarctica, and expansion of the ocean as it continues to absorb 80% of the heat brought on by greenhouse gases. 26 This 2008 report actually had a more modest prediction for our immediate shores than OCCRI, of some 14 inches by 2050 and 35 inches by 2100. However, the 2008 report admittedly did not factor in some higher estimates of ice loss from Greenland, seasonal changes in atmospheric circulation in the Pacific, and vertical land deformation. Estimates of sea level rise are higher for Puget Sound, more in keeping with the global sea level rise. The Northwest Coast of the Olympic Peninsula, however, is undergoing tectonic uplift, the same force that creates the Olympic Mountains and can generate a tsunami (ocean plate moving under continental plate). The result is that relatively speaking, we see less sea level rise than elsewhere in Washington. However, Dr. Ian Miller of Washington Sea Grant, in a presentation at the Coastal Marine Resources Committees Summit in La Push, October of 2015, noted that very locally, La Push is experiencing some subsidence, which can cancel out the benefits of the uplift. Tidal gages are used to inform us of the relative sea level.
26 Mote et al., “Sea Level Rise in the Coastal Waters of Washington State:” University of WA Climate Impacts Group and WDOE, Jan. 2008.
U.S. EPA holds climate change webinars; one in 2014 re sea level indicated the subtle uplift locally as the ocean plate slides under the Olympic Mountains.
The blue arrow down actually means negative (reverse) re sea level rise.
16
The diagram above is corroborated by the University of Washington (UW) Climate Impacts Group: “Coastal areas in Washington will experience sea level rise, although some area may continue to experience decreases due to trends in vertical land movement… “because of local tectonic uplift. 27 However, this is a temporary respite for us, as the factors creating sea level rise are increasing.
What does this mean for all of us here? Long‐term structures and those immediately on the shoreline are at risk of greater storm damage and even potentially minor inundation. That will affect the marina and buildings that serve it, as well as the resort. They will be more subject to storms and wave damage, as well as flooding. The dunes that have protected our shoreline from wave damage will be more subject to erosion. An entire chapter of the Vulnerability Assessment, Chapter 5, Coastal Hazards, is dedicated to this risk and is the special area of expertise of OCCRI. This section is highly technical and gets into a great deal of physics and calculus. What we can take from it, however, is that our dunes are made of stacked up but unconsolidated (no chemical cement like lime) sedimentary materials that are subject to caving in, and landslides, and will be vulnerable to higher waves and more severe storms. The impact is lower at Cape Alava (one‐third of the year) than at Ozette to Rialto (impact some 60% of the year). At our reservation, less steep than Rialto, the impact is some 50% of the year, and at Second Beach this declines to 36% of the year. Third Beach is at a somewhat higher elevation despite being steeper and receives some 85 days a year of impact. (Chapter 5, pages 164‐165). Impact Days per Year and Overtopping Days per Year (over the dunes) are graphed at pages 166‐168. Our collecting areas (heading to Queets) experience impacts on 40‐50% of the year. The variability depends on the beach topography. Figures 5.29=5.29 graph the impact days per year and overtopping days per year for our relevant coastline (reservation and U&A). Most of these areas don’t have infrastructure.
Recommendation: Move structures upland or where not possible, protect with dikes or other structures (e.g., jetties). Make sure the dunes have sufficient logs to protect from wave action.
The impact (just regarding sea level change) on nearshore species such as forage fish and certain marine mollusks is expected to be low (per OCCRI); they will probably move habitat landward. Nearshore species such as mollusks and forage fish will find that the beach has moved upwards a few feet. This is a slow change. Insofar as habitat availability is concerned, species will probably adjust (but see marine section, below, re ocean chemistry). One aspect not discussed by OCCRI, but forwarded by this writer, is that coarser sands won’t have the time to be reworked by waves into less angular and smaller particles. This may interfere with spawning. Beaches can take centuries to develop well‐rounded particles from waves and interaction.
27 Climate change Impacts and Adaptation in Washington State: Technical Summaries for Decision Makers, Climate Impacts Group, college of the Environment, pages ES‐5 fn. F, 2‐2, 5‐3, and 9‐1 and Table 9‐1 of 12/2013 report.
17
Regarding salmon, the effective zone of salt and freshwater mixing will move upstream, potentially affecting outmigrating smolt, and use of the river mouth by other species such as birds and anchovies.
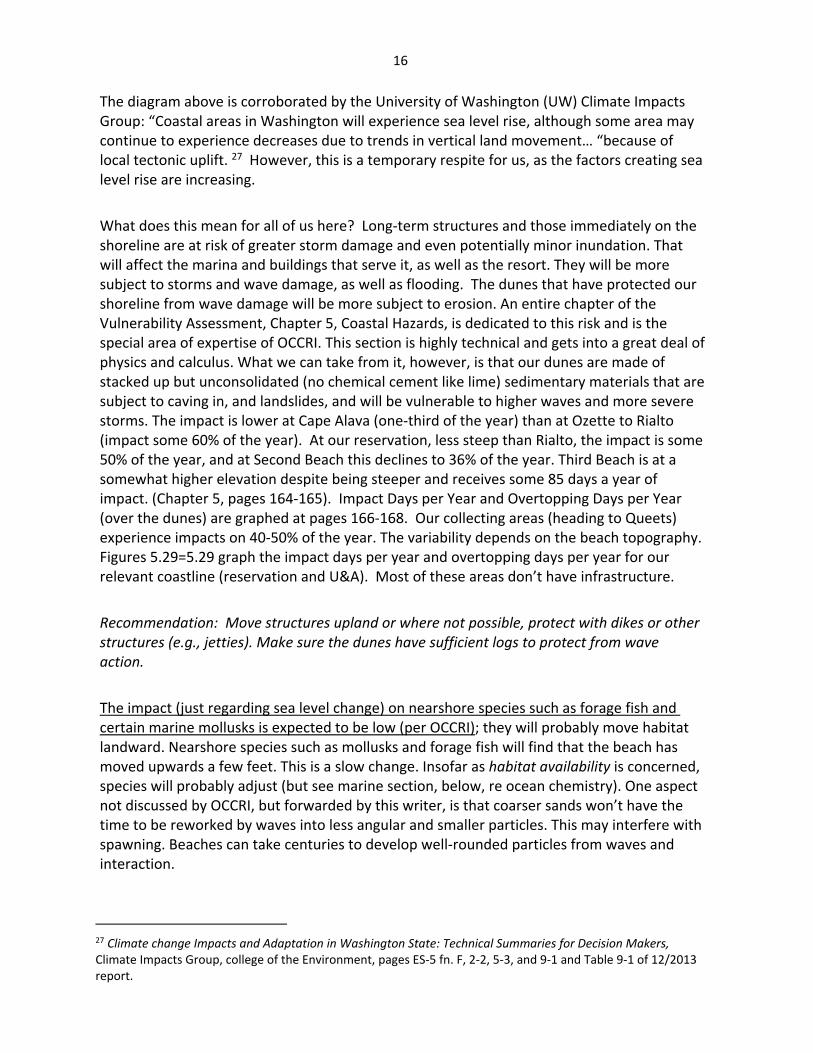
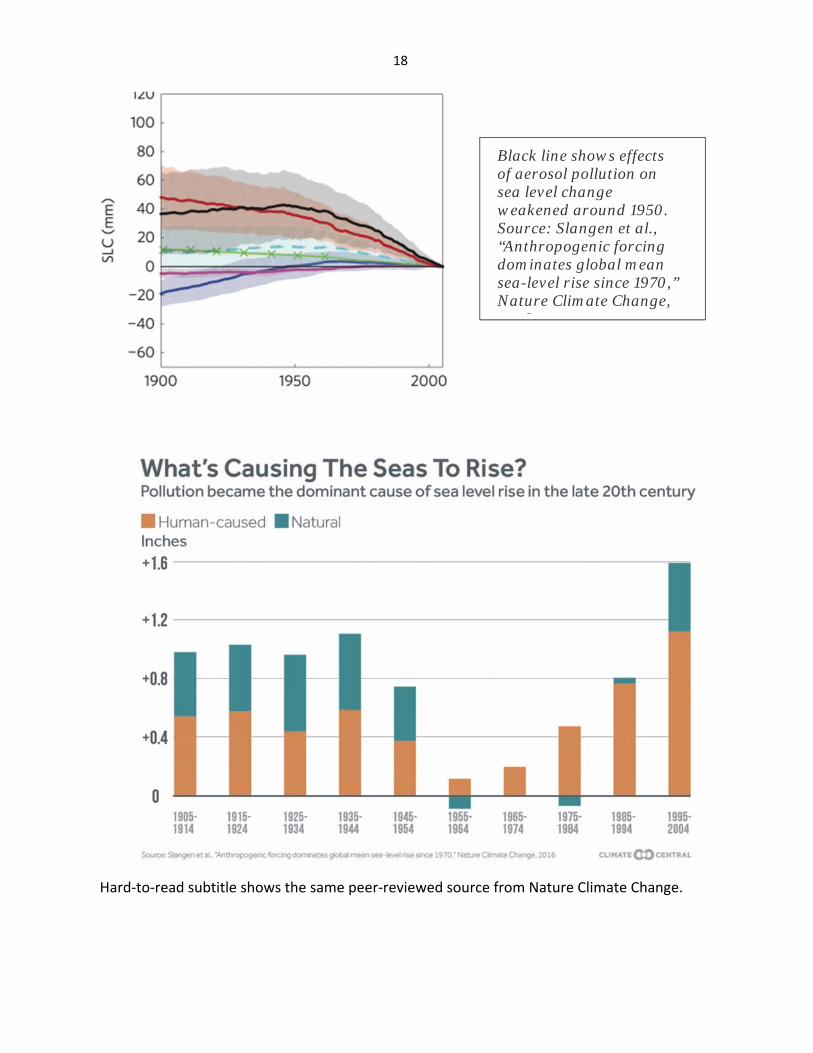
Globally, research on sea level is ongoing and the following is not from OCCRI, but from a peer‐reviewed project by international scientists led by an Australian, published in Nature Climate Change, which only posts its abstract online; but Climate Central puts research news online. The research team analyzed 3,000 years of data from glaciers and used computer modeling to show that human influences have created 2/3 of sea level rise from 1970 to 2005, while natural forces caused 2/3 of rise from 1900 to 1950. The villain is greenhouse gases we produce, warming the planet and melting continental ice (Antarctica, Greenland, and glaciers).
On the vertical Y axis, SLC stands for sea level change. The horizontal X axis reflects year in 50‐year intervals. What is interesting is that negative environmental factors until the 1970s were actually helping to reverse this process. The planet was warming after the Little Ice Age of the 1500s to 1700s, because while greenhouse gases were trapping solar heat, soot and other pollution were reflecting heat away. Then briefly our use of aerosols, which we had to abandon because they were destroying the protective ozone layer, were actually also creating more heat reflection. Mt. Pinatubo erupted in the 1990s and released natural aerosols. This caused global cooling and sea level fell. But aerosols don’t last in the atmosphere, whereas greenhouse gases endure for thousands of years, so they eventually have the dominant effect.28
28 http://www.climatecentral.org/news/pollution‐key‐driver‐late‐20th‐century‐sea‐rise‐20232
Black line shows role of greenhouse gas pollution on sea level rise strengthened around 1970. (Colors show how the pollution affected sea level changes from different factors, such glacier melting in dark blue.) Source: Slangen et al., “Anthropogenic forcing dominates global mean sea-level rise since 1970,” Nature Climate
18
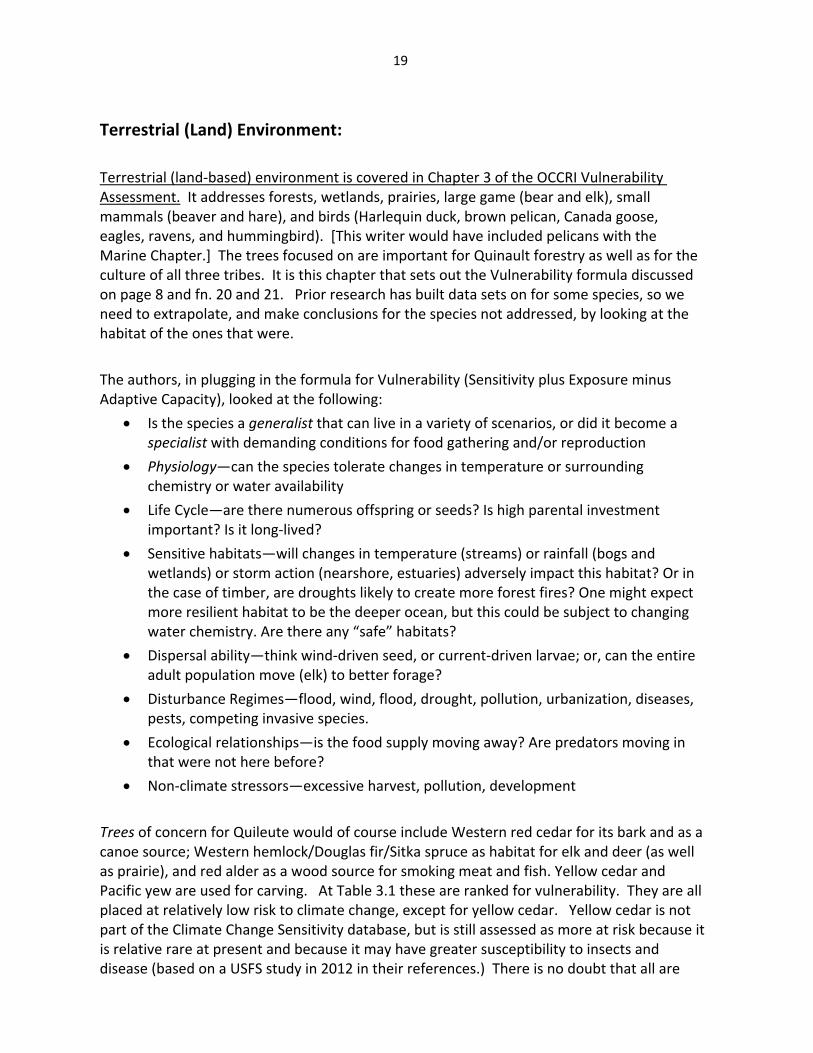
Hard‐to‐read subtitle shows the same peer‐reviewed source from Nature Climate Change.
Black line shows effects of aerosol pollution on sea level change weakened around 1950. Source: Slangen et al., “Anthropogenic forcing dominates global mean sea-level rise since 1970,” Nature Climate Change,
6
19
Terrestrial (Land) Environment:
Terrestrial (land‐based) environment is covered in Chapter 3 of the OCCRI Vulnerability Assessment. It addresses forests, wetlands, prairies, large game (bear and elk), small mammals (beaver and hare), and birds (Harlequin duck, brown pelican, Canada goose, eagles, ravens, and hummingbird). [This writer would have included pelicans with the Marine Chapter.] The trees focused on are important for Quinault forestry as well as for the culture of all three tribes. It is this chapter that sets out the Vulnerability formula discussed on page 8 and fn. 20 and 21. Prior research has built data sets on for some species, so we need to extrapolate, and make conclusions for the species not addressed, by looking at the habitat of the ones that were.
The authors, in plugging in the formula for Vulnerability (Sensitivity plus Exposure minus Adaptive Capacity), looked at the following:
Is the species a generalist that can live in a variety of scenarios, or did it become a specialist with demanding conditions for food gathering and/or reproduction
Physiology—can the species tolerate changes in temperature or surrounding chemistry or water availability
Life Cycle—are there numerous offspring or seeds? Is high parental investment important? Is it long‐lived?
Sensitive habitats—will changes in temperature (streams) or rainfall (bogs and wetlands) or storm action (nearshore, estuaries) adversely impact this habitat? Or in the case of timber, are droughts likely to create more forest fires? One might expect more resilient habitat to be the deeper ocean, but this could be subject to changing water chemistry. Are there any “safe” habitats?
Dispersal ability—think wind‐driven seed, or current‐driven larvae; or, can the entire adult population move (elk) to better forage?
Disturbance Regimes—flood, wind, flood, drought, pollution, urbanization, diseases, pests, competing invasive species.
Ecological relationships—is the food supply moving away? Are predators moving in that were not here before?
Non‐climate stressors—excessive harvest, pollution, development
Trees of concern for Quileute would of course include Western red cedar for its bark and as a canoe source; Western hemlock/Douglas fir/Sitka spruce as habitat for elk and deer (as well as prairie), and red alder as a wood source for smoking meat and fish. Yellow cedar and Pacific yew are used for carving. At Table 3.1 these are ranked for vulnerability. They are all placed at relatively low risk to climate change, except for yellow cedar. Yellow cedar is not part of the Climate Change Sensitivity database, but is still assessed as more at risk because it is relative rare at present and because it may have greater susceptibility to insects and disease (based on a USFS study in 2012 in their references.) There is no doubt that all are
20
subject to forest fires in the event of extreme drought. But in other aspects, most have resilience.
Recommendation: Land management may change and private owners may be less sharing than the current ones. To assure stock of trees we value, it may be advisable to purchase a nearby tract of land and maintain our own small forest.
Forbs (herbaceous flowering plant other than grasses or rushes) and shrubs of concern include the undergrowth favored by elk and deer, and the berries favored by us as well as a host of animals (deer, elk, bears, and land birds). The berries discussed include salal, huckleberries, salmon berries, native blackberry, strawberry, and cranberry. Other plants include bear grass, skunk cabbage, Devil’s club, Nootka rose, cascara, Labrador tea, and mushrooms. None of these has assessable data in the Climate Change Sensitivity database. Those plants that require moisture (e.g., skunk cabbage and mushrooms) may be vulnerable to drought. The seedling trees are preferred by elk and these may experience pressure from invasive species or drought.
Recommendation: It may be prudent to grow berries and shrubs used for food in our own gardens or in a tract of land nearby. Infrastructure (roads and bridges) to stores may be lost as a result of earthquakes or major storms. It may also be prudent to renew our knowledge of how some plants were used medicinally and to grow them as well (e.g., Devil’s club or cascara). This can provide us with some TEK knowledge.
Mammals such as beaver, bear and elk (but not deer) are in the Climate Change Sensitivity database. All are projected to be at low risk and resilient, but drought leading to forest fires will have an adverse impact on all. Climate models show that the range for the cougar is expected to shrink. Quileute has been involved in elk studies and included in peer‐reviewed publications regarding the body fat decline of Roosevelt elk on the Olympic Peninsula and the impact this has on the success of pregnancies and calf survival. Terrestrial noxious weeds compete with native forbs and impact the local food supply.
Recommendation: To have more control over food supply in the future, Quileute might copy Coeur d’Alene and raise elk on its own private ranch.
Continue to work with Clallam County Noxious Weed Control Board to treat and control invasive weeds; e.g., Scotch broom, reed canary grass, tansy ragwort, or knotweed species (see fn. 32).
Birds in the Climate Change Sensitivity database included the Harlequin duck, the brown pelican, and the Canada goose. While all were deemed moderately sensitive to change, the duck was deemed most sensitive. Other species discussed by OCCRI included the culturally important bald eagle and common raven; the rufous hummingbird (important to pollination); and the great blue heron. Most species were expected to hold even or lose some ground
21
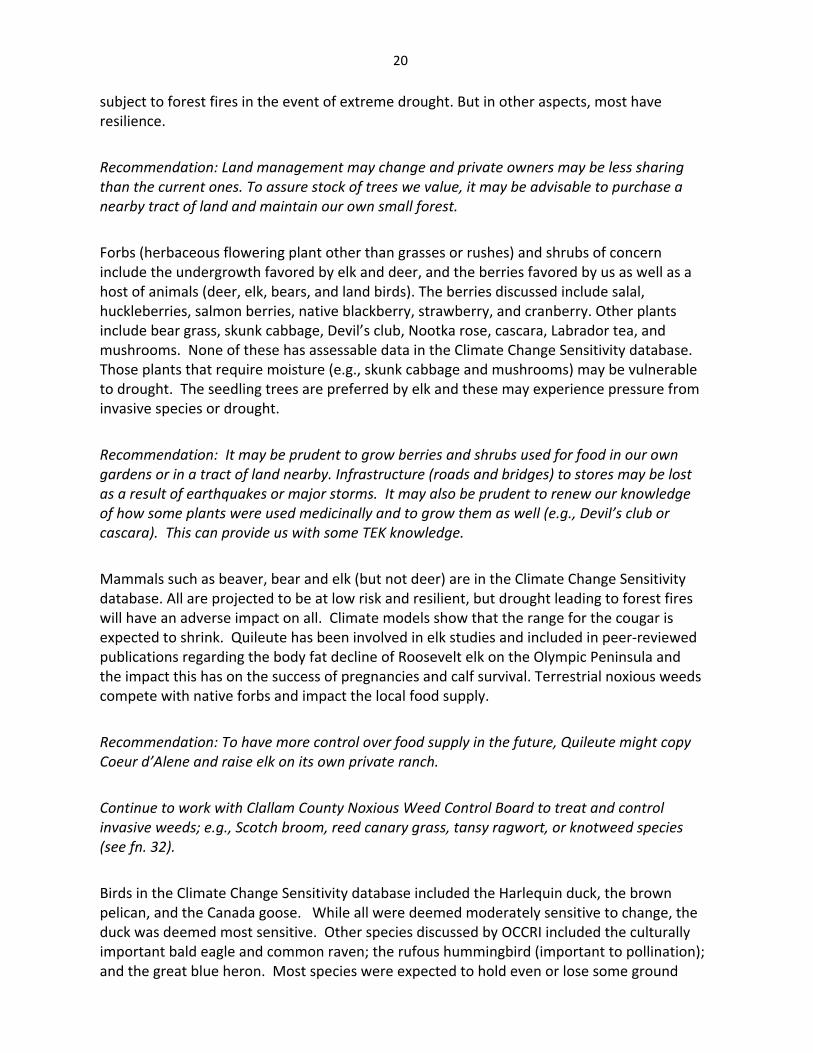
because of loss of habitat but still have low risk. The American crow is expected to gain ground (species highly adaptable to ecosystems). OCCRI actually expects the bald eagle to expand its range, but since salmon is its preferred food, this writer thinks that is an open question. However, eagles are resilient and will eat other foods when salmon are not present. (At QNR we have seen them take live seagulls and scavenge dead common murres. Picture below is from outside QNR office; photo by K. Krueger.)
Quileute Natural Resources has been writing grants over the years to monitor and evaluate the range and population statistics for elk herds that live inside the Dickey, Sol Duc, and Goodman Game Management Units and works with WDFW and our treaty partners (Hoh and Quinault) on game management. In addition, staff participates in tribal and state meetings related to game management, and communicates with major timber landowners such as Rayonier. Evaluation of herd strength and capacity to survive changes in climate that might impact food supply are of primary concerns and the department continues to proactively seek funding to further solutions to such concerns.
Fresh Water (Lakes, Rivers, Wetlands)
Chapter 4 of the OCCRI report deals with the Freshwater Environment and the technical part is written by USFS biologists. The vulnerability of the salmon stocks important to all three tribes is discussed by each stage of the life cycle.
August 2004, K. Krueger
22
Adults‐‐The majority of maturation and growth occurs in the ocean (3‐5 years, depending on species), and during these times, the food sources may be adversely impacted by ocean acidification, which can impair the ability of certain small organisms to make their shells. Elevated surface temperatures may also reduce the preferred habitat for salmon. The OCCRI prediction is that we will see smaller fish, returning to spawn, and reduced returns (QNR saw this in 2015 but not as much in 2016. Krueger’s note). The OCCRI authors noted the low returns of coho in 2015 (at page 95), and we at QNR are noticing smaller‐sized and less fecund (fertile) fish. Some will attribute the smaller sizes to hatchery fish competition but stock studies have indicated most likely environmental conditions are a larger factor. Egg size being a factor of the environment in which they develop, food availability in the ocean will affect fecundity.
Returning adults may encounter low flows that interfere with their reaching spawning grounds. This happened in 2015, leading to Quileute and WDFW sandbagging the Sol Duc to elevate the stream. The drought also led both co‐managers to temporarily close some reaches to fishing.
Eggs and embryos—Higher temperatures in the streams may result from less snowpack and more rain in winter. That same change in the precipitation pattern may also lead to floods in winter and drought for more months of the summer. More flooding may scour the stream beds, either removing gravel for redds and/or removing the eggs and redds entirely, depending on the storm intensity. Also, stream banks may cave in and lead to more sediment getting between gravel and choking the eggs. Studies cited by the authors indicate warmer temperatures in the streams can induce faster development, leading to early emergence, out of synch with season and food supplies.
Juveniles—High flows from earlier snowmelt may disturb the migration cycle. High winter flows may disturb the overwintering rearing of coho and steelhead. Drought may affect water quality in the lakes where sockeye rear. Low flow is expected to occur 4‐6 weeks earlier.
Not discussed in this OCCRI chapter, but our staff knows from our own field work over several years‐‐reduced returns of adults will adversely affect the marine‐derived nutrient load in the streams (carcasses). This nutrient load provides food for macroinvertebrates, the insect larvae that juveniles eat in the streams. We have monitored macroinvertebrates, first in the 1990s with WDOE and EPA money to do pilot studies of their presence in several key streams, and then again in 2013‐present, working with Streamkeepers of Clallam County. As a primary food for juvenile salmonids, their abundance is essential. Leaf litter is also an important component of the nutrient load in streams. That is at risk from noxious weeds, in particular knotweeds, which QNR staff have been controlling since 2003. Knotweeds are bamboo‐like non‐native plants that aggressively displace riparian foliage but despite huge heart‐shaped leaves, produce less shade (only reach some 10‐15 feet in height) and less decaying matter.
23
OCCRI does discuss zooplankton in lakes, which sockeye juveniles prefer. Warmer temperatures will likely increase these, but also, researchers have observed stratification of temperature zones (at Lake Washington), a factor that leads to decline of preferred food species and the rise of some others. This writer has seen University of Washington projections of our streams’ temperatures. In about 30 years we can expect warming above temperatures that salmon prefer. This will not only create the effects discussed in Chapter 4, but also increase the possibility of disease, since some diseases affecting salmonids prefer higher stream temperatures.
Smolt—Changes in flow, day length, and warmer temperature are cues to influence timing of parr‐smolt transformations. Changes in water temperature because of climate can send miscues. Higher temperatures can even interfere. One study the authors cite regarding steelhead at indicated the enzyme needed to smoltify was produced at inadequate levels when temperatures exceeded 15° C (59° F). The OCCRI authors discuss nearshore conditions, with respect to smolt. Changes in upwelling cycles can affect the plankton production.
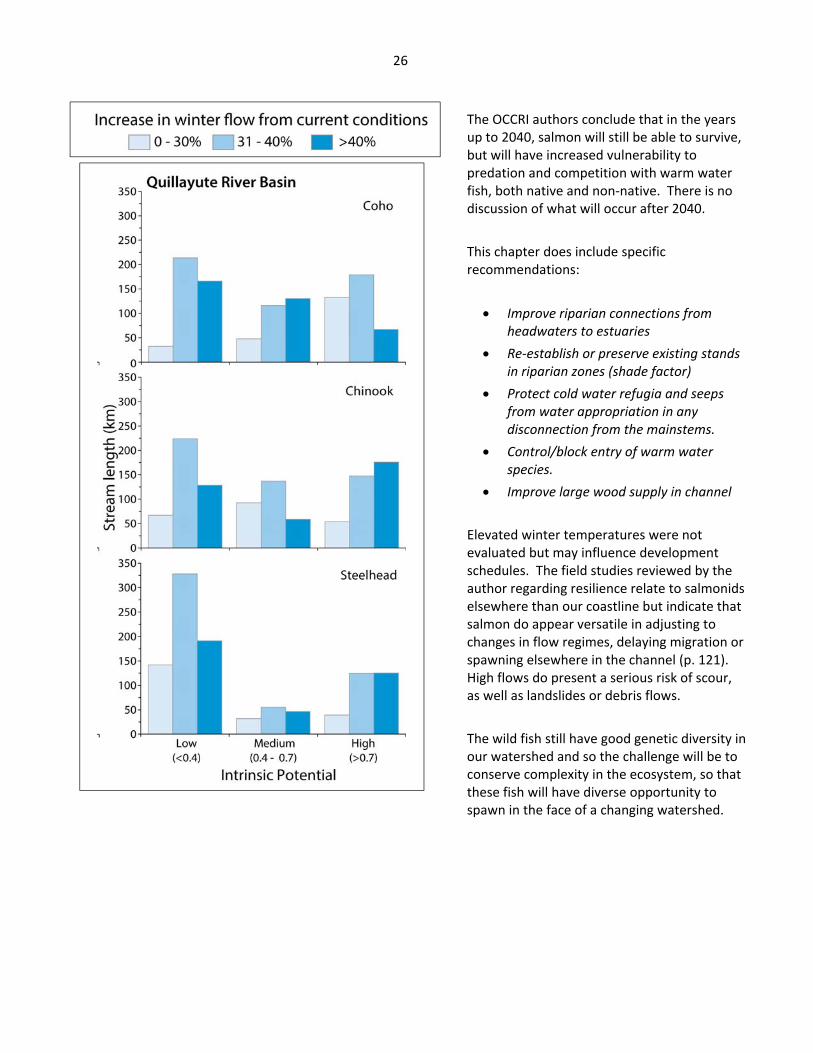
The OCCRI authors made use of NetMap, a computer program using data input into the Geographic Information System (GIS) to map the channels and their likelihood of supporting fish habitat. Stream bankfull width is an important criterion in prioritization of restoration. The evaluation of the channels is referred to as their “intrinsic potential” or IP. This work has been done for our rivers already, and the data are up on the Olympic Natural Resources Center website (UW) in Forks; and have been used by our North Pacific Coast Lead Entity Group for WRIA 20 as well as our regional salmon group, WA Coast Sustainable Salmon Partnership (“WCSSP”). However, the USFS authors accessed the data differently.29 We recommend the ONRC site presented also, in fn. 29. It is important to know that IP is only one tool to evaluate channel habitat. It does not weigh in the factors of anthropogenic (man‐made) pollution, water quality, potential for invasive species, or abundance (or not) of off‐channel habitat. However, the authors did get into temperature change predictions in depth, using the channel morphology as a tool to evaluate risk of temperature increase.
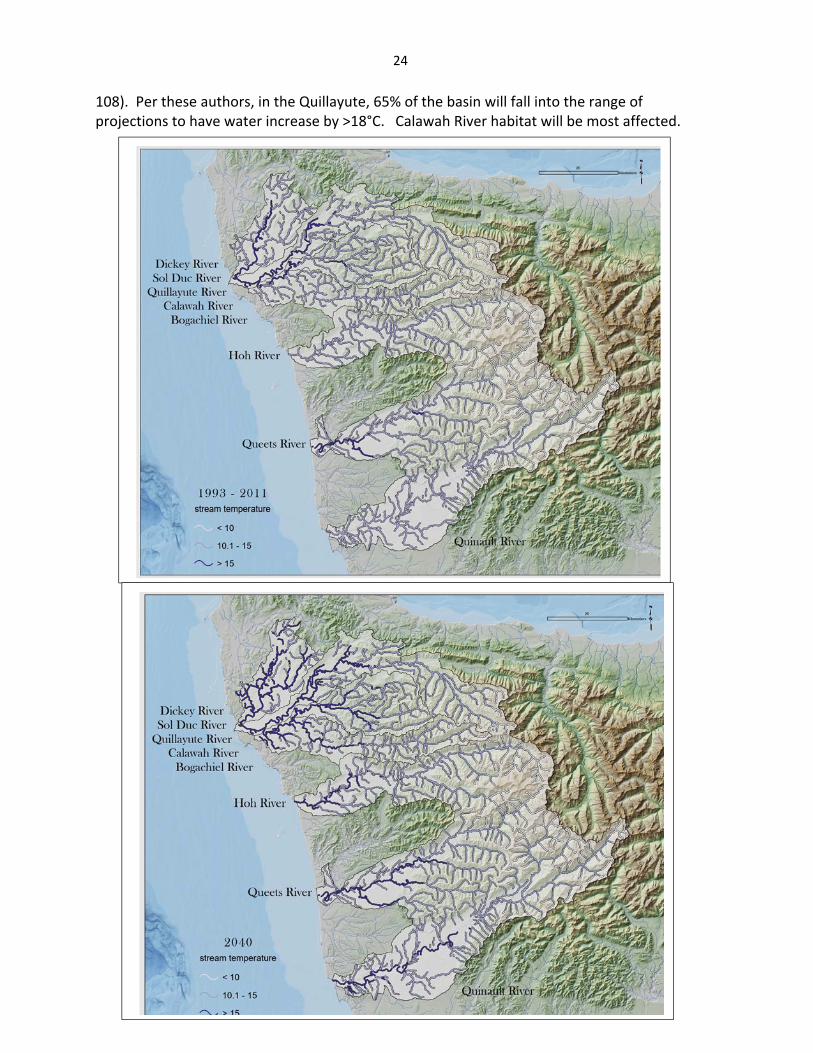
On the next page are two pictures from Figure 4.3 from Chapter 4 on Freshwater, showing current and projected (2040) summer water temperatures in degrees Centigrade in the study basins of the Treaty of Olympia. The first shows 1993‐2001 temperature. Next: Year 2040.
“Summer water temperatures are likely to increase in all basins; the greatest changes are a reduction in the length of stream that is <10° C and an increase in the length of stream where temperatures exceed 10° C, especially in the lower watersheds.” (Reeves et al., Chapter 4, p.
29 http://www.netmaptools.org/Pages/NetMapHelp/ netmap_synthetic_stream_layer_derivation.htm: this site is not available; one has to go into menus after the “NetMapHelp” part of the address. http://www.onrc.washington.edu/MarinePrograms/AnadIPportal.html is a more accessible way to see the work product.
24
108). Per these authors, in the Quillayute, 65% of the basin will fall into the range of projections to have water increase by >18°C. Calawah River habitat will be most affected.
25
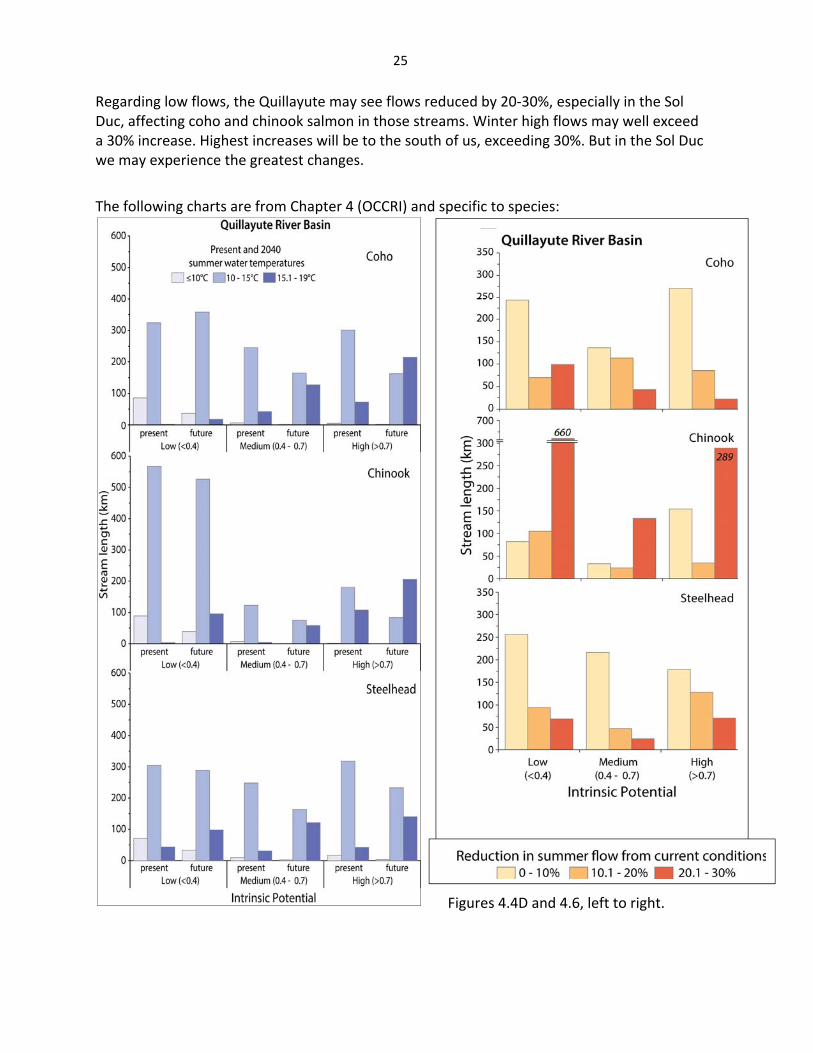
Regarding low flows, the Quillayute may see flows reduced by 20‐30%, especially in the Sol Duc, affecting coho and chinook salmon in those streams. Winter high flows may well exceed a 30% increase. Highest increases will be to the south of us, exceeding 30%. But in the Sol Duc we may experience the greatest changes.
The following charts are from Chapter 4 (OCCRI) and specific to species:
Figures 4.4D and 4.6, left to right.
26
The OCCRI authors conclude that in the years up to 2040, salmon will still be able to survive, but will have increased vulnerability to predation and competition with warm water fish, both native and non‐native. There is no discussion of what will occur after 2040.
This chapter does include specific recommendations:
Improve riparian connections from headwaters to estuaries
Re‐establish or preserve existing stands in riparian zones (shade factor)
Protect cold water refugia and seeps from water appropriation in any disconnection from the mainstems.
Control/block entry of warm water species.
Improve large wood supply in channel
Elevated winter temperatures were not evaluated but may influence development schedules. The field studies reviewed by the author regarding resilience relate to salmonids elsewhere than our coastline but indicate that salmon do appear versatile in adjusting to changes in flow regimes, delaying migration or spawning elsewhere in the channel (p. 121). High flows do present a serious risk of scour, as well as landslides or debris flows.
The wild fish still have good genetic diversity in our watershed and so the challenge will be to conserve complexity in the ecosystem, so that these fish will have diverse opportunity to spawn in the face of a changing watershed.
27
The OCCRI authors conclude with statements that corroborates this writer’s suspicion regarding the effectiveness of Quileute’s TEK: “We can be assured that future conditions are very unlikely to resemble historic ones. New assemblages of native and non‐native species will interact in novel ways… and make it difficult to predict the effects of climate change on Pacific salmon and other aquatic organisms. … The largest impacts are likely to result from changes in the marine environment. It will be imperative to develop management strategies…” (at p. 126)
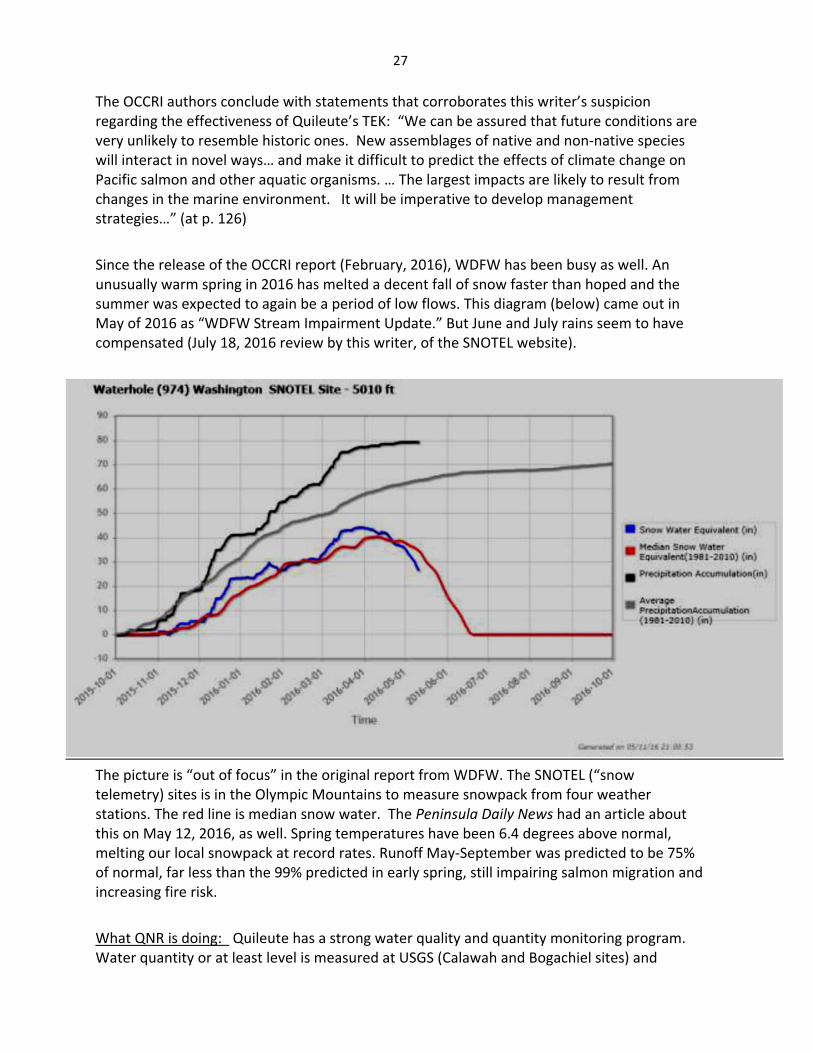
Since the release of the OCCRI report (February, 2016), WDFW has been busy as well. An unusually warm spring in 2016 has melted a decent fall of snow faster than hoped and the summer was expected to again be a period of low flows. This diagram (below) came out in May of 2016 as “WDFW Stream Impairment Update.” But June and July rains seem to have compensated (July 18, 2016 review by this writer, of the SNOTEL website).
The picture is “out of focus” in the original report from WDFW. The SNOTEL (“snow telemetry) sites is in the Olympic Mountains to measure snowpack from four weather stations. The red line is median snow water. The Peninsula Daily News had an article about this on May 12, 2016, as well. Spring temperatures have been 6.4 degrees above normal, melting our local snowpack at record rates. Runoff May‐September was predicted to be 75% of normal, far less than the 99% predicted in early spring, still impairing salmon migration and increasing fire risk.
What QNR is doing: Quileute has a strong water quality and quantity monitoring program. Water quantity or at least level is measured at USGS (Calawah and Bogachiel sites) and
28
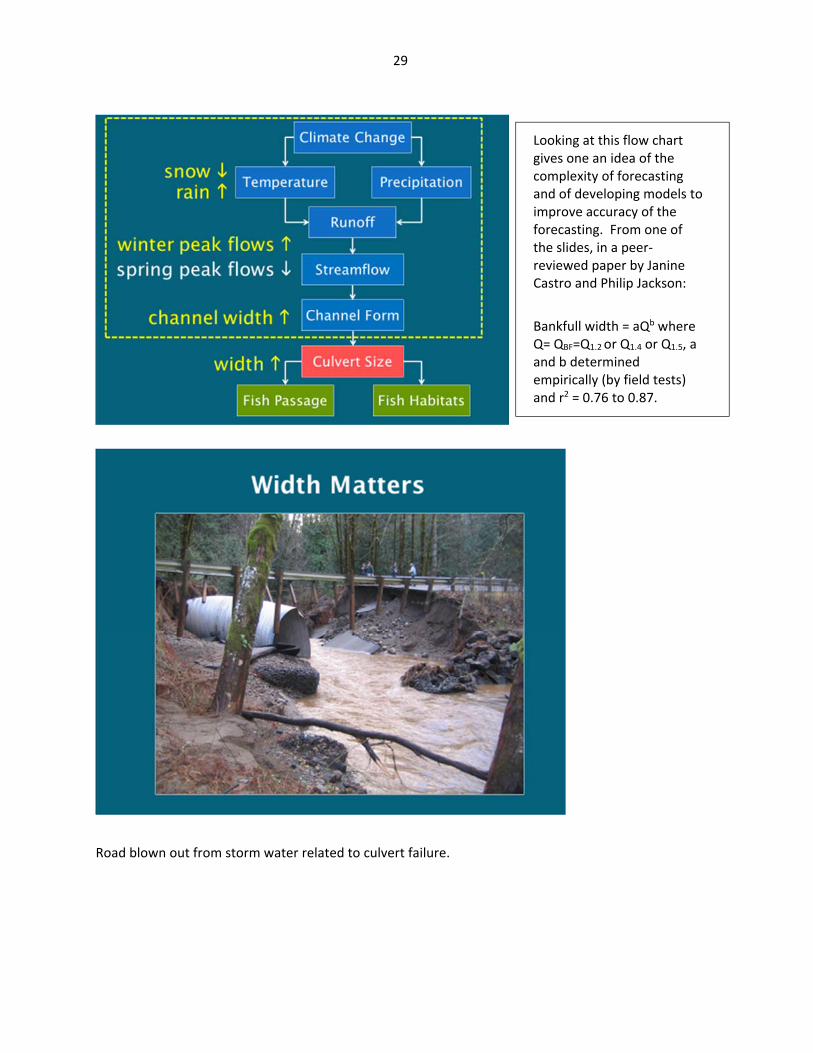
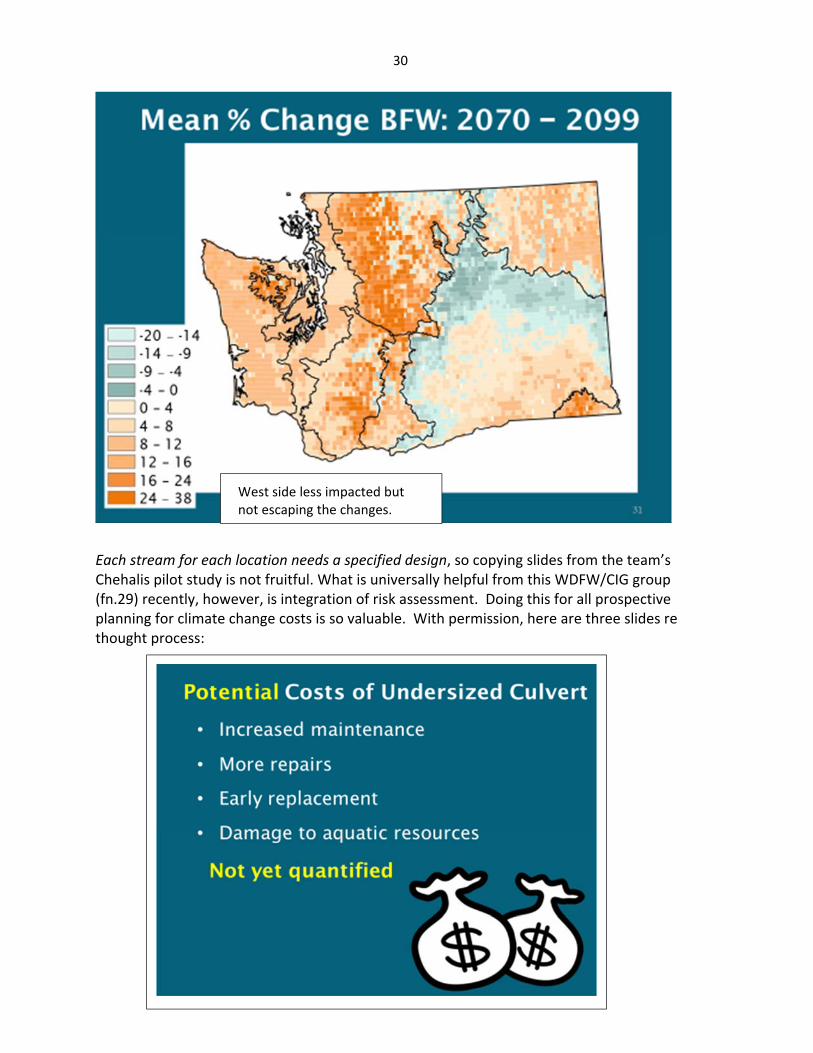
Habitat maintenance: Quileute participates in a number of grant programs and intergovernmental committees30 to develop and implement salmon habitat restoration strategies and has been awarded grants to repair or replace fish passages such as culverts and bridges. However, the science of fish passage improvement is continuously changing. Culvert maintenance for salmonid migration is not only a major habitat concern for Quileute (along with invasive weeds), but also for other tribes and for the state. Washington Department of Fish and Wildlife has for many years been responsible for salmon habitat from the state standpoint and is in fact presently working closely with tribal treaty co‐managers on selection and prioritization of culverts to replace or repair, in accordance with a 2013 federal district court decision (U.S. v Washington subproceeding 2001‐1, upheld by the Ninth Circuit Court of Appeals in 2016). Along related lines they are working with the Climate Impacts Group (“CIG”) from the University of Washington to anticipate what culvert sizes and designs would be needed in the future when changes in precipitation may necessitate different engineering. We are fortunate to have NetMap studies of bankfull width (“BFW”) for our rivers, available from Olympic Natural Resources Center of UW in Forks. However, those maps are “snapshots” in time and will need to be updated, a costly process we hope will occur. The discharge in our river systems is likely to be greater in winter and less in summer, in future decades. So we need to be sure we use a culvert that addresses capacity appropriately. We are fortunate to be able to show their slides, below, with permission:31
30 North Pacific Coast Lead Entity, Washington Coast Sustainable Salmon Partnership, Timber Fish Wildlife. 31 Thanks to Project Team for PPT usage: WDFW—Timothy Quinn, Jane Atha, Dan Ponder, George Wilhere, Kevin Lautz and Lynn Helbrecht; UW Climate Impacts Group—Ingrid Tohver; Jennie Hoffman of Adaptation Insight. Also personal communication with Dr. Atha. 2016.
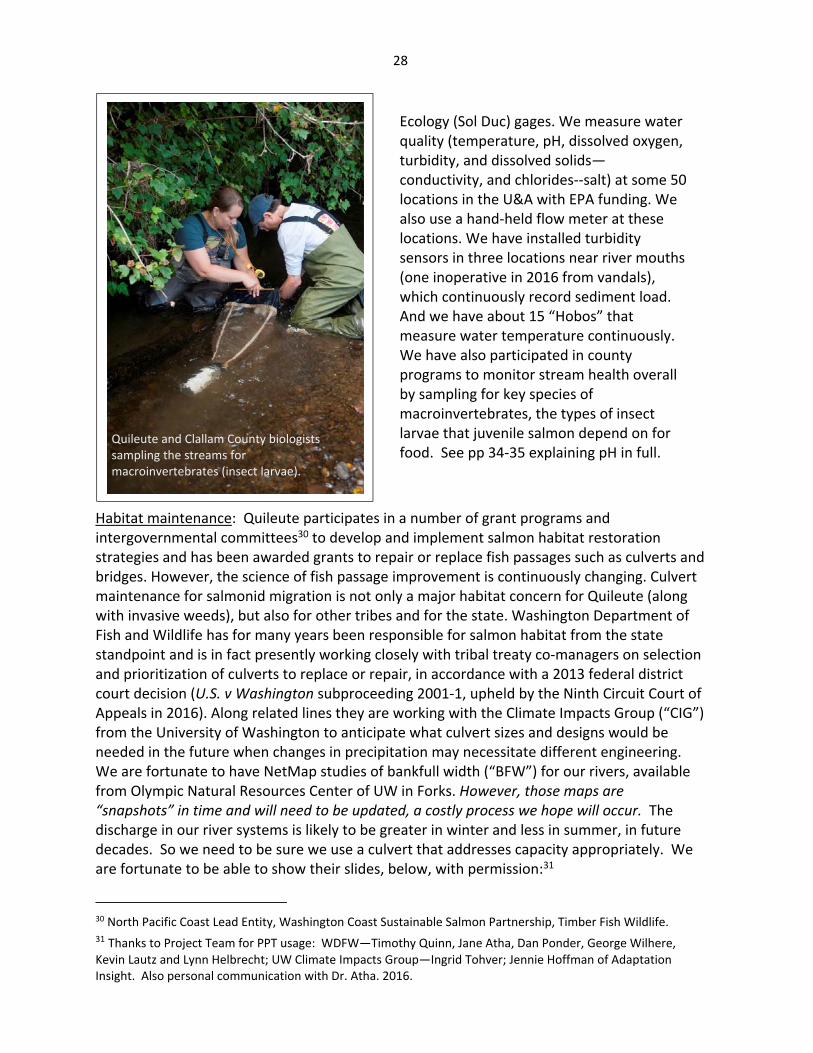
Ecology (Sol Duc) gages. We measure water quality (temperature, pH, dissolved oxygen, turbidity, and dissolved solids—conductivity, and chlorides‐‐salt) at some 50 locations in the U&A with EPA funding. We also use a hand‐held flow meter at these locations. We have installed turbidity sensors in three locations near river mouths (one inoperative in 2016 from vandals), which continuously record sediment load. And we have about 15 “Hobos” that measure water temperature continuously. We have also participated in county programs to monitor stream health overall by sampling for key species of macroinvertebrates, the types of insect larvae that juvenile salmon depend on for food. See pp 34‐35 explaining pH in full.
Quileute and Clallam County biologists sampling the streams for macroinvertebrates (insect larvae).
29
Looking at this flow chart gives one an idea of the complexity of forecasting and of developing models to improve accuracy of the forecasting. From one of the slides, in a peer‐reviewed paper by Janine Castro and Philip Jackson:
Bankfull width = aQb where Q= QBF=Q1.2 or Q1.4 or Q1.5, a and b determined empirically (by field tests) and r2 = 0.76 to 0.87.
Road blown out because culvert was not handling the flow.
Road blown out from storm water related to culvert failure.
30
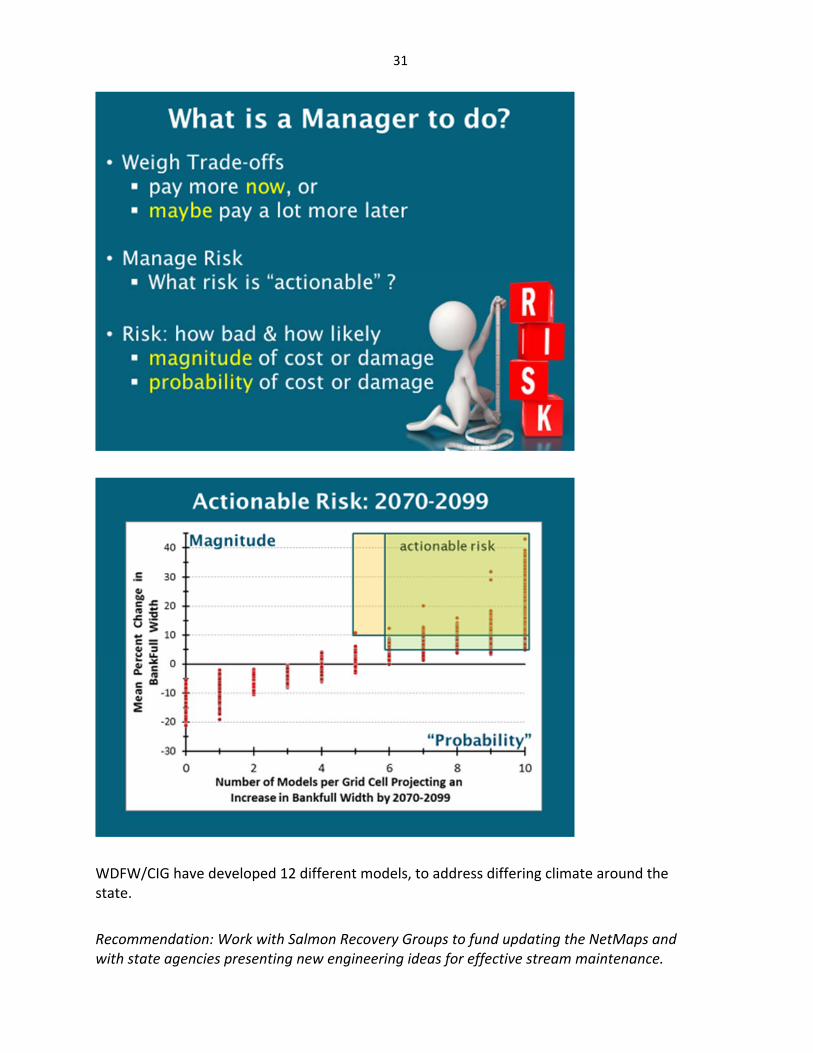
Each stream for each location needs a specified design, so copying slides from the team’s Chehalis pilot study is not fruitful. What is universally helpful from this WDFW/CIG group (fn.29) recently, however, is integration of risk assessment. Doing this for all prospective planning for climate change costs is so valuable. With permission, here are three slides re thought process:
West side less impacted but not escaping the changes.
31
WDFW/CIG have developed 12 different models, to address differing climate around the state.
Recommendation: Work with Salmon Recovery Groups to fund updating the NetMaps and with state agencies presenting new engineering ideas for effective stream maintenance.
32
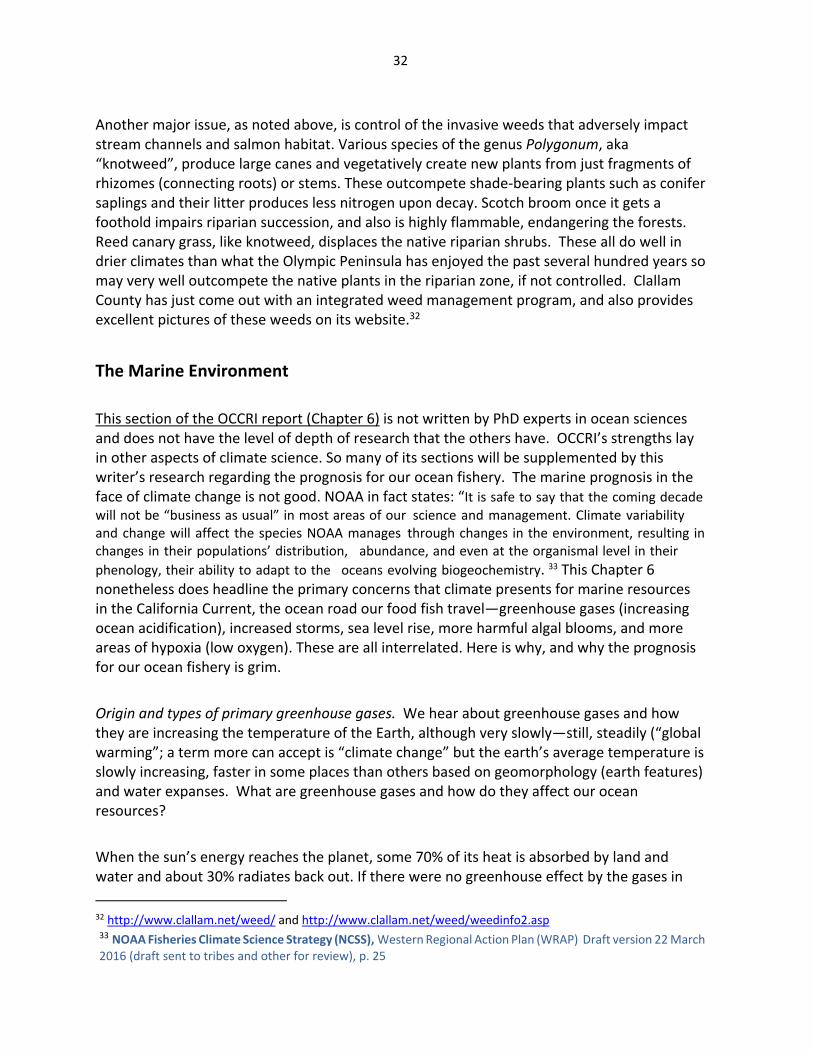
Another major issue, as noted above, is control of the invasive weeds that adversely impact stream channels and salmon habitat. Various species of the genus Polygonum, aka “knotweed”, produce large canes and vegetatively create new plants from just fragments of rhizomes (connecting roots) or stems. These outcompete shade‐bearing plants such as conifer saplings and their litter produces less nitrogen upon decay. Scotch broom once it gets a foothold impairs riparian succession, and also is highly flammable, endangering the forests. Reed canary grass, like knotweed, displaces the native riparian shrubs. These all do well in drier climates than what the Olympic Peninsula has enjoyed the past several hundred years so may very well outcompete the native plants in the riparian zone, if not controlled. Clallam County has just come out with an integrated weed management program, and also provides excellent pictures of these weeds on its website.32
The Marine Environment
This section of the OCCRI report (Chapter 6) is not written by PhD experts in ocean sciences and does not have the level of depth of research that the others have. OCCRI’s strengths lay in other aspects of climate science. So many of its sections will be supplemented by this writer’s research regarding the prognosis for our ocean fishery. The marine prognosis in the face of climate change is not good. NOAA in fact states: “It is safe to say that the coming decade will not be “business as usual” in most areas of our science and management. Climate variability and change will affect the species NOAA manages through changes in the environment, resulting in changes in their populations’ distribution, abundance, and even at the organismal level in their
phenology, their ability to adapt to the oceans evolving biogeochemistry. 33 This Chapter 6 nonetheless does headline the primary concerns that climate presents for marine resources in the California Current, the ocean road our food fish travel—greenhouse gases (increasing ocean acidification), increased storms, sea level rise, more harmful algal blooms, and more areas of hypoxia (low oxygen). These are all interrelated. Here is why, and why the prognosis for our ocean fishery is grim.
Origin and types of primary greenhouse gases. We hear about greenhouse gases and how they are increasing the temperature of the Earth, although very slowly—still, steadily (“global warming”; a term more can accept is “climate change” but the earth’s average temperature is slowly increasing, faster in some places than others based on geomorphology (earth features) and water expanses. What are greenhouse gases and how do they affect our ocean resources?
When the sun’s energy reaches the planet, some 70% of its heat is absorbed by land and water and about 30% radiates back out. If there were no greenhouse effect by the gases in
32 http://www.clallam.net/weed/ and http://www.clallam.net/weed/weedinfo2.asp 33 NOAA Fisheries Climate Science Strategy (NCSS), Western Regional Action Plan (WRAP) Draft version 22 March 2016 (draft sent to tribes and other for review), p. 25
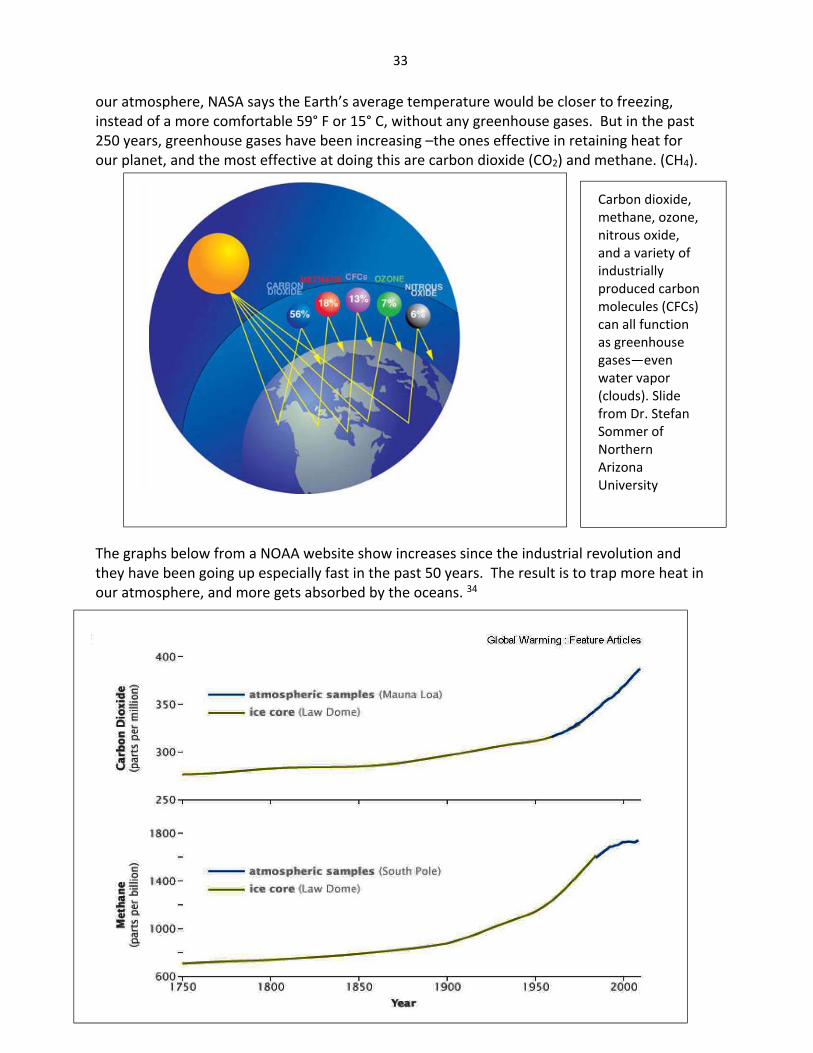
33
our atmosphere, NASA says the Earth’s average temperature would be closer to freezing, instead of a more comfortable 59° F or 15° C, without any greenhouse gases. But in the past 250 years, greenhouse gases have been increasing –the ones effective in retaining heat for our planet, and the most effective at doing this are carbon dioxide (CO2) and methane. (CH4).
The graphs below from a NOAA website show increases since the industrial revolution and they have been going up especially fast in the past 50 years. The result is to trap more heat in our atmosphere, and more gets absorbed by the oceans. 34
34 http://earthobservatory.nasa.gov/Features/GlobalWarming/page2.php
Carbon dioxide, methane, ozone, nitrous oxide, and a variety of industrially produced carbon molecules (CFCs) can all function as greenhouse gases—even water vapor (clouds). Slide from Dr. Stefan Sommer of Northern Arizona University
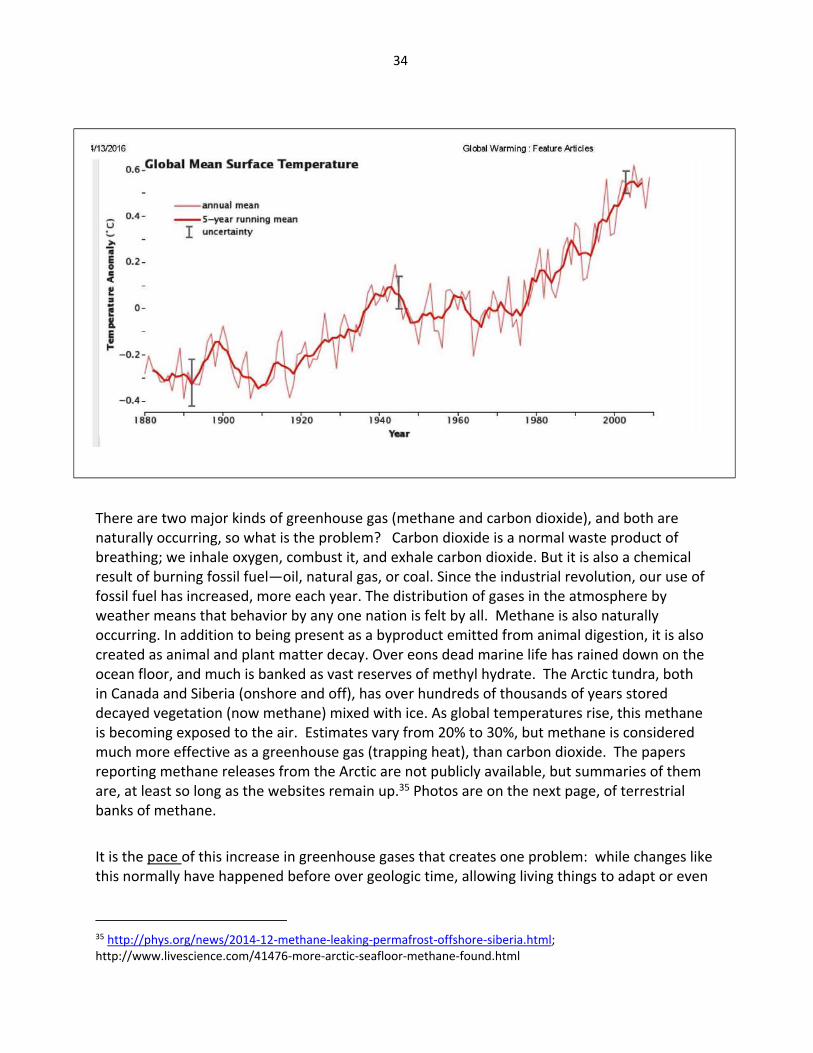
34
There are two major kinds of greenhouse gas (methane and carbon dioxide), and both are naturally occurring, so what is the problem? Carbon dioxide is a normal waste product of breathing; we inhale oxygen, combust it, and exhale carbon dioxide. But it is also a chemical result of burning fossil fuel—oil, natural gas, or coal. Since the industrial revolution, our use of fossil fuel has increased, more each year. The distribution of gases in the atmosphere by weather means that behavior by any one nation is felt by all. Methane is also naturally occurring. In addition to being present as a byproduct emitted from animal digestion, it is also created as animal and plant matter decay. Over eons dead marine life has rained down on the ocean floor, and much is banked as vast reserves of methyl hydrate. The Arctic tundra, both in Canada and Siberia (onshore and off), has over hundreds of thousands of years stored decayed vegetation (now methane) mixed with ice. As global temperatures rise, this methane is becoming exposed to the air. Estimates vary from 20% to 30%, but methane is considered much more effective as a greenhouse gas (trapping heat), than carbon dioxide. The papers reporting methane releases from the Arctic are not publicly available, but summaries of them are, at least so long as the websites remain up.35 Photos are on the next page, of terrestrial banks of methane.
It is the pace of this increase in greenhouse gases that creates one problem: while changes like this normally have happened before over geologic time, allowing living things to adapt or even
35 http://phys.org/news/2014‐12‐methane‐leaking‐permafrost‐offshore‐siberia.html; http://www.livescience.com/41476‐more‐arctic‐seafloor‐methane‐found.html
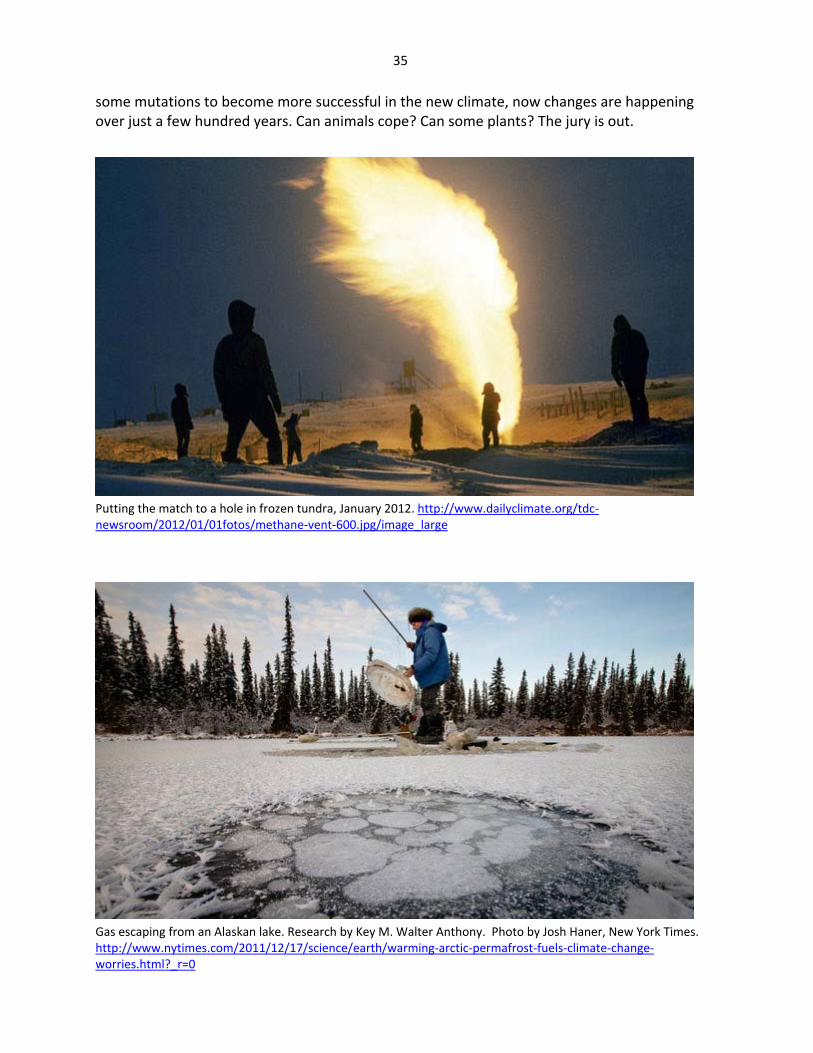
35
some mutations to become more successful in the new climate, now changes are happening over just a few hundred years. Can animals cope? Can some plants? The jury is out.
Putting the match to a hole in frozen tundra, January 2012. http://www.dailyclimate.org/tdc‐newsroom/2012/01/01fotos/methane‐vent‐600.jpg/image_large
Gas escaping from an Alaskan lake. Research by Key M. Walter Anthony. Photo by Josh Haner, New York Times. http://www.nytimes.com/2011/12/17/science/earth/warming‐arctic‐permafrost‐fuels‐climate‐change‐worries.html?_r=0
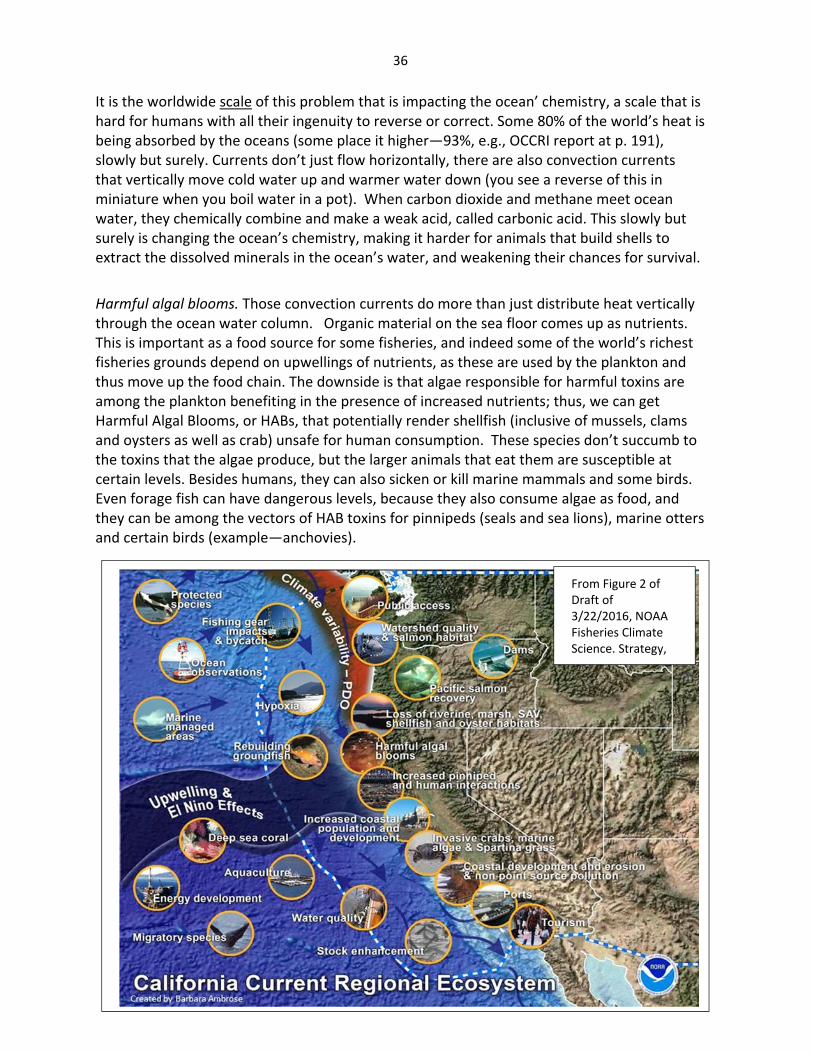
36
It is the worldwide scale of this problem that is impacting the ocean’ chemistry, a scale that is hard for humans with all their ingenuity to reverse or correct. Some 80% of the world’s heat is being absorbed by the oceans (some place it higher—93%, e.g., OCCRI report at p. 191), slowly but surely. Currents don’t just flow horizontally, there are also convection currents that vertically move cold water up and warmer water down (you see a reverse of this in miniature when you boil water in a pot). When carbon dioxide and methane meet ocean water, they chemically combine and make a weak acid, called carbonic acid. This slowly but surely is changing the ocean’s chemistry, making it harder for animals that build shells to extract the dissolved minerals in the ocean’s water, and weakening their chances for survival.
Harmful algal blooms. Those convection currents do more than just distribute heat vertically through the ocean water column. Organic material on the sea floor comes up as nutrients. This is important as a food source for some fisheries, and indeed some of the world’s richest fisheries grounds depend on upwellings of nutrients, as these are used by the plankton and thus move up the food chain. The downside is that algae responsible for harmful toxins are among the plankton benefiting in the presence of increased nutrients; thus, we can get Harmful Algal Blooms, or HABs, that potentially render shellfish (inclusive of mussels, clams and oysters as well as crab) unsafe for human consumption. These species don’t succumb to the toxins that the algae produce, but the larger animals that eat them are susceptible at certain levels. Besides humans, they can also sicken or kill marine mammals and some birds. Even forage fish can have dangerous levels, because they also consume algae as food, and they can be among the vectors of HAB toxins for pinnipeds (seals and sea lions), marine otters and certain birds (example—anchovies).
From Figure 2 of Draft of 3/22/2016, NOAA Fisheries Climate Science. Strategy,
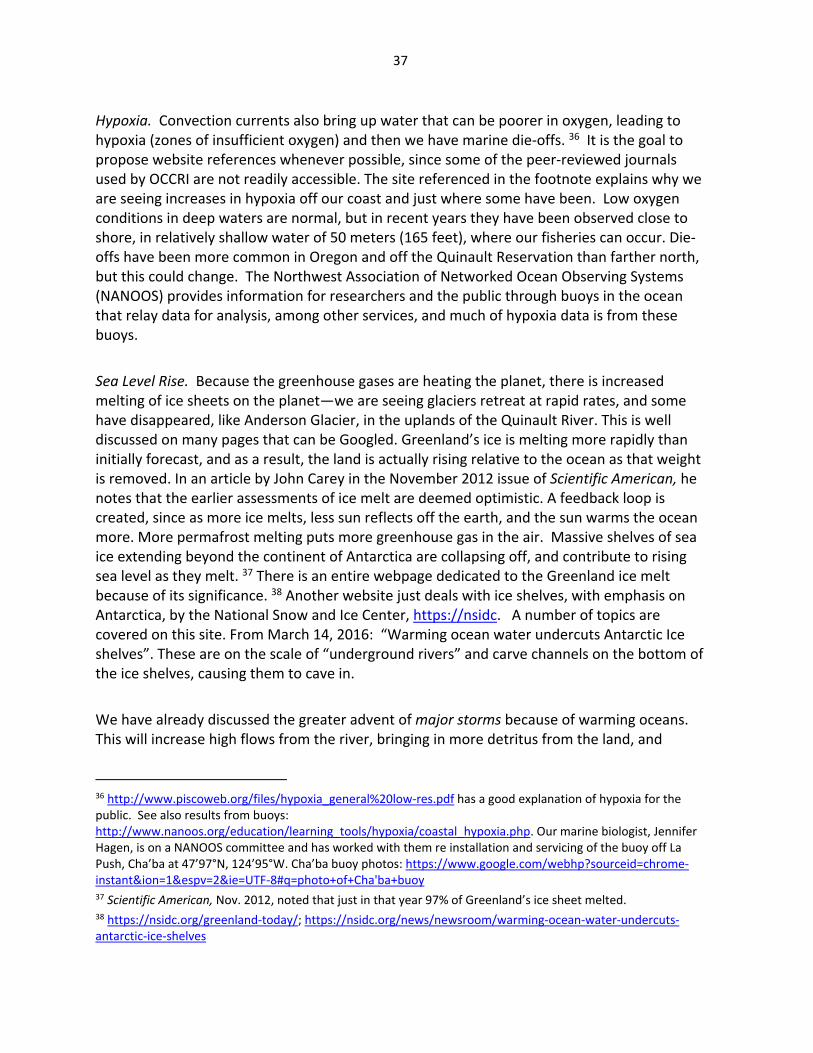
37
Hypoxia. Convection currents also bring up water that can be poorer in oxygen, leading to hypoxia (zones of insufficient oxygen) and then we have marine die‐offs. 36 It is the goal to propose website references whenever possible, since some of the peer‐reviewed journals used by OCCRI are not readily accessible. The site referenced in the footnote explains why we are seeing increases in hypoxia off our coast and just where some have been. Low oxygen conditions in deep waters are normal, but in recent years they have been observed close to shore, in relatively shallow water of 50 meters (165 feet), where our fisheries can occur. Die‐offs have been more common in Oregon and off the Quinault Reservation than farther north, but this could change. The Northwest Association of Networked Ocean Observing Systems (NANOOS) provides information for researchers and the public through buoys in the ocean that relay data for analysis, among other services, and much of hypoxia data is from these buoys.
Sea Level Rise. Because the greenhouse gases are heating the planet, there is increased melting of ice sheets on the planet—we are seeing glaciers retreat at rapid rates, and some have disappeared, like Anderson Glacier, in the uplands of the Quinault River. This is well discussed on many pages that can be Googled. Greenland’s ice is melting more rapidly than initially forecast, and as a result, the land is actually rising relative to the ocean as that weight is removed. In an article by John Carey in the November 2012 issue of Scientific American, he notes that the earlier assessments of ice melt are deemed optimistic. A feedback loop is created, since as more ice melts, less sun reflects off the earth, and the sun warms the ocean more. More permafrost melting puts more greenhouse gas in the air. Massive shelves of sea ice extending beyond the continent of Antarctica are collapsing off, and contribute to rising sea level as they melt. 37 There is an entire webpage dedicated to the Greenland ice melt because of its significance. 38 Another website just deals with ice shelves, with emphasis on Antarctica, by the National Snow and Ice Center, https://nsidc. A number of topics are covered on this site. From March 14, 2016: “Warming ocean water undercuts Antarctic Ice shelves”. These are on the scale of “underground rivers” and carve channels on the bottom of the ice shelves, causing them to cave in.
We have already discussed the greater advent of major storms because of warming oceans. This will increase high flows from the river, bringing in more detritus from the land, and
36 http://www.piscoweb.org/files/hypoxia_general%20low‐res.pdf has a good explanation of hypoxia for the public. See also results from buoys: http://www.nanoos.org/education/learning_tools/hypoxia/coastal_hypoxia.php. Our marine biologist, Jennifer Hagen, is on a NANOOS committee and has worked with them re installation and servicing of the buoy off La Push, Cha’ba at 47’97°N, 124’95°W. Cha’ba buoy photos: https://www.google.com/webhp?sourceid=chrome‐instant&ion=1&espv=2&ie=UTF‐8#q=photo+of+Cha'ba+buoy 37 Scientific American, Nov. 2012, noted that just in that year 97% of Greenland’s ice sheet melted. 38 https://nsidc.org/greenland‐today/; https://nsidc.org/news/newsroom/warming‐ocean‐water‐undercuts‐antarctic‐ice‐shelves
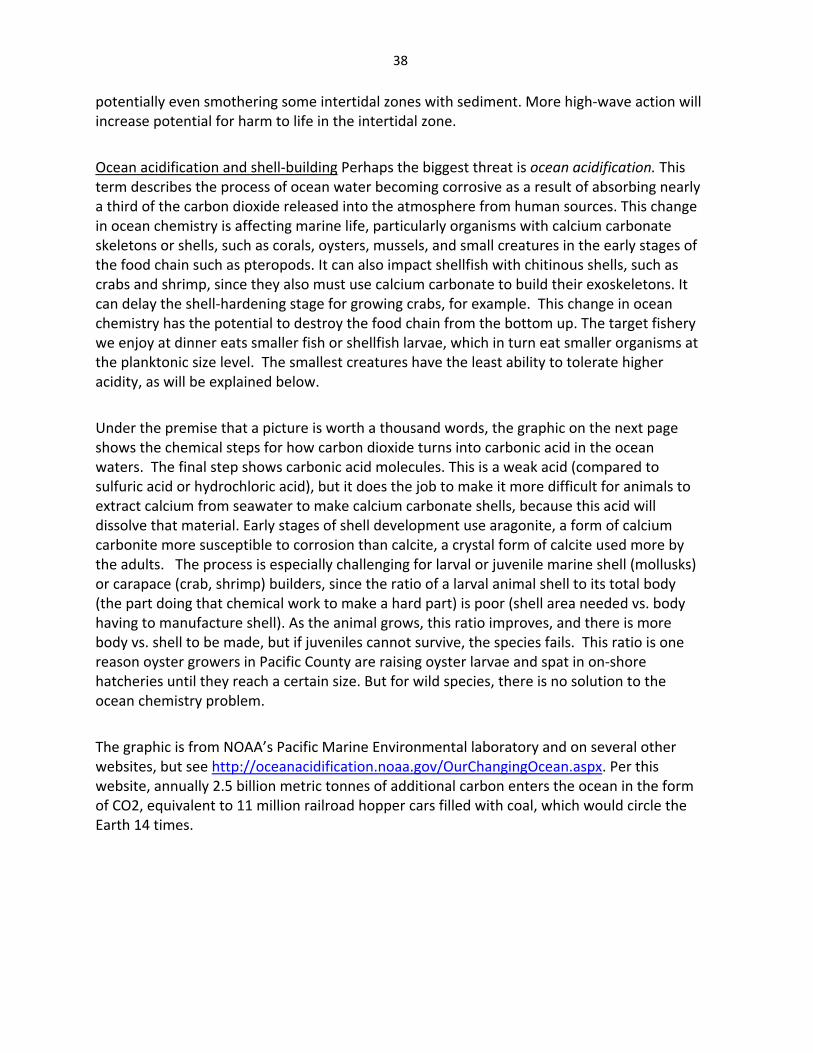
38
potentially even smothering some intertidal zones with sediment. More high‐wave action will increase potential for harm to life in the intertidal zone.
Ocean acidification and shell‐building Perhaps the biggest threat is ocean acidification. This term describes the process of ocean water becoming corrosive as a result of absorbing nearly a third of the carbon dioxide released into the atmosphere from human sources. This change in ocean chemistry is affecting marine life, particularly organisms with calcium carbonate skeletons or shells, such as corals, oysters, mussels, and small creatures in the early stages of the food chain such as pteropods. It can also impact shellfish with chitinous shells, such as crabs and shrimp, since they also must use calcium carbonate to build their exoskeletons. It can delay the shell‐hardening stage for growing crabs, for example. This change in ocean chemistry has the potential to destroy the food chain from the bottom up. The target fishery we enjoy at dinner eats smaller fish or shellfish larvae, which in turn eat smaller organisms at the planktonic size level. The smallest creatures have the least ability to tolerate higher acidity, as will be explained below.
Under the premise that a picture is worth a thousand words, the graphic on the next page shows the chemical steps for how carbon dioxide turns into carbonic acid in the ocean waters. The final step shows carbonic acid molecules. This is a weak acid (compared to sulfuric acid or hydrochloric acid), but it does the job to make it more difficult for animals to extract calcium from seawater to make calcium carbonate shells, because this acid will dissolve that material. Early stages of shell development use aragonite, a form of calcium carbonite more susceptible to corrosion than calcite, a crystal form of calcite used more by the adults. The process is especially challenging for larval or juvenile marine shell (mollusks) or carapace (crab, shrimp) builders, since the ratio of a larval animal shell to its total body (the part doing that chemical work to make a hard part) is poor (shell area needed vs. body having to manufacture shell). As the animal grows, this ratio improves, and there is more body vs. shell to be made, but if juveniles cannot survive, the species fails. This ratio is one reason oyster growers in Pacific County are raising oyster larvae and spat in on‐shore hatcheries until they reach a certain size. But for wild species, there is no solution to the ocean chemistry problem.
The graphic is from NOAA’s Pacific Marine Environmental laboratory and on several other websites, but see http://oceanacidification.noaa.gov/OurChangingOcean.aspx. Per this website, annually 2.5 billion metric tonnes of additional carbon enters the ocean in the form of CO2, equivalent to 11 million railroad hopper cars filled with coal, which would circle the Earth 14 times.
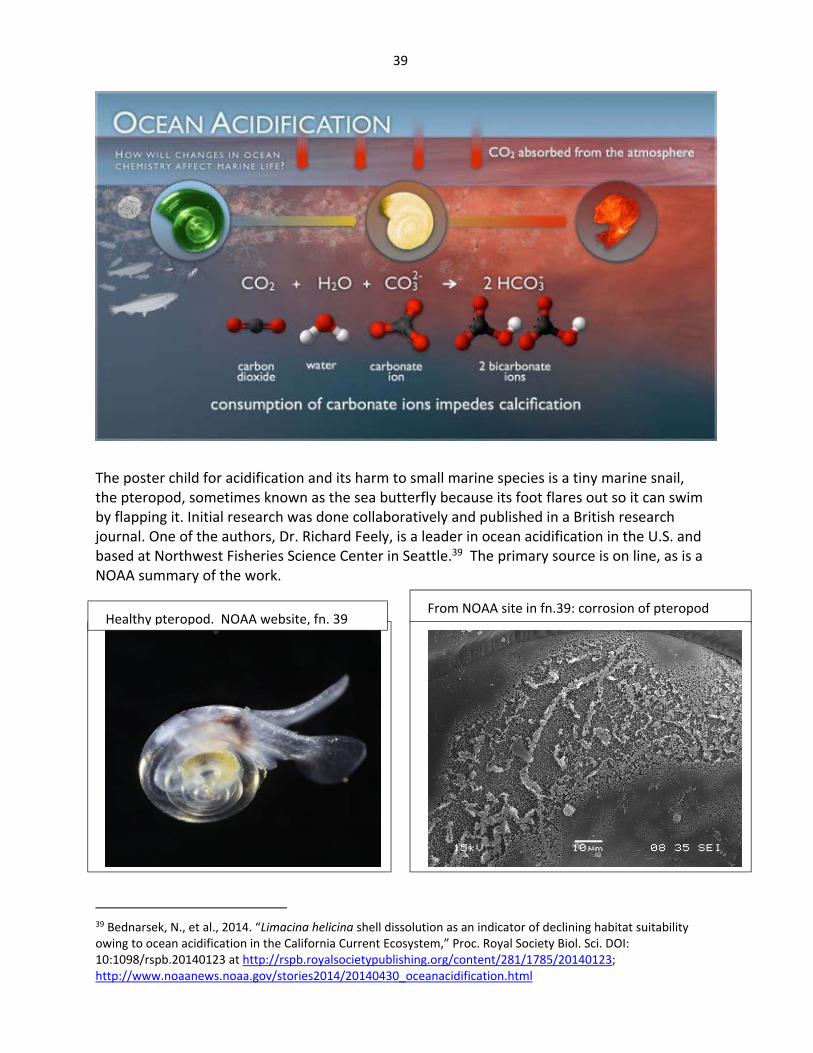
39
The poster child for acidification and its harm to small marine species is a tiny marine snail, the pteropod, sometimes known as the sea butterfly because its foot flares out so it can swim by flapping it. Initial research was done collaboratively and published in a British research journal. One of the authors, Dr. Richard Feely, is a leader in ocean acidification in the U.S. and based at Northwest Fisheries Science Center in Seattle.39 The primary source is on line, as is a NOAA summary of the work.
39 Bednarsek, N., et al., 2014. “Limacina helicina shell dissolution as an indicator of declining habitat suitability owing to ocean acidification in the California Current Ecosystem,” Proc. Royal Society Biol. Sci. DOI: 10:1098/rspb.20140123 at http://rspb.royalsocietypublishing.org/content/281/1785/20140123; http://www.noaanews.noaa.gov/stories2014/20140430_oceanacidification.html
From NOAA site in fn.39: corrosion of pteropod Healthy pteropod. NOAA website, fn. 39
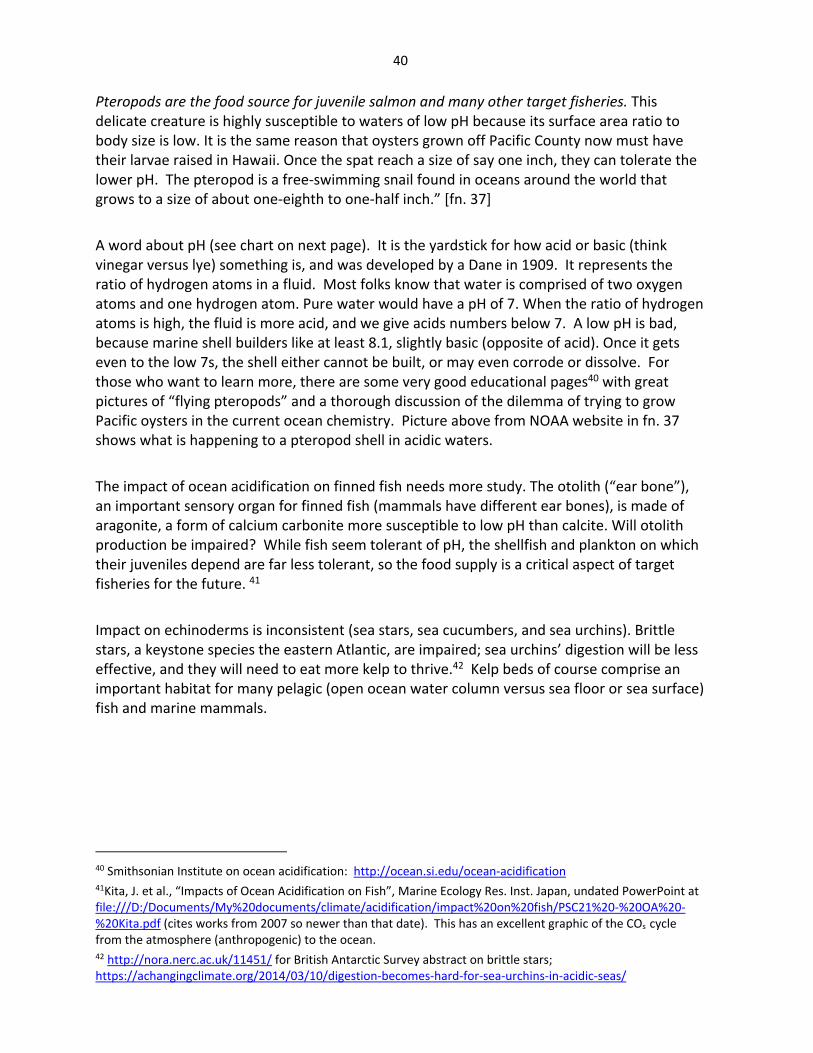
40
Pteropods are the food source for juvenile salmon and many other target fisheries. This delicate creature is highly susceptible to waters of low pH because its surface area ratio to body size is low. It is the same reason that oysters grown off Pacific County now must have their larvae raised in Hawaii. Once the spat reach a size of say one inch, they can tolerate the lower pH. The pteropod is a free‐swimming snail found in oceans around the world that grows to a size of about one‐eighth to one‐half inch.” [fn. 37]
A word about pH (see chart on next page). It is the yardstick for how acid or basic (think vinegar versus lye) something is, and was developed by a Dane in 1909. It represents the ratio of hydrogen atoms in a fluid. Most folks know that water is comprised of two oxygen atoms and one hydrogen atom. Pure water would have a pH of 7. When the ratio of hydrogen atoms is high, the fluid is more acid, and we give acids numbers below 7. A low pH is bad, because marine shell builders like at least 8.1, slightly basic (opposite of acid). Once it gets even to the low 7s, the shell either cannot be built, or may even corrode or dissolve. For those who want to learn more, there are some very good educational pages40 with great pictures of “flying pteropods” and a thorough discussion of the dilemma of trying to grow Pacific oysters in the current ocean chemistry. Picture above from NOAA website in fn. 37 shows what is happening to a pteropod shell in acidic waters.
The impact of ocean acidification on finned fish needs more study. The otolith (“ear bone”), an important sensory organ for finned fish (mammals have different ear bones), is made of aragonite, a form of calcium carbonite more susceptible to low pH than calcite. Will otolith production be impaired? While fish seem tolerant of pH, the shellfish and plankton on which their juveniles depend are far less tolerant, so the food supply is a critical aspect of target fisheries for the future. 41
Impact on echinoderms is inconsistent (sea stars, sea cucumbers, and sea urchins). Brittle stars, a keystone species the eastern Atlantic, are impaired; sea urchins’ digestion will be less effective, and they will need to eat more kelp to thrive.42 Kelp beds of course comprise an important habitat for many pelagic (open ocean water column versus sea floor or sea surface) fish and marine mammals.
40 Smithsonian Institute on ocean acidification: http://ocean.si.edu/ocean‐acidification 41Kita, J. et al., “Impacts of Ocean Acidification on Fish”, Marine Ecology Res. Inst. Japan, undated PowerPoint at file:///D:/Documents/My%20documents/climate/acidification/impact%20on%20fish/PSC21%20‐%20OA%20‐%20Kita.pdf (cites works from 2007 so newer than that date). This has an excellent graphic of the COs cycle from the atmosphere (anthropogenic) to the ocean. 42 http://nora.nerc.ac.uk/11451/ for British Antarctic Survey abstract on brittle stars; https://achangingclimate.org/2014/03/10/digestion‐becomes‐hard‐for‐sea‐urchins‐in‐acidic‐seas/
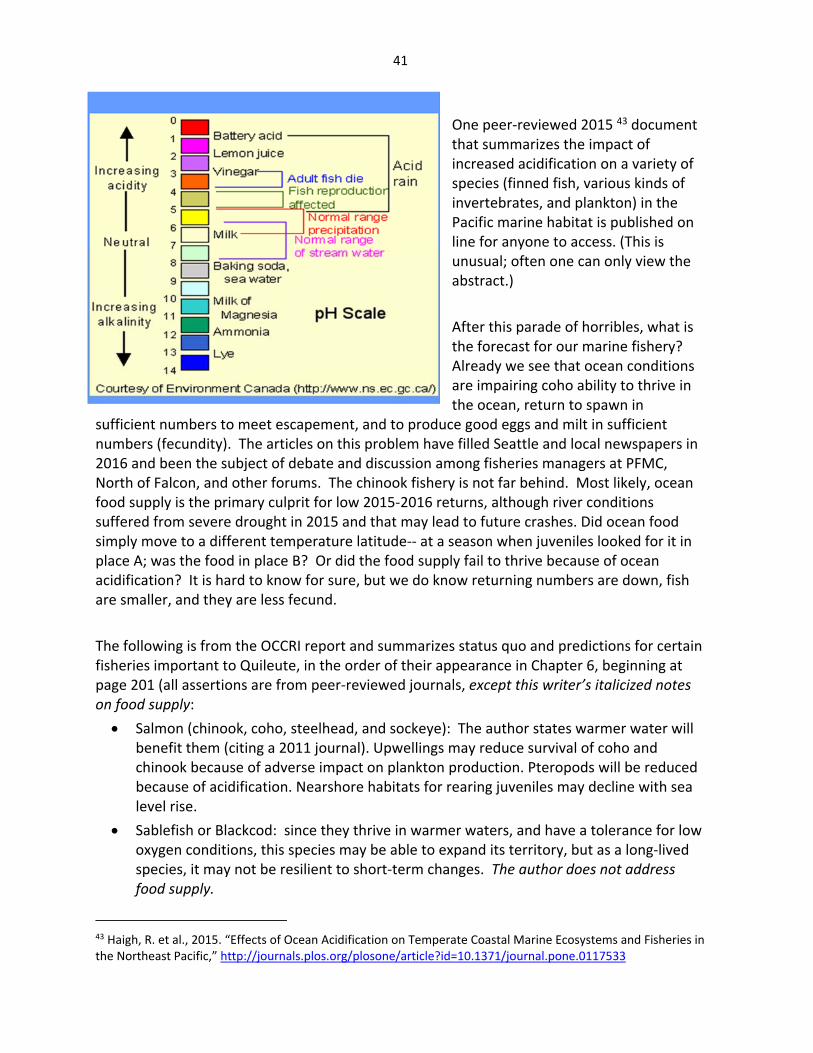
41
One peer‐reviewed 2015 43 document that summarizes the impact of increased acidification on a variety of species (finned fish, various kinds of invertebrates, and plankton) in the Pacific marine habitat is published on line for anyone to access. (This is unusual; often one can only view the abstract.)
After this parade of horribles, what is the forecast for our marine fishery? Already we see that ocean conditions are impairing coho ability to thrive in the ocean, return to spawn in
sufficient numbers to meet escapement, and to produce good eggs and milt in sufficient numbers (fecundity). The articles on this problem have filled Seattle and local newspapers in 2016 and been the subject of debate and discussion among fisheries managers at PFMC, North of Falcon, and other forums. The chinook fishery is not far behind. Most likely, ocean food supply is the primary culprit for low 2015‐2016 returns, although river conditions suffered from severe drought in 2015 and that may lead to future crashes. Did ocean food simply move to a different temperature latitude‐‐ at a season when juveniles looked for it in place A; was the food in place B? Or did the food supply fail to thrive because of ocean acidification? It is hard to know for sure, but we do know returning numbers are down, fish are smaller, and they are less fecund.
The following is from the OCCRI report and summarizes status quo and predictions for certain fisheries important to Quileute, in the order of their appearance in Chapter 6, beginning at page 201 (all assertions are from peer‐reviewed journals, except this writer’s italicized notes on food supply:
Salmon (chinook, coho, steelhead, and sockeye): The author states warmer water will benefit them (citing a 2011 journal). Upwellings may reduce survival of coho and chinook because of adverse impact on plankton production. Pteropods will be reduced because of acidification. Nearshore habitats for rearing juveniles may decline with sea level rise.
Sablefish or Blackcod: since they thrive in warmer waters, and have a tolerance for low oxygen conditions, this species may be able to expand its territory, but as a long‐lived species, it may not be resilient to short‐term changes. The author does not address food supply.
43 Haigh, R. et al., 2015. “Effects of Ocean Acidification on Temperate Coastal Marine Ecosystems and Fisheries in the Northeast Pacific,” http://journals.plos.org/plosone/article?id=10.1371/journal.pone.0117533
42
Rockfish species: Some are listed under the Endangered Species Act (ESA). Their abundance declines in warm phases of the Pacific Decadal Oscillation (“PDO”, large‐scale oscillation of temperature in mid‐latitudes, over 20‐30 years). Upwellings also lead to declines. Some species are tolerant of increased hypoxia. No discussion of their food supply or juvenile stage needs.
Halibut: Recruitment “thrives in warm PDO conditions”. No discussion of food supply or hypoxia. No discussion of juvenile stage needs.
Sardines: the author discusses them with respect to Quinault and notes they do well in warm PDO phases and may increase in such environments. No discussion of their food supply.
Lingcod: Washington coastal tribes rarely see their eggs on washed up kelp anymore. Lingcod thrive from a diet of herring eggs in eelgrass, which may benefit from more carbon dioxide in the water but may also suffer from warmer temperatures. Appears lingcod need herring eggs and their fate is tied to that of herring.44
Smelt (Forage fish): Author discusses all three that are not listed —surf smelt, night smelt, and longfin smelt. Eulachon is now listed as threatened under the ESA. All three tribes are noting a decline, especially surf smelt. Sea level rise could cause a loss of habitat for spawning surf smelt. “Eulachon is sensitive to shifts in spring freshets” (at p. 202). No discussion of the food supply or juvenile stage needs.
Pacific herring: This forage fish prefers cooler waters. It is also actively preyed on by Pacific hake (sometimes called whiting) in Canada’s Pacific. Eggs have not been seen in eelgrass for years. Food supply not discussed, nor demands of juvenile stage.
Pacific hake: They could expand their range northward in warming conditions. No discussion of food other than herring eggs, above. Juvenile needs unknown. (Requires large vessels for harvest; Quileute does not engage in this fishery at present.)
Anchovies: This forage fish is food for people, birds, marine mammals, and other fish. They are still abundant but prefer cool conditions. No other conditions discussed.
Data gaps in this marine chapter include impacts on the food chain of the specific fisheries, and on their juvenile or larval stages, which may be more susceptible to ocean acidification. Further, Dungeness crab is mentioned as commercially important, but is not discussed.
Recent research (2016) out of Northwest Fisheries Science Center in Seattle has just been completed on Dungeness crab.45 The authors note how critical larval health of these crabs is
44 Shaffer, Anne, et. al., 2004, Native American Traditional and Contemporary Knowledge of the Northern Olympic Peninsula Nearshore, published by Olympic Peninsula Intertribal Cultural Advisory Committee (Kingston, WA) and Coastal Watershed Institute (Port Angeles, WA). See especially p. 21‐22. http://www.coastalwatershedinstitute.org/media/nearshore$20studynomaps.pdf 45 http://link.springer.com/article/10.1007%2Fs00227‐016‐2883‐1 Only the abstract is on line for free. One author, Paul McElhany, gave us the full article. J. Miller, M. Maher, E. Bohaboy, C. Friedman and P. McElhany: “Exposure to low pH reduces survival and delays development in early life stages of Dungeness crab, C. magister”, in Marine Biology, 2016, 163:118.
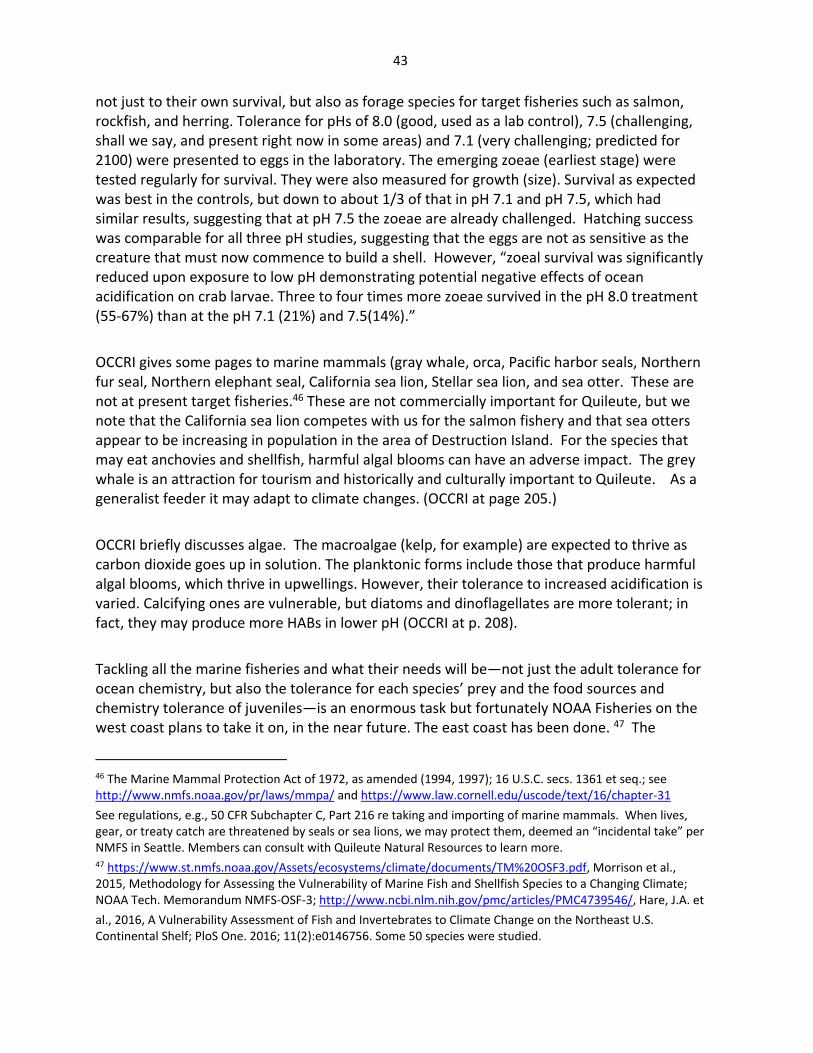
43
not just to their own survival, but also as forage species for target fisheries such as salmon, rockfish, and herring. Tolerance for pHs of 8.0 (good, used as a lab control), 7.5 (challenging, shall we say, and present right now in some areas) and 7.1 (very challenging; predicted for 2100) were presented to eggs in the laboratory. The emerging zoeae (earliest stage) were tested regularly for survival. They were also measured for growth (size). Survival as expected was best in the controls, but down to about 1/3 of that in pH 7.1 and pH 7.5, which had similar results, suggesting that at pH 7.5 the zoeae are already challenged. Hatching success was comparable for all three pH studies, suggesting that the eggs are not as sensitive as the creature that must now commence to build a shell. However, “zoeal survival was significantly reduced upon exposure to low pH demonstrating potential negative effects of ocean acidification on crab larvae. Three to four times more zoeae survived in the pH 8.0 treatment (55‐67%) than at the pH 7.1 (21%) and 7.5(14%).”
OCCRI gives some pages to marine mammals (gray whale, orca, Pacific harbor seals, Northern fur seal, Northern elephant seal, California sea lion, Stellar sea lion, and sea otter. These are not at present target fisheries.46 These are not commercially important for Quileute, but we note that the California sea lion competes with us for the salmon fishery and that sea otters appear to be increasing in population in the area of Destruction Island. For the species that may eat anchovies and shellfish, harmful algal blooms can have an adverse impact. The grey whale is an attraction for tourism and historically and culturally important to Quileute. As a generalist feeder it may adapt to climate changes. (OCCRI at page 205.)
OCCRI briefly discusses algae. The macroalgae (kelp, for example) are expected to thrive as carbon dioxide goes up in solution. The planktonic forms include those that produce harmful algal blooms, which thrive in upwellings. However, their tolerance to increased acidification is varied. Calcifying ones are vulnerable, but diatoms and dinoflagellates are more tolerant; in fact, they may produce more HABs in lower pH (OCCRI at p. 208).
Tackling all the marine fisheries and what their needs will be—not just the adult tolerance for ocean chemistry, but also the tolerance for each species’ prey and the food sources and chemistry tolerance of juveniles—is an enormous task but fortunately NOAA Fisheries on the west coast plans to take it on, in the near future. The east coast has been done. 47 The
46 The Marine Mammal Protection Act of 1972, as amended (1994, 1997); 16 U.S.C. secs. 1361 et seq.; see http://www.nmfs.noaa.gov/pr/laws/mmpa/ and https://www.law.cornell.edu/uscode/text/16/chapter‐31
See regulations, e.g., 50 CFR Subchapter C, Part 216 re taking and importing of marine mammals. When lives, gear, or treaty catch are threatened by seals or sea lions, we may protect them, deemed an “incidental take” per NMFS in Seattle. Members can consult with Quileute Natural Resources to learn more. 47 https://www.st.nmfs.noaa.gov/Assets/ecosystems/climate/documents/TM%20OSF3.pdf, Morrison et al., 2015, Methodology for Assessing the Vulnerability of Marine Fish and Shellfish Species to a Changing Climate; NOAA Tech. Memorandum NMFS‐OSF‐3; http://www.ncbi.nlm.nih.gov/pmc/articles/PMC4739546/, Hare, J.A. et
al., 2016, A Vulnerability Assessment of Fish and Invertebrates to Climate Change on the Northeast U.S. Continental Shelf; PloS One. 2016; 11(2):e0146756. Some 50 species were studied.
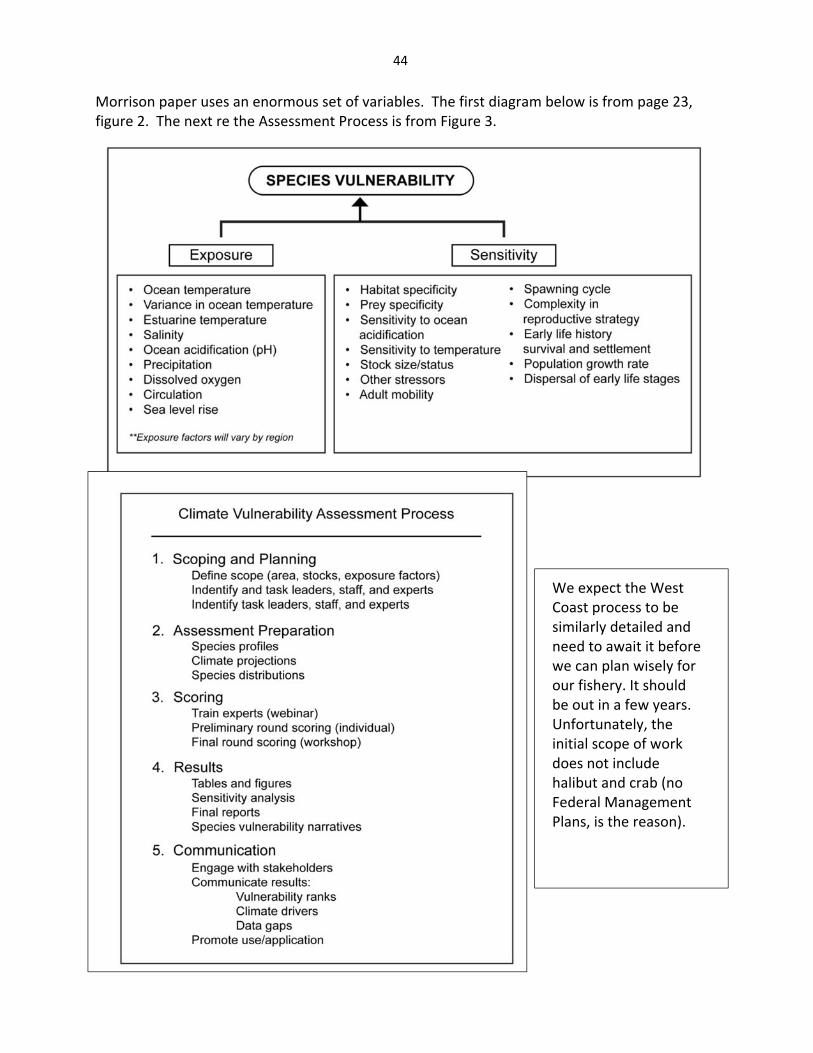
44
Morrison paper uses an enormous set of variables. The first diagram below is from page 23, figure 2. The next re the Assessment Process is from Figure 3.
We expect the West Coast process to be similarly detailed and need to await it before we can plan wisely for our fishery. It should be out in a few years. Unfortunately, the initial scope of work does not include halibut and crab (no Federal Management Plans, is the reason).
45
Recommendations:
For the marine fishery (crab and finned fish discussed above), management becomes increasingly important, and it may well be that allowable bycatch numbers dating from times before impacts of climate change may have to be revisited and revised, for all fisheries. Just as turtle impeders were introduced as turtle numbers dwindled, it may become imperative to use different protocols and to change allowable levels of bycatch. Fishing seasons have always been a means to protect and preserve species. Because tribes have such limited areas in which to fish, geographically, marine protected areas have drawbacks. Inside the Usual and Accustomed treaty area “(U&A”) they curtail fishing opportunity and directly outside a U&A they impact fishing pressures. However, there may be a time when they should be revisited.
For anadromous fish, attention to improvement of riverine habitat and nearshore continues to be important. Means of assuring shade in riparian zones and maintaining fish passages, are two examples. In‐river management becomes increasingly important, and conservation regulations may need to be used. It may be prudent to purchase or lease more land up‐river to create cold‐water rearing ponds. Continue to monitor for water quality to evaluate in particular the temperature, pH, and sediment load of the streams. One source of ocean acidification is fresh waters, which bring higher pH to the ocean.
It may be prudent to even consider warm‐water non‐anadromous fish hatcheries (e.g., tilapia48) to assure a food supply for coming generations. Various species of shrimp are tolerant of higher than present average temperatures and less stringent water quality than most fish.
Quileute depends on the nearshore for subsistence harvest of clams, mussels, and smelt. The nearshore is vital as a place where juvenile stages of major open water fisheries rear in relative safety before entering the open ocean, where larger fish may prey on them. It is also a zone where forage fish lay eggs. This is an area most subject to storms and to sea level rise. Since the latter is slow, the sessile (fixed to rocks or living on sea floor) creatures in theory can migrate up the shoreline. However, whether the habitat is hospitable is another matter, since the current shoreline has been affected by eons of erosion and geomorphic shaping that may not provide a suitable setting for species as water rises. It is important at all times to avoid smothering by sediment. This goes back to improvement of the watershed, upstream (under anadromous fish). If storms and increased precipitation bring in more sediment from river
48 It is beyond the scope of this Plan to pursue what non‐native fish may be appropriate to farm to compensate for diminishing local native species. However, tilapia (a member of the cichlid family) was suggested because it is a freshwater fish, tolerant of warmer waters, and if it escapes into colder Pacific waters, it would not survive. Presently third in aquaculture production after carp and salmon, tilapia is a good source of protein and mature in 6‐7 months. They are omnivorous and tolerant of dense stocking and can be raised in containments such as tanks or channels. See. Generally, https://en.wikipedia.org/wiki/Aquaculture_of_tilapia, although clearly if one goes this route commercially, more authoritative sources are advisable.
46
systems, this may smother some species. Quileute elders have seen this impact on kelp beds, from the Quillayute River sediment loading, after heavy timber harvests in the past several decades. 49
Recommendation: Monitoring for harmful algal blooms should be continued, in order to evaluate the safe consumption of the traditional shellfish harvest. Monitoring for forage fish eggs is also critical and should be continued, to evaluate if these fish can continue to thrive in a changing ocean chemistry. As the bottom of the food chain they are a critical factor in climate change planning. Grant writing opportunities provide some means for effecting the improvements to habitat.
However, managerial practices are equally important. In‐person participation in meetings becomes more essential as controversial regulatory practices need to be negotiated. These types of negotiations cannot be effectively handled by electronic communication. So travel continues to be important for climate change preparation and adaptation.
As new methods of management evolve, training to implement them will be essential as well.
Impact on Infrastructure/Facilities (from climate, not from events such as tsunamis)
To a large extent, this topic is the domain of the planning department, and has already been considered, in documents like the 2015 Hazard Mitigation Plan completed for the tribe by contractors (http://www.quileutenation.org/natural‐resources). Additionally, while a section of the 2016 OCCRI report covers Coastal Hazards in Chapter 5, OCCRI is in process creating a report just dealing with Infrastructure Vulnerability.
However, some infrastructure is of immediate importance to the Natural Resources staff, Quileute Natural Resources Policy Committee, and tribal members.
On reservation, important infrastructure includes the resort, the marina, the U.S. Coast Guard facilities, the fish processing plant, the Natural Resources office building, the roads leading to these facilities, and the fish passages (culverts). We presume in the next few years, government buildings and homes will be moved to higher ground, but some of these structures listed are water‐dependent and won’t be moved. Structures near the ocean are subject to rising sea level, although this is a threat that comes upon us relatively slowly and its impact will be most felt in the 22nd Century. Coastal storms are likely to increase; we already see this; and the impact from waves and surges can damage low‐elevation structures like the marina. Increased rainfall in the winter has led to local flooding and may wash out some structures in the harbor. OCCRI’s Infrastructure Report in 2017 will cover some of these risks.
49 Personal communication, Chris Morganroth III.
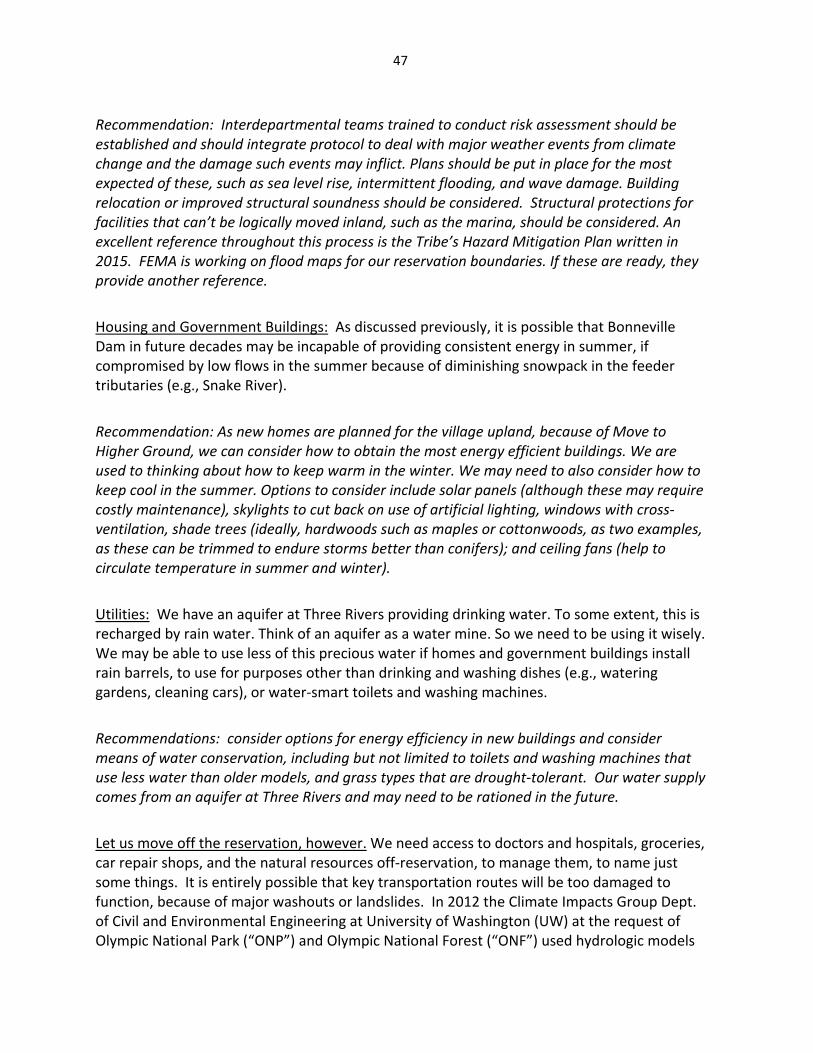
47
Recommendation: Interdepartmental teams trained to conduct risk assessment should be established and should integrate protocol to deal with major weather events from climate change and the damage such events may inflict. Plans should be put in place for the most expected of these, such as sea level rise, intermittent flooding, and wave damage. Building relocation or improved structural soundness should be considered. Structural protections for facilities that can’t be logically moved inland, such as the marina, should be considered. An excellent reference throughout this process is the Tribe’s Hazard Mitigation Plan written in 2015. FEMA is working on flood maps for our reservation boundaries. If these are ready, they provide another reference.
Housing and Government Buildings: As discussed previously, it is possible that Bonneville Dam in future decades may be incapable of providing consistent energy in summer, if compromised by low flows in the summer because of diminishing snowpack in the feeder tributaries (e.g., Snake River).
Recommendation: As new homes are planned for the village upland, because of Move to Higher Ground, we can consider how to obtain the most energy efficient buildings. We are used to thinking about how to keep warm in the winter. We may need to also consider how to keep cool in the summer. Options to consider include solar panels (although these may require costly maintenance), skylights to cut back on use of artificial lighting, windows with cross‐ventilation, shade trees (ideally, hardwoods such as maples or cottonwoods, as two examples, as these can be trimmed to endure storms better than conifers); and ceiling fans (help to circulate temperature in summer and winter).
Utilities: We have an aquifer at Three Rivers providing drinking water. To some extent, this is recharged by rain water. Think of an aquifer as a water mine. So we need to be using it wisely. We may be able to use less of this precious water if homes and government buildings install rain barrels, to use for purposes other than drinking and washing dishes (e.g., watering gardens, cleaning cars), or water‐smart toilets and washing machines.
Recommendations: consider options for energy efficiency in new buildings and consider means of water conservation, including but not limited to toilets and washing machines that use less water than older models, and grass types that are drought‐tolerant. Our water supply comes from an aquifer at Three Rivers and may need to be rationed in the future.
Let us move off the reservation, however. We need access to doctors and hospitals, groceries, car repair shops, and the natural resources off‐reservation, to manage them, to name just some things. It is entirely possible that key transportation routes will be too damaged to function, because of major washouts or landslides. In 2012 the Climate Impacts Group Dept. of Civil and Environmental Engineering at University of Washington (UW) at the request of Olympic National Park (“ONP”) and Olympic National Forest (“ONF”) used hydrologic models
48
to estimate 100 year flooding in our area. 50 This paper is written for engineers and is full of higher mathematics. But just from the introduction:
“A key component of management on the Olympic Peninsula involves maintaining the network of
roads. Most of the 2180 miles (3500 km) of roads in the ONF were designed and built between 1950 and 1980 for logging purposes and are currently outdated. Within the National Park boundaries, over 140 miles (225 km) have been built for visitor use. The roads located near rivers, particularly those requiring a culvert to cross water, are at an increasing risk of inundation damage as future flooding intensifies. Any road infrastructure in disrepair near streams and rivers also threatens to impair the habitat of aquatic animals, including [salmon.] … Road management uses the Q100 (or the peak flow with an estimated 100 year return frequency) as the standard gauge for stream crossing design. In the past the historical streamflow record has been used to calculate flood frequency and magnitude statistics; however, under the projections of a changing climate, the baseline for this metric is expected
to shift.”
The authors used an “extremes toolkit” developed by the National Center for Atmospheric Research.51
Although the worst flooding escalation is projected for the NE Peninsula, our NW corner is not without
consequences. “Higher winter peak flows are detrimental to overwintering salmon redds because they
become more prone to scour. Furthermore, depending on the timing of peak flows, juvenile salmon and
parr could get washed downstream before they are ready to migrate. In terms of road infrastructure,
increased flood magnitudes, regardless of timing, could trigger more wash outs and overtopping of
culverts for roads near these rivers and their tributaries. Such occurrences could further exacerbate the
impairment to aquatic habitats for fish.” (Tohver et al., p. 14). And we may experience historic low
flows in the summer, by 2080 (but showing as early as 2020; at p. 17). The authors did not study the
Quillayute because it is not inside the geographic boundaries of the federal lands emphasized for the
study, but based on the Quinault and Queets Rivers, we are in for some major flooding in the coming
decades, as well as periods of drought. Interested persons can open the document in fn. 42 and explore
the figures/charts. From the conclusion at page 30: “The hydrologic modeling studies carried out
during this study project increased winter flood risk over essentially all of the Olympic Peninsula due to
increased winter precipitation and warmer temperatures. Most low‐lying areas show about a 10%
increase in Q100 by the 2040s…”
Recommendation: The tribe needs to consider how to maintain as much food and water independence as possible, since some roads or bridges may wash out, making access to Port Angeles or Aberdeen difficult.
50 http://cses.washington.edu/db/pdf/tohveretalolympic818.pdf; 4/9/2012, I.Tohver et al., “Using Physically Based Hydrology Models to Improve Fine‐Scale Estimates of Q100 in Complex Mountain Terrain, CIG, Dept. of Civil and Environmental Engineering, University of WA. 51 http://www.assessment.ucar.edu/toolkit/
49
Cultural impacts
A separate database of cultural references has been prepared under a component of EPA funding through 2016 (Traditional Ecological Knowledge, contracted out to WillametteCRA of Seattle). However, with respect to vulnerability, it is important to note that all traditional tribal foods and materials derived from living plants and animals are deemed cultural by tribes.
Shifting to different food sources is not viewed favorably. That having been said, some food sources are in peril, especially salmonids and nearshore shellfish species. Local elk may face food shortages. Some plants may face competition from invasive species, as well, and can be adversely impacted from changes in hydrological cycles. We may see new species of insects arrive that are harmful to plants we relied on, as well. The forests will be more vulnerable to forest fires.
Recommendations: Establish hatcheries where feasible for non‐anadromous fish or for shellfish (some kinds can be grown in hatcheries; e.g., shrimp species tolerant of various temperatures and salinity variances). Acquire lands to potentially maintain herds of game or to grow berry bushes. Use Northwest Indian College reference books to establish gardens of native or naturalized plants for food and medicinal purposes and hold classes on how to harvest and prepare these plants. Possibly a grant can be proposed to train tribal staff and members at Northwest Indian College, which offers classes.
50
APPENDIX
RECOMMENDATIONS FROM THIS PLAN
Page Recommendation
8 Build a team that addresses climate change and how to prepare for it, as an interdepartmental and active committee.
12 Re politics and solving tribal cultural needs that can be compromised by climate change, keep our toe in the political water as much as time and funds permit, to be sure our needs are politically addressed. We do have the access, on paper (the treaty), already.
14 Consider what foods are culturally important to maintain for food or medicine, perhaps by gardens or greenhouses. Northwest Indian College in Bellingham is a resource.
15 To reduce threats from rising sea water and coastal storms, move structures upland or protect with dikes or jetties. Support integrity of coastal dunes by saving the drift logs.
20 To secure a supply of trees we value (e.g., cedar or yew), purchase a nearby tract of land and either grow the desired species or maintain them if already on this land.
21 It is advisable to own or lease a nearby tract of land to grow medicinal or food plants, in the event of compromised transportation to stores.
21 To secure access to elk or deer, obtain nearby land on which to raise them (Coeur d’Alene does this for elk; Shoshone‐Bannock does this for buffalo).
21 Continue to work with Clallam County Noxious Weed Control Board to treat and control invasive weeds; e.g., Scotch broom, reed canary grass, tansy ragwort, or knotweed species (see fn. 32). These threaten the welfare of species Quileute values.
32 Work with Salmon Recovery Groups to fund updating the NetMaps and with state agencies presenting new engineering ideas for effective stream maintenance.
45 Within intergovernmental committees, work to control bycatch numbers for salmon in the marine fisheries. Similarly, work to reduce creation of no‐fish zones that put unfair pressure on our limited fishing area (the Usual and Accustomed treaty area I ocean).
45 For anadromous fish (salmonids), continue to work for improvement of their habitat. Continue to monitor water quality.
45 Consider acquisition of land to establish a warmer‐water freshwater non‐anadromous and non‐native hatchery fish, such as tilapia, as an alternative food source controlled by the tribe, as salmon habitat becomes severely challenged by climate change.
46 Monitoring for harmful algal blooms is critical to advise on safe shellfish consumption.
46 Monitoring for forage fish spawning advises us on nearshore health for juvenile salmonids.
46 Continue to participate in intergovernmental meetings regarding regulatory practices to provide for climate change adaptation.
51
46 Continue to engage in training and seminars to remain current regarding climate change knowledge and adaptation practices.
46 Interdepartmental teams at Quileute should engage in risk assessment to develop protocol to deal with increased sea level rise, wave damage, and flooding. Structures that can be moved inland (not water dependent), should be included in the Move to Higher Ground Plan. Work with FEMA; resource the tribe’s 2015 Hazard Mitigation Plan.
47 New housing should consider energy independence (e.g., solar panels) and if that is not feasible, also consider skylights, cross‐ventilation shade trees, and ceiling fans, to reduce use of energy.
47 New housing should consider water‐efficient toilets, washing machines, and plants tolerant of drought in the gardens. Some garden supply places sell grass seed that produces drought‐tolerant lawns. Research to date predicts drier summers in the future. The tribe’s water supply comes from an aquifer at Three Rivers.
48 As a summation, the tribe needs to consider how to maintain as much food and water independence as possible, since some roads or bridges may wash out, making access to Port Angeles or Aberdeen difficult.
48 As a summation, establish hatcheries where feasible for non‐anadromous fish or for shellfish (some kinds can be grown in hatcheries; e.g., shrimp species tolerant of various temperatures and salinity variances). Acquire lands to potentially maintain herds of elk or to grow berry bushes. Use NW Indian College reference books to establish gardens of native or naturalized plants for food and medicinal purposes and hold classes on how to harvest and prepare these plants. Possibly a grant can be proposed to train individuals at NW Indian College, which offers classes.
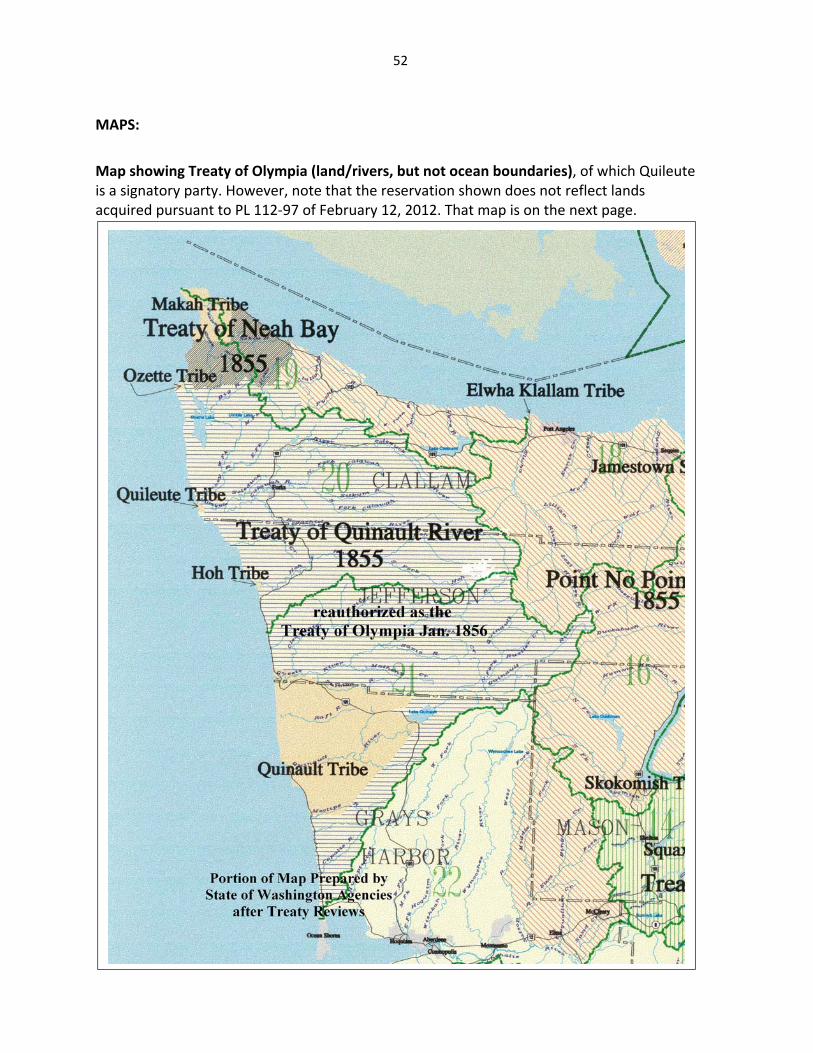
52
MAPS:
Map showing Treaty of Olympia (land/rivers, but not ocean boundaries), of which Quileute is a signatory party. However, note that the reservation shown does not reflect lands acquired pursuant to PL 112‐97 of February 12, 2012. That map is on the next page.
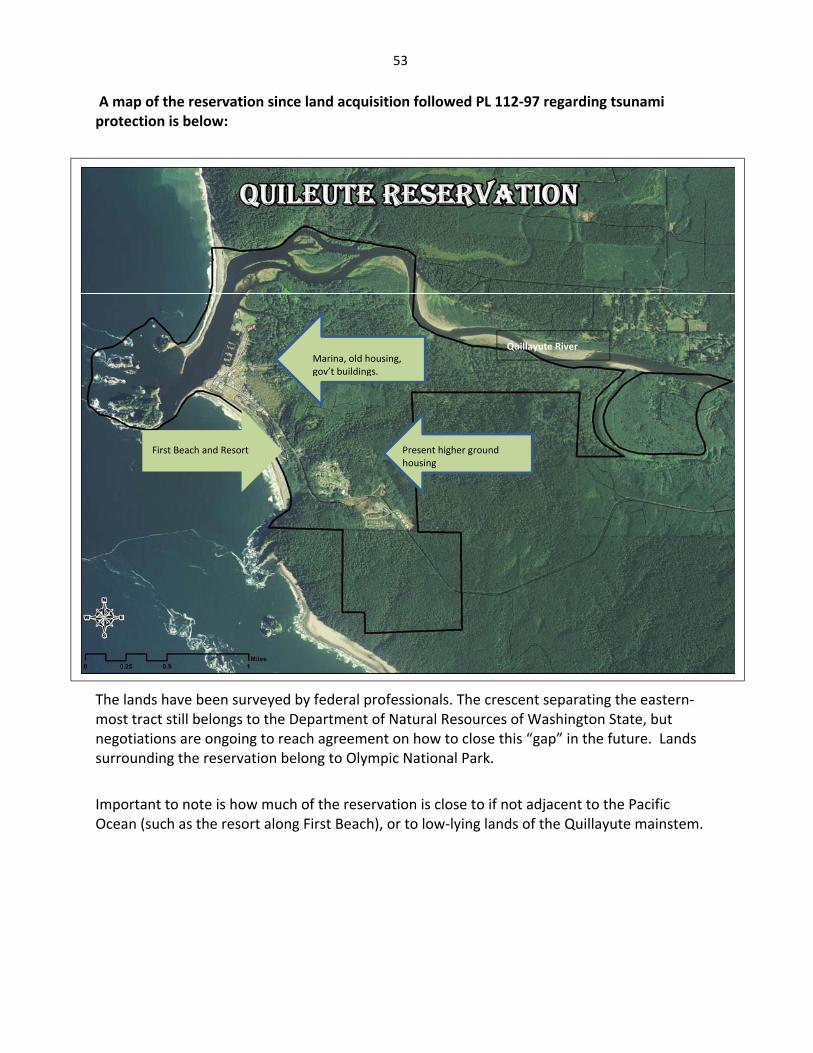
53
A map of the reservation since land acquisition followed PL 112‐97 regarding tsunami protection is below:
The lands have been surveyed by federal professionals. The crescent separating the eastern‐most tract still belongs to the Department of Natural Resources of Washington State, but negotiations are ongoing to reach agreement on how to close this “gap” in the future. Lands surrounding the reservation belong to Olympic National Park.
Important to note is how much of the reservation is close to if not adjacent to the Pacific Ocean (such as the resort along First Beach), or to low‐lying lands of the Quillayute mainstem.
First Beach and Resort Present higher ground housing
Marina, old housing, gov’t buildings.
Quillayute River
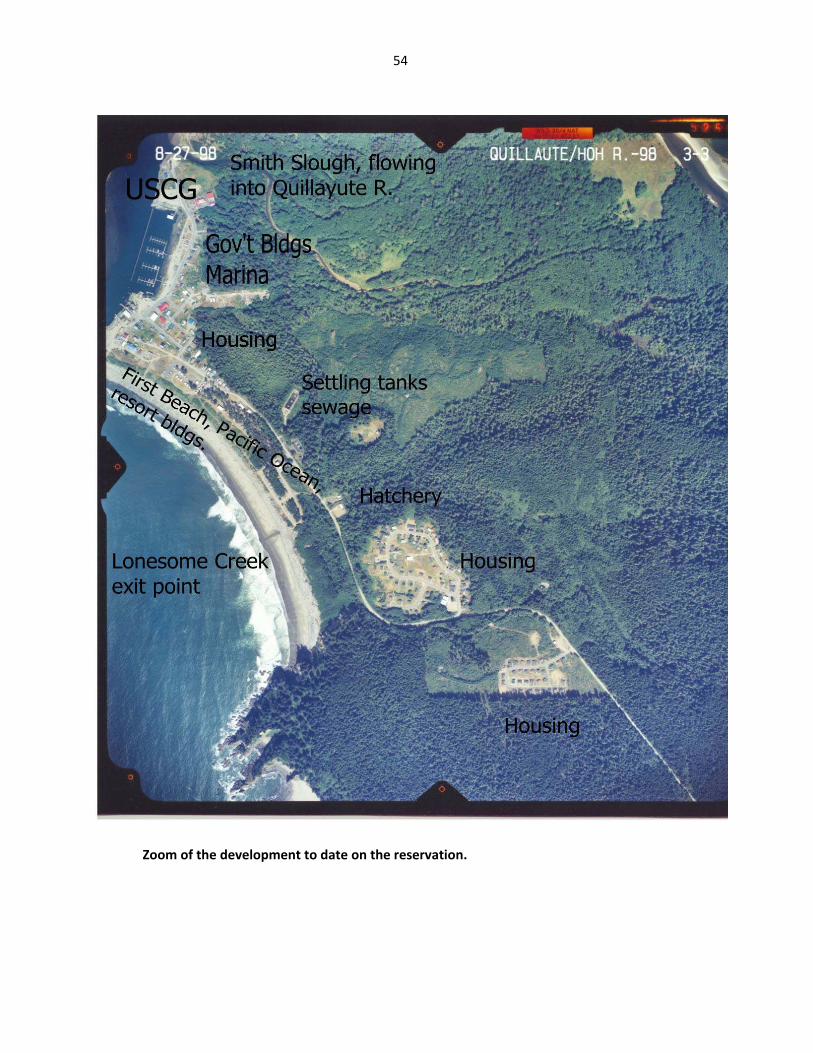
54
Zoom of the development to date on the reservation.
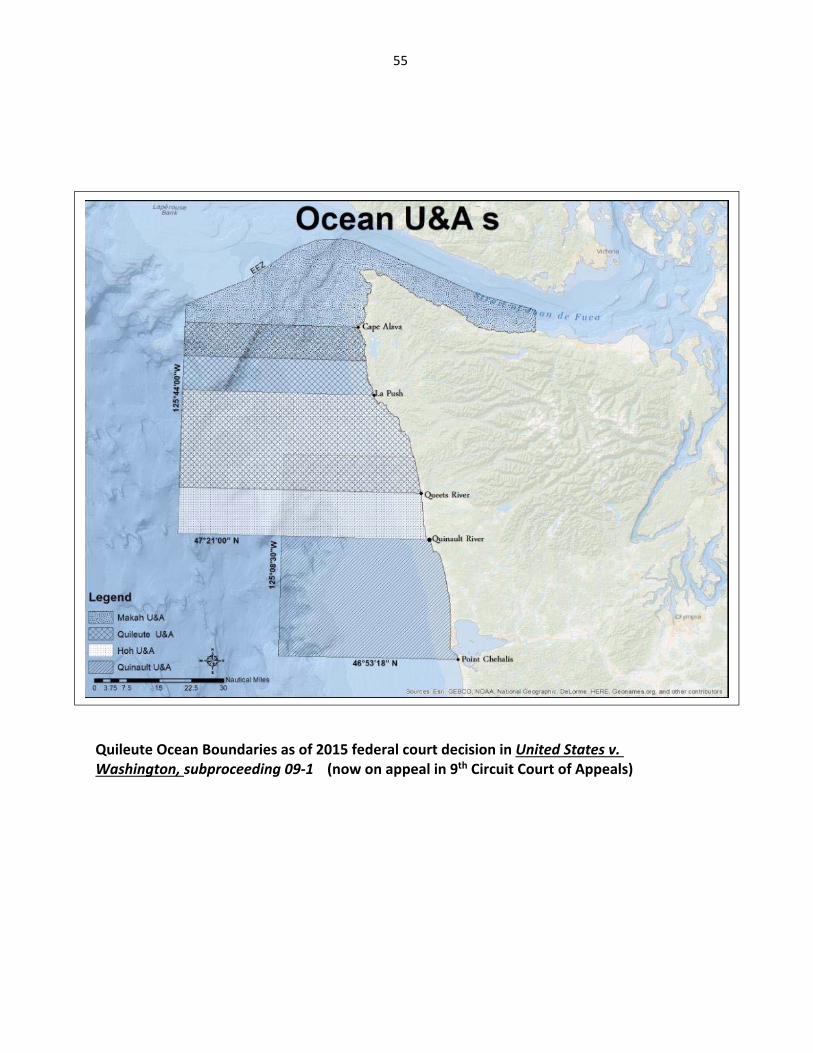
55
Quileute Ocean Boundaries as of 2015 federal court decision in United States v. Washington, subproceeding 09‐1 (now on appeal in 9th Circuit Court of Appeals)
56
Research to Correct the Planet: some good news
It would seem that climate events are happening at such a massive scale, that we really cannot reverse or improve on the situation, only adapt and/or prepare. However, there is research ongoing to change behavior and improve on our carbon dioxide emissions and what they are doing to planetary chemistry.
Let’s look at concrete. Manufacturing it leaves a big environmental footprint, because one must heat limestone, and in chemical processes it emits 80% of its weight in carbon dioxide. This actually 5% of human emissions of this gas, annually (because of roads, bridges, and buildings). However, instead of creating emissions, one can actually sequester recycled carbon dioxide. A Canadian company, CarbonCure Technologies, has developed a process to inject waste carbon dioxide into the concrete mix without compromising its strength. It forms a limestone and assists in bonding the concrete and the end product is strong but actually lighter weight. This was demonstrated at UCLA for a recent conference. 52
In Iceland, a power plant has turned carbon emissions into stone by injecting it into the earth, where in the presence of water and basalt (a volcanic rock), a natural chemical reaction occurs and the carbon dioxide becomes chalk, a kind of limestone rock. This is the result of a pilot study called Carbfix begun in 2012 at the Hellisheidi power plant. The process won’t work for all rock types. For example, where tried with porous sandstone in Saskatchewan (coal‐fired plant) there is a potential for gases to escape or migrate and cause minor earthquakes from pressures. But for areas that have basalt in the vicinity of the power plants, it is one solution to sequester carbon dioxide safely, per study co‐author Martin Stute, a hydrologist at Columbia University’s Lamont‐Doherty Earth Observatory. 53
52 http://www.climatecentral.org/news/how‐can‐we‐reduce‐concretes‐carbon‐footprint‐20274
Sometimes news pages do not last; we have this article scanned in our QNR computer. Article by Nate Berg, reprinted from Ensia, 4/24/2016 53 http://phys.org/news/2016‐06‐climate‐mitigation‐co2.html; digest article from Science. http://science.sciencemag.org/content/352/6291/1312.full J.M. Matter et al., Rapid carbon mineralization for permanent disposal of anthropogenic carbon dioxide emissions, Science, 10 Jun 2016, vol. 352, issue 6291, pgs. 1312‐1314, DOI: 10:1126/science.aad8132.
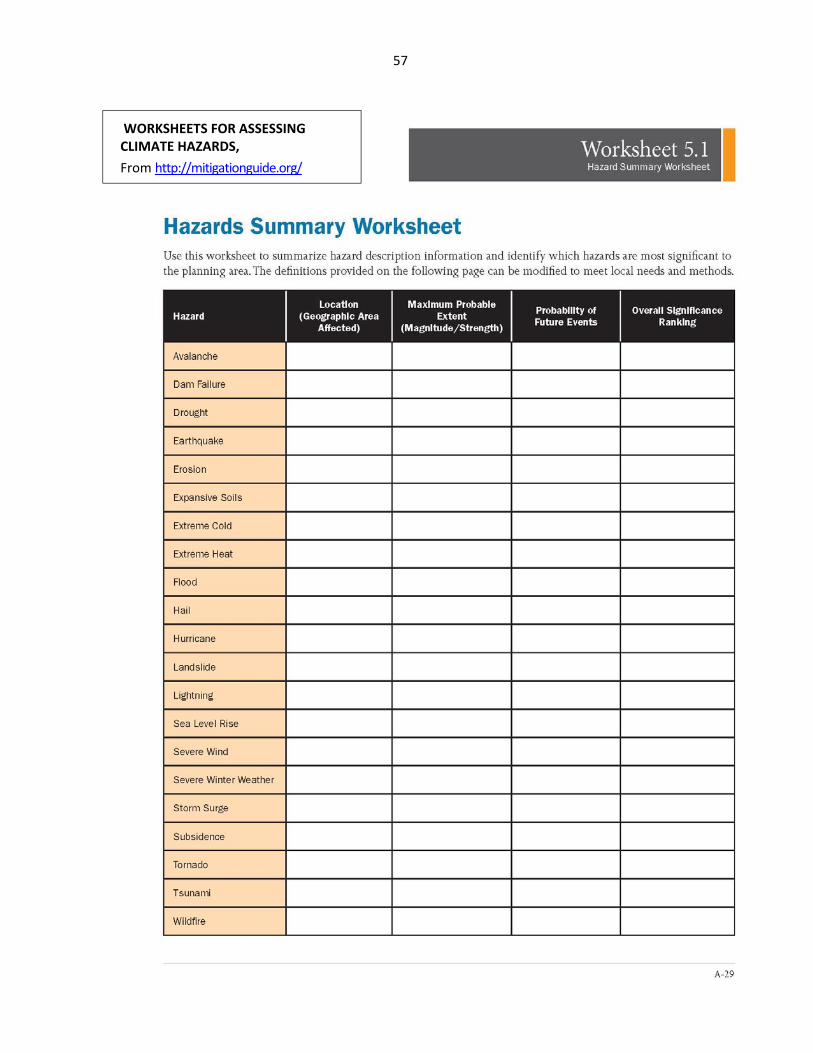
57
WORKSHEETS FOR ASSESSING CLIMATE HAZARDS,
From http://mitigationguide.org/
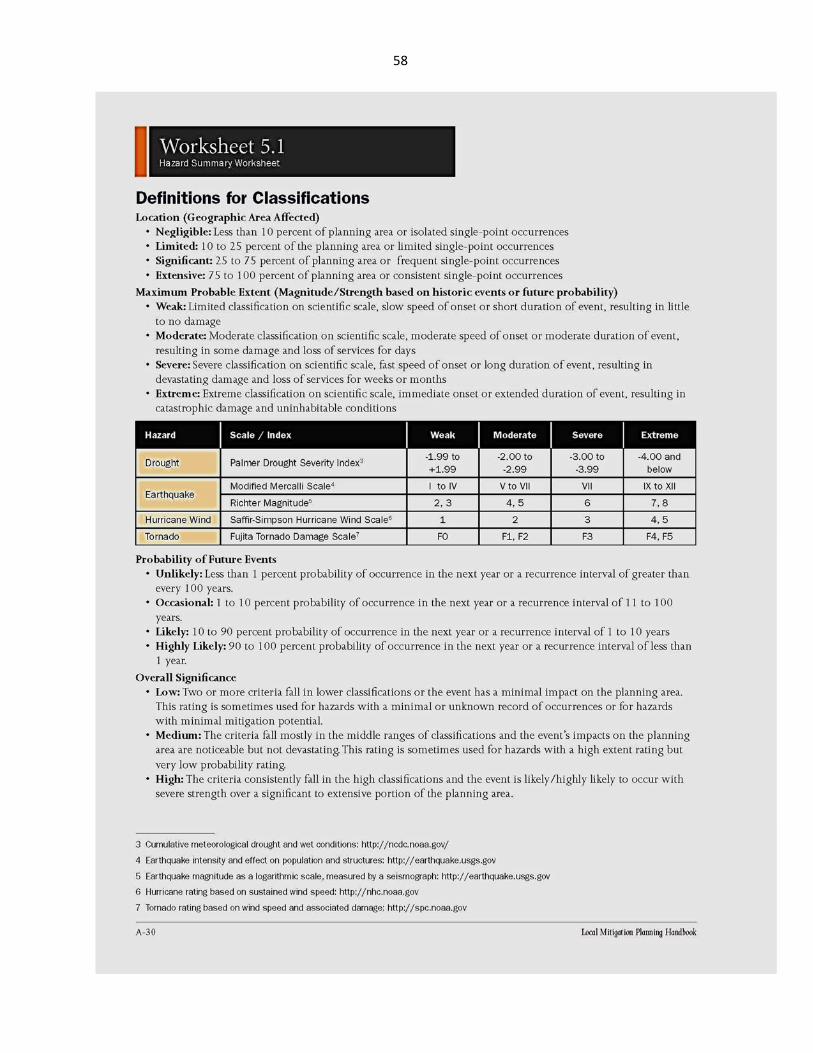
58
59
References and Acknowledgements:
The references appear after usage of the material, either embedded in the text or in footnotes, so won’t be repeated. This writer made an effort to use documents available to the public by Internet, since libraries are remote from our staff, being located in major cities. We also have a number of major references to climate studies and climate plans uploaded on our website, at http://www.quileutenation.org/natural‐resources. That website is subject to change/update as the literature changes; and our plan is also subject to update, as more is known about how climate change impacts us.
Quileute wishes to recognize the Institute for Tribal Environmental Professionals, operating out of Northern Arizona University. Their staff runs programs across the United States, hosted by Native American Tribes in most instances. This writer was able to attend the class offered at Fort Hall, Idaho, home to the Shoshone‐Bannock Tribes, in April of 2016. This class was expressly for those who had already begun and/or had responsibility for a tribe’s climate plan. It was intermediary, not designed for beginners to the process. The interactive method of instruction, which mixed slide shows by peer‐level scientists with group discussions among the tribal professionals attending, allowed for free‐flowing ideas to solve each other’s climate change challenges in a manner better than ever previously experienced. Gestalt (“an organized whole that is more than its sum”) works.
We also thank the tribes that had a head start and produced some excellent plans, made public, that greatly helped to guide our process: Nooksack, Swinomish, and Jamestown S’Klallam in particular.
We appreciate the staff of the Quinault Indian Nation, which wrote the grant awarded to Oregon State University, specifically the Oregon Climate Change Research Institute, on behalf of the Treaty of Olympia Tribes, and we thank the staff of Hoh, Quileute and Quinault that helped OCCRI with that document. Thank you to OCCRI for this work product.
Finally, thanks to Willamette Cultural Research Associates, Ltd. for the Traditional Ecological Knowledge Report, which will be uploaded to the website http://www.quileutenation.org/natural‐resources as a supplement to this Climate Plan.