Embed Size (px)
Citation preview

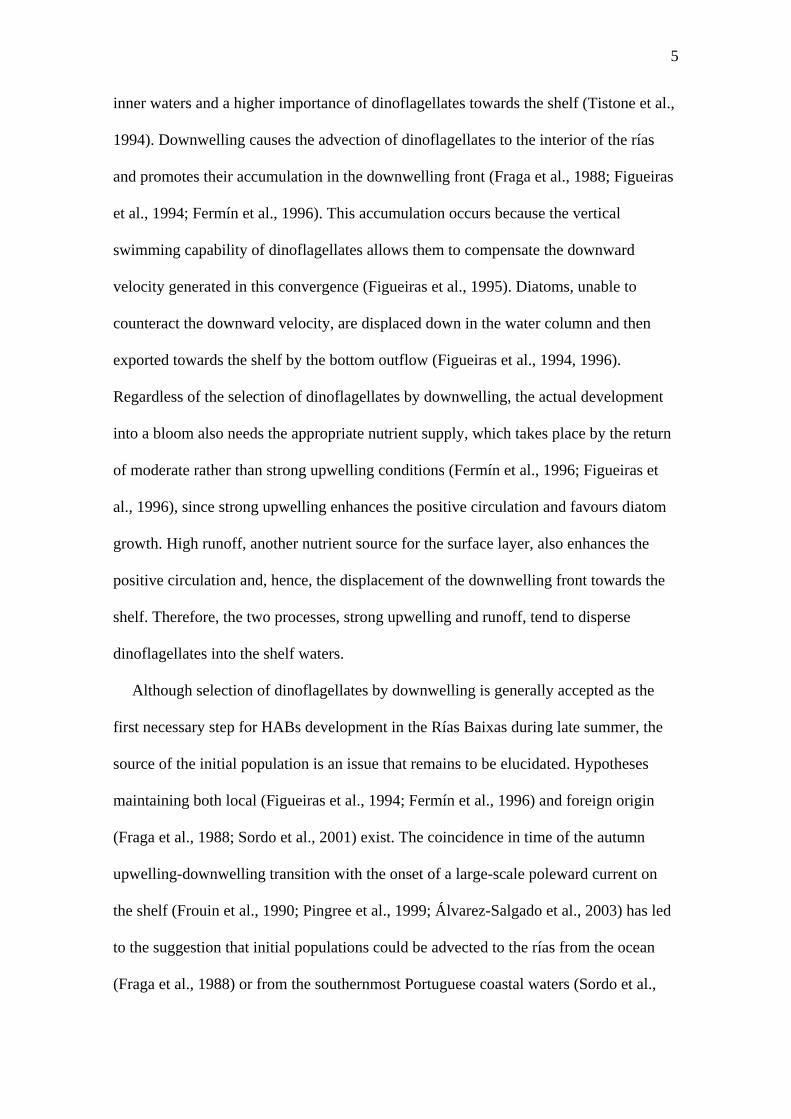
1
Downwelling and dominance of autochthonous
dinoflagellates in the NW Iberian margin: the example
of the Ría de Vigo
B.G. Crespo*, F.G. Figueiras, P. Porras, I.G. Teixeira
Instituto de Investigacións Mariñas, CSIC, Eduardo Cabello 6, 36208 Vigo, Spain
* CORRESPONDING AUTHOR. Tel.: +34986 231930; fax: +34986 292762
E-mail address: [email protected] (B.G. Crespo)

2
Abstract
Dinoflagellate blooms in coastal upwelling systems are restricted to times and places
with reduced exchange and mixing. The Rías Baixas of Galicia are four bays in the NW
Iberian upwelling with these characteristics where harmful algal blooms (HABs) of
dinoflagellates are common. These blooms are especially recurrent at the end of the
upwelling season, when autumn downwelling amplifies accumulation and retention
through the development of a convergence front in the interior of rías. Because oceanic
water enters the rías during downwelling, it has been hypothesised that dinoflagellate
blooms originate by the advection and subsequent accumulation of allochthonous
populations. To examine this possibility, we studied the microplankton succession in
relation to hydrographic variability in the Ría de Vigo (one of these four bays) along an
annual cycle making use of a high sampling frequency. The results indicated that
upwelling lasted from May to August, with downwelling prevailing in winter.
Microplankton during upwelling, although dominated by diatoms, evidenced a
progressive increase in the importance of dinoflagellates, which achieved maximum
abundance at the end of the upwelling season. Thus, diatoms characterised the spring
bloom, while diatoms and autochthonous dinoflagellates composed the autumn bloom.
Diatoms dominated during the first moments of the autumn downwelling and
dinoflagellates were more abundant later, after stronger downwelling removed diatoms
from the water column. Since the dinoflagellates selected by downwelling belonged to
the local community, it is concluded that advection of alien populations is not required
to explain these autumn blooms.
Keywords: dinoflagellate dominance, downwelling, NW Iberian upwelling, reversal
circulation, Ría de Vigo

3
1. Introduction
Diatom dominance in well-mixed and nutrient replete waters and a major
contribution of dinoflagellates in stratified and relatively nutrient poor water columns
characterise the microplankton composition in coastal upwelling systems (Margalef,
1978a; Margalef et al., 1979; Smith et al., 1983). Thus, the microplankton succession
progresses from diatom supremacy in spring to a higher importance of dinoflagellates in
late summer-early fall (Margalef, 1958; Figueiras and Ríos, 1993). The distribution of
microplankton assemblages also shows a distinctive spatial segregation typified by high
diatom abundance near upwelling centres and a greater importance of dinoflagellates
further offshore (Margalef, 1978b); a structure that frequently expands and contracts in
response to upwelling-donwelling cycles (Margalef, 1978b; Tilstone et al., 1994).
Although dinoflagellates can take advantage over diatoms in stratified water columns
due to their ability to perform diel vertical migrations (Eppley and Harrison, 1975;
Cullen, 1985; Cullen et al., 1985; Figueiras and Fraga, 1990; Fraga et al., 1992), blooms
in coastal upwelling systems are mainly composed of diatoms, since those of
dinoflagellates usually require physical processes leading to their accumulation.
However, as some dinoflagellates are among the most noxious species causing harmful
algal blooms (HABs) in coastal upwelling systems (Smayda, 1997), research on the
oceanographic and biological processes ultimately responsible for their proliferation has
been and still is a matter of continuous interest (GEOHAB, 2005). Accumulation and
retention favoured by the vertical swimming capability of dinoflagellates have been
repeatedly mentioned as the key factors promoting blooms of these species not only in
coastal upwelling systems (Blasco, 1977; Pitcher et al., 1998), but also in bays (Tyler
and Seliger, 1981; Anderson and Stolzenbach, 1985), estuaries (Chang and Carpenter,
1985) and in tidal fronts (Pingree et al., 1975). Advection of initial populations prior to

4
their accumulation in downwelling convergences is also occasionally necessary (e.g.
Tyler and Seliger, 1981).
Blooms of dinoflagellates, often harmful, are relatively frequent in the Rías Baixas of
Galicia, four bays on the NW Iberian peninsula (Fig. 1a) where seasonal upwelling-
downwelling is one of the main oceanographic features (Blanton et al., 1984; Figueiras
et al., 2002). The study of these blooms (e.g. Margalef, 1956; Fraga et al., 1988, 1990;
Figueiras et al., 1994, 1996; Fermín et al., 1996), especially recurrent at the end of the
upwelling season (Figueiras and Ríos, 1993), has provided a coherent picture for the
dynamics of these type of HABs in the region. Seasonal upwelling on the NW Iberian
shelf occurs, on average, from March to September when northerly winds are dominant,
whereas downwelling prevails during the rest of the year owing to the predominance of
southerly and westerly winds (Figueiras et al., 2002). Coastal upwelling and
downwelling greatly influence the circulation in the rías and, therefore, the exchange
between rías and the adjacent shelf (Figueiras et al., 1994; Fermín et al., 1996; Álvarez-
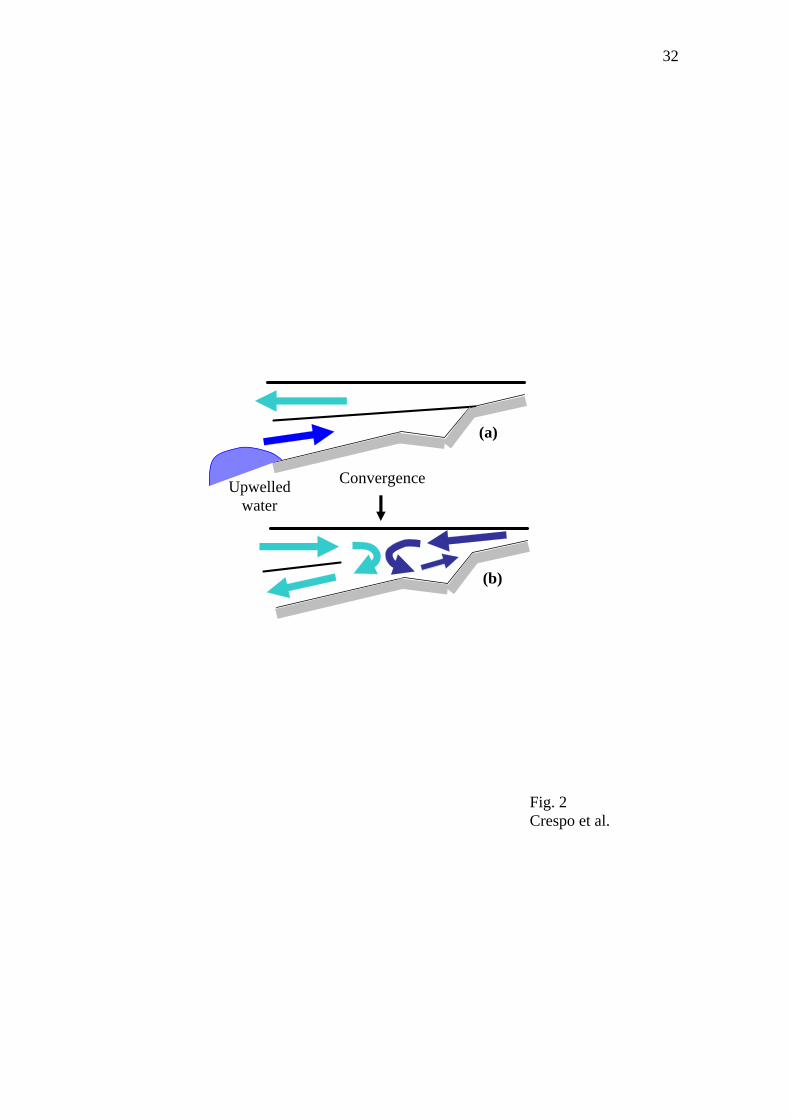
Salgado et al., 2000; Tilstone et al., 2000). Upwelling forces a two layer density-
induced positive circulation in the rías, characterised by the outflow of surface water
and the compensating inflow of upwelled water at the bottom (Fig. 2a). Transition to
seasonal downwelling, which coincides with the rapid change to southerly winds,
establishes a circulation during which surface coastal water enters the rías to develop a
downwelling front at the location where it meets the inner waters with higher
continental influence (Fig. 2b). During this reverse circulation, the outflow towards the
ocean in the outer circulation cell takes place at the bottom layer, while the inner cell
maintains a positive circulation forced by runoff. The reverse circulation also modifies
the distribution of microplankton assemblages along the rías and in the nearest shelf
that, under upwelling conditions, is characterised by the dominance of diatoms in the
5
inner waters and a higher importance of dinoflagellates towards the shelf (Tistone et al.,
1994). Downwelling causes the advection of dinoflagellates to the interior of the rías
and promotes their accumulation in the downwelling front (Fraga et al., 1988; Figueiras
et al., 1994; Fermín et al., 1996). This accumulation occurs because the vertical
swimming capability of dinoflagellates allows them to compensate the downward
velocity generated in this convergence (Figueiras et al., 1995). Diatoms, unable to
counteract the downward velocity, are displaced down in the water column and then
exported towards the shelf by the bottom outflow (Figueiras et al., 1994, 1996).
Regardless of the selection of dinoflagellates by downwelling, the actual development
into a bloom also needs the appropriate nutrient supply, which takes place by the return
of moderate rather than strong upwelling conditions (Fermín et al., 1996; Figueiras et
al., 1996), since strong upwelling enhances the positive circulation and favours diatom
growth. High runoff, another nutrient source for the surface layer, also enhances the
positive circulation and, hence, the displacement of the downwelling front towards the
shelf. Therefore, the two processes, strong upwelling and runoff, tend to disperse
dinoflagellates into the shelf waters.
Although selection of dinoflagellates by downwelling is generally accepted as the
first necessary step for HABs development in the Rías Baixas during late summer, the
source of the initial population is an issue that remains to be elucidated. Hypotheses
maintaining both local (Figueiras et al., 1994; Fermín et al., 1996) and foreign origin
(Fraga et al., 1988; Sordo et al., 2001) exist. The coincidence in time of the autumn
upwelling-downwelling transition with the onset of a large-scale poleward current on
the shelf (Frouin et al., 1990; Pingree et al., 1999; Álvarez-Salgado et al., 2003) has led
to the suggestion that initial populations could be advected to the rías from the ocean
(Fraga et al., 1988) or from the southernmost Portuguese coastal waters (Sordo et al.,

6
2001). As this controversy basically arises because studies on HABs dynamics in the
region have been restricted to the short-time periods of HAB occurrence, the use of
longer-term observations with high sampling frequency appears necessary to clarify the
subject. We here present the results obtained from a twice-weekly sampling made over
an annual cycle in the Ría de Vigo, when local microplankton succession ended in a
short-lived dinoflagellate proliferation at the time of the autumn upwelling-donwelling
transition.
2. Material and methods
A station situated in the mean channel (∼45 m depth in low water) at the central part
of the Ría de Vigo (Fig. 1b) was visited approximately twice a week from 20 January
1987 to 28 January 1988. Seawater samples from the surface and bottom (40 m) were
collected with 5 litre Niskin bottles fitted with reversing thermometers. Temperature,
salinity, nutrient concentration (nitrate, silicate, phosphate and ammonium), chlorophyll
concentration and microplankton abundance were determined for each sampling and
depth. These data were supplemented with daily determinations of incoming solar
radiation, runoff in the drainage basin and along-shore and cross-shore Ekman transport
components.
2. 1. Meteorology
Incoming solar radiation (Qs, cal cm-2 d-1) was calculated using the Mosby’s formula
(Dietrich et al. 1980). Runoff (Qr, m3 s-1) was estimated following the empirical
equation proposed by Ríos et al. (1992), which uses rainfall and a retention coefficient
of 0.75 for the 586 km2 drainage basin of the Ría de Vigo.

7
The cross-shore (Qx) and along-shore (Qy) Ekman transport components (m3 s-1 km-1)
were calculated according to Wooster et al. (1976):
fVVC
Qsw
XYDairYX ρ
ρ ,, =
where airρ is the air density (1.22 kg m-3), is the empirical drag coefficient (1.3 x
10
DC
-3, dimensionless) according to Hidy (1972), is the Coriolis parameter (9.946 x 10f -
5 s-1) at 43º latitude and swρ is the seawater density (∼1025 kg m-3). is the vector of
the wind speed on the sea surface, with magnitude
XYV ,
V , which were deduced from the
surface pressure charts (3 times d-1) at the latitude of Cape Finisterre (43 ºN). Ekman
transports calculated at Cape Finisterre are considered representative of the general
conditions for the whole northwest Iberian coast, including the Rías Baixas (Blanton et
al., 1984; Lavin et al., 1991). To facilitate comparisons between the 2 transport
components the sign of the cross-shore transport (QX), which is associated with
upwelling-downwelling on the shelf and corresponds to North-South winds, was
changed: i.e. positive values of -Qx indicate upwelling and hence transport towards the
open sea. East-West winds, which cause along-shore transport on the shelf (QY),
however have a different influence on the ría circulation owing to its almost
perpendicular orientation to the main coast line (Fig. 1). Easterly winds enhance the
outflow of surface waters of the Ría towards the open ocean and, therefore, cause
upwelling inside the Ría. In contrast, westerly winds promote the intrusion of coastal
surface waters into the ría and favour downwelling (Fig. 2b).

8
2.2. Hydrography, nutrients and chlorophyll
Temperature was registered with the reversing thermometers attached to the Niskin
bottles. Salinity was calculated following UNESCO (1985) from conductivity
determinations made with an AUTOSAL 8400A. Nutrient concentrations were
determined using auto-analysers according to Hansen and Grasshoff (1983), with some
improvements (Mouriño and Fraga, 1985).
Chlorophyll a concentrations were determined by fluorometry after filtration of 100
ml seawater samples under low vacuum pressure through 25 mm Whatman GF/F filters.
Filters were frozen at -20 ºC until pigments were extracted in 90% acetone for 24 h in
the dark at 4 ºC. Readings were made with a Turner Designs fluorometer calibrated with
pure chlorophyll a (Sigma Chemical Co.).
2.3. Microplankton
Microplankton samples preserved in Lugol’s iodine were sedimented in composite
sedimentation chambers. The sedimented volume (10-50 ml) depended on the
chlorophyll concentration of the sample. The organisms were counted and identified to
the species level, when possible, using an inverted microscope. Two transects at x400
and x250 were used to count the small species. The larger and usually less abundant
species were counted from the whole slide at x100 magnification.
Principal component analysis (PCA) was used to reduce and simplify the information
contained in the list of species abundance, to identify assemblages and to determine
changes in species composition. The analysis was made with the correlation matrix of
species abundances after they were transformed to log (X + 1), X representing the
number of individuals per 50 ml. To remove, as much as possible, zero values from the

9
matrix without losing information, only those species present in at least 30% of the
samples were included in the analysis. This provided a starting matrix of 51 species x
101 samples for the surface samples. The very scattered presence of some species and
the generally low cell abundance precluded the use of PCA with bottom samples.
3. Results
3.1. Meteorology and thermohaline properties
The freshwater supplied to the Ría de Vigo (Fig. 3a) showed both seasonal and short-
term variability (average Qr = 26 ± 23 m3 s-1). High runoff took place between autumn
and spring (Qr = 38 ± 24 m3 s-1), with the maximum freshwater input in autumn when a
value of 130 m3 s-1 was recorded on 18 October. Runoff was low (Qr = 10 ± 7 m3 s-1)
from late spring to the end of summer, coinciding with maximum solar radiation (Fig.
3a).
Upwelling, mainly caused by northerly winds (Fig. 3b), persisted from May to the
end of August with intercalated short relaxation and even downwelling events. This
seasonal upwelling was delimited by two winter periods with frequent and strong
downwelling events. The autumn upwelling-downwelling transition firstly occurred
through a relaxation in the second half of September (Fig. 3b) with weak southerly
winds (mean –Qx = - 216 m3 s-1 km-1) that was quickly followed by a strong
downwelling in October caused by westerly winds (Fig. 3c). Downwelling was
particularly strong on 16-17 October (Qy < - 4000 m3 s-1 km-1) and coincided with the
highest runoff (Fig. 3a). Downwelling in general and westerly winds (negative values of
Qy) in particular were related to rainfall (Qy vs Qr, r = -0.51, P < 0.001, n = 374).
Seawater temperature (Fig. 3d) in the surface layer followed a seasonal variation
that was partially correlated with solar radiation (r = 0.50, P < 0.001, n = 101). By
10
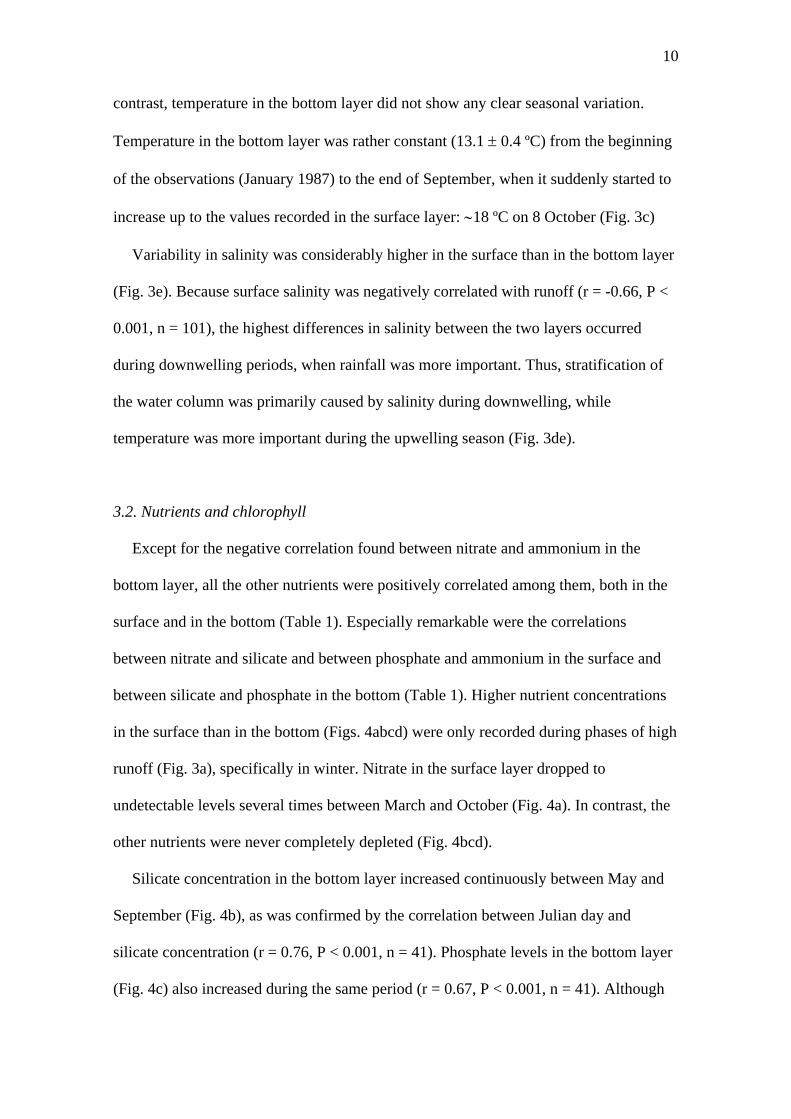
contrast, temperature in the bottom layer did not show any clear seasonal variation.
Temperature in the bottom layer was rather constant (13.1 ± 0.4 ºC) from the beginning
of the observations (January 1987) to the end of September, when it suddenly started to
increase up to the values recorded in the surface layer: ∼18 ºC on 8 October (Fig. 3c)
Variability in salinity was considerably higher in the surface than in the bottom layer
(Fig. 3e). Because surface salinity was negatively correlated with runoff (r = -0.66, P <
0.001, n = 101), the highest differences in salinity between the two layers occurred
during downwelling periods, when rainfall was more important. Thus, stratification of
the water column was primarily caused by salinity during downwelling, while
temperature was more important during the upwelling season (Fig. 3de).
3.2. Nutrients and chlorophyll
Except for the negative correlation found between nitrate and ammonium in the
bottom layer, all the other nutrients were positively correlated among them, both in the
surface and in the bottom (Table 1). Especially remarkable were the correlations
between nitrate and silicate and between phosphate and ammonium in the surface and
between silicate and phosphate in the bottom (Table 1). Higher nutrient concentrations
in the surface than in the bottom (Figs. 4abcd) were only recorded during phases of high
runoff (Fig. 3a), specifically in winter. Nitrate in the surface layer dropped to
undetectable levels several times between March and October (Fig. 4a). In contrast, the
other nutrients were never completely depleted (Fig. 4bcd).
Silicate concentration in the bottom layer increased continuously between May and
September (Fig. 4b), as was confirmed by the correlation between Julian day and
silicate concentration (r = 0.76, P < 0.001, n = 41). Phosphate levels in the bottom layer
(Fig. 4c) also increased during the same period (r = 0.67, P < 0.001, n = 41). Although

11
in lesser extension, the same tendency was observed for nitrate (Fig. 4a, r = 0.42, P <
0.01, n = 39) and ammonium (Fig 4d, r = 0.39, P < 0.05, n = 39).
Regardless of the large variability evidenced by chlorophyll concentration in both
layers, fortnightly averages (Fig. 4e) revealed two maxima in the surface that were
separated by an intermediate summer period of lower but with steadily increasing
concentrations. The spring maximum (∼ 8 mg Chl m-3) showed higher stability through
time than the autumn maximum, in which the highest value of chlorophyll concentration
(13.6 mg Chl m-3), recorded at the beginning of the autumn upwelling-downwelling
transition, was followed by low values (∼ 2 mg Chl m-3) after the strong downwelling of
October. This seasonal variation was not observed in the bottom layer, where high
chlorophyll values were found from early spring to middle summer and the autumn
maximum was absent. Chlorophyll concentration during winter (∼ 1 mg Chl m-3) was
similar in both layers.
3.3 Microplankton abundance
Microplankton in the surface layer (Fig. 5), which was essentially composed by
diatoms (73%) and flagellates (24%), did not follow the chlorophyll pattern of
maximum values in spring and autumn. Though microplankton abundance began to
increase during early spring (late February) causing nutrient reduction (Fig. 4abcd),
maximum abundance occurred at the beginning of the autumn upwelling-downwelling
transition (end of September), when nutrients still remained low. Conspicuous temporal
segregation existed at this time between diatoms and the other groups (dinoflagellates,
flagellates and ciliates). Diatoms were more abundant at the end of September (Fig. 5a);
whereas the other three groups reached their highest values later, during the stronger

12
downwelling conditions on the first week of October (Fig. 5bcd) coinciding with the
chlorophyll maximum (Fig. 4e).
Starting from a relatively low winter abundance (∼400 cells ml-1) of diatoms (48%)
and flagellates (47%), diatoms commenced to increase well in advance (late February)
of the upwelling season (Fig. 3b) and prolonged their dominance (78%) until the
beginning of the upwelling season in May (Figs. 5a, 3b). Chain-forming diatom species
of medium and large size (e.g. Chaetoceros curvisetus, C. didymus, Asterionellopsis
glacialis, Detonula pumila, Lauderia annulata, Guinardia striata, G. delicatula,
Dactyliosolen fragilissimus) and small Chaetoceros (C. socialis) forming big spherical
colonies composed this diatom community.
The microplankton community became more heterogeneous during the rest of the
upwelling season (June-August) (Fig. 5bcd) due to the progressive appearance of
dinoflagellates, flagellates and ciliates; diatoms accounted for 52%, flagellates 41% and
dinoflagellates 6% of the total microplankton. Diatoms during this summer phase,
which were of smaller size (e.g. small Chaetoceros spp., Skeletonema costatum,
Leptocylindrus danicus and L. minimus) than those dominating in spring, coexisted
with small flagellates, Cryptophyceae and the red tide flagellate Heterosigma akashiwo.
Even though small Gymnodinium spp. were dominant within the dinoflagellate
community, larger species (mainly Ceratium furca and C. fusus) were also noticeable in
August. Dinoflagellates (Fig. 5b) and ciliates (Fig. 5d) also showed a conspicuous
increase of abundance during the short downwelling events of June and August (Fig.
3b).
Diatoms, accounting for 85% of the total cell abundance, caused the extraordinary
increase of microplankton abundance in September (Fig. 5a), which coincided with the
upwelling relaxation that preceded the strong downwelling of October (Fig. 3bc). Later,

13
at the beginning of October, total microplankton abundance dropped to levels less than
a half, when diatoms practically disappeared from the surface layer (1% of the total cell
abundance) and dinoflagellates, flagellates and ciliates reached their highest abundances
of the year (Fig. 5bcd). Ceratium fusus was the most abundant dinoflagellate species
during this short period of time. At the end of October, once the strong downwelling
had relaxed, microplankton abundance dropped even more, down to winter levels (∼
500 cells ml-1), flagellates representing 85% and dinoflagellates 9% of the total cell
abundance.
Following the short recovery of November (Fig. 5) caused by diatoms (Fig. 5a),
microplankton abundance remained at low levels (∼ 700 cells ml-1) for the rest of the
winter. In contrast to the previous winter period when diatoms and flagellates co-
dominated, diatoms were now more abundant (70%) than flagellates (25%).
Total microplankton abundance in the bottom layer was considerably lower (Fig. 6)
and, like in the surface layer, generally followed diatom abundance (Fig. 6a). The
exception was during the autumn upwelling-downwelling transition with flagellates
representing 75% of the total cell abundance. Previously, at the beginning of September,
diatoms accounted for 80%.
3.4 Microplankton assemblages in the surface layer
Principal Component Analysis (PCA) extracted 2 components that explained 32% of
the total variance in the original data set and allowed definition of the main
microplankton assemblages present in the surface layer. Among all species or groups
included in the analysis only 5 species (Eutreptiella sp., Torodinium robustum,
Thalassionema nitzschioides, Coscinodiscus radiatus and Skeletonema costatum)
showed negative loads with the first principal component PC1 (Table 2). Several large

14
dinoflagellates, including Ceratium furca and C. fusus, were the species with the highest
positive loads with this component. The PC 1 scores increased continuously from
negative to positive values between January and the beginning of October (Fig. 7a) (r =
0.84, P < 0.001, n = 70 between Julian day and scores of PC 1). Positive scores were
maintained from the onset of the upwelling season in May to the first week of October
when quickly jumped down to negative values that persisted until the end of the
sampling period.
The dinoflagellate Ceratium fusus and the Raphidophycean Heterosigma akashiwo
were the species with the highest positive loads (> 0.40) with the second component PC
2 (Table 2). Other dinoflagellates such as Heterocapsa niei, Prorocentrum micans,
Protoperidinium divergens and Ceratium furca also had positive loads > 0.35. All the
species with negative loads < -0.4 were diatoms, within which large species such as
Chaetoceros spp., Asterionellopsis glacialis, Thalassiosira rotula and Detonula pumila
predominated. Negative scores of PC 2 (Fig. 7b) persisted during the spring bloom
between February and April, while positive and negative scores alternated during the
upwelling season. Although positive scores of PC 2 were found in July and August and
during winter, the highest positive values were achieved at the end of September and in
October, during the autumn upwelling-downwelling transition.
4. Discussion
Although the study of microplankton dynamics in relation to physical processes in
the highly variable environment of the Ría de Vigo ideally requires sampling
programmes covering all the relevant spatial and temporal scales (e.g. Figueiras et al.,
1994; Fermín et al., 1996; Tilstone et al., 2000), the use of the single station that we
show here, where oceanic and continental influences are clearly discernible (Figueiras et

15
al., 1994, 2002), has proven to be a simple but helpful approach when the seasonal
variability is the main concern (Nogueira et al., 1997, 2000; Nogueira and Figueiras,
2005). Therefore, strong seasonal signals, specifically those occurring in spring and
autumn transitions, can be interpreted making use of the extensive knowledge gathered
on circulation and microplankton distribution in the rías.
Despite short-term variability (Fig. 3bc), seasonality was an evident feature of the
environmental conditions in the Ría de Vigo (Fig. 3), with downwelling dominating in
winter and upwelling being more important in summer (Fig. 3bc). The driving force of
the two-layered circulation in the inner cell (Fig. 2b) during winter was the high runoff
(Fig. 3a), which also caused salinity stratification of the water column (Fig. 3e) and,
therefore, was responsible for the formation of the two layers (Fig. 2). Under these
circumstances, the relative strength of downwelling and runoff determines the position
of the downwelling front (Fig. 2b) along the ría, with downwelling favouring an inner
location and runoff forcing an outer position of the front (Álvarez-Salgado et al., 2000).
The reversal circulation begins to affect the middle ría, where our station is located,
when –Qx/Qr < -7 ± 2. Contrarily, the formation of the two layers in summer was due
to thermal stratification (Fig. 3d), when upwelling forced the circulation (Figueiras et
al., 1994; Fermín et al., 1996; Álvarez-Salgado et al., 2000). The autumn upwelling-
downwelling transition (end of September-beginning October, Fig. 3bcd) occurred, as
frequently reported, through a downwelling event that brought warm surface water from
the shelf to the ría interior (Figueiras et al., 1994, 2002; Álvarez-Salgado et al., 2000).
This caused the thermal homogenisation of the water column (Fig. 3d), which took
place through the rapid elevation of the temperature in the bottom layer up to the values
recorded in the surface layer. Such homogenisation, without appreciable temperature
changes in the surface layer could only be due to a strong downwelling that pushed the
16
warm surface water down to the bottom (Figueiras et al., 1994, 2002). Homogenisation
by upwelling necessarily would have produced a significant decrease in the temperature
of the surface layer through mixing with the cold upwelled water in the bottom.
Additional evidence for the existence of reversal circulation in the middle ría during this
autumn transition comes from the mean –Qx/Qr = 11 recorded between 15 September
and 15 October.
Upwelling, which was practically the only nutrient source for the surface layer of the
Ría de Vigo during summer, however did not cause persistent phytoplankton blooms.
The reason for the absence of summer phytoplankton blooms was the positive
circulation imposed by upwelling (Fig. 2a) that induced the export of material, and
hence phytoplankton, from the ría towards the shelf. The two-layered circulation and,
therefore, the export of phytoplankton was greatly favoured by the stratification of
temperature (Fig. 3d) that allowed the efficient transmission between vertical
(upwelling) and horizontal (export) velocities (Figueiras et al., 1994). While
transported, a significant part of this material sinks to the bottom in the outermost part
of the ría and in the nearest shelf where it experiences regeneration processes
contributing to the progressive nutrient increase brought to the ría through the bottom
layer by successive summer upwelling events (Fig. 4). This nutrient enrichment due to
regeneration, which can represent up to 50% (nitrate) and 80% (silicate) of the total
nutrient load supplied to the rías by the upwelled water at the end of the upwelling
season in September (Alvarez-Salgado et al., 1997), fueled the continuous increase of
chlorophyll concentration observed during the upwelling season (May-August, Fig. 4e).
The highest blooms took place during downwelling moments, before (spring) and
after (autumn) the upwelling season (Figs. 3b, 4e). Spring and autumn phytoplankton
blooms, which are recurrent in the Rías Baixas (Nogueira et al., 1997), occurred

17
because of the reversal circulation imposed by downwelling (Fig. 2b) that prevented
exportation. The mechanism of formation and the phytoplankton composition of these
two blooms were, however, substantially different. The spring bloom, mainly composed
of large diatoms, developed inside the rías favoured by salinity stratification (Fig. 3e)
and downwelling that blocked the export towards the shelf allowing phytoplankton
accumulation. The high chlorophyll values (Fig. 4e) did not show correspondence with
cell numbers (Fig 5) due to the large size of the diatoms that formed this bloom. On the
contrary, the autumn bloom, which took place just after the upwelling period during
which export was favoured, was caused by the advection towards the ría interior of
microplankton populations previously exported towards the shelf. This interpretation,
already suggested before (Figueiras et al., 1994, 1995, 1996; Tilstone et al., 1994;
Fermín et al., 1996), is here supported by the succession of microplankton groups
recorded in the surface layer during this relatively short-time period (Fig. 5). The
accumulation of diatoms at the beginning of downwelling (end of September, Fig. 5a)
was followed by the appearance of swimmers (dinoflagellates, flagellates and ciliates,
Fig. 5bcd) in the first half of October, when downwelling began to be stronger (Fig.
3bc). Such sequence of events could only occur because downwelling, through the
advection of surface water, transposed into a temporal scale in the ría interior the
existing spatial segregation of microplankton along the ría, characterised by higher
diatom dominance in the inner ría and a major importance of dinoflagellates in the outer
ría (Tilstone et al., 1994; Figueiras et al., 1994, 1995). Dinoflagellates and flagellates
(Figs. 5bc, 6bc) that remained in the water column during the first moments of
downwelling (end of September-beginning October) due to their swimming capability
(Fraga et al., 1989; Figueiras et al., 1995), however, were practically removed by the
posterior stronger downwelling of middle October (Fig. 3c, Qy < - 2000 m3 s-1 k-1)

18
when downward velocities were presumably higher. Diatoms quickly disappeared
during the first downwelling moments, not only from the surface (Fig. 5a) but also from
the bottom layer (Fig. 6a), probably swept towards the ocean by the reversal circulation
(Figueiras et al., 1994; Fermín et al., 1996).
According to the formation mechanism of this autumn bloom it could be
hypothesised that dinoflagellates were foreign components of the local microplankton
community that were advected to the ría by downwelling. However, the principal
component analysis revealed that dinoflagellates were normal constituents of the
microplankton community in the surface layer of the Ría de Vigo (PC 1 in Table 2),
where the microplankton succession was characterised by the higher importance of
dinoflagellates as summer progressed (Fig. 7a). The PCA also showed that some of
these dinoflagellates (Ceratium fusus, Heterocapsa niei, Prorocentrum micans, and
Ceratium furca) together with the raphidophyte Heterosigma akashiwo, were the species
which were effectively selected by the autumn downwelling (PC 2 in Table 2, Fig. 7b).
5. Conclusion
We conclude, in agreement with several previous researchers, that downwelling is
the oceanographic process that triggers dinoflagellate dominance in the Ría Baixas in
autumn. Although advection of foreign populations can not be totally disregarded, we
found that advection of alien dinoflagellate populations is not a requisite to explain this
sudden dominance, which might be well understood through the positive selection of
autochthonous populations. Despite initial selection by moderate downwelling, further
stronger downwelling removes these dinoflagellate populations from the water column,
precluding their later development into bloom conditions. This points to the very narrow
environmental window that autumn HABs of dinoflagellates require for their

19
appearance in the region, where suitable downwelling for initiation adds to the
succeeding weak upwelling and low runoff needed for their later development.
Acknowledgements
We thank the members of the Oceanography team at the Instituto de Investigacións
Mariñas, Vigo, who participated in the sampling and analysis of nutrients and
hydrographic variables. Financial support for this work came from the EU HABILE
project (EVK3-CT-2001-00063). B.G.C. was funded by a predoctoral I3P fellowship of
CSIC-European Social Foundation and I.G.T. by a FCT (Portuguese Foundation for
Science and Technology) doctoral fellowship. This is a contribution to the GEOHAB
Core Research Project – HABs in Upwelling Systems.
References
Álvarez-Salgado, X.A., Castro. C.G., Pérez. F.F., Fraga, F., 1997. Nutrient
mineralization patterns in shelf waters of the Western Iberian upwelling. Cont. Shelf
Res. 17, 1247-1270.
Álvarez-Salgado, X.A., Figueiras, F.G., Pérez, F.F., Groom, S., Nogueira, E., Borges,
A.V., Chou, L., Castro, C.G., Moncoiffé, G., Ríos, A.F., Miller, A.E.J.,
Frankignoulle, M., Savidge, G., Wollast, R., 2003. The Portugal Coastal Counter
Current off NW Spain: new insights on its biogeochemical variability. Prog.
Oceanogr. 56, 281-321.
Álvarez-Salgado, X.A., Gago, J., Míguez, B.M., Gilcoto, M., Pérez. F.F., 2000. Surface
waters of the NW Iberian margin: Upwelling on the shelf versus outwelling of
upwelled waters from the Rías Baixas. Est. Coast. Shelf Sci. 51, 821-837.

20
Anderson, D.M., Stolzenbach, K.D., 1985. Selective retention of two dinoflagellates in
a well-mixed estuarine embayment: the importance of diel vertical migration and
surface avoidance. Mar. Ecol. Prog. Ser. 25, 39-50.
Blanton, J.O., Atkinson, L.P., Fernández de Castillejo, F., Lavín, A., 1984. Coastal
upwelling off the Rías Bajas, Galicia, Northwest Spain, I: Hydrography studies.
Rapp. p.-v. Reun. Cons. Int. Explor. Mer. 183, 79-90.
Blasco, D., 1977. Red tide in the upwelling region of Baja California. Limnol.
Oceanogr. 22, 255-263.
Chang, J., Carpenter, E.J., 1985. Blooms of the dinoflagellate Gyrodinium aureolum in
a Long Island estuary: Box model analysis of bloom maintenance. Mar. Biol. 89, 83-
93.
Cullen. J.J., 1985. Diel vertical migration by dinoflagellates: roles of carbohydrate
metabolism and behavioural flexibility. In: Rankin, M.A. (Ed.), Migration:
mechanisms and adaptative significance. Univ. Texas Mar. Sci. Inst. Suppl. 27, 135-
152.
Cullen, J.J., Zhu, M., Davis, R.F., Pierson, D. C., 1985. Vertical migration,
carbohydrate synthesis, and nocturnal nitrate uptake during growth of Heterocapsa
niei in a laboratory water column. In: Anderson, D.M., White, A.W., Baden, D.G.
(Eds.), Toxic dinoflagellates. Elsevier, New York, pp. 189-194.
Dietrich, G., Kalle, K., Kraus, W., Siedler, G., 1980. General oceanography. An
introduction, 2nd edn. John Wiley and Sons, New York
Eppley, R.W., Harrison, W. O., 1975. Physiological ecology of Gonyaulax polyedra, a
red water dinoflagellate of Southern California. In: LoCicero, V. (Ed.), Toxic
Dinoflagellate Blooms. Massachusetts Science Technological Foundation,
Wakefield, pp. 11-22.

21
Fermín, E.G., Figueiras, F.G., Arbones, B., Villarino, M. L., 1996. Short-time scale
development of a Gymnodinium catenatum population in the Ría de Vigo (NW
Spain). J. Phycol. 32, 212-221.
Figueiras, F.G., Fraga, F., 1990. Vertical nutrient transport during proliferation of
Gymnodinium catenatum Graham in the Ría de Vigo, Northwest Spain. In: Granéli,
E., Sundström, B., Edler, L., Anderson, D. M. (Eds.), Toxic marine phytoplankton,
Elsevier, New York, pp. 144-148.
Figueiras, F.G., Gómez, E., Nogueira, E., Villarino, M. L., 1996. Selection of
Gymnodinium catenatum under downwelling conditions in the Ría de Vigo. In:
Yasumoto, T., Oshima, Y., Fukuyo, Y. (Eds.), Harmful and Toxic Algal Blooms.
Intergovernmental Oceanographic Commission of UNESCO, Paris, pp. 215-218.
Figueiras, F.G., Jones, K.J., Mosquera, A.M., Álvarez-Salgado, X.A., Edwards, A.,
MacDougall, N., 1994. Red tide assemblage formation in an estuarine upwelling
ecosystem: Ria de Vigo. J. Plankton Res. 16, 857-878.
Figueiras, F.G., Labarta, U., Fernández Reiriz, M.J., 2002. Coastal upwelling, primary
production and mussel growth in the Rías Baixas of Galicia. Hydrobiologia 484,
121-131.
Figueiras, F.G., Ríos, A.F., 1993. Phytoplankton succession, red tides and the
hydrographic regime in the Rías Bajas of Galicia. In: Smayda, T.J., Shimizu, Y.
(Eds.), Toxic phytoplankton blooms in the Sea. Elsevier, New York, pp. 239-244.
Figueiras, F.G., Wyatt, T., Álvarez-Salgado, X.A., Jenkinson, I., 1995. Advection,
diffusion, and patch development of red tide organisms in the Rías Baixas. In:
Lassus, P., Arzul, G., Erard, E., Gentin, P., Marcaillou, C. (Eds.), Harmful Marine
Algal Blooms. Technique et Documentacion-Lavoisier, Intercept Ltd, pp. 579-584.

22
Fraga, F., Pérez, F.F., Figueiras, F.G., Ríos, A.F., 1992. Stoichiometric variations of N,
P, C and O2 during a Gymnodinium catenatum red tide and their interpretation. Mar.
Ecol. Prog. Ser. 87, 123-134.
Fraga, S., Anderson, D.M., Bravo, I., Reguera, B., Steidinger, K.A., Yentsch, C.M.,
1988. Influence of upwelling relaxation on dinoflagellates and shellfish toxicity in
Ria de Vigo, Spain. Est. Coast. Shelf Sci. 27, 349-361.
Fraga, S., Gallager, S.M., Anderson, D.M., 1989. Chain-forming dinoflagellates: an
adaptation to red tides. In: Okaichi, T., Anderson, D.M., Nemoto, T. (Eds.), Red
tides: biology, environmental science and toxicology, Elsevier, New York, pp. 281-
284.
Fraga, S., Reguera, B., Bravo, I., 1990. Gymnodinium catenatum bloom formation in
the Spanish rias. In: Granéli, E., Sundström, B., Edler, L., Anderson, D.M. (Eds.),
Toxic marine phytoplankton, Elsevier, New York, pp. 149-154.
Frouin, R., Fiúza, A.F. G., Ambar, I., Boyd, T.J., 1990. Observations of a poleward
surface current off the coasts of Portugal and Spain during winter. J. Geophys. Res.
95, 679-691.
GEOHAB, 2005. Global Ecology and Oceanography of Harmful Algal Blooms,
GEOHAB Core research project: HABs in upwelling systems. In: Pitcher, G., Moita,
J., Trainer, V., Kudela, R., Figueiras, P., Probyn, T. (Eds.), IOC and SCOR, Paris
and Baltimore
Hansen, H.P., Grassshoff, K., 1983. Automated chemical analysis. In: Grasshoff, K.,
Ehrardt, M., Kremling, K. (Eds.), Methods of seawater analysis, Verlag Chemie,
Weinheim, pp. 347-395.
Hidy, G.M., 1972. A view of recent air-sea interaction research. Bull. Am. Meteorol.
Soc. 53, 1083-1102.

23
Lavín, A., Díaz del Río, G., Cabanas, J.M., Casas, G., 1991. Afloramiento en el
noroeste de la Península Ibérica. Indices de afloramiento para el punto 43o N 11oW:
Período 1966-1989. Inf. Tec. Inst. Esp. Oceanog. 91, 1-40.
Margalef, R., 1956. Estructura y dinámica de la “purga de mar” en la Ría de Vigo. Inv.
Pesq. 5, 113-134.
Margalef, R., 1958. Temporal succession and spatial heterogeneity in phytoplankton. In:
Buzzati-Traverso, A.A. (Ed.), Perspectives in Marine Biology. University California
Press, Berkeley, pp. 323-348.
Margalef, R., 1978a. Life-forms of phytoplankton as survival alternatives in an unstable
environment. Oceanol. Acta 1, 493-509.
Margalef, R., 1978b. Phytoplankton communities in upwelling areas. The example of
NW Africa. Oecologia Aquatica 3, 97-132.
Margalef, R., Estrada, M., Blasco, D., 1979. Functional morphology of organisms
involved in red tides, as adapted to decaying turbulence. In: Taylor, D.L., Seliger, H.
H. (Eds.), Toxic dinoflagellate blooms, Elsevier, New York, pp. 89-94.
Mouriño, C., Fraga, F., 1985. Determinación de nitratos en agua de mar. Inv. Pesq. 49,
81-96.
Nogueira, E., Figueiras, F.G., 2005. The microplankton succession in the Ría de Vigo
revisited: species assemblages and the role of the weather-induced, hydrodynamic
variability. J. Mar. Syst. 54, 139-155.
Nogueira, E., Ibanez, F., Figueiras, F.G., 2000. Effect of meteorological and
hydrographic disturbances on the microplankton community structure in the Ría de
Vigo (NW Spain). Mar. Ecol. Prog. Ser. 203, 23-45.

24
Nogueira, E., Pérez, F. F., Ríos, A.F., 1997. Seasonal patterns and long-term trends in
an estuarine upwelling ecosystem (Ría de Vigo, NW Spain). Est. Coast. Shelf Sci.
44, 285-300.
Pingree, R.D., Pugh, P.R., Holligan, P.M., Forster, G.R., 1975. Summer phytoplankton
blooms and red tides along tidal fronts in the approaches to the English Channel.
Nature 258, 672-677.
Pingree, R.D., Sinha, B., Griffiths, C.R., 1999. Seasonality of the European slope
current (Goban Spur) and ocean margin exchange. Cont. Shelf Res. 19, 929-975.
Pitcher, G.C., Boyd, A.J., Horstman, D., Mitchell-Innes, B.A., 1998. Subsurface
dinoflagellate populations, frontal blooms and the formation of red tide in the
southern Benguela upwelling system. Mar. Ecol. Prog. Ser. 172, 253-264.
Ríos, A.F., Nombela, M., Pérez, F.F., Rosón, G., Fraga, F., 1992. Calculation of runoff
to an estuary. Ría de Vigo. Sci. Mar. 56, 29-33.
Smayda, T.J., 1997, Harmful algal blooms: their ecophysiology and general relevance
to phytoplankton blooms in the sea. Limnol. Oceanogr. 42, 1137-1153.
Smith, W.O., Heburn, G.W., Barber, R.T., O’Brien, J.J., 1983. Regulation of
phytoplankton communities by physical processes in upwelling systems. J. Mar. Res.
41, 539-556.
Sordo, I., Barton, E.D., Cotos, J.M., Pazos, Y., 2001. An inshore poleward current in the
NW of the Iberian Peninsula detected from satellite images, and its relation with G.
catenatum and D. acuminata blooms in the Galician rias. Est. Coast. Shelf Sci. 53,
787-799.

25
Tilstone, G.H., Figueiras, F.G., Fraga, F., 1994. Upwelling-downwelling sequences in
the generation of red tides in a coastal upwelling system. Mar. Ecol. Prog. Ser. 112,
241-253.
Tilstone, G.H., Míguez, B.M., Figueiras, F.G., Fermín, E.G., 2000. Diatom dynamics in
a coastal ecosystem affected by upwelling: coupling between species succession,
circulation and biogeochemical processes. Mar. Ecol. Prog. Ser. 205, 23-41.
Tyler, M.A., Seliger, H.H., 1981. Selection for a red tide organism: Physiological
responses to the physical environment. Limnol. Oceanogr. 26, 310-324.
UNESCO, 1985. The international system of units (SI) in Oceanography. UNESCO
Technical Papers in Marine Science 45
Wooster, W.S., Bakun, A., McLain, D.R., 1976. The seasonal upwelling cycle along the
eastern boundary of the North Atlantic. J. Mar. Res. 34, 131-141.

26
Table 1. Correlation coefficients among nutrient concentrations in the surface and the
bottom layers between 20 January 1987 and 28 January 1988 in the Ría de Vigo (n =
93; * P < 0.05; ** P < 0.01; *** P < 0.001).
Variables Surface Bottom NO-
3 – SiO4H4 0.91*** 0.43***
NO-3 – HPO2-
4 0.33** 0.51***
NO-3 – NH+
4 0.43*** -0.21*
SiO4H4 – HPO2-4 0.37*** 0.79***
SiO4H4 - NH+4 0.53*** 0.53***
HPO2-4 - NH+
4 0.82*** 0.64***

27
Table 2. Correlation coefficients (loads) of the species and taxa selected for Principal
Component Analysis (PCA) with the first 2 principal components. Species and taxa are
ordered according to PC 1. The higher positive and negative loads for PC 2 are in bold
type. The species were grouped as diatoms (Diat), dinoflagellates (Dinof), flagellates
other than dinoflagellates (Flag) and ciliates (Cil).
Group Taxon PC 1 PC 2
Dinof Ceratium furca 0.795 0.354
Dinof Protoperidinium divergens 0.740 0.358
Dinof Scrippsiella trochoidea 0.733 0.143
Dinof Dinophysis acuminata 0.727 0.011
Dinof Ceratium fusas 0.722 0.441
Cil Ciliates (other than choreotrich, 30-60 µm) 0.719 0.114
Flag Unidentified small flagellates (<30µm) 0.679 -0.043
Dinof Protoperidinium longipes 0.673 -0.078
Cil Choreotrich ciliates A (medium, 30-60 µm) 0.623 0.063
Diat Leptocylindrus danicus 0.615 -0.306
Dinof Protoperidinium steinii 0.613 0.244
Dinof Heterocapsa niei 0.587 0.392
Flag Leucocryptos spp. 0.574 0.120
Dinof Protoperidinium diabolus 0.560 -0.094
Dinof Gymnodinium spp. (small, <30µm) 0.560 0.159
Flag Heterosigma akashiwo 0.541 0.397
Flag Cryptophyceae spp. 0.534 0.035
Dinof Gymnodinium varians 0.483 -0.359
Dinof Gyrodinium fusiforme 0.469 -0.389
Diat Pseudo-nitzschia cf. seriata 0.468 -0.597
Cil Strombidium strobilum 0.463 -0.088
Dinof Amphidinium flagellans 0.451 -0.004
Cil Choreotrich ciliates (small, <30 µm) 0.447 0.054
Dinof Prorocentrum micans 0.361 0.381
Diat Centric diatom spp. (small, <30 µm) 0.352 -0.023

28
Diat Pleurosigma elongatum 0.339 -0.457
Dinof Naked dinoflagellates (medium, 30-60 µm) 0.311 0.036
Diat Dactyliosolen fragilissimus 0.302 -0.525
Cil Choreotrich ciliates (large, >60 µm) 0.282 0.083
Cil Mesodinium rubrum 0.265 0.143
Diat Thalassiosira rotula 0.264 -0.599
Diat Detonula pumila 0.253 -0.653
Cil Choreotrich ciliates B (medium, 30-60µm) 0.246 -0.132
Diat Guinardia delicatula 0.232 -0.293
Cil Ciliates (other than choreotrich, <30 µm) 0.200 -0.388
Diat Rhizosolenia setigera 0.165 -0.612
Dinof Gymnodinium nanum 0.160 -0.033
Diat Chaetoceros didymus 0.135 -0.782
Diat Chaetoceros spp. (small) 0.132 -0.287
Diat Nitzschia longissima 0.125 -0.018
Diat Chaetoceros debilis 0.086 -0.567
Diat Chaetoceros lorenzianus 0.079 -0.535
Diat Pseudo-nitzschia cf. delicatissima 0.065 -0.533
Diat Centric diatom spp. (medium, 30-60 µm) 0.039 0.317
Diat Chaetoceros curvisetus 0.036 -0.608
Diat Asterionellopsis glacialis 0.011 -0.805
Flag Eutreptiella sp. -0.030 -0.065
Dinof Torodinium robustum -0.098 0.129
Diat Thalassionema nitzschioides -0.203 -0.390
Diat Coscinodiscus radiatus -0.251 0.032
Diat Skeletonema costatum -0.386 -0.149

29
Figure captions
Fig. 1. Map showing (a) the location of the four Rías Baixas on the NW of the
Iberian Peninsula, and (b) detail of the Ría the Vigo with the sampling station.
Fig. 2. Scheme representing the circulation of the rías during (a) upwelling and
(b) downwelling. See text for details.
Fig. 3. Evolution of (a) runoff Qr and incoming solar radiation Qs, (b) cross-shore
Ekman transport - Qx, (c) along-shore Ekman transport Qy, (d) temperature and
(e) salinity in the surface and bottom layers during the sampling period. Dashed
areas denote the upwelling season and the autumn downwelling transition. See
text for details.
Fig. 4. Evolution of (a) nitrate, (b) silicate, (c) phosphate, (d) ammonium and (e)
chlorophyll concentration in the surface and bottom layer. Values were fortnightly
averaged (n = 4) to remove short-term variability.
Fig. 5. Evolution of total microplankton abundance (cells mL-1) in the surface
layer compared with that of (a) diatoms, (b) dinoflagellates, (c) flagellates other
than dinoflagellates and (d) ciliates during the sampling period. Values were
fortnightly averaged (n = 4) to remove short-term variability.

30
Fig. 6. Evolution of total microplankton abundance (cells mL-1) in the bottom
layer compared with that of (a) diatoms, (b) dinoflagellates, (c) flagellates other
than dinoflagellates and (d) ciliates during the sampling period. Values were
fortnightly averaged (n = 4) to remove short-term variability.
Fig. 7. Evolution of (a) PC 1 and (b) PC 2 scores extracted by the principal
component analysis of microplankton species abundance. Dashed areas denote the
upwelling season and the autumn downwelling transition.

31
-10 -9 -8
42
43
44
100 m200 m
1000 m2000 m
N
E
Ría de Vigo
Cape Finisterre
(a)
(b)
Rías Baixas
Fig. 1 Crespo et al.
32
Convergence
Fig. 2 Crespo et al.
(a)
(b)
Upwelled water

33
-Qx
(m3 s
-1 k
m-1
)
-3000
-2000
-1000
0
1000
2000
3000
Qy
(m3 s
-1 k
m-1
)
-6000
-4000
-2000
0
2000
4000
Qr (
m3 s
-1)
0
20
40
60
80
100
120
140
Qs
(cal
cm
-2 d
-1)
0100200300400500600700800
Qr Qs
Tem
pera
ture
(ºC
)
10
12
14
16
18
20
22
Surface Bottom
Salin
ity
26
28
30
32
34
36
38
SurfaceBottom
(a)
(b)
(c)
(d)
(e)
Feb April June Aug Oct Dec
Feb April June Aug Oct Dec
Feb April June Aug Oct Dec
Feb April June Aug Oct Dec
Feb April June Aug Oct Dec
Fig. 3 Crespo et al.

34
Feb April June Aug Oct DecN
O- 3 (
µmol
kg-1
)0
2
4
6
8
10
12
SurfaceBottom
Feb April June Aug Oct Dec
SiO
4H4 (
µmol
kg-1
)
02468
10121416
SurfaceBottom
Feb April June Aug Oct Dec
NH
+ 4 (µ
mol
kg-1
)
0
1
2
3
4
5
6
7
SurfaceBottom
Feb April June Aug Oct Dec
Chl
orop
hyll
(µg
l-1)
02468
10121416
SurfaceBottom
Feb April June Aug Oct Dec
HP
O2-
4 (µm
ol k
g-1)
0.0
0.2
0.4
0.6
0.8
1.0
1.2
1.4SurfaceBottom
(a)
(b)
(c)
(d)
(e)
Fig. 4 Crespo et al.

35
Feb April June Aug Oct Dec
Tota
l mic
ropl
ankt
on(c
ells
ml-1
)
0
10000
20000
30000
40000
Dia
tom
s (c
ells
ml-1
)
0
10000
20000
30000
40000MicroplanktonDiatoms
Feb April June Aug Oct Dec
Tota
l mic
ropl
ankt
on(c
ells
ml-1
)
0
10000
20000
30000
40000
Din
ofla
gella
tes
(cel
ls m
l-1)
0
200
400
600
800
1000
1200
MicroplanktonDinoflagellates
Feb April June Aug Oct Dec
Tota
l mic
ropl
ankt
on(c
ells
ml-1
)
0
10000
20000
30000
40000
Flag
ella
tes
(cel
ls m
l-1)
0
2000
4000
6000
8000
10000
MicroplanktonFlagellates
Feb April June Aug Oct Dec
Tota
l mic
ropl
ankt
on(c
ells
ml-1
)
0
10000
20000
30000
40000
Cilia
tes
(cel
ls m
l-1)
0
20
40
60
80
100
120
MicroplanktonCiliates
(a)
(b)
(c)
(d)
Fig. 5 Crespo et al.

36
Feb April June Aug Oct Dec
Tota
l mic
ropl
ankt
on(c
ells
ml-1
)
0
200
400
600
800
1000
1200
1400
Dia
tom
s (c
ells
ml-1
)
0
200
400
600
800
1000
1200
1400
MicroplanktonDiatoms
Feb April June Aug Oct Dec
Tota
l mic
ropl
ankt
on(c
ells
ml-1
)
0
200
400
600
800
1000
1200
1400
Din
ofla
gella
tes
(cel
ls m
l-1)
0
10
20
30
40MicroplanktonDinoflagellates
Feb April June Aug Oct Dec
Tota
l mic
ropl
ankt
on(c
ells
ml-1
)
0
200
400
600
800
1000
1200
1400
Flag
ella
tes
(cel
ls m
l-1)
0
200
400
600
800
1000MicroplanktonFlagellates
Feb April June Aug Oct Dec
Tota
l mic
ropl
ankt
on(c
ells
ml-1
)
0
200
400
600
800
1000
1200
1400
Cilia
tes
(cel
ls m
l-1)
0
5
10
15
20
25
30MicroplanktonCiliates
(a)
(b)
(c)
(d)
Fig. 6 Crespo et al.

37
PC 1
sco
res
-2
-1
0
1
2
3P
C 2
sco
res
-3
-2
-1
0
1
2
3
(a)
(b)
Feb April June Aug Oct Dec
Feb April June Aug Oct Dec
Fig. 7 Crespo et al.