Embed Size (px)
Citation preview
Comparision of national food situation - Estonia
Liina Laumets, Karin Pai & Liisa Lang
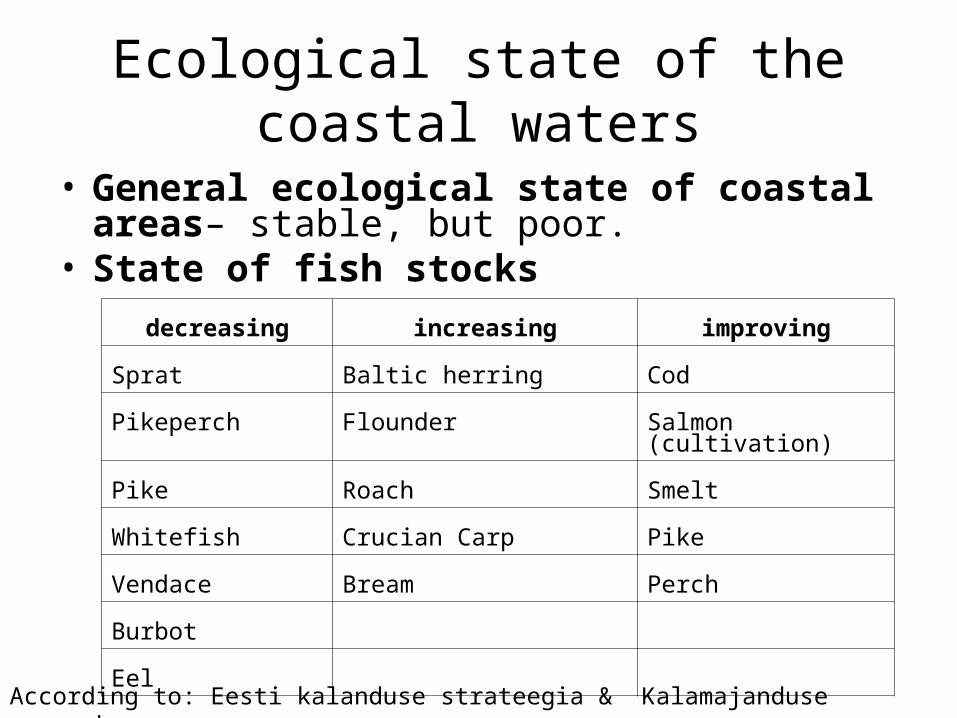
Ecological state of the coastal waters
• General ecological state of coastal areas– stable, but poor.
• State of fish stocks
decreasing increasing improving
Sprat Baltic herring Cod
Pikeperch Flounder Salmon (cultivation)
Pike Roach Smelt
Whitefish Crucian Carp Pike
Vendace Bream Perch
Burbot
Eel
According to: Eesti kalanduse strateegia & Kalamajanduse arengukava
Reasons of fish stock decreasing:
Reasons of fish stock decreasing:1) too intensive fishing less fishing licenses increase
of illegal fishing2) Environmental conditions3) Decrease of good living and spawning places/ limited
access to spawning places (Narva hydro electric power station).
4) Due to intensive fishing some fish species have reached their critical state where self-regulation and spreading is complicated or impossible (human interference is needed – cultivation etc)
5) Catching of undersized fish.
• Recreation & livelihood - 3790 km of coastline; SPA-s, sport (e.g. sailing, diving, swimming), hobby-fishing, hiking, nature tourism etc.
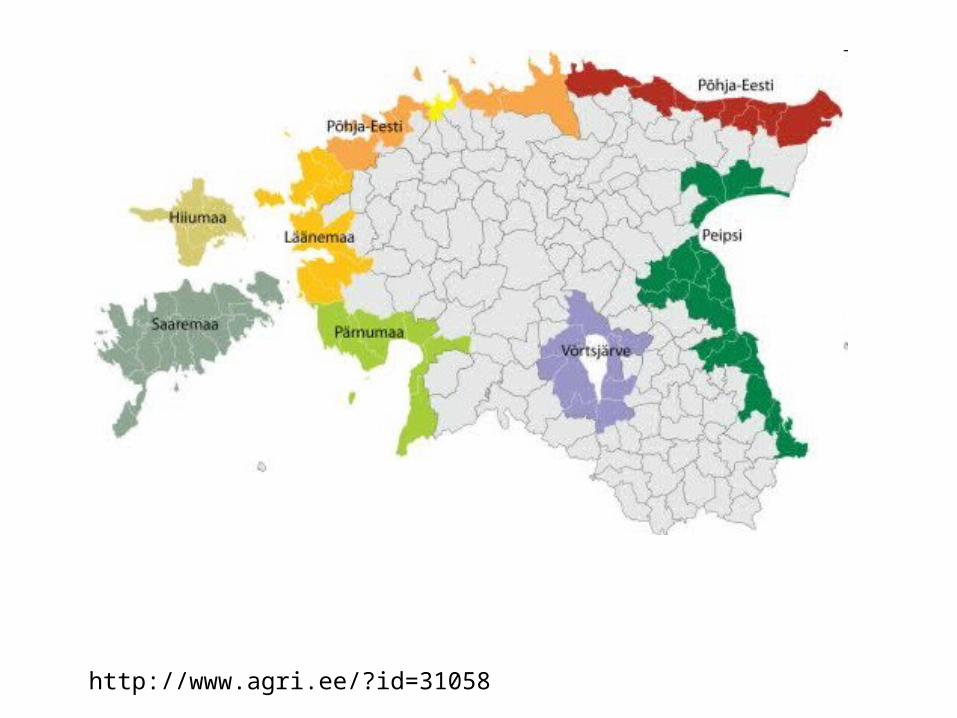
http://www.agri.ee/?id=31058
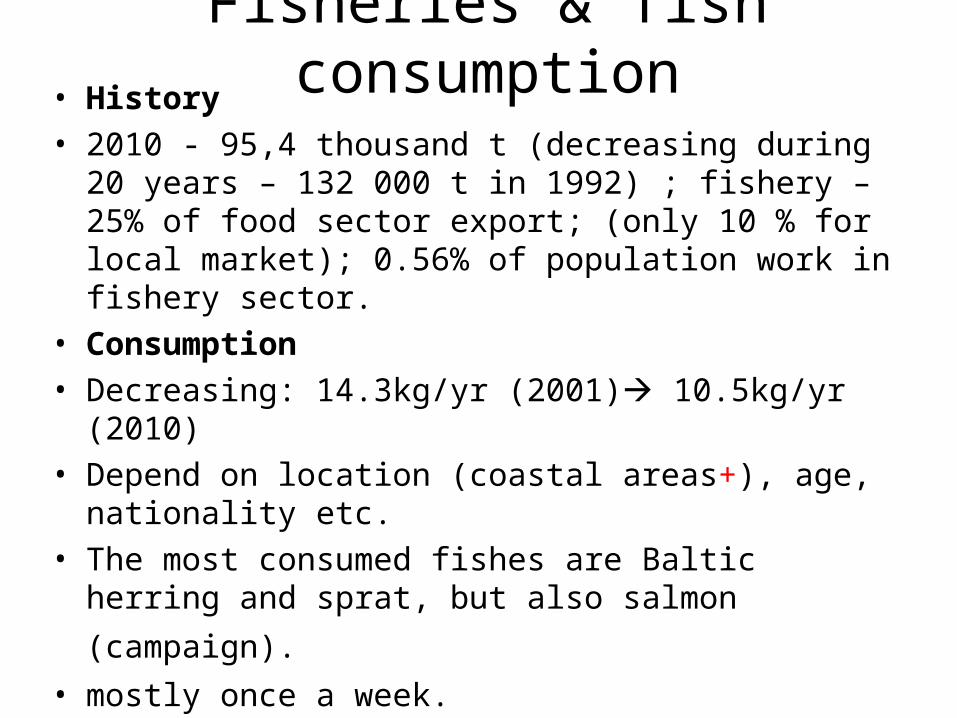
Fisheries & fish consumption• History• 2010 - 95,4 thousand t (decreasing during 20 years –
132 000 t in 1992) ; fishery – 25% of food sector export; (only 10 % for local market); 0.56% of population work in fishery sector.
• Consumption • Decreasing: 14.3kg/yr (2001) 10.5kg/yr (2010)• Depend on location (coastal areas+), age, nationality etc.• The most consumed fishes are Baltic herring and sprat,
but also salmon (campaign). • mostly once a week.
According to: Kala ja kalatoodete turg Eestis. 2011. Eesti Konjunktuuriinstituut
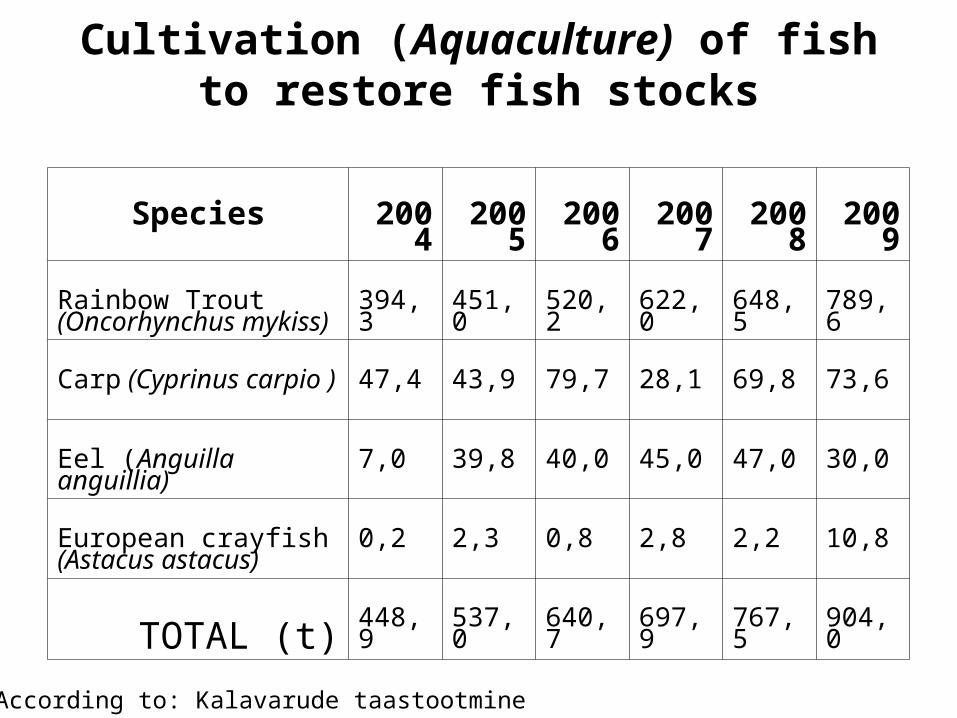
Cultivation (Aquaculture) of fish to restore fish stocks
Species 2004 2005 2006 2007 2008 2009
Rainbow Trout (Oncorhynchus mykiss)
394,3 451,0 520,2 622,0 648,5 789,6
Carp (Cyprinus carpio ) 47,4 43,9 79,7 28,1 69,8 73,6
Eel (Anguilla anguillia) 7,0 39,8 40,0 45,0 47,0 30,0
European crayfish(Astacus astacus)
0,2 2,3 0,8 2,8 2,2 10,8
TOTAL (t)448,9 537,0 640,7 697,9 767,5 904,0
According to: Kalavarude taastootmine
Regulations• Legislative constraints, international agreements &
their fulfillment• Fisheries Act (1995), Fishing Regulation• Catch limitations are established by the Council of the European Union
(highly migratory fishes) & Republic of Estonia (less migratory fishes)
• SAPARD (2003-2006); State Development Plan (2004-2006),
European Fishing Fund (2007-2013). • EU Common Fisheries Policy (CFP) (2004)• Council Regulation (EC) No 1098/2007• Council Regulation (EC) No 1224/2009• Estonian-Russian fishing commission • Ministry of Agriculture, Ministry of Environment • Environmental Inspectorate of Estonia (45 inspectors)
• In Soviet times all industry was owned by the State, so there was limited legislation (collective farms)
• The Farm Act in 1989 (legal guarantees for the establishment and development of farms)
• Land Reform Act in 1991 (in 1990 no private farms and in 1994 10,153 private farms)
• Establishment of Estonian Biodynamic Association in 1989 (beginning of organized organic farming)
• Situation now: The number of farms has grown, but farm size has decreased
Sources: Thorne, S. 2003. Estonian food production. The Anthropology of East Europe Review. Vol 21, No 1: Special Issue: Food and Foodways in Post-Socialistic Eurasia. Available at: http://scholarworks.iu.edu/journals/index.php/aeer/article/viewFile/375/450
Peepson, A; Mikk, M. 2008. Country profile of rural characteristics. Estonia. Assessing the impact of rural development policies (incl. LEADER). Centre for Ecological Engineering. Tartu. Available at: http://www.rudi-europe.net/uploads/media/Estonia_WP1_Report.pdf
History of agriculture
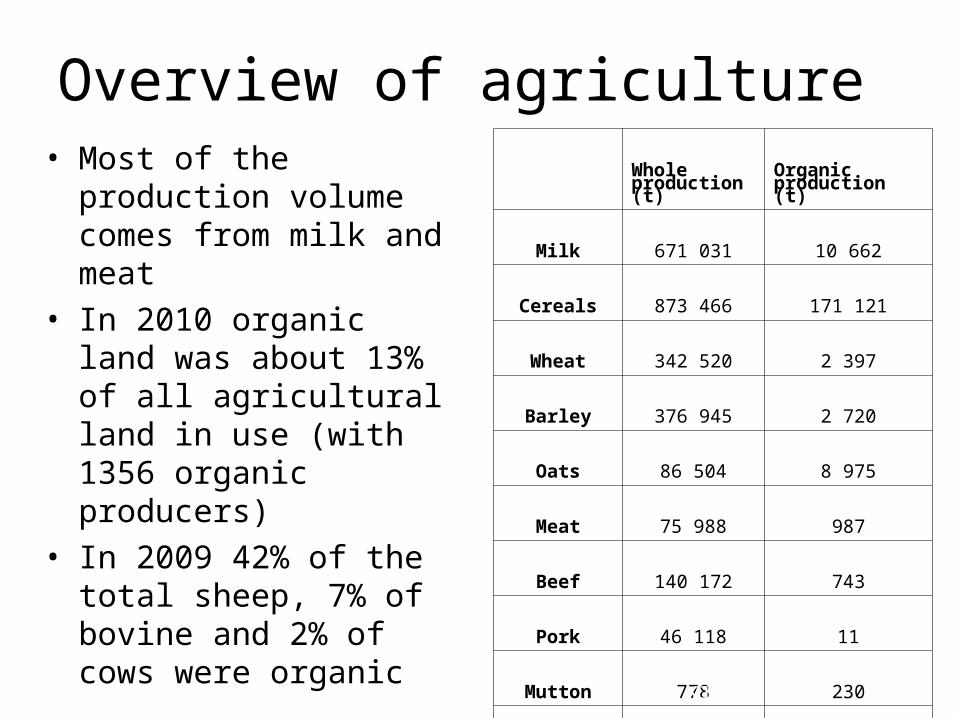
Overview of agriculture • Most of the production
volume comes from milk and meat
• In 2010 organic land was about 13% of all agricultural land in use (with 1356 organic producers)
• In 2009 42% of the total sheep, 7% of bovine and 2% of cows were organic
Sources: Orro 2010 & Estonian Organic Farming Foundation 2011.
Whole production (t)
Organic production (t)
Milk 671 031 10 662
Cereals 873 466 171 121
Wheat 342 520 2 397
Barley 376 945 2 720
Oats 86 504 8 975
Meat 75 988 987
Beef 140 172 743
Pork 46 118 11
Mutton 778 230
Poultry 14 882 1
Potatoes 139 100 1 654
Vegetables 70 600 277
Eggs (thousand)
173 264 523
www.ki.ee
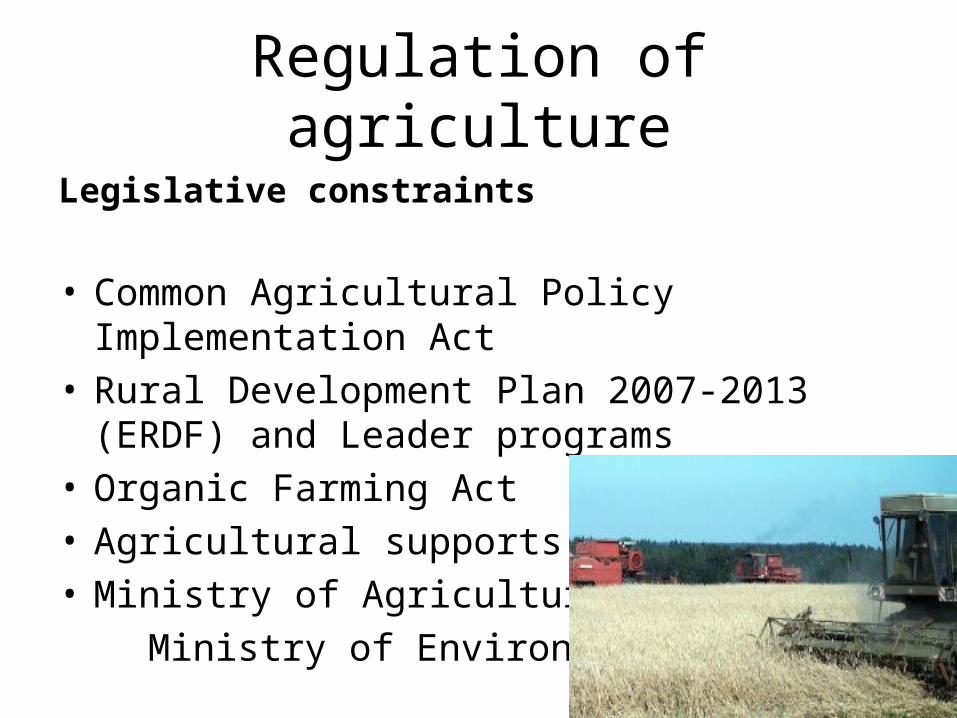
Regulation of agriculture
Legislative constraints
• Common Agricultural Policy Implementation Act
• Rural Development Plan 2007-2013 (ERDF) and Leader programs
• Organic Farming Act• Agricultural supports (ARIB)• Ministry of Agriculture &
Ministry of Environment
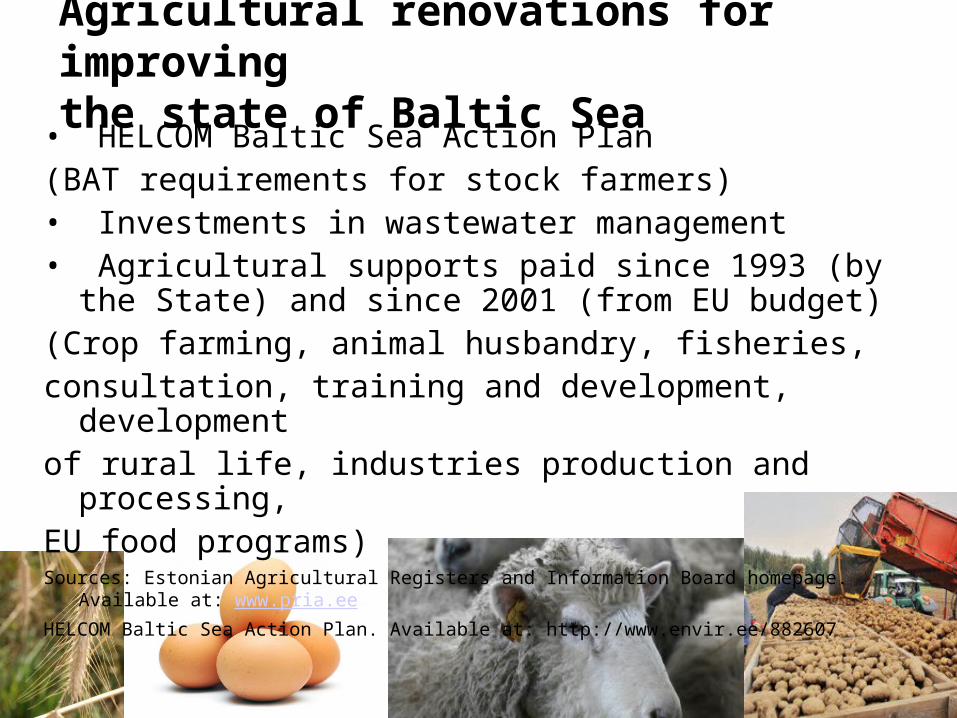
Agricultural renovations for improving the state of Baltic Sea
• HELCOM Baltic Sea Action Plan (BAT requirements for stock farmers)• Investments in wastewater management• Agricultural supports paid since 1993 (by the State) and
since 2001 (from EU budget)(Crop farming, animal husbandry, fisheries,consultation, training and development, developmentof rural life, industries production and processing,EU food programs)Sources: Estonian Agricultural Registers and Information Board homepage. Available at: www.pria.ee
HELCOM Baltic Sea Action Plan. Available at: http://www.envir.ee/882607
History of food industry
• In 1991 there was no official rural food industry and little legislation to control it
• Liberal trade policy was implemented after Soviet Union• Russia remained as major export market for decades
(products designed for the Russian market – fish, meat and milk)
• The Association of Estonian Food Industry in 1993• Agricultural supports from EU budget since 2001
Sources: Thorne, S. 2003. Estonian food production. The Anthropology of East Europe Review. Vol 21, No 1: Special Issue: Food and Foodways in Post-Socialistic Eurasia. Available at: http://scholarworks.iu.edu/journals/index.php/aeer/article/viewFile/375/450
Importance of food industry
• Food industry provides about one fifth from the total production of processing industry
• Food industry gives almost 2% of GDP and 8% of industrial product export
• Food industry plays a major role in rural life as the main employer in rural communities
Sources: Estonian Rural Development Plan 2007-2013. Ministry of Agriculture. Available at: http://www.agri.ee/public/juurkataloog/MAK/RDP_2007-2013.pdf
Raudla, H. 2010. Estonian Agriculture. Rural Life. Fisheries. Ministry of Agriculture. Available at: http://www.agri.ee/public/juurkataloog/TRUKISED/Esindustrykis_2010_ENG_3.PDF
Major impacts on environment• In 1970s and 1980s the lakes in Estonia were strongly
affected by fertilizers and farm sewage waters, which caused rapid eutrophication.
• The state of water bodies depend directly on the efficiency on the purification of wastewater
• The most fertile soils are located in the nitrate-vulnerable area
• Land is left out of direct agricultural use (big share of acid soils)
• Wide usage of pesticides and herbicides in Soviet times (record in 1986 when 1 kg of pesticides was used for 1 ha)
Sources: Estonian Rural Development Plan 2007-2013. Ministry of Agriculture. Available at: http://www.agri.ee/public/juurkataloog/MAK/RDP_2007-2013.pdf
Rohtsalu, K. 2001. Põllumajanduskemikaalid. Tallinn Technical University. Available at: http://www.hot.ee/teekaaslane/keskkond.html
Overview of food industry
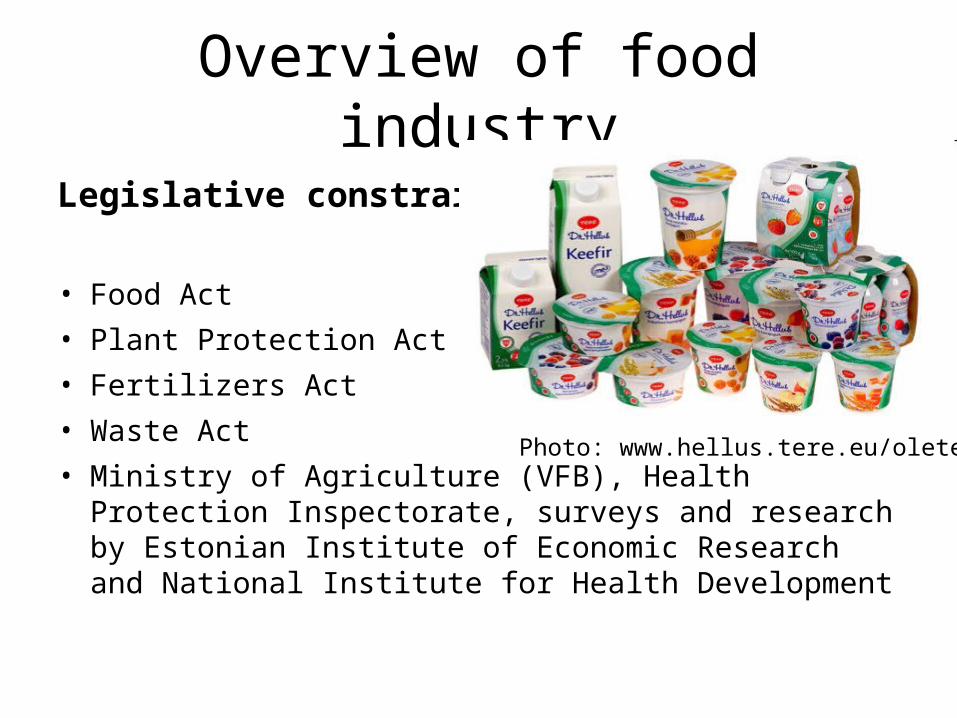
Legislative constraints
• Food Act
• Plant Protection Act
• Fertilizers Act
• Waste Act
• Ministry of Agriculture (VFB), Health Protection Inspectorate, surveys and research by Estonian Institute of Economic Research and National Institute for Health Development
Photo: www.hellus.tere.eu/oleterve
Problems in agriculture and food industry
• The internal market is small
• Weak cooperation between enterprises
• The high price of local basic products. Low purchase power of consumers. EU direct payments are lower than the EU average
• Bad state of technology
• Small enterprises can not achieve EU requirements
• Low population concentration in rural areaSources: Estonian Rural Development Plan 2007-2013. Ministry of Agriculture. Available at:
http://www.agri.ee/public/juurkataloog/MAK/RDP_2007-2013.pdf
Campaigns
• „Acknowledged Estonian taste” (main basic product 100% Estonian)
• National organic food marking (Eco lable -Ökomärk)
• „Notice the flag” campaign
• The nomination of best Estonian food products
• GDA (Guideline Daily Amount) labeling etc.Sources: Association of Estonian Food Industry homepage. Available at:
http://www.toiduliit.ee/Estonian Organic Farming Foundation homepage. Available at: http://www.maheklubi.ee/
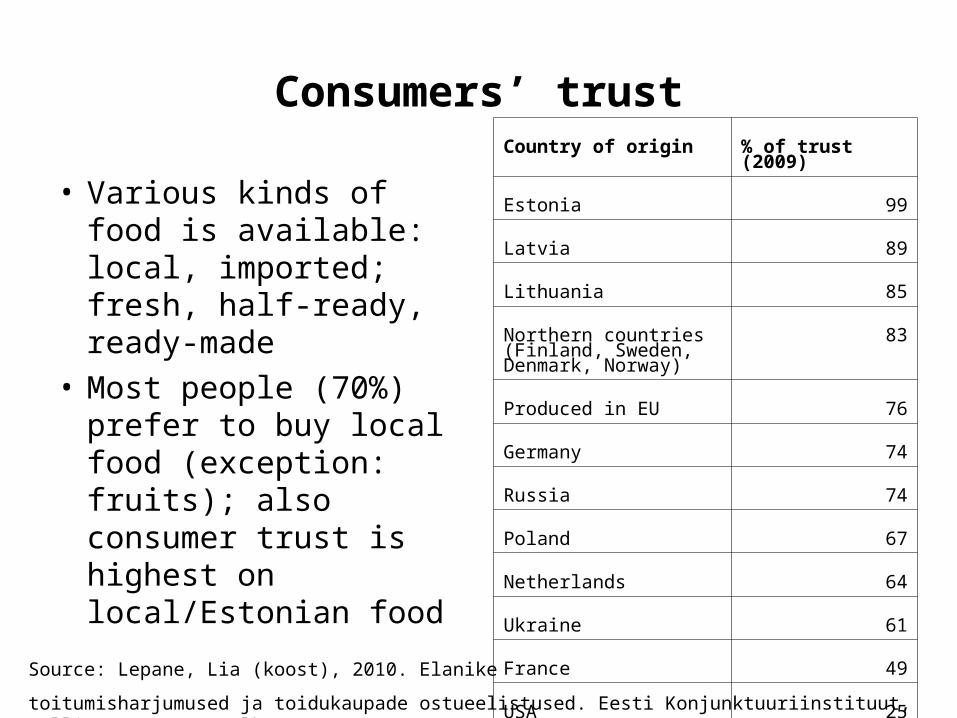
Consumers’ trust
• Various kinds of food is available: local, imported; fresh, half-ready, ready-made
• Most people (70%) prefer to buy local food (exception: fruits); also consumer trust is highest on local/Estonian food
Country of origin % of trust (2009)
Estonia 99
Latvia 89
Lithuania 85
Northern countries (Finland, Sweden, Denmark, Norway)
83
Produced in EU 76
Germany 74
Russia 74
Poland 67
Netherlands 64
Ukraine 61
France 49
USA 25
Source: Lepane, Lia (koost), 2010. Elanike
toitumisharjumused ja toidukaupade ostueelistused. Eesti Konjunktuuriinstituut, Tallinn, 2010. 176 lk.
Consumer trust: quality, healthiness
• Local bread (and bread products), milk & dairy products, flour & cereal products, sweets & pastry products, soft drinks & juices, meat & meat products & sauces, mayonnaises & ketchups were valuated with high quality.
• Less satisfied with quality of local fruits and vegetables.
• Healthy food = fruits, vegetables, milk products, lean meat, fish.
• People are interested getting information about harmful substances in food, however, the topic is difficult for them.
Sources: Lepane, Lia (koost), 2010. Elanike toitumisharjumused ja toidukaupade ostueelistused. Eesti Konjunktuuriinstituut, Tallinn, 2010. 176 lk.Toiduliit, 2008. Tervisliku toitumise tähendus ja sisu Eesti tarbijaskonna seas. Faktum & Ariko. Tallinn, September-Oktoober
2008. 79 lk.
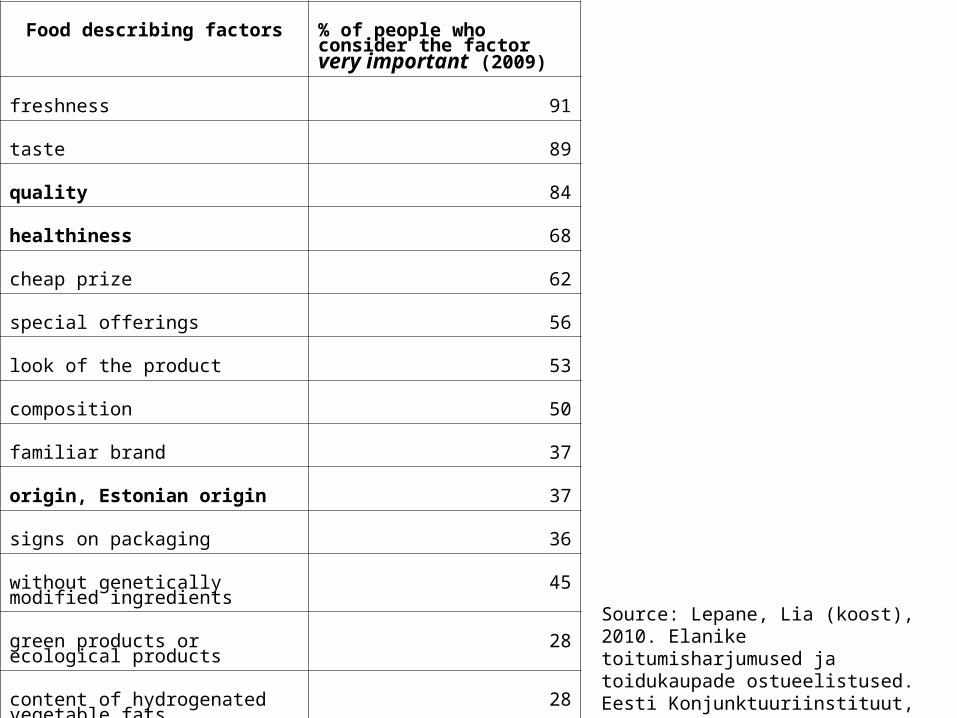
Food describing factors % of people who consider the factor very important (2009)
freshness 91
taste 89
quality 84
healthiness 68
cheap prize 62
special offerings 56
look of the product 53
composition 50
familiar brand 37
origin, Estonian origin 37
signs on packaging 36
without genetically modified ingredients
45
green products or ecological products
28
content of hydrogenated vegetable fats
28
long self life 24
comfortable packaging 14
look of packaging 15
easiness to prepare 16
Source: Lepane, Lia (koost), 2010. Elanike toitumisharjumused ja toidukaupade ostueelistused. Eesti Konjunktuuriinstituut, Tallinn, 2010. 176 lk.
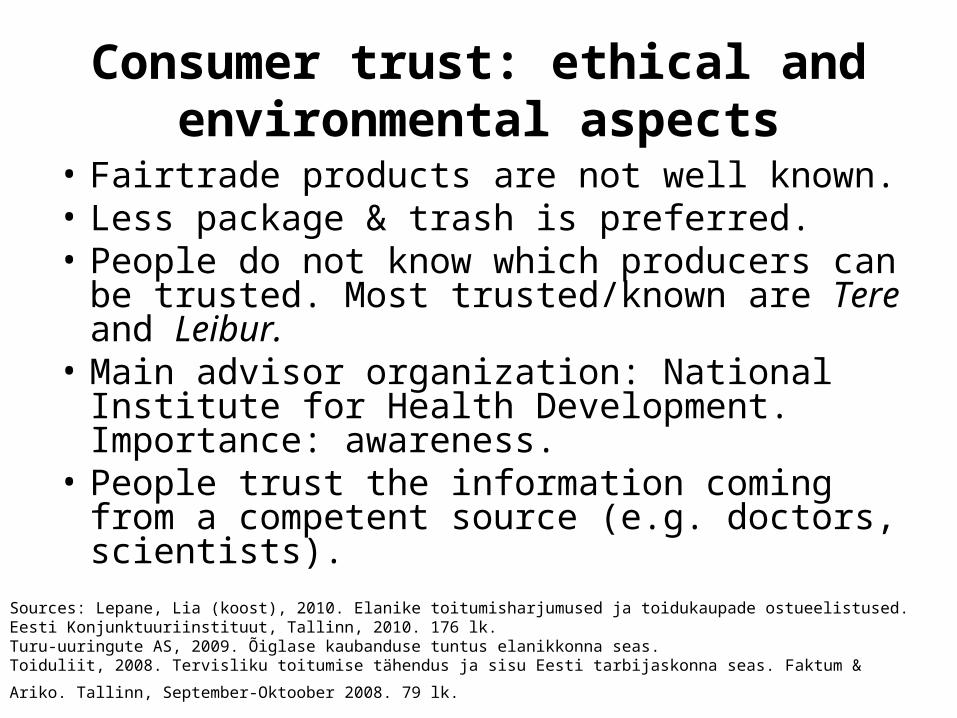
Consumer trust: ethical and environmental aspects
• Fairtrade products are not well known.• Less package & trash is preferred.• People do not know which producers can be
trusted. Most trusted/known are Tere and Leibur.
• Main advisor organization: National Institute for Health Development. Importance: awareness.
• People trust the information coming from a competent source (e.g. doctors, scientists).
Sources: Lepane, Lia (koost), 2010. Elanike toitumisharjumused ja toidukaupade ostueelistused. Eesti Konjunktuuriinstituut, Tallinn, 2010. 176 lk.Turu-uuringute AS, 2009. Õiglase kaubanduse tuntus elanikkonna seas.Toiduliit, 2008. Tervisliku toitumise tähendus ja sisu Eesti tarbijaskonna seas. Faktum & Ariko. Tallinn, September-Oktoober
2008. 79 lk.
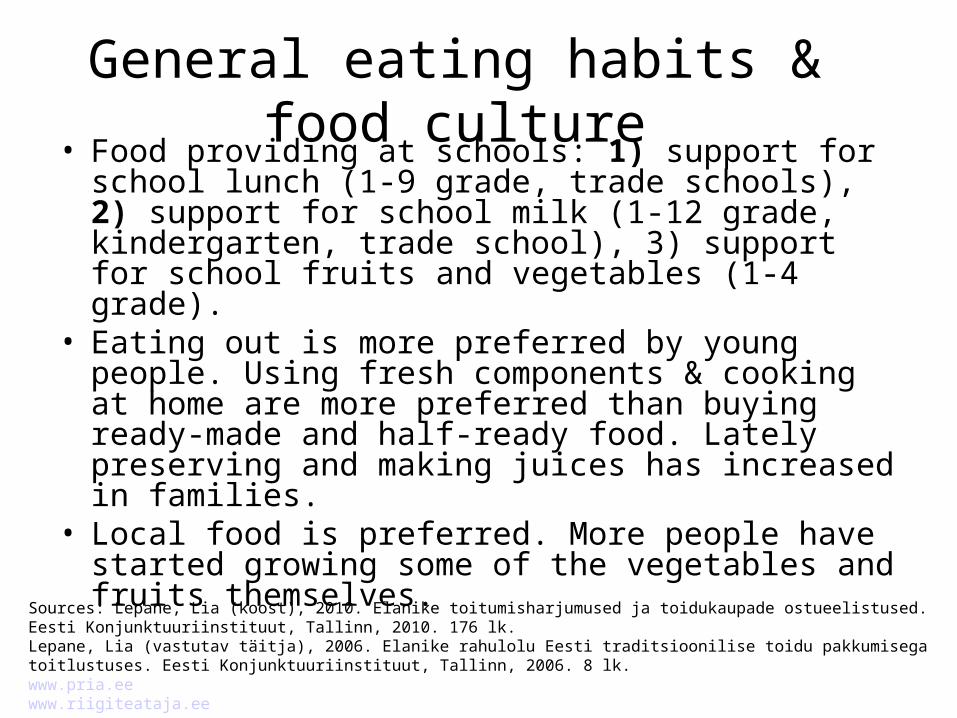
General eating habits & food culture• Food providing at schools: 1) support for school
lunch (1-9 grade, trade schools), 2) support for school milk (1-12 grade, kindergarten, trade school), 3) support for school fruits and vegetables (1-4 grade).
• Eating out is more preferred by young people. Using fresh components & cooking at home are more preferred than buying ready-made and half-ready food. Lately preserving and making juices has increased in families.
• Local food is preferred. More people have started growing some of the vegetables and fruits themselves.
Sources: Lepane, Lia (koost), 2010. Elanike toitumisharjumused ja toidukaupade ostueelistused. Eesti Konjunktuuriinstituut, Tallinn, 2010. 176 lk.Lepane, Lia (vastutav täitja), 2006. Elanike rahulolu Eesti traditsioonilise toidu pakkumisega toitlustuses. Eesti Konjunktuuriinstituut, Tallinn, 2006. 8 lk.www.pria.eewww.riigiteataja.ee
References:• Elanike toitumisharjumused ja toidukaupade ostueelistused, 2010• Tervisliku toitumise tähendus ja sisu Eesti tarbijaskonna seas, 2008 • Elanike rahulolu Eesti traditsioonilise toidu pakkumisega toitlustuses, 2006 • Elanike toitumisharjumused ja toidukaupade ostueelistused, 2010• Õiglase kaubanduse tuntus elanikkonna seas, 2009.; • Tervisliku toitumise tähendus ja sisu Eesti tarbijaskonna seas, 2008• Association of Estonian Food Industry/Toiduliit Orro, E (koost). 2010. Kohalike mahepõllumajandustoodete ja -toidukaupade turg Eestis 2009.
aastal. Eesti Konjuktuuriinstituut. Tallinn. Available at: http://www.agri.ee/public/juurkataloog/UURINGUD/Kohalike_mahep6llumajandustoodete_turg_Eestis_2007.pdf
Estonian Organic Farming Foundation. 2011. Mahepõllumajandus Eestis. Organic Farming In Estonia 2010. Ministry of Agriculture. Available at: http://www.maheklubi.ee/upload/Editor/New%20Folder/mahepoll_eestis_2010-1.pdf
• www.envir.ee• www.riigiteataja.ee• www.pria.ee • www.agri.ee
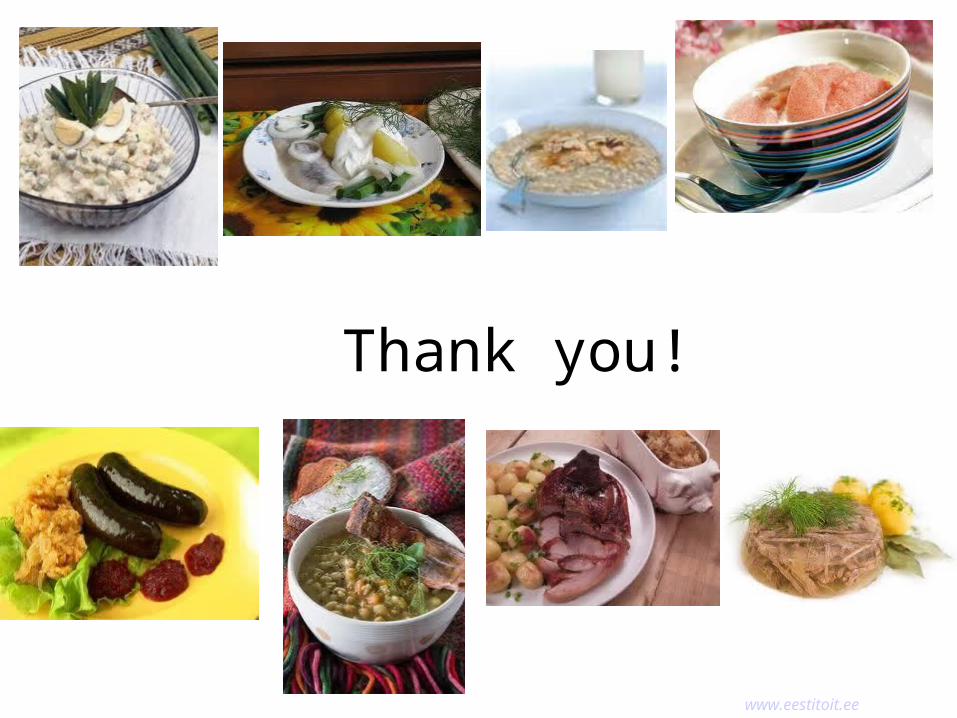
Thank you!
www.eestitoit.ee
![Liina esitlus 19.12.2017 [Kirjutuskaitstud]...Title Microsoft PowerPoint - Liina esitlus 19.12.2017 [Kirjutuskaitstud] Author kaisa.knight Created Date 1/3/2018 2:23:55 PM](https://img.pdfslide.tips/doc/110x75/60caa1d3b9cf7423835871fd/liina-esitlus-19122017-kirjutuskaitstud-title-microsoft-powerpoint-liina.jpg)