Embed Size (px)
Citation preview

Atlanta Regional Commission Atlanta, Georgia
Comprehensive Annual Financial Report
Fiscal Year Ended December 31, 2017
Prepared By The Financial Service Group

Union City
Kennesaw
Buford
Fairburn
Hampton
Fayetteville
WoolseyPeachtree
City
Nelson
Brooks
Auburn
Jonesboro
MorrowRiverdale
Douglasville
McDonough
Villa Rica
Braselton
Lake CityForest Park
Waleska
Hapeville
SandySprings
Alpharetta
Palmetto
Johns Creek
College Park
Milton
East Point
Roswell
Canton
Austell
Marietta
Lithonia
StoneMountain
Dunwoody LawrencevilleDaculaBerkeley Lake
NorcrossPeachtree Corners
SugarHill
Suwanee
Loganville
Acworth
Lovejoy
PowderSprings
BallGround
Duluth
Lilburn
Woodstock
Holly Springs
ChambleeSnellville
Conyers
Grayson
Locust Grove
Tyrone
Brookhaven
Doraville
DecaturClarkston
Smyrna
Atlanta
Tucker
Chattahoochee Hills
AvondaleEstates
Stockbridge
StonecrestSouth Fulton
MountainPark
PineLake
RestHaven
Fayette
Rockdale
Cobb
ClaytonHenry
Gwinnett
Fulton
DouglasDeKalb
Cherokee
The Atlanta Region
Ü0 10 205 Miles
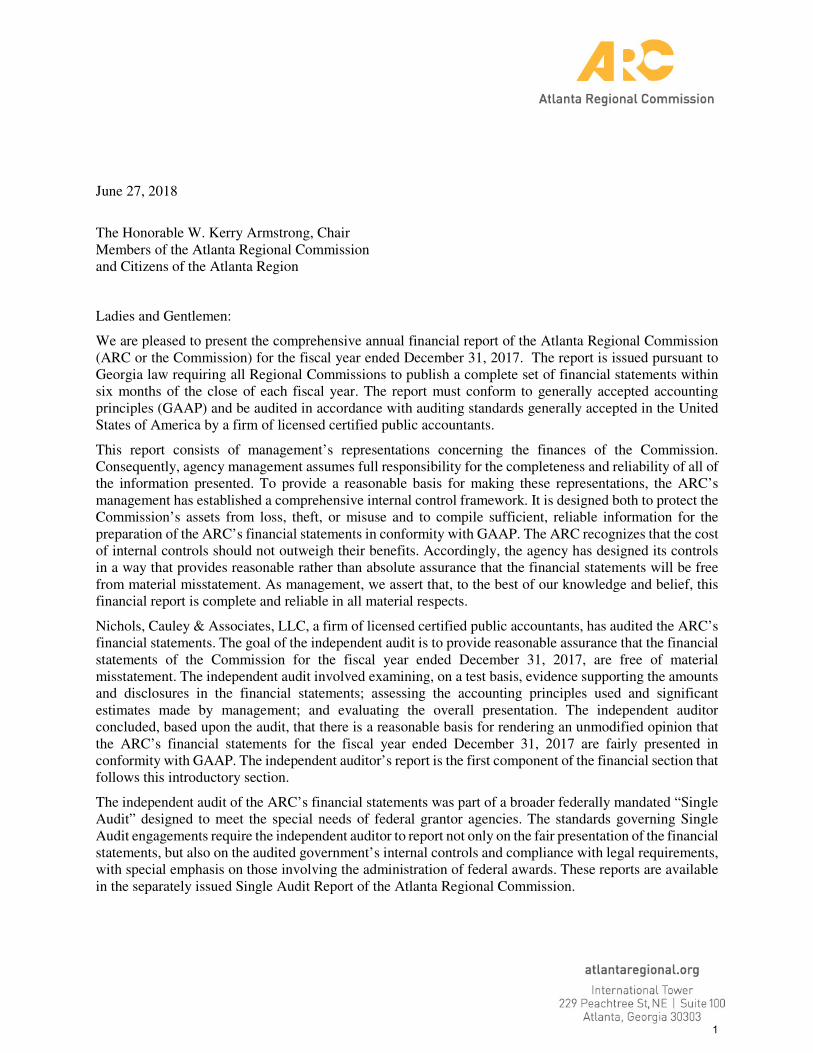
The Atlanta Regional Commission ("ARC") created in 1971 by local governments of the Atlanta Region, includes Cherokee, Clayton, Cobb, DeKalb, Douglas, Fayette, Fulton, Gwinnett, Henry and Rockdale counties and 73 municipalities including the City of Atlanta. ARC is the regional planning and intergovernmental coordination agency for the Region. It is also the forum where the Region's leaders come together to solve mutual problems and decide issues of regionwide consequence. ARC is supported by local, state and federal funds. Board membership on the ARC is held by 23 local elected officials, 15 private citizens and one non-voting member appointed by the Board of the Georgia Department of Community Affairs. The Atlanta Regional Commission is committed to the principle of affirmative action and shall not discriminate against otherwise qualified persons on the basis of race, color, religion, national origin, sex, age, physical or mental handicap, or disability in its recruitment, employment, facility and program accessibility or service.
10/6/2017

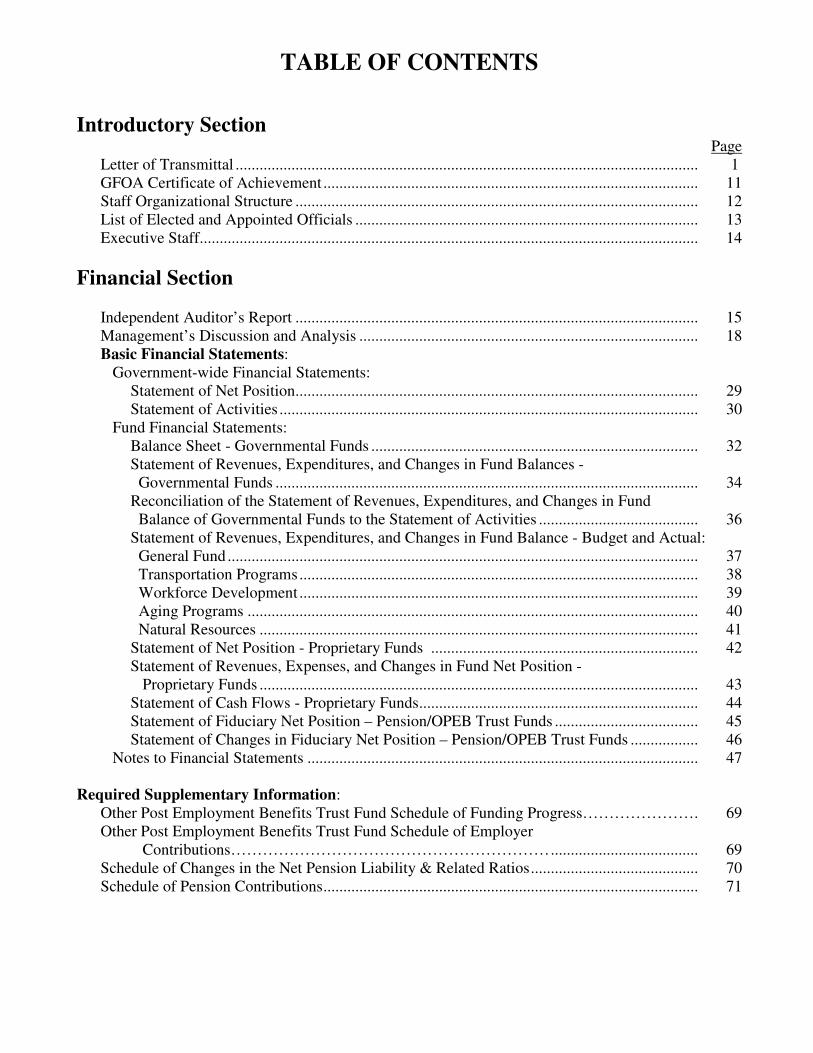
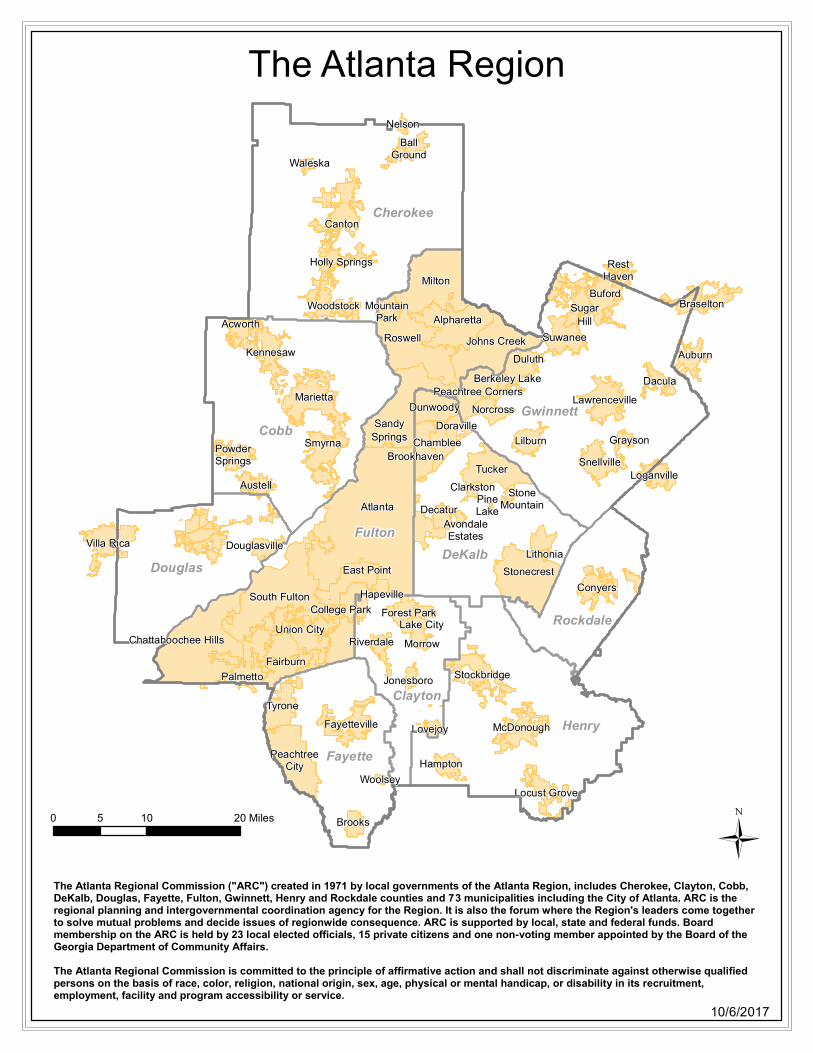
TABLE OF CONTENTS
Introductory Section Page
Letter of Transmittal .................................................................................................................... 1
GFOA Certificate of Achievement .............................................................................................. 11
Staff Organizational Structure ..................................................................................................... 12
List of Elected and Appointed Officials ...................................................................................... 13
Executive Staff ............................................................................................................................. 14
Financial Section
Independent Auditor’s Report ..................................................................................................... 15
Management’s Discussion and Analysis ..................................................................................... 18
Basic Financial Statements:
Government-wide Financial Statements:
Statement of Net Position ..................................................................................................... 29
Statement of Activities ......................................................................................................... 30
Fund Financial Statements:
Balance Sheet - Governmental Funds .................................................................................. 32
Statement of Revenues, Expenditures, and Changes in Fund Balances -
Governmental Funds .......................................................................................................... 34
Reconciliation of the Statement of Revenues, Expenditures, and Changes in Fund
Balance of Governmental Funds to the Statement of Activities ........................................ 36
Statement of Revenues, Expenditures, and Changes in Fund Balance - Budget and Actual:
General Fund ...................................................................................................................... 37
Transportation Programs .................................................................................................... 38
Workforce Development .................................................................................................... 39
Aging Programs ................................................................................................................. 40
Natural Resources .............................................................................................................. 41
Statement of Net Position - Proprietary Funds ................................................................... 42
Statement of Revenues, Expenses, and Changes in Fund Net Position -
Proprietary Funds .............................................................................................................. 43
Statement of Cash Flows - Proprietary Funds ...................................................................... 44
Statement of Fiduciary Net Position – Pension/OPEB Trust Funds .................................... 45
Statement of Changes in Fiduciary Net Position – Pension/OPEB Trust Funds ................. 46
Notes to Financial Statements .................................................................................................. 47
Required Supplementary Information:
Other Post Employment Benefits Trust Fund Schedule of Funding Progress………………… . 69
Other Post Employment Benefits Trust Fund Schedule of Employer
Contributions…………………………………………………… ..................................... 69
Schedule of Changes in the Net Pension Liability & Related Ratios .......................................... 70
Schedule of Pension Contributions .............................................................................................. 71
TABLE OF CONTENTS (Continued)
Combining Nonmajor Fund Statements and Schedules: Page Non Major Governmental Funds ............................................................................................................. 72
Combining Balance Sheet - Non Major Governmental Funds .......................................................... 73
Combining Statement of Revenues, Expenditures and Changes in Fund Balance -
Non Major Governmental Funds ..................................................................................................... 74
Schedule of Revenues, Expenditures, and Changes in Fund Balance - Budget and Actual:
Research & Analytics .................................................................................................................... 75
Schedule of Revenues, Expenditures, and Changes in Fund Balance - Budget and Actual:
Community Development .............................................................................................................. 76
Schedule of Revenues, Expenditures, and Changes in Fund Balance - Budget and Actual:
Homeland Security & Recovery .................................................................................................... 77
Non Major Enterprise Funds .................................................................................................................... 78
Combining Statement of Net Position - Non Major Enterprise Funds .............................................. 79
Combining Statement of Revenues, Expenses and Changes in Fund Net Position -
Non Major Enterprise Funds ........................................................................................................... 80
Combining Statement of Cash Flows - Non Major Enterprise Funds ............................................... 82
Fiduciary Funds .................................................................................................................................... . 84
Combining Statement of Fiduciary Net Position-Pension/OPEB Trust Funds ……………...... ..... 85
Combining Statement of Changes in Fiduciary Net Position – Pension/
OPEB Trust Funds …………………………………………………………………………........... 86
Statistical Section (Unaudited) TABLE PAGE
Net Position by Component – Last Ten Fiscal Years .......................................................... I 89
Changes in Net Position – Last Ten Fiscal Years ................................................................ II 90
Fund Balance of Governmental Funds – Last Ten Fiscal Years ......................................... III 92
Changes in Fund Balances of Governmental Funds – Last Ten Fiscal Years ..................... IV 93
Expenditures by Element ..................................................................................................... V 94
General Fund Revenue from External Sources – Last Ten Fiscal Years ............................. VI 96
Miscellaneous Statistical Data………………………………………………………… .... VII 97
Principal Employers in the Atlanta Region .................................................................... …. VIII 102
Education Facilities…………………………………………………………………… IX 103
Area Hospitals …………………………………………………………………… X 105
Review and Comment Activity – Last Ten Fiscal Years……………………………… XI 106
Full-time Equivalent Employees by Function…..…………………………………….. XII 107
Development Guides: Past and Present……………………………………………….. XIII 108
Supplemental Information
Schedule of Expenditures of Federal Awards.................................................................................... 113
Schedule of Agency Wide Central Support Services and Indirect Expenses .................................... 116
Schedule of Agency Wide Central Support Services Indirect Costs and Recoveries........................ 118
Schedule of Fringe Benefits and Recoveries ..................................................................................... 119
Schedule of Insurance In Force………………………………………………………………… ...... 120
Schedule of Agency Vehicles ............................................................................................................ 122
Salaries of Principal Employees (Exempt Positions) Pay Ranges and
Classifications (Classified Service)…………………………………………………. ...... ……… 123
Schedule of Employee Salary and Travel Expenses .......................................................................... 124
June 27, 2018
The Honorable W. Kerry Armstrong, Chair
Members of the Atlanta Regional Commission
and Citizens of the Atlanta Region
Ladies and Gentlemen:
We are pleased to present the comprehensive annual financial report of the Atlanta Regional Commission
(ARC or the Commission) for the fiscal year ended December 31, 2017. The report is issued pursuant to
Georgia law requiring all Regional Commissions to publish a complete set of financial statements within
six months of the close of each fiscal year. The report must conform to generally accepted accounting
principles (GAAP) and be audited in accordance with auditing standards generally accepted in the United
States of America by a firm of licensed certified public accountants.
This report consists of management’s representations concerning the finances of the Commission.
Consequently, agency management assumes full responsibility for the completeness and reliability of all of
the information presented. To provide a reasonable basis for making these representations, the ARC’s
management has established a comprehensive internal control framework. It is designed both to protect the
Commission’s assets from loss, theft, or misuse and to compile sufficient, reliable information for the
preparation of the ARC’s financial statements in conformity with GAAP. The ARC recognizes that the cost
of internal controls should not outweigh their benefits. Accordingly, the agency has designed its controls
in a way that provides reasonable rather than absolute assurance that the financial statements will be free
from material misstatement. As management, we assert that, to the best of our knowledge and belief, this
financial report is complete and reliable in all material respects.
Nichols, Cauley & Associates, LLC, a firm of licensed certified public accountants, has audited the ARC’s
financial statements. The goal of the independent audit is to provide reasonable assurance that the financial
statements of the Commission for the fiscal year ended December 31, 2017, are free of material
misstatement. The independent audit involved examining, on a test basis, evidence supporting the amounts
and disclosures in the financial statements; assessing the accounting principles used and significant
estimates made by management; and evaluating the overall presentation. The independent auditor
concluded, based upon the audit, that there is a reasonable basis for rendering an unmodified opinion that
the ARC’s financial statements for the fiscal year ended December 31, 2017 are fairly presented in
conformity with GAAP. The independent auditor’s report is the first component of the financial section that
follows this introductory section.
The independent audit of the ARC’s financial statements was part of a broader federally mandated “Single
Audit” designed to meet the special needs of federal grantor agencies. The standards governing Single
Audit engagements require the independent auditor to report not only on the fair presentation of the financial
statements, but also on the audited government’s internal controls and compliance with legal requirements,
with special emphasis on those involving the administration of federal awards. These reports are available
in the separately issued Single Audit Report of the Atlanta Regional Commission.
1
The Honorable W. Kerry Armstrong, Chair
June 27, 2018
Page 2
GAAP requires that management provide a narrative introduction, overview, and analysis to accompany the
basic financial statements in the form of Management’s Discussion and Analysis (MD&A). This letter of
transmittal is designed to complement the MD&A and should be read in conjunction with it. The ARC’s MD&A
can be found immediately following the report of the independent auditors.
The Commission’s comprehensive annual financial report contains supplementary information which was not
audited by Nichols, Cauley & Associates, LLC and on which they express no opinion.
Profile of the Atlanta Regional Commission
The ARC, created in 1971, is a multi-purpose, comprehensive regional planning agency serving the 10-county
Atlanta region, which covers almost 3,000 square miles and includes the City of Atlanta and all or part of 73
other municipalities. These 10 counties account for 65 percent of the population and 86 percent of the jobs in
Metropolitan Atlanta, one of the nation’s fastest growing economic centers.
The Commission’s Board has 39 members, of which 23 are local elected officials representing general-purpose
local governments. The agency, formed pursuant to State law (Official Code of Georgia Annotated (OCGA) 50-
8-80 et seq. or Act 5), is also one of 12 regional commissions (RCs) established by the Georgia Planning Act of
1989 (OCGA 50-8-30 et seq.). In the event of any conflict between the two laws, the law creating RCs states
that the ARC’s enabling law shall control and govern.
The Commission's federally assisted planning responsibilities include designation as a Metropolitan Planning
Organization (MPO) for transportation planning, in addition to being the Area Agency on Aging, which has the
responsibility for providing nutrition, health, social services, employment programs for the elderly, and
promoting lifelong communities. The ARC’s state-assigned planning responsibilities include, but are not limited
to, environmental, land use, parks and open space, housing and human services. It is noteworthy that the
Commission is the single governing body providing unified policy direction to each of the cited programs. The
ARC carries out these programmatic responsibilities through a fully integrated, interfunctional planning process.
In addition, the ARC acts as the administrative agent of the Atlanta Regional Workforce Board to provide a
broad array of services to expand job skills of workers and assist businesses with their employment needs in
seven counties. ARC also serves as staff to the Metropolitan North Georgia Water Planning District.
The Commission exercises extensive review and comment responsibilities. Under Presidential Executive Order
12372, it reviews proposed applications for federal assistance within the region. O.C.G.A. 50-8-80 thru 50-8-
103, provides for the ARC to review and comment on any “Area Plan,” defined as a proposed plan that affects
more than one governmental jurisdiction. The 1989 planning act extended this authority by requiring all regional
development centers to review developments of regional impact (DRIs) or certain large-scale proposals that
portend intergovernmental impacts. In addition, the Metropolitan River Protection Act requires the ARC’s
review of development proposals in the Chattahoochee River Corridor.
Factors Affecting Financial Condition
The information presented in the financial statements is perhaps best understood when it is considered from the
broader perspective of the specific environment within which the Atlanta Regional Commission operates.
Local Economy. The 2010 Census of the Atlanta Regional Commission 10-county area showed that the Region
grew by 678,000 people over the 2000s, for an average annual growth of 1.8 percent, and was home to 4.1
million people as of April 1, 2010. From 2010 to 2017, ARC estimates that the region added 372,350 persons
to total 4.48 million people, an average annual growth rate of 1.2 percent (up from 1.1 percent between 2010
and 2015). The 2010-2017 average annual population increase of 53,193 was still significantly lower than the
2
The Honorable W. Kerry Armstrong, Chair
June 27, 2018
Page 3
67,837 new residents averaged per year during the 2000s, and far lower than the 87,158 new residents per year
averaged during the 1990s. However, the 78,300 increase of 2016-2017 trailed 2015-2016 only slightly as the
largest annual growth during the decade to date.
The impact of the severe national and regional recession that began in December 2007 and ended in June 2009
was both lagged and resilient. Population growth slowed significantly, as did job growth even more dramatically.
For the calendar years of 2014-2017, however, housing permit levels bounced back substantially, though still
not to pre-recession levels in almost all jurisdictions. 2017 saw some slowing compared to 2016 levels. The
vacant home oversupply of the recession and its aftermath has almost totally abated, particularly due to
significant strength in the market for existing homes. While there is the good news of foreclosure problems
receding to pre-recession levels except in a few hot-spots, there has been a corollary effect of constraining
marketplace supply of existing homes. There are now under four months of supply in most single-family price
segments. While there is some momentum for new single-family construction, most activity underway is focused
on higher-priced market niches. Multifamily construction boomed 2014-2015 (particularly in core areas such as
the City of Atlanta condo market) and continues in those core areas with tapering in 2016 and significant slowing
in 2017. As for commercial space, while office and industrial vacancies are dropping, retail vacancies are
increasing with the shift of consumer demand away from brick and mortar stores to online shopping. There is
significant new construction (largely build to suit, but spec development increasing) only in the industrial
market.
Yet while construction in most sectors has rebounded to an extent, things are not now and are not likely to be
“business as usual”, at least not as the phrase would be defined in prior decades. Series 15 ARC forecasts indicate
that population increase through to the end of its forecast horizon will average about 1.5 percent per year, lagging
the 3% average annual increases of the 1980s and 1990s, and just behind the 1.8% average annual growth in the
2000s.
Since 1980, the Atlanta region’s population has increased by almost 140 percent, adding 2.58 million new
residents. Put another way, over 60 percent of the region’s growth since 1900 has occurred after 1980. Over the
65+ years since 1950, Atlanta’s population has grown at an average annual rate of 2.6 percent. Sustaining so
high a rate over this period clearly demonstrates the underlying strength of the region’s diversified economy.
Overall, the regional economy remains well balanced and serves as an economic development engine for the
Southeast and for the nation. Between 1980 and 2000, the Region added 1,090,343 jobs, (121 percent). The two
major recessions of the 2000s (the dotcom bust of the early decade followed by the Great Recession of 2007-
2009) “shifted downward” the historical growth trend over the past decade. Unemployment rates in the metro
area soared from 3.6% in 2001 to 10.7% in January 2010, but back down to 3.6 percent as of April, 2018.
For the ARC 10-county region, the job base declined by almost 400,000 jobs 2000-2010 (20 percent). Since
2010, the job base has slowly bounced back, with data from the Georgia Department of Labor showing consistent
positive (monthly) trends in employed persons for the Atlanta Regional Commission. By late 2013, the job base
had finally recovered to the pre-recession levels of late 2007. Unemployment rates have dropped significantly
from the highs of 2010 -- to 5.1% as of March 2016 and then down even more sharply to 3.6% by April of 2018.
This recent rate is a dramatic decline from the 10.0% reported in March 2010 and is lower than pre-recession
rates. Over the long term, ARC forecasts that the Region will average about 42,000 new jobs per year. While
impressive net growth, this is appreciably lower than the record job growth (approaching 90,000 jobs per year)
observed in the late 1990s.
From 1980 to present, the mix of jobs has shifted toward the Services and Trade sectors at the expense of the
relative ranking of Government and Manufacturing, which have both declined in jobs. Services and Trade
account for 90% of the Region’s increase in jobs over the 35+-year period. Despite the dominance of Services
and Trade, all major industry groups (besides Government and Manufacturing) posted net gains in jobs during
3
The Honorable W. Kerry Armstrong, Chair
June 27, 2018
Page 4
this period. Part of this shift in industry is illusory, as privatization of public facilities such as hospitals shifted
thousands of jobs from Government to Services.
Other economic “macro trends” should be mentioned as well. Critical elements of the recent recovery have been
the large share of “net new” jobs that are part-time and low-paying, the stagnation of wage and job growth in
middle-wage and middle-wage sectors, and the rapidly increasing educational expectations of employers in both
the middle-skill and higher-skill sectors. While industry demand for workers in Services is likely to increase,
the future may bring downward trends (or at least lower net growth) in Retail and Wholesale Trade employment.
The uncertain impacts of automation along with demographically and skill-driven shrinkage in the labor force
also present challenges of longer-term economic health of the region.
Long-term financial planning. Two provisions of Act 5 give the ARC a level of stability that is distinctive
among the nation’s substate planning agencies. These are mandatory funding by the ten counties and the City
of Atlanta and prior approval by the Georgia General Assembly before a county may withdraw from the
Commission.
In addition, management prepares financial forecasts to help anticipate future financial resources needed to
maintain critical programs for the ARC service area. Relying on these forecasts, the Commission’s Budget and
Audit Review Committee garnered the support of the full Board for a dues increase. The legislation authorizing
the dues increase provided the ARC’s local funding to rise from $.80 per capita to $.90 effective January 1, 2002
and to $1.00 effective January 1, 2003. In addition, the law gave the Board sole authority over future increases
when triggered by rises in the Consumer Price Index. During the 2017 Budget preparation, the ARC Board of
Directors authorized a $.10 per capita dues increase effective January 1, 2017.
Major Initiatives. ARC’s Transportation Access and Mobility Group (TAMG) has two primary core products
that it develops; 1) the Regional Transportation Plan (RTP) and the 2) Transportation Improvement Program
(TIP). The Atlanta Region’s Plan, a major joint effort involving all ARC groups, was completed and adopted
by the ARC Board in February 2016. The Plan includes significant updates to regional land use and growth
strategies, including population forecasts, while updating regional policies and transportation concepts through
the year 2040. As part of The Atlanta Region’s Plan, the RTP includes over $93 billion in investments through
the year 2040, including major updates to the regional managed lane and transit strategies. Since the plan’s
original adoption, ARC has undertaken five amendments and nine rounds of quarterly administrative
modifications. The next major quadrennial update of the plan will be completed in early 2020.
Several initiatives in 2018 continue to build on the foundation of The Atlanta Region’s Plan:
• ARC will assist in reviewing and implementing regional transit governance (ATL Authority) legislation
passed by the Georgia General Assembly during the 2018 session.
• TAMG will coordinate with the Mobility Services Group on completing an update to the regional transit
vision, a process which began in late 2016.
• TAMG will complete the development of a Regional Truck Parking Assessment and a Regional Bicycle
and Pedestrian Safety Action Plan, both of which got underway in 2017.
• TAMG manages the County Transportation Program (CTP), providing funding and staffing for county-
level long range transportation planning initiatives as well as the City of Atlanta. The City of Atlanta
and Gwinnett County completed CTP updates in 2016, with work ongoing in Clayton County, Fayette
County, Forsyth County and northern Fulton County. All four of those updates will be completed in
2018. Procurement and contracting activities will also be underway in the latter half of 2018 for updates
in Cobb County, DeKalb County and southern Fulton County. The first two updates will focus on
establishing transit visions for those jurisdictions and preparing for possible future funding referenda
under the ATL legislation.
4
The Honorable W. Kerry Armstrong, Chair
June 27, 2018
Page 5
• TAMG will be managing several new regional planning studies using consultant assistance, including
an update to the Regional Transportation System Management & Operations Vision and ITS
Architecture Plan, development of the Chattahoochee Greenway Trail Plan, development of an outreach
and engagement plan for the next TIP/RTP update, and conducting a transit onboard survey used for
regional travel demand model calibration.
• TAMG will be providing management oversight over numerous local planning studies, including four
freight cluster plans, identified through a TIP funding solicitation process which got underway in 2017
and will be completed via TIP/RTP amendments in 2018.
• TAMG will be managing the procurement process on behalf of MARTA, Cobb County and SRTA to
identify a vendor for implementation of a Regional Bus Stop Signage Program.
• ARC continues to be actively involved in reviewing and implementing federal rulemaking requirements
related to transportation performance measures and targets.
ARC’s Mobility Services Group is responsible for supporting and coordinating transportation demand
management activities, regional transit service providers, human service transportation service planning and
provision as well as the development of technological solutions to transportation related issues. In 2017, the
division undertook a number of significant initiatives:
• Regional Transit Vision Update – The regional transit vision update process continued through 2017
finalizing the project list, evaluating and determining the best technologies available to evaluate the
projects and developing evaluation criteria. All projects were evaluated and the plan update will be
complete mid-2018.
• Fulton County Transit Master Plan – Mobility Services staff developed the scope and managed the
Fulton County Transit Master Plan process. This involved extensive stakeholder and community
outreach, oversight of the development of the financial model, funding scenarios, and mode
selection. Mobility Services staff also planned and executed a transit scouting trip to Los Angeles to
ensure Fulton County leaders experienced and fully understood BRT and LRT options.
• Group TAM Plan – Mobility Services staff initiated a Group TAM Plan for CPACS, and Gwinnett,
Henry and Douglas Counties. This TAM Plan will outline current targets for State of Good Repair
(SGR) for each asset class owned and operated by the group plan participants. The plan will also outline
policies and procedures required to maintain SGR and will prioritize and project capital replacement
costs. This plan will be completed by October 2018.
• Regional Bus Stop Sign – Mobility Services staff continued work on the regional procurement process
for fabricating and installing new bus stop signs at all shared stop locations in the CobbLinc, GCT,
SRTA and MARTA service areas. Technical documents for design and installation and an RFP were
developed and procurement will be complete mid-2018.
• Georgia Commute Options (GCO) – As the regional transportation demand management (TDM) arm
for the region, the Mobility Services Group officially assumed management of the Georgia Commute
Options program in April/May of 2017 and procured several program consultants to assist with employer
outreach, incentives management, performance evaluation and marketing and communications for the
program. In addition, the GCO team facilitated the transition of all marketing elements, employer
outreach functions, incentives’ operations and schools’ management.
Extensive research and analysis was conducted on the program to aid in the development of the new
marketing and communications plan, the employer outreach approach and methodology and the schools’
engagement strategy.
In 2017, GCO promoted and/or launched several mode-specific promotions and TDM-related programs
such as the TDM Regional Summit, FlexWork Summit, Biketober: Atlanta Bike Challenge and National
School Bus Safety Week. In addition, Mobility Services assists regional transportation management
associations (TMAs) with modal shift marketing campaign and strategies.
5
The Honorable W. Kerry Armstrong, Chair
June 27, 2018
Page 6
• Transportation Technology– Mobility Services coordinated and managed the inaugural ConnectATL
Summit in 2017. This summit was largely successful and provided a framework for how community
leaders, civic leaders and business leaders can work together to create a stronger, better connected and
more prosperous Atlanta region. A second ConnectATL Summit is scheduled for 2018.
In 2017, the Community Development Group conducted a Strategic Planning framework with SixPitch Inc., to
determine how the Group should view projects and update the Livable Centers Initiative Program. The result of
this work, led to the development of the four core values of: Mobility; Equity; Resiliency; and Prosperity.
In 2017, the Community Development Group in partnership with the Aerotropolis Atlanta Alliance (the
Alliance), supported the transition of the Aerotropolis Atlanta Alliance (the Alliance), to be a self-supporting
organization with an Executive Director with the continued support of ARC, the Alliance will continue to focus
on coordination among local efforts, marketing and branding of the airport area and to increase private
investment in the communities surrounding the airport.
The Community Development Group continues to provide resources to implement plans at MARTA rail station
areas. In 2017, ARC continued to support the TransFormation Alliance by hosting its Managing Director. The
Community Development Group’s previous work in supporting MARTA TOD led to the construction of TOD
Developments at two MARTA stations, and the Community Development Group is continuing to work with
MARTA on other opportunities.
ARC continued to implement The Atlanta Region’s Plan to meet not only its state requirements for regional
planning but to align local, state and regional policies to continue to support future growth. These elements
included a Regional Resource Plan, Minimum Standards for Local Government Implementation and a detailed
Unified Growth Policy Map (UGPM) coordinated with local government Comprehensive Plans.
The Community Development Group continued reviews of Developments of Regional Impact (DRI) and
reviewing local Comprehensive Plans, Short Term Work Programs and Capital Improvement Elements. ARC
reviewed 32 DRIs in 2017.
In 2012, the Georgia Department of Community Affairs mandated regional commissions to assist local
governments in meeting their basic planning requirements with no financial contribution from local
governments. The Community Development Group completed 10 plans in 2017. Since 2012, the Community
Development Group has completed 56% of all Comprehensive Plans within the region.
ARC’s Natural Resources Group continues to provide administrative and technical planning support to the
Metropolitan North Georgia Water Planning District, which provides regional planning for water resources and
water quality in the 15 counties surrounding and including the City of Atlanta. The District completed work on
the update to the Water Resource Management Plan which was adopted in June 2017. Technical planning
included support for the newly adopted Water Resource Management Plan. The District started the Single-
Family Toilet Rebate Program in March 2008. Between March 2008 and December 31, 2017, the District rebate
program and partners have replaced over 130,000 old, inefficient toilets with new low-flow toilets.
ARC continued the Green Communities program, certifying 8 communities in 2017. ARC also continued the
Sustainable Connections Internship Program in 2017, matching 4 students with 4 communities on projects
ranging from green certification to materials reuse and recycling. In addition, ARC continued its role in
administration of the Chattahoochee Corridor Plan under the Metropolitan River Protection Act. ARC provided
technical support and several workshops for communities related to the update to the Georgia Stormwater
Manual completed in early 2016. ARC also coordinated legal and technical support for ongoing efforts related
to water supply in the Apalachicola-Chattahoochee-Flint and Alabama-Coosa-Tallapoosa river basins.
6
The Honorable W. Kerry Armstrong, Chair
June 27, 2018
Page 7
In 2017, The Research and Analytics Group (RAG) completed major jurisdiction estimates for population in
2017, and finished a portion of preparatory work for development of 2017 employment estimates. For the
geographic information specialists of the group, extensive work went into beginning a new round of spatial data
collection, and refining associated city boundaries in the region. The GIS group continued assisting GDOT’s
MAP-21 effort both in terms of project management and technical work—all to update the geography of and
attributes for the state’s street spatial database. With completion of the Boundary Annexation Survey (BAS)
assistance in 2016, 2017 was a significant “ramp-up” year for the Local Update of Census Addresses (LUCA)
process, involving aid to local governments in generating updated lists for the 2020 Census count.
2017 marked a transition from a forecast production hiatus in 2016 to a year of earnest planning and early work
on a new forecast series for the 2020 Atlanta Region’s Plan update. The primary work of the modeling groups
in 2017 zeroed in on completion of needed refinements and calibrations for the transportation-focused Activity-
Based Model (ABM), the land use/ socioeconomic focused REMI (regional forecast) and PECAS (small-area
allocation) models—with the overarching goal of better performance on the forthcoming conformity forecast
series. Modeling for the region’s updated Transportation Improvement Plan (TIP) was completed in 2017. The
PECAS model was also used in initial evaluations of the impacts of growth scenarios for the City of Atlanta.
The Neighborhood Nexus program, having in 2016 hired a new Executive Director and reestablished Board
linkages, shifted into a new gear of activity in 2017. Both number of projects and revenues from fee-for-service
efforts set records in 2017. The Nexus program was awarded host duties for a National Neighborhood Indicators
Partnership Spring Partners Meeting in May of 2018. A draft business case statement was completed, and
funding was explored for a consultant to perform a Resource Development Plan to more fully refine future
direction and focus.
The Research & Analytics Group also continued adding value to services offered to seven internal clients and
constituent governments by increasing use of ESRI Business Analyst Online, On the Map (Census Bureau),
Burning Glass, and JobsEQ. The group in 2017 continued to use A to Z Databases for current business
information to assist the Mobility Group, as well as Infograph’s Historical Business Database to assess patterns
in economic development. The Economic Analysis Program (EAP) via REMI TranSight maintained momentum
as a tool providing custom economic impact modeling on-demand to public and private clients. The 33 Degrees
North blog (launched in 2015) continued to evolve in 2017 as a “one-stop shop” for the Group’s data products,
hosting current and historical regional snapshots. The blog serves as a vehicle to post current “hot” content
multiple times each week. Additional tools (Tableau, AMCharts, Venngage, and ArcGIS Online) were the core
for the data visualizations “served” on the blog, website pages, Nexus, and Facebook/ Twitter feeds. The
expansion and refinement of the group’s Open Data Portal further enhanced internal and external customer
access to datasets.
Research and Analytics continued to ensure the success of the Workforce Business Solutions (WBS) Division
at ARC, as well as that of local stakeholders, via (a) ongoing licensing and use of Burning Glass labor demand
data database, and (b) continued access to and use of (via consortium) the JobsEQ labor supply data tool. The
division used these tools to “seed” numerous presentations for both WBS staff as well as other internal and
external clients, provide updated data to the Atlanta Regional Workforce Plan adopted in 2016, information for
the Targeted Industries Plan, and updates to in-demand occupation lists
Other projects included administering the Metro Atlanta Speaks Survey (MAS) and exploring implementation
of the QuestionPro panel survey tool. The 2017 MAS was the fifth edition, and the largest of its kind in Metro
Atlanta and Georgia. The 2017 version asked over 5,400 of Atlanta region residents 27 questions about their
regional and local attitudes, perceptions, and behaviors. As with the 2016 survey, statistical significance was
available down to the level of each of the 13 counties surveyed, with the City of Atlanta again presented as a
statistically significant subset. The United Way continued as the primary sponsor of the survey, with all other
7
The Honorable W. Kerry Armstrong, Chair
June 27, 2018
Page 8
partners from 2016 continuing their sponsorship. Though the greatest number of questions continued to focus
on civic engagement, others tested perceptions of public education, traffic and transit, and economic health and
resilience (including new questions on financial resiliency and food insecurity. The results were made publicly
available and served as a central part of the messaging for the year’s ARC State of the Region breakfast, which
was attended by over 1,200 civic and business leaders.
The Aging and Independence Services Group continued to improve the delivery of long term care services in
the metro region with the goal of streamlining access and ensuring that the right people are getting the right
services in the state’s long term care system. As the state of Georgia undergoes a significant re-design of its
home and community based services system, the Aging and Independence Services Group will implement the
redesign across the services that ARC administers directly and those it administers with partner agencies.
As individuals live longer, it is essential that the system of services and supports reflect the broad and
comprehensive nature of their needs. The Aging and Independence Services Group continues to focus on a
number of emerging issues for the older adult population in the Atlanta area, they include: defining ARC’s role
in the expansion of supportive housing in the metro area, identifying critical needs for workforce expansion
among home and community based service providers, improving quality of life through more specific integration
with Aging and the Arts, work with other partners to improve the healthcare system in the metro area and
enhanced utilization of technology to address the increasing number of isolated older adults.
The Atlanta Regional Commission’s Workforce Solutions Group serves as the sub-grant recipient for the Atlanta
Regional Workforce Development Board (ARWDB). The Board is responsible for policy development and
systems oversight for residents of Cherokee, Clayton, Douglas, Fayette, Gwinnett, Henry and Rockdale counties.
Several major initiatives currently being addressed by Workforce Solutions are:
Implementation of workforce development services for adult or dislocated workers at one stop career resource
centers, or the Mobile Workforce Unit, in each of the seven counties in the Atlanta region service area.
Provide a system of youth services in the Atlanta regional service area to qualified youth that are seeking
continued education, receiving a credential, or entering employment.
Provide a system of Individual Training Accounts for customers to access training opportunities and provide
regional processes for implementation of the Eligible Training Provider Listing.
Participate in Rapid Response activities with the Georgia Department of Economic Development Workforce
Division and Georgia Department of Labor to disseminate information about retraining services to employees
and employers experiencing layoffs and implement services.
Implement the SNAP Works 2.0 Grant funded through the U.S. Department of Agriculture and Georgia
Department of Labor in six metro counties with the goal to increase the number of SNAP work registrants who
obtain unsubsidized employment, increase their earned income, and reduce their reliance on public assistance.
Implement the HDCI Sector Partnership Grant from the Georgia Department of Economic Development to build
and support regional, employer-led workforce development collaboratives in three key sectors: healthcare,
information technology, and transportation, distribution, & logistics.
The Homeland Security & Recovery Group has been a unit under the management control of the Atlanta
Regional Commission beginning in March 2015. Over the period, a new program structure was created which
consist of an expanded policy board, an advisory board of 25 public safety practitioners, and 4 committees
8
The Honorable W. Kerry Armstrong, Chair
June 27, 2018
Page 9
focused on outcome based projects to increase the region’s preparedness capabilities. Over 150 public and
private sector representatives are engaged in the work of coordinating the plans, training and exercises in the
event of a terrorist attack. Three (3) of the many specific accomplishments in 2017 include the installation and
testing of a new regional interoperable radio frequency system; the creation, implementation and practicing of a
SWAT tactical response Concept of Operations Plan, and completing a Full Scale Exercise in conjunction with
Emory University and the Center for Diseases Control & Prevention (CDC). Since 2015, 17 seminars, trainings,
drills and exercises have been conducted involving over 650 jurisdictional representatives and partnering
stakeholders as work continues to build toward a multiyear training and exercise plan. Examples of some of the
training completed so far have been the focus of Urban Area Security Initiative (UASI) efforts in anticipation of
various major national sporting events within the region.
Relevant Financial Policies and Controls. The ARC’s Financial Policies and Controls include an Investment
Policy, Budgetary Control, Internal Control Structure and Risk Management. In addition, the Commission’s
bylaws provide policy parameters for budget and finance, as well as define standards of ethical conduct.
The ARC Governance Committee is responsible for authorizing changes in the retirement and insurance
programs for Commission employees. The Governance Committee consists of members of the ARC Board with
the Chair of the Commission serving as the Chair of the Committee.
The Budget and Audit Review Committee (BARC) receives and reviews the ARC annual audit and the annual
budget and work program. The Treasurer of the ARC Board serves as Chair of the BARC. The Chair along
with four additional appointed Board members serve on the committee. The BARC meets from time to time
during the year to review the financial status of the Commission.
The annual budget and work program serves as the foundation of the ARC’s financial planning and control. All
groups are required to submit work program information and funding requests to the Executive Director by mid-
September each year. The Executive Director uses these requests to develop the proposed Annual Work Program
and Budget that he presents to the Board for review at its October meeting. The budget document is also
distributed to constituents and prospective funders for their review and comment. The ARC’s Bylaws require
the Board to adopt a final budget for the next fiscal year at its December meeting. During the year, the Executive
Director presents to the Board, recommendations for revision of the work program and budget that are generally
initiated by new sources of funding.
The Pension Board of Trustees is responsible for the investment of ARC’s pension plan assets, which includes
reviewing and altering investment objectives; selecting appropriate asset allocation strategies; monitoring the
investment performance of the pension fund; and approving changes in pension investment funds, managers,
and consultants. The Board of Trustees consists of five members: the ARC Board Chair, the ARC Budget &
Audit Review Committee Chair, the ARC Executive Director, an employee of the Atlanta Regional Commission
selected by the above three members, and one other member appointed by the above three members.
The Commission has joined together with other municipalities in the state as part of the Georgia Interlocal Risk
Management Agency Property and Liability Insurance Fund and the Georgia Municipal Association Group Self-
Insurance Workers Compensation Fund, a public entity risk pool currently operating as a common risk
management and insurance program for member local governments.
Awards and Acknowledgements
Certificate of Achievement. The Government Finance Officers Association of the United States and Canada
(GFOA) awarded a Certificate of Achievement for Excellence in Financial Reporting to the Atlanta Regional
Commission for its comprehensive annual financial report for the fiscal year ended December 31, 2016. The
Certificate of Achievement is a prestigious national award, recognizing conformance with the highest standards
9
The Honorable W. Kerry Armstrong, Chair June 27, 2018 Page 10
for preparation of state and local government financial reports. This is the 36th consecutive year that ARC has received the award. The award, which is valid for only one year, requires a governmental unit to publish an easily readable and efficiently organized comprehensive annual financial report that confonns to program standards. The report must also satisfy both accounting principles generally accepted in the United States of America and applicable legal requirements. We believe our current report continues to meet these standards and we are submitting it to GFOA to detennine its eligibility for another certificate.
The preparation of the report was accomplished through the efficient and dedicated services of the entire staff of the Financial Services Group. We would like to express our appreciation to all members of the department who assisted and contributed to the preparation of this report. They were assisted by the Commission's auditors, Nichols, Cauley & Associates, LLC, whose expertise, experience and judgment were extremely valuable.
Respectfully Submitted� ?z�ke��-Executive Director
10
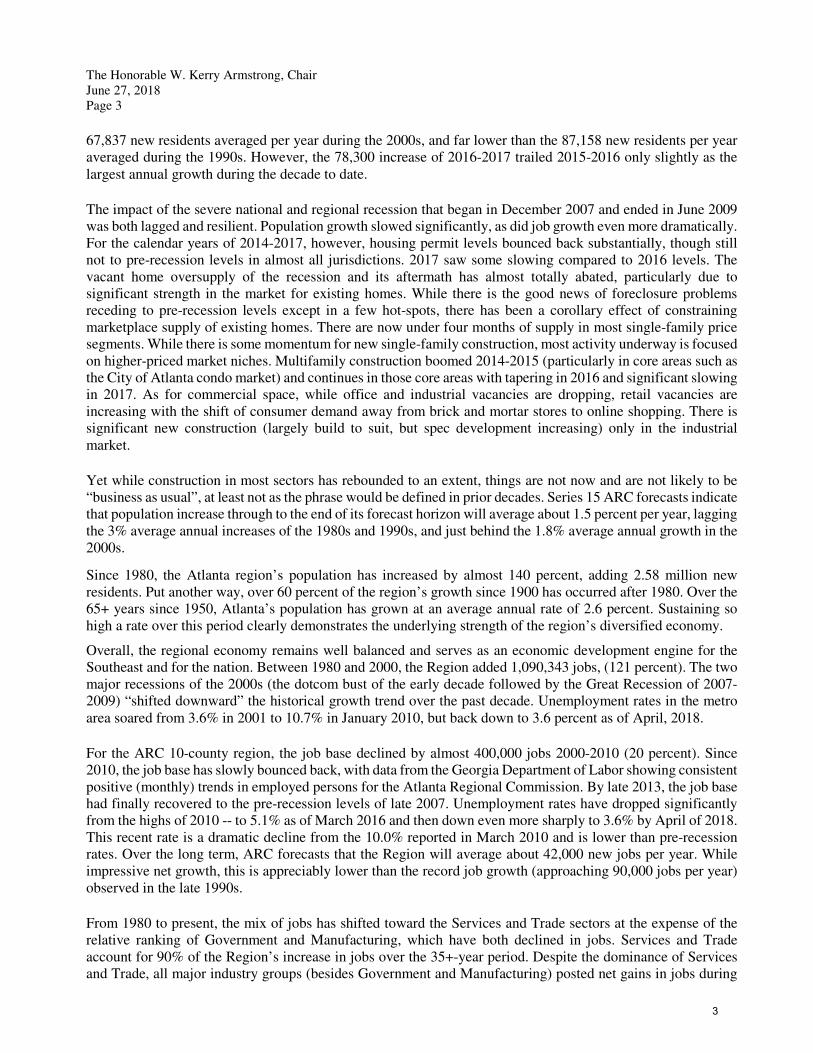
11
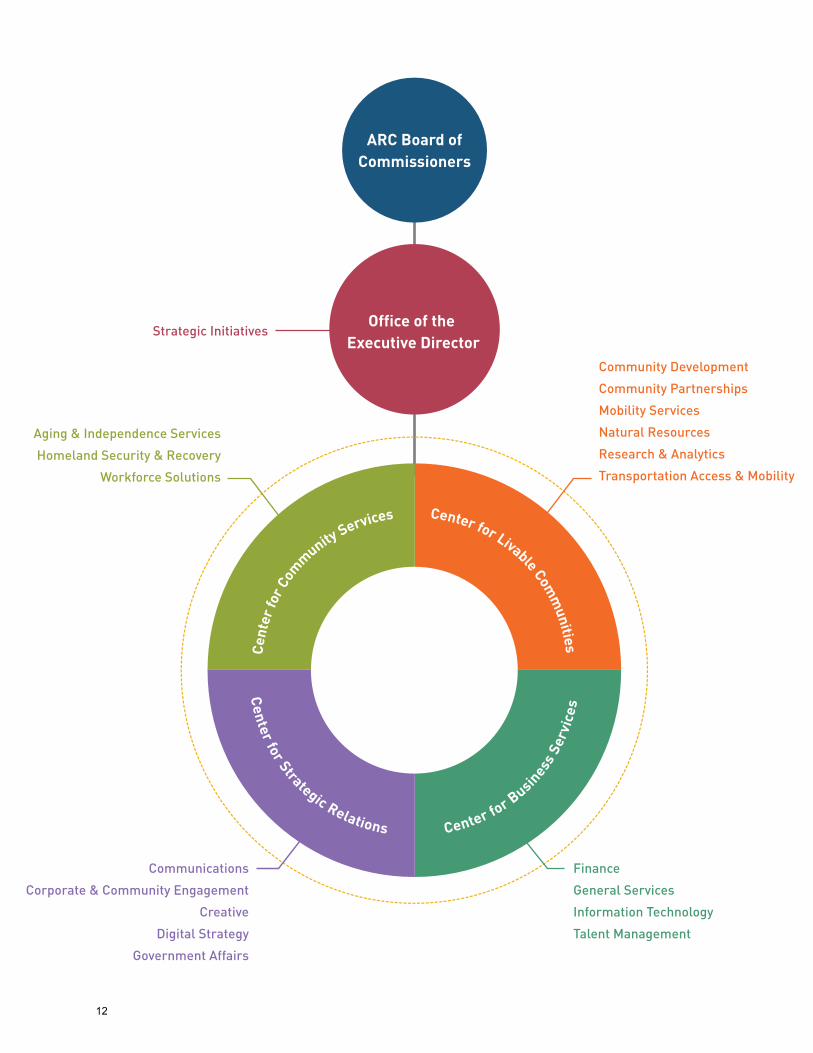
Community Development
Community Partnerships
Mobility Services
Natural Resources
Research & Analytics
Transportation Access & Mobility
Communications
Corporate & Community Engagement
Creative
Digital Strategy
Government Affairs
Center for Livable Comm
unitiesCent
er fo
r Com
munity Services
Center for Strategic Relations Center for Busin
ess S
ervi
ces
ARC Board ofCommissioners
Office of the Executive Director
Aging & Independence Services
Homeland Security & Recovery
Workforce Solutions
Strategic Initiatives
Finance
General Services
Information Technology
Talent Management
12
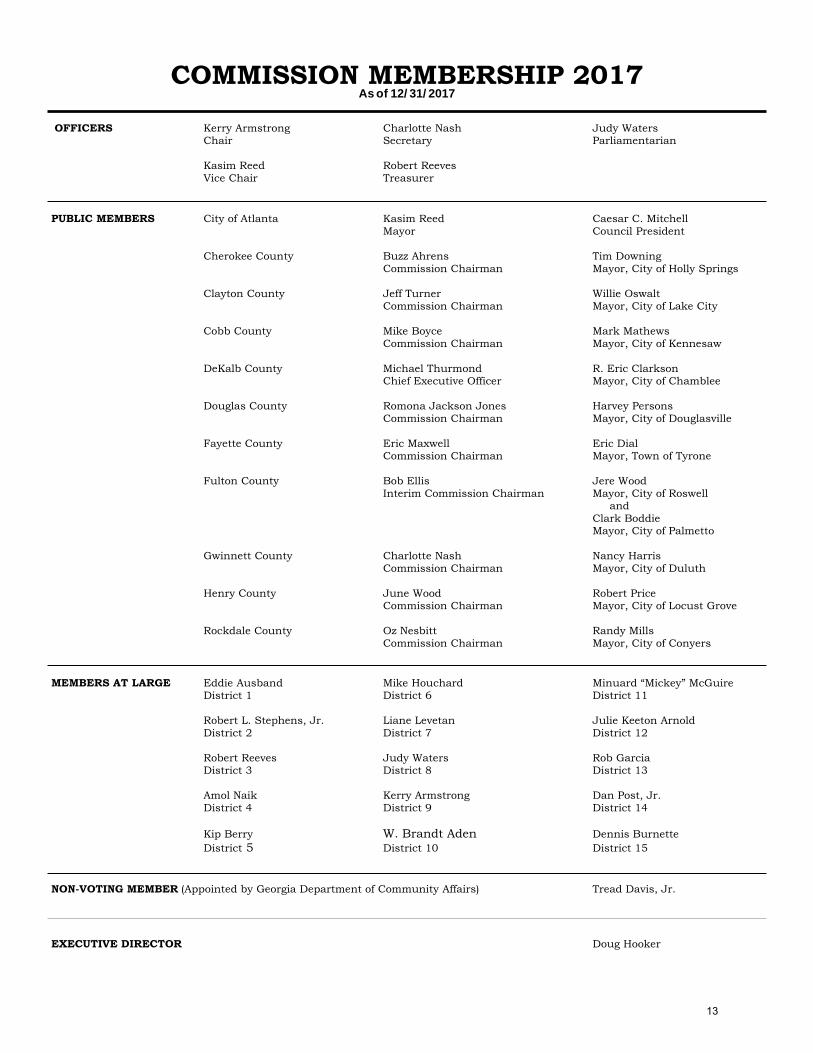
COMMISSION MEMBERSHIP 2017 As of 12/31/2017
OFFICERS Kerry Armstrong Charlotte Nash Judy Waters Chair Secretary Parliamentarian
Kasim Reed Robert Reeves Vice Chair Treasurer
PUBLIC MEMBERS City of Atlanta Kasim Reed Caesar C. Mitchell Mayor Council President
Cherokee County Buzz Ahrens Tim Downing Commission Chairman Mayor, City of Holly Springs
Clayton County Jeff Turner Willie Oswalt Commission Chairman Mayor, City of Lake City
Cobb County Mike Boyce Mark Mathews Commission Chairman Mayor, City of Kennesaw
DeKalb County Michael Thurmond R. Eric Clarkson Chief Executive Officer Mayor, City of Chamblee
Douglas County Romona Jackson Jones Harvey Persons Commission Chairman Mayor, City of Douglasville
Fayette County Eric Maxwell Eric Dial Commission Chairman Mayor, Town of Tyrone
Fulton County Bob Ellis Jere Wood Interim Commission Chairman Mayor, City of Roswell
and Clark Boddie Mayor, City of Palmetto
Gwinnett County Charlotte Nash Nancy Harris Commission Chairman Mayor, City of Duluth
Henry County June Wood Robert Price Commission Chairman Mayor, City of Locust Grove
Rockdale County Oz Nesbitt Randy Mills Commission Chairman Mayor, City of Conyers
MEMBERS AT LARGE Eddie Ausband Mike Houchard Minuard “Mickey” McGuire District 1 District 6 District 11
Robert L. Stephens, Jr. Liane Levetan Julie Keeton Arnold District 2 District 7 District 12
Robert Reeves Judy Waters Rob Garcia District 3 District 8 District 13
Amol Naik Kerry Armstrong Dan Post, Jr. District 4 District 9 District 14
Kip Berry W. Brandt Aden Dennis Burnette District 5 District 10 District 15
NON-VOTING MEMBER (Appointed by Georgia Department of Community Affairs) Tread Davis, Jr.
EXECUTIVE DIRECTOR Doug Hooker
13
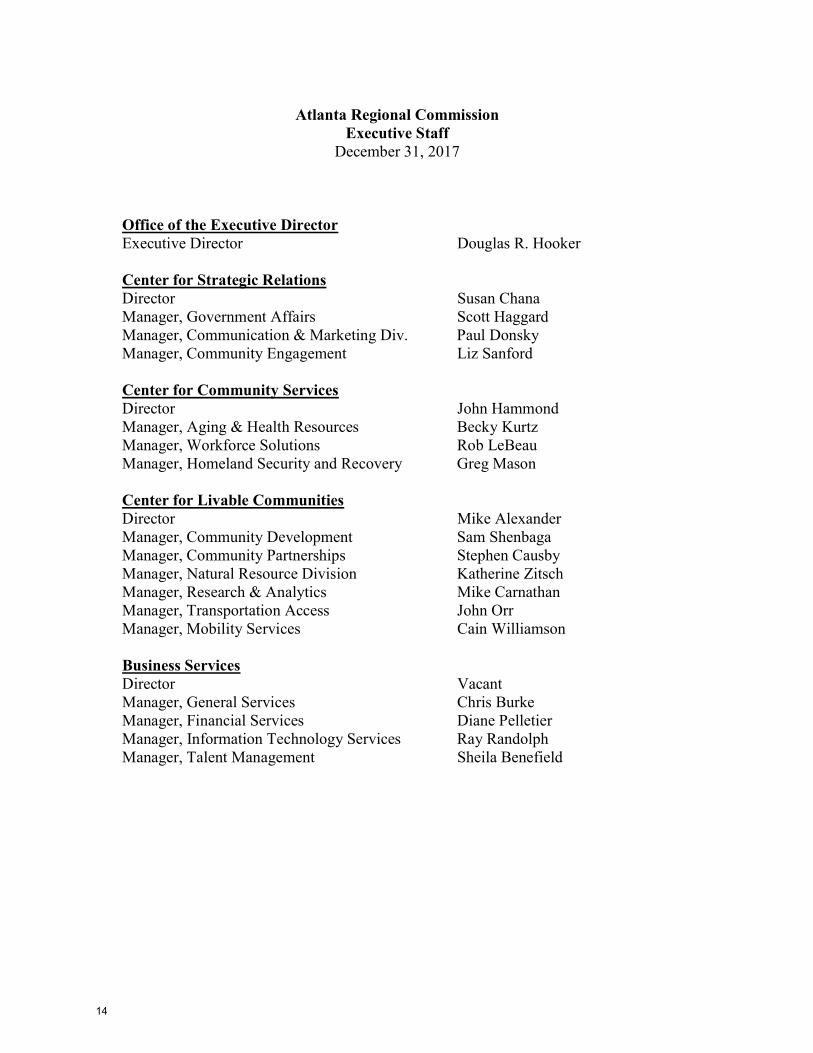
Atlanta Regional Commission Executive Staff
December 31, 2017 Office of the Executive Director Executive Director Douglas R. Hooker Center for Strategic Relations Director Susan Chana Manager, Government Affairs Scott Haggard Manager, Communication & Marketing Div. Paul Donsky Manager, Community Engagement Liz Sanford Center for Community Services Director John Hammond Manager, Aging & Health Resources Becky Kurtz Manager, Workforce Solutions Rob LeBeau Manager, Homeland Security and Recovery Greg Mason Center for Livable Communities Director Mike Alexander Manager, Community Development Sam Shenbaga Manager, Community Partnerships Stephen Causby Manager, Natural Resource Division Katherine Zitsch Manager, Research & Analytics Mike Carnathan Manager, Transportation Access John Orr Manager, Mobility Services Cain Williamson Business Services Director Vacant Manager, General Services Chris Burke Manager, Financial Services Diane Pelletier Manager, Information Technology Services Ray Randolph Manager, Talent Management Sheila Benefield
14
NICHOLS, CAULEY & ASSOCIATES, LLC 1825 Barrett Lakes Blvd, Suite 200
Kennesaw, Georgia 30144 770-422-0598 FAX 678-214-2355
At lan ta | Ca lhoun | Can ton | Da l ton | Dub l in
Kennesaw | Mar i e t t a | Rome | Warne r Rob ins
INDEPENDENT AUDITOR'S REPORT
The Members of the Atlanta Regional Commission Atlanta, Georgia
Report on the Financial Statements
We have audited the accompanying financial statements of the governmental activities, business-type activities, each major fund, and the aggregate remaining fund information of the Atlanta Regional Commission (the “Commission”), as of and for the year ended December 31, 2017, and the related notes to the financial statements, which collectively comprise the Commission’s basic financial statements as listed in the table of contents.
Management’s Responsibility for the Financial Statements
Management is responsible for the preparation and fair presentation of these financial statements in accordance with accounting principles generally accepted in the United States of America; this includes the design, implementation, and maintenance of internal control relevant to the preparation and fair presentation of financial statements that are free from material misstatement, whether due to fraud or error.
Auditor’s Responsibility
Our responsibility is to express opinions on these financial statements based on our audit. We conducted our audit in accordance with auditing standards generally accepted in the United States of America and the standards applicable to financial audits contained in Government Auditing Standards, issued by the Comptroller General of the United States. Those standards require that we plan and perform the audit to obtain reasonable assurance about whether the financial statements are free from material misstatement.
An audit involves performing procedures to obtain audit evidence about the amounts and disclosures in the financial statements. The procedures selected depend on the auditor’s judgment, including the assessment of the risks of material misstatement of the financial statements, whether due to fraud or error. In making those risk assessments, the auditor considers internal control relevant to the entity’s preparation and fair presentation of the financial statements in order to design audit procedures that are appropriate in the circumstances, but not for the purpose of expressing an opinion on the effectiveness of the entity’s internal control. Accordingly, we express no such opinion. An audit also includes evaluating the appropriateness
15
of accounting policies used and the reasonableness of significant accounting estimates made by management, as well as evaluating the overall presentation of the financial statements.
We believe that the audit evidence we have obtained is sufficient and appropriate to provide a basis for our audit opinions.
Opinions
In our opinion, the financial statements referred to above present fairly, in all material respects, the respective financial position of the governmental activities, business-type activities, each major fund, and the aggregate remaining fund information of the Atlanta Regional Commission, as of December 31 2017, and the respective changes in financial position, and, where applicable, cash flows thereof and the respective budgetary comparison for the General Fund, Transportation Programs Fund, Workforce Development Fund, Aging Programs Fund, and Natural Resources Fund for the year then ended in conformity with accounting principles generally accepted in the United States of America.
Other Matters
Required Supplementary Information
Accounting principles generally accepted in the United States of America require that the management’s discussion and analysis, the other post employment benefits trust fund schedule of funding progress, the other post employment benefits trust fund schedule of employer contributions, the schedule of changes in net pension liability and related ratios, and the schedule of pension contributions on pages 18-27 and 69-71 be presented to supplement the basic financial statements. Such information, although not a part of the basic financial statements, is required by the Governmental Accounting Standards Board, who considers it to be an essential part of financial reporting for placing the basic financial statements in an appropriate operational, economic, or historical context. We have applied certain limited procedures to the required supplementary information in accordance with auditing standards generally accepted in the United States of America, which consisted of inquiries of management about the methods of preparing the information and comparing the information for consistency with management’s responses to our inquiries, the basic financial statements, and other knowledge we obtained during our audit of the basic financial statements. We do not express an opinion or provide any assurance on the information because the limited procedures do not provide us with sufficient evidence to express an opinion or provide any assurance.
Other Information
Our audit was conducted for the purpose of forming opinions on the financial statements that collectively comprise the Atlanta Regional Commission’s basic financial statements. The introductory section, the combining nonmajor fund statements and schedules, statistical section and supplemental information, are presented for purposes of additional analysis and are not a required part of the basic financial statements. The schedule of expenditures of federal awards is presented for purposes of additional analysis as required by Title 2 U.S. Code of Federal
16
Regulations (CFR) Part 200, Uniform Administrative Requirements, Cost Principles, and Audit Requirements for Federal Awards, and is also not a required part of the basic financial statements.
The combining nonmajor fund statements and schedules and the schedule of expenditures of federal awards are the responsibility of management and were derived from and relate directly to the underlying accounting and other records used to prepare the basic financial statements. Such information has been subjected to the auditing procedures applied in the audit of the basic financial statements and certain additional procedures, including comparing and reconciling such information directly to the underlying accounting and other records used to prepare the basic financial statements or to the basic financial statements themselves, and other additional procedures in accordance with auditing standards generally accepted in the United States of America. In our opinion, the combining nonmajor fund statements and schedules and the schedule of expenditures of federal awards are fairly stated, in all material respects, in relation to the basic financial statements as a whole.
The introductory section, statistical section, and the remaining supplemental information have not been subjected to the auditing procedures applied in the audit of the basic financial statements, and accordingly, we do not express an opinion or provide any assurance on them.
Other Reporting Required by Government Auditing Standards
In accordance with Government Auditing Standards, we have also issued our report dated June 21, 2018 on our consideration of the Atlanta Regional Commission’s internal control over financial reporting and on our tests of its compliance with certain provisions of laws, regulations, contracts, and grant agreements and other matters. The purpose of that report is to describe the scope of our testing of internal control over financial reporting and compliance and the results of that testing, and not to provide an opinion on internal control over financial reporting or on compliance. That report is an integral part of an audit performed in accordance with Government Auditing Standards in considering the Atlanta Regional Commission’s internal control over financial reporting and compliance.
Nichols, Cauley & Associates, LLC
June 21, 2018
17
Management’s Discussion and Analysis (unaudited)
As management of the Atlanta Regional Commission, we offer readers of the Atlanta Regional
Commission’s financial statements this narrative overview and analysis of the financial activities of the
Atlanta Regional Commission (ARC or the Commission) for the fiscal year ended December 31, 2017.
We encourage readers to consider the information that we have furnished in our letter of transmittal,
which can be found on pages 1 through 10 of this report.
Financial Highlights
• The assets and deferred outflows of the ARC exceeded its liabilities and deferred inflows at the
close of the most recent fiscal year by $7,256,445 (net position). Of this amount, $5,159,177
(unrestricted net position) may be used to meet the Commission’s ongoing obligations to the
member local governments and creditors.
• The Commission’s total net position increased by $607,430. The majority of this increase is
attributable to the decrease in unrestricted resources required to match grant proceeds and increases
in population on which ARC receives local funding of $1.10 per capita.
• Governmental Activities general revenues for the year were $5,030,922. Of this amount, $60,400
net was transferred to business-type activities.
• As of the close of the current fiscal year, the ARC’s governmental funds reported a combined ending
fund balance of $10,661,620, an decrease of $1,622,434 in comparison with the prior year.
Approximately 98 percent of this amount, $10,432,006, is available for spending at the
Commission’s discretion (unassigned fund balance).
• At the end of the fiscal year, total fund balance for the General Fund was $10,661,620 or 12 percent
of total governmental fund expenditures.
Overview of the Financial Statements
This discussion and analysis is intended to serve as an introduction to the ARC’s basic financial
statements. The ARC’s basic financial statements comprise three components: 1) government-wide
financial statements, 2) fund financial statements, and 3) notes to the financial statements. This report
also contains other supplementary information in addition to the basic financial statements themselves.
Government-wide financial statements. The government-wide financial statements are designed to
provide readers with a broad overview of the ARC’s finances, in a manner similar to a private-sector
business.
The statement of net position presents information on all of the ARC’s assets, deferred outflows and
inflows of resources, and liabilities, with the difference being reported as net position. Over time,
increases or decreases in net position may serve as a useful indicator of whether the financial position
of the ARC is improving or deteriorating.
The statement of activities presents information showing how the government’s net position changed
during the most recent fiscal year. All changes in net position are reported as soon as the underlying
event giving rise to the change occurs, regardless of the timing of related cash flows. Thus, revenues
18
and expenses are reported in this statement for some items that will only result in cash flows in future
fiscal periods (e.g., earned but unused vacation leave).
Both of the government-wide financial statements distinguish functions of the ARC that are principally
supported by grants and regional appropriations (governmental activities) from other functions that are
intended to recover all or a significant portion of their costs through user fees and charges (business-
type activities). The governmental activities of the ARC include general government, general
government overhead, all grant funded activities and an internal service fund for information technology
support. The business-type activities of the ARC include enterprise funds. The government-wide
financial statements can be found on pages 29 through 31 of this report.
The ARC has no component units.
Fund financial statements. A fund is a grouping of related accounts that are used to maintain control
over resources that have been segregated for specific activities or objectives. The ARC, like other
similar governmental entities, uses fund accounting to ensure and demonstrate compliance with finance-
related legal requirements. All of the funds of the ARC can be divided into three categories:
governmental funds, proprietary funds, and fiduciary funds.
Governmental funds. Governmental funds are used to account for essentially the same functions
reported as governmental activities in the government-wide financial statements. However, unlike the
government-wide financial statements, governmental fund financial statements focus on near-term
inflows and outflows of spendable resources, as well as on balances of spendable resources available at
the end of the fiscal year. Such information may be useful in evaluating a government’s near-term
financing requirements.
Because the focus of governmental funds is narrower than that of the government-wide financial
statements, it is useful to compare the information presented for governmental funds with similar
information presented for governmental activities in the government-wide financial statements. By
doing so, readers may better understand the long-term impact of the government’s near-term financing
decisions. Both the governmental fund balance sheet and the governmental fund statement of revenues,
expenditures, and changes in fund balances provide a reconciliation to facilitate this comparison between
governmental funds and governmental activities.
The ARC maintains eight governmental funds. Information is presented separately in the governmental
fund balance sheet and in the governmental fund statement of revenues, expenditures, and changes in
fund balance for the General, Transportation Programs, Workforce Development, Aging Program and
Natural Resources Funds which are considered to be major funds. Data for the other funds is combined
into a single aggregate presentation. Individual data for these nonmajor funds is provided in the form
of combining statements elsewhere in this report.
The ARC adopts an annual budget for its funds. Budgetary comparison statements or schedules have
been provided for each governmental fund to demonstrate compliance with this budget. The basic
governmental fund financial statements can be found on pages 32 through 41 of this report. Budget
comparisons for non-major funds are provided in schedules elsewhere in this report.
Proprietary funds. The ARC maintains two different types of proprietary funds. Enterprise funds are
used to report the same functions presented as business-type activities in the government-wide financial
statements. The ARC uses enterprise funds to account for its business type activities. The ARC’s
internal service fund is an accounting device used to accumulate and allocate costs internally among the
ARC’s various functions. The ARC uses this internal service fund to account for its management
19
information technology systems. Because this service predominantly benefits governmental rather than
business-type functions, it has been included within governmental activities in the government-wide
financial statements.
Proprietary funds provide the same type of information as the government-wide financial statements,
only in more detail. The proprietary funds are combined into a single, aggregated presentation in the
proprietary fund financial statements. Conversely, the internal service fund is presented individually.
The basic proprietary fund financial statements can be found on pages 42 through 44 of this report.
Fiduciary funds. The fiduciary funds are used to account for the ARC’s Pension and OPEB Trust
Funds. The fiduciary funds are not reflected in the government-wide financial statement because the
resources of these funds are not available to support the ARC’s own programs. The accounting used for
the fiduciary funds are much like that used for proprietary funds. The basic fiduciary financial statements
can be found on pages 45 through 46 of this report.
Notes to the financial statements. The notes provide additional information that is essential to a full
understanding of the data provided in the government-wide and fund financial statements. The notes to
the financial statements can be found on pages 47 through 68 of this report.
Other information. In addition to the basic financial statements and accompanying notes, this report
also presents certain required supplementary information including ARC’s progress in funding its
obligation to provide pension and other post-employment benefits to its employees, along with other
supplementary information. Required and other supplementary information can be found on pages 69
through 86, and pages 113 through 130 of this report.
Government-wide Financial Analysis
As noted earlier, net position may serve over time as a useful indicator of a government’s financial
position. In the case of the ARC, assets and deferred outflows exceeded liabilities and deferred inflows
by $7,256,445 at December 31, 2017, compared with assets and deferred outflows exceeding liabilities
and deferred inflows by $6,649,015 at December 31, 2016. Twenty-nine percent of the ARC’s net
position reflect its investment in capital assets (vehicles, furniture, fixtures and equipment). The ARC
uses these capital assets to operate and to provide services; consequently, these assets are not available
for future spending. There is no debt outstanding on resources used to acquire these assets.
The following table reflects the condensed Statement of Net Position compared to prior year.
20
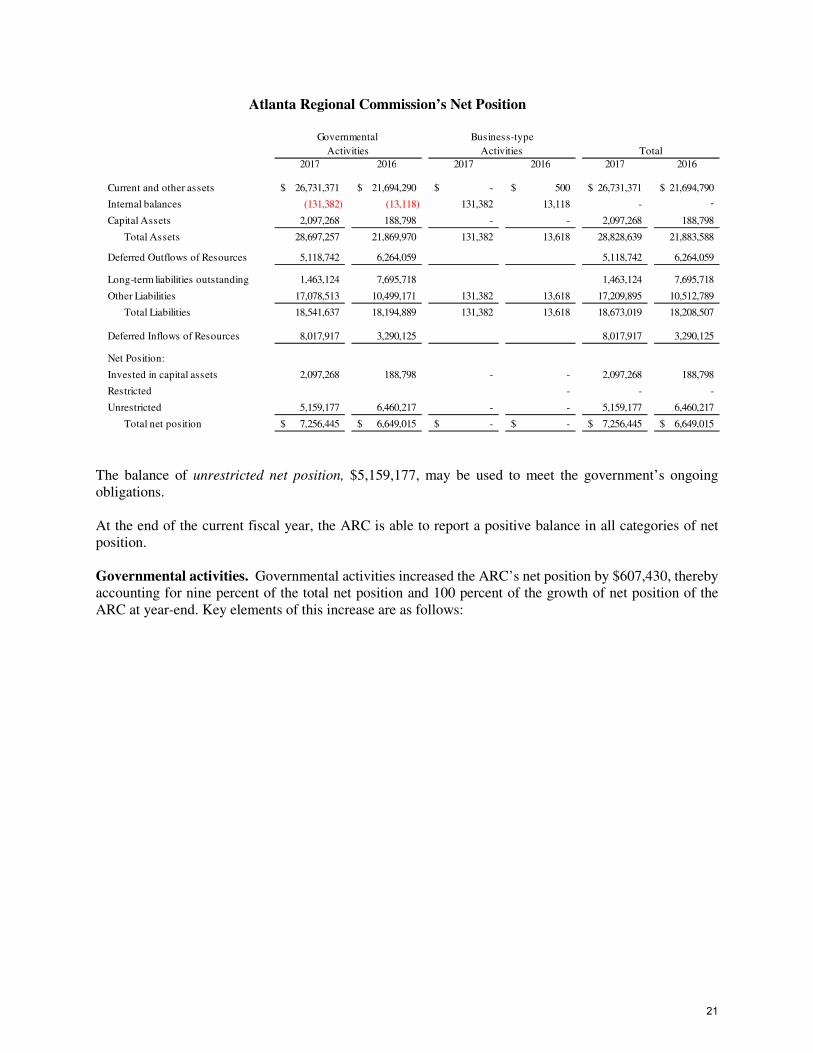
Atlanta Regional Commission’s Net Position
2017 2016 2017 2016 2017 2016
Current and other assets 26,731,371$ 21,694,290$ -$ 500$ 26,731,371$ 21,694,790$
Internal balances (131,382) (13,118) 131,382 13,118 - -
Capital Assets 2,097,268 188,798 - - 2,097,268 188,798
Total Assets 28,697,257 21,869,970 131,382 13,618 28,828,639 21,883,588
Deferred Outflows of Resources 5,118,742 6,264,059 5,118,742 6,264,059
Long-term liabilities outstanding 1,463,124 7,695,718 1,463,124 7,695,718
Other Liabilities 17,078,513 10,499,171 131,382 13,618 17,209,895 10,512,789
Total Liabilities 18,541,637 18,194,889 131,382 13,618 18,673,019 18,208,507
Deferred Inflows of Resources 8,017,917 3,290,125 8,017,917 3,290,125
Net Position:
Invested in capital assets 2,097,268 188,798 - - 2,097,268 188,798
Restricted - - -
Unrestricted 5,159,177 6,460,217 - - 5,159,177 6,460,217
Total net position 7,256,445$ 6,649,015$ -$ -$ 7,256,445$ 6,649,015$
Governmental
Activities
Business-type
Activities Total
The balance of unrestricted net position, $5,159,177, may be used to meet the government’s ongoing
obligations.
At the end of the current fiscal year, the ARC is able to report a positive balance in all categories of net
position.
Governmental activities. Governmental activities increased the ARC’s net position by $607,430, thereby
accounting for nine percent of the total net position and 100 percent of the growth of net position of the
ARC at year-end. Key elements of this increase are as follows:
21
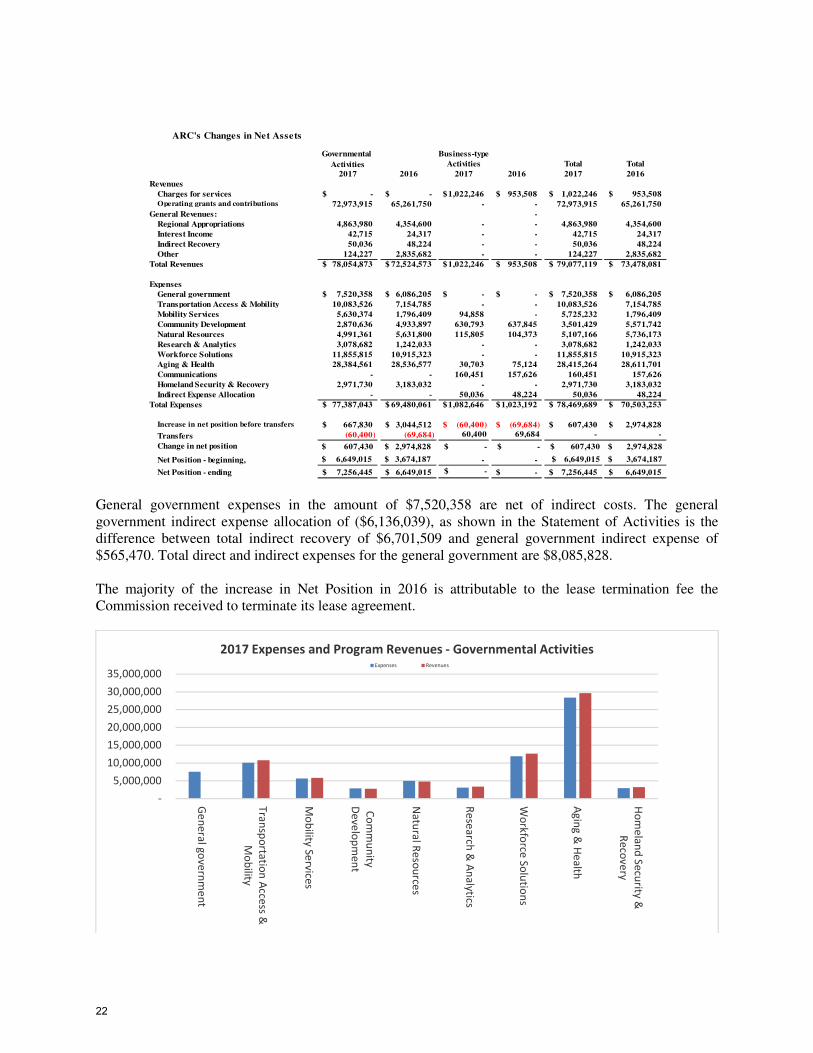
ARC's Changes in Net Assets
Governmental Business-type
Activities Activities Total Total
2017 2016 2017 2016 2017 2016
Revenues
Charges for services -$ -$ 1,022,246$ 953,508$ 1,022,246$ 953,508$
Operating grants and contributions 72,973,915 65,261,750 - - 72,973,915 65,261,750
General Revenues: -
Regional Appropriations 4,863,980 4,354,600 - - 4,863,980 4,354,600
Interest Income 42,715 24,317 - - 42,715 24,317
Indirect Recovery 50,036 48,224 - - 50,036 48,224
Other 124,227 2,835,682 - - 124,227 2,835,682
Total Revenues 78,054,873$ 72,524,573$ 1,022,246$ 953,508$ 79,077,119$ 73,478,081$
Expenses
General government 7,520,358$ 6,086,205$ -$ -$ 7,520,358$ 6,086,205$
Transportation Access & Mobility 10,083,526 7,154,785 - - 10,083,526 7,154,785
Mobility Services 5,630,374 1,796,409 94,858 - 5,725,232 1,796,409
Community Development 2,870,636 4,933,897 630,793 637,845 3,501,429 5,571,742
Natural Resources 4,991,361 5,631,800 115,805 104,373 5,107,166 5,736,173
Research & Analytics 3,078,682 1,242,033 - - 3,078,682 1,242,033
Workforce Solutions 11,855,815 10,915,323 - - 11,855,815 10,915,323
Aging & Health 28,384,561 28,536,577 30,703 75,124 28,415,264 28,611,701
Communications - - 160,451 157,626 160,451 157,626
Homeland Security & Recovery 2,971,730 3,183,032 - - 2,971,730 3,183,032
Indirect Expense Allocation - - 50,036 48,224 50,036 48,224
Total Expenses 77,387,043$ 69,480,061$ 1,082,646$ 1,023,192$ 78,469,689$ 70,503,253$
Increase in net position before transfers 667,830$ 3,044,512$ (60,400)$ (69,684)$ 607,430$ 2,974,828$
Transfers (60,400) (69,684) 60,400 69,684 - -
Change in net position $ 607,430 $ 2,974,828 $ - $ - $ 607,430 $ 2,974,828
Net Position - beginning, $ 6,649,015 $ 3,674,187 - - $ 6,649,015 $ 3,674,187
Net Position - ending 7,256,445$ 6,649,015$ $ - -$ 7,256,445$ 6,649,015$
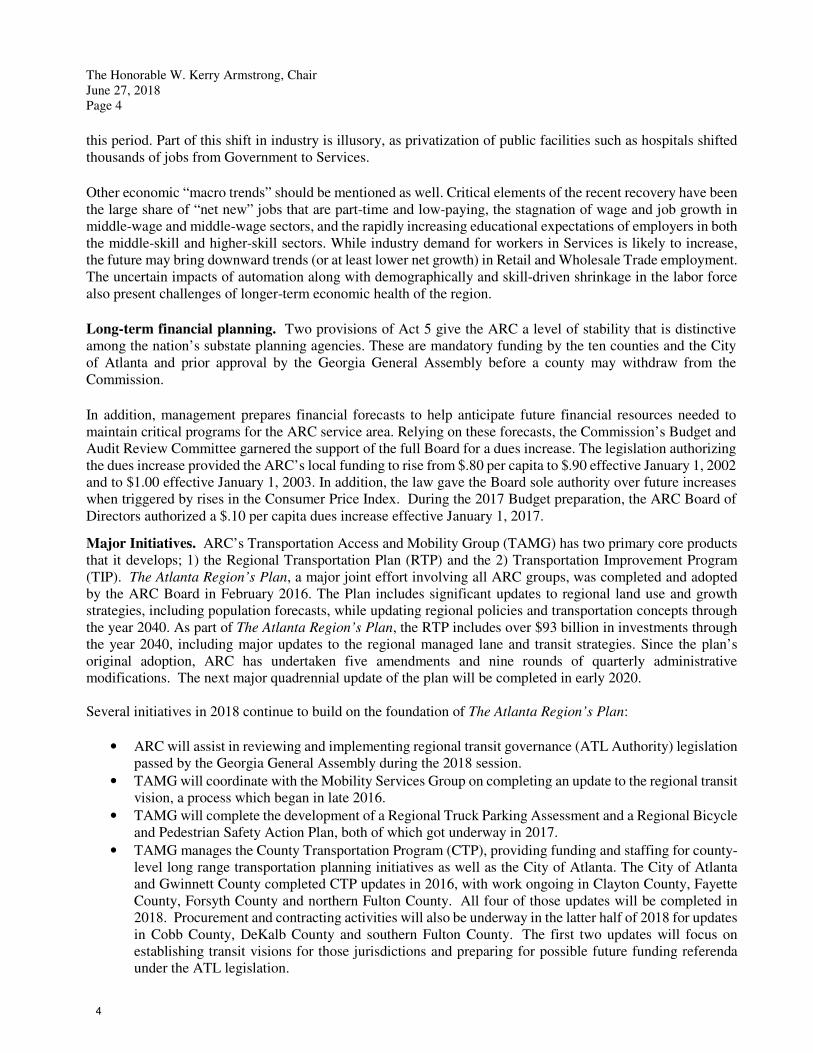
General government expenses in the amount of $7,520,358 are net of indirect costs. The general
government indirect expense allocation of ($6,136,039), as shown in the Statement of Activities is the
difference between total indirect recovery of $6,701,509 and general government indirect expense of
$565,470. Total direct and indirect expenses for the general government are $8,085,828.
The majority of the increase in Net Position in 2016 is attributable to the lease termination fee the
Commission received to terminate its lease agreement.
-
5,000,000
10,000,000
15,000,000
20,000,000
25,000,000
30,000,000
35,000,000
Ge
ne
ral g
ove
rnm
en
t
Tra
nsp
orta
tion
Acce
ss &
Mo
bility
Mo
bility
Se
rvice
s
Co
mm
un
ity
De
ve
lop
me
nt
Na
tura
l Re
sou
rces
Re
sea
rch &
An
aly
tics
Wo
rkfo
rce S
olu
tion
s
Ag
ing
& H
ea
lth
Ho
me
lan
d S
ecu
rity &
Re
cov
ery
2017 Expenses and Program Revenues - Governmental ActivitiesExpenses Revenues
22
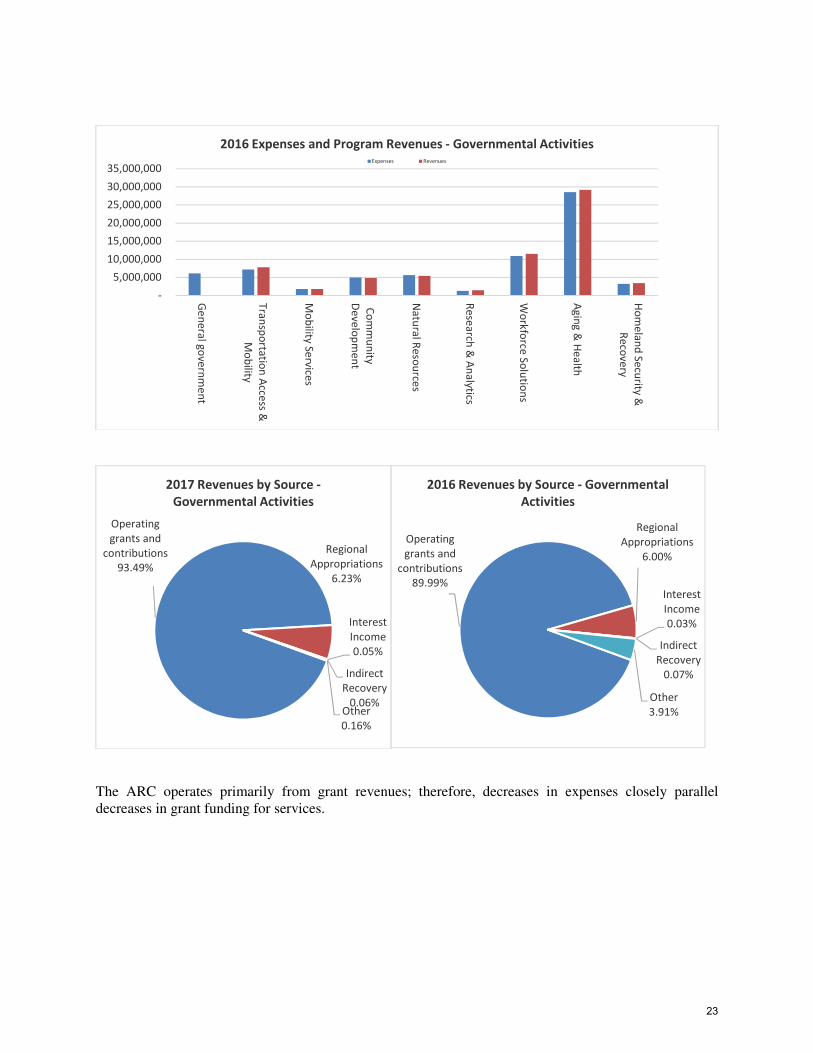
The ARC operates primarily from grant revenues; therefore, decreases in expenses closely parallel
decreases in grant funding for services.
-
5,000,000
10,000,000
15,000,000
20,000,000
25,000,000
30,000,000
35,000,000
Ge
ne
ral g
ove
rnm
en
t
Tra
nsp
orta
tion
Acce
ss &
Mo
bility
Mo
bility
Se
rvice
s
Co
mm
un
ity
De
ve
lop
me
nt
Na
tura
l Re
sou
rces
Re
sea
rch &
An
aly
tics
Wo
rkfo
rce S
olu
tion
s
Ag
ing
& H
ea
lth
Ho
me
lan
d S
ecu
rity &
Re
cov
ery
2016 Expenses and Program Revenues - Governmental ActivitiesExpenses Revenues
Operating
grants and
contributions
93.49%
Regional
Appropriations
6.23%
Interest
Income
0.05%
Indirect
Recovery
0.06%Other
0.16%
2017 Revenues by Source -
Governmental Activities
Operating
grants and
contributions
89.99%
Regional
Appropriations
6.00%
Interest
Income
0.03%
Indirect
Recovery
0.07%
Other
3.91%
2016 Revenues by Source - Governmental
Activities
23
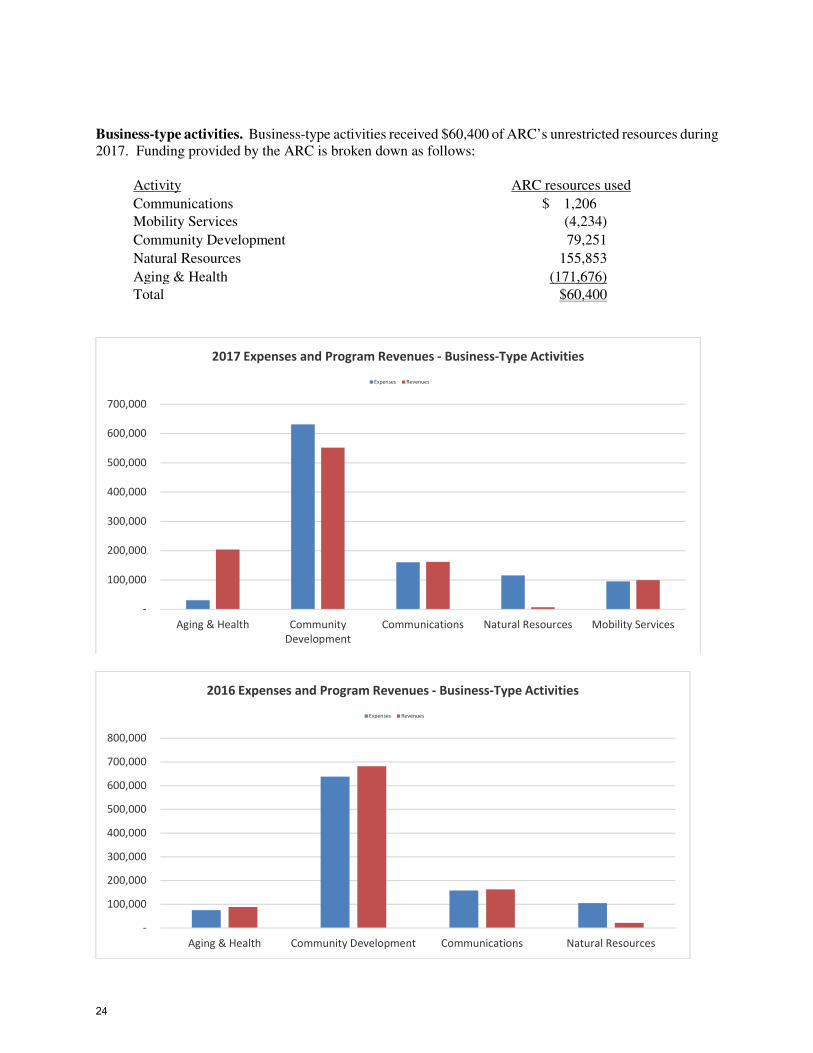
Business-type activities. Business-type activities received $60,400 of ARC’s unrestricted resources during
2017. Funding provided by the ARC is broken down as follows:
Activity ARC resources used
Communications $ 1,206
Mobility Services (4,234)
Community Development 79,251
Natural Resources 155,853
Aging & Health (171,676)
Total $60,400
-
100,000
200,000
300,000
400,000
500,000
600,000
700,000
Aging & Health Community
Development
Communications Natural Resources Mobility Services
2017 Expenses and Program Revenues - Business-Type Activities
Expenses Revenues
-
100,000
200,000
300,000
400,000
500,000
600,000
700,000
800,000
Aging & Health Community Development Communications Natural Resources
2016 Expenses and Program Revenues - Business-Type Activities
Expenses Revenues
24
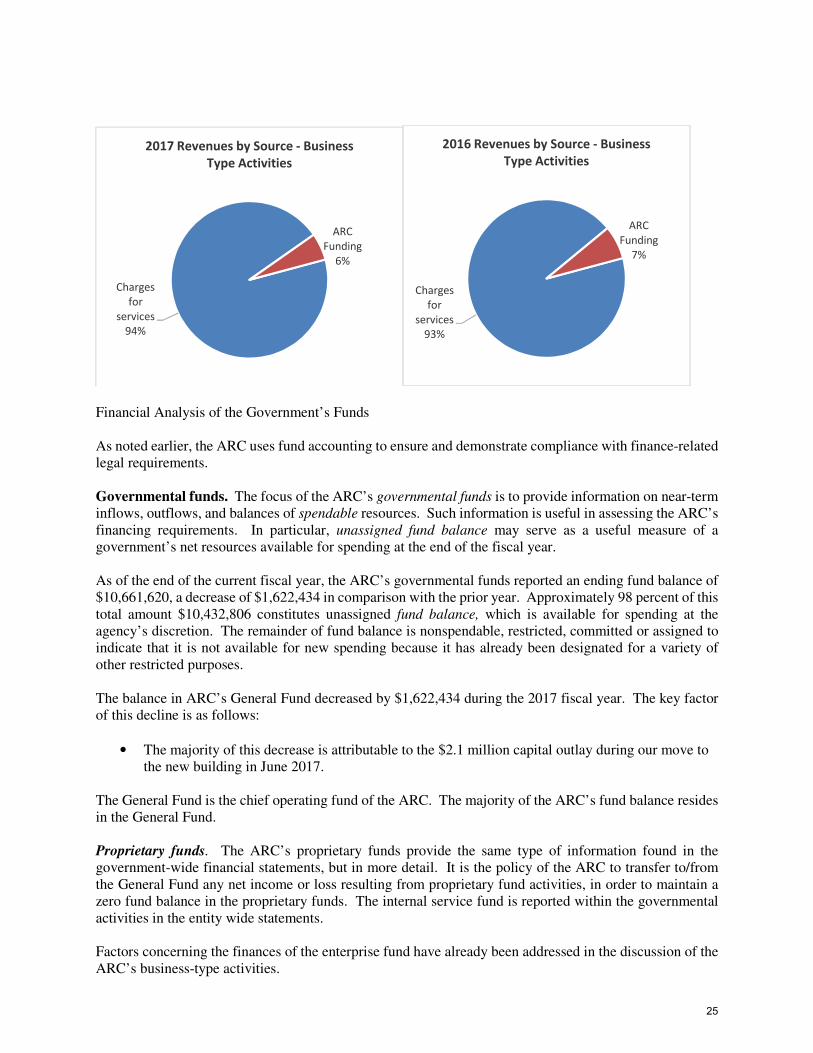
Financial Analysis of the Government’s Funds
As noted earlier, the ARC uses fund accounting to ensure and demonstrate compliance with finance-related
legal requirements.
Governmental funds. The focus of the ARC’s governmental funds is to provide information on near-term
inflows, outflows, and balances of spendable resources. Such information is useful in assessing the ARC’s
financing requirements. In particular, unassigned fund balance may serve as a useful measure of a
government’s net resources available for spending at the end of the fiscal year.
As of the end of the current fiscal year, the ARC’s governmental funds reported an ending fund balance of
$10,661,620, a decrease of $1,622,434 in comparison with the prior year. Approximately 98 percent of this
total amount $10,432,806 constitutes unassigned fund balance, which is available for spending at the
agency’s discretion. The remainder of fund balance is nonspendable, restricted, committed or assigned to
indicate that it is not available for new spending because it has already been designated for a variety of
other restricted purposes.
The balance in ARC’s General Fund decreased by $1,622,434 during the 2017 fiscal year. The key factor
of this decline is as follows:
• The majority of this decrease is attributable to the $2.1 million capital outlay during our move to
the new building in June 2017.
The General Fund is the chief operating fund of the ARC. The majority of the ARC’s fund balance resides
in the General Fund.
Proprietary funds. The ARC’s proprietary funds provide the same type of information found in the
government-wide financial statements, but in more detail. It is the policy of the ARC to transfer to/from
the General Fund any net income or loss resulting from proprietary fund activities, in order to maintain a
zero fund balance in the proprietary funds. The internal service fund is reported within the governmental
activities in the entity wide statements.
Factors concerning the finances of the enterprise fund have already been addressed in the discussion of the
ARC’s business-type activities.
Charges
for
services
94%
ARC
Funding
6%
2017 Revenues by Source - Business
Type Activities
Charges
for
services
93%
ARC
Funding
7%
2016 Revenues by Source - Business
Type Activities
25
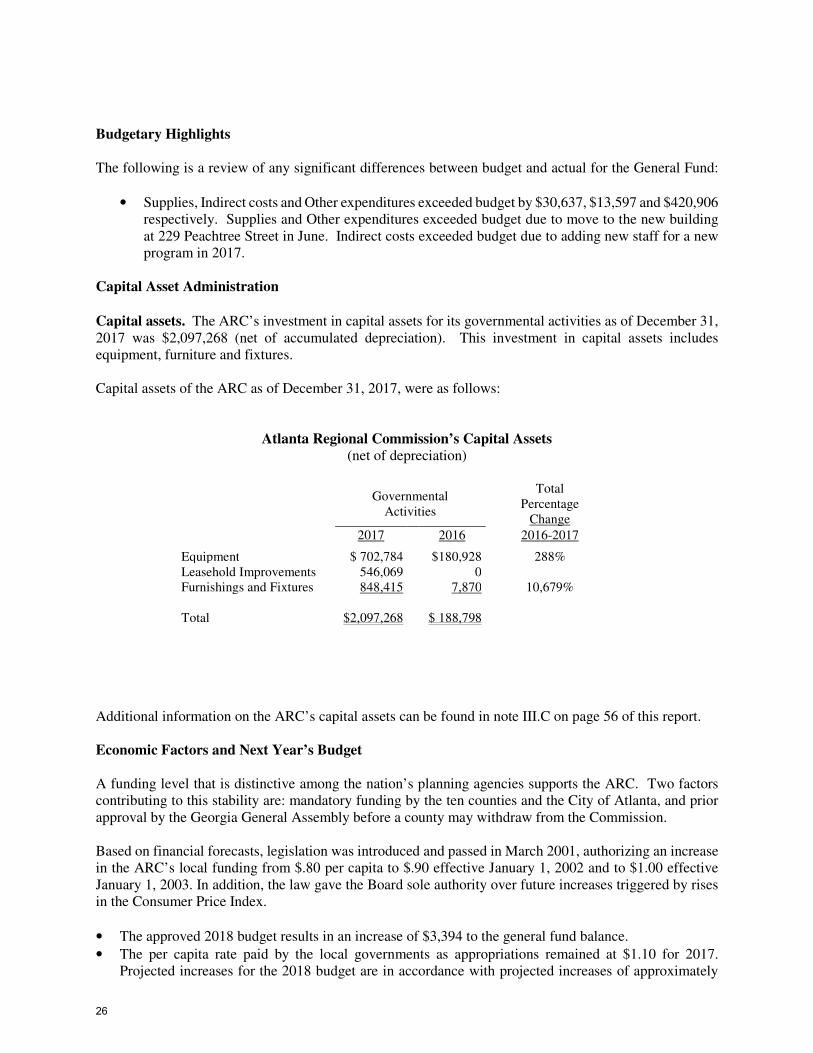
Budgetary Highlights
The following is a review of any significant differences between budget and actual for the General Fund:
• Supplies, Indirect costs and Other expenditures exceeded budget by $30,637, $13,597 and $420,906
respectively. Supplies and Other expenditures exceeded budget due to move to the new building
at 229 Peachtree Street in June. Indirect costs exceeded budget due to adding new staff for a new
program in 2017.
Capital Asset Administration
Capital assets. The ARC’s investment in capital assets for its governmental activities as of December 31,
2017 was $2,097,268 (net of accumulated depreciation). This investment in capital assets includes
equipment, furniture and fixtures.
Capital assets of the ARC as of December 31, 2017, were as follows:
Atlanta Regional Commission’s Capital Assets
(net of depreciation)
Governmental
Activities
Total
Percentage
Change
2017 2016 2016-2017
Equipment $ 702,784 $180,928 288%
Leasehold Improvements 546,069 0
Furnishings and Fixtures 848,415 7,870 10,679%
Total $2,097,268 $ 188,798
Additional information on the ARC’s capital assets can be found in note III.C on page 56 of this report.
Economic Factors and Next Year’s Budget
A funding level that is distinctive among the nation’s planning agencies supports the ARC. Two factors
contributing to this stability are: mandatory funding by the ten counties and the City of Atlanta, and prior
approval by the Georgia General Assembly before a county may withdraw from the Commission.
Based on financial forecasts, legislation was introduced and passed in March 2001, authorizing an increase
in the ARC’s local funding from $.80 per capita to $.90 effective January 1, 2002 and to $1.00 effective
January 1, 2003. In addition, the law gave the Board sole authority over future increases triggered by rises
in the Consumer Price Index.
• The approved 2018 budget results in an increase of $3,394 to the general fund balance.
• The per capita rate paid by the local governments as appropriations remained at $1.10 for 2017.
Projected increases for the 2018 budget are in accordance with projected increases of approximately
26
2.9 percent of population. The 2018 Budget reflects the per capita rate of $1.10 paid by local
governments.
• Financial forecasts prepared by management help anticipate future financial resources needed to
maintain critical programs for the ARC service area.
All of these factors were considered in preparing the ARC budget for the 2018 fiscal year.
Requests for Information
This financial report is designed to provide a general overview of ARC’s finances for all those with an
interest in the government’s finances. Questions concerning any of the information provided in this report
or requests for additional financial information should be addressed to the Office of the Financial Services
Manager, Atlanta Regional Commission, 229 Peachtree Street, NE, Suite 100, Atlanta, GA 30303.
27

Intentionally Blank
28
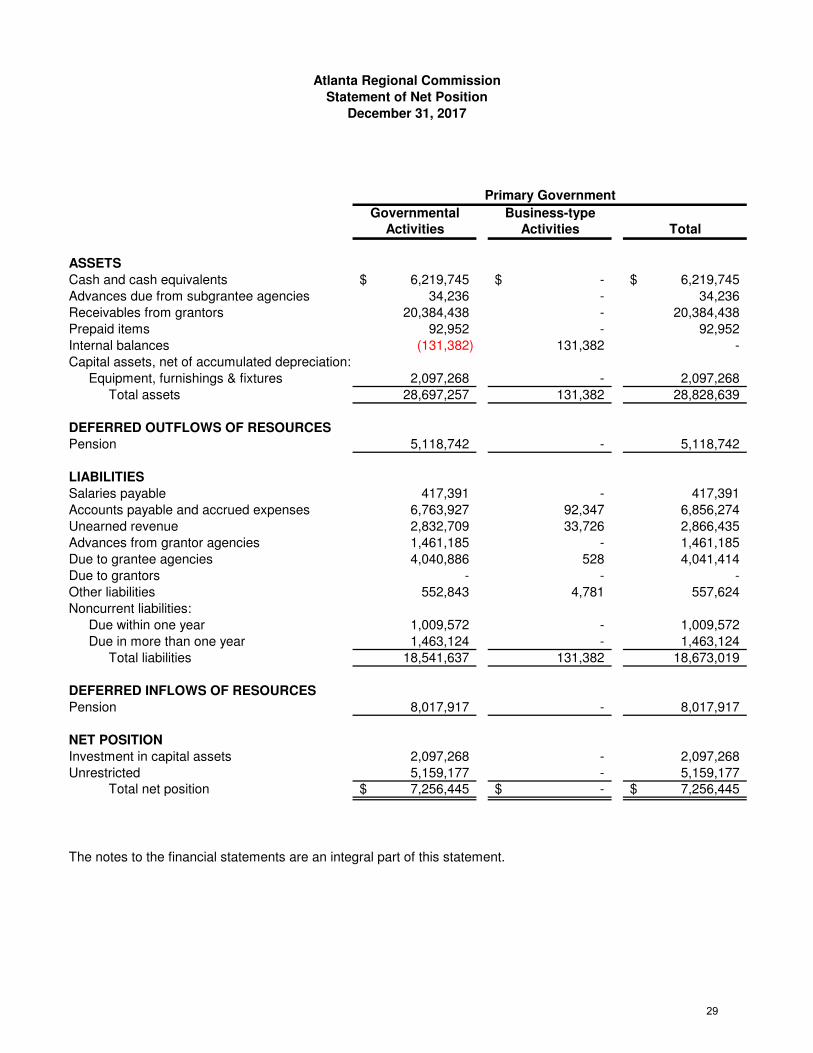
Governmental Business-type
Activities Activities Total
ASSETS
Cash and cash equivalents 6,219,745$ -$ 6,219,745$
Advances due from subgrantee agencies 34,236 - 34,236
Receivables from grantors 20,384,438 - 20,384,438
Prepaid items 92,952 - 92,952
Internal balances (131,382) 131,382 -
Capital assets, net of accumulated depreciation:
Equipment, furnishings & fixtures 2,097,268 - 2,097,268
Total assets 28,697,257 131,382 28,828,639
DEFERRED OUTFLOWS OF RESOURCES
Pension 5,118,742 - 5,118,742
LIABILITIES
Salaries payable 417,391 - 417,391
Accounts payable and accrued expenses 6,763,927 92,347 6,856,274
Unearned revenue 2,832,709 33,726 2,866,435
Advances from grantor agencies 1,461,185 - 1,461,185
Due to grantee agencies 4,040,886 528 4,041,414
Due to grantors - - -
Other liabilities 552,843 4,781 557,624
Noncurrent liabilities:
Due within one year 1,009,572 - 1,009,572
Due in more than one year 1,463,124 - 1,463,124
Total liabilities 18,541,637 131,382 18,673,019
DEFERRED INFLOWS OF RESOURCES
Pension 8,017,917 - 8,017,917
NET POSITION
Investment in capital assets 2,097,268 - 2,097,268
Unrestricted 5,159,177 - 5,159,177 Total net position 7,256,445$ -$ 7,256,445$
The notes to the financial statements are an integral part of this statement.
Primary Government
Atlanta Regional Commission
Statement of Net Position
December 31, 2017
29
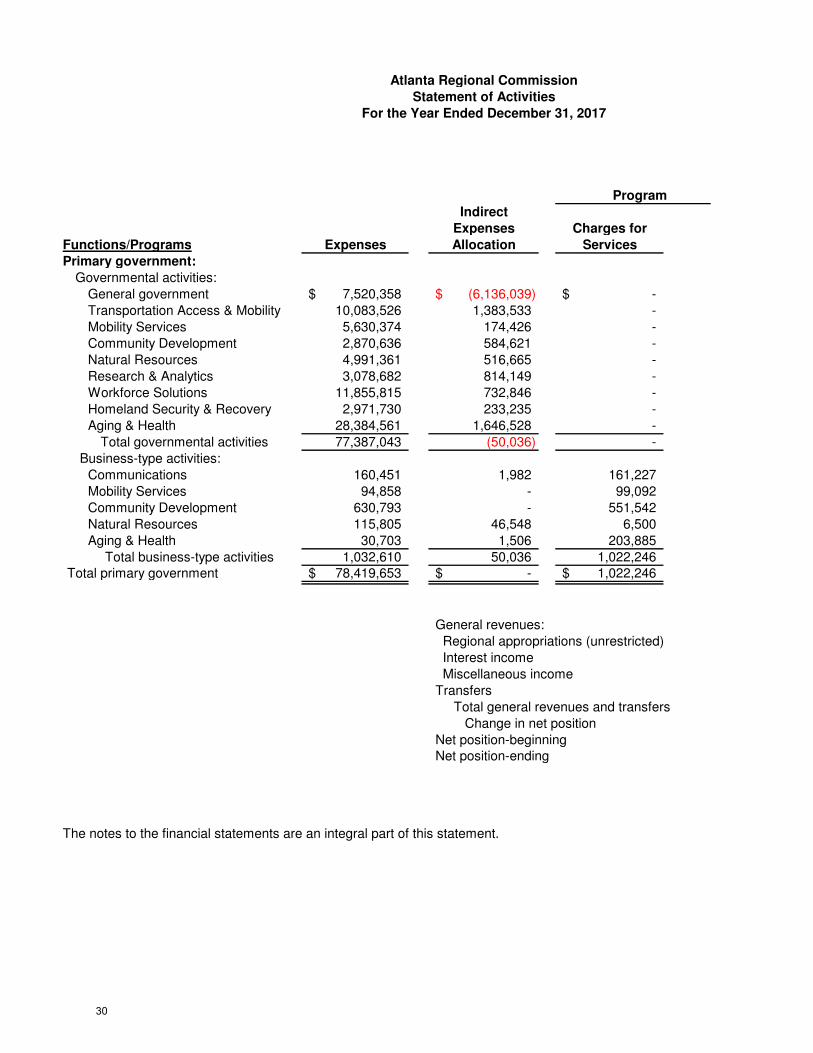
Atlanta Regional Commission
Statement of Activities
For the Year Ended December 31, 2017
Indirect
Expenses Charges for
Functions/Programs Expenses Allocation Services
Primary government:
Governmental activities:
General government 7,520,358$ (6,136,039)$ -$
Transportation Access & Mobility 10,083,526 1,383,533 -
Mobility Services 5,630,374 174,426 -
Community Development 2,870,636 584,621 -
Natural Resources 4,991,361 516,665 -
Research & Analytics 3,078,682 814,149 -
Workforce Solutions 11,855,815 732,846 -
Homeland Security & Recovery 2,971,730 233,235 -
Aging & Health 28,384,561 1,646,528 -
Total governmental activities 77,387,043 (50,036) -
Business-type activities:
Communications 160,451 1,982 161,227
Mobility Services 94,858 - 99,092
Community Development 630,793 - 551,542
Natural Resources 115,805 46,548 6,500
Aging & Health 30,703 1,506 203,885
Total business-type activities 1,032,610 50,036 1,022,246 Total primary government 78,419,653$ -$ 1,022,246$
General revenues:
Regional appropriations (unrestricted)
Interest income
Miscellaneous income
Transfers
Total general revenues and transfers
Change in net position
Net position-beginningNet position-ending
The notes to the financial statements are an integral part of this statement.
Program Revenues
30
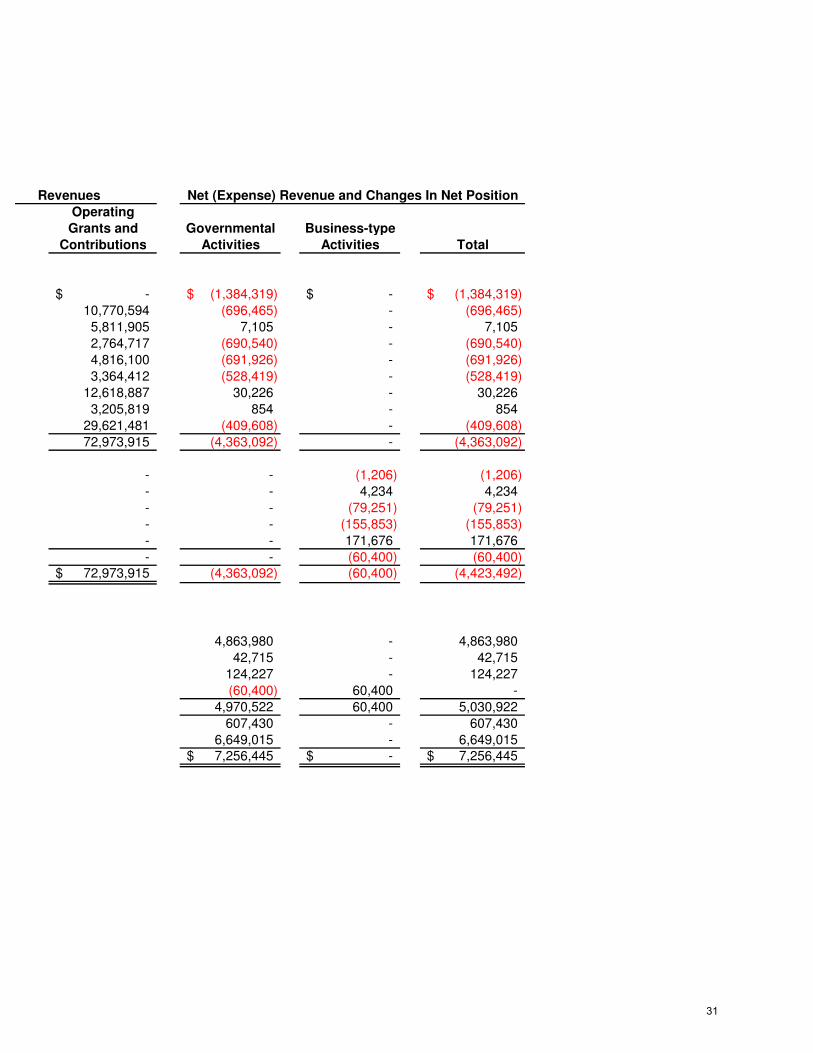
Operating
Grants and Governmental Business-type
Contributions Activities Activities Total
-$ (1,384,319)$ -$ (1,384,319)$
10,770,594 (696,465) - (696,465)
5,811,905 7,105 - 7,105
2,764,717 (690,540) - (690,540)
4,816,100 (691,926) - (691,926)
3,364,412 (528,419) - (528,419)
12,618,887 30,226 - 30,226
3,205,819 854 - 854
29,621,481 (409,608) - (409,608)
72,973,915 (4,363,092) - (4,363,092)
- - (1,206) (1,206)
- - 4,234 4,234
- - (79,251) (79,251)
- - (155,853) (155,853)
- - 171,676 171,676
- - (60,400) (60,400) 72,973,915$ (4,363,092) (60,400) (4,423,492)
4,863,980 - 4,863,980
42,715 - 42,715
124,227 - 124,227
(60,400) 60,400 -
4,970,522 60,400 5,030,922
607,430 - 607,430
6,649,015 - 6,649,015 7,256,445$ -$ 7,256,445$
Program Revenues Net (Expense) Revenue and Changes In Net Position
31
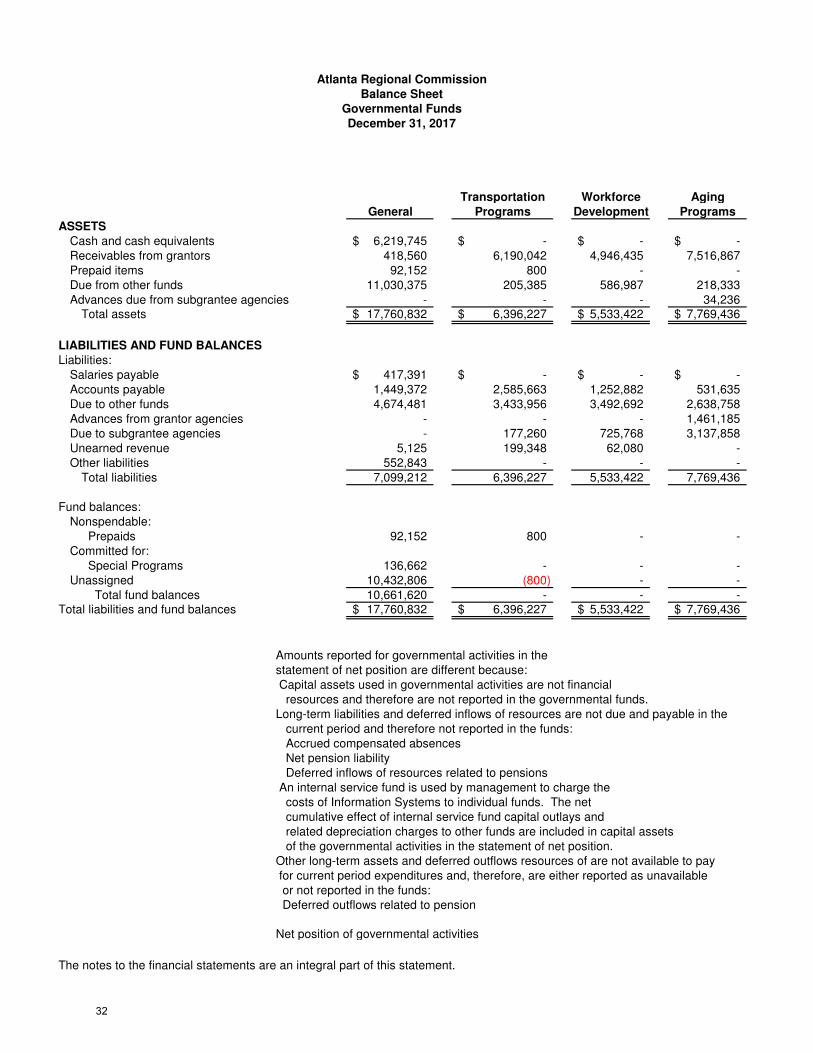
Transportation Workforce Aging
General Programs Development Programs
ASSETS
Cash and cash equivalents 6,219,745$ -$ -$ -$ Receivables from grantors 418,560 6,190,042 4,946,435 7,516,867 Prepaid items 92,152 800 - - Due from other funds 11,030,375 205,385 586,987 218,333 Advances due from subgrantee agencies - - - 34,236
Total assets 17,760,832$ 6,396,227$ 5,533,422$ 7,769,436$
LIABILITIES AND FUND BALANCES
Liabilities:Salaries payable 417,391$ -$ -$ -$ Accounts payable 1,449,372 2,585,663 1,252,882 531,635 Due to other funds 4,674,481 3,433,956 3,492,692 2,638,758 Advances from grantor agencies - - - 1,461,185 Due to subgrantee agencies - 177,260 725,768 3,137,858 Unearned revenue 5,125 199,348 62,080 - Other liabilities 552,843 - - - Total liabilities (Note 2)Total liabilities 7,099,212 6,396,227 5,533,422 7,769,436
Fund balances:Nonspendable:
Prepaids 92,152 800 - - Committed for:
Special Programs 136,662 - - - Unassigned 10,432,806 (800) - - Total fund balances Total fund balances 10,661,620 - - -
Total liabilities and fund balances 17,760,832$ 6,396,227$ 5,533,422$ 7,769,436$
Amounts reported for governmental activities in thestatement of net position are different because: Capital assets used in governmental activities are not financial resources and therefore are not reported in the governmental funds.Long-term liabilities and deferred inflows of resources are not due and payable in the current period and therefore not reported in the funds: Accrued compensated absences Net pension liability Deferred inflows of resources related to pensions An internal service fund is used by management to charge the costs of Information Systems to individual funds. The net cumulative effect of internal service fund capital outlays and related depreciation charges to other funds are included in capital assets of the governmental activities in the statement of net position.Other long-term assets and deferred outflows resources of are not available to pay for current period expenditures and, therefore, are either reported as unavailable or not reported in the funds: Deferred outflows related to pension
Net position of governmental activities
The notes to the financial statements are an integral part of this statement.
Atlanta Regional Commission
Balance Sheet
Governmental Funds
December 31, 2017
32
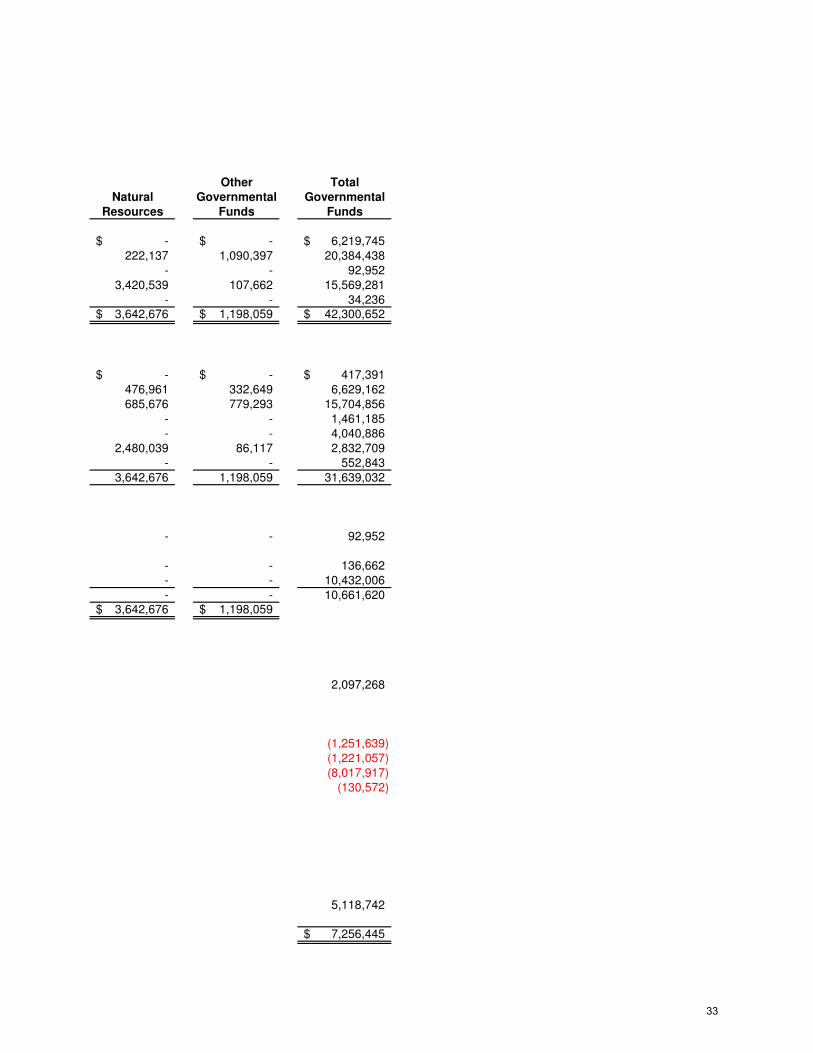
Other Total
Natural Governmental Governmental
Resources Funds Funds
-$ -$ 6,219,745$ 222,137 1,090,397 20,384,438
- - 92,952 3,420,539 107,662 15,569,281
- - 34,236 3,642,676$ 1,198,059$ 42,300,652$
-$ -$ 417,391$ 476,961 332,649 6,629,162 685,676 779,293 15,704,856
- - 1,461,185 - - 4,040,886
2,480,039 86,117 2,832,709 - - 552,843
3,642,676 1,198,059 31,639,032
- - 92,952
- - 136,662 - - 10,432,006 - - 10,661,620
3,642,676$ 1,198,059$
2,097,268
(1,251,639) (1,221,057) (8,017,917)
(130,572)
5,118,742
7,256,445$
33
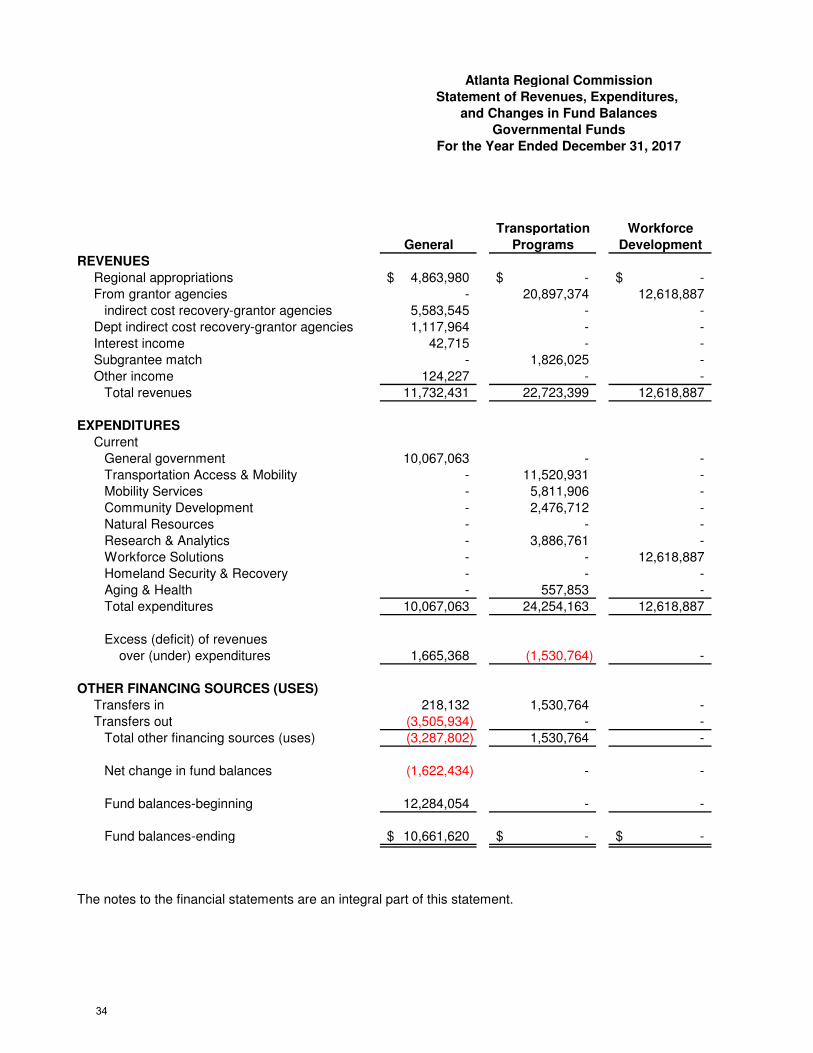
Transportation Workforce
General Programs Development
REVENUES
Regional appropriations 4,863,980$ -$ -$
From grantor agencies - 20,897,374 12,618,887
indirect cost recovery-grantor agencies 5,583,545 - -
Dept indirect cost recovery-grantor agencies 1,117,964 - -
Interest income 42,715 - -
Subgrantee match - 1,826,025 -
Other income 124,227 - -
Total revenues 11,732,431 22,723,399 12,618,887
EXPENDITURES
Current
General government 10,067,063 - -
Transportation Access & Mobility - 11,520,931 -
Mobility Services - 5,811,906 -
Community Development - 2,476,712 -
Natural Resources - - -
Research & Analytics - 3,886,761 -
Workforce Solutions - - 12,618,887
Homeland Security & Recovery - - -
Aging & Health - 557,853 -
Total expenditures 10,067,063 24,254,163 12,618,887
Excess (deficit) of revenues
over (under) expenditures 1,665,368 (1,530,764) -
OTHER FINANCING SOURCES (USES)
Transfers in 218,132 1,530,764 -
Transfers out (3,505,934) - -
Total other financing sources (uses) (3,287,802) 1,530,764 -
Net change in fund balances (1,622,434) - -
Fund balances-beginning 12,284,054 - -
Fund balances-ending 10,661,620$ -$ -$
The notes to the financial statements are an integral part of this statement.
Atlanta Regional Commission
Statement of Revenues, Expenditures,
Governmental Funds
For the Year Ended December 31, 2017
and Changes in Fund Balances
34
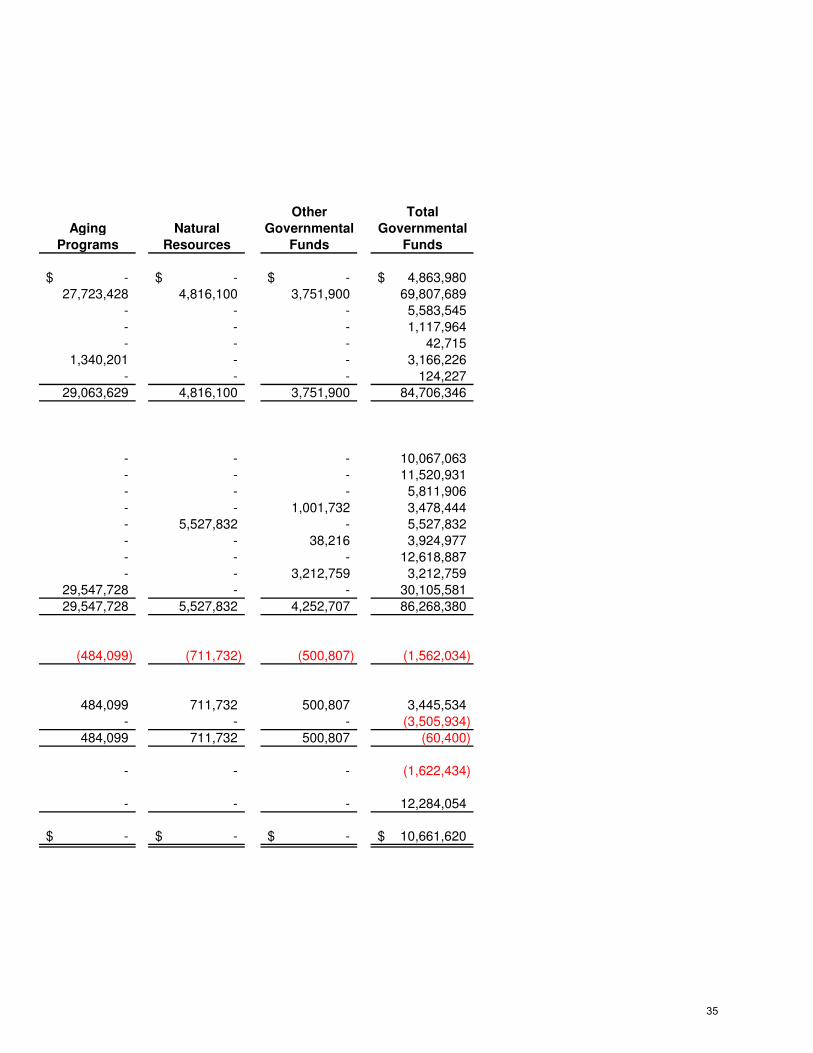
Other Total
Aging Natural Governmental Governmental
Programs Resources Funds Funds
-$ -$ -$ 4,863,980$
27,723,428 4,816,100 3,751,900 69,807,689
- - - 5,583,545
- - - 1,117,964
- - - 42,715
1,340,201 - - 3,166,226
- - - 124,227
29,063,629 4,816,100 3,751,900 84,706,346
- - - 10,067,063
- - - 11,520,931
- - - 5,811,906
- - 1,001,732 3,478,444
- 5,527,832 - 5,527,832
- - 38,216 3,924,977
- - - 12,618,887
- - 3,212,759 3,212,759
29,547,728 - - 30,105,581
29,547,728 5,527,832 4,252,707 86,268,380
(484,099) (711,732) (500,807) (1,562,034)
484,099 711,732 500,807 3,445,534
- - - (3,505,934)
484,099 711,732 500,807 (60,400)
- - - (1,622,434)
- - - 12,284,054
-$ -$ -$ 10,661,620$
35
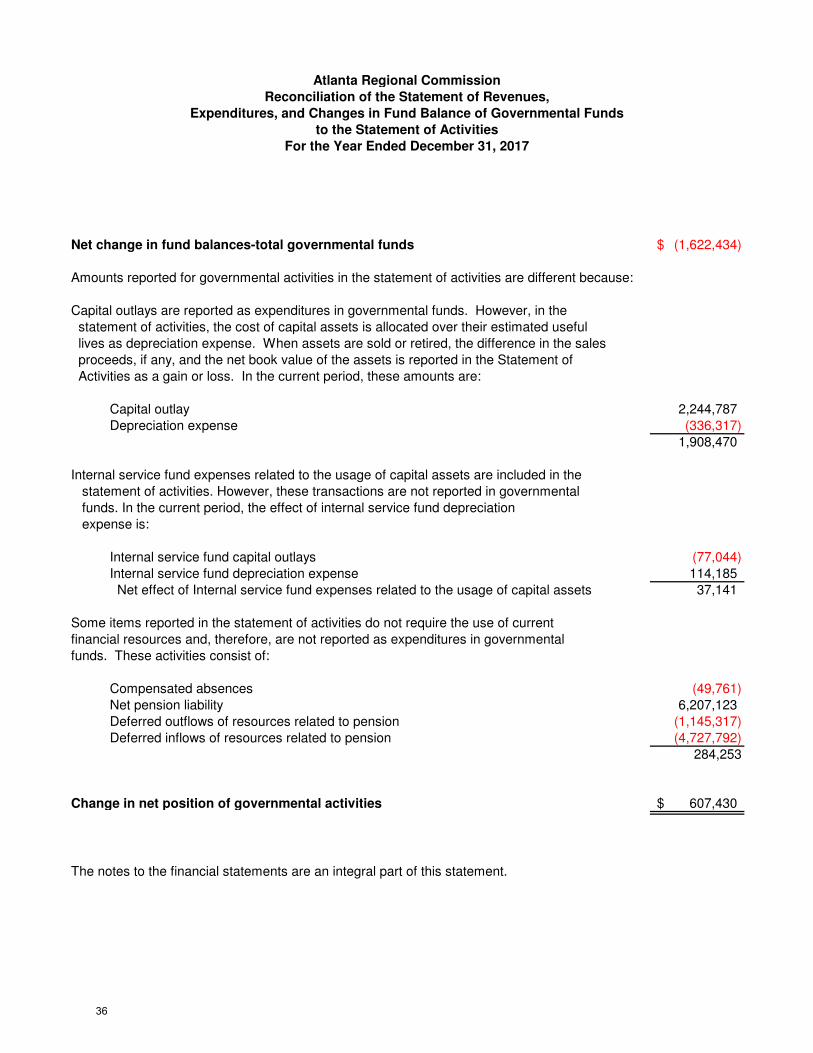
Net change in fund balances-total governmental funds (1,622,434)$
Amounts reported for governmental activities in the statement of activities are different because:
Capital outlays are reported as expenditures in governmental funds. However, in the
statement of activities, the cost of capital assets is allocated over their estimated useful
lives as depreciation expense. When assets are sold or retired, the difference in the sales
proceeds, if any, and the net book value of the assets is reported in the Statement of
Activities as a gain or loss. In the current period, these amounts are:
Capital outlay 2,244,787
Depreciation expense (336,317)
1,908,470
Internal service fund expenses related to the usage of capital assets are included in the
statement of activities. However, these transactions are not reported in governmental
funds. In the current period, the effect of internal service fund depreciation
expense is:
Internal service fund capital outlays (77,044)
Internal service fund depreciation expense 114,185
Net effect of Internal service fund expenses related to the usage of capital assets 37,141
Some items reported in the statement of activities do not require the use of current
financial resources and, therefore, are not reported as expenditures in governmental
funds. These activities consist of:
Compensated absences (49,761)
Net pension liability 6,207,123
Deferred outflows of resources related to pension (1,145,317)
Deferred inflows of resources related to pension (4,727,792)
284,253
Change in net position of governmental activities 607,430$
The notes to the financial statements are an integral part of this statement.
Atlanta Regional Commission
Reconciliation of the Statement of Revenues,
to the Statement of Activities
For the Year Ended December 31, 2017
Expenditures, and Changes in Fund Balance of Governmental Funds
36
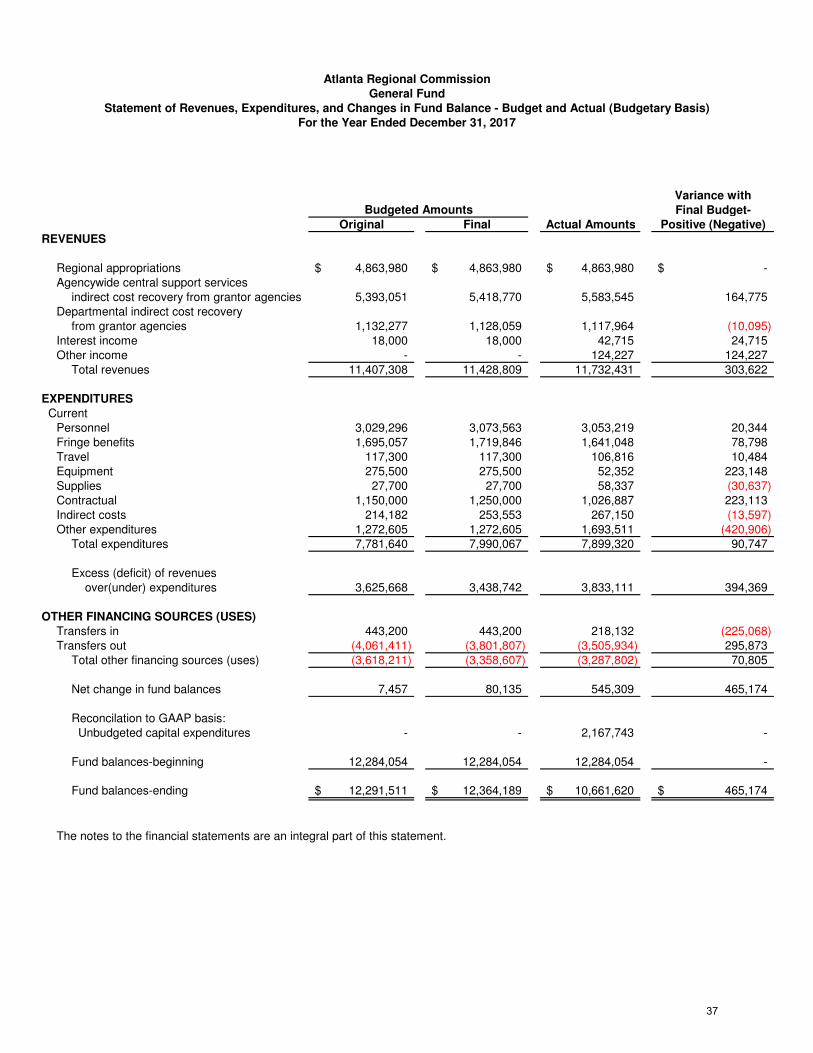
Variance with
Final Budget-
Original Final Actual Amounts Positive (Negative)
REVENUES
Regional appropriations 4,863,980$ 4,863,980$ 4,863,980$ -$ Agencywide central support services
indirect cost recovery from grantor agencies 5,393,051 5,418,770 5,583,545 164,775 Departmental indirect cost recovery
from grantor agencies 1,132,277 1,128,059 1,117,964 (10,095) Interest income 18,000 18,000 42,715 24,715 Other income - - 124,227 124,227
Total revenues 11,407,308 11,428,809 11,732,431 303,622
EXPENDITURES
CurrentPersonnel 3,029,296 3,073,563 3,053,219 20,344 Fringe benefits 1,695,057 1,719,846 1,641,048 78,798 Travel 117,300 117,300 106,816 10,484 Equipment 275,500 275,500 52,352 223,148 Supplies 27,700 27,700 58,337 (30,637) Contractual 1,150,000 1,250,000 1,026,887 223,113 Indirect costs 214,182 253,553 267,150 (13,597) Other expenditures 1,272,605 1,272,605 1,693,511 (420,906)
Total expenditures 7,781,640 7,990,067 7,899,320 90,747
Excess (deficit) of revenues over(under) expenditures 3,625,668 3,438,742 3,833,111 394,369
OTHER FINANCING SOURCES (USES)
Transfers in 443,200 443,200 218,132 (225,068) Transfers out (4,061,411) (3,801,807) (3,505,934) 295,873
Total other financing sources (uses) (3,618,211) (3,358,607) (3,287,802) 70,805
Net change in fund balances 7,457 80,135 545,309 465,174
Reconcilation to GAAP basis: Unbudgeted capital expenditures - - 2,167,743 -
Fund balances-beginning 12,284,054 12,284,054 12,284,054 -
Fund balances-ending 12,291,511$ 12,364,189$ 10,661,620$ 465,174$
The notes to the financial statements are an integral part of this statement.
Budgeted Amounts
General Fund
Atlanta Regional Commission
Statement of Revenues, Expenditures, and Changes in Fund Balance - Budget and Actual (Budgetary Basis)
For the Year Ended December 31, 2017
37
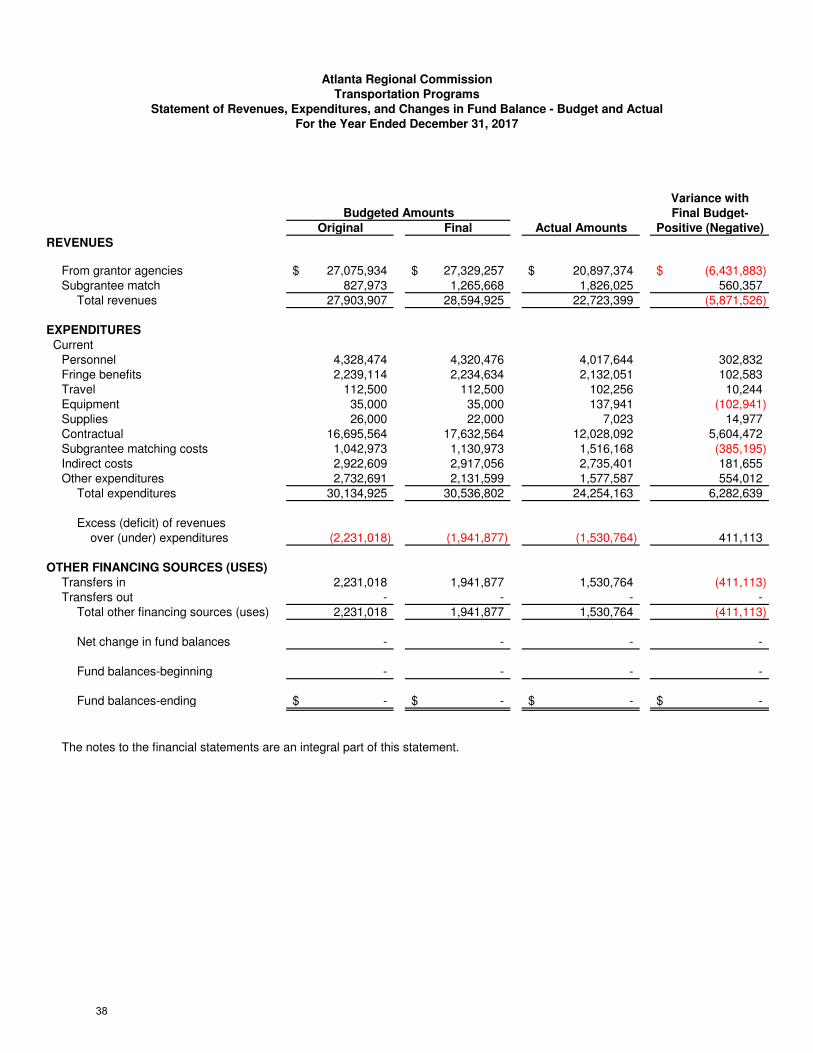
Variance with
Final Budget-
Original Final Actual Amounts Positive (Negative)
REVENUES
From grantor agencies 27,075,934$ 27,329,257$ 20,897,374$ (6,431,883)$ Subgrantee match 827,973 1,265,668 1,826,025 560,357
Total revenues 27,903,907 28,594,925 22,723,399 (5,871,526)
EXPENDITURES
CurrentPersonnel 4,328,474 4,320,476 4,017,644 302,832 Fringe benefits 2,239,114 2,234,634 2,132,051 102,583 Travel 112,500 112,500 102,256 10,244 Equipment 35,000 35,000 137,941 (102,941) Supplies 26,000 22,000 7,023 14,977 Contractual 16,695,564 17,632,564 12,028,092 5,604,472 Subgrantee matching costs 1,042,973 1,130,973 1,516,168 (385,195) Indirect costs 2,922,609 2,917,056 2,735,401 181,655 Other expenditures 2,732,691 2,131,599 1,577,587 554,012
Total expenditures 30,134,925 30,536,802 24,254,163 6,282,639
Excess (deficit) of revenues over (under) expenditures (2,231,018) (1,941,877) (1,530,764) 411,113
OTHER FINANCING SOURCES (USES)
Transfers in 2,231,018 1,941,877 1,530,764 (411,113) Transfers out - - - -
Total other financing sources (uses) 2,231,018 1,941,877 1,530,764 (411,113)
Net change in fund balances - - - -
Fund balances-beginning - - - -
Fund balances-ending -$ -$ -$ -$
The notes to the financial statements are an integral part of this statement.
Budgeted Amounts
Transportation Programs
Atlanta Regional Commission
Statement of Revenues, Expenditures, and Changes in Fund Balance - Budget and Actual
For the Year Ended December 31, 2017
38
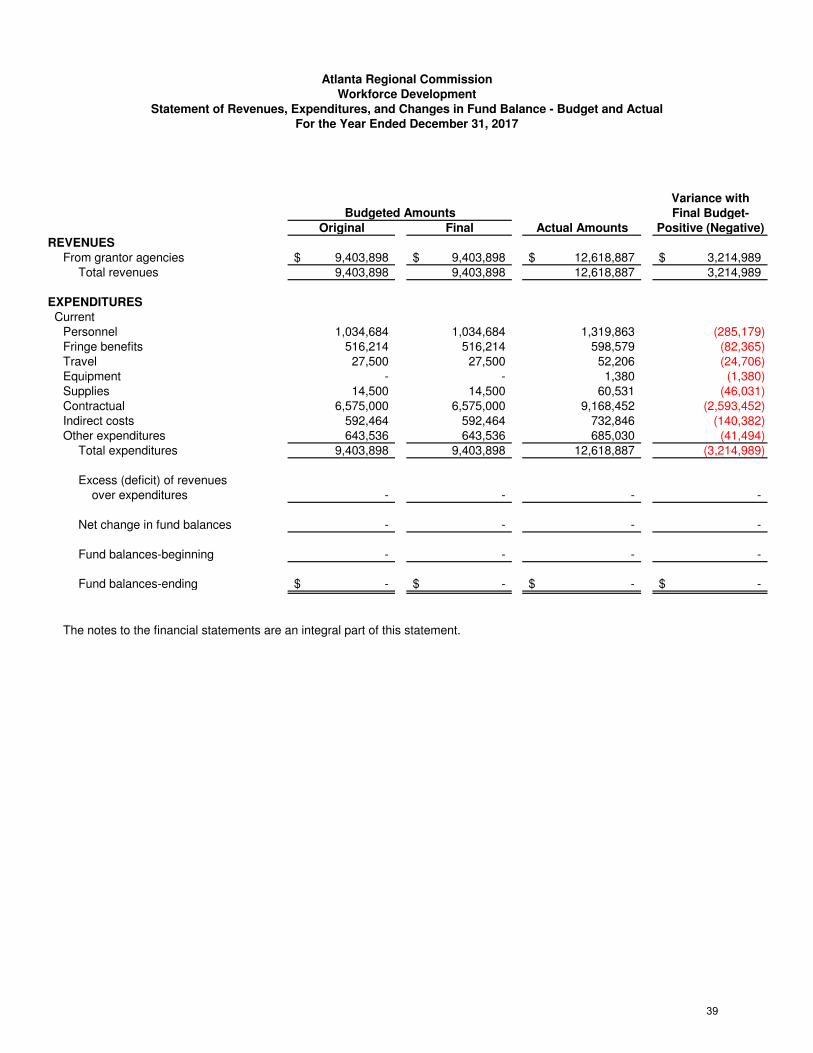
Variance with
Final Budget-
Original Final Actual Amounts Positive (Negative)
REVENUES
From grantor agencies 9,403,898$ 9,403,898$ 12,618,887$ 3,214,989$ Total revenues 9,403,898 9,403,898 12,618,887 3,214,989
EXPENDITURES
CurrentPersonnel 1,034,684 1,034,684 1,319,863 (285,179) Fringe benefits 516,214 516,214 598,579 (82,365) Travel 27,500 27,500 52,206 (24,706) Equipment - - 1,380 (1,380) Supplies 14,500 14,500 60,531 (46,031) Contractual 6,575,000 6,575,000 9,168,452 (2,593,452) Indirect costs 592,464 592,464 732,846 (140,382) Other expenditures 643,536 643,536 685,030 (41,494)
Total expenditures 9,403,898 9,403,898 12,618,887 (3,214,989)
Excess (deficit) of revenues over expenditures - - - -
Net change in fund balances - - - -
Fund balances-beginning - - - -
Fund balances-ending -$ -$ -$ -$
The notes to the financial statements are an integral part of this statement.
Budgeted Amounts
Workforce Development
Atlanta Regional Commission
Statement of Revenues, Expenditures, and Changes in Fund Balance - Budget and Actual
For the Year Ended December 31, 2017
39
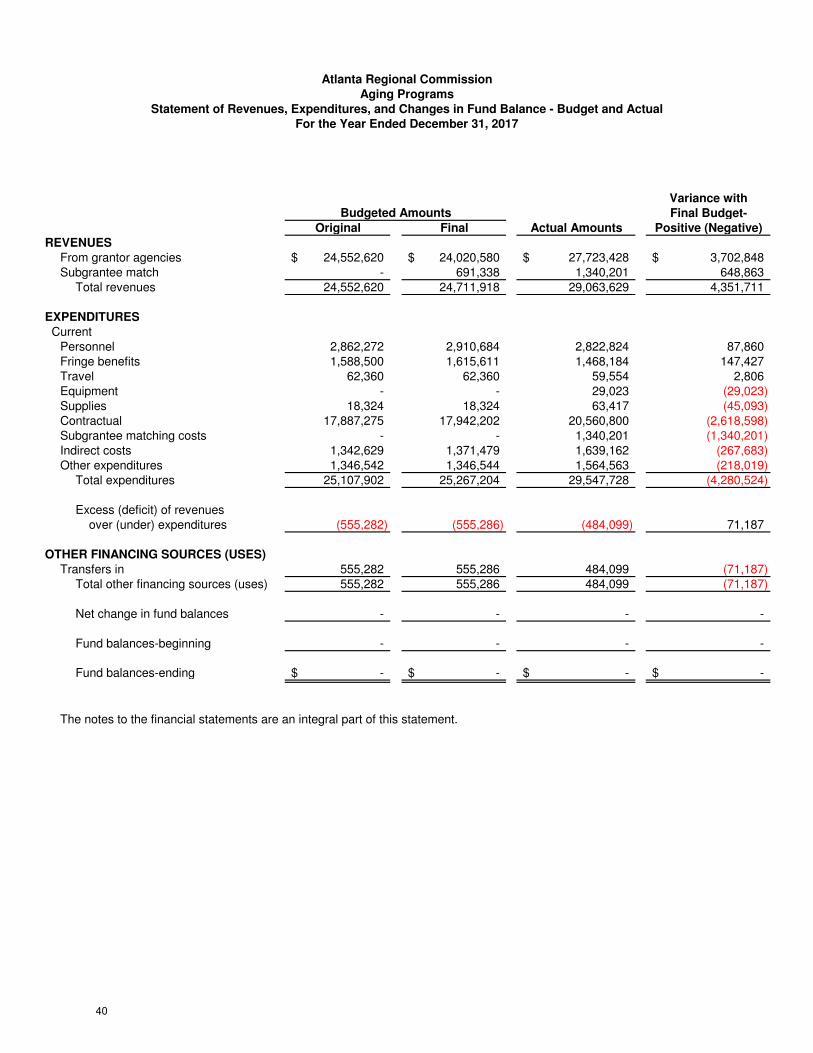
Variance with
Final Budget-
Original Final Actual Amounts Positive (Negative)
REVENUES
From grantor agencies 24,552,620$ 24,020,580$ 27,723,428$ 3,702,848$ Subgrantee match - 691,338 1,340,201 648,863
Total revenues 24,552,620 24,711,918 29,063,629 4,351,711
EXPENDITURES
CurrentPersonnel 2,862,272 2,910,684 2,822,824 87,860 Fringe benefits 1,588,500 1,615,611 1,468,184 147,427 Travel 62,360 62,360 59,554 2,806 Equipment - - 29,023 (29,023) Supplies 18,324 18,324 63,417 (45,093) Contractual 17,887,275 17,942,202 20,560,800 (2,618,598) Subgrantee matching costs - - 1,340,201 (1,340,201) Indirect costs 1,342,629 1,371,479 1,639,162 (267,683) Other expenditures 1,346,542 1,346,544 1,564,563 (218,019)
Total expenditures 25,107,902 25,267,204 29,547,728 (4,280,524)
Excess (deficit) of revenues over (under) expenditures (555,282) (555,286) (484,099) 71,187
OTHER FINANCING SOURCES (USES)
Transfers in 555,282 555,286 484,099 (71,187) Total other financing sources (uses) 555,282 555,286 484,099 (71,187)
Net change in fund balances - - - -
Fund balances-beginning - - - -
Fund balances-ending -$ -$ -$ -$
The notes to the financial statements are an integral part of this statement.
Budgeted Amounts
Aging Programs
Atlanta Regional Commission
Statement of Revenues, Expenditures, and Changes in Fund Balance - Budget and Actual
For the Year Ended December 31, 2017
40
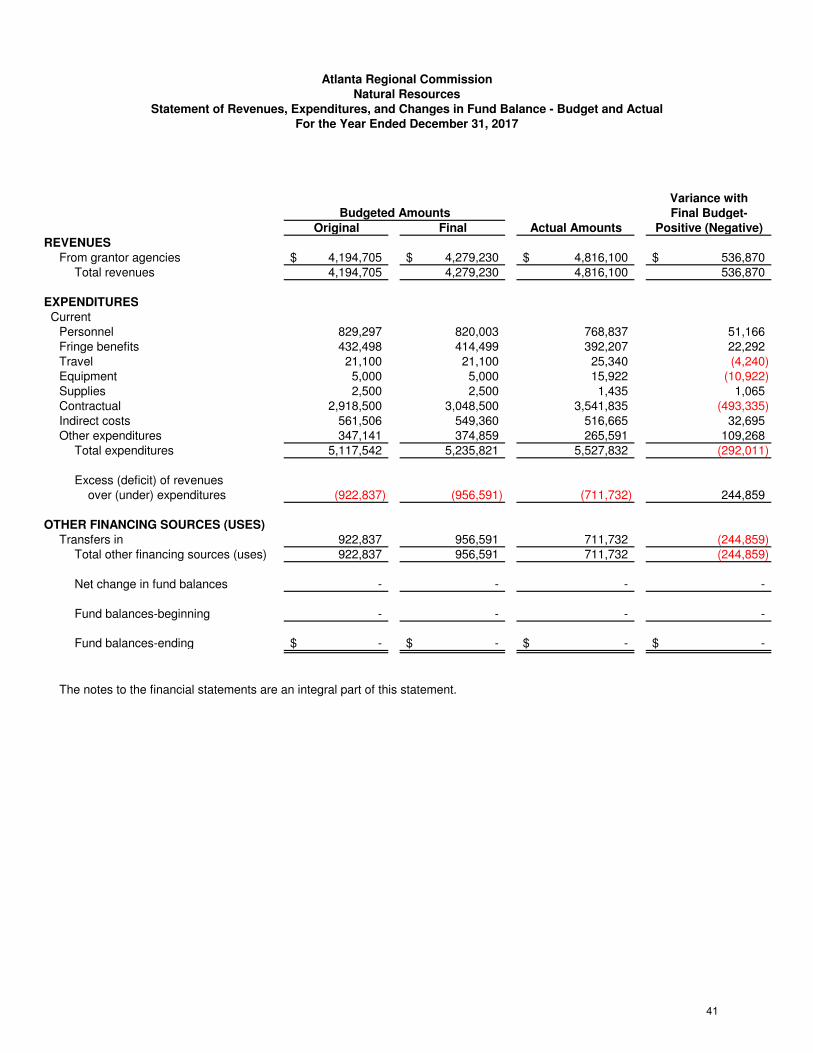
Variance with
Final Budget-
Original Final Actual Amounts Positive (Negative)
REVENUES
From grantor agencies 4,194,705$ 4,279,230$ 4,816,100$ 536,870$ Total revenues 4,194,705 4,279,230 4,816,100 536,870
EXPENDITURES
CurrentPersonnel 829,297 820,003 768,837 51,166 Fringe benefits 432,498 414,499 392,207 22,292 Travel 21,100 21,100 25,340 (4,240) Equipment 5,000 5,000 15,922 (10,922) Supplies 2,500 2,500 1,435 1,065 Contractual 2,918,500 3,048,500 3,541,835 (493,335) Indirect costs 561,506 549,360 516,665 32,695 Other expenditures 347,141 374,859 265,591 109,268
Total expenditures 5,117,542 5,235,821 5,527,832 (292,011)
Excess (deficit) of revenues over (under) expenditures (922,837) (956,591) (711,732) 244,859
OTHER FINANCING SOURCES (USES)
Transfers in 922,837 956,591 711,732 (244,859) Total other financing sources (uses) 922,837 956,591 711,732 (244,859)
Net change in fund balances - - - -
Fund balances-beginning - - - -
Fund balances-ending -$ -$ -$ -$
The notes to the financial statements are an integral part of this statement.
Budgeted Amounts
Natural Resources
Atlanta Regional Commission
Statement of Revenues, Expenditures, and Changes in Fund Balance - Budget and Actual
For the Year Ended December 31, 2017
41
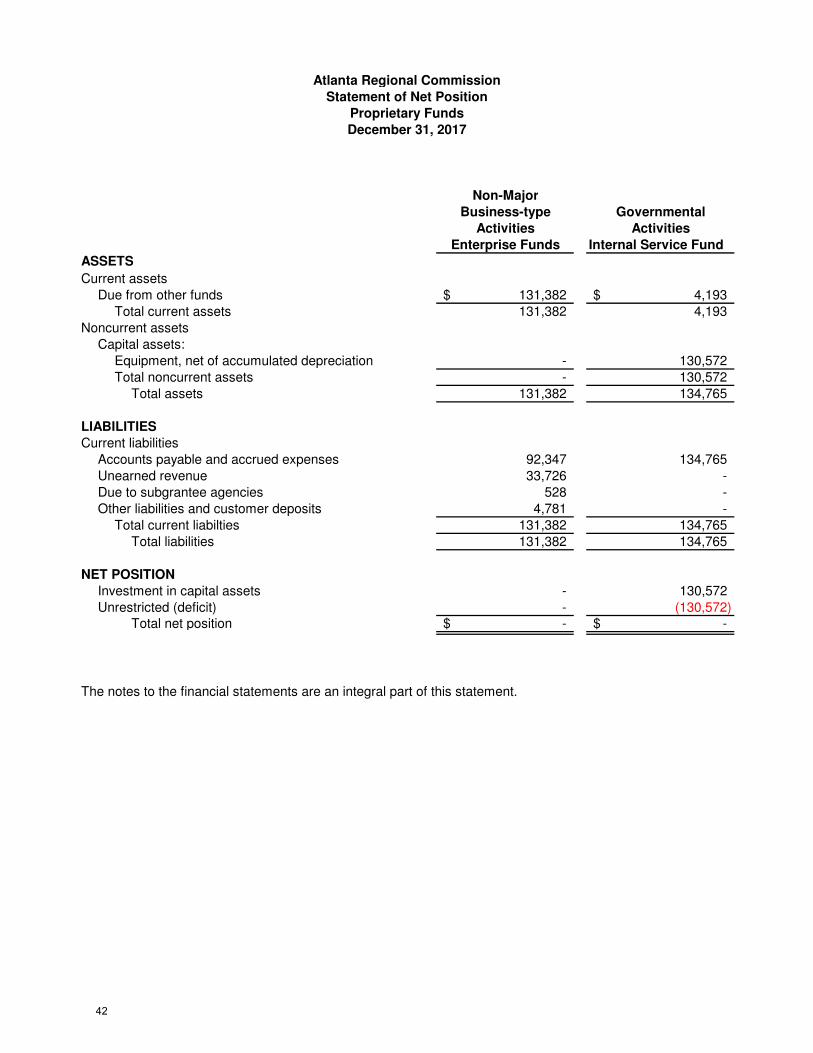
Non-Major
Business-type Governmental
Activities Activities
Enterprise Funds Internal Service Fund
ASSETS
Current assets
Due from other funds 131,382$ 4,193$
Total current assets 131,382 4,193
Noncurrent assets
Capital assets:
Equipment, net of accumulated depreciation - 130,572
Total noncurrent assets - 130,572
Total assets 131,382 134,765
LIABILITIES
Current liabilities
Accounts payable and accrued expenses 92,347 134,765
Unearned revenue 33,726 -
Due to subgrantee agencies 528 -
Other liabilities and customer deposits 4,781 -
Total current liabilties 131,382 134,765
Total liabilities 131,382 134,765
NET POSITION
Investment in capital assets - 130,572
Unrestricted (deficit) - (130,572) Total net position -$ -$
The notes to the financial statements are an integral part of this statement.
Atlanta Regional Commission
Statement of Net Position
Proprietary Funds
December 31, 2017
42
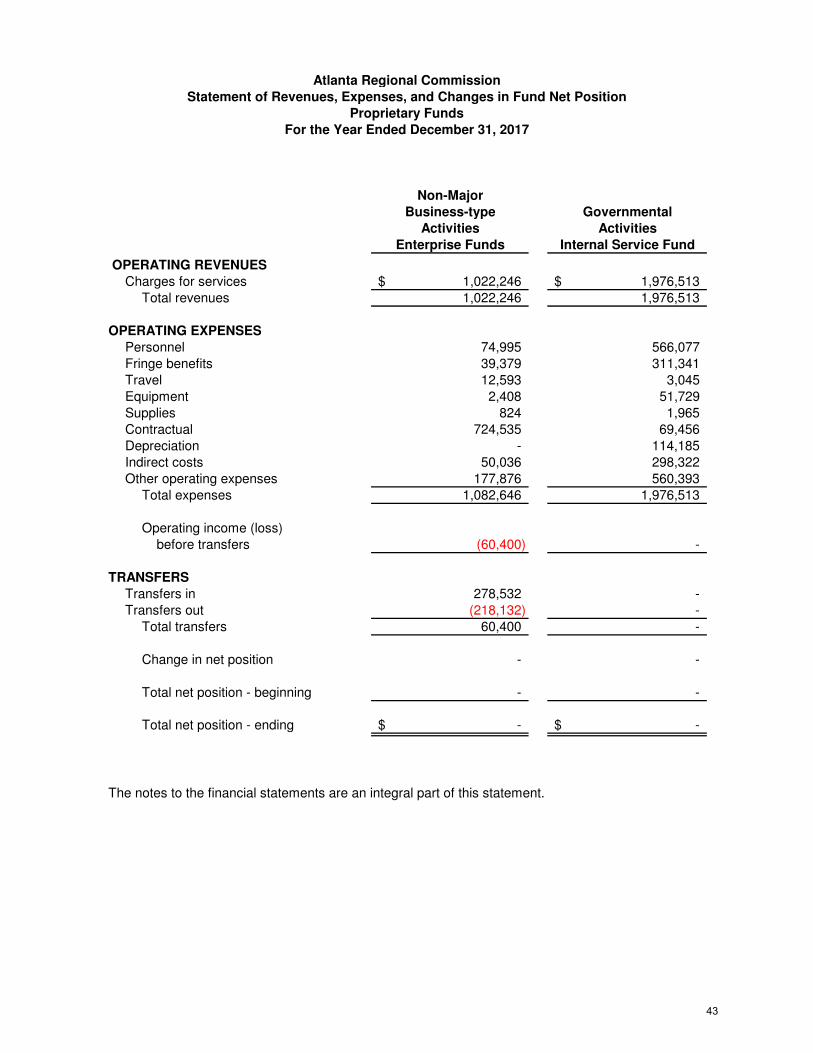
Non-Major
Business-type Governmental
Activities Activities
Enterprise Funds Internal Service Fund
OPERATING REVENUES
Charges for services 1,022,246$ 1,976,513$
Total revenues 1,022,246 1,976,513
OPERATING EXPENSES
Personnel 74,995 566,077
Fringe benefits 39,379 311,341
Travel 12,593 3,045
Equipment 2,408 51,729
Supplies 824 1,965
Contractual 724,535 69,456
Depreciation - 114,185
Indirect costs 50,036 298,322
Other operating expenses 177,876 560,393
Total expenses 1,082,646 1,976,513
Operating income (loss)
before transfers (60,400) -
TRANSFERS
Transfers in 278,532 -
Transfers out (218,132) -
Total transfers 60,400 -
Change in net position - -
Total net position - beginning - -
Total net position - ending -$ -$
The notes to the financial statements are an integral part of this statement.
Atlanta Regional Commission
Statement of Revenues, Expenses, and Changes in Fund Net Position
Proprietary Funds
For the Year Ended December 31, 2017
43
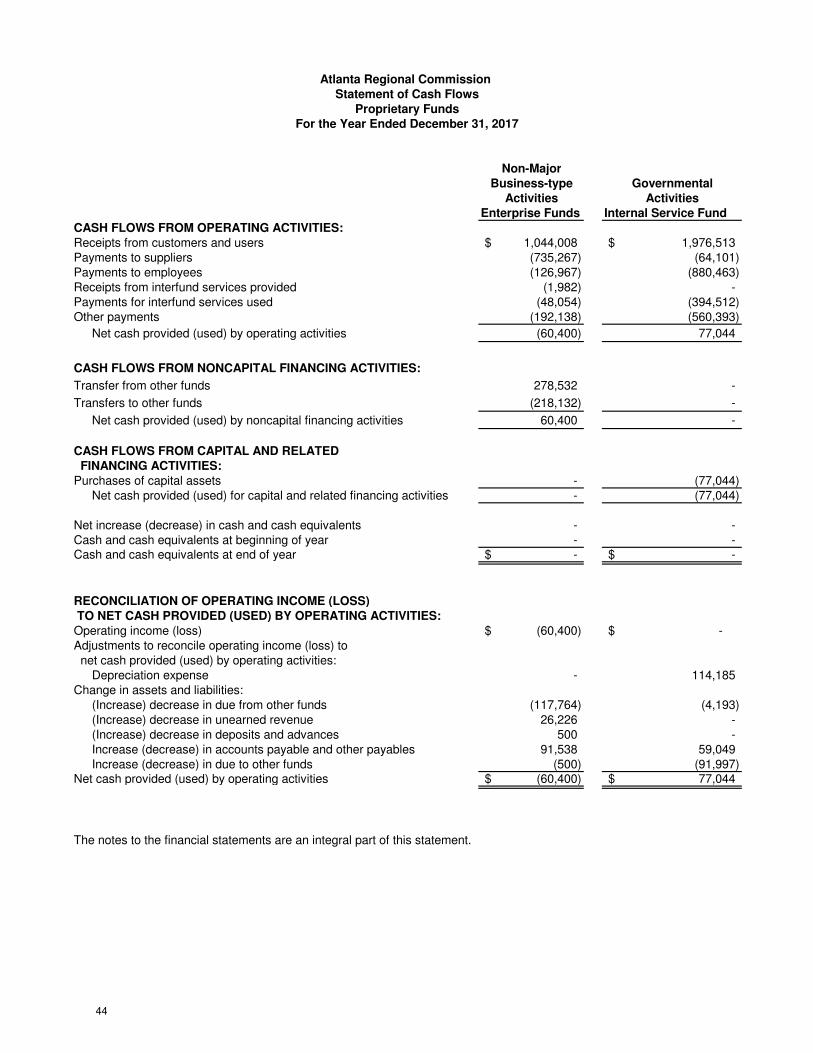
Non-Major
Business-type Governmental
Activities Activities
Enterprise Funds Internal Service Fund
CASH FLOWS FROM OPERATING ACTIVITIES:
Receipts from customers and users 1,044,008$ 1,976,513$ Payments to suppliers (735,267) (64,101) Payments to employees (126,967) (880,463) Receipts from interfund services provided (1,982) - Payments for interfund services used (48,054) (394,512) Other payments (192,138) (560,393)
Net cash provided (used) by operating activities (60,400) 77,044
CASH FLOWS FROM NONCAPITAL FINANCING ACTIVITIES:
Transfer from other funds 278,532 -
Transfers to other funds (218,132) -
Net cash provided (used) by noncapital financing activities 60,400 -
CASH FLOWS FROM CAPITAL AND RELATED FINANCING ACTIVITIES:
Purchases of capital assets - (77,044) Net cash provided (used) for capital and related financing activities - (77,044)
Net increase (decrease) in cash and cash equivalents - - Cash and cash equivalents at beginning of year - - Cash and cash equivalents at end of year -$ -$
RECONCILIATION OF OPERATING INCOME (LOSS)
TO NET CASH PROVIDED (USED) BY OPERATING ACTIVITIES:
Operating income (loss) (60,400)$ -$ Adjustments to reconcile operating income (loss) to net cash provided (used) by operating activities:
Depreciation expense - 114,185 Change in assets and liabilities:
(Increase) decrease in due from other funds (117,764) (4,193) (Increase) decrease in unearned revenue 26,226 - (Increase) decrease in deposits and advances 500 - Increase (decrease) in accounts payable and other payables 91,538 59,049 Increase (decrease) in due to other funds (500) (91,997)
Net cash provided (used) by operating activities (60,400)$ 77,044$
The notes to the financial statements are an integral part of this statement.
Atlanta Regional Commission
Statement of Cash Flows
Proprietary Funds
For the Year Ended December 31, 2017
44

Pension/OPEB
Trust Funds
ASSETS
Receivables
Accrued interest 381$
Due from employees 343,650
Investments, at fair value
Short term 471,735
Fixed 15,540,658
Equities 46,107,491
Total investments 62,119,884 Total assets 62,463,915
LIABILITIES
Accounts Payable 14,322
Total liabilities 14,322
NET POSITION
Restricted for pension benefits 52,014,455
Restricted for OPEB 10,435,138 62,449,593$
The notes to the financial statements are an integral part of this statement.
December 31, 2017
Atlanta Regional Commission
Fiduciary Funds
Statement of Fiduciary Net Position
45
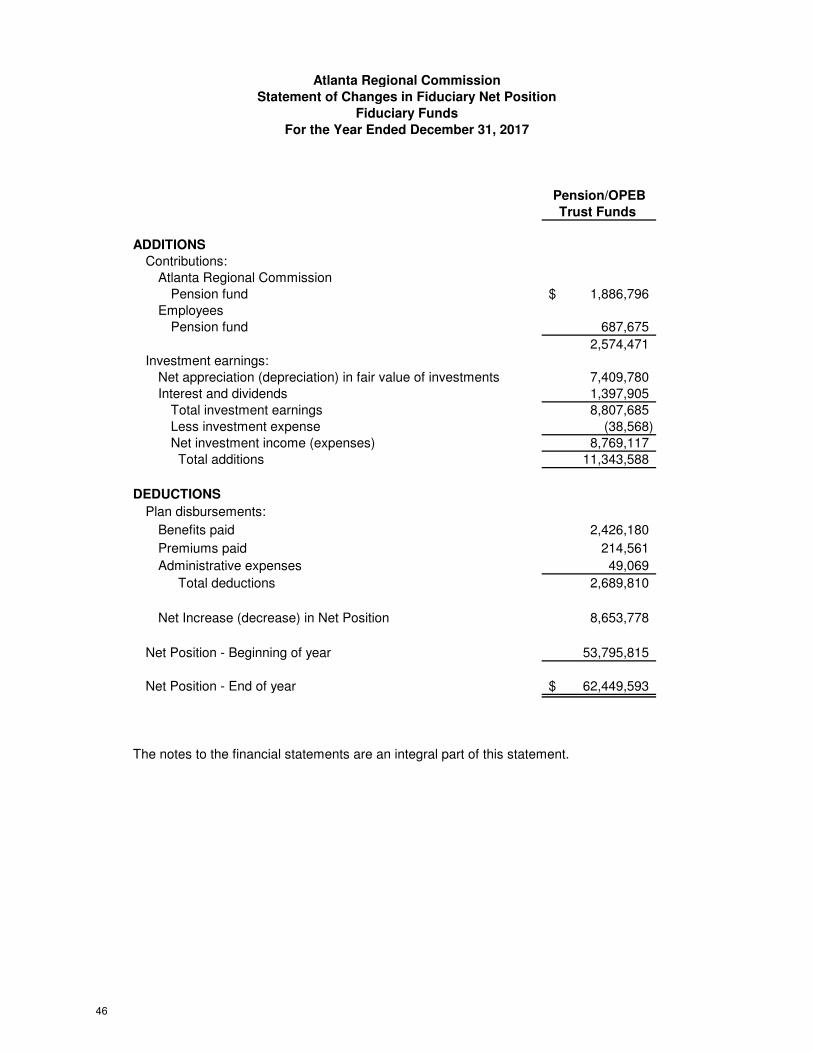
Pension/OPEB
Trust Funds
ADDITIONS
Contributions:
Atlanta Regional Commission
Pension fund 1,886,796$
Employees
Pension fund 687,675
2,574,471
Investment earnings:
Net appreciation (depreciation) in fair value of investments 7,409,780
Interest and dividends 1,397,905
Total investment earnings 8,807,685
Less investment expense (38,568)
Net investment income (expenses) 8,769,117
Total additions 11,343,588
DEDUCTIONS
Plan disbursements:
Benefits paid 2,426,180
Premiums paid 214,561
Administrative expenses 49,069
Total deductions 2,689,810
Net Increase (decrease) in Net Position 8,653,778
Net Position - Beginning of year 53,795,815
Net Position - End of year 62,449,593$
The notes to the financial statements are an integral part of this statement.
For the Year Ended December 31, 2017
Atlanta Regional Commission
Statement of Changes in Fiduciary Net Position
Fiduciary Funds
46
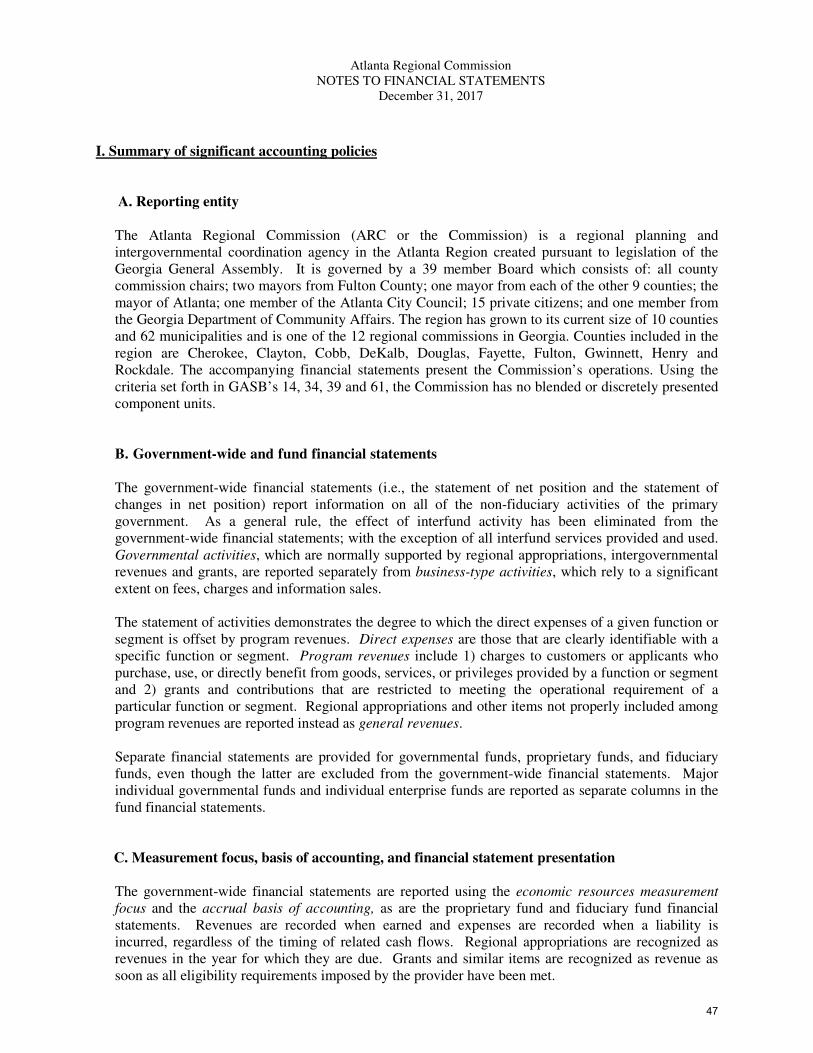
Atlanta Regional Commission
NOTES TO FINANCIAL STATEMENTS
December 31, 2017
I. Summary of significant accounting policies
A. Reporting entity
The Atlanta Regional Commission (ARC or the Commission) is a regional planning and
intergovernmental coordination agency in the Atlanta Region created pursuant to legislation of the
Georgia General Assembly. It is governed by a 39 member Board which consists of: all county
commission chairs; two mayors from Fulton County; one mayor from each of the other 9 counties; the
mayor of Atlanta; one member of the Atlanta City Council; 15 private citizens; and one member from
the Georgia Department of Community Affairs. The region has grown to its current size of 10 counties
and 62 municipalities and is one of the 12 regional commissions in Georgia. Counties included in the
region are Cherokee, Clayton, Cobb, DeKalb, Douglas, Fayette, Fulton, Gwinnett, Henry and
Rockdale. The accompanying financial statements present the Commission’s operations. Using the
criteria set forth in GASB’s 14, 34, 39 and 61, the Commission has no blended or discretely presented
component units.
B. Government-wide and fund financial statements
The government-wide financial statements (i.e., the statement of net position and the statement of
changes in net position) report information on all of the non-fiduciary activities of the primary
government. As a general rule, the effect of interfund activity has been eliminated from the
government-wide financial statements; with the exception of all interfund services provided and used.
Governmental activities, which are normally supported by regional appropriations, intergovernmental
revenues and grants, are reported separately from business-type activities, which rely to a significant
extent on fees, charges and information sales.
The statement of activities demonstrates the degree to which the direct expenses of a given function or
segment is offset by program revenues. Direct expenses are those that are clearly identifiable with a
specific function or segment. Program revenues include 1) charges to customers or applicants who
purchase, use, or directly benefit from goods, services, or privileges provided by a function or segment
and 2) grants and contributions that are restricted to meeting the operational requirement of a
particular function or segment. Regional appropriations and other items not properly included among
program revenues are reported instead as general revenues.
Separate financial statements are provided for governmental funds, proprietary funds, and fiduciary
funds, even though the latter are excluded from the government-wide financial statements. Major
individual governmental funds and individual enterprise funds are reported as separate columns in the
fund financial statements.
C. Measurement focus, basis of accounting, and financial statement presentation
The government-wide financial statements are reported using the economic resources measurement
focus and the accrual basis of accounting, as are the proprietary fund and fiduciary fund financial
statements. Revenues are recorded when earned and expenses are recorded when a liability is
incurred, regardless of the timing of related cash flows. Regional appropriations are recognized as
revenues in the year for which they are due. Grants and similar items are recognized as revenue as
soon as all eligibility requirements imposed by the provider have been met.
47
Atlanta Regional Commission
NOTES TO FINANCIAL STATEMENTS
December 31, 2017
Governmental fund financial statements are reported using the current financial resources
measurement focus and the modified accrual basis of accounting. Revenues are recognized as soon as
they are both measurable and available. Revenues are considered to be available when they are
collectible within the current period or soon enough thereafter to pay liabilities of the current period if
available. For this purpose, the government considers revenues to be available if they are collected
within 60 days of the end of the current period. Expenditure-driven grants are recognized when the
qualifying expenditures have been incurred and all other grant or contract requirements have been met.
Expenditures generally are recorded when a liability is incurred, as under accrual accounting.
However, expenditures related to compensated absences and claims and judgments are recorded only
when payment is due.
Dues from member counties, interest and grant revenue associated with the current fiscal period are all
considered susceptible to accrual and so have been recognized as revenues of the current fiscal period.
All business-type revenue items are considered to be measurable only when cash is received by the
Commission.
The ARC reports the following major governmental funds:
The general fund is the ARC’s primary operating fund. It accounts for all financial resources of the
Commission, except those required to be accounted for in another fund.
The transportation programs fund is used to account for Georgia Department of Transportation
Funded Unified (Transportation) Planning Work Program and Special Transportation Projects –
within the following elements of the Commission’s work program:
Transportation Access & Mobility
Mobility Services
Community Development
Research & Analytics
The Federal Railroad Administration, the Federal Transit Administration, the Federal Aviation
Administration, and the Georgia Department of Transportation provide grant funding.
The workforce development fund is used to account for the operations within the Workforce
Solutions element of the Commission’s work program. Funding is provided by the U.S.
Department of Labor, through the Governor’s Office of Workforce Development and other
miscellaneous sources.
The aging programs fund is used to account for the operations of several subelements within the
Aging & Health Resources element of the Commission’s work program. Funding is provided by
the U.S. Departments of Labor, Agriculture and Health and Human Services via the Georgia
Department of Human Resources (Ga.DHR), from Ga.DHR, in-kind services provided by local
service delivery agencies, and transfers from the Commission’s General Fund.
The natural resources fund is used to account for selected operations of the Natural Resources
subelement within the work program of Natural Resource Planning. Funding is provided by the
U.S. Environmental Protection Agency via the Environmental Protection Division of the Georgia
Department of Natural Resources, a contract with the Metropolitan North Georgia Planning
District, contracts with local governmental entities, and transfers from the Commission’s General
Fund.
48
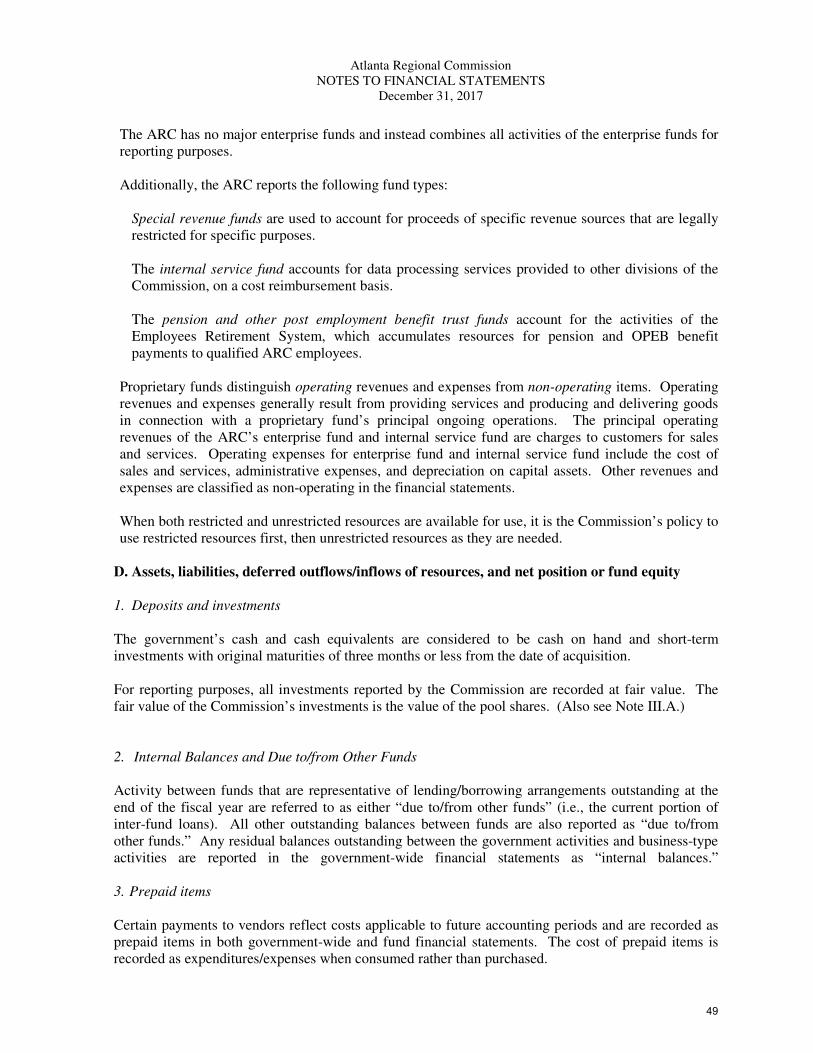
Atlanta Regional Commission
NOTES TO FINANCIAL STATEMENTS
December 31, 2017
The ARC has no major enterprise funds and instead combines all activities of the enterprise funds for
reporting purposes.
Additionally, the ARC reports the following fund types:
Special revenue funds are used to account for proceeds of specific revenue sources that are legally
restricted for specific purposes.
The internal service fund accounts for data processing services provided to other divisions of the
Commission, on a cost reimbursement basis.
The pension and other post employment benefit trust funds account for the activities of the
Employees Retirement System, which accumulates resources for pension and OPEB benefit
payments to qualified ARC employees.
Proprietary funds distinguish operating revenues and expenses from non-operating items. Operating
revenues and expenses generally result from providing services and producing and delivering goods
in connection with a proprietary fund’s principal ongoing operations. The principal operating
revenues of the ARC’s enterprise fund and internal service fund are charges to customers for sales
and services. Operating expenses for enterprise fund and internal service fund include the cost of
sales and services, administrative expenses, and depreciation on capital assets. Other revenues and
expenses are classified as non-operating in the financial statements.
When both restricted and unrestricted resources are available for use, it is the Commission’s policy to
use restricted resources first, then unrestricted resources as they are needed.
D. Assets, liabilities, deferred outflows/inflows of resources, and net position or fund equity
1. Deposits and investments
The government’s cash and cash equivalents are considered to be cash on hand and short-term
investments with original maturities of three months or less from the date of acquisition.
For reporting purposes, all investments reported by the Commission are recorded at fair value. The
fair value of the Commission’s investments is the value of the pool shares. (Also see Note III.A.)
2. Internal Balances and Due to/from Other Funds
Activity between funds that are representative of lending/borrowing arrangements outstanding at the
end of the fiscal year are referred to as either “due to/from other funds” (i.e., the current portion of
inter-fund loans). All other outstanding balances between funds are also reported as “due to/from
other funds.” Any residual balances outstanding between the government activities and business-type
activities are reported in the government-wide financial statements as “internal balances.”
3. Prepaid items
Certain payments to vendors reflect costs applicable to future accounting periods and are recorded as
prepaid items in both government-wide and fund financial statements. The cost of prepaid items is
recorded as expenditures/expenses when consumed rather than purchased.
49
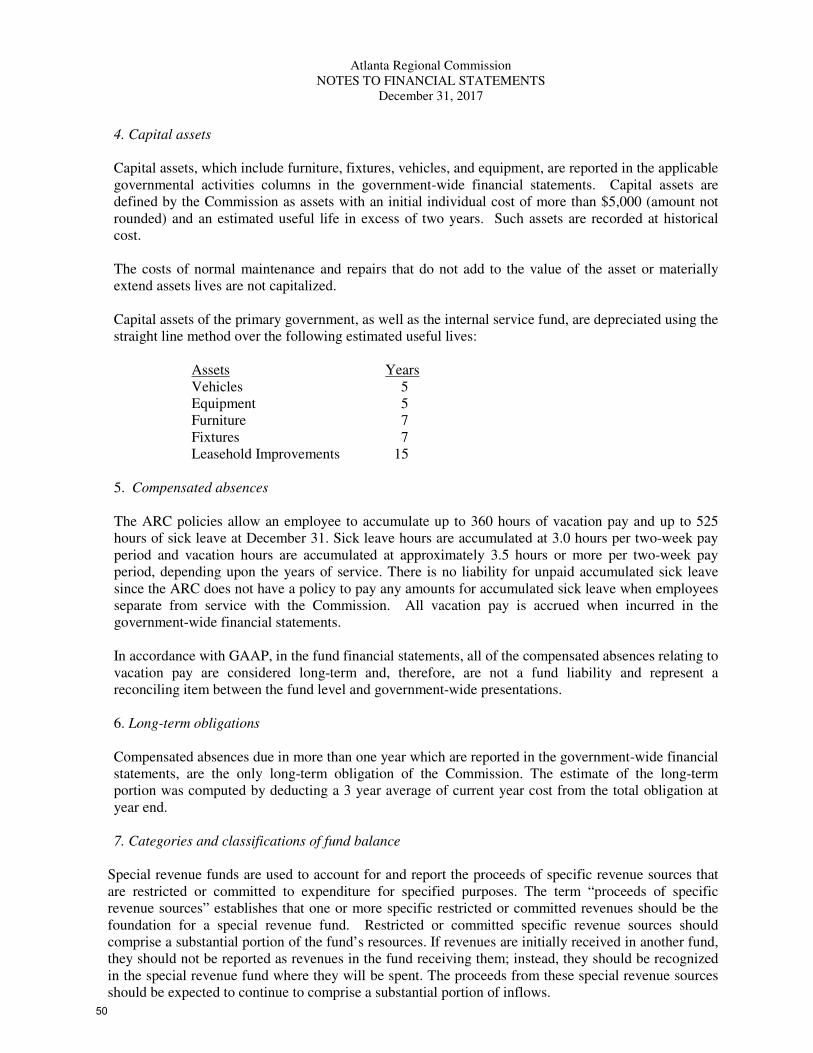
Atlanta Regional Commission
NOTES TO FINANCIAL STATEMENTS
December 31, 2017
4. Capital assets
Capital assets, which include furniture, fixtures, vehicles, and equipment, are reported in the applicable
governmental activities columns in the government-wide financial statements. Capital assets are
defined by the Commission as assets with an initial individual cost of more than $5,000 (amount not
rounded) and an estimated useful life in excess of two years. Such assets are recorded at historical
cost.
The costs of normal maintenance and repairs that do not add to the value of the asset or materially
extend assets lives are not capitalized.
Capital assets of the primary government, as well as the internal service fund, are depreciated using the
straight line method over the following estimated useful lives:
Assets Years
Vehicles 5
Equipment 5
Furniture 7
Fixtures 7
Leasehold Improvements 15
5. Compensated absences
The ARC policies allow an employee to accumulate up to 360 hours of vacation pay and up to 525
hours of sick leave at December 31. Sick leave hours are accumulated at 3.0 hours per two-week pay
period and vacation hours are accumulated at approximately 3.5 hours or more per two-week pay
period, depending upon the years of service. There is no liability for unpaid accumulated sick leave
since the ARC does not have a policy to pay any amounts for accumulated sick leave when employees
separate from service with the Commission. All vacation pay is accrued when incurred in the
government-wide financial statements.
In accordance with GAAP, in the fund financial statements, all of the compensated absences relating to
vacation pay are considered long-term and, therefore, are not a fund liability and represent a
reconciling item between the fund level and government-wide presentations.
6. Long-term obligations
Compensated absences due in more than one year which are reported in the government-wide financial
statements, are the only long-term obligation of the Commission. The estimate of the long-term
portion was computed by deducting a 3 year average of current year cost from the total obligation at
year end.
7. Categories and classifications of fund balance
Special revenue funds are used to account for and report the proceeds of specific revenue sources that
are restricted or committed to expenditure for specified purposes. The term “proceeds of specific
revenue sources” establishes that one or more specific restricted or committed revenues should be the
foundation for a special revenue fund. Restricted or committed specific revenue sources should
comprise a substantial portion of the fund’s resources. If revenues are initially received in another fund,
they should not be reported as revenues in the fund receiving them; instead, they should be recognized
in the special revenue fund where they will be spent. The proceeds from these special revenue sources
should be expected to continue to comprise a substantial portion of inflows.
50
Atlanta Regional Commission
NOTES TO FINANCIAL STATEMENTS
December 31, 2017
The following classifications are used by the Atlanta Regional Commission:
a. Nonspendable Fund Balance: the portion of a fund balance that includes amounts that cannot be
spent because they are either not in a spendable form (prepaid items, inventories of supplies) or be
legally or contractually required to be maintained intact.
b. Restricted Fund Balance: the portion of a fund balance that reflects constraints placed on the use of
resources other than nonspendable items that are either externally imposed by creditors (grantors,
contributors, or laws or regulations of other governments), or be imposed by law through
constitutional provisions or enabling legislation.
c. Committed Fund Balance: the portion of a fund balance that includes amounts that can only be
used for specific purposes pursuant to constraints imposed by formal action of the Board and
remain binding unless removed in the same manner.
d. Assigned Fund Balance: the portion of a fund balance that includes amounts that are constrained
by the Agency’s intent to be used for specific purposes but that are neither restricted nor
committed, as established by the Board.
e. Unassigned Fund Balance: that portion of a fund balance that includes amounts that do not fall into
one of the above categories. The General Fund is the only fund that should report a positive
unassigned balance.
The ARC uses restricted amounts to be spent first when both restricted and unrestricted fund balances
are available, unless there are legal documents/contracts that prohibit the use of restricted fund balance,
such as grant agreements that require a dollar match. Additionally, the ARC would then use committed,
assigned and lastly unassigned amounts from the unrestricted fund balance when expending funds.
The committed fund balance classification includes amounts that can be used only for the specific
purposes determined by a formal action of the agency’s highest level of decision-making authority. The
Board of Directors is the highest level of decision-making authority for the Atlanta Regional
Commission that can, by resolution, commit fund balance. Once adopted, the limitation imposed by the
resolution remains in place until a similar action (resolution) is taken to remove or revise the limitation.
The Executive Director or his designee may assign fund balance. The ARC Fund Balance Policy
outlining these procedures was adopted by the ARC Budget and Audit Committee on June 26, 2013.
8. Deferred outflows/inflows of resources
In addition to assets, the statement of net position will sometimes report a separate section for deferred
outflows of resources. This separate financial statement element, deferred outflows of resources,
represents a consumption of net position that applies to a future period(s) and so will not be recognized
as an outflow of resources (expense/expenditure) until then. The Commission only has one item that
qualifies for reporting in this category. It is the deferred outflows relating to Pension.
In addition to liabilities, the statement of net position will sometimes report a separate section for
deferred inflow of resources. This separate financial statement element, deferred inflows of resources,
represents an acquisition of net position that applies to a future period(s) and so will not be recognized
as an inflow of resources (revenue) until that time. The Commission has only one item, deferred
inflows relating to pension, that qualifies for reporting in this category.
51
Atlanta Regional Commission
NOTES TO FINANCIAL STATEMENTS
December 31, 2017
II. Stewardship, compliance, and accountability
A. Budgetary information
Budgets for the general, special revenue funds, and proprietary funds are adopted on a basis consistent
with generally accepted accounting principles. A proposed budget and work program for the ensuing
fiscal year is submitted by the ARC Director to the Commission’s Board during October of each year.
The budget is prepared by cost centers within each fund and is organized into a General Fund budget, a
budget for each special revenue fund and a combined total budget. The budget must be balanced. The
Board votes to adopt the budget for the ensuing fiscal year, subject to amendment or modification,
during its November-December meeting. The Director may, without explicit Board approval,
authorize budget revisions if: (1) the cumulative absolute value of transfers among object classes
within a fund does not exceed five percent of the total disbursements budget; (2) it causes no
significant modifications or additions to the work program; and (3) the combined total disbursement
budget is not increased. All other revisions are subject to the approval of the Board. In November or
December of each year, the Commission adopts the final amendment to its current year budget
incorporating all changes made during the year either administratively by the Director or by Board
action.
The legal level of control (the level at which expenditures may not legally exceed appropriations) for
each legally adopted grant award is at the object level.
The budget is organized on a “fund” basis. A fund is an accounting entity used to account for revenues
of like sources. The structure of funds at the ARC is as follows:
The Governmental Funds group accounts for funds received from other units of government or
otherwise used in financing the routine operations of the ARC. The two types of funds within this
category are:
1. General Fund. The General Fund is the basic operating fund of the ARC. It is used to account for
all financial resources not required to be accounted for in another category.
2. Special Revenue Funds. These funds account for proceeds from specific revenue sources other than
fiduciary functions and proprietary functions. For the ARC, grant funds are accounted for in
Special Revenue funds.
The Proprietary Funds group accounts for funds received in the course of the operation of self-
supporting functions that receive their revenues from providing goods or services to internal or
external customers. The two types of funds that make up this category are:
1. Enterprise Funds. Enterprise Funds account for operations carried out and financed like a business
operation, usually designated to be self-supporting through fees for services and generating
revenues from outside sources. Enterprise Funds are budgeted as separate cost centers but as
integral parts of the work programs.
2. Internal Service Fund (ISF). An ISF accounts for financing goods or services provided by an
organizational unit of the ARC to other units of the ARC, on a self-liquidating, fee-for-service
basis. The ARC has one ISF, for Information Systems use and support, funded in this manner.
The Fiduciary Funds are used to account for assets held in a trust capacity, not available for the ARC
expenditure, but held and used in accordance with the direction of the donor party. Due to their nature,
fiduciary funds do not require annual budget action.
52
Atlanta Regional Commission
NOTES TO FINANCIAL STATEMENTS
December 31, 2017
Many inter-fund transactions take place within the finances of the ARC, resulting in monies flowing
back and forth between funds. For example, the ARC matching shares for grants are paid from the
General Fund to Special Revenue Funds while Special Revenue Funds pay indirect charges to the
General Fund and fees for services to the Internal Service Fund.
B. Excess of expenditures over appropriations
For the year ended December 31, 2017:
General Fund exceeded budget in Supplies, Indirect costs and Other expenditures by $30,637, $13,597
and $420,906 respectively. Supplies and Other expenditures exceeded budget due to the move to new
building at 229 Peachtree Street in June. Indirect costs exceeded budget due adding new staff for a
new program in 2017.
Equipment costs exceeded budget by $102,941 in the Transportation Fund due to adding additional
computers, printer and digital storage. Subgrantee match exceeded budget by $385,195 increase due
to new grants executed.
In the Workforce fund, personnel, fringe and indirect costs exceeded budget by $285,179, $82,365 and
$140,382, respectively, due to addition of new staff members. Equipment, supplies and other
expenditures exceeded budget by $1,380, $46,031 and $41,494, due to the move to the new building.
Travel exceeded budget by $24,706 due to increased trips to career centers. Contract exceeded budget
by $2,593,452 because of additional funding allocated by the state in 2017. Indirect cost exceeded
budget by $140,382 due to an increase in cost pool rate.
Aging fund expenditures exceeded budget in contracts and subgrantee match by $2,618,598 and
$1,340,201 respectively. These expenditures exceeded budget due to extended and new grants added
during the year. Equipment, Supplies and Other expenditures exceeded budget by $29,023, $45,093
and $218,019 respectively, due to the move to the new building. Indirect cost expenditures exceed
budget by $267,683 due to an increase in cost pool rate.
Natural Resources exceeded its equipment budget by $10,922 due to the purchase of additional
computers. Travel exceeded budget by $4,240 due to increased effort in Water Supply and
Conservation. Contracts exceeded budget by $493,335 due to increased expenditures in Water Wars.
III. Detailed notes on all funds
A. Deposits and investments
At December 31, 2017, the Commission’s carrying amount of cash deposits and equivalents for all
funds, except for the Pension Trust Fund and OPEB Trust Fund was $6,219,745. The deposits and
investments of the Pension Trust Fund and OPEB Trust Fund are held separately from other
Commission funds.
The Commission’s investments other than for the Pension Trust Fund are made in the State of
Georgia’s Local Government Investment Pool (Georgia Fund 1). Georgia Fund 1 is regulated by the
oversight of the Georgia Office of the State Treasurer. The pool’s primary objectives are safety of
capital investment income, liquidity and diversification. The pool consists of U. S. Treasury
obligations, securities issued or guaranteed by the U. S. Government or any of its agencies or
instrumentalities, banker acceptances, overnight and term repurchase agreements with highly rated
counterparties, and collateralized bank accounts. Fair value of the investment in Georgia Fund 1 is
53
Atlanta Regional Commission
NOTES TO FINANCIAL STATEMENTS
December 31, 2017
equal to the value of the pool of shares. As of December 31, 2017, the Georgia Fund 1 had a weighted
average maturity of 9 days and a credit rating of AAAf by Standard & Poor’s. The Commission has
classified the Georgia Fund 1 funds as cash and cash equivalents: therefore, at December 31, 2017,
cash includes $2,878,406 in Georgia Fund 1.
Custodial credit risk – deposits and investments
Custodial credit risk for deposits is the risk that, in the event of the failure of a depository financial
institution, a government will not be able to recover deposits or will not be able to recover collateral
securities that are in the possession of an outside party. State statutes require all deposits and
investments (other than federal or state government instruments) to be collateralized by depository
insurance, obligations of the U.S. government, or bonds of public authorities, counties or
municipalities. As of December 31, 2017, the Commission was not exposed to custodial credit risk.
The amounts included in the Pension and OPEB Trust Funds as Investments are $62,119,884.
This is invested as follows:
Short-term Investments $471,735
Fixed Income Securities 15,540,658
Equity Securities 46,107,491
$62,119,884
As of December 31, 2017, the ARC’s Credit and Interest Rate Risk related to Fixed Income Securities
is as follows:
Investment Type
Cohen Steers Preferred Sec
Fair Value
$ 2,055,031
Duration(Years)
4.7
Weighted Average Quality
BB
Dodge & Cox Income Fund 4,246,189 4.2 BBB
Pimco Income Fund 4,668,498 2.4 A-
Diversified Income Fund 4,570,940 5.0 BAA+
$15,540,658
Credit risk
Georgia law and the ARC Policy authorizes the Commission to invest in obligations of the United
States (and of its agencies and instrumentalities); bonds or certificates of indebtedness of the State of
Georgia (and of its agencies and instrumentalities); repurchase agreements where the underlying
security is one of the foregoing, certificates of deposit; and in the State of Georgia's Local Government
Investment Pool (Georgia Fund 1). The Pension and OPEB Trust Funds are also authorized to invest
in securities consistent with ERISA prudence and diversity of risk standards, even though the Pension
Trust Fund and OPEB Trust Fund need not legally conform to such ERISA requirements.
Interest Rate risk
As a means of limiting its exposure to fair value losses arising from rising interest rates, the
Commission’s Investment Policy adopts the following asset mix to achieve the lowest level of risk for
the plan: Domestic securities between 20% and 55%, International equity securities between 5% and
20%, Domestic fixed income securities between 15% and 30% and Real return securities between 10%
and 50%.
The ARC categorizes its fair value measurements within the fair value hierarchy established by
generally accepted accounting principles. Fair value is the exchange price that would be received for
an asset (exit price) in the principal or most advantageous market for an asset in an orderly transaction 54
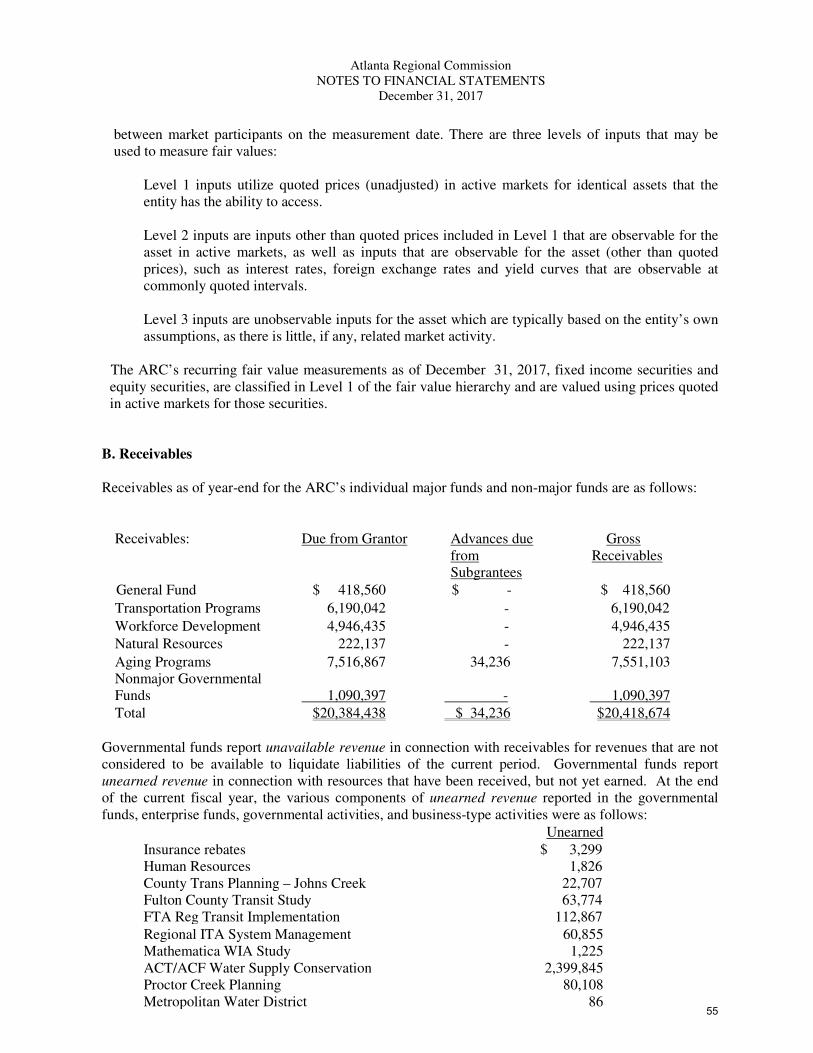
Atlanta Regional Commission
NOTES TO FINANCIAL STATEMENTS
December 31, 2017
between market participants on the measurement date. There are three levels of inputs that may be
used to measure fair values: Level 1 inputs utilize quoted prices (unadjusted) in active markets for identical assets that the
entity has the ability to access. Level 2 inputs are inputs other than quoted prices included in Level 1 that are observable for the
asset in active markets, as well as inputs that are observable for the asset (other than quoted
prices), such as interest rates, foreign exchange rates and yield curves that are observable at
commonly quoted intervals. Level 3 inputs are unobservable inputs for the asset which are typically based on the entity’s own
assumptions, as there is little, if any, related market activity.
The ARC’s recurring fair value measurements as of December 31, 2017, fixed income securities and
equity securities, are classified in Level 1 of the fair value hierarchy and are valued using prices quoted
in active markets for those securities.
B. Receivables
Receivables as of year-end for the ARC’s individual major funds and non-major funds are as follows:
Receivables: Due from Grantor Advances due
from
Subgrantees
Gross
Receivables
General Fund $ 418,560 $ - $ 418,560
Transportation Programs 6,190,042 - 6,190,042
Workforce Development 4,946,435 - 4,946,435
Natural Resources 222,137 - 222,137
Aging Programs
Nonmajor Governmental
Funds
7,516,867
1,090,397
34,236
-
7,551,103
1,090,397
Total $20,384,438 $ 34,236 $20,418,674
Governmental funds report unavailable revenue in connection with receivables for revenues that are not
considered to be available to liquidate liabilities of the current period. Governmental funds report
unearned revenue in connection with resources that have been received, but not yet earned. At the end
of the current fiscal year, the various components of unearned revenue reported in the governmental
funds, enterprise funds, governmental activities, and business-type activities were as follows:
Unearned
Insurance rebates
Human Resources
County Trans Planning – Johns Creek
Fulton County Transit Study
FTA Reg Transit Implementation
$ 3,299
1,826
22,707
63,774
112,867
Regional ITA System Management
Mathematica WIA Study
ACT/ACF Water Supply Conservation
Proctor Creek Planning
Metropolitan Water District
60,855
1,225
2,399,845
80,108
86 55
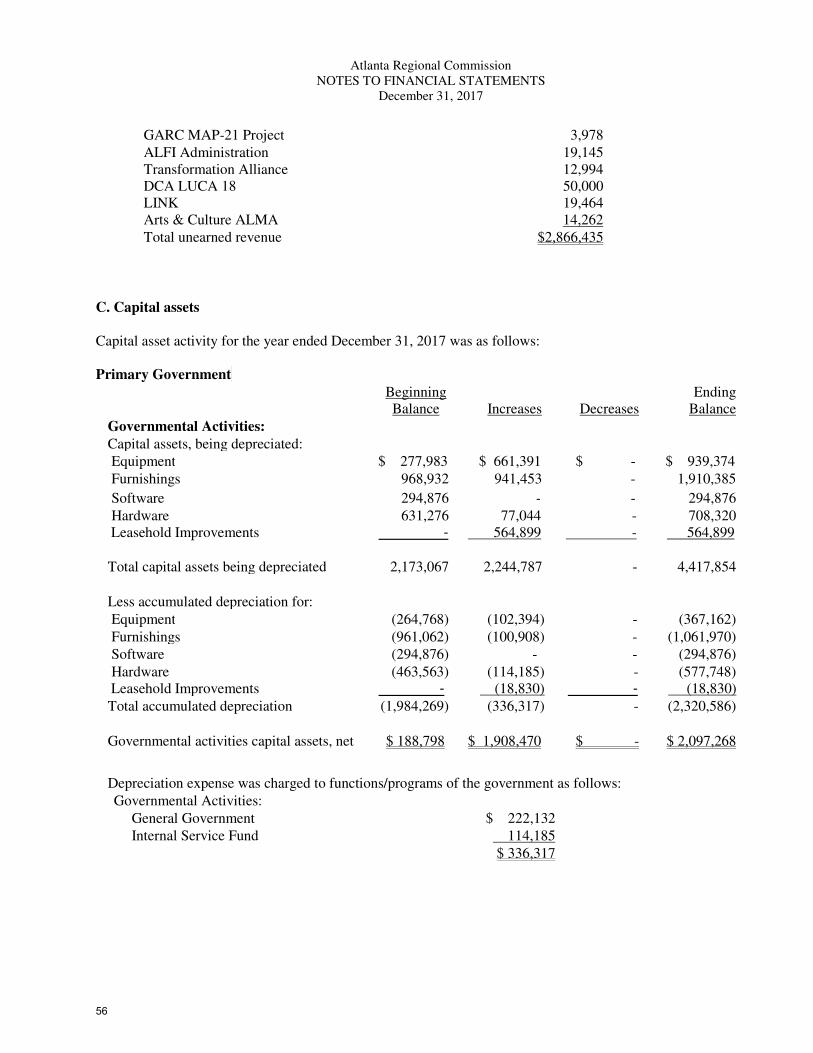
Atlanta Regional Commission
NOTES TO FINANCIAL STATEMENTS
December 31, 2017
GARC MAP-21 Project 3,978
ALFI Administration
Transformation Alliance
DCA LUCA 18
LINK
Arts & Culture ALMA
19,145
12,994
50,000
19,464
14,262
Total unearned revenue $2,866,435
C. Capital assets
Capital asset activity for the year ended December 31, 2017 was as follows:
Primary Government
Beginning
Balance
Increases
Decreases
Ending
Balance
Governmental Activities:
Capital assets, being depreciated:
Equipment $ 277,983 $ 661,391 $ - $ 939,374
Furnishings 968,932 941,453 - 1,910,385
Software 294,876 - - 294,876
Hardware
Leasehold Improvements
631,276
- 77,044
564,899
-
-
708,320
564,899
Total capital assets being depreciated 2,173,067 2,244,787 - 4,417,854
Less accumulated depreciation for:
Equipment (264,768) (102,394) - (367,162)
Furnishings (961,062) (100,908) - (1,061,970)
Software (294,876) - - (294,876)
Hardware
Leasehold Improvements
(463,563)
- (114,185)
(18,830)
-
- (577,748)
(18,830) Total accumulated depreciation (1,984,269) (336,317) - (2,320,586)
Governmental activities capital assets, net $ 188,798 $ 1,908,470 $ - $ 2,097,268
Depreciation expense was charged to functions/programs of the government as follows:
Governmental Activities:
General Government $ 222,132
Internal Service Fund 114,185
$ 336,317
56
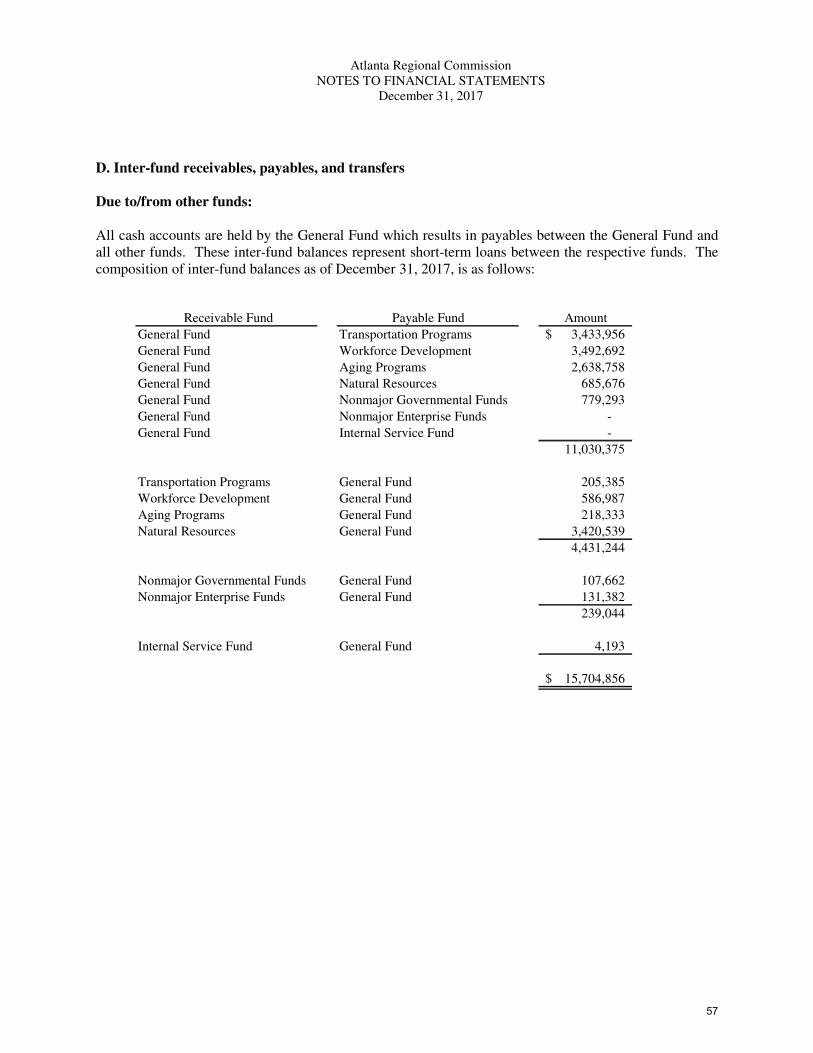
Atlanta Regional Commission
NOTES TO FINANCIAL STATEMENTS
December 31, 2017
D. Inter-fund receivables, payables, and transfers
Due to/from other funds:
All cash accounts are held by the General Fund which results in payables between the General Fund and
all other funds. These inter-fund balances represent short-term loans between the respective funds. The
composition of inter-fund balances as of December 31, 2017, is as follows:
Receivable Fund Payable Fund Amount
General Fund Transportation Programs 3,433,956$
General Fund Workforce Development 3,492,692
General Fund Aging Programs 2,638,758
General Fund Natural Resources 685,676
General Fund Nonmajor Governmental Funds 779,293
General Fund Nonmajor Enterprise Funds -
General Fund Internal Service Fund -
11,030,375
Transportation Programs General Fund 205,385
Workforce Development General Fund 586,987
Aging Programs General Fund 218,333
Natural Resources General Fund 3,420,539
4,431,244
Nonmajor Governmental Funds General Fund 107,662
Nonmajor Enterprise Funds General Fund 131,382
239,044
Internal Service Fund General Fund 4,193
15,704,856$
57
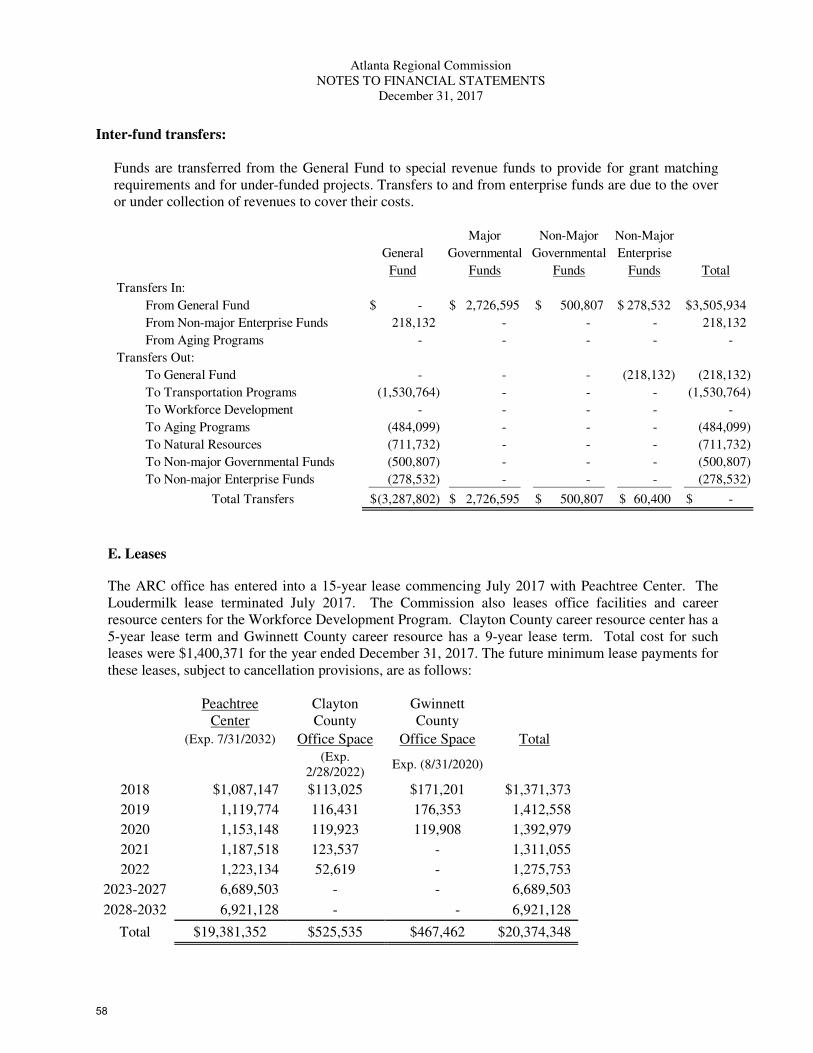
Atlanta Regional Commission
NOTES TO FINANCIAL STATEMENTS
December 31, 2017
Inter-fund transfers:
Funds are transferred from the General Fund to special revenue funds to provide for grant matching
requirements and for under-funded projects. Transfers to and from enterprise funds are due to the over
or under collection of revenues to cover their costs.
Major Non-Major Non-Major
General Governmental Governmental Enterprise
Fund Funds Funds Funds Total
Transfers In:
From General Fund -$ 2,726,595$ 500,807$ 278,532$ 3,505,934$
From Non-major Enterprise Funds 218,132 - - - 218,132
From Aging Programs - - - - -
Transfers Out:
To General Fund - - - (218,132) (218,132)
To Transportation Programs (1,530,764) - - - (1,530,764)
To Workforce Development - - - - -
To Aging Programs (484,099) - - - (484,099)
To Natural Resources (711,732) - - - (711,732)
To Non-major Governmental Funds (500,807) - - - (500,807)
To Non-major Enterprise Funds (278,532) - - - (278,532)
Total Transfers (3,287,802)$ 2,726,595$ 500,807$ 60,400$ -$
E. Leases
The ARC office has entered into a 15-year lease commencing July 2017 with Peachtree Center. The
Loudermilk lease terminated July 2017. The Commission also leases office facilities and career
resource centers for the Workforce Development Program. Clayton County career resource center has a
5-year lease term and Gwinnett County career resource has a 9-year lease term. Total cost for such
leases were $1,400,371 for the year ended December 31, 2017. The future minimum lease payments for
these leases, subject to cancellation provisions, are as follows:
Peachtree
Center
Clayton
County
Gwinnett
County
(Exp. 7/31/2032) Office Space Office Space Total
(Exp.
2/28/2022) Exp. (8/31/2020)
2018 $1,087,147 $113,025 $171,201 $1,371,373
2019 1,119,774 116,431 176,353 1,412,558
2020 1,153,148 119,923 119,908 1,392,979
2021 1,187,518 123,537 - 1,311,055
2022 1,223,134 52,619 - 1,275,753
2023-2027 6,689,503 - - 6,689,503
2028-2032 6,921,128 - - 6,921,128
Total $19,381,352 $525,535 $467,462 $20,374,348
58
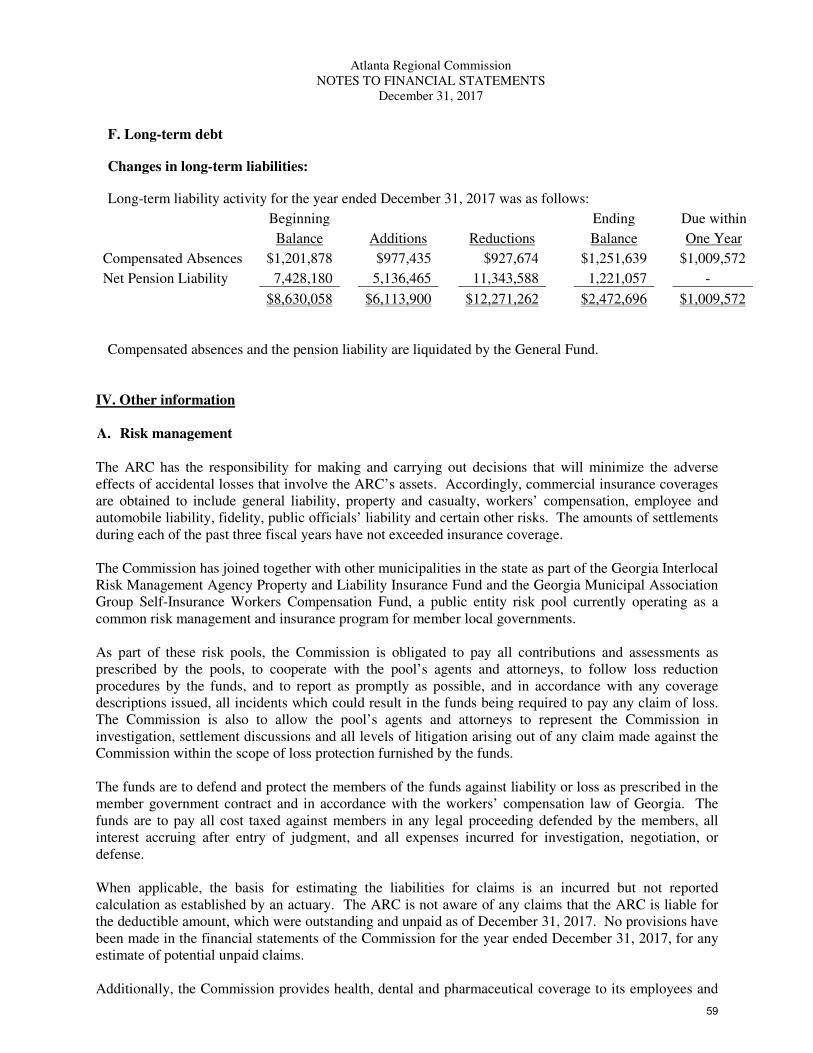
Atlanta Regional Commission
NOTES TO FINANCIAL STATEMENTS
December 31, 2017
F. Long-term debt
Changes in long-term liabilities:
Long-term liability activity for the year ended December 31, 2017 was as follows:
Beginning Ending Due within
Balance Additions Reductions Balance One Year
Compensated Absences $1,201,878 $977,435 $927,674 $1,251,639 $1,009,572
Net Pension Liability 7,428,180 5,136,465 11,343,588 1,221,057 -
$8,630,058 $6,113,900 $12,271,262 $2,472,696 $1,009,572
Compensated absences and the pension liability are liquidated by the General Fund.
IV. Other information
A. Risk management
The ARC has the responsibility for making and carrying out decisions that will minimize the adverse
effects of accidental losses that involve the ARC’s assets. Accordingly, commercial insurance coverages
are obtained to include general liability, property and casualty, workers’ compensation, employee and
automobile liability, fidelity, public officials’ liability and certain other risks. The amounts of settlements
during each of the past three fiscal years have not exceeded insurance coverage.
The Commission has joined together with other municipalities in the state as part of the Georgia Interlocal
Risk Management Agency Property and Liability Insurance Fund and the Georgia Municipal Association
Group Self-Insurance Workers Compensation Fund, a public entity risk pool currently operating as a
common risk management and insurance program for member local governments.
As part of these risk pools, the Commission is obligated to pay all contributions and assessments as
prescribed by the pools, to cooperate with the pool’s agents and attorneys, to follow loss reduction
procedures by the funds, and to report as promptly as possible, and in accordance with any coverage
descriptions issued, all incidents which could result in the funds being required to pay any claim of loss.
The Commission is also to allow the pool’s agents and attorneys to represent the Commission in
investigation, settlement discussions and all levels of litigation arising out of any claim made against the
Commission within the scope of loss protection furnished by the funds.
The funds are to defend and protect the members of the funds against liability or loss as prescribed in the
member government contract and in accordance with the workers’ compensation law of Georgia. The
funds are to pay all cost taxed against members in any legal proceeding defended by the members, all
interest accruing after entry of judgment, and all expenses incurred for investigation, negotiation, or
defense.
When applicable, the basis for estimating the liabilities for claims is an incurred but not reported
calculation as established by an actuary. The ARC is not aware of any claims that the ARC is liable for
the deductible amount, which were outstanding and unpaid as of December 31, 2017. No provisions have
been made in the financial statements of the Commission for the year ended December 31, 2017, for any
estimate of potential unpaid claims.
Additionally, the Commission provides health, dental and pharmaceutical coverage to its employees and
59
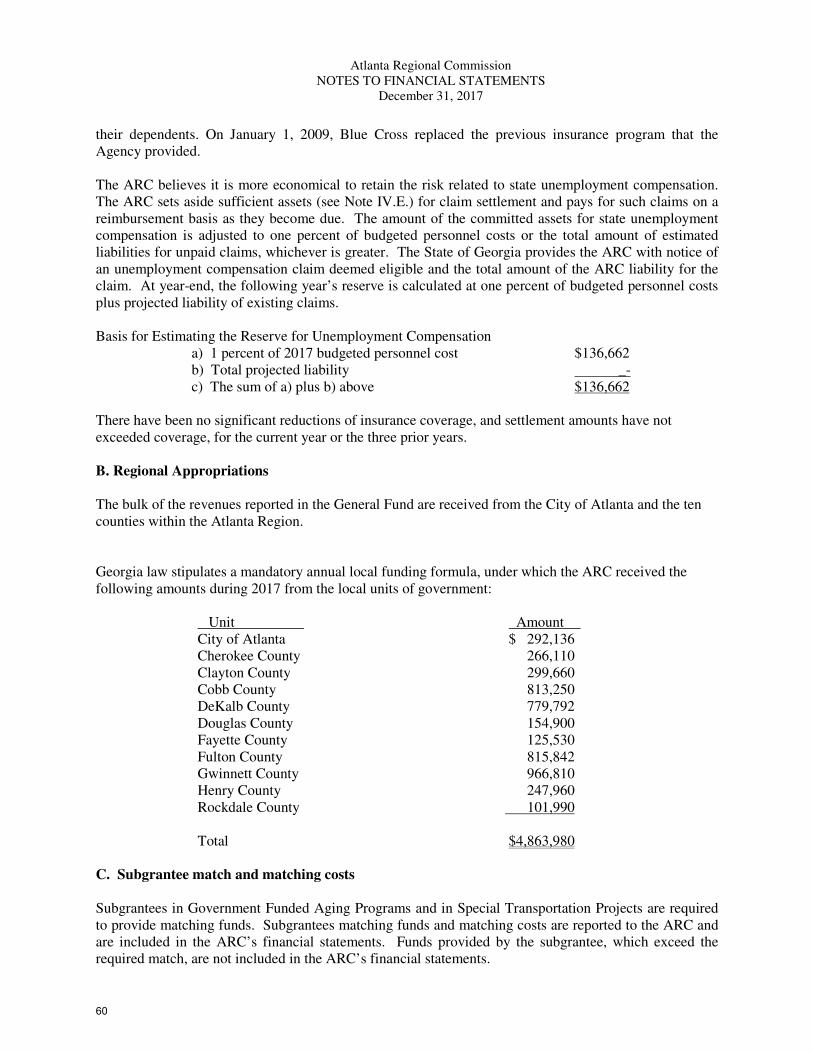
Atlanta Regional Commission
NOTES TO FINANCIAL STATEMENTS
December 31, 2017
their dependents. On January 1, 2009, Blue Cross replaced the previous insurance program that the
Agency provided.
The ARC believes it is more economical to retain the risk related to state unemployment compensation.
The ARC sets aside sufficient assets (see Note IV.E.) for claim settlement and pays for such claims on a
reimbursement basis as they become due. The amount of the committed assets for state unemployment
compensation is adjusted to one percent of budgeted personnel costs or the total amount of estimated
liabilities for unpaid claims, whichever is greater. The State of Georgia provides the ARC with notice of
an unemployment compensation claim deemed eligible and the total amount of the ARC liability for the
claim. At year-end, the following year’s reserve is calculated at one percent of budgeted personnel costs
plus projected liability of existing claims.
Basis for Estimating the Reserve for Unemployment Compensation
a) 1 percent of 2017 budgeted personnel cost $136,662
b) Total projected liability _-
c) The sum of a) plus b) above $136,662
There have been no significant reductions of insurance coverage, and settlement amounts have not
exceeded coverage, for the current year or the three prior years.
B. Regional Appropriations
The bulk of the revenues reported in the General Fund are received from the City of Atlanta and the ten
counties within the Atlanta Region.
Georgia law stipulates a mandatory annual local funding formula, under which the ARC received the
following amounts during 2017 from the local units of government:
Unit Amount
City of Atlanta $ 292,136
Cherokee County 266,110
Clayton County 299,660
Cobb County 813,250
DeKalb County 779,792
Douglas County 154,900
Fayette County 125,530
Fulton County 815,842
Gwinnett County 966,810
Henry County 247,960
Rockdale County 101,990
Total $4,863,980
C. Subgrantee match and matching costs
Subgrantees in Government Funded Aging Programs and in Special Transportation Projects are required
to provide matching funds. Subgrantees matching funds and matching costs are reported to the ARC and
are included in the ARC’s financial statements. Funds provided by the subgrantee, which exceed the
required match, are not included in the ARC’s financial statements.
60
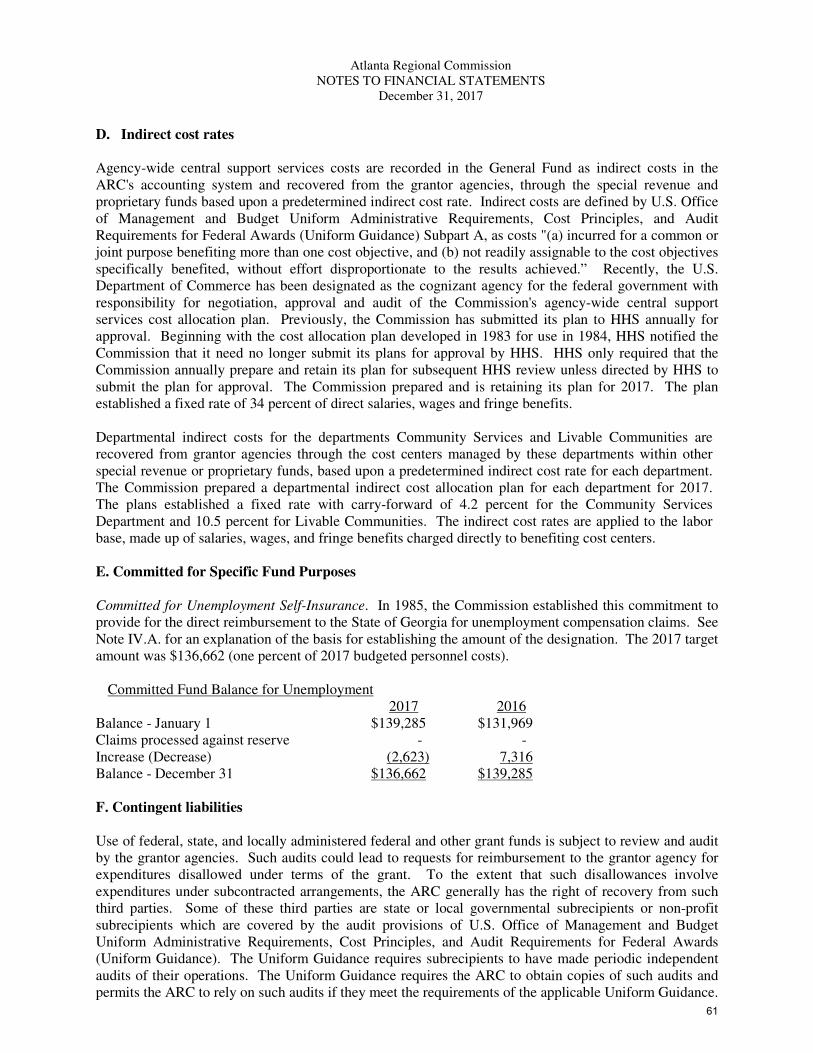
Atlanta Regional Commission
NOTES TO FINANCIAL STATEMENTS
December 31, 2017
D. Indirect cost rates
Agency-wide central support services costs are recorded in the General Fund as indirect costs in the
ARC's accounting system and recovered from the grantor agencies, through the special revenue and
proprietary funds based upon a predetermined indirect cost rate. Indirect costs are defined by U.S. Office
of Management and Budget Uniform Administrative Requirements, Cost Principles, and Audit
Requirements for Federal Awards (Uniform Guidance) Subpart A, as costs "(a) incurred for a common or
joint purpose benefiting more than one cost objective, and (b) not readily assignable to the cost objectives
specifically benefited, without effort disproportionate to the results achieved.” Recently, the U.S.
Department of Commerce has been designated as the cognizant agency for the federal government with
responsibility for negotiation, approval and audit of the Commission's agency-wide central support
services cost allocation plan. Previously, the Commission has submitted its plan to HHS annually for
approval. Beginning with the cost allocation plan developed in 1983 for use in 1984, HHS notified the
Commission that it need no longer submit its plans for approval by HHS. HHS only required that the
Commission annually prepare and retain its plan for subsequent HHS review unless directed by HHS to
submit the plan for approval. The Commission prepared and is retaining its plan for 2017. The plan
established a fixed rate of 34 percent of direct salaries, wages and fringe benefits.
Departmental indirect costs for the departments Community Services and Livable Communities are
recovered from grantor agencies through the cost centers managed by these departments within other
special revenue or proprietary funds, based upon a predetermined indirect cost rate for each department.
The Commission prepared a departmental indirect cost allocation plan for each department for 2017.
The plans established a fixed rate with carry-forward of 4.2 percent for the Community Services
Department and 10.5 percent for Livable Communities. The indirect cost rates are applied to the labor
base, made up of salaries, wages, and fringe benefits charged directly to benefiting cost centers.
E. Committed for Specific Fund Purposes
Committed for Unemployment Self-Insurance. In 1985, the Commission established this commitment to
provide for the direct reimbursement to the State of Georgia for unemployment compensation claims. See
Note IV.A. for an explanation of the basis for establishing the amount of the designation. The 2017 target
amount was $136,662 (one percent of 2017 budgeted personnel costs).
Committed Fund Balance for Unemployment
2017 2016
Balance - January 1 $139,285 $131,969
Claims processed against reserve - -
Increase (Decrease) (2,623) 7,316
Balance - December 31 $136,662 $139,285
F. Contingent liabilities
Use of federal, state, and locally administered federal and other grant funds is subject to review and audit
by the grantor agencies. Such audits could lead to requests for reimbursement to the grantor agency for
expenditures disallowed under terms of the grant. To the extent that such disallowances involve
expenditures under subcontracted arrangements, the ARC generally has the right of recovery from such
third parties. Some of these third parties are state or local governmental subrecipients or non-profit
subrecipients which are covered by the audit provisions of U.S. Office of Management and Budget
Uniform Administrative Requirements, Cost Principles, and Audit Requirements for Federal Awards
(Uniform Guidance). The Uniform Guidance requires subrecipients to have made periodic independent
audits of their operations. The Uniform Guidance requires the ARC to obtain copies of such audits and
permits the ARC to rely on such audits if they meet the requirements of the applicable Uniform Guidance.
61
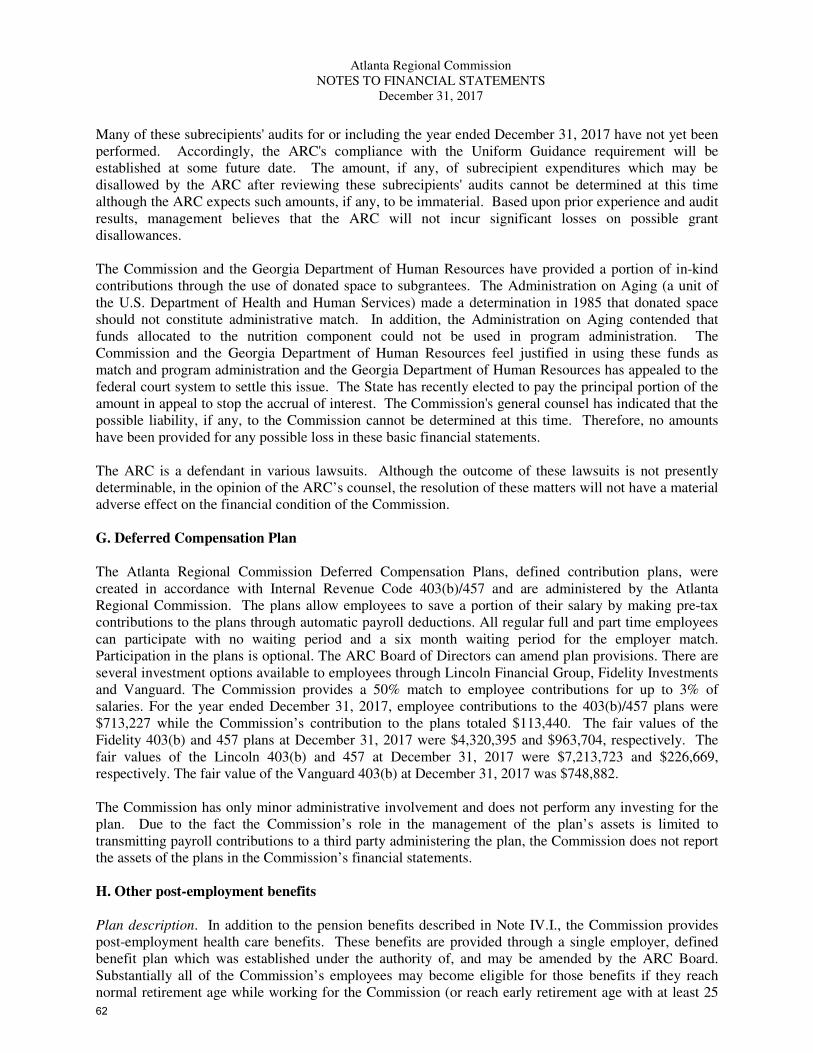
Atlanta Regional Commission
NOTES TO FINANCIAL STATEMENTS
December 31, 2017
Many of these subrecipients' audits for or including the year ended December 31, 2017 have not yet been
performed. Accordingly, the ARC's compliance with the Uniform Guidance requirement will be
established at some future date. The amount, if any, of subrecipient expenditures which may be
disallowed by the ARC after reviewing these subrecipients' audits cannot be determined at this time
although the ARC expects such amounts, if any, to be immaterial. Based upon prior experience and audit
results, management believes that the ARC will not incur significant losses on possible grant
disallowances.
The Commission and the Georgia Department of Human Resources have provided a portion of in-kind
contributions through the use of donated space to subgrantees. The Administration on Aging (a unit of
the U.S. Department of Health and Human Services) made a determination in 1985 that donated space
should not constitute administrative match. In addition, the Administration on Aging contended that
funds allocated to the nutrition component could not be used in program administration. The
Commission and the Georgia Department of Human Resources feel justified in using these funds as
match and program administration and the Georgia Department of Human Resources has appealed to the
federal court system to settle this issue. The State has recently elected to pay the principal portion of the
amount in appeal to stop the accrual of interest. The Commission's general counsel has indicated that the
possible liability, if any, to the Commission cannot be determined at this time. Therefore, no amounts
have been provided for any possible loss in these basic financial statements.
The ARC is a defendant in various lawsuits. Although the outcome of these lawsuits is not presently
determinable, in the opinion of the ARC’s counsel, the resolution of these matters will not have a material
adverse effect on the financial condition of the Commission.
G. Deferred Compensation Plan
The Atlanta Regional Commission Deferred Compensation Plans, defined contribution plans, were
created in accordance with Internal Revenue Code 403(b)/457 and are administered by the Atlanta
Regional Commission. The plans allow employees to save a portion of their salary by making pre-tax
contributions to the plans through automatic payroll deductions. All regular full and part time employees
can participate with no waiting period and a six month waiting period for the employer match.
Participation in the plans is optional. The ARC Board of Directors can amend plan provisions. There are
several investment options available to employees through Lincoln Financial Group, Fidelity Investments
and Vanguard. The Commission provides a 50% match to employee contributions for up to 3% of
salaries. For the year ended December 31, 2017, employee contributions to the 403(b)/457 plans were
$713,227 while the Commission’s contribution to the plans totaled $113,440. The fair values of the
Fidelity 403(b) and 457 plans at December 31, 2017 were $4,320,395 and $963,704, respectively. The
fair values of the Lincoln 403(b) and 457 at December 31, 2017 were $7,213,723 and $226,669,
respectively. The fair value of the Vanguard 403(b) at December 31, 2017 was $748,882.
The Commission has only minor administrative involvement and does not perform any investing for the
plan. Due to the fact the Commission’s role in the management of the plan’s assets is limited to
transmitting payroll contributions to a third party administering the plan, the Commission does not report
the assets of the plans in the Commission’s financial statements.
H. Other post-employment benefits
Plan description. In addition to the pension benefits described in Note IV.I., the Commission provides
post-employment health care benefits. These benefits are provided through a single employer, defined
benefit plan which was established under the authority of, and may be amended by the ARC Board.
Substantially all of the Commission’s employees may become eligible for those benefits if they reach
normal retirement age while working for the Commission (or reach early retirement age with at least 25
62
Atlanta Regional Commission
NOTES TO FINANCIAL STATEMENTS
December 31, 2017
years of service). Those and similar benefits for active employees are to be provided through an
insurance company whose premiums will be based on the benefits paid during the year.
Effective January 1, 1988, the Commission began pre-funding those post-employment benefits by
accruing the actuarially determined estimated cost of such benefits in the OPEB Trust Fund to the extent
permitted under the Internal Revenue Code. The insurance premiums for eligible retirees will be paid by
the OPEB Trust Fund. The most recent actuarial valuation of these benefits was as of January 1, 2017.
Significant actuarial assumptions used in the valuation include (a) a rate of return on the investment of
present and future assets of 7 percent per year, compounded annually, (b) projected salary increases of
3.00 percent per year, compounded annually, and (c) the monthly health and dental insurance premium
paid by the plan on behalf of single retirees under age 65 is assumed to be $570.72 per month and the
premium paid on behalf of married retirees under age 65 is assumed to be either $992.75 per month (for
current retirees and those future retirees who have earned at least 20 years of service as of January 1,
2004), $781.74 per month (for those future retirees who have earned at least 12 years of service as of
January 1, 2004), or $570.72 otherwise.
At age 65 and older, the premiums are assumed to be $304.32 for single retirees and $602.94 for married
retires. All premiums are assumed to increase at the rate of 5.00% per year after 2017.
The Plan issues a stand-alone financial report. This report can be obtained from the Atlanta Regional
Commission at the following address:
Atlanta Regional Commission
Financial Services Division
229 Peachtree Street, NE
Suite 100
Atlanta, GA 30303
Funding Policy. The policy regarding the amount of contributions to the plan is established, and may be
amended, by the ARC Board. Contributions for the year ended December 31, 2017 were based upon
actuarial calculations made from the January 1, 2016 census data.
Annual OPEB Cost. The contribution for the twelve-month period ended December 31, 2017 was $0, in
accordance with actuarially determined contribution requirements determined through an actuarial
valuation performed at January 1, 2016. The annual OPEB cost, the percentage of annual OPEB cost
contributed to the plan, and the net OPEB obligation for 2017 and the two preceding years were as
follows:
Percentage of
Annual Annual OPEB Cost Net OPEB
Fiscal Year Ended OPEB Cost Contributed Obligation(Asset)
12/31/2015 $108,989 100% $0
12/31/2016 $0 100% $0
12/31/2017 $0 100% $0
Funding status and progress. Actuarial valuations of an ongoing plan involve estimates of the value of
reported amounts and assumptions about the probability of occurrence of events far into the future.
Examples include assumptions about future employment, mortality, and the healthcare cost trend.
Amounts determined regarding the funded status of the plan and the annual required contributions of the
employer are subject to continual revision as actual results are compared with past expectations and new
estimates are made about the future.
Actuarial Methods and Assumptions. Projections of benefits for financial reporting purposes are based on
63
Atlanta Regional Commission
NOTES TO FINANCIAL STATEMENTS
December 31, 2017
the substantive plan (the plan as understood by the employer and plan members) and include the types of
benefits provided at the time of each valuation and the historical pattern of sharing of benefit costs
between the employer and plan members to that point. The actuarial methods and assumptions used
include techniques that are designed to reduce the effects of short-term volatility in actuarial accrued
liabilities and the actuarial value of assets, consistent with the long-term perspective of the calculations.
The “Aggregate Cost Method” was used to determine the recommended contribution for the 401(h)
medical accounts. Under the "aggregate cost method", there is no unfunded actuarial accrued liability
determined and amortized. As a result, the information about the funded status and funding progress
presented below is done using the entry age actuarial cost method, which is intended to serve as a
surrogate for the funding progress information of the plan.
Funding status and progress. The funded status of the plan as of January 1, 2017 was as follows:
Actuarial accrued liability (AAL) $5,412,822
Actuarial Value of plan assets 9,225,050
Unfunded (Overfunded) actuarial accrued liability (UAAL) $(3,812,228)
Funded ratio (actuarial value of plan assets / AAL) 170.4%
Covered payroll (active plan members) $11,970,540
UAAL as a percentage of covered payroll (31.9%)
The schedule of funding progress, presented as required supplementary information following the notes to
the financial statements, presents multiyear trend information that shows whether the actuarial value of
plan assets is increasing or decreasing over time relative to the actuarial accrued liabilities for benefits.
Actuarial Assumptions.
Date of Last Actuarial Valuation January 1, 2017
(a) Actuarial Cost Method Aggregate
(b) Rate of Return on Investments 7.0%
(c) Projected Salary Increase 3.0%
(d) Post-employment Benefit Increase n/a
(e) Inflation Rate 2.5% Included in
projected salary increase
(f) Healthcare Trend Rate 5.0%
(g) Amortization Method of Unfunded Actuarial Accrued Liability level dollar
(h) Remaining Amortization Period 11 years
(i) Asset Valuation Method Two year average market
value
As of January 1, 2017, the number of plan participants included 46 retirees receiving benefits and 166
active employees.
I. Employee retirement systems and pension plans
Defined benefit plan
Plan description. The ARC maintains, Atlanta Regional Commission Plan, a single employer,
contributory, defined benefit retirement plan (the Plan) covering substantially all employees. Effective
January 1, 2015, the Plan implemented the provisions of Governmental Accounting Standards Board
(GASB) Statement No. 67, Financial Reporting for Pension Plans – an amendment of GASB Statement
64
Atlanta Regional Commission
NOTES TO FINANCIAL STATEMENTS
December 31, 2017
No. 25, which significantly changed the disclosures required related to the Plan. The Plan provides
retirement, death and disability benefits to plan members and beneficiaries. U.S. Bank administers the
Plan as trustee. Control over the operation and administration of the Plan, except investment decisions, is
vested in the trustee along with custody of certain Plan assets. An independent third party investment
advisor makes investment recommendations which must be approved by the Plans’ board. The Plan
provides that the ARC has no liability with respect to payments or benefits or otherwise under the Plan
except to pay over to the trustee such actuarially determined contributions as are required under Georgia
Code §47-20-10 and to provide the benefits thereunder. If terminated, the Plan provides that if there are
funds remaining after the satisfaction of all liabilities such funds shall not revert to the ARC but shall be
allocated to the employees.
The Plan was formed under the authority of the ARC board of directors and the board has the authority to
amend and/or terminate the Plan at any time. In 1998, the Plan’s fiscal year-end was changed from June
30 to December 31 to coincide with the fiscal year-end of the ARC.
For the plan year ended December 31, 2017, total plan year payroll for the employees covered by the Plan
was $11,970,540, while total plan year payroll for all employees was $15,427,130.
As of January 1, 2017, Plan membership consisted of:
(a) Retirees and beneficiaries receiving benefits 46
(b) Terminated employees entitled to deferred benefits but not yet receiving them 94
(c) Active plan participants 71
(d) Active employees - partially vested 0
(e) Active employees - non-vested 95
(f) Eligible for medical benefits only 10
Total Participants 316
This compares with the number of plan participants at January 1, 2016, as follows:
(a) Retirees and beneficiaries receiving benefits 42
(b) Terminated employees entitled to deferred benefits but not yet receiving them 85
(c) Active plan participants 77
(d) Active employees - partially vested 0
(e) Active employees - non-vested 105
(f) Eligible for medical benefits only 10
Total Participants 319
Benefits and funding policy. The ARC provides retirement benefits as well as death and disability
benefits to plan members. The Plan provides that normal retirement is at the earlier of (a) attainment of
age 55 and the completion of 25 years of service (only if hired prior to January 1, 2008) or (b) attainment
of age 62 with at least 30 years of credited service or (c) attainment of age 65. At that time, the employee
is entitled to a lifetime pension equal to 2.5 percent of his “high-three” year average compensation for
each year of service. In addition, the Plan provides that no participant will receive less than what he
would have received under the Plan in effect on June 30, 1987. After retirement, the lifetime pension is
indexed to reflect changes in the Consumer Price Index. An employee vests at the rate of 10 percent per
year for the first four years. In each subsequent year, the employee vests at the rate of 20 percent per year
to a maximum of 100 percent after seven years. The vesting schedule is extended to a seven-year cliff
schedule for participants hired after December 31, 2007.
65
Atlanta Regional Commission
NOTES TO FINANCIAL STATEMENTS
December 31, 2017
Contributions. Entry age normal actuarial cost method is used to establish the actuarial position of the
plan and to determine an appropriate level of contributions for all benefits except 401(h) medical
accounts. Employer contributions represented 15.76% of the current year covered payroll. Employees are
required to contribute 5% of gross wages. Total employer and employee contributions to the general
pension plan for the fiscal year ended December 31, 2017 were $1,886,796 and $687,675 respectively.
Net Pension Liability. The ARC’s total pension liability was determined by an actuarial valuation as of
January 1, 2017 and was rolled forward to the measurement date of December 31, 2017.
Actuarial Assumptions.
Projected Salary Increase: 3.00% per annum
Rate of Return on Investments: 7.0%
Mortality rates were based on sex-distinct rates set forth in the RP-2000 Mortality Table for annuitants,
projected to 2007 by Scale AA, as published by the Internal Revenue Service (IRS) for purposes of
Internal Revenue Code (IRC) section 430; future generational improvements in mortality have not been
reflected.
The long-term expected rate of return on pension plan investments was determined using a long normal
distribution analysis in which best-estimate ranges of expected future real rates of return (expected
returns, net of pension plan investment expense and inflation) are developed for each major asset class.
These ranges are combined to produce the long-term expected rate of return by weighting the expected
future real rates of return by the target asset allocation percentage and by adding expected inflation. The
target allocation and best estimates of arithmetic real rates of return for each major asset class are
summarized in the following table:
Investment Category Target Allocation Expected Long-Term Real Return
U.S. Large Cap Equity 35.00% 5.25% per annum
International Equity 10.00% 5.50% per annum
Absolute Return Investments 35.00% 4.00% per annum
U.S. Core & Fixed Income Investments 20.00% 2.88% per annum
Total 100.00% 4.36% per annum
Discount rate: The discount rate used to measure the total pension liability was 6.61% per annum (2.25%
per annum is attributable to long-term inflation); this rate was used to discount all future benefit
payments. The projection of cash flows used to determine the discount rate assumed that plan member
contributions will be made at the current contribution rate of 5% and the Employer contributions will be
made at rates equal to the difference between actuarially determined contribution rates and the member
rate. Projected future benefit payments for all current plan members were projected through the year
2107. Based on those assumptions, the pension plan’s fiduciary net position was projected to be available
to make all projected future benefit payments of current active and inactive employees. Therefore, the
long-term expected rate of return on pension plan investments was applied to all periods of projected
benefit payments to determine the total pension liability.
66
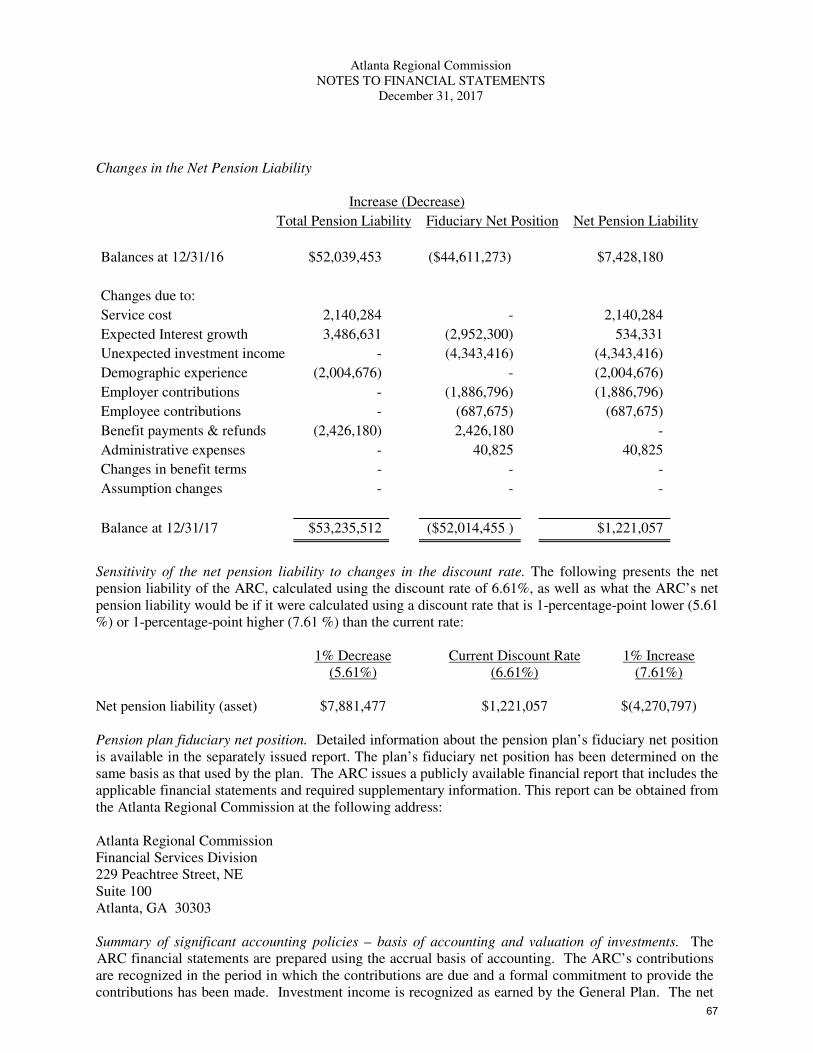
Atlanta Regional Commission
NOTES TO FINANCIAL STATEMENTS
December 31, 2017
Changes in the Net Pension Liability
Increase (Decrease)
Total Pension Liability Fiduciary Net Position Net Pension Liability
Balances at 12/31/16 $52,039,453 ($44,611,273) $7,428,180
Changes due to:
Service cost 2,140,284 - 2,140,284
Expected Interest growth 3,486,631 (2,952,300) 534,331
Unexpected investment income - (4,343,416) (4,343,416)
Demographic experience (2,004,676) - (2,004,676)
Employer contributions - (1,886,796) (1,886,796)
Employee contributions - (687,675) (687,675)
Benefit payments & refunds (2,426,180) 2,426,180 -
Administrative expenses - 40,825 40,825
Changes in benefit terms - - -
Assumption changes - - -
Balance at 12/31/17 $53,235,512 ($52,014,455 ) $1,221,057
Sensitivity of the net pension liability to changes in the discount rate. The following presents the net
pension liability of the ARC, calculated using the discount rate of 6.61%, as well as what the ARC’s net
pension liability would be if it were calculated using a discount rate that is 1-percentage-point lower (5.61
%) or 1-percentage-point higher (7.61 %) than the current rate:
1% Decrease
(5.61%)
Current Discount Rate
(6.61%)
1% Increase
(7.61%)
Net pension liability (asset) $7,881,477 $1,221,057 $(4,270,797)
Pension plan fiduciary net position. Detailed information about the pension plan’s fiduciary net position
is available in the separately issued report. The plan’s fiduciary net position has been determined on the
same basis as that used by the plan. The ARC issues a publicly available financial report that includes the
applicable financial statements and required supplementary information. This report can be obtained from
the Atlanta Regional Commission at the following address:
Atlanta Regional Commission
Financial Services Division
229 Peachtree Street, NE
Suite 100
Atlanta, GA 30303
Summary of significant accounting policies – basis of accounting and valuation of investments. The
ARC financial statements are prepared using the accrual basis of accounting. The ARC’s contributions
are recognized in the period in which the contributions are due and a formal commitment to provide the
contributions has been made. Investment income is recognized as earned by the General Plan. The net
67
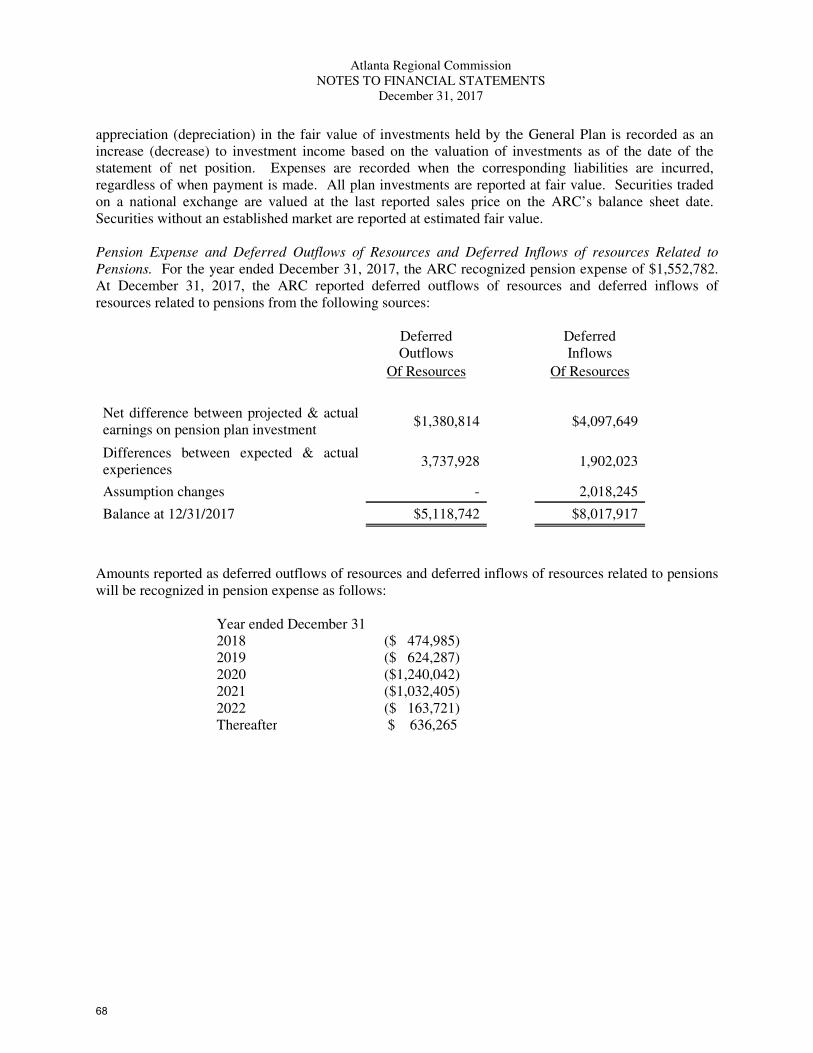
Atlanta Regional Commission
NOTES TO FINANCIAL STATEMENTS
December 31, 2017
appreciation (depreciation) in the fair value of investments held by the General Plan is recorded as an
increase (decrease) to investment income based on the valuation of investments as of the date of the
statement of net position. Expenses are recorded when the corresponding liabilities are incurred,
regardless of when payment is made. All plan investments are reported at fair value. Securities traded
on a national exchange are valued at the last reported sales price on the ARC’s balance sheet date.
Securities without an established market are reported at estimated fair value.
Pension Expense and Deferred Outflows of Resources and Deferred Inflows of resources Related to
Pensions. For the year ended December 31, 2017, the ARC recognized pension expense of $1,552,782.
At December 31, 2017, the ARC reported deferred outflows of resources and deferred inflows of
resources related to pensions from the following sources:
Deferred
Outflows
Deferred
Inflows
Of Resources Of Resources
Net difference between projected & actual
earnings on pension plan investment $1,380,814
$4,097,649
Differences between expected & actual
experiences 3,737,928
1,902,023
Assumption changes -
2,018,245
Balance at 12/31/2017 $5,118,742
$8,017,917
Amounts reported as deferred outflows of resources and deferred inflows of resources related to pensions
will be recognized in pension expense as follows:
Year ended December 31
2018 ($ 474,985)
2019 ($ 624,287)
2020 ($1,240,042)
2021 ($1,032,405)
2022 ($ 163,721)
Thereafter $ 636,265
68
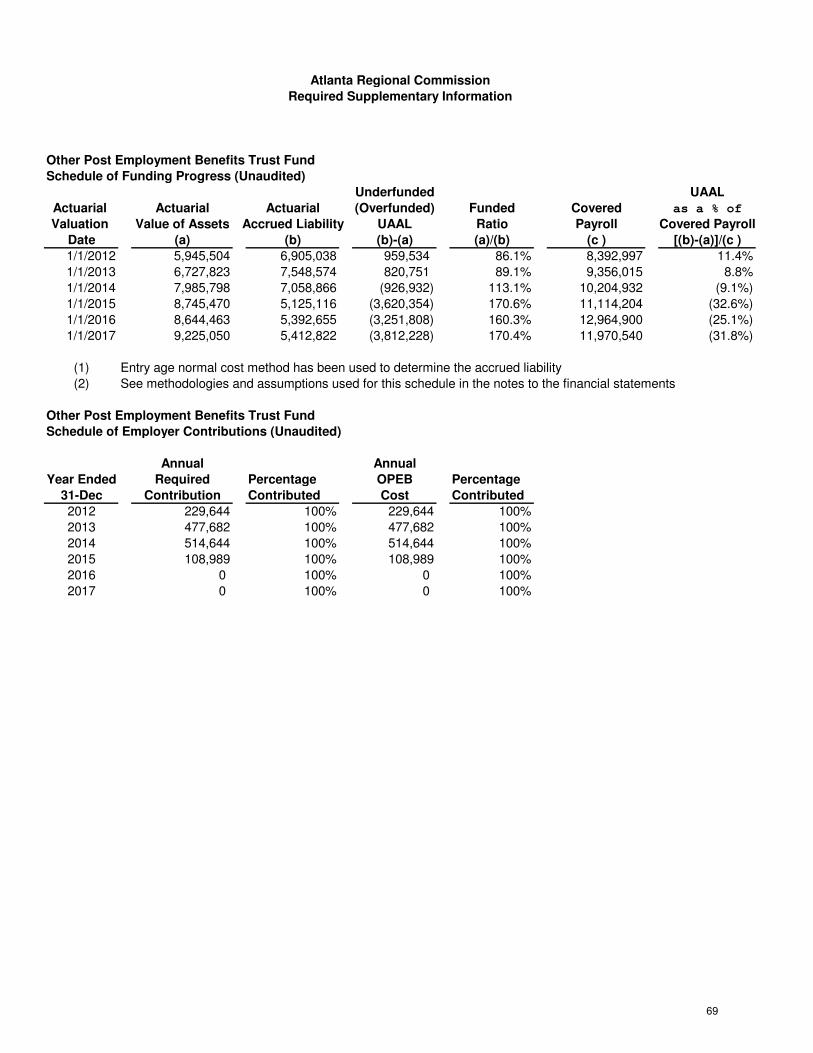
Other Post Employment Benefits Trust Fund
Schedule of Funding Progress (Unaudited)
Underfunded UAAL
Actuarial Actuarial Actuarial (Overfunded) Funded Covered as a % of
Valuation Value of Assets Accrued Liability UAAL Ratio Payroll Covered Payroll
Date (a) (b) (b)-(a) (a)/(b) (c ) [(b)-(a)]/(c )
1/1/2012 5,945,504 6,905,038 959,534 86.1% 8,392,997 11.4%
1/1/2013 6,727,823 7,548,574 820,751 89.1% 9,356,015 8.8%
1/1/2014 7,985,798 7,058,866 (926,932) 113.1% 10,204,932 (9.1%)
1/1/2015 8,745,470 5,125,116 (3,620,354) 170.6% 11,114,204 (32.6%)
1/1/2016 8,644,463 5,392,655 (3,251,808) 160.3% 12,964,900 (25.1%)
1/1/2017 9,225,050 5,412,822 (3,812,228) 170.4% 11,970,540 (31.8%)
(1) Entry age normal cost method has been used to determine the accrued liability
(2) See methodologies and assumptions used for this schedule in the notes to the financial statements
Other Post Employment Benefits Trust Fund
Schedule of Employer Contributions (Unaudited)
Annual Annual
Year Ended Required Percentage OPEB Percentage
31-Dec Contribution Contributed Cost Contributed
2012 229,644 100% 229,644 100%
2013 477,682 100% 477,682 100%
2014 514,644 100% 514,644 100%
2015 108,989 100% 108,989 100%
2016 0 100% 0 100%
2017 0 100% 0 100%
Required Supplementary Information
Atlanta Regional Commission
69
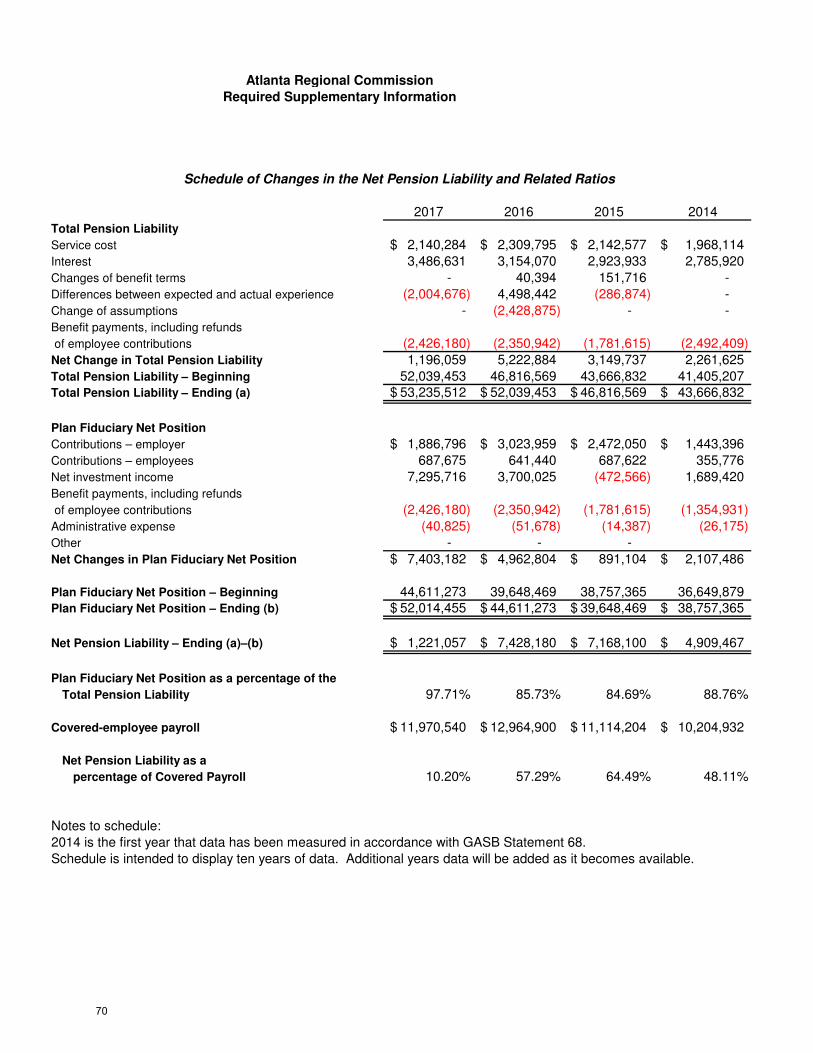
2017 2016 2015 2014
Total Pension Liability
Service cost 2,140,284$ 2,309,795$ 2,142,577$ 1,968,114$
Interest 3,486,631 3,154,070 2,923,933 2,785,920
Changes of benefit terms - 40,394 151,716 -
Differences between expected and actual experience (2,004,676) 4,498,442 (286,874) -
Change of assumptions - (2,428,875) - -
Benefit payments, including refunds
of employee contributions (2,426,180) (2,350,942) (1,781,615) (2,492,409)
Net Change in Total Pension Liability 1,196,059 5,222,884 3,149,737 2,261,625
Total Pension Liability – Beginning 52,039,453 46,816,569 43,666,832 41,405,207 Total Pension Liability – Ending (a) 53,235,512$ 52,039,453$ 46,816,569$ 43,666,832$
Plan Fiduciary Net Position
Contributions – employer 1,886,796$ 3,023,959$ 2,472,050$ 1,443,396$
Contributions – employees 687,675 641,440 687,622 355,776
Net investment income 7,295,716 3,700,025 (472,566) 1,689,420
Benefit payments, including refunds
of employee contributions (2,426,180) (2,350,942) (1,781,615) (1,354,931)
Administrative expense (40,825) (51,678) (14,387) (26,175)
Other - - -
Net Changes in Plan Fiduciary Net Position 7,403,182$ 4,962,804$ 891,104$ 2,107,486$
Plan Fiduciary Net Position – Beginning 44,611,273 39,648,469 38,757,365 36,649,879 Plan Fiduciary Net Position – Ending (b) 52,014,455$ 44,611,273$ 39,648,469$ 38,757,365$
Net Pension Liability – Ending (a)–(b) 1,221,057$ 7,428,180$ 7,168,100$ 4,909,467$
Plan Fiduciary Net Position as a percentage of the
Total Pension Liability 97.71% 85.73% 84.69% 88.76%
Covered-employee payroll 11,970,540$ 12,964,900$ 11,114,204$ 10,204,932$
Net Pension Liability as a
percentage of Covered Payroll 10.20% 57.29% 64.49% 48.11%
Notes to schedule:
2014 is the first year that data has been measured in accordance with GASB Statement 68.
Schedule is intended to display ten years of data. Additional years data will be added as it becomes available.
Atlanta Regional Commission
Required Supplementary Information
Schedule of Changes in the Net Pension Liability and Related Ratios
70
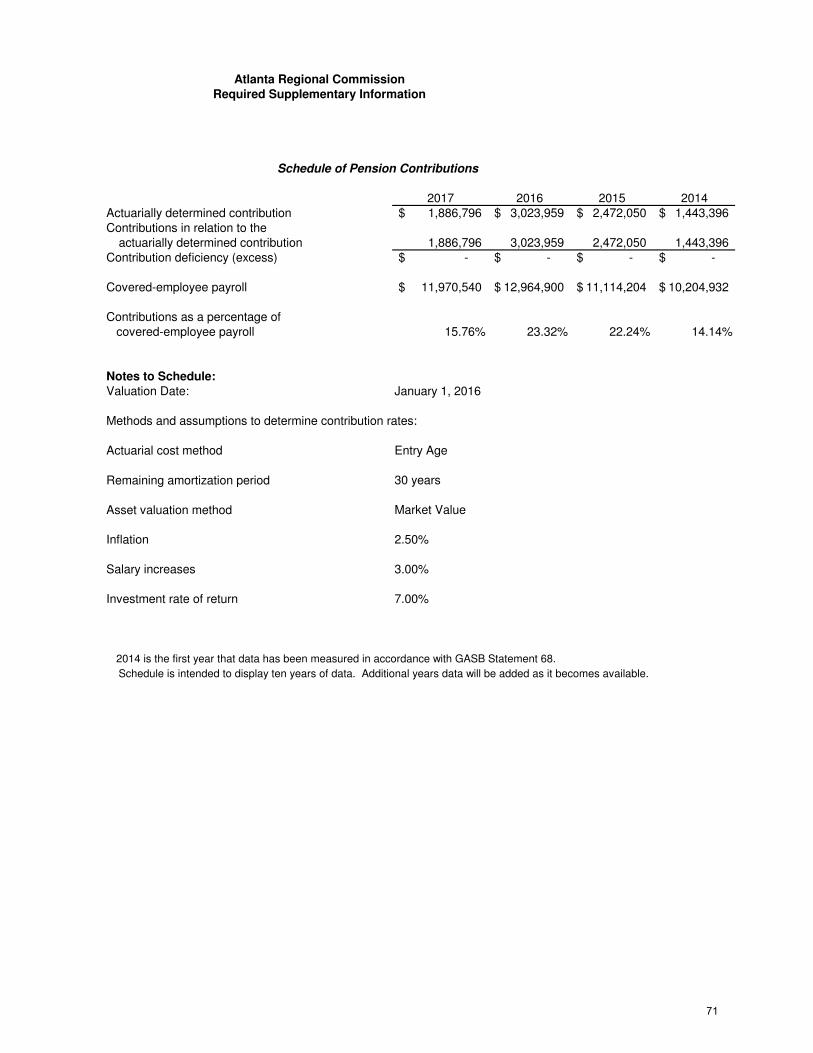
2017 2016 2015 2014Actuarially determined contribution 1,886,796$ 3,023,959$ 2,472,050$ 1,443,396$ Contributions in relation to the
actuarially determined contribution 1,886,796 3,023,959 2,472,050 1,443,396 Contribution deficiency (excess) -$ -$ -$ -$
Covered-employee payroll 11,970,540$ 12,964,900$ 11,114,204$ 10,204,932$
Contributions as a percentage of covered-employee payroll 15.76% 23.32% 22.24% 14.14%
Notes to Schedule:
Valuation Date: January 1, 2016
Methods and assumptions to determine contribution rates:
Actuarial cost method Entry Age
Remaining amortization period 30 years
Asset valuation method Market Value
Inflation 2.50%
Salary increases 3.00%
Investment rate of return 7.00%
2014 is the first year that data has been measured in accordance with GASB Statement 68.
Schedule is intended to display ten years of data. Additional years data will be added as it becomes available.
Atlanta Regional Commission
Required Supplementary Information
Schedule of Pension Contributions
71

The Atlanta Regional Commission
Nonmajor Governmental Funds
Year ended December 31, 2017
Nonmajor Funds – Special revenue funds are used to account for proceeds of specific
revenue sources that are legally restricted for specific purposes.
72
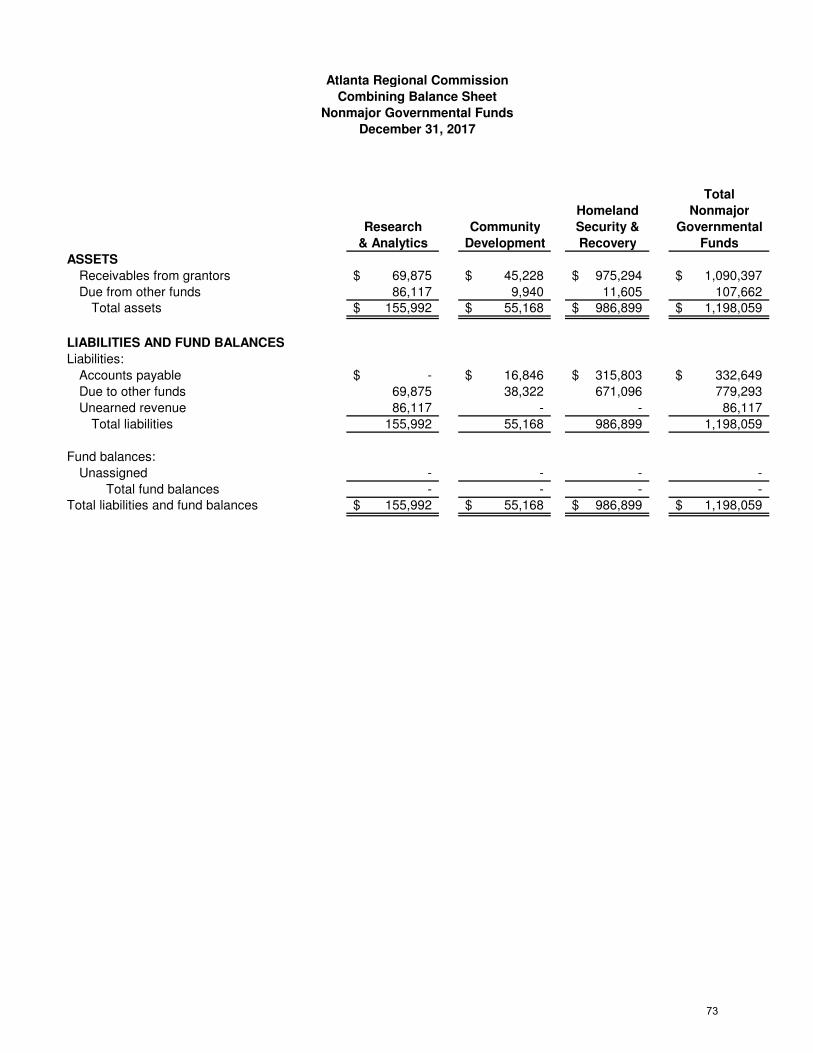
Total
Homeland Nonmajor
Research Community Security & Governmental
& Analytics Development Recovery Funds
ASSETS
Receivables from grantors 69,875$ 45,228$ 975,294$ 1,090,397$
Due from other funds 86,117 9,940 11,605 107,662 Total assets 155,992$ 55,168$ 986,899$ 1,198,059$
LIABILITIES AND FUND BALANCES
Liabilities:
Accounts payable -$ 16,846$ 315,803$ 332,649$
Due to other funds 69,875 38,322 671,096 779,293
Unearned revenue 86,117 - - 86,117
Total liabilities (Note 2)Total liabilities 155,992 55,168 986,899 1,198,059
Fund balances:
Unassigned - - - -
Total fund balances Total fund balances - - - - Total liabilities and fund balances 155,992$ 55,168$ 986,899$ 1,198,059$
Atlanta Regional Commission
Combining Balance Sheet
Nonmajor Governmental Funds
December 31, 2017
73
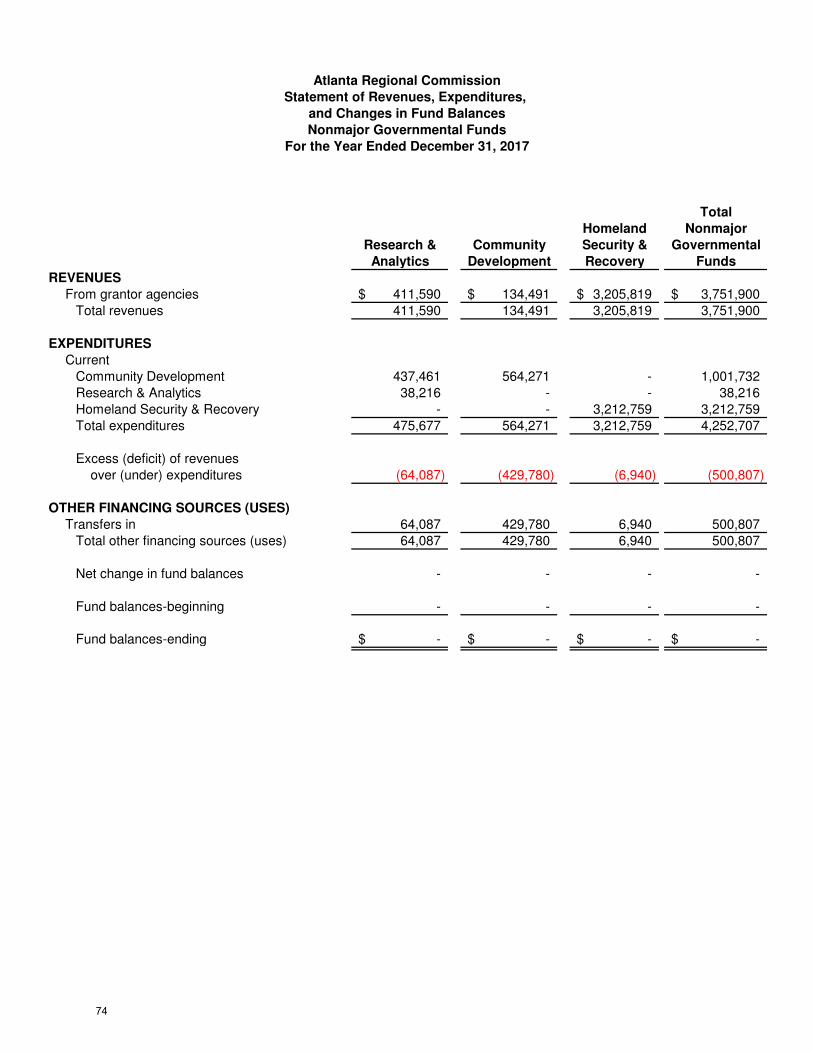
Total
Homeland Nonmajor
Research & Community Security & Governmental
Analytics Development Recovery Funds
REVENUES
From grantor agencies 411,590$ 134,491$ 3,205,819$ 3,751,900$
Total revenues 411,590 134,491 3,205,819 3,751,900
EXPENDITURES
Current
Community Development 437,461 564,271 - 1,001,732
Research & Analytics 38,216 - - 38,216
Homeland Security & Recovery - - 3,212,759 3,212,759
Total expenditures 475,677 564,271 3,212,759 4,252,707
Excess (deficit) of revenues
over (under) expenditures (64,087) (429,780) (6,940) (500,807)
OTHER FINANCING SOURCES (USES)
Transfers in 64,087 429,780 6,940 500,807
Total other financing sources (uses) 64,087 429,780 6,940 500,807
Net change in fund balances - - - -
Fund balances-beginning - - - -
Fund balances-ending -$ -$ -$ -$
Atlanta Regional Commission
Statement of Revenues, Expenditures,
and Changes in Fund Balances
Nonmajor Governmental Funds
For the Year Ended December 31, 2017
74
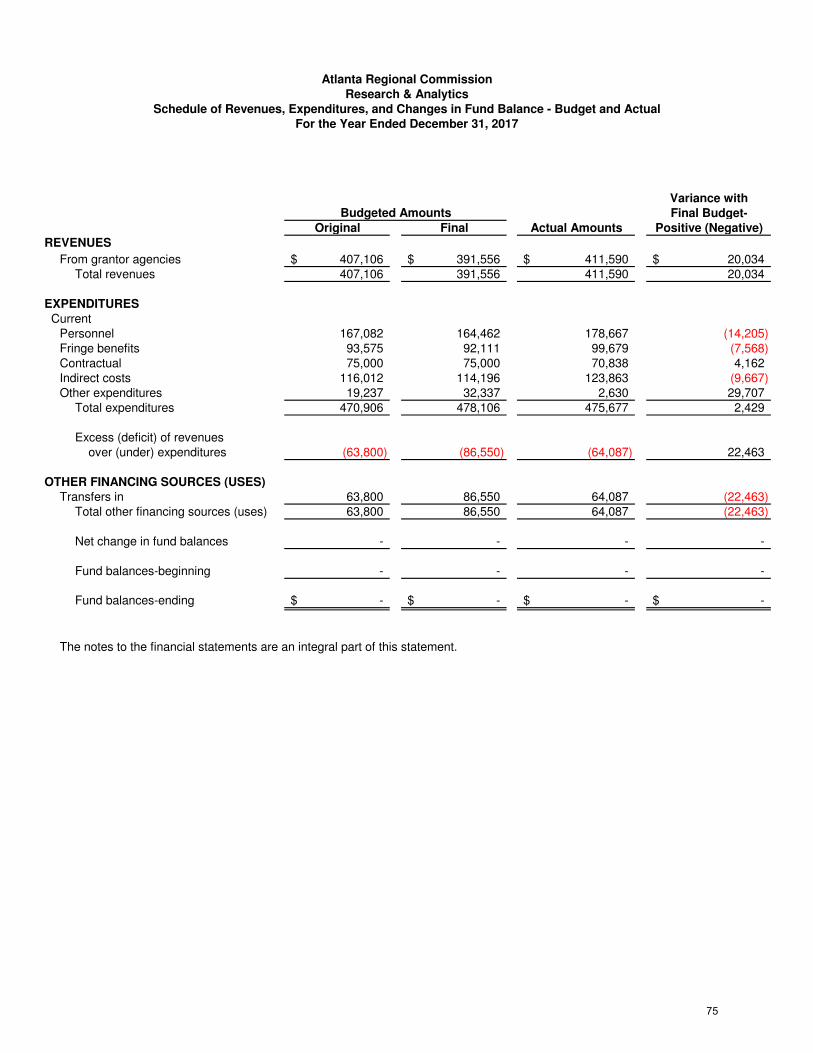
Variance with
Final Budget-
Original Final Actual Amounts Positive (Negative)
REVENUES
From grantor agencies 407,106$ 391,556$ 411,590$ 20,034$ Total revenues 407,106 391,556 411,590 20,034
EXPENDITURES
CurrentPersonnel 167,082 164,462 178,667 (14,205) Fringe benefits 93,575 92,111 99,679 (7,568) Contractual 75,000 75,000 70,838 4,162 Indirect costs 116,012 114,196 123,863 (9,667) Other expenditures 19,237 32,337 2,630 29,707
Total expenditures 470,906 478,106 475,677 2,429
Excess (deficit) of revenues over (under) expenditures (63,800) (86,550) (64,087) 22,463
OTHER FINANCING SOURCES (USES)
Transfers in 63,800 86,550 64,087 (22,463) Total other financing sources (uses) 63,800 86,550 64,087 (22,463)
Net change in fund balances - - - -
Fund balances-beginning - - - -
Fund balances-ending -$ -$ -$ -$
The notes to the financial statements are an integral part of this statement.
Budgeted Amounts
Research & Analytics
Atlanta Regional Commission
Schedule of Revenues, Expenditures, and Changes in Fund Balance - Budget and Actual
For the Year Ended December 31, 2017
75
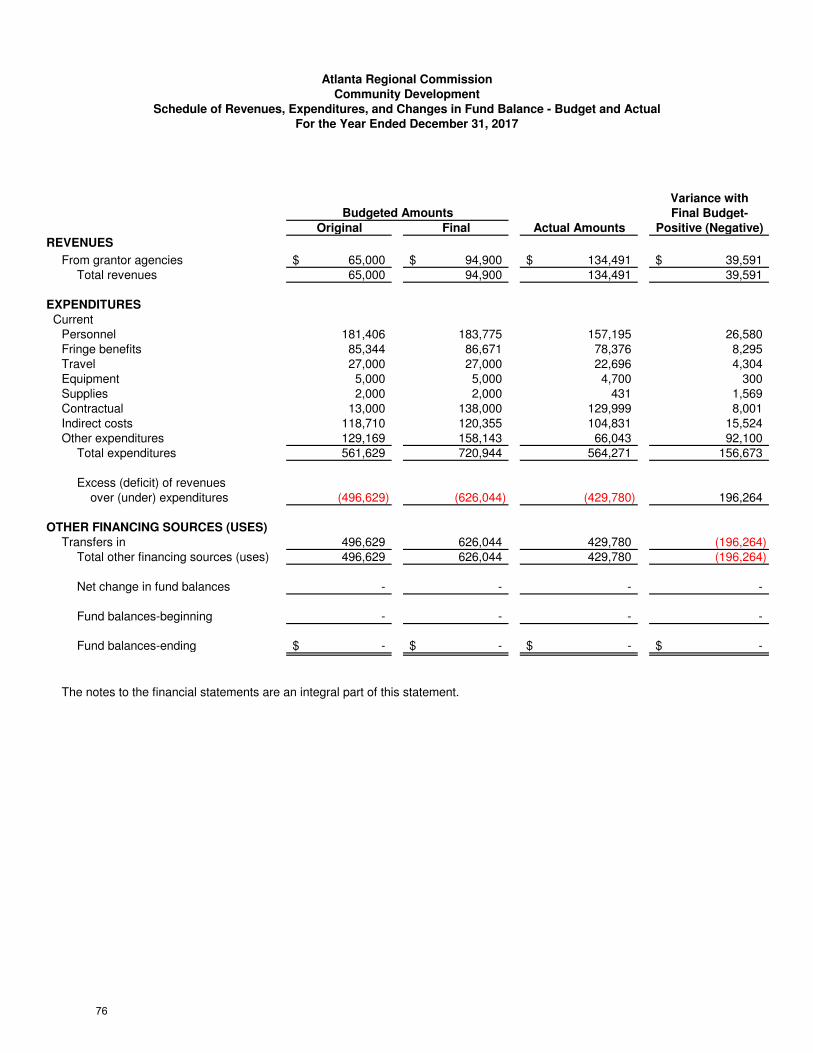
Variance with
Final Budget-
Original Final Actual Amounts Positive (Negative)
REVENUES
From grantor agencies 65,000$ 94,900$ 134,491$ 39,591$ Total revenues 65,000 94,900 134,491 39,591
EXPENDITURES
CurrentPersonnel 181,406 183,775 157,195 26,580 Fringe benefits 85,344 86,671 78,376 8,295 Travel 27,000 27,000 22,696 4,304 Equipment 5,000 5,000 4,700 300 Supplies 2,000 2,000 431 1,569 Contractual 13,000 138,000 129,999 8,001 Indirect costs 118,710 120,355 104,831 15,524 Other expenditures 129,169 158,143 66,043 92,100
Total expenditures 561,629 720,944 564,271 156,673
Excess (deficit) of revenues over (under) expenditures (496,629) (626,044) (429,780) 196,264
OTHER FINANCING SOURCES (USES)
Transfers in 496,629 626,044 429,780 (196,264) Total other financing sources (uses) 496,629 626,044 429,780 (196,264)
Net change in fund balances - - - -
Fund balances-beginning - - - -
Fund balances-ending -$ -$ -$ -$
The notes to the financial statements are an integral part of this statement.
Budgeted Amounts
Community Development
Atlanta Regional Commission
Schedule of Revenues, Expenditures, and Changes in Fund Balance - Budget and Actual
For the Year Ended December 31, 2017
76
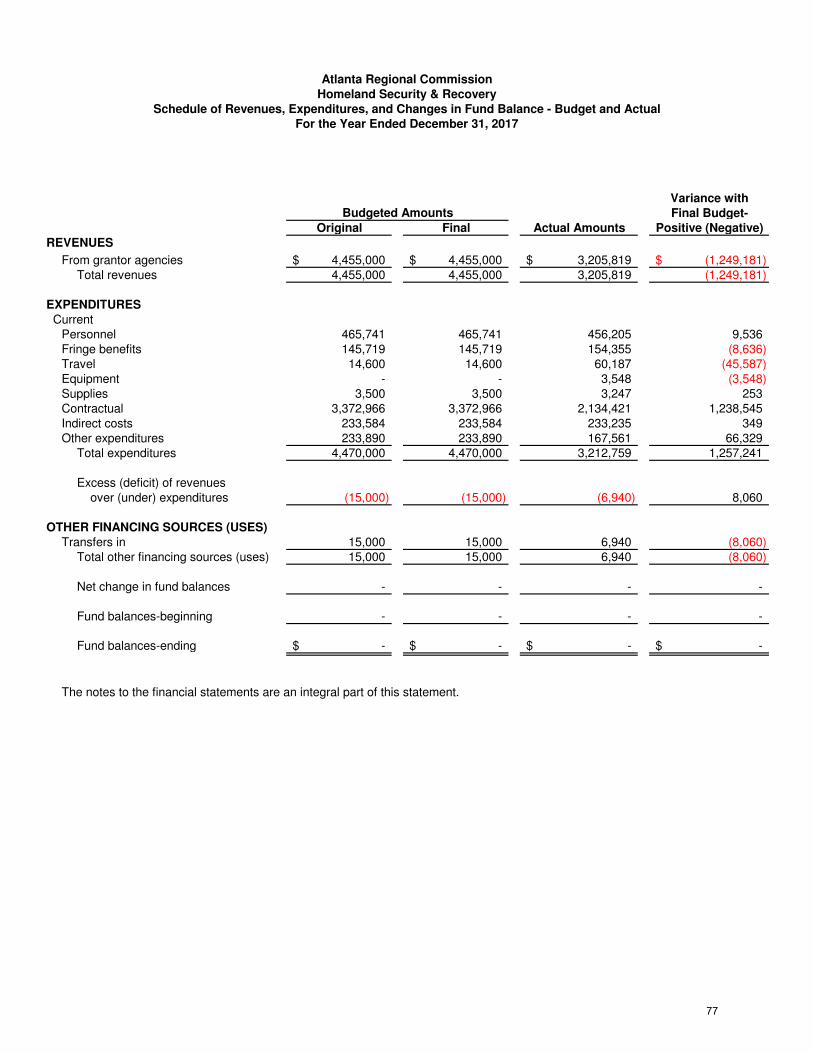
Variance with
Final Budget-
Original Final Actual Amounts Positive (Negative)
REVENUES
From grantor agencies 4,455,000$ 4,455,000$ 3,205,819$ (1,249,181)$ Total revenues 4,455,000 4,455,000 3,205,819 (1,249,181)
EXPENDITURES
CurrentPersonnel 465,741 465,741 456,205 9,536 Fringe benefits 145,719 145,719 154,355 (8,636) Travel 14,600 14,600 60,187 (45,587) Equipment - - 3,548 (3,548) Supplies 3,500 3,500 3,247 253 Contractual 3,372,966 3,372,966 2,134,421 1,238,545 Indirect costs 233,584 233,584 233,235 349 Other expenditures 233,890 233,890 167,561 66,329
Total expenditures 4,470,000 4,470,000 3,212,759 1,257,241
Excess (deficit) of revenues over (under) expenditures (15,000) (15,000) (6,940) 8,060
OTHER FINANCING SOURCES (USES)
Transfers in 15,000 15,000 6,940 (8,060) Total other financing sources (uses) 15,000 15,000 6,940 (8,060)
Net change in fund balances - - - -
Fund balances-beginning - - - -
Fund balances-ending -$ -$ -$ -$
The notes to the financial statements are an integral part of this statement.
Atlanta Regional Commission
Homeland Security & Recovery
Schedule of Revenues, Expenditures, and Changes in Fund Balance - Budget and Actual
For the Year Ended December 31, 2017
Budgeted Amounts
77
The Atlanta Regional Commission
Non-Major Enterprise Funds Year ended December 31, 2017
Enterprise Funds are to account for operations (a) that are financed and operated in a manner similar to private business enterprises – where the intent of the governing body is that the costs of providing goods or services to the general public on a continuing basis be financed or recovered primarily through user charges; or (b) where the governing body has decided that periodic determination of revenues earned, expenses incurred, and/or net income is appropriate for capital maintenance, public policy, management control, accountability, or other purposes. The Atlanta Regional Commission maintains the following Non-major Enterprise Funds:
1. Aging Programs – Provides (1) through Aging Connection Plus, enhanced information services to businesses to improve the quality of services to their older customers, (2) all other information-based services offered by the Aging Services Division to corporations and to other service partners, and (3) the Metropolitan Partnership in Aging, a consortium of ten county-based aging programs developing partnerships to expand services to older adults.
2. Metropolitan River Protection Act Reviews – Covers review responsibilities assigned
to ARC by the Metropolitan River Protection Act (MRPA) to monitor compliance with Chattahoochee Corridor Plan standards.
3. State of the Region – Covers operating expenses and registration fees directly related to
ARC’s annual State of the Region Conference for leaders from the public, business, and nonprofit sectors.
4. Regional Leadership Institute & Memberships – Includes only those activities
involved in the direct operation of the one-week Institute conducted annually to develop a network of leaders from all sectors to address region wide problems and opportunities.
5. Arts & Culture Programs – Covers registration fees and operating expenses related to
training provided to develop “regional” cultural agencies and cultural plans.
6. LINK Program - Activities involved in hosting the Leadership, Involvement, Networking & Knowledge (LINK) trip which is a cross-sector, cross-county leadership exchange that brings together the region’s most influential leaders to learn how metropolitan areas throughout the country are addressing the same issues and challenges we face in the Atlanta region.
7. Miscellaneous Programs – Activities of ARC’s Miscellaneous Program include cultural
forums in each of the 10 metro counties, inventories of non-profit cultural groups and cultural facilities, an overview of for-profit “creative industries” in the region and the cultural plans, agencies, policies and ordinances in the region.
78
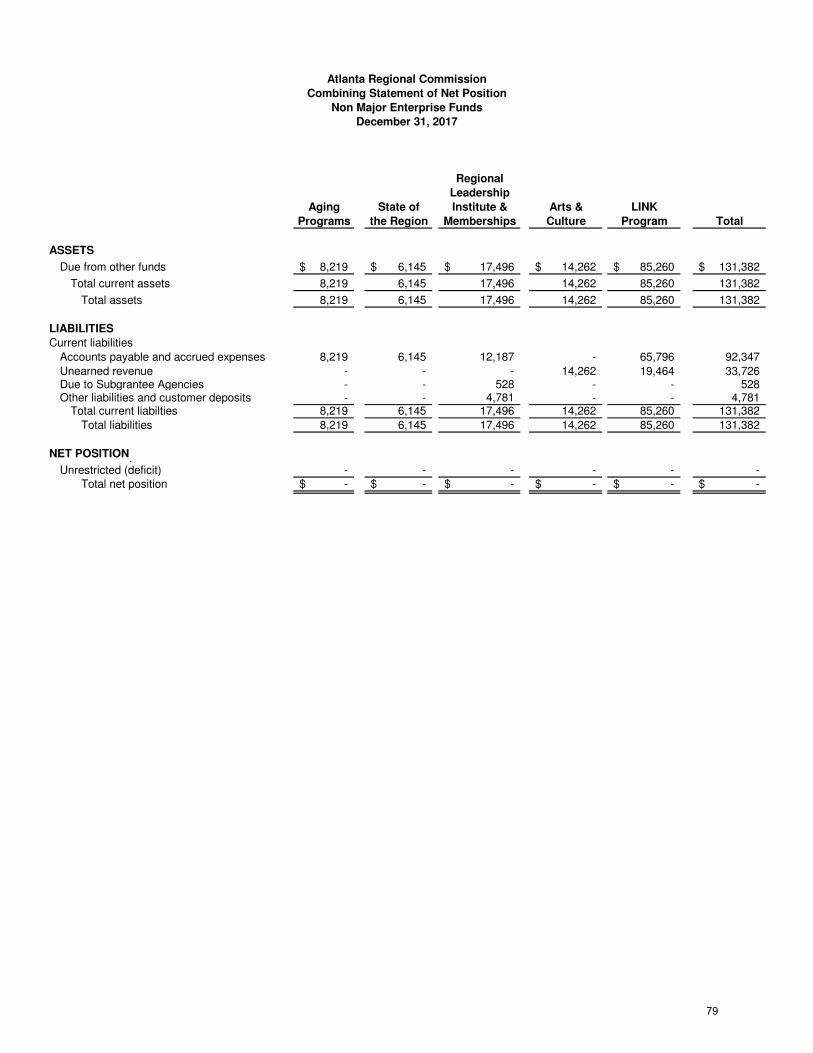
Regional
Leadership
Aging State of Institute & Arts & LINK
Programs the Region Memberships Culture Program Total
ASSETS
Due from other funds 8,219$ 6,145$ 17,496$ 14,262$ 85,260$ 131,382$
Total current assets 8,219 6,145 17,496 14,262 85,260 131,382
Total assets 8,219 6,145 17,496 14,262 85,260 131,382
LIABILITIES
Current liabilities
Accounts payable and accrued expenses 8,219 6,145 12,187 - 65,796 92,347
Unearned revenue - - - 14,262 19,464 33,726 Due to Subgrantee Agencies - - 528 - - 528 Other liabilities and customer deposits - - 4,781 - - 4,781
Total current liabilties 8,219 6,145 17,496 14,262 85,260 131,382
Total liabilities 8,219 6,145 17,496 14,262 85,260 131,382
NET POSITIONInvested in capital assets - - - - - -
Unrestricted (deficit) - - - - - - Total net position -$ -$ -$ -$ -$ -$
Atlanta Regional Commission
Combining Statement of Net Position
Non Major Enterprise Funds
December 31, 2017
79
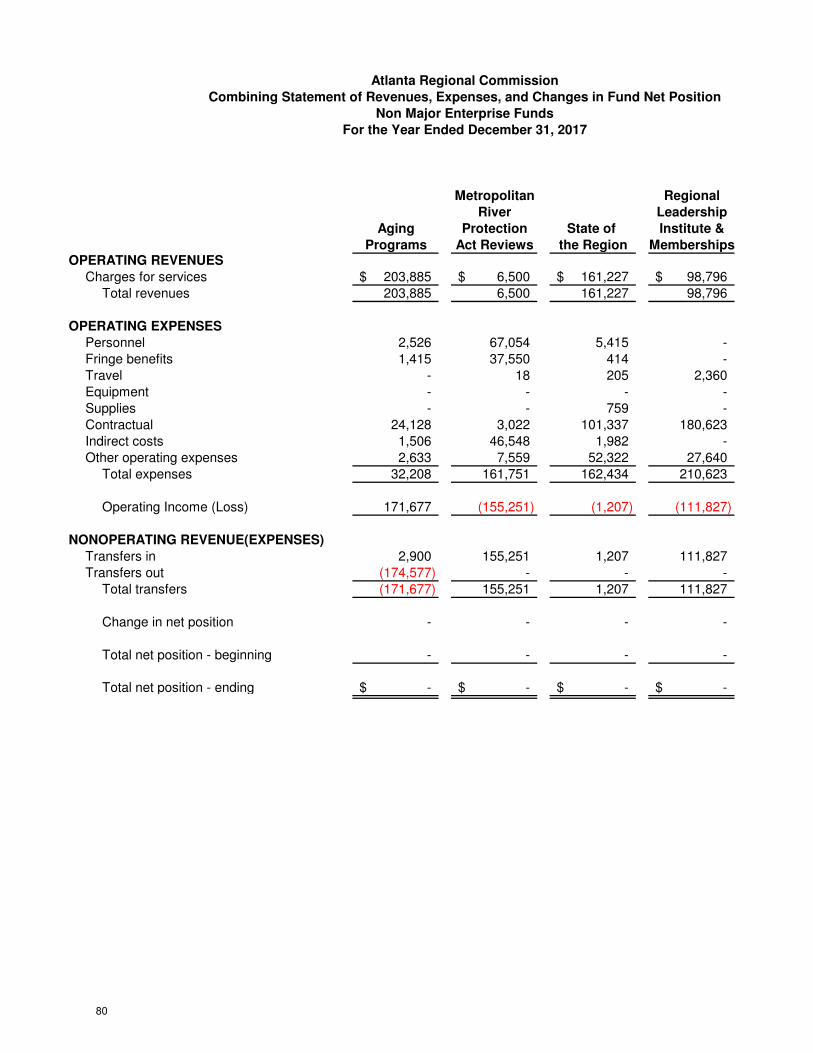
Metropolitan Regional
River Leadership
Aging Protection State of Institute &
Programs Act Reviews the Region MembershipsOPERATING REVENUES
Charges for services 203,885$ 6,500$ 161,227$ 98,796$
Total revenues 203,885 6,500 161,227 98,796
OPERATING EXPENSES
Personnel 2,526 67,054 5,415 -
Fringe benefits 1,415 37,550 414 -
Travel - 18 205 2,360
Equipment - - - -
Supplies - - 759 -
Contractual 24,128 3,022 101,337 180,623
Indirect costs 1,506 46,548 1,982 -
Other operating expenses 2,633 7,559 52,322 27,640
Total expenses 32,208 161,751 162,434 210,623
Operating Income (Loss) 171,677 (155,251) (1,207) (111,827)
NONOPERATING REVENUE(EXPENSES)
Transfers in 2,900 155,251 1,207 111,827
Transfers out (174,577) - - -
Total transfers (171,677) 155,251 1,207 111,827
Change in net position - - - -
Total net position - beginning - - - -
Total net position - ending -$ -$ -$ -$
Non Major Enterprise Funds
For the Year Ended December 31, 2017
Combining Statement of Revenues, Expenses, and Changes in Fund Net Position
Atlanta Regional Commission
80
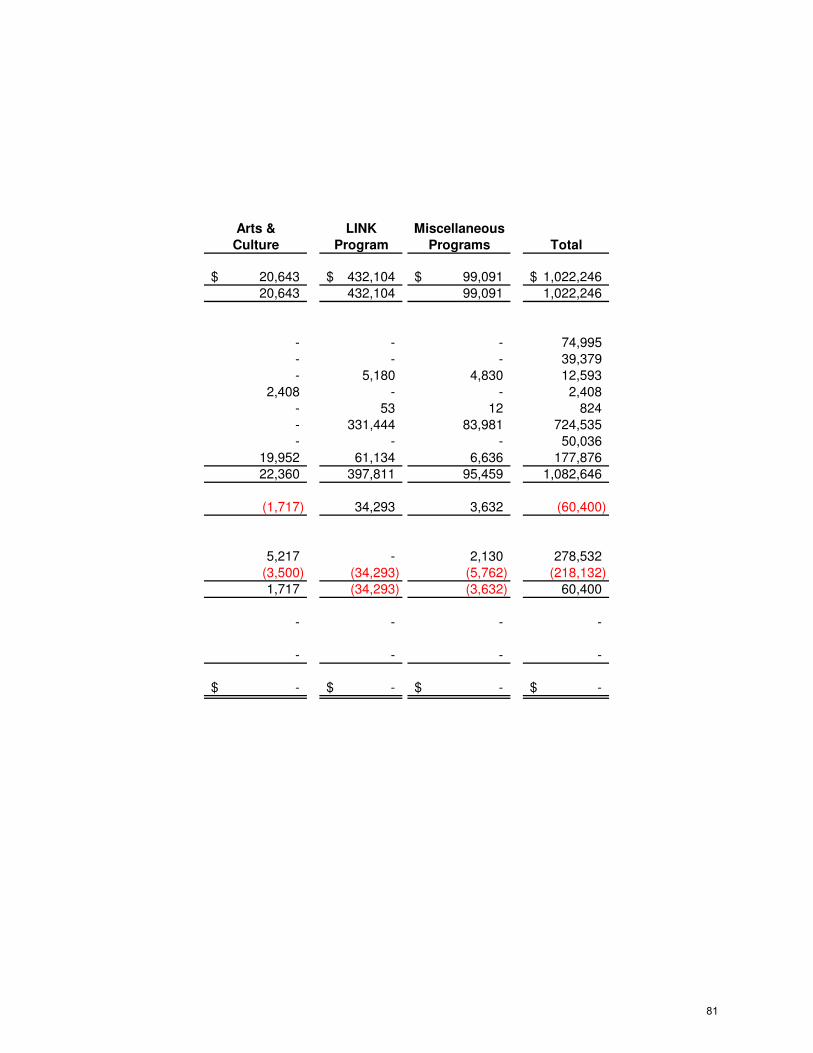
Arts & LINK Miscellaneous
Culture Program Programs Total
20,643$ 432,104$ 99,091$ 1,022,246$
20,643 432,104 99,091 1,022,246
- - - 74,995
- - - 39,379
- 5,180 4,830 12,593
2,408 - - 2,408
- 53 12 824
- 331,444 83,981 724,535
- - - 50,036
19,952 61,134 6,636 177,876
22,360 397,811 95,459 1,082,646
(1,717) 34,293 3,632 (60,400)
5,217 - 2,130 278,532
(3,500) (34,293) (5,762) (218,132)
1,717 (34,293) (3,632) 60,400
- - - -
- - - -
-$ -$ -$ -$
81
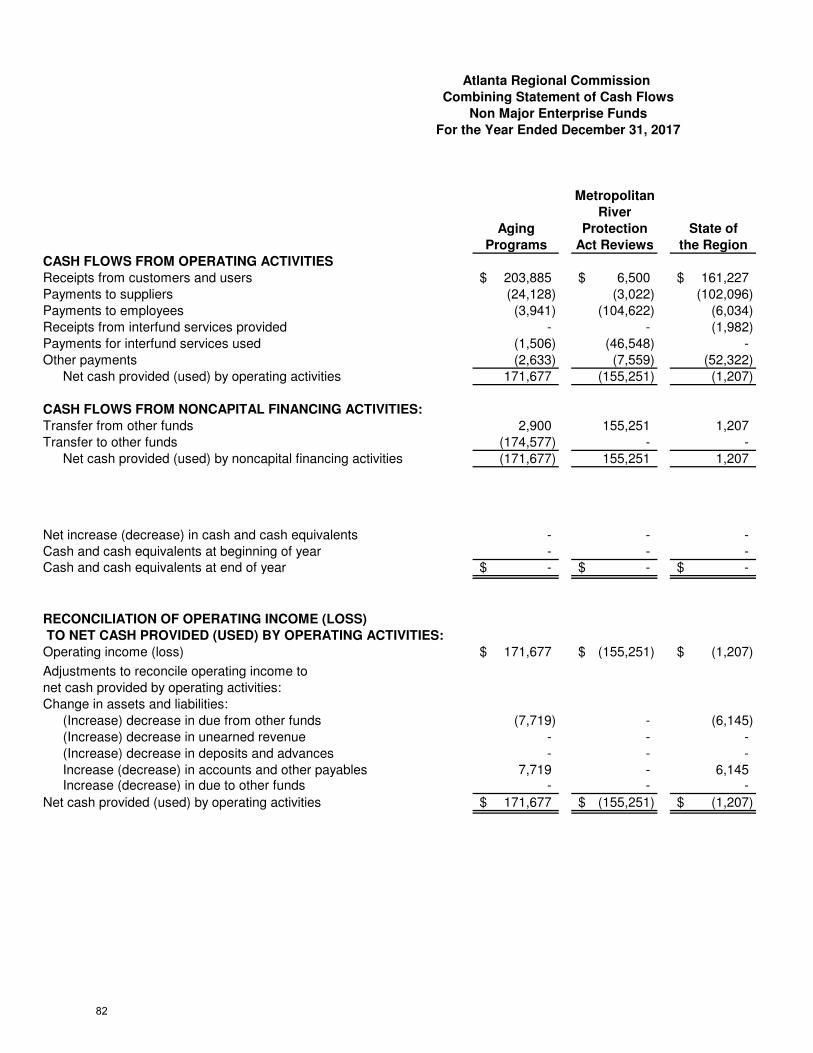
Metropolitan
River
Aging Protection State of
Programs Act Reviews the Region
CASH FLOWS FROM OPERATING ACTIVITIES
Receipts from customers and users 203,885$ 6,500$ 161,227$
Payments to suppliers (24,128) (3,022) (102,096)
Payments to employees (3,941) (104,622) (6,034)
Receipts from interfund services provided - - (1,982)
Payments for interfund services used (1,506) (46,548) -
Other payments (2,633) (7,559) (52,322)
Net cash provided (used) by operating activities 171,677 (155,251) (1,207)
CASH FLOWS FROM NONCAPITAL FINANCING ACTIVITIES:
Transfer from other funds 2,900 155,251 1,207
Transfer to other funds (174,577) - -
Net cash provided (used) by noncapital financing activities (171,677) 155,251 1,207
Net increase (decrease) in cash and cash equivalents - - -
Cash and cash equivalents at beginning of year - - - Cash and cash equivalents at end of year -$ -$ -$
RECONCILIATION OF OPERATING INCOME (LOSS)
TO NET CASH PROVIDED (USED) BY OPERATING ACTIVITIES:
Operating income (loss) 171,677$ (155,251)$ (1,207)$
Adjustments to reconcile operating income to
net cash provided by operating activities:
Change in assets and liabilities:
(Increase) decrease in due from other funds (7,719) - (6,145)
(Increase) decrease in unearned revenue - - -
(Increase) decrease in deposits and advances - - -
Increase (decrease) in accounts and other payables 7,719 - 6,145 Increase (decrease) in due to other funds - - -
Net cash provided (used) by operating activities 171,677$ (155,251)$ (1,207)$
Combining Statement of Cash Flows
Atlanta Regional Commission
For the Year Ended December 31, 2017
Non Major Enterprise Funds
82
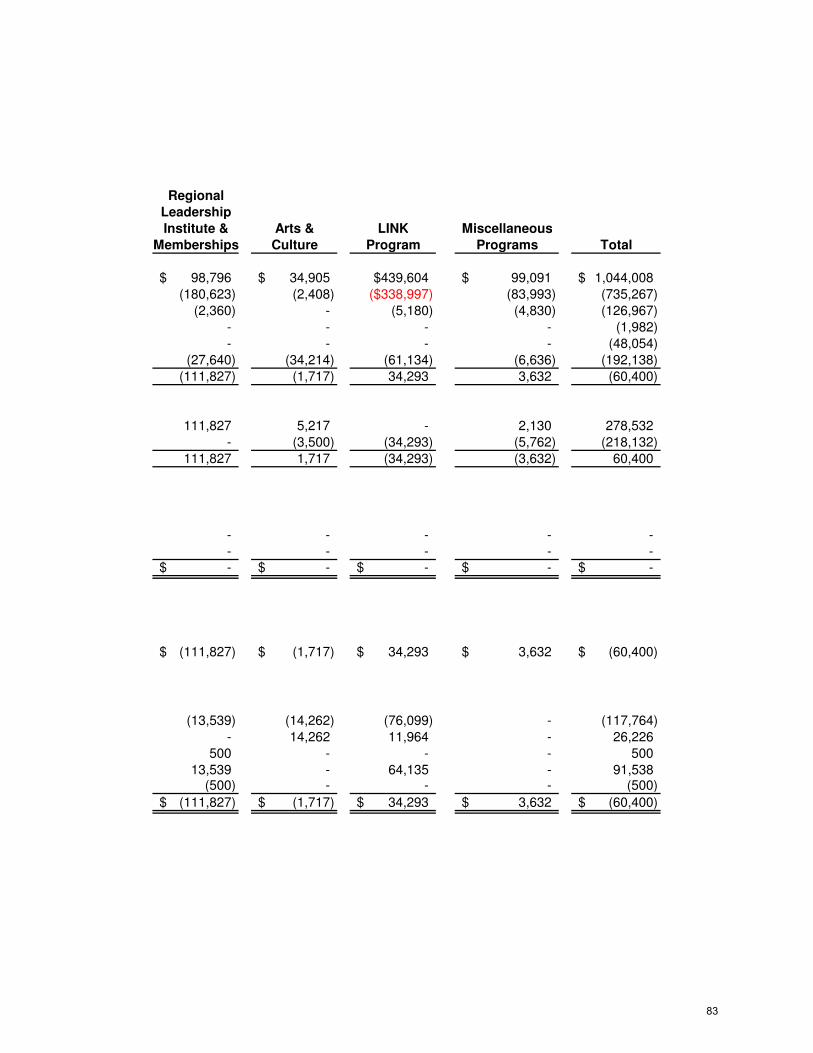
Regional
Leadership
Institute & Arts & LINK Miscellaneous
Memberships Culture Program Programs Total
98,796$ 34,905$ $439,604 99,091$ 1,044,008$
(180,623) (2,408) ($338,997) (83,993) (735,267)
(2,360) - (5,180) (4,830) (126,967)
- - - - (1,982)
- - - - (48,054)
(27,640) (34,214) (61,134) (6,636) (192,138)
(111,827) (1,717) 34,293 3,632 (60,400)
111,827 5,217 - 2,130 278,532
- (3,500) (34,293) (5,762) (218,132)
111,827 1,717 (34,293) (3,632) 60,400
- - - - -
- - - - - -$ -$ -$ -$ -$
(111,827)$ (1,717)$ 34,293$ 3,632$ (60,400)$
(13,539) (14,262) (76,099) - (117,764)
- 14,262 11,964 - 26,226
500 - - - 500
13,539 - 64,135 - 91,538 (500) - - - (500)
(111,827)$ (1,717)$ 34,293$ 3,632$ (60,400)$
83
The Atlanta Regional Commission
Fiduciary Funds
Year ended December 31, 2017
Fiduciary Funds
Pension Trust Fund –The Employee Retirement Trust Fund accounts for resources
accumulated from pension benefits within a defined benefit plan.
Other Post Employment Benefits – The Other Post Employment Benefits Trust Fund
accounts for the current and future cost of health benefits provided by the Commission
to retirees and their dependents.
84
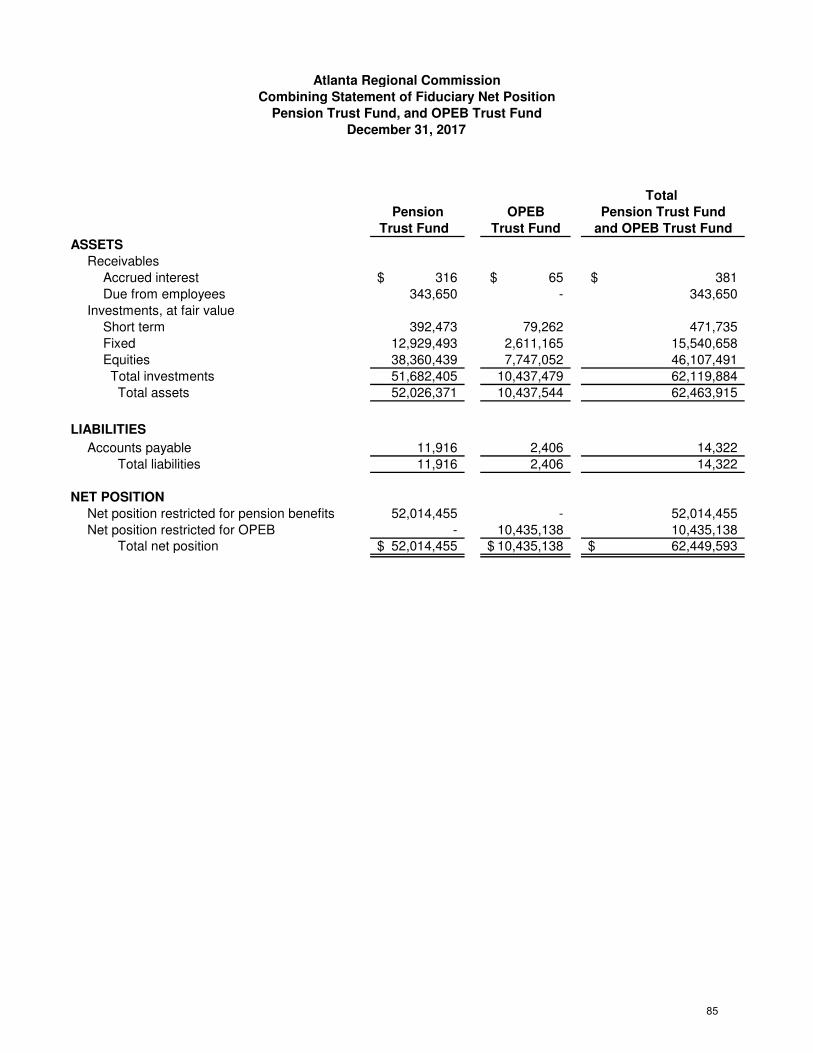
Total
Pension OPEB Pension Trust Fund
Trust Fund Trust Fund and OPEB Trust Fund
ASSETS
Receivables
Accrued interest 316$ 65$ 381$
Due from employees 343,650 - 343,650
Investments, at fair value
Short term 392,473 79,262 471,735
Fixed 12,929,493 2,611,165 15,540,658
Equities 38,360,439 7,747,052 46,107,491
Total investments 51,682,405 10,437,479 62,119,884
Total assets 52,026,371 10,437,544 62,463,915
LIABILITIES
Accounts payable 11,916 2,406 14,322
Total liabilities 11,916 2,406 14,322
NET POSITION
Net position restricted for pension benefits 52,014,455 - 52,014,455
Net position restricted for OPEB - 10,435,138 10,435,138 Total net position 52,014,455$ 10,435,138$ 62,449,593$
Atlanta Regional Commission
Combining Statement of Fiduciary Net Position
Pension Trust Fund, and OPEB Trust Fund
December 31, 2017
85
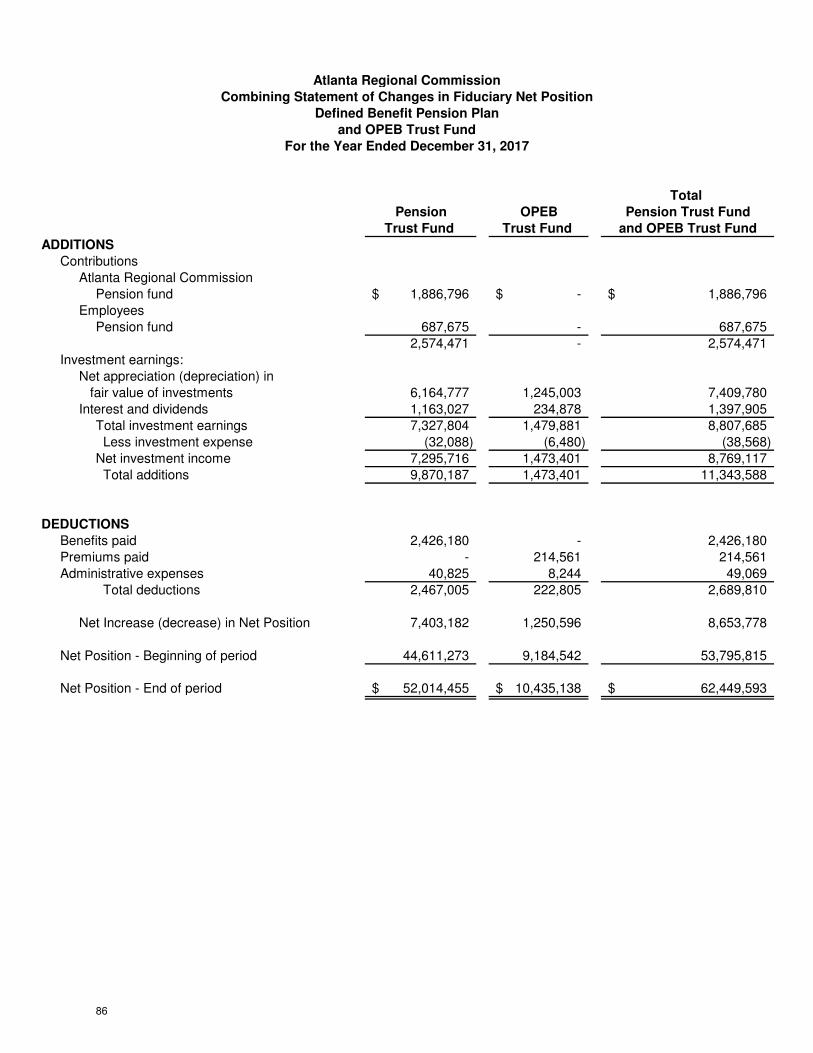
Total
Pension OPEB Pension Trust Fund
Trust Fund Trust Fund and OPEB Trust Fund
ADDITIONS
Contributions
Atlanta Regional Commission
Pension fund 1,886,796$ -$ 1,886,796$
Employees
Pension fund 687,675 - 687,675
2,574,471 - 2,574,471
Investment earnings:
Net appreciation (depreciation) in
fair value of investments 6,164,777 1,245,003 7,409,780
Interest and dividends 1,163,027 234,878 1,397,905
Total investment earnings 7,327,804 1,479,881 8,807,685
Less investment expense (32,088) (6,480) (38,568)
Net investment income 7,295,716 1,473,401 8,769,117
Total additions 9,870,187 1,473,401 11,343,588
DEDUCTIONS
Benefits paid 2,426,180 - 2,426,180
Premiums paid - 214,561 214,561
Administrative expenses 40,825 8,244 49,069
Total deductions 2,467,005 222,805 2,689,810
Net Increase (decrease) in Net Position 7,403,182 1,250,596 8,653,778
Net Position - Beginning of period 44,611,273 9,184,542 53,795,815
Net Position - End of period 52,014,455$ 10,435,138$ 62,449,593$
Atlanta Regional Commission
Combining Statement of Changes in Fiduciary Net Position
Defined Benefit Pension Plan
and OPEB Trust Fund
For the Year Ended December 31, 2017
86
This part of Atlanta Regional Commission’s Comprehensive Annual Financial Report presents
detailed information as a context for understanding what the information in the financial
statement, note disclosures, and required supplementary information says about the agency’s
overall financial health.
Contents Page
Financial Trends
These schedules contain trend information to help the reader understand how the
Agency’s financial performance and well-being have changed over time. 89
Revenue Capacity
This schedule contains information to help the readers assess the Commission’s
General Fund revenues from external sources. 96
Demographic and Economic Information
These schedules offer demographic and economic indicators to help the reader
understand the environment within which the commission’s financial activities take
place. 97
Operating Information
These schedules contain service and infrastructure data to help the reader
understand how the information in the commission’s financial report relates to the
services the commission provides and the activities it performs. 107
Except where noted, the information in these schedules is derived from the Atlanta Regional
Commission’s comprehensive annual financial reports for the relevant year.
87

Intentionally Blank
88
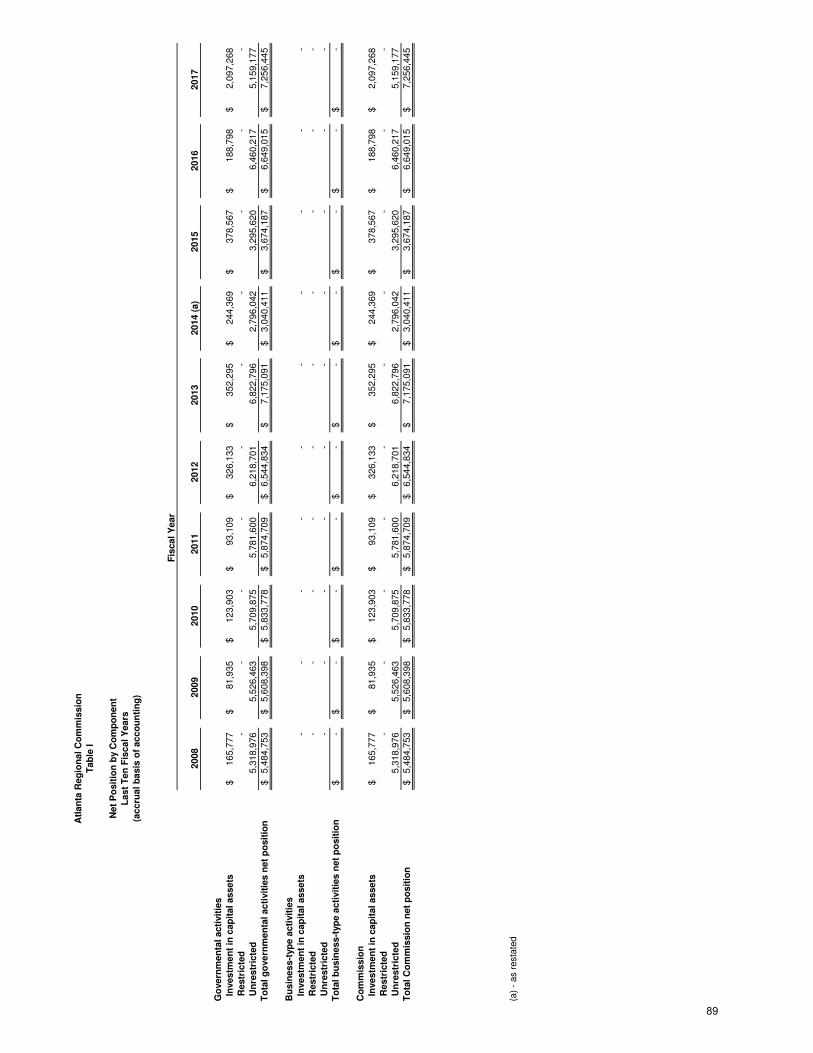
Atl
an
ta R
eg
ion
al C
om
mis
sio
n
Tab
le I
Net
Po
sit
ion
by C
om
po
nen
t
Last
Ten
Fis
cal Y
ears
(accru
al b
asis
of
acco
un
tin
g)
Fis
cal Y
ear
2008
2009
2010
2011
2012
2013
2014 (
a)
2015
2016
2017
Go
vern
men
tal acti
vit
ies
In
vestm
en
t in
cap
ital assets
165,7
77
$
81,9
35
$
123,9
03
$
93,1
09
$
326,1
33
$
352,2
95
$
244,3
69
$
378,5
67
$
188,7
98
$
2,0
97,2
68
$
R
estr
icte
d-
-
-
-
-
-
-
-
-
-
U
nre
str
icte
d5,3
18,9
76
5,5
26,4
63
5,7
09,8
75
5,7
81,6
00
6,2
18,7
01
6,8
22,7
96
2,7
96,0
42
3,2
95,6
20
6,4
60,2
17
5,1
59,1
77
To
tal g
overn
men
tal acti
vit
ies n
et
po
sit
ion
5,4
84,7
53
$
5,6
08,3
98
$
5,8
33,7
78
$
5,8
74,7
09
$
6,5
44,8
34
$
7,1
75,0
91
$
3,0
40,4
11
$
3,6
74,1
87
$
6,6
49,0
15
$
7,2
56,4
45
$
Bu
sin
ess-t
yp
e a
cti
vit
ies
In
vestm
en
t in
cap
ital assets
-
-
-
-
-
-
-
-
-
-
R
estr
icte
d-
-
-
-
-
-
-
-
-
-
U
nre
str
icte
d-
-
-
-
-
-
-
-
-
-
To
tal b
usin
ess-t
yp
e a
cti
vit
ies n
et
po
sit
ion
-$
-$
-$
-$
-$
-$
-$
-$
-$
-$
Co
mm
issio
n
In
vestm
en
t in
cap
ital assets
165,7
77
$
81,9
35
$
123,9
03
$
93,1
09
$
326,1
33
$
352,2
95
$
244,3
69
$
378,5
67
$
188,7
98
$
2,0
97,2
68
$
R
estr
icte
d-
-
-
-
-
-
-
-
-
-
U
nre
str
icte
d5,3
18,9
76
5,5
26,4
63
5,7
09,8
75
5,7
81,6
00
6,2
18,7
01
6,8
22,7
96
2,7
96,0
42
3,2
95,6
20
6,4
60,2
17
5,1
59,1
77
To
tal C
om
mis
sio
n n
et
po
sit
ion
5,4
84,7
53
$
5,6
08,3
98
$
5,8
33,7
78
$
5,8
74,7
09
$
6,5
44,8
34
$
7,1
75,0
91
$
3,0
40,4
11
$
3,6
74,1
87
$
6,6
49,0
15
$
7,2
56,4
45
$
(a)
- as r
esta
ted
89
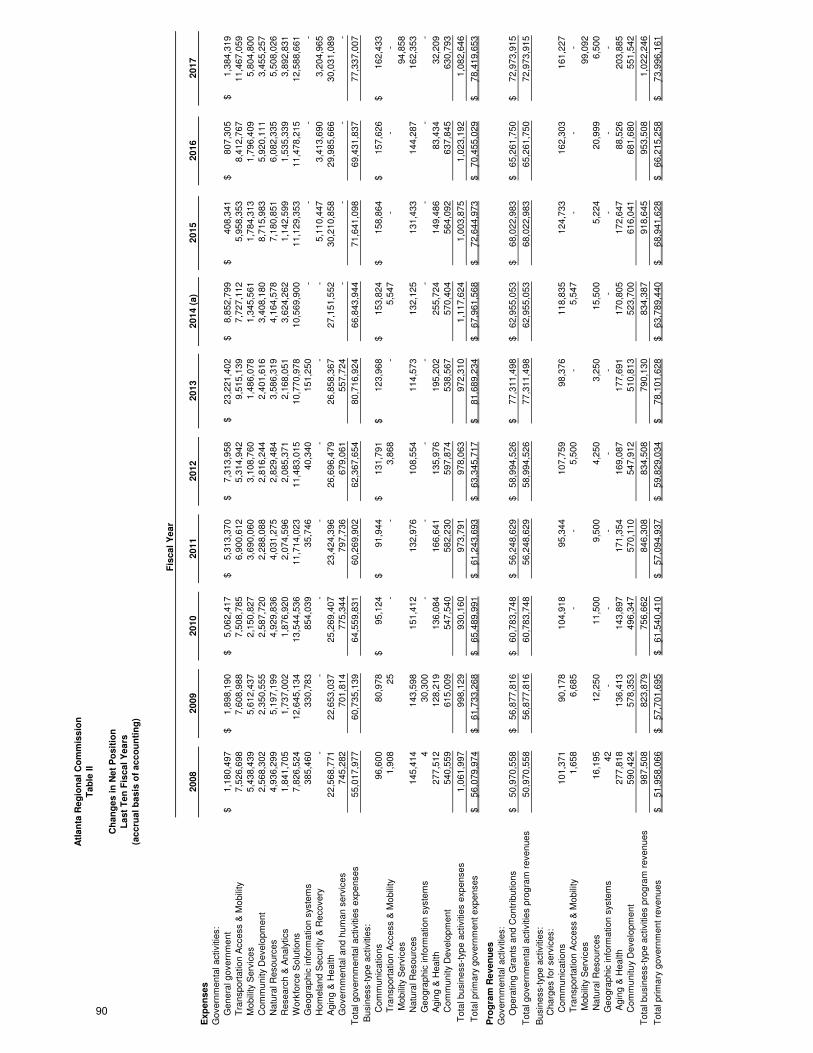
Atl
an
ta R
eg
ion
al
Co
mm
iss
ion
Ta
ble
II
Ch
an
ge
s i
n N
et
Po
sit
ion
La
st
Te
n F
isc
al
Ye
ars
(ac
cru
al
ba
sis
of
ac
co
un
tin
g)
Fis
ca
l Y
ea
r
20
08
20
09
20
10
20
11
20
12
20
13
20
14
(a
)2
01
52
01
62
01
7
Ex
pe
ns
es
Go
ve
rnm
en
tal a
ctivitie
s:
Ge
ne
ral g
ove
rnm
en
t1
,18
0,4
97
$
1
,89
8,1
90
$
5,0
62
,41
7$
5
,31
3,3
70
$
7,3
13
,95
8$
2
3,2
21
,40
2$
8
,85
2,7
99
$
40
8,3
41
$
8
07
,30
5$
1
,38
4,3
19
$
Tra
nsp
ort
atio
n A
cce
ss &
Mo
bili
ty7
,52
6,6
98
7
,60
8,9
88
7,5
08
,78
5
6
,90
0,6
12
5,3
14
,94
2
9
,51
5,1
39
7
,72
7,1
12
5,9
58
,35
3
8,4
12
,76
7
1
1,4
67
,05
9
Mo
bili
ty S
erv
ice
s5
,43
8,4
39
5
,61
2,4
37
2,1
50
,82
7
3
,69
0,0
60
3,1
08
,76
0
1
,48
6,0
78
1
,34
5,5
61
1,7
84
,31
3
1,7
96
,40
9
5
,80
4,8
00
Co
mm
un
ity
De
ve
lop
me
nt
2,5
68
,30
2
2,3
50
,55
5
2
,58
7,7
20
2,2
88
,08
8
2
,81
6,2
44
2,4
01
,61
6
3,4
08
,18
0
8
,71
5,9
83
5
,92
0,1
11
3,4
55
,25
7
Na
tura
l R
eso
urc
es
4,9
36
,29
9
5,1
97
,19
9
4
,92
9,8
36
4,0
31
,27
5
2
,82
9,4
84
3,5
86
,31
9
4,1
64
,57
8
7
,18
0,8
51
6
,08
2,3
35
5,5
08
,02
6
Re
se
arc
h &
An
aly
tics
1,8
41
,70
5
1,7
37
,00
2
1
,87
6,9
20
2,0
74
,59
6
2
,08
5,3
71
2,1
68
,05
1
3,6
24
,26
2
1
,14
2,5
99
1
,53
5,3
39
3,8
92
,83
1
Wo
rkfo
rce
So
lutio
ns
7,8
26
,52
4
12
,64
5,1
34
1
3,5
44
,53
6
11
,71
4,0
23
1
1,4
83
,01
5
10
,77
0,9
78
10
,56
9,9
00
1
1,1
29
,35
3
1
1,4
78
,21
5
12
,58
8,6
61
Ge
og
rap
hic
in
form
atio
n s
yste
ms
38
5,4
60
33
0,7
83
85
4,0
39
35
,74
6
40
,34
0
15
1,2
50
-
-
-
-
Ho
me
lan
d S
ecu
rity
& R
eco
ve
ry-
-
-
-
-
-
-
5
,11
0,4
47
3
,41
3,6
90
3,2
04
,96
5
Ag
ing
& H
ea
lth
22
,56
8,7
71
22
,65
3,0
37
2
5,2
69
,40
7
23
,42
4,3
96
2
6,6
96
,47
9
26
,85
8,3
67
27
,15
1,5
52
3
0,2
10
,85
8
2
9,9
85
,66
6
30
,03
1,0
89
Go
ve
rnm
en
tal a
nd
hu
ma
n s
erv
ice
s7
45
,28
2
7
01
,81
4
7
75
,34
4
7
97
,73
6
6
79
,06
1
5
57
,72
4
-
-
-
-
To
tal g
ove
rnm
en
tal a
ctivitie
s e
xpe
nse
s5
5,0
17
,97
7
6
0,7
35
,13
9
64
,55
9,8
31
6
0,2
69
,90
2
62
,36
7,6
54
8
0,7
16
,92
4
6
6,8
43
,94
4
71
,64
1,0
98
69
,43
1,8
37
7
7,3
37
,00
7
Bu
sin
ess-t
ype
activitie
s:
Co
mm
un
ica
tio
ns
96
,60
0
80
,97
8
95
,12
4$
91
,94
4$
13
1,7
91
$
12
3,9
68
$
1
53
,82
4$
1
58
,86
4$
15
7,6
26
$
16
2,4
33
$
Tra
nsp
ort
atio
n A
cce
ss &
Mo
bili
ty1
,90
8
2
5
-
-
3
,86
8
-
5
,54
7
-
-
-
M
ob
ility
Se
rvic
es
94
,85
8
Na
tura
l R
eso
urc
es
14
5,4
14
14
3,5
98
15
1,4
12
13
2,9
76
10
8,5
54
11
4,5
73
1
32
,12
5
1
31
,43
3
14
4,2
87
16
2,3
53
Ge
og
rap
hic
in
form
atio
n s
yste
ms
4
3
0,3
00
-
-
-
-
-
-
-
-
Ag
ing
& H
ea
lth
27
7,5
12
12
8,2
19
13
6,0
84
16
6,6
41
13
5,9
76
19
5,2
02
2
55
,72
4
1
49
,48
6
83
,43
4
32
,20
9
Co
mm
un
ity
De
ve
lop
me
nt
54
0,5
59
61
5,0
09
54
7,5
40
58
2,2
30
59
7,8
74
53
8,5
67
5
70
,40
4
5
64
,09
2
63
7,8
45
63
0,7
93
To
tal b
usin
ess-t
ype
activitie
s e
xpe
nse
s1
,06
1,9
97
9
98
,12
9
9
30
,16
0
9
73
,79
1
9
78
,06
3
9
72
,31
0
1,1
17
,62
4
1
,00
3,8
75
1
,02
3,1
92
1,0
82
,64
6
To
tal p
rim
ary
go
ve
rnm
en
t e
xpe
nse
s5
6,0
79
,97
4$
6
1,7
33
,26
8$
65
,48
9,9
91
$
6
1,2
43
,69
3$
63
,34
5,7
17
$
8
1,6
89
,23
4$
6
7,9
61
,56
8$
72
,64
4,9
73
$
70
,45
5,0
29
$
7
8,4
19
,65
3$
Pro
gra
m R
eve
nu
es
Go
ve
rnm
en
tal a
ctivitie
s:
Op
era
tin
g G
ran
ts a
nd
Co
ntr
ibu
tio
ns
50
,97
0,5
58
$
56
,87
7,8
16
$
6
0,7
83
,74
8$
56
,24
8,6
29
$
5
8,9
94
,52
6$
77
,31
1,4
98
$
62
,95
5,0
53
$
6
8,0
22
,98
3$
6
5,2
61
,75
0$
72
,97
3,9
15
$
To
tal g
ove
rnm
en
tal a
ctivitie
s p
rog
ram
re
ve
nu
es
50
,97
0,5
58
56
,87
7,8
16
6
0,7
83
,74
8
56
,24
8,6
29
5
8,9
94
,52
6
77
,31
1,4
98
62
,95
5,0
53
6
8,0
22
,98
3
6
5,2
61
,75
0
72
,97
3,9
15
Bu
sin
ess-t
ype
activitie
s:
Ch
arg
es f
or
se
rvic
es:
Co
mm
un
ica
tio
ns
10
1,3
71
90
,17
8
10
4,9
18
95
,34
4
10
7,7
59
98
,37
6
1
18
,83
5
1
24
,73
3
16
2,3
03
16
1,2
27
Tra
nsp
ort
atio
n A
cce
ss &
Mo
bili
ty1
,65
8
6
,68
5
-
-
5
,50
0
-
5
,54
7
-
-
-
M
ob
ility
Se
rvic
es
99
,09
2
N
atu
ral R
eso
urc
es
16
,19
5
12
,25
0
11
,50
0
9,5
00
4,2
50
3,2
50
1
5,5
00
5
,22
4
20
,99
9
6,5
00
Ge
og
rap
hic
in
form
atio
n s
yste
ms
42
-
-
-
-
-
-
-
-
-
A
gin
g &
He
alth
27
7,8
18
13
6,4
13
14
3,8
97
17
1,3
54
16
9,0
87
17
7,6
91
1
70
,80
5
1
72
,64
7
88
,52
6
20
3,8
85
Co
mm
un
itu
y D
eve
lop
me
nt
59
0,4
24
57
8,3
53
49
6,3
47
57
0,1
10
54
7,9
12
51
0,8
13
5
23
,70
0
6
16
,04
1
68
1,6
80
55
1,5
42
To
tal b
usin
ess-t
ype
activitie
s p
rog
ram
re
ve
nu
es
98
7,5
08
82
3,8
79
75
6,6
62
84
6,3
08
83
4,5
08
79
0,1
30
8
34
,38
7
9
18
,64
5
95
3,5
08
1,0
22
,24
6
To
tal p
rim
ary
go
ve
rnm
en
t re
ve
nu
es
51
,95
8,0
66
$
57
,70
1,6
95
$
6
1,5
40
,41
0$
57
,09
4,9
37
$
5
9,8
29
,03
4$
78
,10
1,6
28
$
63
,78
9,4
40
$
6
8,9
41
,62
8$
6
6,2
15
,25
8$
73
,99
6,1
61
$
90
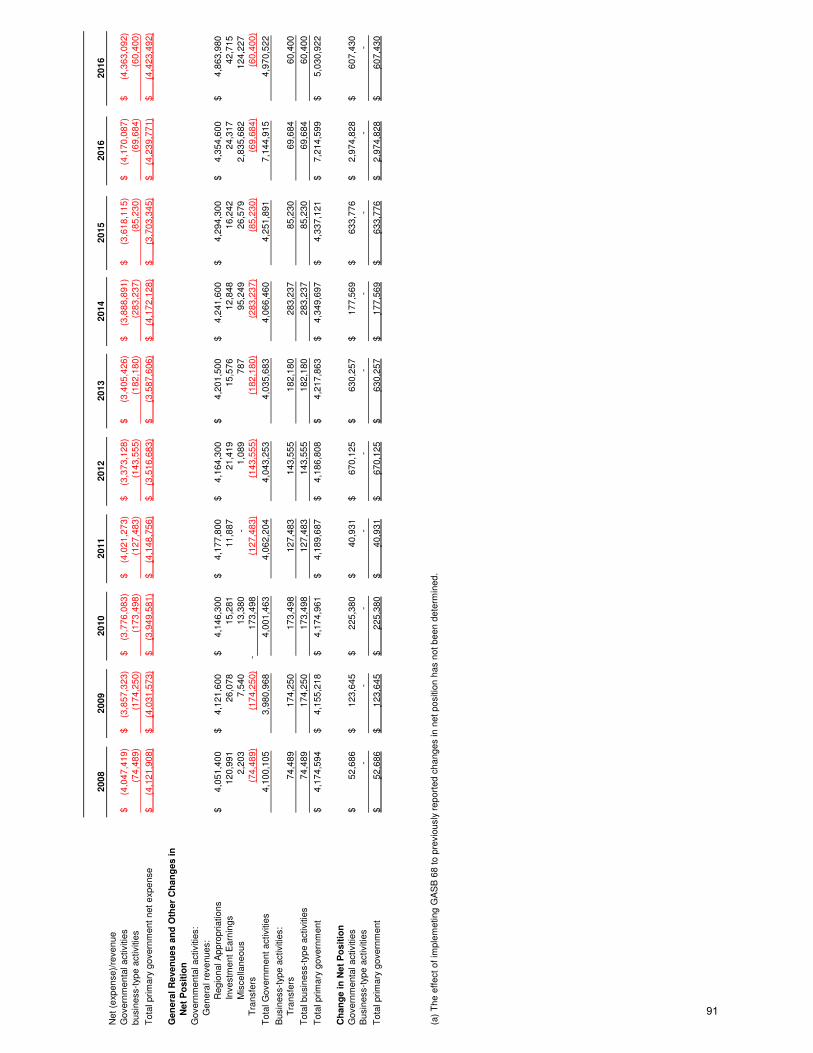
20
08
20
09
20
10
20
11
20
12
20
13
20
14
20
15
20
16
20
16
Ne
t (e
xpe
nse
)/re
ve
nu
e
Go
ve
rnm
en
tal a
ctivitie
s(4
,04
7,4
19
)$
(3
,85
7,3
23
)$
(3
,77
6,0
83
)$
(4
,02
1,2
73
)$
(3
,37
3,1
28
)$
(3
,40
5,4
26
)$
(3,8
88
,89
1)
$
(3,6
18
,11
5)
$
(4
,17
0,0
87
)$
(4
,36
3,0
92
)$
bu
sin
ess-t
ype
activitie
s(7
4,4
89
)
(1
74
,25
0)
(1
73
,49
8)
(1
27
,48
3)
(1
43
,55
5)
(1
82
,18
0)
(28
3,2
37
)
(85
,23
0)
(6
9,6
84
)
(6
0,4
00
)
To
tal p
rim
ary
go
ve
rnm
en
t n
et
exp
en
se
(4,1
21
,90
8)
$
(4,0
31
,57
3)
$
(3,9
49
,58
1)
$
(4,1
48
,75
6)
$
(3,5
16
,68
3)
$
(3,5
87
,60
6)
$
(4
,17
2,1
28
)$
(3
,70
3,3
45
)$
(4,2
39
,77
1)
$
(4,4
23
,49
2)
$
Ge
ne
ral
Re
ve
nu
es
an
d O
the
r C
ha
ng
es
in
Ne
t P
os
itio
n
Go
ve
rnm
en
tal a
ctivitie
s:
Ge
ne
ral re
ve
nu
es:
Re
gio
na
l A
pp
rop
ria
tio
ns
4,0
51
,40
0$
4,1
21
,60
0$
4
,14
6,3
00
$
4,1
77
,80
0$
4
,16
4,3
00
$
4,2
01
,50
0$
4,2
41
,60
0$
4
,29
4,3
00
$
4
,35
4,6
00
$
4,8
63
,98
0$
Inve
stm
en
t E
arn
ing
s1
20
,99
1
2
6,0
78
1
5,2
81
1
1,8
87
2
1,4
19
1
5,5
76
12
,84
8
16
,24
2
2
4,3
17
4
2,7
15
Mis
ce
llan
eo
us
2,2
03
7,5
40
13
,38
0
-
1
,08
9
7
87
95
,24
9
26
,57
9
2
,83
5,6
82
12
4,2
27
Tra
nsfe
rs(7
4,4
89
)(1
74
,25
0)
17
3,4
98
-
(12
7,4
83
)(1
43
,55
5)
(18
2,1
80
)(2
83
,23
7)
(85
,23
0)
(69
,68
4)
(60
,40
0)
To
tal G
ove
rnm
en
t a
ctivitie
s4
,10
0,1
05
3
,98
0,9
68
4,0
01
,46
3
4
,06
2,2
04
4,0
43
,25
3
4
,03
5,6
83
4
,06
6,4
60
4,2
51
,89
1
7,1
44
,91
5
4
,97
0,5
22
Bu
sin
ess-t
ype
activitie
s:
Tra
nsfe
rs7
4,4
89
1
74
,25
0
1
73
,49
8
1
27
,48
3
1
43
,55
5
1
82
,18
0
28
3,2
37
85
,23
0
6
9,6
84
6
0,4
00
To
tal b
usin
ess-t
ype
activitie
s7
4,4
89
1
74
,25
0
1
73
,49
8
1
27
,48
3
1
43
,55
5
1
82
,18
0
28
3,2
37
85
,23
0
6
9,6
84
6
0,4
00
To
tal p
rim
ary
go
ve
rnm
en
t4
,17
4,5
94
$
4
,15
5,2
18
$
4,1
74
,96
1$
4
,18
9,6
87
$
4,1
86
,80
8$
4
,21
7,8
63
$
4
,34
9,6
97
$
4,3
37
,12
1$
7,2
14
,59
9$
5
,03
0,9
22
$
Ch
an
ge
in
Ne
t P
os
itio
n
Go
ve
rnm
en
tal a
ctivitie
s5
2,6
86
$
1
23
,64
5$
2
25
,38
0$
4
0,9
31
$
6
70
,12
5$
6
30
,25
7$
17
7,5
69
$
63
3,7
76
$
2
,97
4,8
28
$
60
7,4
30
$
Bu
sin
ess-t
ype
activitie
s-
-
-
-
-
-
-
-
-
-
To
tal p
rim
ary
go
ve
rnm
en
t5
2,6
86
$
1
23
,64
5$
2
25
,38
0$
4
0,9
31
$
6
70
,12
5$
6
30
,25
7$
17
7,5
69
$
63
3,7
76
$
2
,97
4,8
28
$
60
7,4
30
$
(a)
Th
e e
ffe
ct
of
imp
lem
etin
g G
AS
B 6
8 t
o p
revio
usly
re
po
rte
d c
ha
ng
es in
ne
t p
ositio
n h
as n
ot
be
en
de
term
ine
d.
91
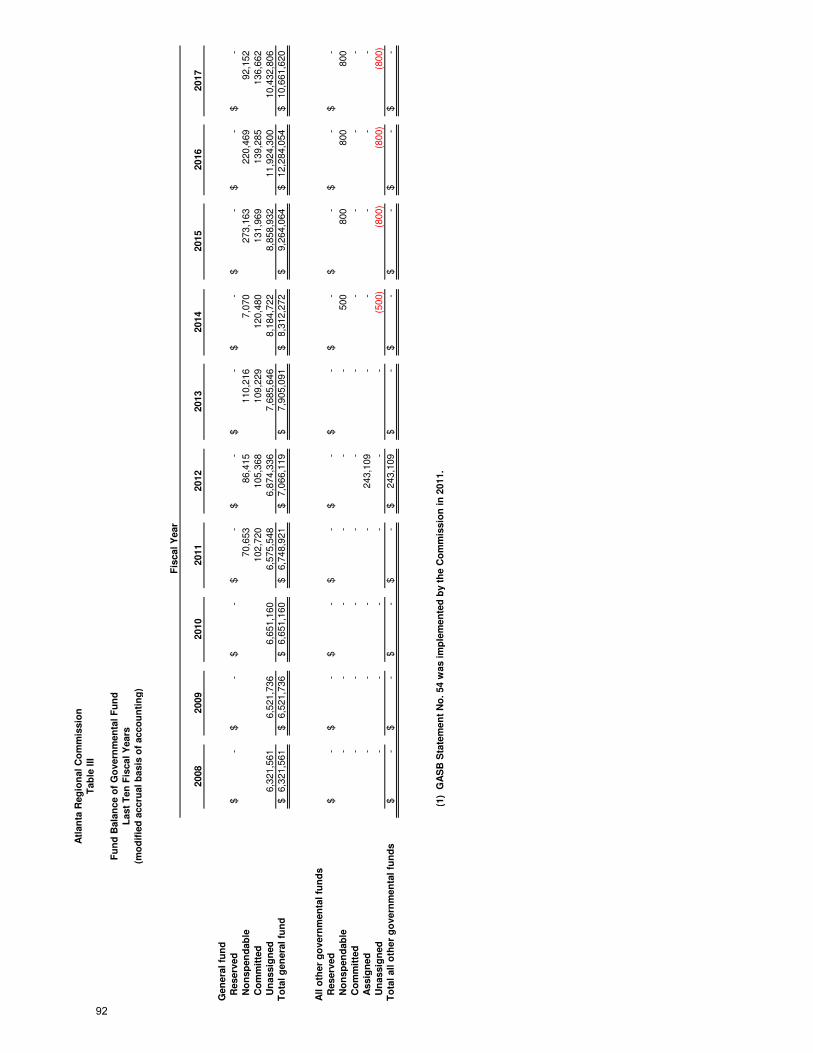
Atl
an
ta R
eg
ion
al
Co
mm
issio
n
Tab
le I
II
Fu
nd
Bala
nce o
f G
overn
men
tal
Fu
nd
Last
Ten
Fis
cal
Years
(mo
dif
ied
accru
al
basis
of
acco
un
tin
g)
Fis
cal
Year
2008
2009
2010
2011
2012
2013
2014
2015
2016
2017
Gen
era
l fu
nd
R
eserv
ed
-$
-$
-$
-$
-$
-$
-$
-$
-$
-
$
N
on
sp
en
dab
le70,6
53
86,4
15
110,2
16
7,0
70
273,1
63
220,4
69
92,1
52
C
om
mit
ted
102,7
20
105,3
68
109,2
29
120,4
80
131,9
69
139,2
85
136,6
62
U
nassig
ned
6,3
21,5
61
6,5
21,7
36
6,6
51,1
60
6,5
75,5
48
6,8
74,3
36
7,6
85,6
46
8,1
84,7
22
8,8
58,9
32
11,9
24,3
00
10,4
32,8
06
T
ota
l g
en
era
l fu
nd
6,3
21,5
61
$
6,5
21,7
36
$
6,6
51,1
60
$
6,7
48,9
21
$
7,0
66,1
19
$
7,9
05,0
91
$
8,3
12,2
72
$
9,2
64,0
64
$
12,2
84,0
54
$
10,6
61,6
20
$
All
oth
er
go
vern
men
tal
fun
ds
R
eserv
ed
-$
-$
-$
-$
-$
-$
-$
-$
-$
-
$
N
on
sp
en
dab
le-
-
-
-
-
-
500
800
800
800
C
om
mit
ted
-
-
-
-
-
-
-
-
-
-
A
ssig
ned
-
-
-
-
243,1
09
-
-
-
-
-
U
nassig
ned
-
-
-
-
-
-
(500)
(8
00)
(8
00)
(800)
To
tal
all
oth
er
go
vern
men
tal
fun
ds
-$
-$
-$
-$
243,1
09
$
-$
-$
-$
-$
-
$
(1)
GA
SB
Sta
tem
en
t N
o.
54 w
as i
mp
lem
en
ted
by t
he C
om
mis
sio
n i
n 2
011.
92
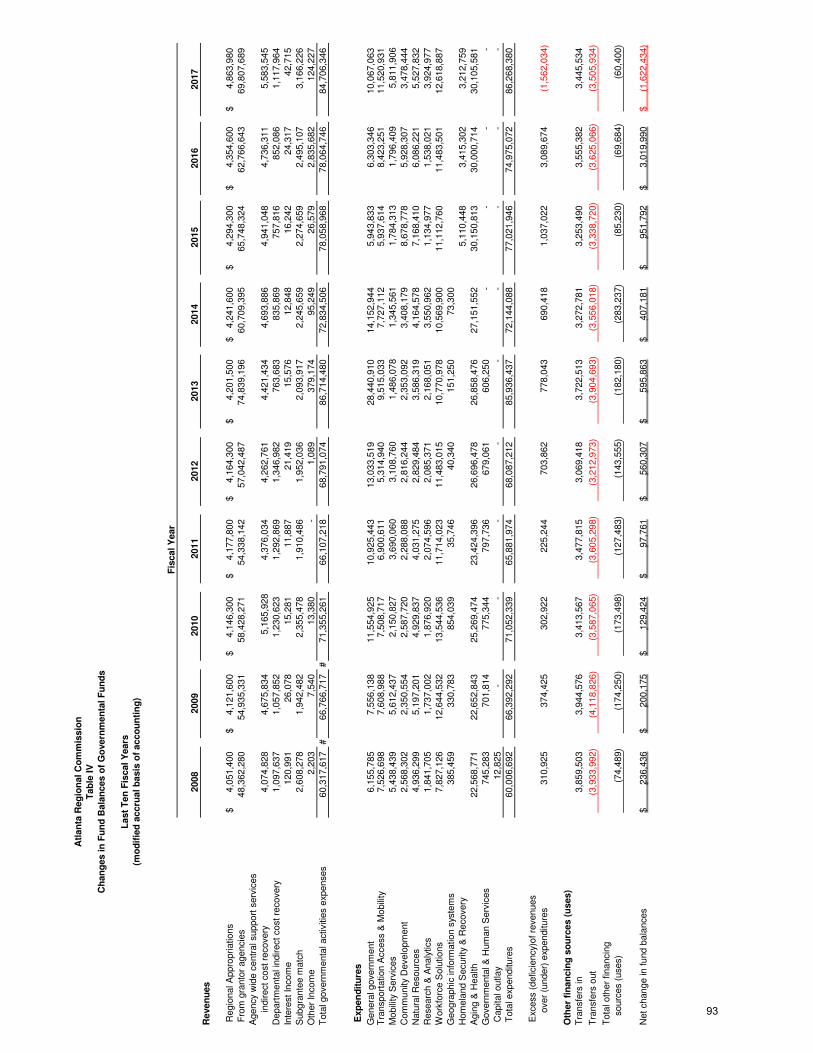
Atl
an
ta R
eg
ion
al C
om
mis
sio
n
Tab
le IV
Ch
an
ges in
Fu
nd
Bala
nces o
f G
overn
men
tal F
un
ds
Last
Ten
Fis
cal Y
ears
(mo
dif
ied
accru
al b
asis
of
acco
un
tin
g)
Fis
cal Y
ear
2008
2009
2010
2011
2012
2013
2014
2015
2016
2017
Reven
ues
Regio
nal A
ppro
priations
4,0
51,4
00
$
4,1
21,6
00
$
4,1
46,3
00
$
4,1
77,8
00
$
4,1
64,3
00
$
4,2
01,5
00
$
4,2
41,6
00
$
4,2
94,3
00
$
4,3
54,6
00
$
4,8
63,9
80
$
Fro
m g
ranto
r agencie
s48,3
62,2
80
54,9
35,3
31
58,4
28,2
71
54,3
38,1
42
57,0
42,4
87
74,8
39,1
96
60,7
09,3
95
65,7
48,3
24
62,7
66,6
43
69,8
07,6
89
Agency
wid
e c
entr
al support
serv
ices
indirect cost re
covery
4,0
74,8
28
4,6
75,8
34
5,1
65,9
28
4,3
76,0
34
4,2
62,7
61
4,4
21,4
34
4,6
93,8
86
4,9
41,0
48
4,7
36,3
11
5,5
83,5
45
Depart
menta
l in
direct cost re
covery
1,0
97,6
37
1,0
57,8
52
1,2
30,6
23
1,2
92,8
69
1,3
46,9
82
763,6
83
835,8
69
757,8
16
852,0
86
1,1
17,9
64
Inte
rest In
com
e120,9
91
26,0
78
15,2
81
11,8
87
21,4
19
15,5
76
12,8
48
16,2
42
24,3
17
42,7
15
Subgra
nte
e m
atc
h2,6
08,2
78
1,9
42,4
82
2,3
55,4
78
1,9
10,4
86
1,9
52,0
36
2,0
93,9
17
2,2
45,6
59
2,2
74,6
59
2,4
95,1
07
3,1
66,2
26
Oth
er
Incom
e2,2
03
7,5
40
13,3
80
-
1,0
89
379,1
74
95,2
49
26,5
79
2,8
35,6
82
124,2
27
Tota
l govern
menta
l activitie
s e
xpenses
60,3
17,6
17
#66,7
66,7
17
#71,3
55,2
61
66,1
07,2
18
68,7
91,0
74
86,7
14,4
80
72,8
34,5
06
78,0
58,9
68
78,0
64,7
46
84,7
06,3
46
Exp
en
dit
ure
s
Genera
l govern
ment
6,1
55,7
85
7,5
56,1
38
11,5
54,9
25
10,9
25,4
43
13,0
33,5
19
28,4
40,9
10
14,1
52,9
44
5,9
43,8
33
6,3
03,3
46
10,0
67,0
63
Tra
nsport
ation A
ccess &
Mobili
ty7,5
26,6
98
7,6
08,9
88
7,5
08,7
17
6,9
00,6
11
5,3
14,9
40
9,5
15,0
33
7,7
27,1
12
5,9
37,6
14
8,4
23,2
51
11,5
20,9
31
Mobili
ty S
erv
ices
5,4
38,4
39
5,6
12,4
37
2,1
50,8
27
3,6
90,0
60
3,1
08,7
60
1,4
86,0
78
1,3
45,5
61
1,7
84,3
13
1,7
96,4
09
5,8
11,9
06
Com
munity
Develo
pm
ent
2,5
68,3
02
2,3
50,5
54
2,5
87,7
20
2,2
88,0
88
2,8
16,2
44
2,3
53,0
92
3,4
08,1
79
8,6
78,7
78
5,9
28,3
07
3,4
78,4
44
Natu
ral R
esourc
es
4,9
36,2
99
5,1
97,2
01
4,9
29,8
37
4,0
31,2
75
2,8
29,4
84
3,5
86,3
19
4,1
64,5
78
7,1
68,4
10
6,0
86,2
21
5,5
27,8
32
Researc
h &
Analy
tics
1,8
41,7
05
1,7
37,0
02
1,8
76,9
20
2,0
74,5
96
2,0
85,3
71
2,1
68,0
51
3,5
50,9
62
1,1
34,9
77
1,5
38,0
21
3,9
24,9
77
Work
forc
e S
olu
tions
7,8
27,1
26
12,6
44,5
32
13,5
44,5
36
11,7
14,0
23
11,4
83,0
15
10,7
70,9
78
10,5
69,9
00
11,1
12,7
60
11,4
83,5
01
12,6
18,8
87
Geogra
phic
info
rmation s
yste
ms
385,4
59
330,7
83
854,0
39
35,7
46
40,3
40
151,2
50
73,3
00
Hom
ela
nd S
ecurity
& R
ecovery
5,1
10,4
48
3,4
15,3
02
3,2
12,7
59
Agin
g &
Health
22,5
68,7
71
22,6
52,8
43
25,2
69,4
74
23,4
24,3
96
26,6
96,4
78
26,8
58,4
76
27,1
51,5
52
30,1
50,8
13
30,0
00,7
14
30,1
05,5
81
Govern
menta
l &
Hum
an S
erv
ices
745,2
83
701,8
14
775,3
44
797,7
36
679,0
61
606,2
50
-
-
-
-
Capital outlay
12,8
25
-
-
-
-
-
-
-
-
-
Tota
l exp
enditure
s60,0
06,6
92
66,3
92,2
92
71,0
52,3
39
65,8
81,9
74
68,0
87,2
12
85,9
36,4
37
72,1
44,0
88
77,0
21,9
46
74,9
75,0
72
86,2
68,3
80
Exc
ess (
deficie
ncy)
of re
venues
over
(under)
exp
enditure
s310,9
25
374,4
25
302,9
22
225,2
44
703,8
62
778,0
43
690,4
18
1,0
37,0
22
3,0
89,6
74
(1,5
62,0
34)
Oth
er
fin
an
cin
g s
ou
rces (
uses)
Tra
nsfe
rs in
3,8
59,5
03
3,9
44,5
76
3,4
13,5
67
3,4
77,8
15
3,0
69,4
18
3,7
22,5
13
3,2
72,7
81
3,2
53,4
90
3,5
55,3
82
3,4
45,5
34
Tra
nsfe
rs o
ut
(3,9
33,9
92)
(4,1
18,8
26)
(3,5
87,0
65)
(3,6
05,2
98)
(3,2
12,9
73)
(3,9
04,6
93)
(3,5
56,0
18)
(3,3
38,7
20)
(3,6
25,0
66)
(3,5
05,9
34)
Tota
l oth
er
financin
g
sourc
es (
uses)
(74,4
89)
(174,2
50)
(173,4
98)
(127,4
83)
(143,5
55)
(182,1
80)
(283,2
37)
(85,2
30)
(69,6
84)
(60,4
00)
Net change in fund b
ala
nces
236,4
36
$
200,1
75
$
129,4
24
$
97,7
61
$
560,3
07
$
595,8
63
$
407,1
81
$
951,7
92
$
3,0
19,9
90
$
(1,6
22,4
34)
$
93
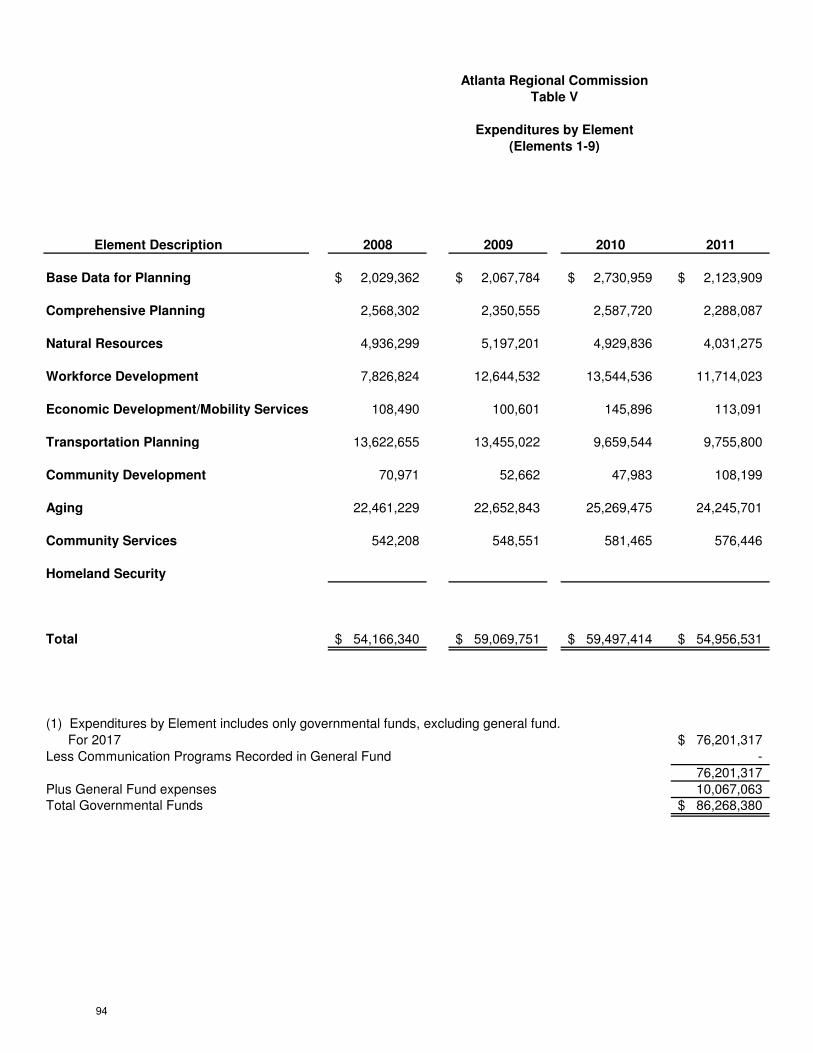
Atlanta Regional Commission
Table V
Expenditures by Element
(Elements 1-9)
Element Description 2008 2009 2010 2011
Base Data for Planning 2,029,362$ 2,067,784$ 2,730,959$ 2,123,909$
Comprehensive Planning 2,568,302 2,350,555 2,587,720 2,288,087
Natural Resources 4,936,299 5,197,201 4,929,836 4,031,275
Workforce Development 7,826,824 12,644,532 13,544,536 11,714,023
Economic Development/Mobility Services 108,490 100,601 145,896 113,091
Transportation Planning 13,622,655 13,455,022 9,659,544 9,755,800
Community Development 70,971 52,662 47,983 108,199
Aging 22,461,229 22,652,843 25,269,475 24,245,701
Community Services 542,208 548,551 581,465 576,446
Homeland Security
Total 54,166,340$ 59,069,751$ 59,497,414$ 54,956,531$
(1) Expenditures by Element includes only governmental funds, excluding general fund.
For 2017 76,201,317$
Less Communication Programs Recorded in General Fund -
76,201,317
Plus General Fund expenses 10,067,063 Total Governmental Funds 86,268,380$
94
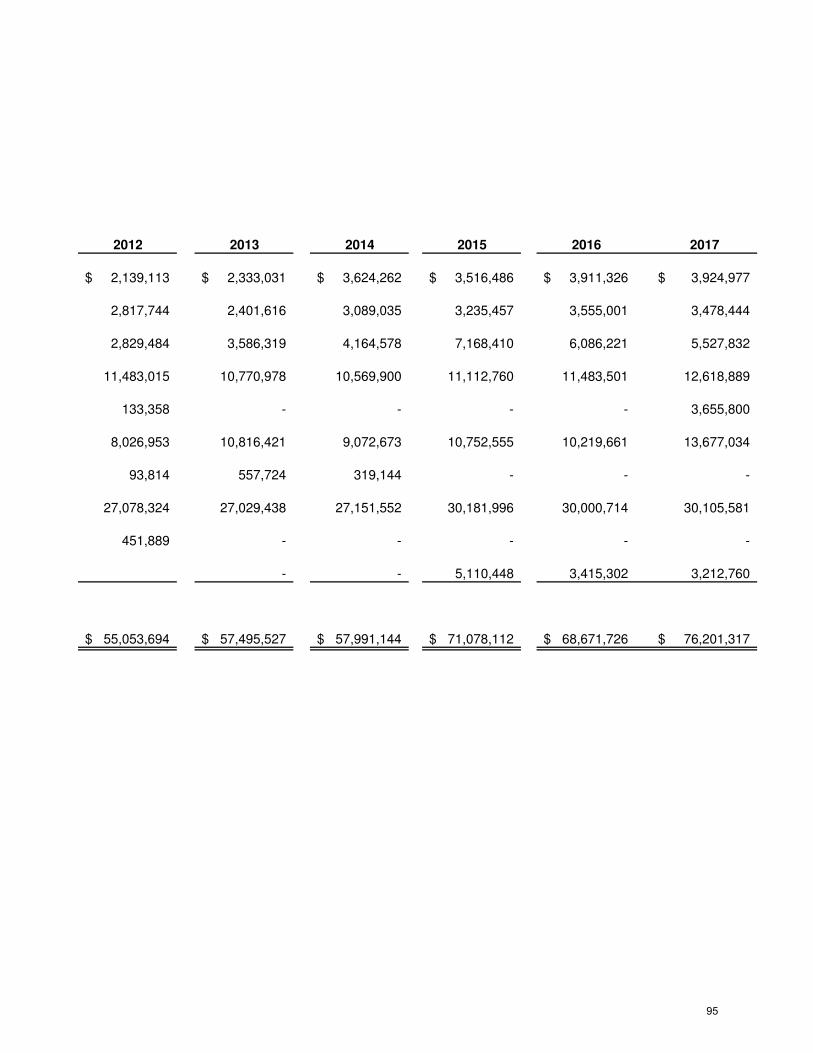
2012 2013 2014 2015 2016 2017
2,139,113$ 2,333,031$ 3,624,262$ 3,516,486$ 3,911,326$ 3,924,977$
2,817,744 2,401,616 3,089,035 3,235,457 3,555,001 3,478,444
2,829,484 3,586,319 4,164,578 7,168,410 6,086,221 5,527,832
11,483,015 10,770,978 10,569,900 11,112,760 11,483,501 12,618,889
133,358 - - - - 3,655,800
8,026,953 10,816,421 9,072,673 10,752,555 10,219,661 13,677,034
93,814 557,724 319,144 - - -
27,078,324 27,029,438 27,151,552 30,181,996 30,000,714 30,105,581
451,889 - - - - -
- - 5,110,448 3,415,302 3,212,760
55,053,694$ 57,495,527$ 57,991,144$ 71,078,112$ 68,671,726$ 76,201,317$
95
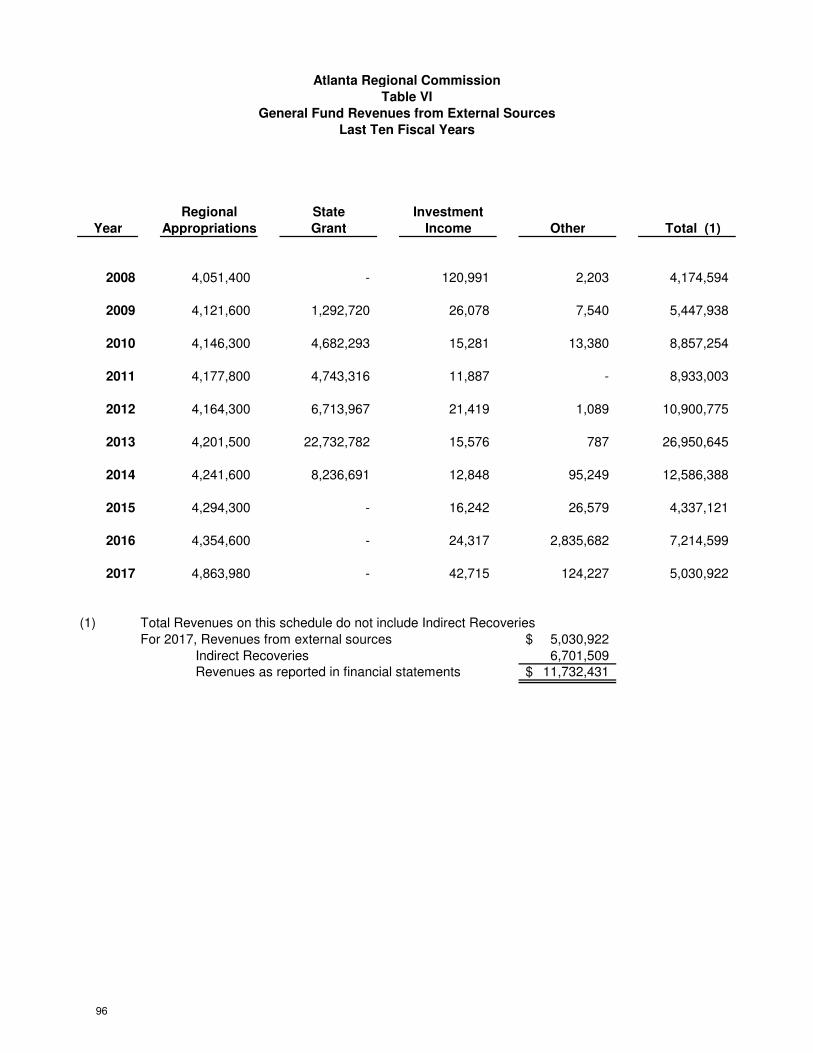
Atlanta Regional Commission
Table VI
General Fund Revenues from External Sources
Last Ten Fiscal Years
Regional State Investment
Year Appropriations Grant Income Other Total (1)
2008 4,051,400 - 120,991 2,203 4,174,594
2009 4,121,600 1,292,720 26,078 7,540 5,447,938
2010 4,146,300 4,682,293 15,281 13,380 8,857,254
2011 4,177,800 4,743,316 11,887 - 8,933,003
2012 4,164,300 6,713,967 21,419 1,089 10,900,775
2013 4,201,500 22,732,782 15,576 787 26,950,645
2014 4,241,600 8,236,691 12,848 95,249 12,586,388
2015 4,294,300 - 16,242 26,579 4,337,121
2016 4,354,600 - 24,317 2,835,682 7,214,599
2017 4,863,980 - 42,715 124,227 5,030,922
(1) Total Revenues on this schedule do not include Indirect Recoveries
For 2017, Revenues from external sources 5,030,922$
Indirect Recoveries 6,701,509 Revenues as reported in financial statements 11,732,431$
96
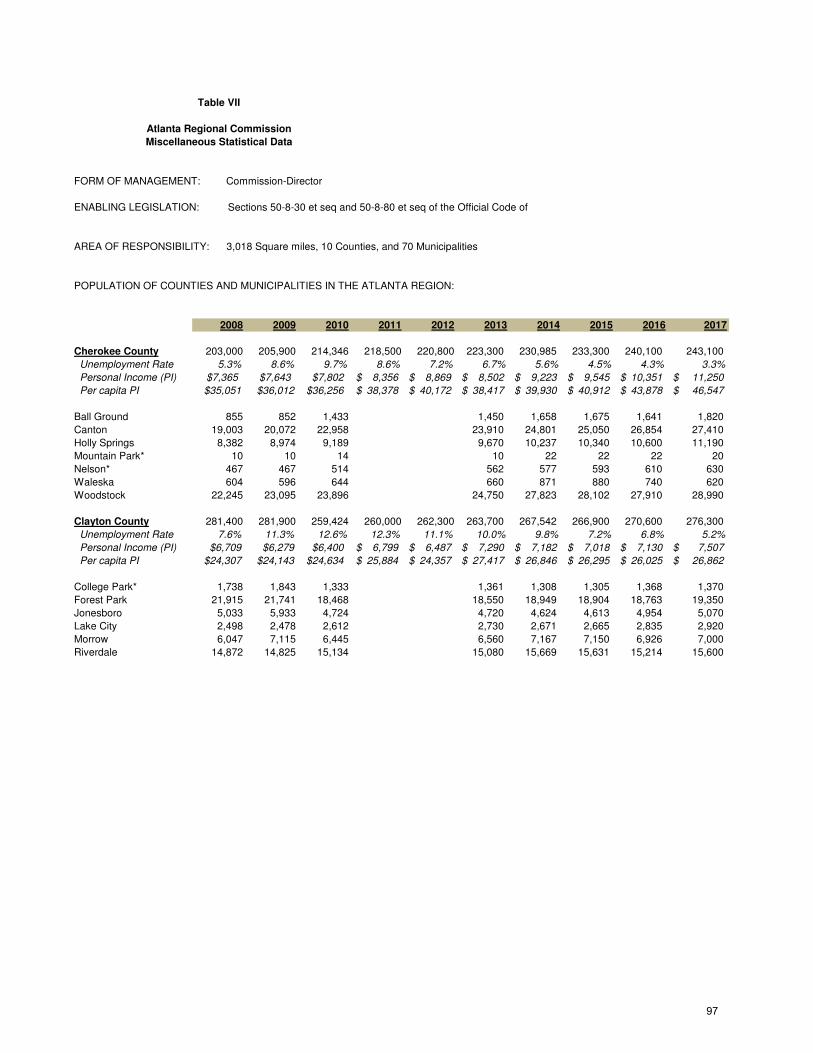
Table VII
Atlanta Regional Commission
Miscellaneous Statistical Data
FORM OF MANAGEMENT: Commission-Director
ENABLING LEGISLATION: Sections 50-8-30 et seq and 50-8-80 et seq of the Official Code of
AREA OF RESPONSIBILITY: 3,018 Square miles, 10 Counties, and 70 Municipalities
POPULATION OF COUNTIES AND MUNICIPALITIES IN THE ATLANTA REGION:
2008 2009 2010 2011 2012 2013 2014 2015 2016 2017
Cherokee County 203,000 205,900 214,346 218,500 220,800 223,300 230,985 233,300 240,100 243,100
Unemployment Rate 5.3% 8.6% 9.7% 8.6% 7.2% 6.7% 5.6% 4.5% 4.3% 3.3%
Personal Income (PI) $7,365 $7,643 $7,802 8,356$ 8,869$ 8,502$ 9,223$ 9,545$ 10,351$ 11,250$
Per capita PI $35,051 $36,012 $36,256 38,378$ 40,172$ 38,417$ 39,930$ 40,912$ 43,878$ 46,547$
Ball Ground 855 852 1,433 1,450 1,658 1,675 1,641 1,820
Canton 19,003 20,072 22,958 23,910 24,801 25,050 26,854 27,410
Holly Springs 8,382 8,974 9,189 9,670 10,237 10,340 10,600 11,190
Mountain Park* 10 10 14 10 22 22 22 20
Nelson* 467 467 514 562 577 593 610 630
Waleska 604 596 644 660 871 880 740 620
Woodstock 22,245 23,095 23,896 24,750 27,823 28,102 27,910 28,990
Clayton County 281,400 281,900 259,424 260,000 262,300 263,700 267,542 266,900 270,600 276,300
Unemployment Rate 7.6% 11.3% 12.6% 12.3% 11.1% 10.0% 9.8% 7.2% 6.8% 5.2%
Personal Income (PI) $6,709 $6,279 $6,400 6,799$ 6,487$ 7,290$ 7,182$ 7,018$ 7,130$ 7,507$
Per capita PI $24,307 $24,143 $24,634 25,884$ 24,357$ 27,417$ 26,846$ 26,295$ 26,025$ 26,862$
College Park* 1,738 1,843 1,333 1,361 1,308 1,305 1,368 1,370
Forest Park 21,915 21,741 18,468 18,550 18,949 18,904 18,763 19,350
Jonesboro 5,033 5,933 4,724 4,720 4,624 4,613 4,954 5,070
Lake City 2,498 2,478 2,612 2,730 2,671 2,665 2,835 2,920
Morrow 6,047 7,115 6,445 6,560 7,167 7,150 6,926 7,000
Riverdale 14,872 14,825 15,134 15,080 15,669 15,631 15,214 15,600
97
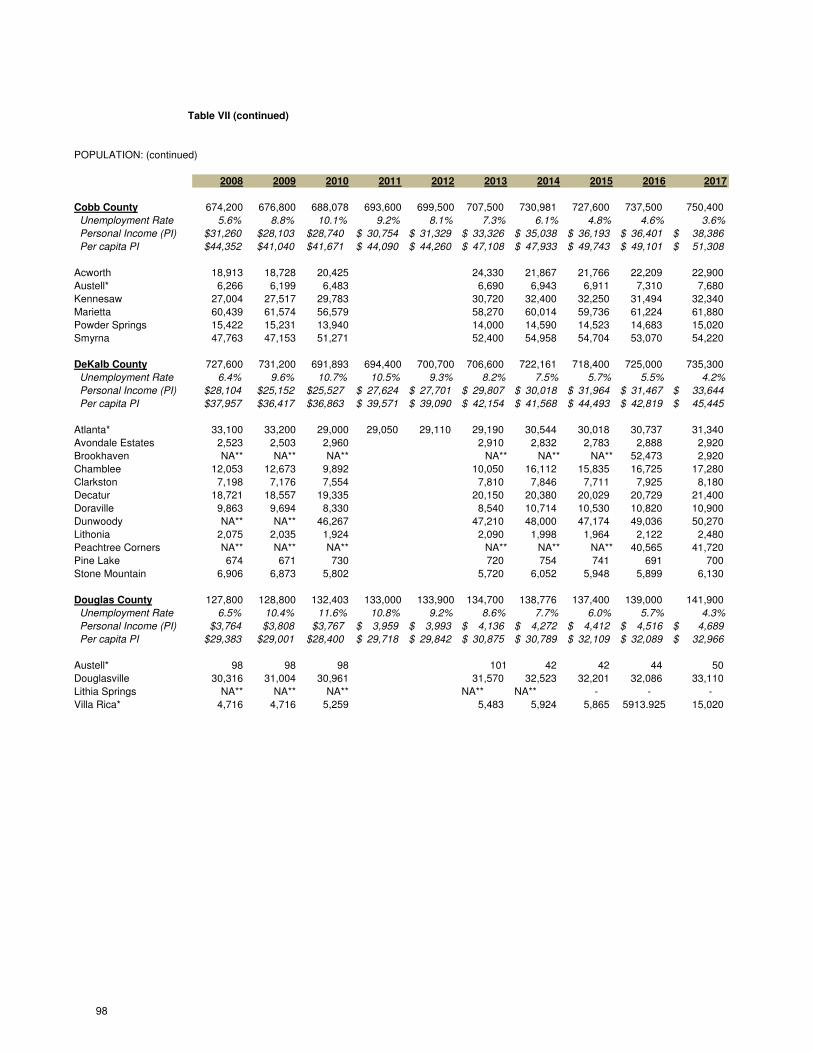
POPULATION: (continued)
2008 2009 2010 2011 2012 2013 2014 2015 2016 2017
Cobb County 674,200 676,800 688,078 693,600 699,500 707,500 730,981 727,600 737,500 750,400
Unemployment Rate 5.6% 8.8% 10.1% 9.2% 8.1% 7.3% 6.1% 4.8% 4.6% 3.6%
Personal Income (PI) $31,260 $28,103 $28,740 30,754$ 31,329$ 33,326$ 35,038$ 36,193$ 36,401$ 38,386$
Per capita PI $44,352 $41,040 $41,671 44,090$ 44,260$ 47,108$ 47,933$ 49,743$ 49,101$ 51,308$
Acworth 18,913 18,728 20,425 24,330 21,867 21,766 22,209 22,900
Austell* 6,266 6,199 6,483 6,690 6,943 6,911 7,310 7,680
Kennesaw 27,004 27,517 29,783 30,720 32,400 32,250 31,494 32,340
Marietta 60,439 61,574 56,579 58,270 60,014 59,736 61,224 61,880
Powder Springs 15,422 15,231 13,940 14,000 14,590 14,523 14,683 15,020
Smyrna 47,763 47,153 51,271 52,400 54,958 54,704 53,070 54,220
DeKalb County 727,600 731,200 691,893 694,400 700,700 706,600 722,161 718,400 725,000 735,300
Unemployment Rate 6.4% 9.6% 10.7% 10.5% 9.3% 8.2% 7.5% 5.7% 5.5% 4.2%
Personal Income (PI) $28,104 $25,152 $25,527 27,624$ 27,701$ 29,807$ 30,018$ 31,964$ 31,467$ 33,644$
Per capita PI $37,957 $36,417 $36,863 39,571$ 39,090$ 42,154$ 41,568$ 44,493$ 42,819$ 45,445$
Atlanta* 33,100 33,200 29,000 29,050 29,110 29,190 30,544 30,018 30,737 31,340
Avondale Estates 2,523 2,503 2,960 2,910 2,832 2,783 2,888 2,920
Brookhaven NA** NA** NA** NA** NA** NA** 52,473 2,920
Chamblee 12,053 12,673 9,892 10,050 16,112 15,835 16,725 17,280
Clarkston 7,198 7,176 7,554 7,810 7,846 7,711 7,925 8,180
Decatur 18,721 18,557 19,335 20,150 20,380 20,029 20,729 21,400
Doraville 9,863 9,694 8,330 8,540 10,714 10,530 10,820 10,900
Dunwoody NA** NA** 46,267 47,210 48,000 47,174 49,036 50,270
Lithonia 2,075 2,035 1,924 2,090 1,998 1,964 2,122 2,480
Peachtree Corners NA** NA** NA** NA** NA** NA** 40,565 41,720
Pine Lake 674 671 730 720 754 741 691 700
Stone Mountain 6,906 6,873 5,802 5,720 6,052 5,948 5,899 6,130
Douglas County 127,800 128,800 132,403 133,000 133,900 134,700 138,776 137,400 139,000 141,900
Unemployment Rate 6.5% 10.4% 11.6% 10.8% 9.2% 8.6% 7.7% 6.0% 5.7% 4.3%
Personal Income (PI) $3,764 $3,808 $3,767 3,959$ 3,993$ 4,136$ 4,272$ 4,412$ 4,516$ 4,689$
Per capita PI $29,383 $29,001 $28,400 29,718$ 29,842$ 30,875$ 30,789$ 32,109$ 32,089$ 32,966$
Austell* 98 98 98 101 42 42 44 50
Douglasville 30,316 31,004 30,961 31,570 32,523 32,201 32,086 33,110
Lithia Springs NA** NA** NA** NA** NA** - - -
Villa Rica* 4,716 4,716 5,259 5,483 5,924 5,865 5913.925 15,020
Table VII (continued)
98
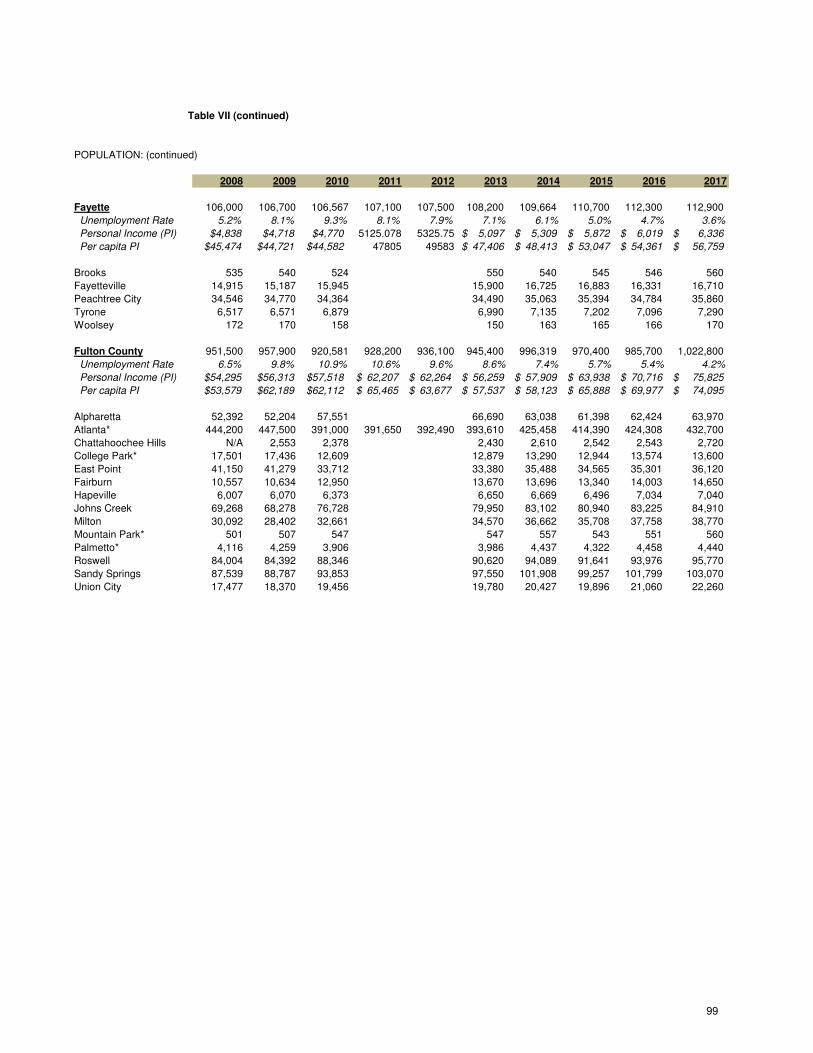
POPULATION: (continued)
2008 2009 2010 2011 2012 2013 2014 2015 2016 2017
Fayette 106,000 106,700 106,567 107,100 107,500 108,200 109,664 110,700 112,300 112,900
Unemployment Rate 5.2% 8.1% 9.3% 8.1% 7.9% 7.1% 6.1% 5.0% 4.7% 3.6%
Personal Income (PI) $4,838 $4,718 $4,770 5125.078 5325.75 5,097$ 5,309$ 5,872$ 6,019$ 6,336$
Per capita PI $45,474 $44,721 $44,582 47805 49583 47,406$ 48,413$ 53,047$ 54,361$ 56,759$
Brooks 535 540 524 550 540 545 546 560
Fayetteville 14,915 15,187 15,945 15,900 16,725 16,883 16,331 16,710
Peachtree City 34,546 34,770 34,364 34,490 35,063 35,394 34,784 35,860
Tyrone 6,517 6,571 6,879 6,990 7,135 7,202 7,096 7,290
Woolsey 172 170 158 150 163 165 166 170
Fulton County 951,500 957,900 920,581 928,200 936,100 945,400 996,319 970,400 985,700 1,022,800
Unemployment Rate 6.5% 9.8% 10.9% 10.6% 9.6% 8.6% 7.4% 5.7% 5.4% 4.2%
Personal Income (PI) $54,295 $56,313 $57,518 62,207$ 62,264$ 56,259$ 57,909$ 63,938$ 70,716$ 75,825$
Per capita PI $53,579 $62,189 $62,112 65,465$ 63,677$ 57,537$ 58,123$ 65,888$ 69,977$ 74,095$
Alpharetta 52,392 52,204 57,551 66,690 63,038 61,398 62,424 63,970
Atlanta* 444,200 447,500 391,000 391,650 392,490 393,610 425,458 414,390 424,308 432,700
Chattahoochee Hills N/A 2,553 2,378 2,430 2,610 2,542 2,543 2,720
College Park* 17,501 17,436 12,609 12,879 13,290 12,944 13,574 13,600
East Point 41,150 41,279 33,712 33,380 35,488 34,565 35,301 36,120
Fairburn 10,557 10,634 12,950 13,670 13,696 13,340 14,003 14,650
Hapeville 6,007 6,070 6,373 6,650 6,669 6,496 7,034 7,040
Johns Creek 69,268 68,278 76,728 79,950 83,102 80,940 83,225 84,910
Milton 30,092 28,402 32,661 34,570 36,662 35,708 37,758 38,770
Mountain Park* 501 507 547 547 557 543 551 560
Palmetto* 4,116 4,259 3,906 3,986 4,437 4,322 4,458 4,440
Roswell 84,004 84,392 88,346 90,620 94,089 91,641 93,976 95,770
Sandy Springs 87,539 88,787 93,853 97,550 101,908 99,257 101,799 103,070
Union City 17,477 18,370 19,456 19,780 20,427 19,896 21,060 22,260
Table VII (continued)
99
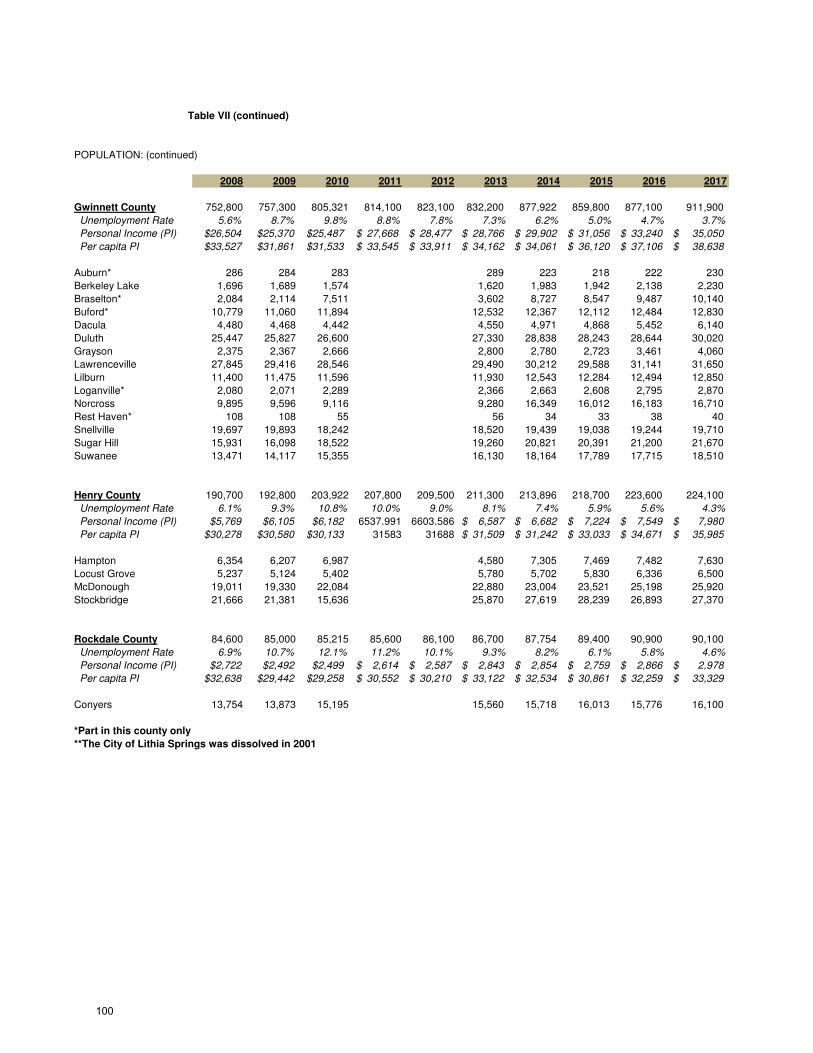
POPULATION: (continued)
2008 2009 2010 2011 2012 2013 2014 2015 2016 2017
Gwinnett County 752,800 757,300 805,321 814,100 823,100 832,200 877,922 859,800 877,100 911,900
Unemployment Rate 5.6% 8.7% 9.8% 8.8% 7.8% 7.3% 6.2% 5.0% 4.7% 3.7%
Personal Income (PI) $26,504 $25,370 $25,487 27,668$ 28,477$ 28,766$ 29,902$ 31,056$ 33,240$ 35,050$
Per capita PI $33,527 $31,861 $31,533 33,545$ 33,911$ 34,162$ 34,061$ 36,120$ 37,106$ 38,638$
Auburn* 286 284 283 289 223 218 222 230
Berkeley Lake 1,696 1,689 1,574 1,620 1,983 1,942 2,138 2,230
Braselton* 2,084 2,114 7,511 3,602 8,727 8,547 9,487 10,140
Buford* 10,779 11,060 11,894 12,532 12,367 12,112 12,484 12,830
Dacula 4,480 4,468 4,442 4,550 4,971 4,868 5,452 6,140
Duluth 25,447 25,827 26,600 27,330 28,838 28,243 28,644 30,020
Grayson 2,375 2,367 2,666 2,800 2,780 2,723 3,461 4,060
Lawrenceville 27,845 29,416 28,546 29,490 30,212 29,588 31,141 31,650
Lilburn 11,400 11,475 11,596 11,930 12,543 12,284 12,494 12,850
Loganville* 2,080 2,071 2,289 2,366 2,663 2,608 2,795 2,870
Norcross 9,895 9,596 9,116 9,280 16,349 16,012 16,183 16,710
Rest Haven* 108 108 55 56 34 33 38 40
Snellville 19,697 19,893 18,242 18,520 19,439 19,038 19,244 19,710
Sugar Hill 15,931 16,098 18,522 19,260 20,821 20,391 21,200 21,670
Suwanee 13,471 14,117 15,355 16,130 18,164 17,789 17,715 18,510
Henry County 190,700 192,800 203,922 207,800 209,500 211,300 213,896 218,700 223,600 224,100
Unemployment Rate 6.1% 9.3% 10.8% 10.0% 9.0% 8.1% 7.4% 5.9% 5.6% 4.3%
Personal Income (PI) $5,769 $6,105 $6,182 6537.991 6603.586 6,587$ 6,682$ 7,224$ 7,549$ 7,980$
Per capita PI $30,278 $30,580 $30,133 31583 31688 31,509$ 31,242$ 33,033$ 34,671$ 35,985$
Hampton 6,354 6,207 6,987 4,580 7,305 7,469 7,482 7,630
Locust Grove 5,237 5,124 5,402 5,780 5,702 5,830 6,336 6,500
McDonough 19,011 19,330 22,084 22,880 23,004 23,521 25,198 25,920
Stockbridge 21,666 21,381 15,636 25,870 27,619 28,239 26,893 27,370
Rockdale County 84,600 85,000 85,215 85,600 86,100 86,700 87,754 89,400 90,900 90,100
Unemployment Rate 6.9% 10.7% 12.1% 11.2% 10.1% 9.3% 8.2% 6.1% 5.8% 4.6%
Personal Income (PI) $2,722 $2,492 $2,499 2,614$ 2,587$ 2,843$ 2,854$ 2,759$ 2,866$ 2,978$
Per capita PI $32,638 $29,442 $29,258 30,552$ 30,210$ 33,122$ 32,534$ 30,861$ 32,259$ 33,329$
Conyers 13,754 13,873 15,195 15,560 15,718 16,013 15,776 16,100
*Part in this county only
**The City of Lithia Springs was dissolved in 2001
Table VII (continued)
100
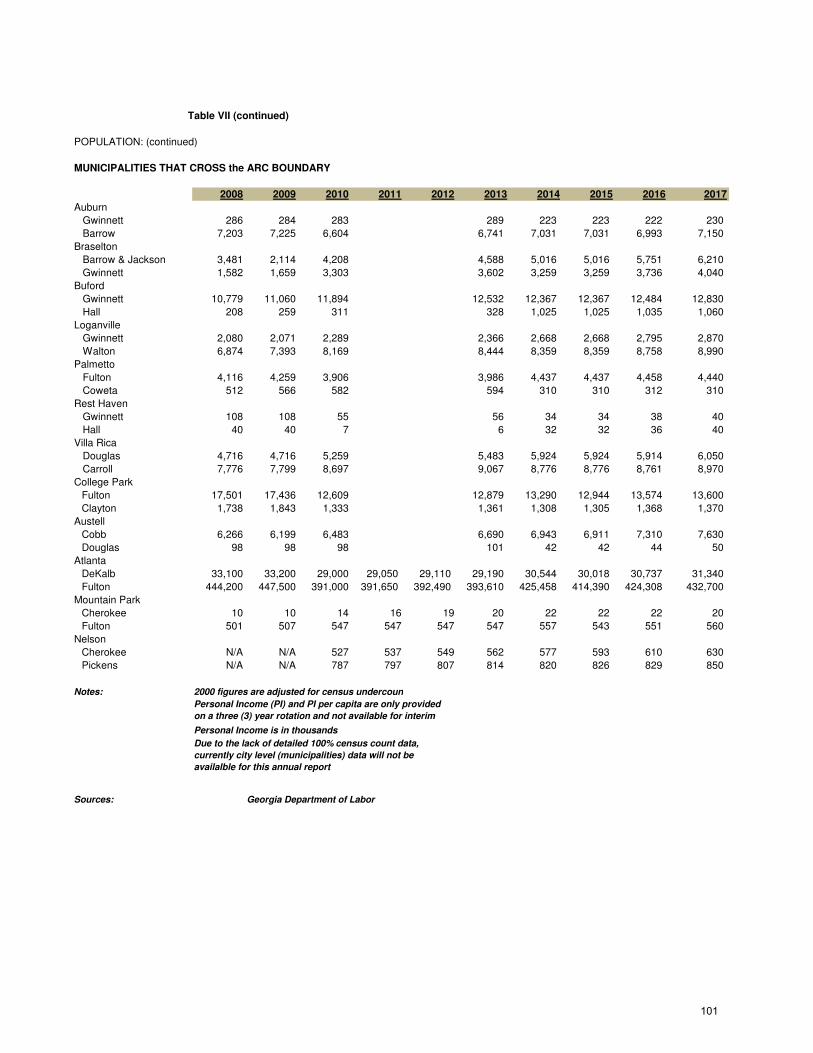
POPULATION: (continued)
MUNICIPALITIES THAT CROSS the ARC BOUNDARY
2008 2009 2010 2011 2012 2013 2014 2015 2016 2017
Auburn
Gwinnett 286 284 283 289 223 223 222 230
Barrow 7,203 7,225 6,604 6,741 7,031 7,031 6,993 7,150
Braselton
Barrow & Jackson 3,481 2,114 4,208 4,588 5,016 5,016 5,751 6,210
Gwinnett 1,582 1,659 3,303 3,602 3,259 3,259 3,736 4,040
Buford
Gwinnett 10,779 11,060 11,894 12,532 12,367 12,367 12,484 12,830
Hall 208 259 311 328 1,025 1,025 1,035 1,060
Loganville
Gwinnett 2,080 2,071 2,289 2,366 2,668 2,668 2,795 2,870
Walton 6,874 7,393 8,169 8,444 8,359 8,359 8,758 8,990
Palmetto
Fulton 4,116 4,259 3,906 3,986 4,437 4,437 4,458 4,440
Coweta 512 566 582 594 310 310 312 310
Rest Haven
Gwinnett 108 108 55 56 34 34 38 40
Hall 40 40 7 6 32 32 36 40
Villa Rica
Douglas 4,716 4,716 5,259 5,483 5,924 5,924 5,914 6,050
Carroll 7,776 7,799 8,697 9,067 8,776 8,776 8,761 8,970
College Park
Fulton 17,501 17,436 12,609 12,879 13,290 12,944 13,574 13,600
Clayton 1,738 1,843 1,333 1,361 1,308 1,305 1,368 1,370
Austell
Cobb 6,266 6,199 6,483 6,690 6,943 6,911 7,310 7,630
Douglas 98 98 98 101 42 42 44 50
Atlanta
DeKalb 33,100 33,200 29,000 29,050 29,110 29,190 30,544 30,018 30,737 31,340
Fulton 444,200 447,500 391,000 391,650 392,490 393,610 425,458 414,390 424,308 432,700
Mountain Park
Cherokee 10 10 14 16 19 20 22 22 22 20
Fulton 501 507 547 547 547 547 557 543 551 560
Nelson
Cherokee N/A N/A 527 537 549 562 577 593 610 630
Pickens N/A N/A 787 797 807 814 820 826 829 850
Notes:
Sources: Georgia Department of Labor
Personal Income is in thousands
Due to the lack of detailed 100% census count data,
currently city level (municipalities) data will not be
availalble for this annual report
Table VII (continued)
2000 figures are adjusted for census undercount
Personal Income (PI) and PI per capita are only provided
on a three (3) year rotation and not available for interim
years
101
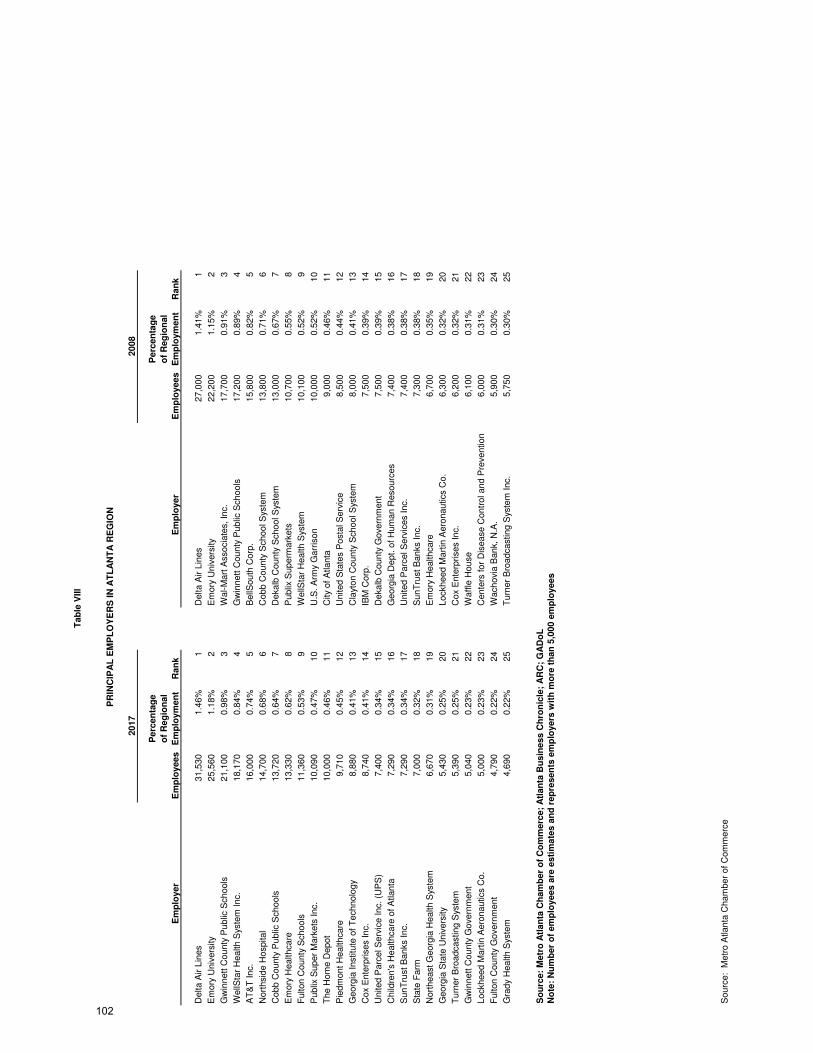
Em
plo
yer
Em
plo
yees
Perc
en
tag
e
of
Reg
ion
al
Em
plo
ym
en
tR
an
kE
mp
loyer
Em
plo
yees
Perc
en
tag
e
of
Reg
ion
al
Em
plo
ym
en
tR
an
k
Delta A
ir L
ines
31,5
30
1.4
6%
1D
elta A
ir L
ines
27,0
00
1.4
1%
1
Em
ory
Univ
ers
ity
25,5
60
1.1
8%
2E
mory
Univ
ers
ity
22,2
00
1.1
5%
2
Gw
innett C
ounty
Public
Schools
21,1
00
0.9
8%
3W
al-M
art
Associa
tes, In
c.
17,7
00
0.9
1%
3
WellS
tar
Health S
yste
m Inc.
18,1
70
0.8
4%
4G
win
nett C
ounty
Public
Schools
17,2
00
0.8
9%
4
AT
&T
Inc.
16,0
00
0.7
4%
5B
ellS
outh
Corp
.15,8
00
0.8
2%
5
Nort
hsid
e H
ospital
14,7
00
0.6
8%
6C
obb C
ounty
School S
yste
m13,8
00
0.7
1%
6
Cobb C
ounty
Public
Schools
13,7
20
0.6
4%
7D
ekalb
County
School S
yste
m13,0
00
0.6
7%
7
Em
ory
Healthcare
13,3
30
0.6
2%
8P
ublix
Superm
ark
ets
10,7
00
0.5
5%
8
Fulton C
ounty
Schools
11,3
60
0.5
3%
9W
ellS
tar
Health S
yste
m10,1
00
0.5
2%
9
Publix
Super
Mark
ets
Inc.
10,0
90
0.4
7%
10
U.S
. A
rmy
Garr
ison
10,0
00
0.5
2%
10
The H
om
e D
epot
10,0
00
0.4
6%
11
City
of A
tlanta
9,0
00
0.4
6%
11
Pie
dm
ont H
ealthcare
9,7
10
0.4
5%
12
United S
tate
s P
osta
l S
erv
ice
8,5
00
0.4
4%
12
Georg
ia Institu
te o
f T
echnolo
gy
8,8
80
0.4
1%
13
Cla
yton C
ounty
School S
yste
m8,0
00
0.4
1%
13
Cox
Ente
rprises Inc.
8,7
40
0.4
1%
14
IBM
Corp
.7,5
00
0.3
9%
14
United P
arc
el S
erv
ice Inc. (U
PS
)7,4
00
0.3
4%
15
Dekalb
County
Gove
rnm
ent
7,5
00
0.3
9%
15
Child
ren's
Healthcare
of A
tlanta
7,2
90
0.3
4%
16
Georg
ia D
ept. o
f H
um
an R
esourc
es
7,4
00
0.3
8%
16
SunT
rust B
anks Inc.
7,2
90
0.3
4%
17
United P
arc
el S
erv
ices Inc.
7,4
00
0.3
8%
17
Sta
te F
arm
7,0
00
0.3
2%
18
SunT
rust B
anks Inc.
7,3
00
0.3
8%
18
Nort
heast G
eorg
ia H
ealth S
yste
m6,6
70
0.3
1%
19
Em
ory
Healthcare
6,7
00
0.3
5%
19
Georg
ia S
tate
Univ
ers
ity
5,4
30
0.2
5%
20
Lockheed M
art
in A
ero
nautics C
o.
6,3
00
0.3
2%
20
Turn
er
Bro
adcasting S
yste
m5,3
90
0.2
5%
21
Cox
Ente
rprises Inc.
6,2
00
0.3
2%
21
Gw
innett C
ounty
Gove
rnm
ent
5,0
40
0.2
3%
22
Waffle
House
6,1
00
0.3
1%
22
Lockheed M
art
in A
ero
nautics C
o.
5,0
00
0.2
3%
23
Cente
rs for
Dis
ease C
ontr
ol and P
reve
ntion
6,0
00
0.3
1%
23
Fulton C
ounty
Gove
rnm
ent
4,7
90
0.2
2%
24
Wachovi
a B
ank, N
.A.
5,9
00
0.3
0%
24
Gra
dy
Health S
yste
m4,6
90
0.2
2%
25
Turn
er
Bro
adcasting S
yste
m Inc.
5,7
50
0.3
0%
25
Sourc
e: M
etr
o A
tlanta
Cham
ber
of C
om
merc
e
No
te:
Nu
mb
er
of
em
plo
yees a
re e
sti
mate
s a
nd
rep
resen
ts e
mp
loyers
wit
h m
ore
th
an
5,0
00 e
mp
loyees
Tab
le V
III
PR
INC
IPA
L E
MP
LO
YE
RS
IN
AT
LA
NT
A R
EG
ION
2017
2008
So
urc
e:
Metr
o A
tlan
ta C
ham
ber
of
Co
mm
erc
e;
Atl
an
ta B
usin
ess C
hro
nic
le;
AR
C;
GA
Do
L
102
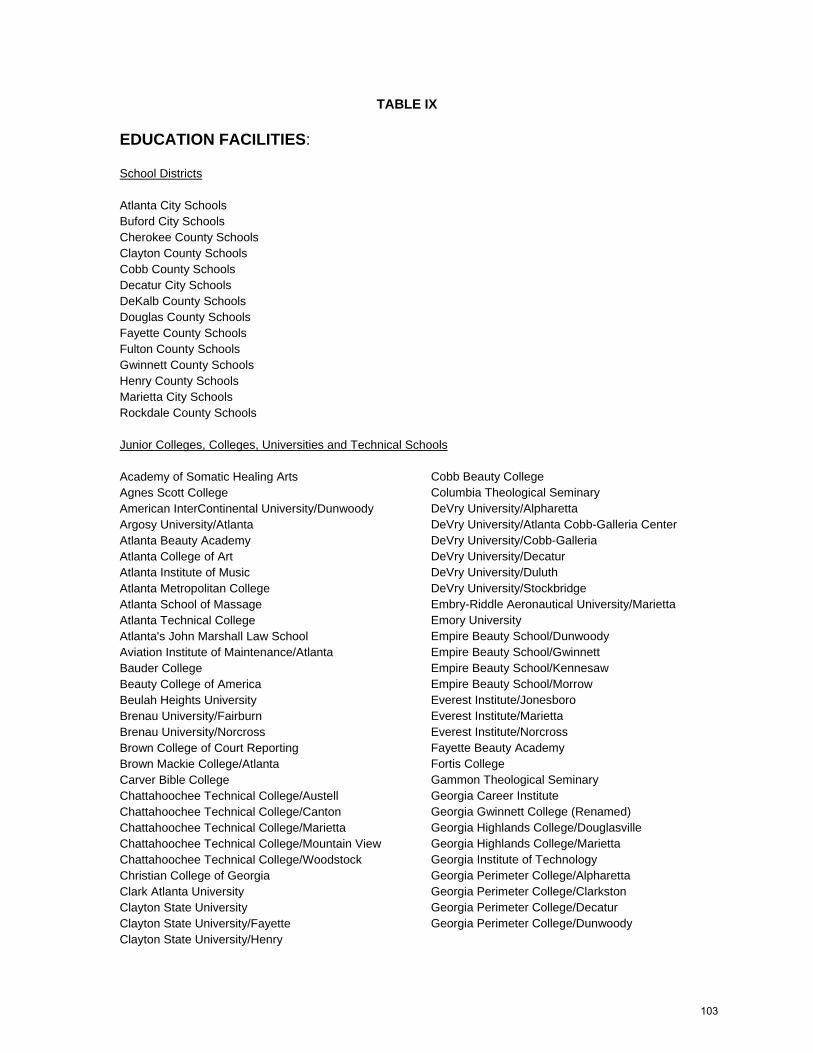
TABLE IX EDUCATION FACILITIES: School Districts Atlanta City Schools Buford City Schools Cherokee County Schools Clayton County Schools Cobb County Schools Decatur City Schools DeKalb County Schools Douglas County Schools Fayette County Schools Fulton County Schools Gwinnett County Schools Henry County Schools Marietta City Schools Rockdale County Schools Junior Colleges, Colleges, Universities and Technical Schools Academy of Somatic Healing Arts Agnes Scott College American InterContinental University/Dunwoody Argosy University/Atlanta Atlanta Beauty Academy Atlanta College of Art Atlanta Institute of Music Atlanta Metropolitan College Atlanta School of Massage Atlanta Technical College Atlanta's John Marshall Law School Aviation Institute of Maintenance/Atlanta Bauder College Beauty College of America Beulah Heights University Brenau University/Fairburn Brenau University/Norcross Brown College of Court Reporting Brown Mackie College/Atlanta Carver Bible College Chattahoochee Technical College/Austell Chattahoochee Technical College/Canton Chattahoochee Technical College/Marietta Chattahoochee Technical College/Mountain View Chattahoochee Technical College/Woodstock Christian College of Georgia Clark Atlanta University Clayton State University Clayton State University/Fayette Clayton State University/Henry
Cobb Beauty College Columbia Theological Seminary DeVry University/Alpharetta DeVry University/Atlanta Cobb-Galleria Center DeVry University/Cobb-Galleria DeVry University/Decatur DeVry University/Duluth DeVry University/Stockbridge Embry-Riddle Aeronautical University/Marietta Emory University Empire Beauty School/Dunwoody Empire Beauty School/Gwinnett Empire Beauty School/Kennesaw Empire Beauty School/Morrow Everest Institute/Jonesboro Everest Institute/Marietta Everest Institute/Norcross Fayette Beauty Academy Fortis College Gammon Theological Seminary Georgia Career Institute Georgia Gwinnett College (Renamed) Georgia Highlands College/Douglasville Georgia Highlands College/Marietta Georgia Institute of Technology Georgia Perimeter College/Alpharetta Georgia Perimeter College/Clarkston Georgia Perimeter College/Decatur Georgia Perimeter College/Dunwoody
103

Georgia Piedmont Technical College/DeKalb (Renamed) Georgia State University Georgia State University/Henry Grady Health System Professional Schools Gupton-Jones College of Funeral Service Gwinnett College/Lilburn Gwinnett College/Sandy Springs Gwinnett Technical College/Gwinnett Place Mall Gwinnett Technical College/Lawrenceville Herzing University High-Tech Institute-Atlanta Interactive College of Technology Interactive College of Technology/Chamblee Interactive College of Technology/Morrow Interdenominational Theological Center International School of Skin, Nailcare & Massage Therapy ITT Technical Institute/Atlanta ITT Technical Institute/Duluth ITT Technical Institute/Kennesaw Iverson Business School Kennesaw State University Laurus Technical Institute/Decatur Laurus Technical Institute/Jonesboro Le Cordon Bleu College – Atlanta Le Cordon Bleu College of Culinary Arts Life University Lincoln College of Technology/Marietta Luther Rice University Medtech Institute/Marietta Medtech Institute/Morrow Medtech Institute/Northlake Mercer University/Atlanta Mercer University/Douglas Mercer University/Henry Morehouse College Morehouse School Of Medicine Morris Brown College Oglethorpe University Omnitech Institute Paul Mitchell School/Atlanta Paul Mitchell School/Roswell
Philadelphia College of Osteopathic Medicine/Suwanee Point University Portfolio Center Pro Way Hair School Profile Institute of Barber-Styling Reinhardt College Saint Leo University/Gwinnett Saint Leo University/Marietta Saint Leo University/Morrow Sanford-Brown College Savannah College of Art and Design/Atlanta Shorter College/Atlanta Shorter College/College Park Shorter College/Gwinnett Southern Crescent Technical College/Henry Spelman College Strayer University/Chamblee Strayer University/Cobb Strayer University/Douglasville Strayer University/Lithonia Strayer University/Morrow Strayer University/Roswell The Art Institute of Atlanta The Creative Circus The Medical Management Institute The Process Institute of Cosmetology The Salvation Army Evangeline Booth College Toni & Guy Hairdressing Academy/Atlanta Troy University/Atlanta UEI/Morrow University of Georgia/Atlanta University of Georgia/Gwinnett University of Phoenix/Alpharetta University of Phoenix/DeKalb University of Phoenix/Gwinnett University of Phoenix/Marietta University of Phoenix/McDonough University of Phoenix/Sandy Springs University of Phoenix/Snellville West Georgia Technical College/Douglas Westwood College/Midtown Westwood College/Northlake
Source: Atlanta Regional Commission
104
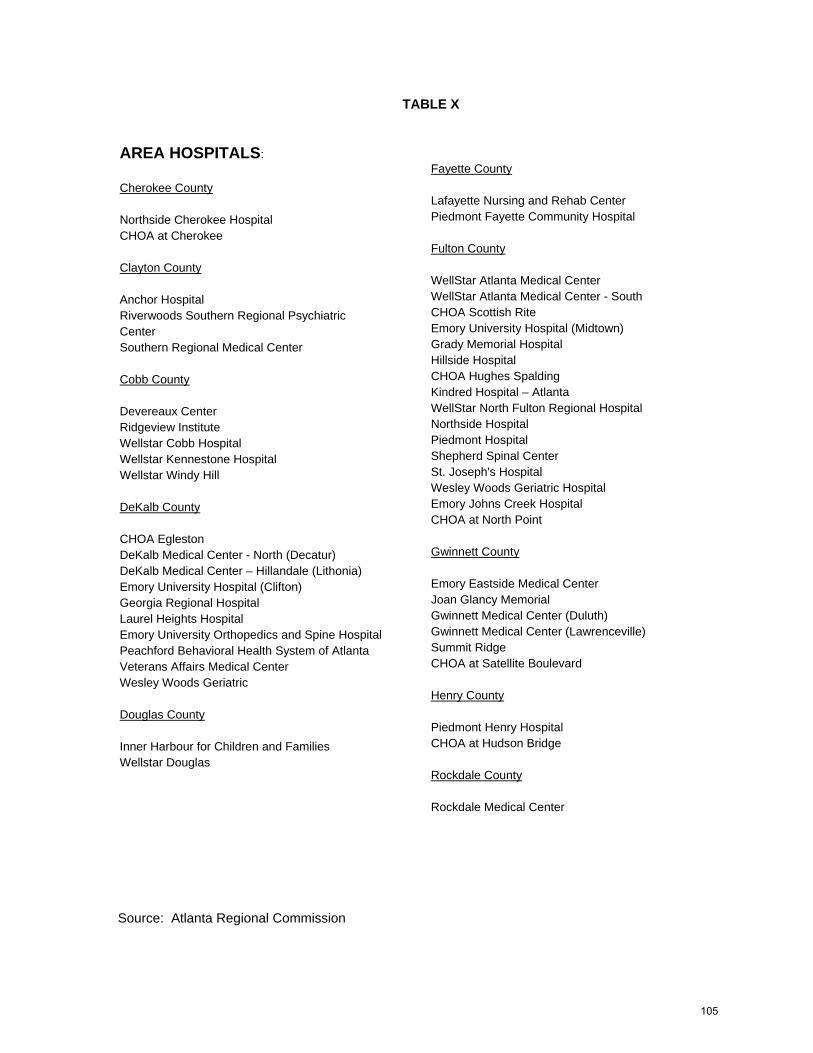
TABLE X
AREA HOSPITALS: Cherokee County Northside Cherokee Hospital CHOA at Cherokee Clayton County Anchor Hospital Riverwoods Southern Regional Psychiatric Center Southern Regional Medical Center Cobb County Devereaux Center Ridgeview Institute Wellstar Cobb Hospital Wellstar Kennestone Hospital Wellstar Windy Hill DeKalb County CHOA Egleston DeKalb Medical Center - North (Decatur) DeKalb Medical Center – Hillandale (Lithonia) Emory University Hospital (Clifton) Georgia Regional Hospital Laurel Heights Hospital Emory University Orthopedics and Spine Hospital Peachford Behavioral Health System of Atlanta Veterans Affairs Medical Center Wesley Woods Geriatric Douglas County Inner Harbour for Children and Families Wellstar Douglas
Fayette County Lafayette Nursing and Rehab Center Piedmont Fayette Community Hospital Fulton County WellStar Atlanta Medical Center WellStar Atlanta Medical Center - South CHOA Scottish Rite Emory University Hospital (Midtown) Grady Memorial Hospital Hillside Hospital CHOA Hughes Spalding Kindred Hospital – Atlanta WellStar North Fulton Regional Hospital Northside Hospital Piedmont Hospital Shepherd Spinal Center St. Joseph's Hospital Wesley Woods Geriatric Hospital Emory Johns Creek Hospital CHOA at North Point Gwinnett County Emory Eastside Medical Center Joan Glancy Memorial Gwinnett Medical Center (Duluth) Gwinnett Medical Center (Lawrenceville) Summit Ridge CHOA at Satellite Boulevard Henry County Piedmont Henry Hospital CHOA at Hudson Bridge Rockdale County Rockdale Medical Center
Source: Atlanta Regional Commission
105
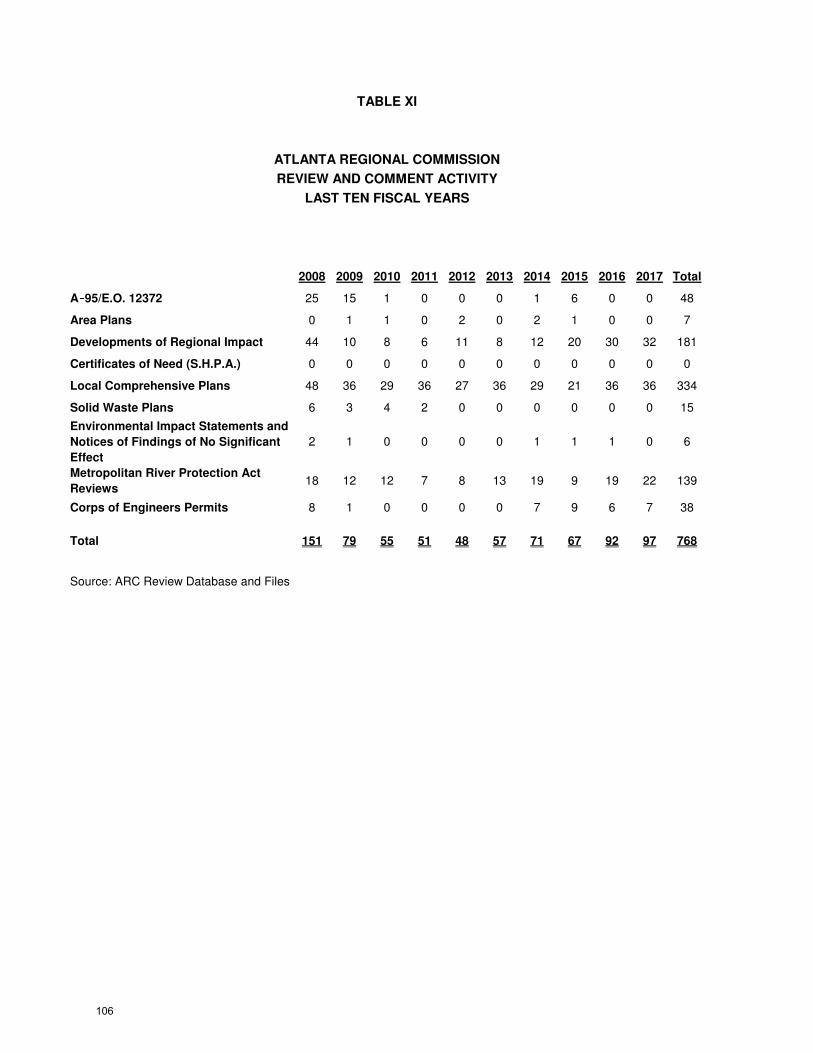
2008 2009 2010 2011 2012 2013 2014 2015 2016 2017 Total
A‑‑‑‑95/E.O. 12372 25 15 1 0 0 0 1 6 0 0 48
Area Plans 0 1 1 0 2 0 2 1 0 0 7
Developments of Regional Impact 44 10 8 6 11 8 12 20 30 32 181
Certificates of Need (S.H.P.A.) 0 0 0 0 0 0 0 0 0 0 0
Local Comprehensive Plans 48 36 29 36 27 36 29 21 36 36 334
Solid Waste Plans 6 3 4 2 0 0 0 0 0 0 15
Environmental Impact Statements and
Notices of Findings of No Significant
Effect
2 1 0 0 0 0 1 1 1 0 6
Metropolitan River Protection Act
Reviews18 12 12 7 8 13 19 9 19 22 139
Corps of Engineers Permits 8 1 0 0 0 0 7 9 6 7 38
Total 151 79 55 51 48 57 71 67 92 97 768
Source: ARC Review Database and Files
LAST TEN FISCAL YEARS
TABLE XI
ATLANTA REGIONAL COMMISSION
REVIEW AND COMMENT ACTIVITY
106
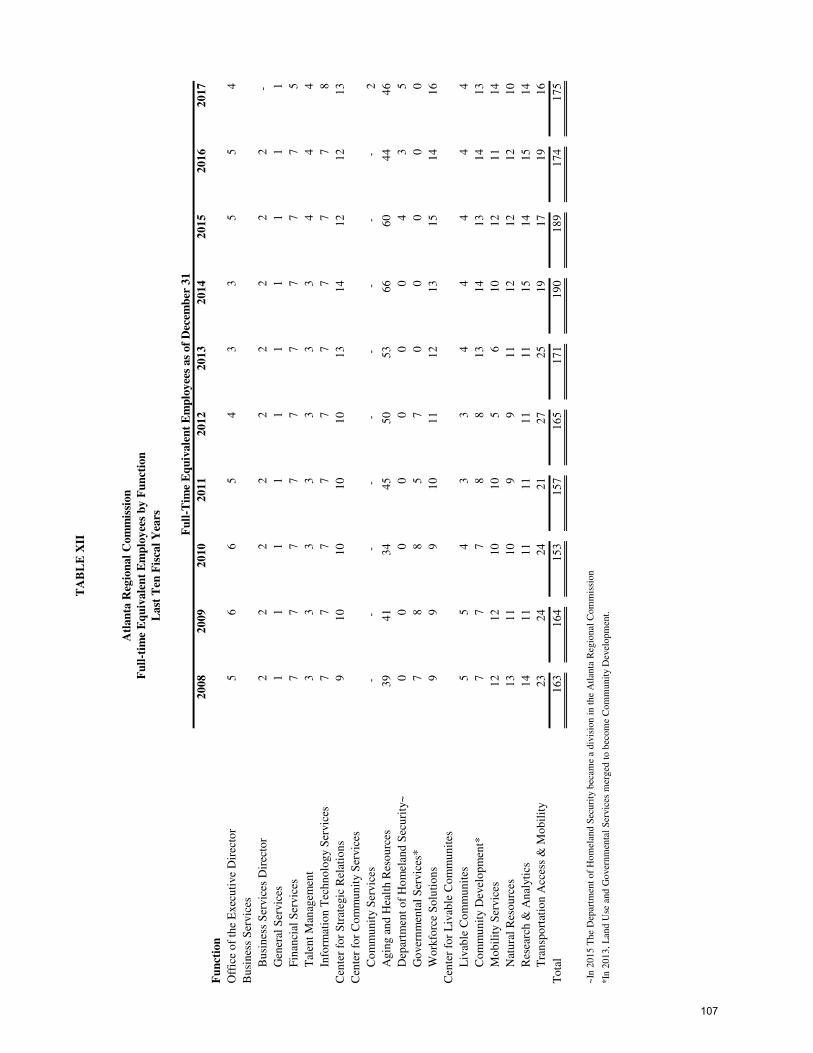
20
08
20
09
20
10
20
11
20
12
20
13
20
14
20
15
20
16
20
17
Fu
nct
ion
Off
ice
of
the
Exec
uti
ve
Dir
ecto
r5
66
54
33
55
4
Bu
sin
ess
Ser
vic
es
Bu
sin
ess
Ser
vic
es D
irec
tor
22
22
22
22
2-
Gen
eral
Ser
vic
es1
11
11
11
11
1
Fin
anci
al S
ervic
es7
77
77
77
77
5
Tal
ent
Man
agem
ent
33
33
33
34
44
Info
rmat
ion
Tec
hn
olo
gy S
ervic
es7
77
77
77
77
8
Cen
ter
for
Str
ateg
ic R
elat
ion
s9
10
10
10
10
13
14
12
12
13
Cen
ter
for
Co
mm
un
ity S
ervic
es
Co
mm
un
ity S
ervic
es-
-
-
-
-
-
-
-
-
2
Agin
g a
nd
Hea
lth
Res
ou
rces
39
41
34
45
50
53
66
60
44
46
Dep
artm
ent
of
Ho
mel
and
Sec
uri
ty~
00
00
00
04
35
Go
ver
nm
enta
l S
ervic
es*
78
85
70
00
00
Wo
rkfo
rce
So
luti
on
s9
99
10
11
12
13
15
14
16
Cen
ter
for
Liv
able
Co
mm
un
ites
Liv
able
Co
mm
un
ites
55
43
34
44
44
Co
mm
un
ity D
evel
op
men
t*7
77
88
13
14
13
14
13
Mo
bil
ity S
ervic
es1
21
21
01
05
61
01
21
11
4
Nat
ura
l R
eso
urc
es1
31
11
09
91
11
21
21
21
0
Res
earc
h &
An
alyti
cs1
41
11
11
11
11
11
51
41
51
4
Tra
nsp
ort
atio
n A
cces
s &
Mo
bil
ity
23
24
24
21
27
25
19
17
19
16
To
tal
16
31
64
15
31
57
16
51
71
19
01
89
17
41
75
~In
20
15
Th
e D
epar
tmen
t o
f H
om
elan
d S
ecu
rity
bec
ame
a d
ivis
ion
in
th
e A
tlan
ta R
egio
nal
Co
mm
issi
on
*In
20
13
, L
and
Use
an
d G
over
nm
enta
l S
ervic
es m
erg
ed t
o b
eco
me
Co
mm
un
ity
Dev
elo
pm
ent.
Fu
ll-T
ime
Eq
uiv
ale
nt
Em
plo
yee
s as
of
Dec
emb
er 3
1
TA
BL
E X
II
Fu
ll-t
ime
Eq
uiv
ale
nt
Em
plo
yee
s b
y F
un
ctio
n
Atl
an
ta R
egio
nal
Com
mis
sion
Last
Ten
Fis
cal
Yea
rs
107
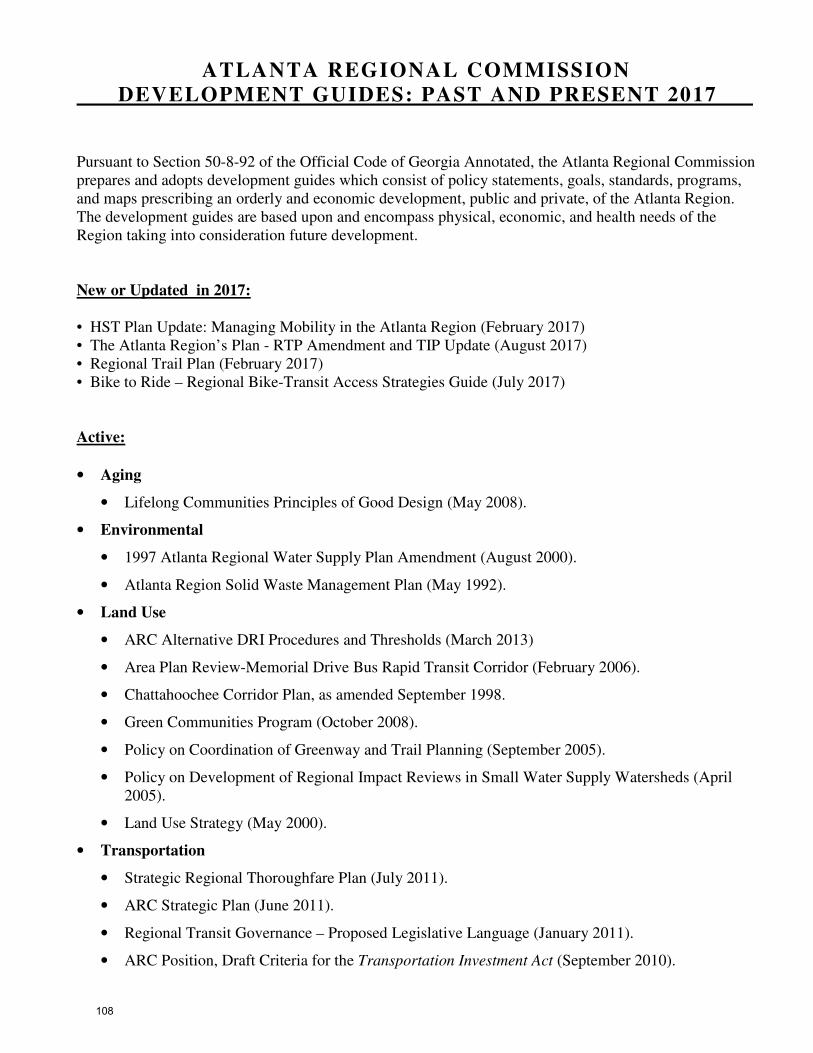
ATLANTA REGIONAL COMMISSION
DEVELOPMENT GUIDES: PAST AND PRESENT 2017
Pursuant to Section 50-8-92 of the Official Code of Georgia Annotated, the Atlanta Regional Commission
prepares and adopts development guides which consist of policy statements, goals, standards, programs,
and maps prescribing an orderly and economic development, public and private, of the Atlanta Region.
The development guides are based upon and encompass physical, economic, and health needs of the
Region taking into consideration future development.
New or Updated in 2017:
• HST Plan Update: Managing Mobility in the Atlanta Region (February 2017)
• The Atlanta Region’s Plan - RTP Amendment and TIP Update (August 2017)
• Regional Trail Plan (February 2017)
• Bike to Ride – Regional Bike-Transit Access Strategies Guide (July 2017)
Active:
• Aging
• Lifelong Communities Principles of Good Design (May 2008).
• Environmental
• 1997 Atlanta Regional Water Supply Plan Amendment (August 2000).
• Atlanta Region Solid Waste Management Plan (May 1992).
• Land Use
• ARC Alternative DRI Procedures and Thresholds (March 2013)
• Area Plan Review-Memorial Drive Bus Rapid Transit Corridor (February 2006).
• Chattahoochee Corridor Plan, as amended September 1998.
• Green Communities Program (October 2008).
• Policy on Coordination of Greenway and Trail Planning (September 2005).
• Policy on Development of Regional Impact Reviews in Small Water Supply Watersheds (April
2005).
• Land Use Strategy (May 2000).
• Transportation
• Strategic Regional Thoroughfare Plan (July 2011).
• ARC Strategic Plan (June 2011).
• Regional Transit Governance – Proposed Legislative Language (January 2011).
• ARC Position, Draft Criteria for the Transportation Investment Act (September 2010).
108
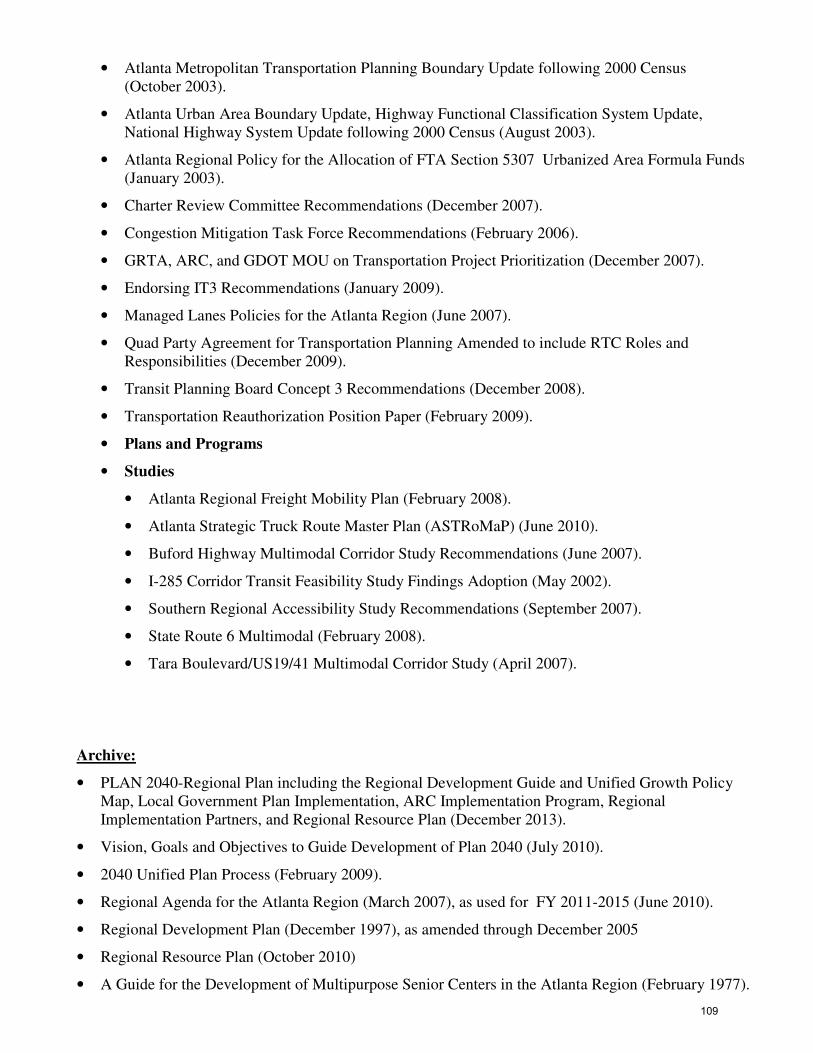
• Atlanta Metropolitan Transportation Planning Boundary Update following 2000 Census
(October 2003).
• Atlanta Urban Area Boundary Update, Highway Functional Classification System Update,
National Highway System Update following 2000 Census (August 2003).
• Atlanta Regional Policy for the Allocation of FTA Section 5307 Urbanized Area Formula Funds
(January 2003).
• Charter Review Committee Recommendations (December 2007).
• Congestion Mitigation Task Force Recommendations (February 2006).
• GRTA, ARC, and GDOT MOU on Transportation Project Prioritization (December 2007).
• Endorsing IT3 Recommendations (January 2009).
• Managed Lanes Policies for the Atlanta Region (June 2007).
• Quad Party Agreement for Transportation Planning Amended to include RTC Roles and
Responsibilities (December 2009).
• Transit Planning Board Concept 3 Recommendations (December 2008).
• Transportation Reauthorization Position Paper (February 2009).
• Plans and Programs
• Studies
• Atlanta Regional Freight Mobility Plan (February 2008).
• Atlanta Strategic Truck Route Master Plan (ASTRoMaP) (June 2010).
• Buford Highway Multimodal Corridor Study Recommendations (June 2007).
• I-285 Corridor Transit Feasibility Study Findings Adoption (May 2002).
• Southern Regional Accessibility Study Recommendations (September 2007).
• State Route 6 Multimodal (February 2008).
• Tara Boulevard/US19/41 Multimodal Corridor Study (April 2007).
Archive:
• PLAN 2040-Regional Plan including the Regional Development Guide and Unified Growth Policy
Map, Local Government Plan Implementation, ARC Implementation Program, Regional
Implementation Partners, and Regional Resource Plan (December 2013).
• Vision, Goals and Objectives to Guide Development of Plan 2040 (July 2010).
• 2040 Unified Plan Process (February 2009).
• Regional Agenda for the Atlanta Region (March 2007), as used for FY 2011-2015 (June 2010).
• Regional Development Plan (December 1997), as amended through December 2005
• Regional Resource Plan (October 2010)
• A Guide for the Development of Multipurpose Senior Centers in the Atlanta Region (February 1977).
109
• Envision6- Regional Development Policies, as amended through May 2006, Unified Growth Policy
Map, as amended through February 2010, Regional Development Types Matrix (May 2005).
• Recommendations for Services to Non-English Speaking Groups (June 1980).
• Review Criteria for Adult Developmental Disabilities Projects (February 1980).
• Review Criteria for Human Services Planning Review of Federally and State Assisted Human
Services Projects (January 1981).
• Guide for Services to Abused and Neglected Children in the Atlanta Region (March, 1977),
Amendment of Administrative Policy Component (August 1981).
• Policy on Funding and Services for Dependent Children in the Atlanta Region (May 1980).
• Goals and Objectives for Transportation for the Handicapped and Elderly (August 1975), incorporated
into Regional Transportation Plan.
• Priorities for Park Acquisition and Development Projects Proposed for Funding in FY 1981 (March
1980).
• Recommendations for Funding of Local Government Pre-applications for FY 1982 Land and Water
Conservation Funds (April 1981).
• Regional Open Space and Recreation Planning Objectives (June 1976).
• Land Use - Guidelines for Growth (April 1968), as amended by the Regional Development Plan
(1975) and superseded by the 1984 Regional Development Plan.
• Preliminary Development Plan (August 1968), as superseded by the Regional Development Plan
(1975) and superseded by the 1984 Regional Development Plan.
• Emergency Medical Services Position Paper (March 1973), Repealed (March, 1978).
• Hospital Development Guide, Volume I (April 1973), Hospital Development Guide Update, 1974
(February 1975), Repealed (March 1978).
• Water and Sewer Priority Ranking System (May 1973), superseded by Areawide Wastewater
Management Plan.
• Housing Goals and Objectives (June 1973),
• Peachtree Trail Bikeway Plan (February 1974).
• Nursing Home Development Guide (February 1975), Nursing Home Development Guide Update
(December, 1975), Repealed (March 1978).
• Home Care Services Program (April 1975).
• Regional Improvements Program (April 1975), superseded by Areawide Capital Improvements
Programs.
• Five-year Family Planning Service Delivery Plan (September 1975), Repealed (March 1978).
• Regional Development Plan (September, 1975), Amendment to Regional Development Plan (March
1977) as updated and superseded by 1984 Regional Development Plan and superceded by the 1997
Regional Development Plan.
• Transit Development Program (November 1975), incorporated into Regional Transportation Plan.
• Regional Housing Plan (February 1976).
110
• Transportation Systems Management Plan (March 1976), amendment to Transportation Systems
Management Plan (April 1976), incorporated into Regional Transportation Plan.
• Comprehensive Health Plan, First Edition (April 1976), Quantified Projections of Future Need for
Facilities, Manpower, or Services, Repealed (March 1978).
• Areawide Wastewater Management Plan (June 1976), as amended November, 1983, and June, 1992.
• Mental Health Position Paper (August 1976). Mental Retardation Policies Repealed (April 1982).
• Proposed Nature Preserves for the Atlanta Region (October 1976), as amended February, 1983 and
February, 1986.
• Health Policy Plan for the Atlanta Region (December 1976).
• Renal Dialysis Position Paper (June 1974), Repealed (March, 1978).
• Human Services Planning Goals (June 1978)
• Hispanic Policy Recommendations (April 1980).
• Appalachian Regional Commission Priorities (July 1980); Amended (September 1981).
• Environmental - Water Supply Plan (March 1988) as amended April,1988; August, 1990; February,
1991; and May, 1992. Repealed and replaced with the 1997 Atlanta Region Water Supply Plan
(December 1997).
• Areawide Capital Improvements Program, 1989-1993 (February 1989).
• Human Services Investment Strategy (July 1990).
• Project Prioritization Framework for Envision6 RTP (August 2006)
• Envision6 Implementation Strategy (December 2006)
• Standards for Peace Officer Training in Juvenile Law (October 1980).
• Criminal Justice in the Atlanta Region - 1978 Update (October 1977), Amendment (January 1978),
1979 Update to the Plan (September, 1978), Amendment of JJDP Policies (August 1981).
• Regional Transportation Plans –Envision6 2030 RTP adopted in October 2007, the Mobility 2030
RTP adopted in December 2004 and the Transportation Solutions 2025 RTP adopted in July 2000.
111

Intentionally Blank
112
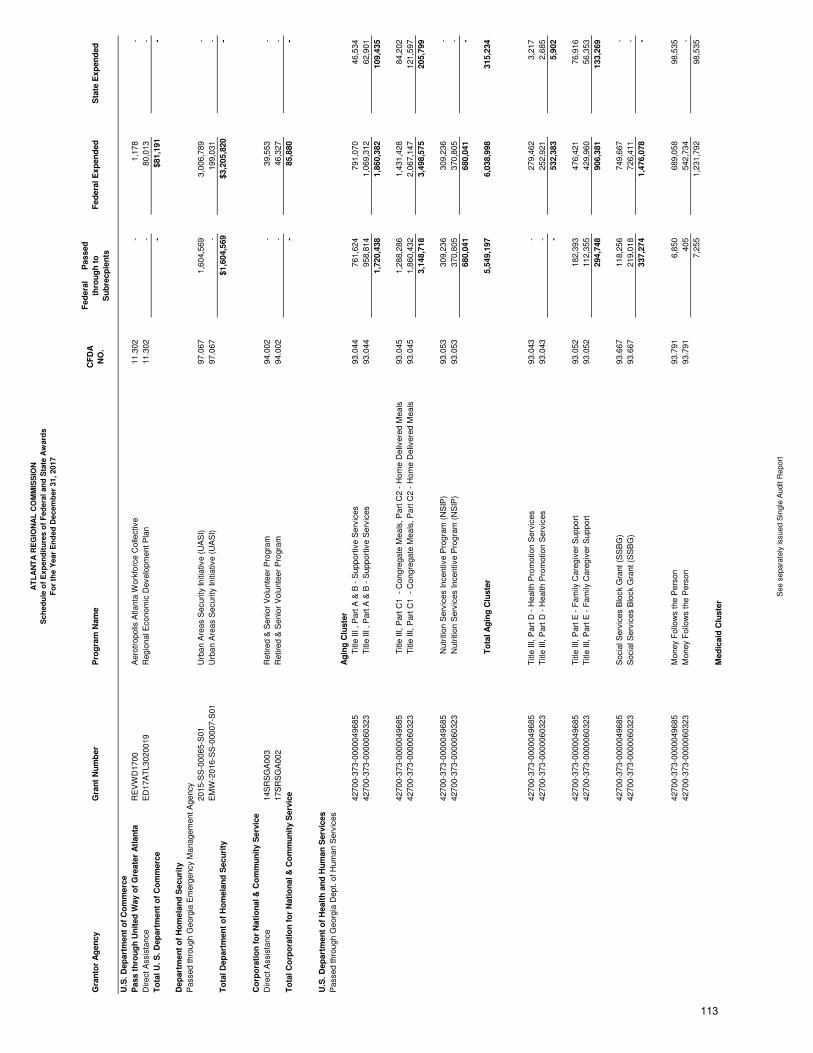
AT
LA
NT
A R
EG
ION
AL
CO
MM
ISS
ION
Sch
ed
ule
of
Exp
en
dit
ure
s o
f F
ed
era
l an
d S
tate
Aw
ard
s
Fo
r th
e Y
ear
En
ded
Decem
ber
31, 2017
Gra
nto
r A
gen
cy
Gra
nt
Nu
mb
er
Pro
gra
m N
am
eC
FD
A
NO
.
Fed
era
l P
assed
thro
ug
h t
o
Su
bre
cp
ien
ts
Fed
era
l E
xp
en
ded
S
tate
Exp
en
ded
U.S
. D
ep
art
men
t o
f C
om
merc
e
Pass t
hro
ug
h U
nit
ed
Way
of
Gre
ate
r A
tlan
taR
EV
WD
1700
Aero
tropolis
Atla
nta
Work
forc
e C
olle
ctiv
e11.3
02
-
1,1
78
-
Direct A
ssis
tance
ED
17A
TL3020019
Regio
nal E
conom
ic D
evelo
pm
ent P
lan
11.3
02
-
80,0
13
-
To
tal U
. S
. D
ep
art
men
t o
f C
om
merc
e-
$81,1
91
-
Dep
art
men
t o
f H
om
ela
nd
Secu
rity
Passed thro
ugh G
eorg
ia E
merg
ency
Managem
ent A
gency
2015-S
S-0
0065-S
01
Urb
an A
reas S
ecurity
Initi
ativ
e (
UA
SI)
97.0
67
1,6
04,5
69
3,0
06,7
89
-
EM
W-2
016-S
S-0
0007-S
01
Urb
an A
reas S
ecurity
Initi
ativ
e (
UA
SI)
97.0
67
-
199,0
31
-
To
tal D
ep
art
men
t o
f H
om
ela
nd
Secu
rity
$1,6
04,5
69
$3,2
05,8
20
-
Co
rpo
rati
on
fo
r N
ati
on
al &
Co
mm
un
ity
Serv
ice
Direct A
ssis
tance
14S
RS
GA
003
Retir
ed &
Senio
r V
olu
nte
er
Pro
gra
m94.0
02
-
39,5
53
-
17S
RS
GA
002
Retir
ed &
Senio
r V
olu
nte
er
Pro
gra
m94.0
02
-
46,3
27
-
To
tal C
orp
ora
tio
n f
or
Nati
on
al &
Co
mm
un
ity
Serv
ice
-
85,8
80
-
U.S
. D
ep
art
men
t o
f H
ealt
h a
nd
Hu
man
Serv
ices
Passed thro
ugh G
eorg
ia D
ept. o
f H
um
an S
erv
ices
Ag
ing
Clu
ste
r
42700-3
73-0
000049685
T
itle III , P
art
A &
B -
Support
ive S
erv
ices
93.0
44
761,6
24
791,0
70
46,5
34
42700-3
73-0
000060323
T
itle III , P
art
A &
B -
Support
ive S
erv
ices
93.0
44
958,8
14
1,0
69,3
12
62,9
01
1,7
20,4
38
1,8
60,3
82
109,4
35
42700-3
73-0
000049685
T
itle III, P
art
C1 -
Congre
gate
Meals
, P
art
C2 -
Hom
e D
eliv
ere
d M
eals
93.0
45
1,2
88,2
86
1,4
31,4
28
84,2
02
42700-3
73-0
000060323
T
itle III, P
art
C1 -
Congre
gate
Meals
, P
art
C2 -
Hom
e D
eliv
ere
d M
eals
93.0
45
1,8
60,4
32
2,0
67,1
47
121,5
97
3,1
48,7
18
3,4
98,5
75
205,7
99
42700-3
73-0
000049685
N
utr
ition S
erv
ices Incentiv
e P
rogra
m (
NS
IP)
93.0
53
309,2
36
309,2
36
-
42700-3
73-0
000060323
N
utr
ition S
erv
ices Incentiv
e P
rogra
m (
NS
IP)
93.0
53
370,8
05
370,8
05
-
680,0
41
680,0
41
-
T
ota
l A
gin
g C
luste
r5,5
49,1
97
6,0
38,9
98
315,2
34
42700-3
73-0
000049685
Titl
e III, P
art
D -
Health
Pro
motio
n S
erv
ices
93.0
43
-
279,4
62
3,2
17
42700-3
73-0
000060323
Titl
e III, P
art
D -
Health
Pro
motio
n S
erv
ices
93.0
43
-
252,9
21
2,6
85
-
532,3
83
5,9
02
42700-3
73-0
000049685
Titl
e III, P
art
E -
Fam
ily C
are
giv
er
Support
93.0
52
182,3
93
476,4
21
76,9
16
42700-3
73-0
000060323
Titl
e III, P
art
E -
Fam
ily C
are
giv
er
Support
93.0
52
112,3
55
429,9
60
56,3
53
294,7
48
906,3
81
133,2
69
42700-3
73-0
000049685
Socia
l Serv
ices B
lock
Gra
nt (S
SB
G)
93.6
67
118,2
56
749,6
67
-
42700-3
73-0
000060323
Socia
l Serv
ices B
lock
Gra
nt (S
SB
G)
93.6
67
219,0
18
726,4
11
-
337,2
74
1,4
76,0
78
-
42700-3
73-0
000049685
Money
Follo
ws the P
ers
on
93.7
91
6,8
50
689,0
58
98,5
35
42700-3
73-0
000060323
Money
Follo
ws the P
ers
on
93.7
91
405
542,7
34
-
7,2
55
1,2
31,7
92
98,5
35
Med
icaid
Clu
ste
r
See s
epara
tely
issued S
ingle
Audit
Report
113
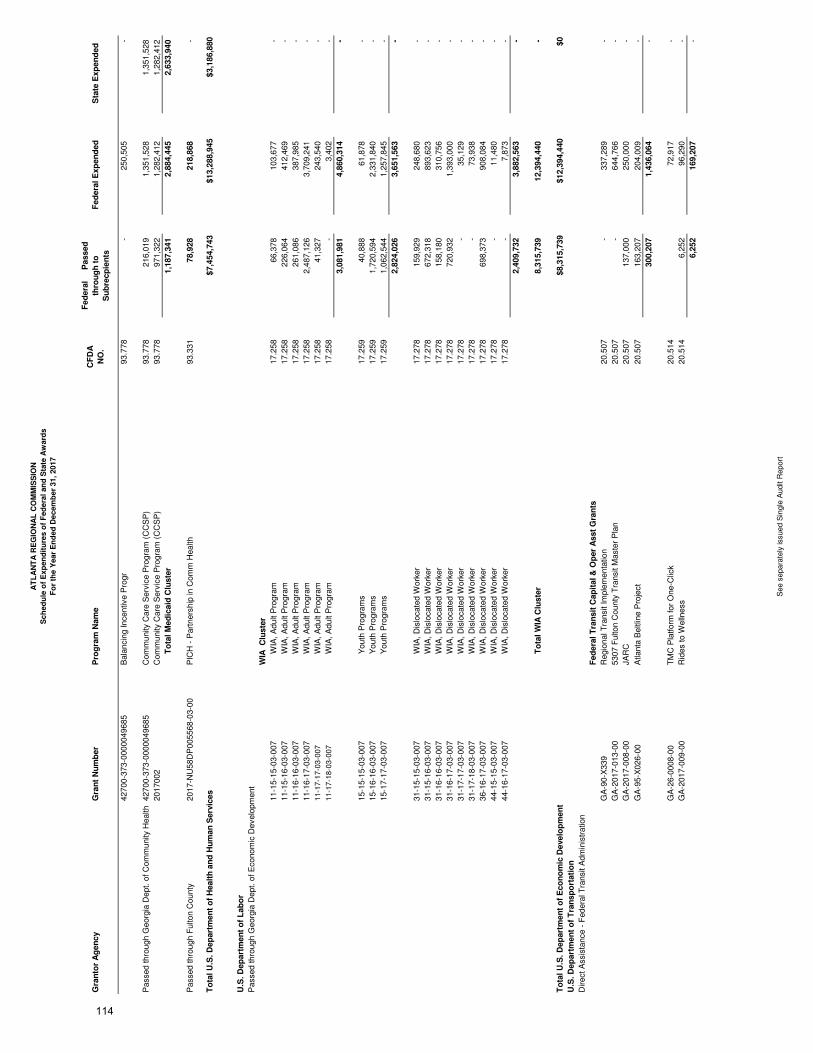
AT
LA
NT
A R
EG
ION
AL
CO
MM
ISS
ION
Sch
ed
ule
of
Exp
en
dit
ure
s o
f F
ed
era
l an
d S
tate
Aw
ard
s
Fo
r th
e Y
ear
En
ded
Decem
ber
31, 2017
Gra
nto
r A
gen
cy
Gra
nt
Nu
mb
er
Pro
gra
m N
am
eC
FD
A
NO
.
Fed
era
l P
assed
thro
ug
h t
o
Su
bre
cp
ien
ts
Fed
era
l E
xp
en
ded
S
tate
Exp
en
ded
42700-3
73-0
000049685
Bala
ncin
g Incentiv
e P
rogr
93.7
78
-
250,5
05
-
Passed thro
ugh G
eorg
ia D
ept. o
f C
om
munity
Health
42700-3
73-0
000049685
Com
munity
Care
Serv
ice P
rogra
m (
CC
SP
)93.7
78
216,0
19
1,3
51,5
28
1,3
51,5
28
2017002
Com
munity
Care
Serv
ice P
rogra
m (
CC
SP
)93.7
78
971,3
22
1,2
82,4
12
1,2
82,4
12
T
ota
l M
ed
icaid
Clu
ste
r1,1
87,3
41
2,8
84,4
45
2,6
33,9
40
Passed thro
ugh F
ulto
n C
ounty
2017-N
U58D
P005568-0
3-0
0P
ICH
- P
art
ners
hip
in C
om
m H
ealth
93.3
31
78,9
28
218,8
68
-
To
tal U
.S. D
ep
art
men
t o
f H
ealt
h a
nd
Hu
man
Serv
ices
$7,4
54,7
43
$13,2
88,9
45
$3,1
86,8
80
U.S
. D
ep
art
men
t o
f L
ab
or
Passed thro
ugh G
eorg
ia D
ept. o
f E
conom
ic D
evelo
pm
ent
WIA
C
luste
r
11-1
5-1
5-0
3-0
07
W
IA, A
dult
Pro
gra
m17.2
58
66,3
78
103,6
77
-
11-1
5-1
6-0
3-0
07
W
IA, A
dult
Pro
gra
m17.2
58
226,0
64
412,4
69
-
11-1
6-1
6-0
3-0
07
W
IA, A
dult
Pro
gra
m17.2
58
261,0
86
387,9
85
-
11-1
6-1
7-0
3-0
07
W
IA, A
dult
Pro
gra
m17.2
58
2,4
87,1
26
3,7
09,2
41
-
11-1
7-1
7-0
3-0
07
W
IA, A
dult
Pro
gra
m17.2
58
41,3
27
243,5
40
-
11-1
7-1
8-0
3-0
07
W
IA, A
dult
Pro
gra
m17.2
58
-
3,4
02
-
3,0
81,9
81
4,8
60,3
14
-
15-1
5-1
5-0
3-0
07
Y
outh
Pro
gra
ms
17.2
59
40,8
88
61,8
78
-
15-1
6-1
6-0
3-0
07
Y
outh
Pro
gra
ms
17.2
59
1,7
20,5
94
2,3
31,8
40
-
15-1
7-1
7-0
3-0
07
Y
outh
Pro
gra
ms
17.2
59
1,0
62,5
44
1,2
57,8
45
-
2,8
24,0
26
3,6
51,5
63
-
31-1
5-1
5-0
3-0
07
W
IA, D
islo
cate
d W
ork
er
17.2
78
159,9
29
248,6
80
-
31-1
5-1
6-0
3-0
07
W
IA, D
islo
cate
d W
ork
er
17.2
78
672,3
18
893,6
23
-
31-1
6-1
6-0
3-0
07
W
IA, D
islo
cate
d W
ork
er
17.2
78
158,1
80
310,7
56
-
31-1
6-1
7-0
3-0
07
W
IA, D
islo
cate
d W
ork
er
17.2
78
720,9
32
1,3
93,0
00
-
31-1
7-1
7-0
3-0
07
W
IA, D
islo
cate
d W
ork
er
17.2
78
-
35,1
29
-
31-1
7-1
8-0
3-0
07
W
IA, D
islo
cate
d W
ork
er
17.2
78
-
73,9
38
-
36-1
6-1
7-0
3-0
07
W
IA, D
islo
cate
d W
ork
er
17.2
78
698,3
73
908,0
84
-
44-1
5-1
5-0
3-0
07
W
IA, D
islo
cate
d W
ork
er
17.2
78
-
11,4
80
-
44-1
6-1
7-0
3-0
07
W
IA, D
islo
cate
d W
ork
er
17.2
78
-
7,8
73
-
2,4
09,7
32
3,8
82,5
63
-
T
ota
l W
IA C
luste
r8,3
15,7
39
12,3
94,4
40
-
To
tal U
.S. D
ep
art
men
t o
f E
co
no
mic
Develo
pm
en
t$8,3
15,7
39
$12,3
94,4
40
$0
U.S
. D
ep
art
men
t o
f T
ran
sp
ort
ati
on
Direct A
ssis
tance -
Federa
l Tra
nsit
Adm
inis
tratio
n
Fed
era
l T
ran
sit
Cap
ital &
Op
er
Asst
Gra
nts
GA
-90-X
339
Regio
nal T
ransit
Imple
menta
tion
20.5
07
-
337,2
89
-
GA
-2017-0
13-0
05307 F
ulto
n C
ounty
Tra
nsit
Maste
r P
lan
20.5
07
-
644,7
66
-
GA
-2017-0
08-0
0JA
RC
20.5
07
137,0
00
250,0
00
-
GA
-95-X
026-0
0A
tlanta
Beltl
ine P
roje
ct
20.5
07
163,2
07
204,0
09
-
300,2
07
1,4
36,0
64
-
GA
-26-0
008-0
0T
MC
Pla
tform
for
One-C
lick
20.5
14
72,9
17
-
GA
-2017-0
09-0
0R
ides to W
elln
ess
20.5
14
6,2
52
96,2
90
-
6,2
52
169,2
07
-
See s
epara
tely
issued S
ingle
Audit
Report
114
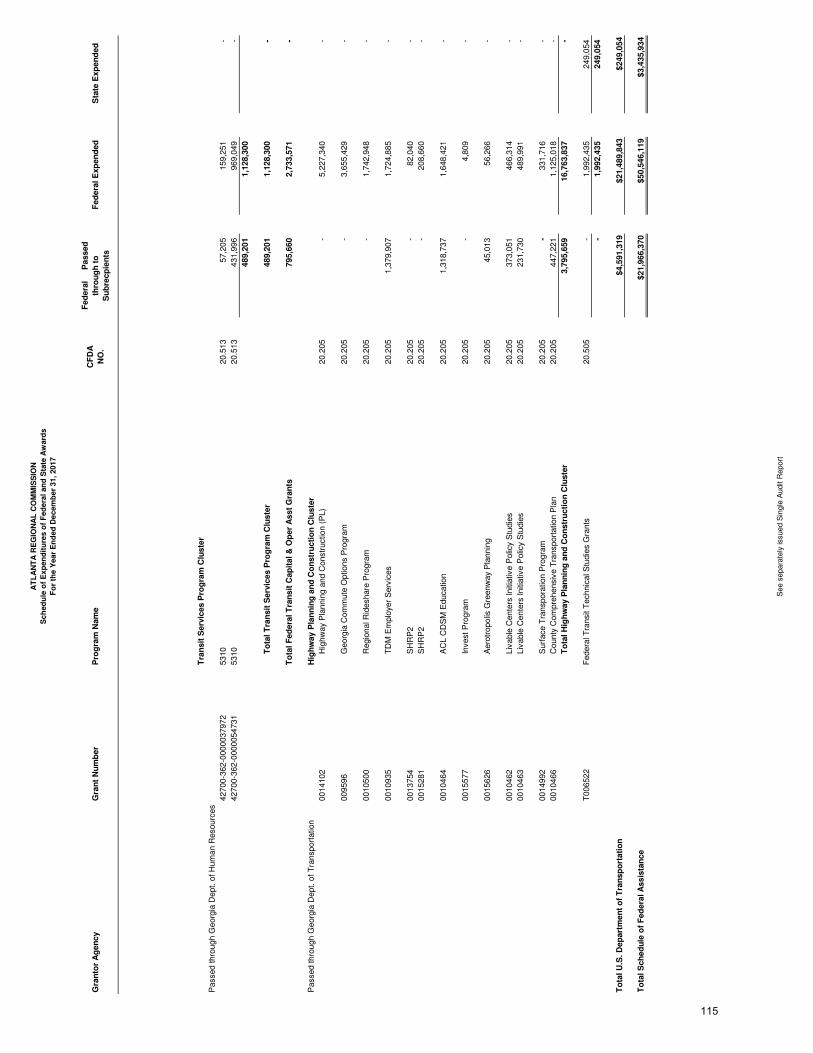
AT
LA
NT
A R
EG
ION
AL
CO
MM
ISS
ION
Sch
ed
ule
of
Exp
en
dit
ure
s o
f F
ed
era
l an
d S
tate
Aw
ard
s
Fo
r th
e Y
ear
En
ded
Decem
ber
31, 2017
Gra
nto
r A
gen
cy
Gra
nt
Nu
mb
er
Pro
gra
m N
am
eC
FD
A
NO
.
Fed
era
l P
assed
thro
ug
h t
o
Su
bre
cp
ien
ts
Fed
era
l E
xp
en
ded
S
tate
Exp
en
ded
Tra
nsit
Serv
ices P
rog
ram
Clu
ste
r
Passed thro
ugh G
eorg
ia D
ept. o
f H
um
an R
esourc
es
42700-3
62-0
000037972
5310
20.5
13
57,2
05
159,2
51
-
42700-3
62-0
000054731
5310
20.5
13
431,9
96
969,0
49
-
489,2
01
1,1
28,3
00
T
ota
l T
ran
sit
Serv
ices P
rog
ram
Clu
ste
r489,2
01
1,1
28,3
00
-
To
tal F
ed
era
l T
ran
sit
Cap
ital &
Op
er
Asst
Gra
nts
795,6
60
2,7
33,5
71
-
Passed thro
ugh G
eorg
ia D
ept. o
f T
ransport
atio
nH
igh
way
Pla
nn
ing
an
d C
on
str
ucti
on
Clu
ste
r
0014102
H
ighw
ay
Pla
nnin
g a
nd C
onstr
uctio
n (
PL)
20.2
05
-
5,2
27,3
40
-
009596
G
eorg
ia C
om
mute
Optio
ns P
rogra
m20.2
05
-
3,6
55,4
29
-
0010500
R
egio
nal R
ideshare
Pro
gra
m20.2
05
-
1,7
42,9
48
-
0010935
T
DM
Em
plo
yer
Serv
ices
20.2
05
1,3
79,9
07
1,7
24,8
85
-
0013754
S
HR
P2
20.2
05
-
82,0
40
-
0015281
S
HR
P2
20.2
05
-
208,6
60
-
0010464
A
CL C
DS
M E
ducatio
n20.2
05
1,3
18,7
37
1,6
48,4
21
-
0015577
Invest P
rogra
m20.2
05
-
4,8
09
-
0015626
A
ero
tropolis
Gre
enw
ay
Pla
nnin
g20.2
05
45,0
13
56,2
66
-
0010462
L
ivable
Cente
rs Initi
ativ
e P
olic
y S
tudie
s20.2
05
373,0
51
466,3
14
-
0010463
L
ivable
Cente
rs Initi
ativ
e P
olic
y S
tudie
s20.2
05
231,7
30
489,9
91
-
0014992
S
urf
ace T
ranspora
tion P
rogra
m20.2
05
-
331,7
16
-
0010466
C
ounty
Com
pre
hensiv
e T
ransport
atio
n P
lan
20.2
05
447,2
21
1,1
25,0
18
-
T
ota
l H
igh
way
Pla
nn
ing
an
d C
on
str
ucti
on
Clu
ste
r3,7
95,6
59
16,7
63,8
37
-
T006522
Federa
l Tra
nsit
Technic
al S
tudie
s G
rants
20.5
05
-
1,9
92,4
35
249,0
54
-
1,9
92,4
35
249,0
54
To
tal U
.S. D
ep
art
men
t o
f T
ran
sp
ort
ati
on
$4,5
91,3
19
$21,4
89,8
43
$249,0
54
To
tal S
ch
ed
ule
of
Fed
era
l A
ssis
tan
ce
$21,9
66,3
70
$50,5
46,1
19
$3,4
35,9
34
See s
epara
tely
issued S
ingle
Audit
Report
115
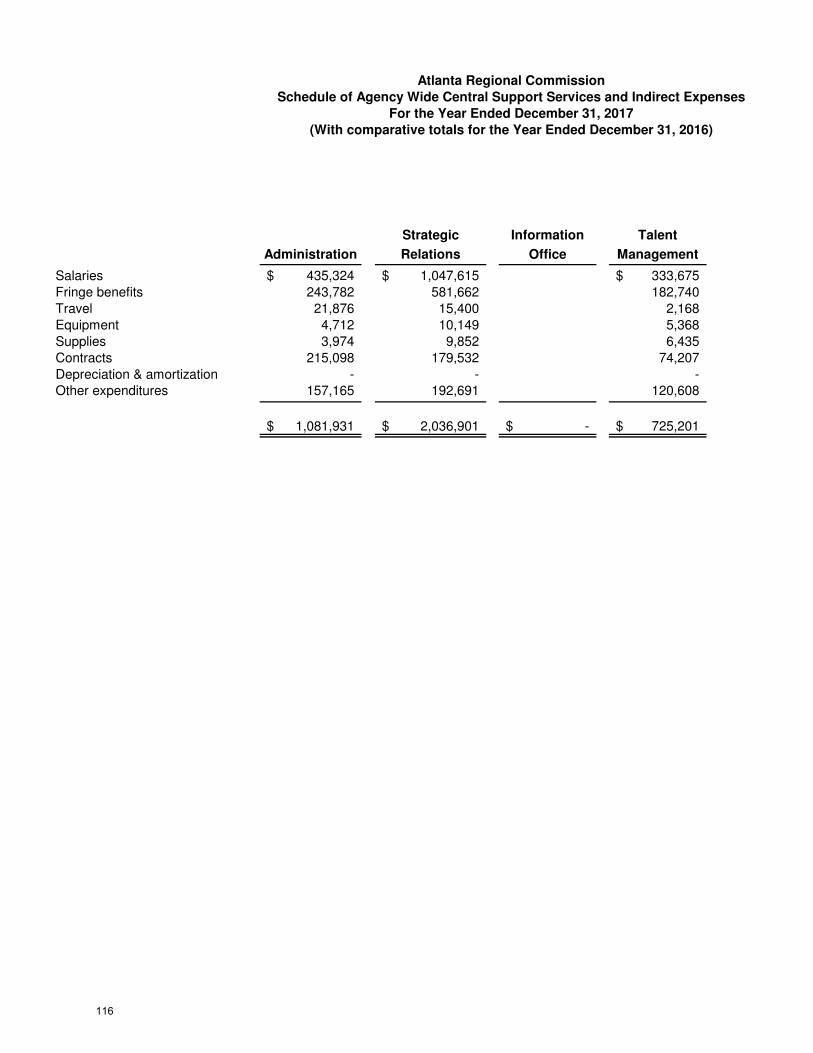
For the Year Ended December 31, 2017
(With comparative totals for the Year Ended December 31, 2016)
Strategic Information Talent
Administration Relations Office Management
Salaries 435,324$ 1,047,615$ 333,675$
Fringe benefits 243,782 581,662 182,740
Travel 21,876 15,400 2,168
Equipment 4,712 10,149 5,368
Supplies 3,974 9,852 6,435
Contracts 215,098 179,532 74,207
Depreciation & amortization - - - Other expenditures 157,165 192,691 120,608
1,081,931$ 2,036,901$ -$ 725,201$
Atlanta Regional Commission
Schedule of Agency Wide Central Support Services and Indirect Expenses
116
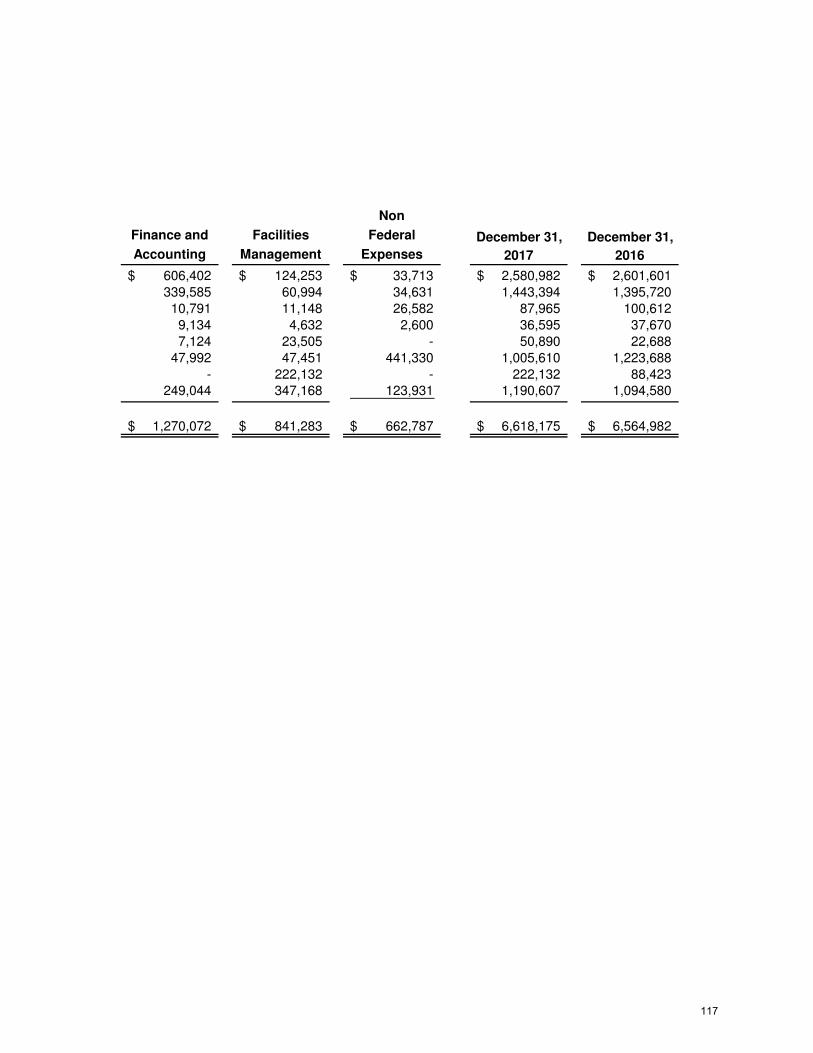
Non
Finance and Facilities Federal December 31, December 31,
Accounting Management Expenses 2017 2016
606,402$ 124,253$ 33,713$ 2,580,982$ 2,601,601$
339,585 60,994 34,631 1,443,394 1,395,720
10,791 11,148 26,582 87,965 100,612
9,134 4,632 2,600 36,595 37,670
7,124 23,505 - 50,890 22,688
47,992 47,451 441,330 1,005,610 1,223,688
- 222,132 - 222,132 88,423 249,044 347,168 123,931 1,190,607 1,094,580
1,270,072$ 841,283$ 662,787$ 6,618,175$ 6,564,982$
117
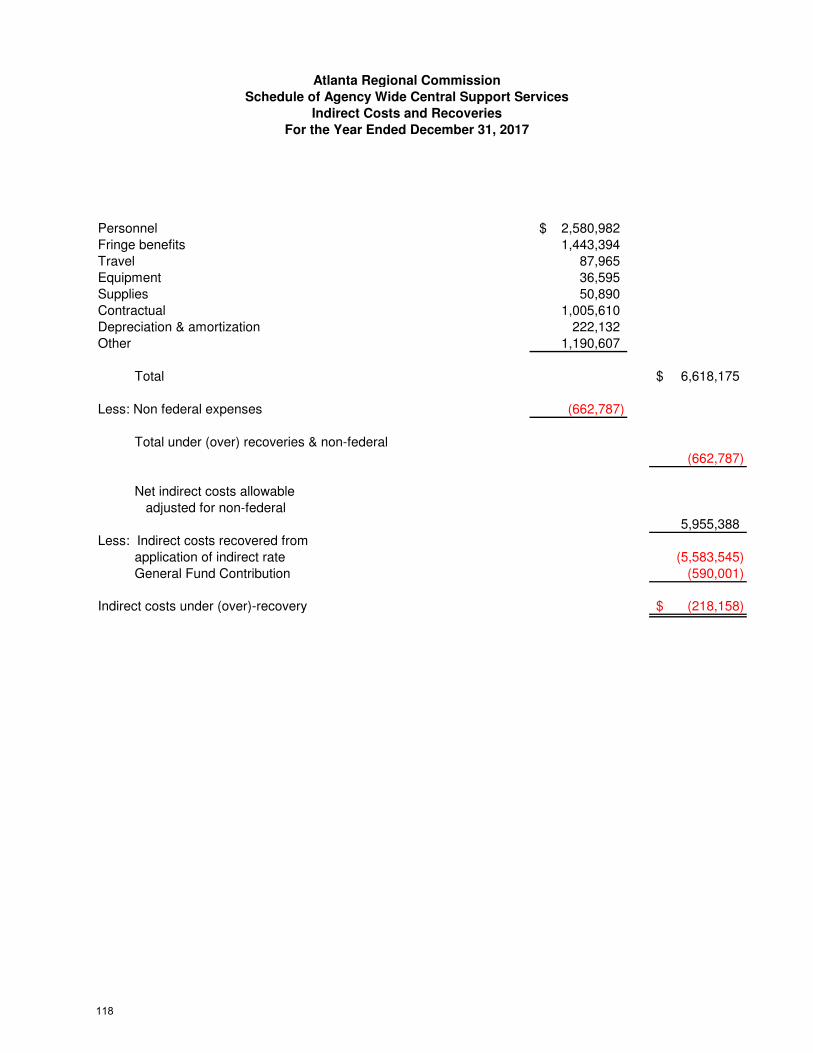
Indirect Costs and Recoveries
For the Year Ended December 31, 2017
Personnel 2,580,982$
Fringe benefits 1,443,394
Travel 87,965
Equipment 36,595
Supplies 50,890
Contractual 1,005,610
Depreciation & amortization 222,132
Other 1,190,607
Total 6,618,175$
Less: Non federal expenses (662,787)
Total under (over) recoveries & non-federal
(662,787)
Net indirect costs allowable
adjusted for non-federal
5,955,388
Less: Indirect costs recovered from
application of indirect rate (5,583,545)
General Fund Contribution (590,001)
Indirect costs under (over)-recovery (218,158)$
Schedule of Agency Wide Central Support Services
Atlanta Regional Commission
118
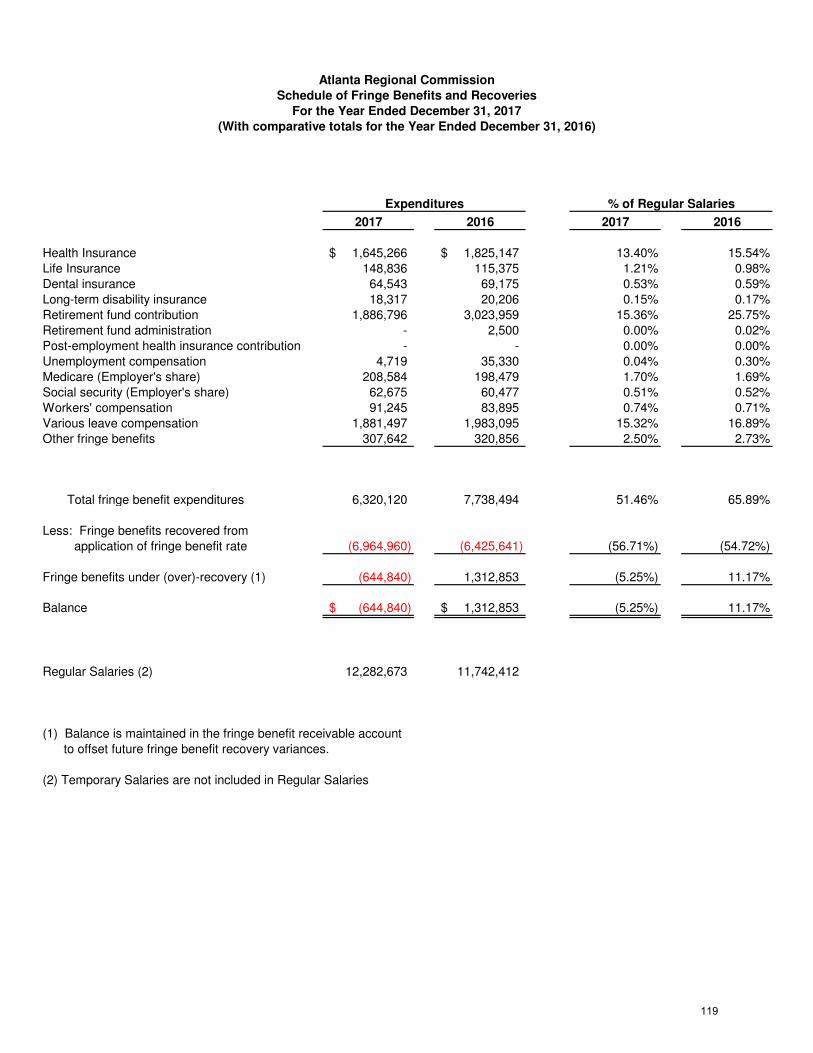
Atlanta Regional Commission
For the Year Ended December 31, 2017
(With comparative totals for the Year Ended December 31, 2016)
Expenditures % of Regular Salaries
2017 2016 2017 2016
Health Insurance 1,645,266$ 1,825,147$ 13.40% 15.54%
Life Insurance 148,836 115,375 1.21% 0.98%
Dental insurance 64,543 69,175 0.53% 0.59%
Long-term disability insurance 18,317 20,206 0.15% 0.17%
Retirement fund contribution 1,886,796 3,023,959 15.36% 25.75%
Retirement fund administration - 2,500 0.00% 0.02%
Post-employment health insurance contribution - - 0.00% 0.00%
Unemployment compensation 4,719 35,330 0.04% 0.30%
Medicare (Employer's share) 208,584 198,479 1.70% 1.69%
Social security (Employer's share) 62,675 60,477 0.51% 0.52%
Workers' compensation 91,245 83,895 0.74% 0.71%
Various leave compensation 1,881,497 1,983,095 15.32% 16.89%
Other fringe benefits 307,642 320,856 2.50% 2.73%
Total fringe benefit expenditures 6,320,120 7,738,494 51.46% 65.89%
Less: Fringe benefits recovered from
application of fringe benefit rate (6,964,960) (6,425,641) (56.71%) (54.72%)
Fringe benefits under (over)-recovery (1) (644,840) 1,312,853 (5.25%) 11.17%
Balance (644,840)$ 1,312,853$ (5.25%) 11.17%
Regular Salaries (2) 12,282,673 11,742,412
(1) Balance is maintained in the fringe benefit receivable account
to offset future fringe benefit recovery variances.
(2) Temporary Salaries are not included in Regular Salaries
Schedule of Fringe Benefits and Recoveries
119

Atla
nta
Reg
iona
l Com
mis
sion
Sc
hedu
le o
f Ins
uran
ce In
For
ce
Dec
embe
r 31
, 201
7
Typ
e of
C
over
age/
Nam
e of
C
ompa
ny
Polic
y N
umbe
r E
ffec
tive
Pe
riod
D
etai
ls o
f Cov
erag
e L
iabi
lity
Lim
its
Gen
eral
Lia
bilit
y &
La
w E
nfor
cem
ent
Liab
ility
/GIR
MA
A
T-3
Con
tinuo
us
Incl
udes
Per
sona
l &
Adv
ertis
ing
Inju
ry,
Prod
ucts
/Com
plet
ed
Ope
ratio
ns, F
ailu
re to
Su
pply
Util
ities
, Fire
Le
gal L
iabi
lity
and
Law
Enf
orce
men
t Li
abili
ty
$5,0
00,0
00 fo
r eac
h lia
bilit
y lin
e; U
nlim
ited
Gen
eral
Agg
rega
te; $
25,0
00,0
00
Prod
ucts
/Com
plet
ed O
pera
tions
Agg
rega
te;
$25,
000,
000
Failu
re to
Sup
ply
Util
ities
Agg
rega
te
Publ
ic
Off
icia
ls/E
rror
s &
Om
issi
ons
Liab
ility
/GIR
MA
AT-
3 C
ontin
uous
W
rong
ful A
cts o
r O
ccur
renc
es
$5,0
00,0
00 fo
r eac
h oc
curr
ence
; $25
,000
,000
A
ggre
gate
Lim
it
Aut
omob
ile
Liab
ility
/GIR
MA
A
T-3
Con
tinuo
us
Sing
le O
ccur
renc
e,
Uni
nsur
ed M
otor
ists
, H
ired/
Non
-Ow
ned
$5,0
00,0
00 fo
r Com
bine
d Si
ngle
Occ
urre
nce
Lim
it, U
nins
ured
Mot
oris
ts a
nd H
ire “
& N
on-
Ow
ned.
Med
ical
pay
men
ts a
re E
xclu
ded
Crim
e &
Fi
delit
y/G
IRM
A
AT-
3 C
ontin
uous
Bla
nket
Em
ploy
ee
Dis
hone
sty,
For
gery
or
Alte
ratio
n,
Com
pute
r Crim
e,
Mon
ey &
Sec
uriti
es
$500
,000
for e
ach
cove
rage
line
Prop
erty
/GIR
MA
A
T-3
Con
tinuo
us
Tota
l Ins
ured
Val
ues,
Bla
nket
Bui
ldin
g &
C
onte
nts;
Com
pute
rs
(ED
P); F
lood
, Ea
rthqu
ake
$5,1
45,1
27 fo
r Tot
al In
sure
d V
alue
s; $
5,14
5,12
7 (e
a) fo
r, Fl
ood
and
Earth
quak
e; R
epla
cem
ent C
ost
for B
uild
ing
& C
onte
nts;
Act
ual C
ash
Val
ue fo
r M
obile
Equ
ipm
ent
120
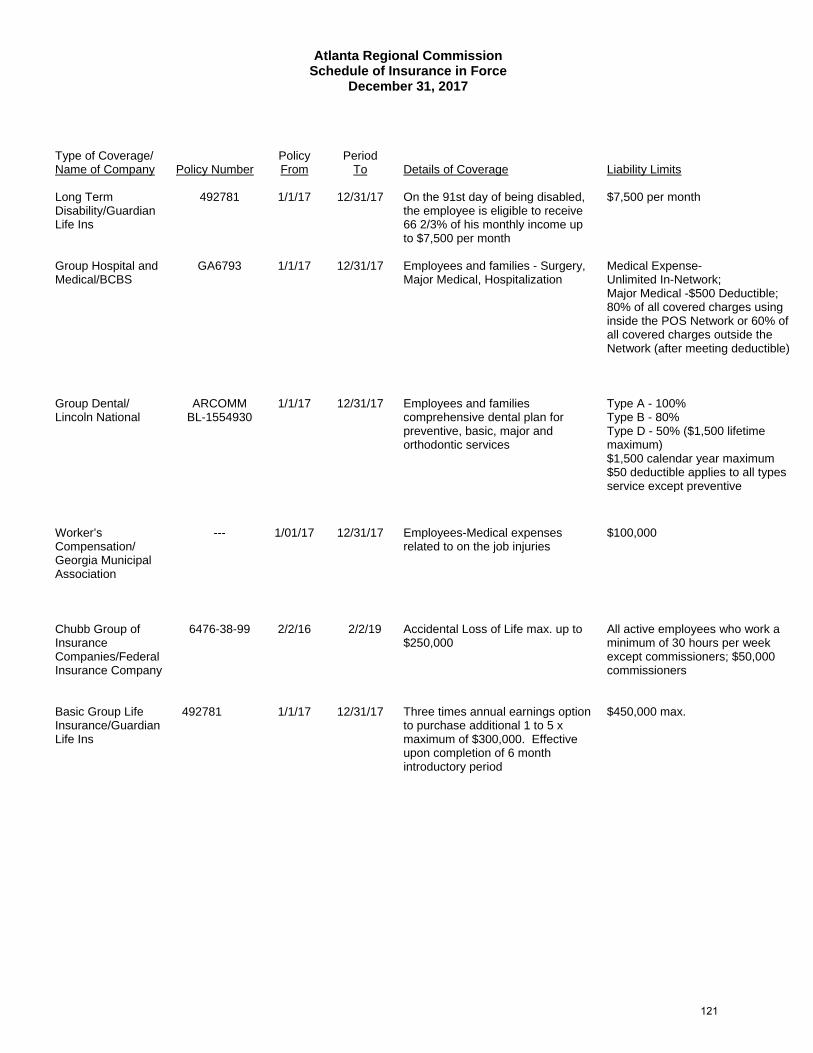
Atlanta Regional Commission Schedule of Insurance in Force
December 31, 2017
Type of Coverage/ Name of Company
Policy Number
Policy From
Period To
Details of Coverage
Liability Limits
Long Term Disability/Guardian Life Ins
492781 1/1/17 12/31/17 On the 91st day of being disabled, the employee is eligible to receive 66 2/3% of his monthly income up to $7,500 per month
$7,500 per month
Group Hospital and Medical/BCBS
GA6793 1/1/17 12/31/17 Employees and families - Surgery, Major Medical, Hospitalization
Medical Expense- Unlimited In-Network; Major Medical -$500 Deductible; 80% of all covered charges using inside the POS Network or 60% of all covered charges outside the Network (after meeting deductible)
Group Dental/ Lincoln National
ARCOMM BL-1554930
1/1/17 12/31/17 Employees and families comprehensive dental plan for preventive, basic, major and orthodontic services
Type A - 100% Type B - 80% Type D - 50% ($1,500 lifetime maximum) $1,500 calendar year maximum $50 deductible applies to all types service except preventive
Worker’s Compensation/ Georgia Municipal Association
--- 1/01/17 12/31/17 Employees-Medical expenses related to on the job injuries
$100,000
Chubb Group of Insurance Companies/Federal Insurance Company
6476-38-99 2/2/16 2/2/19 Accidental Loss of Life max. up to $250,000
All active employees who work a minimum of 30 hours per week except commissioners; $50,000 commissioners
Basic Group Life Insurance/Guardian Life Ins
492781 1/1/17 12/31/17 Three times annual earnings option to purchase additional 1 to 5 x maximum of $300,000. Effective upon completion of 6 month introductory period
$450,000 max.
121
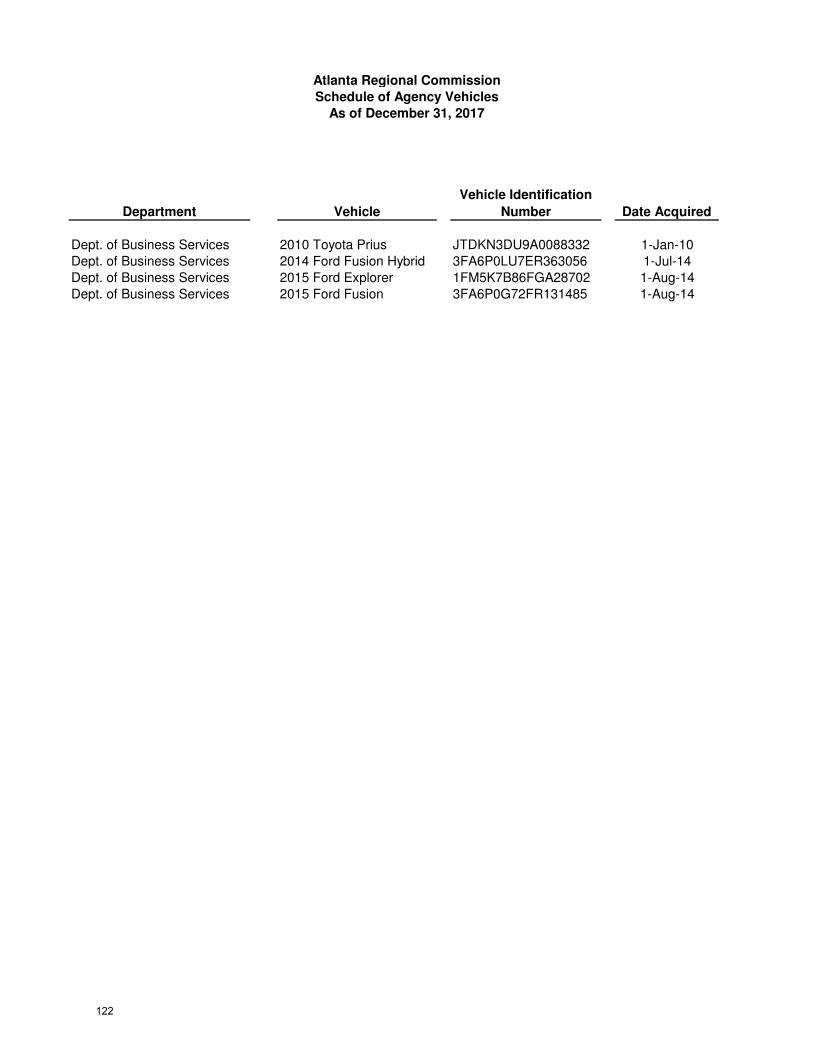
Department Vehicle
Vehicle Identification
Number Date Acquired
Dept. of Business Services 2010 Toyota Prius JTDKN3DU9A0088332 1-Jan-10
Dept. of Business Services 2014 Ford Fusion Hybrid 3FA6P0LU7ER363056 1-Jul-14
Dept. of Business Services 2015 Ford Explorer 1FM5K7B86FGA28702 1-Aug-14
Dept. of Business Services 2015 Ford Fusion 3FA6P0G72FR131485 1-Aug-14
Atlanta Regional Commission
As of December 31, 2017
Schedule of Agency Vehicles
122
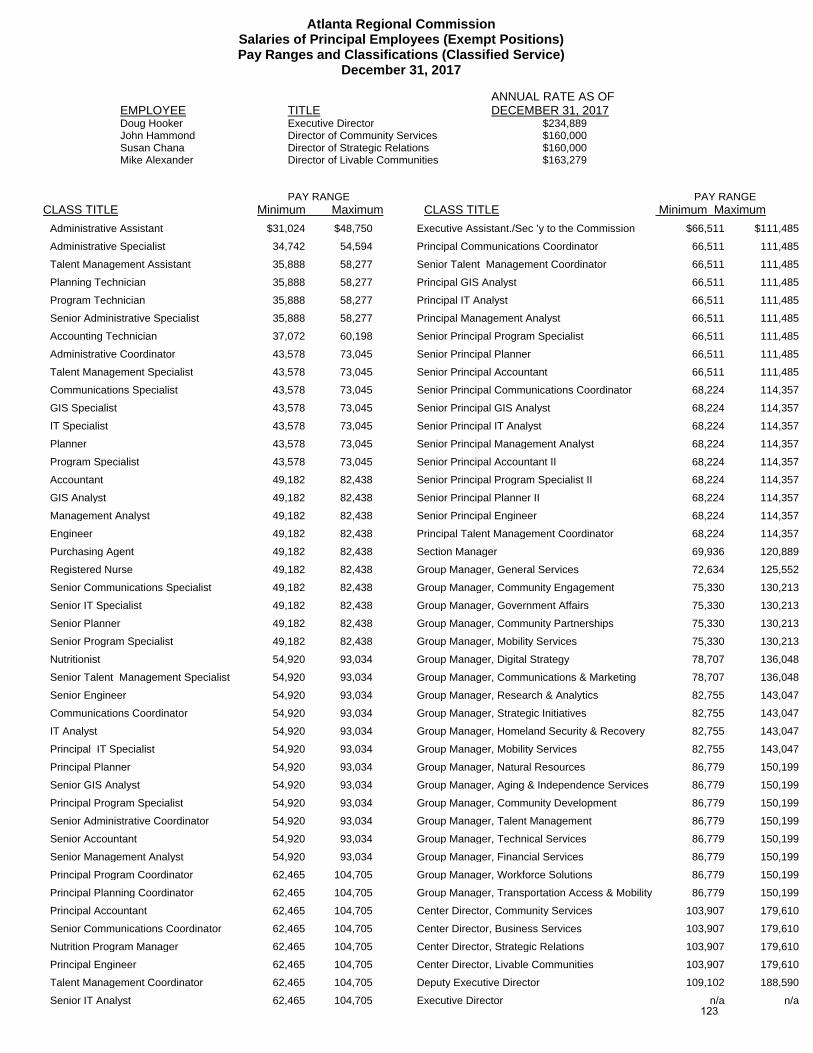
Atlanta Regional Commission Salaries of Principal Employees (Exempt Positions) Pay Ranges and Classifications (Classified Service)
December 31, 2017
ANNUAL RATE AS OF EMPLOYEE TITLE DECEMBER 31, 2017 Doug Hooker Executive Director $234,889 John Hammond Director of Community Services $160,000 Susan Chana Director of Strategic Relations $160,000 Mike Alexander Director of Livable Communities $163,279 PAY RANGE PAY RANGE CLASS TITLE Minimum Maximum CLASS TITLE Minimum Maximum
Administrative Assistant $31,024 $48,750 Executive Assistant./Sec ’y to the Commission $66,511 $111,485 Administrative Specialist 34,742 54,594 Principal Communications Coordinator 66,511 111,485 Talent Management Assistant 35,888 58,277 Senior Talent Management Coordinator 66,511 111,485 Planning Technician 35,888 58,277 Principal GIS Analyst 66,511 111,485 Program Technician 35,888 58,277 Principal IT Analyst 66,511 111,485 Senior Administrative Specialist 35,888 58,277 Principal Management Analyst 66,511 111,485 Accounting Technician 37,072 60,198 Senior Principal Program Specialist 66,511 111,485 Administrative Coordinator 43,578 73,045 Senior Principal Planner 66,511 111,485 Talent Management Specialist 43,578 73,045 Senior Principal Accountant 66,511 111,485 Communications Specialist 43,578 73,045 Senior Principal Communications Coordinator 68,224 114,357 GIS Specialist 43,578 73,045 Senior Principal GIS Analyst 68,224 114,357 IT Specialist 43,578 73,045 Senior Principal IT Analyst 68,224 114,357 Planner 43,578 73,045 Senior Principal Management Analyst 68,224 114,357 Program Specialist 43,578 73,045 Senior Principal Accountant II 68,224 114,357 Accountant 49,182 82,438 Senior Principal Program Specialist II 68,224 114,357 GIS Analyst 49,182 82,438 Senior Principal Planner II 68,224 114,357 Management Analyst 49,182 82,438 Senior Principal Engineer 68,224 114,357 Engineer 49,182 82,438 Principal Talent Management Coordinator 68,224 114,357 Purchasing Agent 49,182 82,438 Section Manager 69,936 120,889 Registered Nurse 49,182 82,438 Group Manager, General Services 72,634 125,552 Senior Communications Specialist 49,182 82,438 Group Manager, Community Engagement 75,330 130,213 Senior IT Specialist 49,182 82,438 Group Manager, Government Affairs 75,330 130,213 Senior Planner 49,182 82,438 Group Manager, Community Partnerships 75,330 130,213 Senior Program Specialist 49,182 82,438 Group Manager, Mobility Services 75,330 130,213 Nutritionist 54,920 93,034 Group Manager, Digital Strategy 78,707 136,048 Senior Talent Management Specialist 54,920 93,034 Group Manager, Communications & Marketing 78,707 136,048 Senior Engineer 54,920 93,034 Group Manager, Research & Analytics 82,755 143,047 Communications Coordinator 54,920 93,034 Group Manager, Strategic Initiatives 82,755 143,047 IT Analyst 54,920 93,034 Group Manager, Homeland Security & Recovery 82,755 143,047 Principal IT Specialist 54,920 93,034 Group Manager, Mobility Services 82,755 143,047 Principal Planner 54,920 93,034 Group Manager, Natural Resources 86,779 150,199 Senior GIS Analyst 54,920 93,034 Group Manager, Aging & Independence Services 86,779 150,199 Principal Program Specialist 54,920 93,034 Group Manager, Community Development 86,779 150,199 Senior Administrative Coordinator 54,920 93,034 Group Manager, Talent Management 86,779 150,199 Senior Accountant 54,920 93,034 Group Manager, Technical Services 86,779 150,199 Senior Management Analyst 54,920 93,034 Group Manager, Financial Services 86,779 150,199 Principal Program Coordinator 62,465 104,705 Group Manager, Workforce Solutions 86,779 150,199 Principal Planning Coordinator 62,465 104,705 Group Manager, Transportation Access & Mobility 86,779 150,199 Principal Accountant 62,465 104,705 Center Director, Community Services 103,907 179,610 Senior Communications Coordinator 62,465 104,705 Center Director, Business Services 103,907 179,610 Nutrition Program Manager 62,465 104,705 Center Director, Strategic Relations 103,907 179,610 Principal Engineer 62,465 104,705 Center Director, Livable Communities 103,907 179,610 Talent Management Coordinator 62,465 104,705 Deputy Executive Director 109,102 188,590 Senior IT Analyst 62,465 104,705 Executive Director n/a n/a
123

Employee Title Wages Travel
Alexander, Michael D Ctr. Dir. Livable Communities $163,275.00 $6,147.00
Allen, Julius A Principal Program Specialist $58,717.00 $237.00
Allen, Leslie Temporary $76,950.00 $0.00
Allown, Michael F Senior Accountant $85,721.00 $0.00
Alsobrook, Cora L Program Technician/CC $26,489.00 $0.00
Alter, Aaron Temporary $1,564.00 $0.00
Amedu, Lora E Sr. Program Specialist $56,980.00 $169.00
Anderson, Jacquelyn l Senior Management Analyst $71,523.00 $29.00
Apter, Rebecca Administrative Coordinator $32,000.00 $10.00
Bailie, Ana L Senior Program Specialist $62,608.00 $0.00
Baldwin, Yoll Senior Program Specialist $52,476.00 $1,757.00
Barrett, JeanHee P Senior Principal Planner $93,888.00 $516.00
Barrett, Stephen R Principal Planning Coordinator $76,535.00 $4,136.00
Beamer, Jennifer D Senior Program Specialist $66,411.00 $2,878.00
Bear, Karen A Temporary $5,546.00 $0.00
Bellows, Layla Temporary $6,766.00 $0.00
Benefield, Sheila C Division Manager, Talent Mgmt $135,078.00 $0.00
Berg, David Temporary $14,196.00 $0.00
Berry, M H Senior Principal Mgmt. Analyst $101,818.00 $3,757.00
Beverly, Sylvia E Senior Program Specialist $59,785.00 $129.00
Blakeney, Roseanne Sr. Administrative Specialist $39,014.00 $57.00
Blocker, Christopher Senior Program Specialist $8,031.00 $115.00
Blumberg, Mary T Senior Principal Program Spec $102,294.00 $2,574.00
Boucard, Jazmine Temporary $1,688.00 $0.00
Bradshaw, Patrick A Principal Planning Coordinator $69,867.00 $192.00
Brasgalla, Karina Temporary $2,842.00 $0.00
Brathwaite, Haydn Principal Management Analyst $107,775.00 $0.00
Brown, Danielle D Program Technician $46,939.00 $1,304.00
Brown, Tamika B Program Specialist $51,143.00 $0.00
Browne, Samantha Temporary $5,026.00 $0.00
Brunson, Gia L Senior Program Specialist $55,595.00 $0.00
Bryan III, I Emerson Temporary $149,158.00 $0.00
Bundrage, Marquita Administrative Coordinator $29,774.00 $0.00
Burgess, Suzanne H Program Section Manager $131,454.00 $2,060.00
Burke , Christopher J Division Manager, General Svcs $117,250.00 $0.00
Burke, Cynthia K Principal Program Coordinator $79,039.00 $790.00
Burns, Elizabeth Temporary $6,629.00 $0.00
Butler, Susan Temporary $3,112.00 $0.00
Butts, Wendy Y Senior Program Specialist $58,958.00 $0.00
Caceda, Leslie S Principal Program Specialist $66,524.00 $3,006.00
Carmenate, Sigal Temporary $6,552.00 $0.00
Carnathan, Michael N Division Manager, Research $118,573.00 $1,170.00
Causby, Stephen W Division Manager, Comm. Partnerships $91,000.00 $3,338.00
Chana, Susan Ctr. Director, Strategic Rel $126,154.00 $3,131.00
Charlot, Henry Senior Principal Program Spec $96,869.00 $1,510.00
Atlanta Regional Commission
Schedule of Employee Salary and Travel Expenses
for the Year Ended December 31, 2017
124
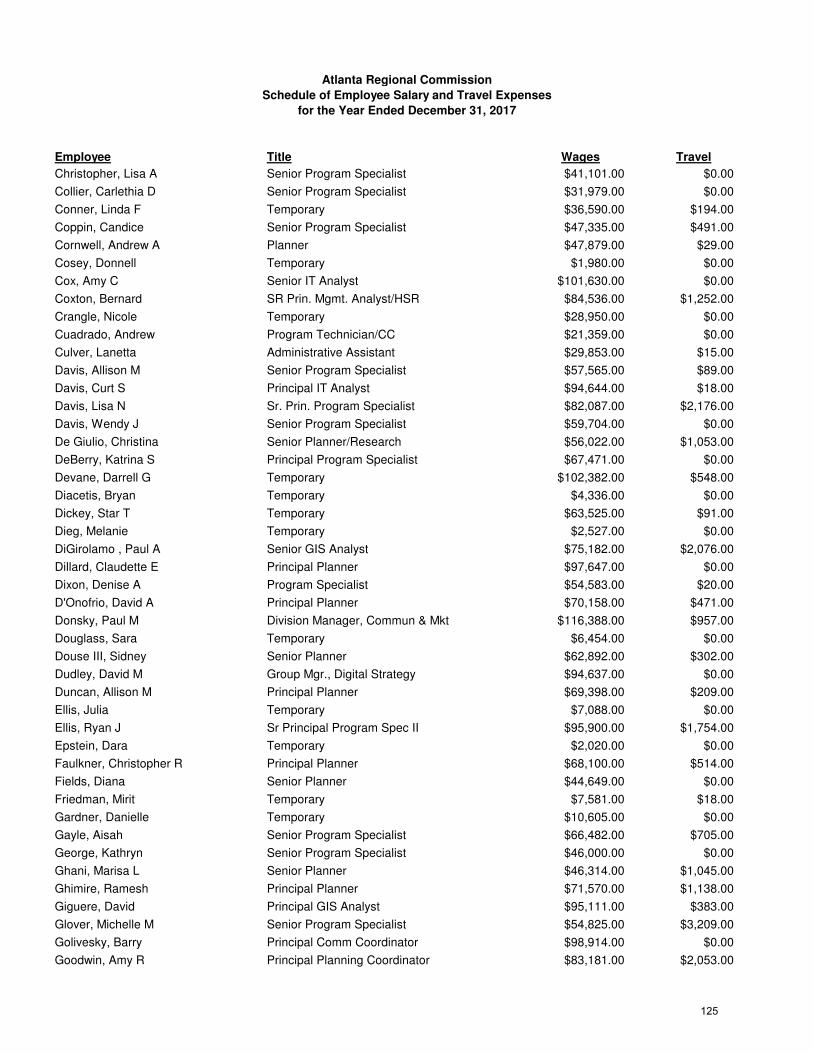
Employee Title Wages Travel
Atlanta Regional Commission
Schedule of Employee Salary and Travel Expenses
for the Year Ended December 31, 2017
Christopher, Lisa A Senior Program Specialist $41,101.00 $0.00
Collier, Carlethia D Senior Program Specialist $31,979.00 $0.00
Conner, Linda F Temporary $36,590.00 $194.00
Coppin, Candice Senior Program Specialist $47,335.00 $491.00
Cornwell, Andrew A Planner $47,879.00 $29.00
Cosey, Donnell Temporary $1,980.00 $0.00
Cox, Amy C Senior IT Analyst $101,630.00 $0.00
Coxton, Bernard SR Prin. Mgmt. Analyst/HSR $84,536.00 $1,252.00
Crangle, Nicole Temporary $28,950.00 $0.00
Cuadrado, Andrew Program Technician/CC $21,359.00 $0.00
Culver, Lanetta Administrative Assistant $29,853.00 $15.00
Davis, Allison M Senior Program Specialist $57,565.00 $89.00
Davis, Curt S Principal IT Analyst $94,644.00 $18.00
Davis, Lisa N Sr. Prin. Program Specialist $82,087.00 $2,176.00
Davis, Wendy J Senior Program Specialist $59,704.00 $0.00
De Giulio, Christina Senior Planner/Research $56,022.00 $1,053.00
DeBerry, Katrina S Principal Program Specialist $67,471.00 $0.00
Devane, Darrell G Temporary $102,382.00 $548.00
Diacetis, Bryan Temporary $4,336.00 $0.00
Dickey, Star T Temporary $63,525.00 $91.00
Dieg, Melanie Temporary $2,527.00 $0.00
DiGirolamo , Paul A Senior GIS Analyst $75,182.00 $2,076.00
Dillard, Claudette E Principal Planner $97,647.00 $0.00
Dixon, Denise A Program Specialist $54,583.00 $20.00
D'Onofrio, David A Principal Planner $70,158.00 $471.00
Donsky, Paul M Division Manager, Commun & Mkt $116,388.00 $957.00
Douglass, Sara Temporary $6,454.00 $0.00
Douse III, Sidney Senior Planner $62,892.00 $302.00
Dudley, David M Group Mgr., Digital Strategy $94,637.00 $0.00
Duncan, Allison M Principal Planner $69,398.00 $209.00
Ellis, Julia Temporary $7,088.00 $0.00
Ellis, Ryan J Sr Principal Program Spec II $95,900.00 $1,754.00
Epstein, Dara Temporary $2,020.00 $0.00
Faulkner, Christopher R Principal Planner $68,100.00 $514.00
Fields, Diana Senior Planner $44,649.00 $0.00
Friedman, Mirit Temporary $7,581.00 $18.00
Gardner, Danielle Temporary $10,605.00 $0.00
Gayle, Aisah Senior Program Specialist $66,482.00 $705.00
George, Kathryn Senior Program Specialist $46,000.00 $0.00
Ghani, Marisa L Senior Planner $46,314.00 $1,045.00
Ghimire, Ramesh Principal Planner $71,570.00 $1,138.00
Giguere, David Principal GIS Analyst $95,111.00 $383.00
Glover, Michelle M Senior Program Specialist $54,825.00 $3,209.00
Golivesky, Barry Principal Comm Coordinator $98,914.00 $0.00
Goodwin, Amy R Principal Planning Coordinator $83,181.00 $2,053.00
125
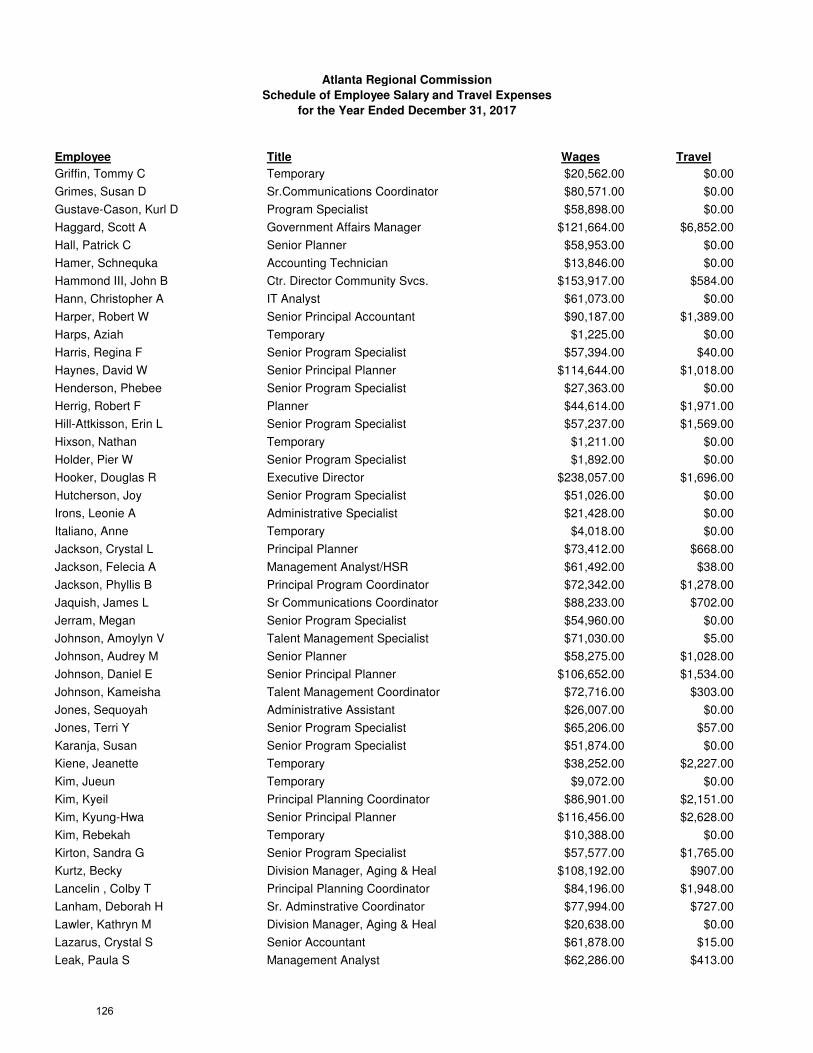
Employee Title Wages Travel
Atlanta Regional Commission
Schedule of Employee Salary and Travel Expenses
for the Year Ended December 31, 2017
Griffin, Tommy C Temporary $20,562.00 $0.00
Grimes, Susan D Sr.Communications Coordinator $80,571.00 $0.00
Gustave-Cason, Kurl D Program Specialist $58,898.00 $0.00
Haggard, Scott A Government Affairs Manager $121,664.00 $6,852.00
Hall, Patrick C Senior Planner $58,953.00 $0.00
Hamer, Schnequka Accounting Technician $13,846.00 $0.00
Hammond III, John B Ctr. Director Community Svcs. $153,917.00 $584.00
Hann, Christopher A IT Analyst $61,073.00 $0.00
Harper, Robert W Senior Principal Accountant $90,187.00 $1,389.00
Harps, Aziah Temporary $1,225.00 $0.00
Harris, Regina F Senior Program Specialist $57,394.00 $40.00
Haynes, David W Senior Principal Planner $114,644.00 $1,018.00
Henderson, Phebee Senior Program Specialist $27,363.00 $0.00
Herrig, Robert F Planner $44,614.00 $1,971.00
Hill-Attkisson, Erin L Senior Program Specialist $57,237.00 $1,569.00
Hixson, Nathan Temporary $1,211.00 $0.00
Holder, Pier W Senior Program Specialist $1,892.00 $0.00
Hooker, Douglas R Executive Director $238,057.00 $1,696.00
Hutcherson, Joy Senior Program Specialist $51,026.00 $0.00
Irons, Leonie A Administrative Specialist $21,428.00 $0.00
Italiano, Anne Temporary $4,018.00 $0.00
Jackson, Crystal L Principal Planner $73,412.00 $668.00
Jackson, Felecia A Management Analyst/HSR $61,492.00 $38.00
Jackson, Phyllis B Principal Program Coordinator $72,342.00 $1,278.00
Jaquish, James L Sr Communications Coordinator $88,233.00 $702.00
Jerram, Megan Senior Program Specialist $54,960.00 $0.00
Johnson, Amoylyn V Talent Management Specialist $71,030.00 $5.00
Johnson, Audrey M Senior Planner $58,275.00 $1,028.00
Johnson, Daniel E Senior Principal Planner $106,652.00 $1,534.00
Johnson, Kameisha Talent Management Coordinator $72,716.00 $303.00
Jones, Sequoyah Administrative Assistant $26,007.00 $0.00
Jones, Terri Y Senior Program Specialist $65,206.00 $57.00
Karanja, Susan Senior Program Specialist $51,874.00 $0.00
Kiene, Jeanette Temporary $38,252.00 $2,227.00
Kim, Jueun Temporary $9,072.00 $0.00
Kim, Kyeil Principal Planning Coordinator $86,901.00 $2,151.00
Kim, Kyung-Hwa Senior Principal Planner $116,456.00 $2,628.00
Kim, Rebekah Temporary $10,388.00 $0.00
Kirton, Sandra G Senior Program Specialist $57,577.00 $1,765.00
Kurtz, Becky Division Manager, Aging & Heal $108,192.00 $907.00
Lancelin , Colby T Principal Planning Coordinator $84,196.00 $1,948.00
Lanham, Deborah H Sr. Adminstrative Coordinator $77,994.00 $727.00
Lawler, Kathryn M Division Manager, Aging & Heal $20,638.00 $0.00
Lazarus, Crystal S Senior Accountant $61,878.00 $15.00
Leak, Paula S Management Analyst $62,286.00 $413.00
126
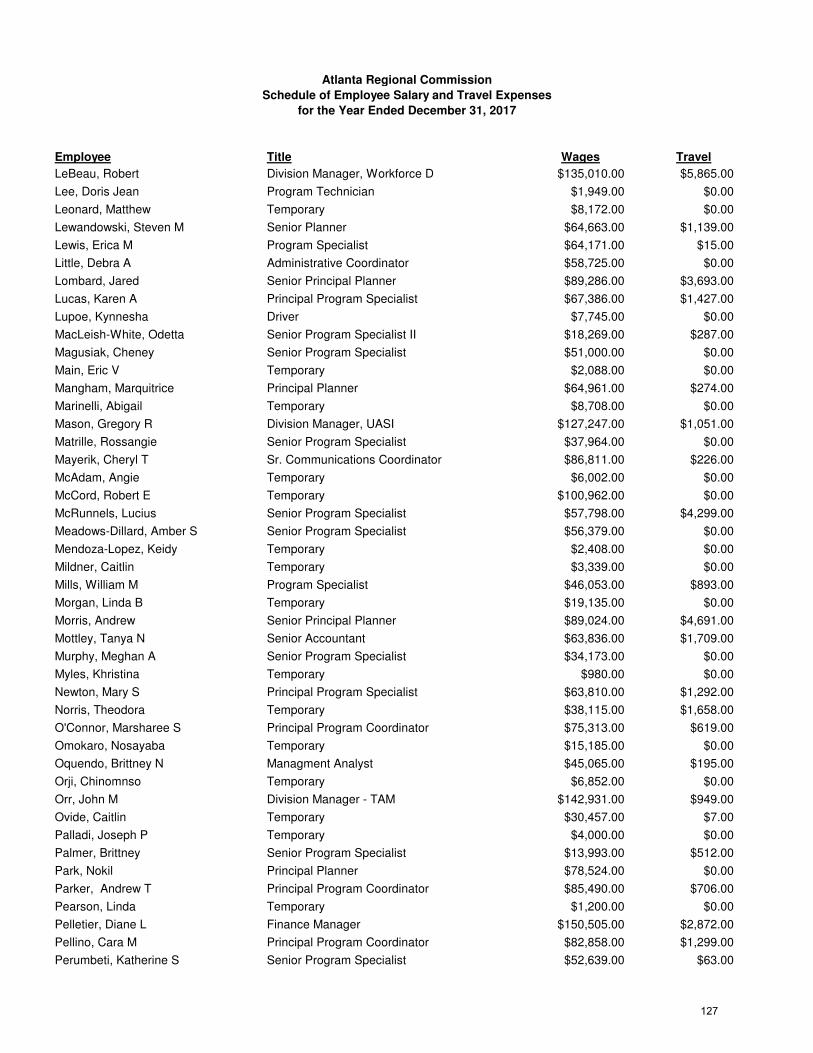
Employee Title Wages Travel
Atlanta Regional Commission
Schedule of Employee Salary and Travel Expenses
for the Year Ended December 31, 2017
LeBeau, Robert Division Manager, Workforce D $135,010.00 $5,865.00
Lee, Doris Jean Program Technician $1,949.00 $0.00
Leonard, Matthew Temporary $8,172.00 $0.00
Lewandowski, Steven M Senior Planner $64,663.00 $1,139.00
Lewis, Erica M Program Specialist $64,171.00 $15.00
Little, Debra A Administrative Coordinator $58,725.00 $0.00
Lombard, Jared Senior Principal Planner $89,286.00 $3,693.00
Lucas, Karen A Principal Program Specialist $67,386.00 $1,427.00
Lupoe, Kynnesha Driver $7,745.00 $0.00
MacLeish-White, Odetta Senior Program Specialist II $18,269.00 $287.00
Magusiak, Cheney Senior Program Specialist $51,000.00 $0.00
Main, Eric V Temporary $2,088.00 $0.00
Mangham, Marquitrice Principal Planner $64,961.00 $274.00
Marinelli, Abigail Temporary $8,708.00 $0.00
Mason, Gregory R Division Manager, UASI $127,247.00 $1,051.00
Matrille, Rossangie Senior Program Specialist $37,964.00 $0.00
Mayerik, Cheryl T Sr. Communications Coordinator $86,811.00 $226.00
McAdam, Angie Temporary $6,002.00 $0.00
McCord, Robert E Temporary $100,962.00 $0.00
McRunnels, Lucius Senior Program Specialist $57,798.00 $4,299.00
Meadows-Dillard, Amber S Senior Program Specialist $56,379.00 $0.00
Mendoza-Lopez, Keidy Temporary $2,408.00 $0.00
Mildner, Caitlin Temporary $3,339.00 $0.00
Mills, William M Program Specialist $46,053.00 $893.00
Morgan, Linda B Temporary $19,135.00 $0.00
Morris, Andrew Senior Principal Planner $89,024.00 $4,691.00
Mottley, Tanya N Senior Accountant $63,836.00 $1,709.00
Murphy, Meghan A Senior Program Specialist $34,173.00 $0.00
Myles, Khristina Temporary $980.00 $0.00
Newton, Mary S Principal Program Specialist $63,810.00 $1,292.00
Norris, Theodora Temporary $38,115.00 $1,658.00
O'Connor, Marsharee S Principal Program Coordinator $75,313.00 $619.00
Omokaro, Nosayaba Temporary $15,185.00 $0.00
Oquendo, Brittney N Managment Analyst $45,065.00 $195.00
Orji, Chinomnso Temporary $6,852.00 $0.00
Orr, John M Division Manager - TAM $142,931.00 $949.00
Ovide, Caitlin Temporary $30,457.00 $7.00
Palladi, Joseph P Temporary $4,000.00 $0.00
Palmer, Brittney Senior Program Specialist $13,993.00 $512.00
Park, Nokil Principal Planner $78,524.00 $0.00
Parker, Andrew T Principal Program Coordinator $85,490.00 $706.00
Pearson, Linda Temporary $1,200.00 $0.00
Pelletier, Diane L Finance Manager $150,505.00 $2,872.00
Pellino, Cara M Principal Program Coordinator $82,858.00 $1,299.00
Perumbeti, Katherine S Senior Program Specialist $52,639.00 $63.00
127
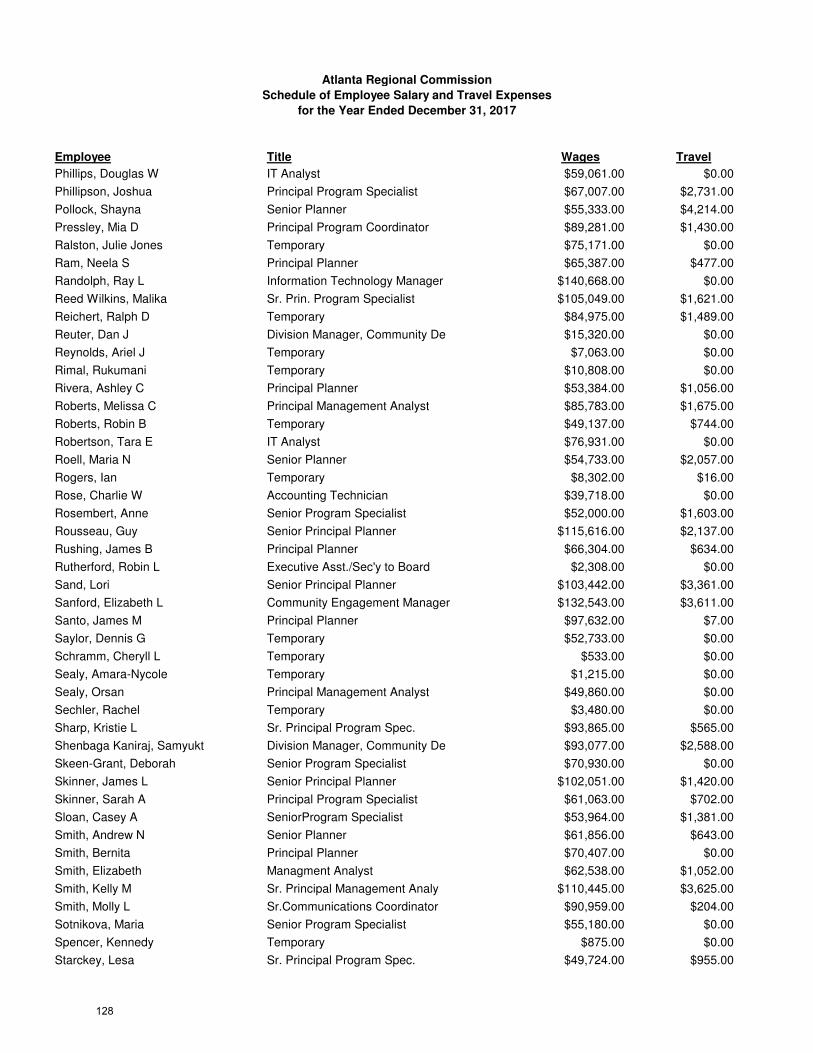
Employee Title Wages Travel
Atlanta Regional Commission
Schedule of Employee Salary and Travel Expenses
for the Year Ended December 31, 2017
Phillips, Douglas W IT Analyst $59,061.00 $0.00
Phillipson, Joshua Principal Program Specialist $67,007.00 $2,731.00
Pollock, Shayna Senior Planner $55,333.00 $4,214.00
Pressley, Mia D Principal Program Coordinator $89,281.00 $1,430.00
Ralston, Julie Jones Temporary $75,171.00 $0.00
Ram, Neela S Principal Planner $65,387.00 $477.00
Randolph, Ray L Information Technology Manager $140,668.00 $0.00
Reed Wilkins, Malika Sr. Prin. Program Specialist $105,049.00 $1,621.00
Reichert, Ralph D Temporary $84,975.00 $1,489.00
Reuter, Dan J Division Manager, Community De $15,320.00 $0.00
Reynolds, Ariel J Temporary $7,063.00 $0.00
Rimal, Rukumani Temporary $10,808.00 $0.00
Rivera, Ashley C Principal Planner $53,384.00 $1,056.00
Roberts, Melissa C Principal Management Analyst $85,783.00 $1,675.00
Roberts, Robin B Temporary $49,137.00 $744.00
Robertson, Tara E IT Analyst $76,931.00 $0.00
Roell, Maria N Senior Planner $54,733.00 $2,057.00
Rogers, Ian Temporary $8,302.00 $16.00
Rose, Charlie W Accounting Technician $39,718.00 $0.00
Rosembert, Anne Senior Program Specialist $52,000.00 $1,603.00
Rousseau, Guy Senior Principal Planner $115,616.00 $2,137.00
Rushing, James B Principal Planner $66,304.00 $634.00
Rutherford, Robin L Executive Asst./Sec'y to Board $2,308.00 $0.00
Sand, Lori Senior Principal Planner $103,442.00 $3,361.00
Sanford, Elizabeth L Community Engagement Manager $132,543.00 $3,611.00
Santo, James M Principal Planner $97,632.00 $7.00
Saylor, Dennis G Temporary $52,733.00 $0.00
Schramm, Cheryll L Temporary $533.00 $0.00
Sealy, Amara-Nycole Temporary $1,215.00 $0.00
Sealy, Orsan Principal Management Analyst $49,860.00 $0.00
Sechler, Rachel Temporary $3,480.00 $0.00
Sharp, Kristie L Sr. Principal Program Spec. $93,865.00 $565.00
Shenbaga Kaniraj, Samyukt Division Manager, Community De $93,077.00 $2,588.00
Skeen-Grant, Deborah Senior Program Specialist $70,930.00 $0.00
Skinner, James L Senior Principal Planner $102,051.00 $1,420.00
Skinner, Sarah A Principal Program Specialist $61,063.00 $702.00
Sloan, Casey A SeniorProgram Specialist $53,964.00 $1,381.00
Smith, Andrew N Senior Planner $61,856.00 $643.00
Smith, Bernita Principal Planner $70,407.00 $0.00
Smith, Elizabeth Managment Analyst $62,538.00 $1,052.00
Smith, Kelly M Sr. Principal Management Analy $110,445.00 $3,625.00
Smith, Molly L Sr.Communications Coordinator $90,959.00 $204.00
Sotnikova, Maria Senior Program Specialist $55,180.00 $0.00
Spencer, Kennedy Temporary $875.00 $0.00
Starckey, Lesa Sr. Principal Program Spec. $49,724.00 $955.00
128
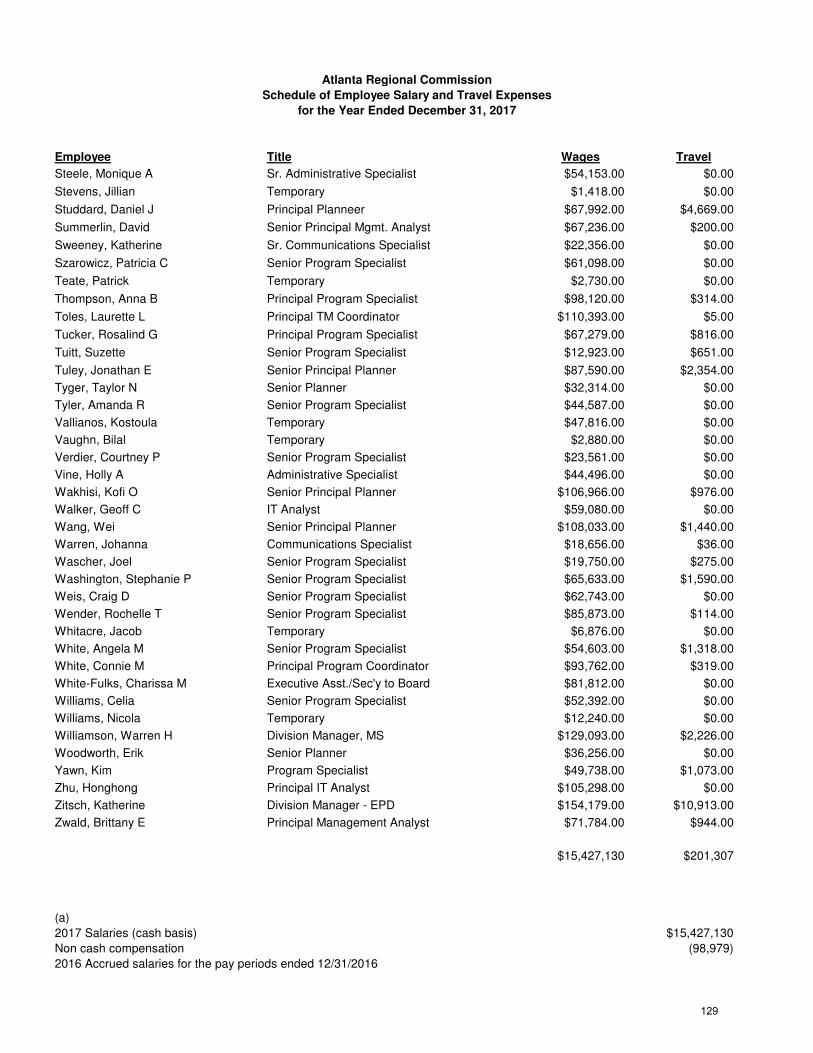
Employee Title Wages Travel
Atlanta Regional Commission
Schedule of Employee Salary and Travel Expenses
for the Year Ended December 31, 2017
Steele, Monique A Sr. Administrative Specialist $54,153.00 $0.00
Stevens, Jillian Temporary $1,418.00 $0.00
Studdard, Daniel J Principal Planneer $67,992.00 $4,669.00
Summerlin, David Senior Principal Mgmt. Analyst $67,236.00 $200.00
Sweeney, Katherine Sr. Communications Specialist $22,356.00 $0.00
Szarowicz, Patricia C Senior Program Specialist $61,098.00 $0.00
Teate, Patrick Temporary $2,730.00 $0.00
Thompson, Anna B Principal Program Specialist $98,120.00 $314.00
Toles, Laurette L Principal TM Coordinator $110,393.00 $5.00
Tucker, Rosalind G Principal Program Specialist $67,279.00 $816.00
Tuitt, Suzette Senior Program Specialist $12,923.00 $651.00
Tuley, Jonathan E Senior Principal Planner $87,590.00 $2,354.00
Tyger, Taylor N Senior Planner $32,314.00 $0.00
Tyler, Amanda R Senior Program Specialist $44,587.00 $0.00
Vallianos, Kostoula Temporary $47,816.00 $0.00
Vaughn, Bilal Temporary $2,880.00 $0.00
Verdier, Courtney P Senior Program Specialist $23,561.00 $0.00
Vine, Holly A Administrative Specialist $44,496.00 $0.00
Wakhisi, Kofi O Senior Principal Planner $106,966.00 $976.00
Walker, Geoff C IT Analyst $59,080.00 $0.00
Wang, Wei Senior Principal Planner $108,033.00 $1,440.00
Warren, Johanna Communications Specialist $18,656.00 $36.00
Wascher, Joel Senior Program Specialist $19,750.00 $275.00
Washington, Stephanie P Senior Program Specialist $65,633.00 $1,590.00
Weis, Craig D Senior Program Specialist $62,743.00 $0.00
Wender, Rochelle T Senior Program Specialist $85,873.00 $114.00
Whitacre, Jacob Temporary $6,876.00 $0.00
White, Angela M Senior Program Specialist $54,603.00 $1,318.00
White, Connie M Principal Program Coordinator $93,762.00 $319.00
White-Fulks, Charissa M Executive Asst./Sec'y to Board $81,812.00 $0.00
Williams, Celia Senior Program Specialist $52,392.00 $0.00
Williams, Nicola Temporary $12,240.00 $0.00
Williamson, Warren H Division Manager, MS $129,093.00 $2,226.00
Woodworth, Erik Senior Planner $36,256.00 $0.00
Yawn, Kim Program Specialist $49,738.00 $1,073.00
Zhu, Honghong Principal IT Analyst $105,298.00 $0.00
Zitsch, Katherine Division Manager - EPD $154,179.00 $10,913.00
Zwald, Brittany E Principal Management Analyst $71,784.00 $944.00
$15,427,130 $201,307
(a)
2017 Salaries (cash basis) $15,427,130
Non cash compensation (98,979)
2016 Accrued salaries for the pay periods ended 12/31/2016
129
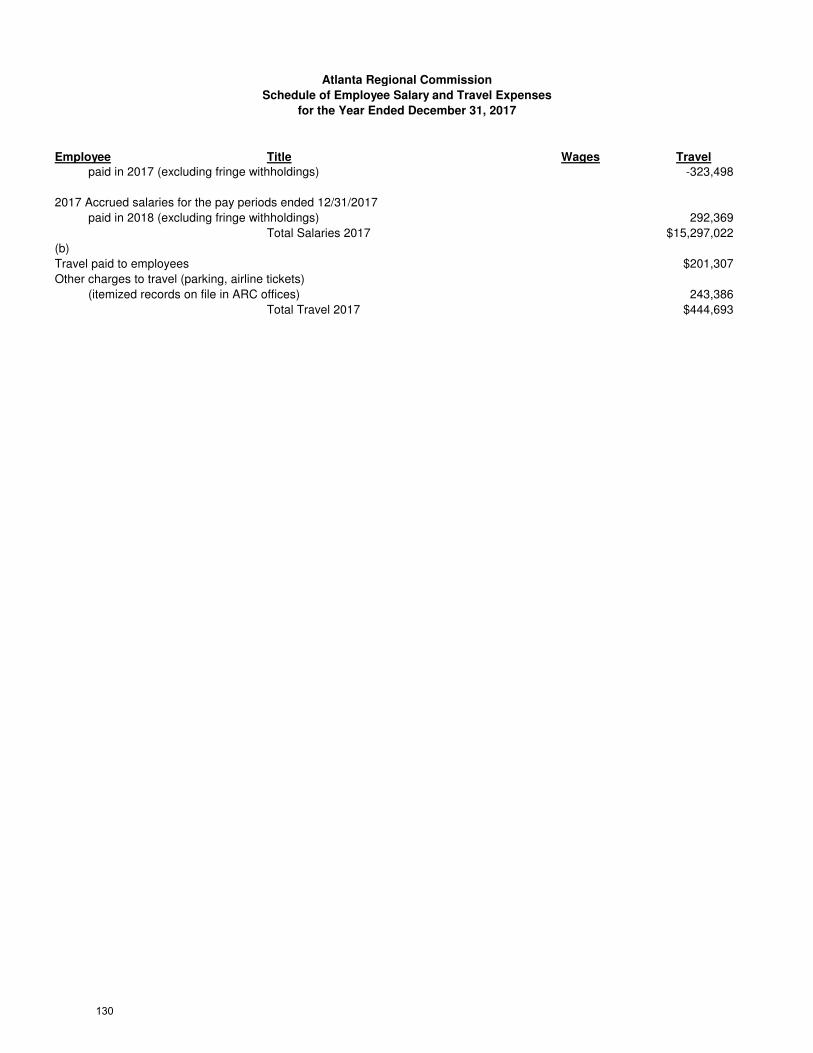
Employee Title Wages Travel
Atlanta Regional Commission
Schedule of Employee Salary and Travel Expenses
for the Year Ended December 31, 2017
paid in 2017 (excluding fringe withholdings) -323,498
2017 Accrued salaries for the pay periods ended 12/31/2017
paid in 2018 (excluding fringe withholdings) 292,369
Total Salaries 2017 $15,297,022
(b)
Travel paid to employees $201,307
Other charges to travel (parking, airline tickets)
(itemized records on file in ARC offices) 243,386
Total Travel 2017 $444,693
130