Embed Size (px)
Citation preview
21
40
Jurnal Ekol1omi Malaysia 33 (1999) 3 - 19
Cost of Trans-boundary Haze Externalities
Jamal Othman Mohd Shahwahid H.O.
ABSTRACT
This paper atlempts to assess the economic value of the trans-boundary 1997 haze damages all health in Malaysia. Valuing the damage will help policy makers appreciate the scale of the problem as the values can be readily compared with other losses or the merits of alternative resource use. It also facilitates the establishment of common. crosscountry environmental policy framework, which will benefit the affected region as a whole. The impacts on health are especially highlighted in this papel; as there is sujficiellf market data for the employment of appropriate secondary valuation technique, namely the Dose-Response Function. Policy implications, based on the findings of the study are offered. This study contributes substantially to the literature on environmental valuation in Malaysia. The Dose-Response Function would not be made possible without the given haze episode, where all relevant health data and pollution level were collected nationwide and on a daily basis. The Malaysian Dose-Respon.se coefficient may also be transferred to other similar studies via a Benefit Transfer Protocol.
ABSTRAK
Kertas ini menganggar nilai ekollomi kesan isu pencemaran udara antara sempadanjerebu 1997 terhadap kesihatan di Malaysia. Penilaiall illi akan membantu pembuat dasar memahami skala masalah kerana nilai yang diperoleh boleh dibandingkan dengan kerugian lain atau faedah dari penggllnaan alrernatif sumbel: Ia juga membantu pembentukan kerangka bersama bagi dasar alom sekitar serantatt yang akan memberi kebaikan kepada semua negara yang terlibat. Kesan terhadap kesihatan diberikan fokus kerana ferdapaf maklumat pasaran yang cllkup untuk membenarkan pemakaian teknik penilaian sekllnder yang wajar, khususnya Fungsi Dose~Response. Implikasi dasar dari penemuan kajian dibincangkan. Sumbangan penting kajiem ini ialah dari segi sumbangannya terhadap liferatur penilaian alam sekitar di
4 iurnal £konomi Malaysia 33
Malaysia. Episod jerebu 1997 lelah membenarkall pemakaiall Flings; Dose-Response secara efektif, kerana maklwnat yang diperlukan seperti data kesihatan dan paras pencemaran udara sedia dikumpul di seluruh !legaro setiap hari. Koefisen Dose-Respons yang dianggar ulltuk Malaysia juga boleh dipindahkan untuk kajian lain yang berkaitan dengan menggwtakan Protokol Benefit Tran!>fer.
INTRODUCTION
Unlike acid rains which characterize the trans-boundary environmental problems in many industrial regions of the world (such as Northeast Asia (Japan, Korea and Taiwan) and Europe), the "fast growth" Southeast Asian region is rather prone to an international environmental pollution of a different kind - the haze. Haze is caused by the accumulation of fine particles in the air, which are hardly visible to the naked eye. The particles may result from some natural phenomena and/or human activities. The main natural source of haze is forest fires, while haze from deliberate forest burning, open burning of rubbish, emissions from factories and motor vehicles is attributable to human activities. Persistent accumulation of haze particles in the air may reduce sun 's rays and visibi lity.
For most Indonesians and Malaysians, the haze is not an unusual phenomenon. In Malaysia, it has gained prominence in Apri l 1983, August 1990, June and October 1991 and since then it recurs annually, usually from the months of August to October. However, the haze of 1997 was unprecedented in terms of intensity, duration and coverage. It started in early August and the sky remained dull unti l some three months later. The haze caused much inconvenience and disruption to the Malaysian economy. The haze has raised the incidences of respiratory diseases, forced a decline in agricultural crop and fishing yields and caused disruption to transport services, manufacturing output and the tourism industry,
The cause of the 1997 haze is suspended smoke particulate from large-scale forest and plantation fires, particularly in Southern Sumatra and Central Kalimantan, both in neighboring Indonesia. The forest fires, to some extent, are attributable to land preparation for extensive ex-situ oil palm expansion. Given freer agricultural trade under WTO rules, palm oil is expected to benefit considerably as production and exports of its main competitor, soybean oil, has been heavily subsidi zed (Jamal et aJ.
Co,
19' Ma Ind
rea lev da~ Ka fin( suI·
esp wh lun out
dar ma cor fac pol Th, is ~
tecl on
33
~gsi
erti ruh tuk tan
1Ial ~ast
lthItal nu,ed Vor lile )ns les.
n's
ual 83, Ily, of
ge. ree to
raIds Ind
Jm
ltra "es, :itu 11m its aI.
Cost of Trans-boundary Haze Externalities 5
1998). This has led to greater investment by both Indonesian as well Malaysian companies (reverse investment) for oil palm cultivation in Indonesia.
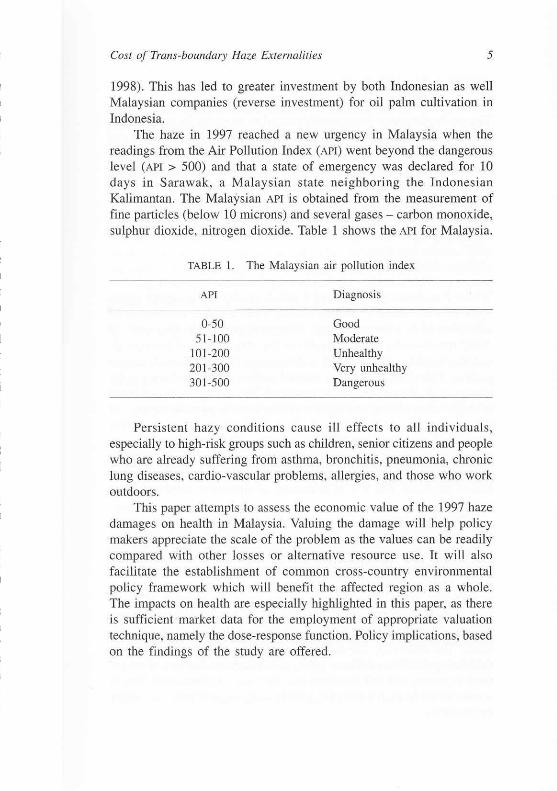
The haze in 1997 reached a new urgency in Malaysia when the readings from the Air Pollution Index (API) went beyond the dangerous level (API > 500) and that a state of emergency was declared for 10 days in Sarawak, a Malaysian state neighboring the Indonesian Kalimantan. The Malaysian API is obtained from the measurement of fine particles (below 10 microns) and several gases - carbon monoxide, sulphur dioxide, nitrogen dioxide. Table I shows the API for Malaysia.
TABLE I. The Malaysian air pollution index
API Diagnosis
0-50 Good 51-100 Moderate
101-200 Unhealthy 201-300 Very unhealthy 301-500 Dangerous
Persistent hazy conditions cause ill effects to all indi vidual s, especially to high-risk groups such as children, senior citizens and people who are already sufferi ng from asthma, bronchitis, pneumonia, chronic lung diseases, cardio-vascular problems, allergies, and those who work outdoors.
This paper attempts to assess the economic val ue of the 1997 haze damages on health in Malaysia. Valuing the damage will help policy makers appreciate the scale of the problem as the values can be readily compared with other losses or alternative resource use. It will also facilitate the establishment of common cross-country environmental policy framework whieh will benefit Ihe affecled region as a whole. The impacts on health are especially highlighted in this paper, as there is sufficient market data for the employment of appropriate valuation technique, namely the dose-response function. Policy impj.ications, based on the findings of the study are offered.
6 illrnal Ekonomi Malaysia 33
VALUING THE HAZE IMPACTS ON HEALTH - METHODS
The production function approach is used to estimate the value of the haze impacts on health in Malaysia. This approach links air quality and production relationships. Degradation of air quality causes firm s and households to reduce the production of goods and services or to seek preventi ve or mitigation measures to reduce the impacts of the haze. Finns use factors of production including environmental input to produce goods and services. Generally. the production function for a flrm can be shown:
Y = f( I, K, H (M, Q))
Where Y is the output produced, I and K are labor and capital inputs while H is indi vidual' s (workers) health status which is assumed to be a functi on of M - preventive and mitigation! curative measures and Q which measures the hygienic quality of the environment, in this case air quality. Assuming (aYlaQ) > 0, a decrease in Q will reduce Y, ceteris paribus. Therefore, to maintain societal welfare to the level prior to the change in Q, M mu st need to be increased. This change in M combined with the value of producti vity loss can be used to estimate the cost of the haze on health. However, M which is based on observed market prices only measures cost of illness partially. The appropriate measure of cost of illness is individual maximum wi llingness to pay (WTP) to prevent haze related illness, pain, discomfort and loss in ability to enjoy leisure activities. The WTP is in essence an equivalent surplus welfare measure.
Thi s study estimates the value of M using the dose-response function (DRF) , which is a class of production function methods. Based on the value of M, the cost of illness is then calculated using the benefit transfer approach. The dose-response approach aims to estimate incremental cos ts over a "normal" situation. Haze incidents normally occur in Malaysia, albeit insignificantly, even without the outbreak of fores t fires in Indonesia. This study is in terested in the incremental impacts occurring in 1997 relati ve to domestically sourced impacts in previous years. The following sub-sections discuss the methodology used in calculating the Cost of Illness (cot), which includes the cost of outpatient, inpatient, and self-treatment and the value of productivity loss as a result of the haze. It is then followed by sections on results, and policy implications .
Co.
co
Ha inr thr wa est sec Th AP
ha: thE
illr
Th lat
Th
w
N'
Dl
DI
P(
CI
HI
! 33
Ihe and and eek lze. )[0-
inn
lUtS
, be j Q air
zris the ned t of ·kel ure I to joy ~are
ncon
efit ;recur rest lcts ous
In
pa; as .icy
Cost of Trans-boundary Haze Externalities 7
COUNTING THE COST OF OUTPATIENT. SELF-TREATMENT AND INPATIENT
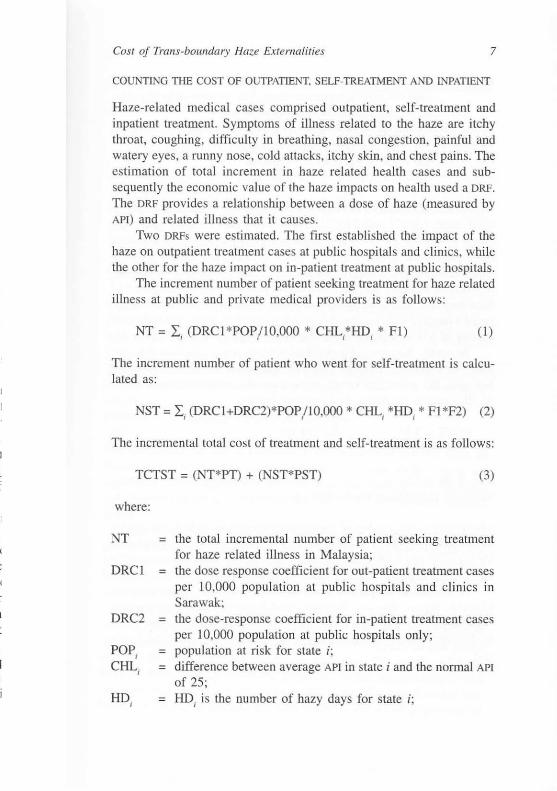
Haze-related medical cases comprised outpatient, self-treatment and inpatient Ireatment. Symptoms of illness related to the haze are itchy throat, coughing, difficulty in breathing, nasal congestion, painful and watery eyes, a runny nose, cold attacks, itchy skin , and chest pains. The estimation of total increment in haze related health cases and subsequently the economic value of the haze impacts on health used a DRF. The DRF provides a relationship between a dose of haze (measured by API) and related illness that it causes.
Two DRFs were estimaled. The first established the impact of Ihe haze on outpatient treaUllent cases at public hospitals and clinics, while the other for the haze impact on in-patient treatment at public hospitals.
The increment number of patient seeking treatment [or haze related illness at public and private medical providers is as follows:
NT = I i (DRCI*POP/IO,OOO * CHL:HDi * FI) (I)
The increment number of patient who went for self-treatment is calculaled as:
NST = I ;<DRCI+DRC2)*POP 110,000 * CHLi *HD, * FI *F2) (2)
The incremental total cost of treatment and self-treatment is as follows:
TCTST = (NT*PT) + (NST*PST) (3)
where:
NT = the total incremental number of patient seeki ng treatment for haze relaled illness in Malaysia;
DRCI = the dose response coefficient for out-patient treatment cases per 10,000 population al public hospital s and clinics in Sarawak;
DRC2 = the dose-response coefficient for in-patient treatment cases per 10,000 population at public hospitals only;
POP, = population at risk for stale i; CHL. = difference between average API in state i and the normal API ,
of 25; HD. = HDi is the number of hazy days for state i ; ,
8
FI
F2
;
;
Jurnal Ekollomi Malaysia 33
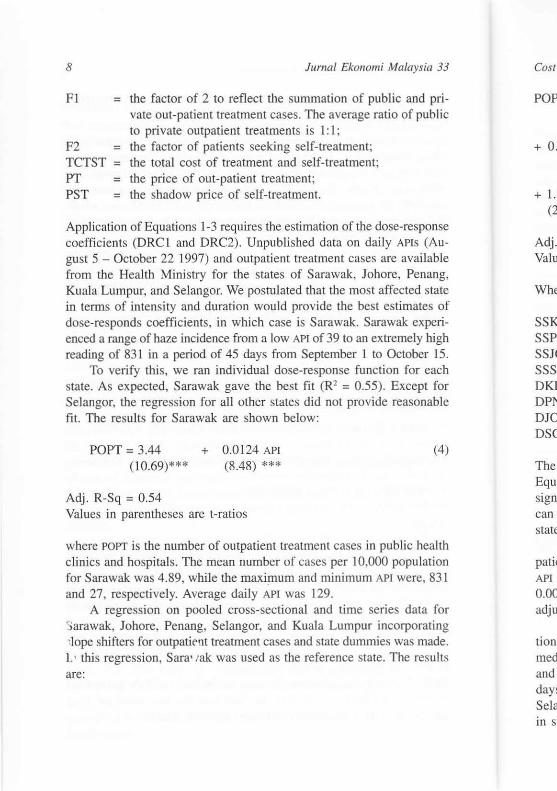
the factor of 2 to reflect the summation of public and private out-patient treatment cases. The average ratio of public to private outpatient treatments is I : I;
TCTST ;
the factor of patients seeking self- treatment; the total cost of treatment and self-treatment; the price of out-patient treatment; PT ;
PST ; the shadow price of self-treatment.
Application of Equations 1-3 requires the estimation of the dose-response coefficients (DRC I and DRC2). Unpublished data on daily APIS (August 5 - October 22 1997) and outpatient treatment cases are avai lable from the Health Ministry for the states of Sarawak, Johore, Penang, Kuala Lumpur, and Selangor. We postulated that the most affected state in terms of intensity and duration would provide the best estimates of dose-responds coefficients, in which case is Sarawak. Sarawak experienced a range of haze incidence from a low API of 39 to an extremely high reading of 83 1 in a period of 45 days from September I to October 15.
To verify this, we ran individual dose-response function for each state. As expected, Sarawak gave the best fit (R' ; 0.55). Except for Selangor, the regression for all other states did not provide reasonable fit. The results for Sarawak are shown below:
POPT; 3.44 (10.69)***
Adj. R-Sq ; 0.54
+ 0.0124 APt (8.48) **.
Values in parentheses are t-ratios
(4)
where POPT is the number of outpatient treatment cases in public health clinics and hospitals. The mean number of cases per 10,000 population for Sarawak was 4.89, while the maxi~um and minimum API were, 831 and 27, respectively. Average daily API was 129.
A regression on pooled cross-sectional and lime series data for ~arawak, Johore, Penang, Selangor, and Kuala Lumpur incorporating -:Iope shifters for outpatient treatment cases and state dummies was made. L' this regression, Sara' lak was used as the reference stale. The results are:
Cost
POP
+ O.
+1.: (2
Adj. Valli
Whe
SSK SSP: SSJ( SSS· DKJ DPl-010 OSC
The Equ: sign] can · state
pati< API I
0.00 adju
lion med and days Sela in sl
a 33
priIblic
)nse Au,ble lng, .tatc
s of lcn-ugh
15. 'ach for
,ble
(4)
,Ith :1011
l31
for mg Idc. llts
Cost of Trans-boundary Haze Externalities 9
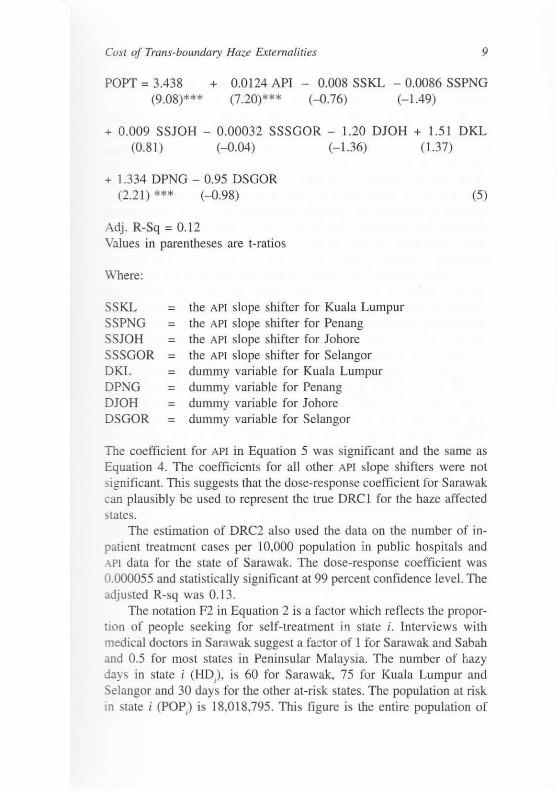
POPT = 3.438 + 0.0124 API - 0.008 SSKL - 0.0086 SSPNG (9.08)*** (7.20)*** (-0.76) (- 1.49)
+ 0.009 SSJOH - 0.00032 SSSGOR - 1.20 DJOH + 1.51 DKL (0.81) (-O.Q4) (- 1.36) (1.37)
+ 1.334 DPNG - 0.95 DSGOR (2.21) *** (- 0.98)
Adj. R-Sq = 0. 12 Values in parentheses are t-rat ios
Where:
SSKL = SSPNG = SSJOH SSSGOR = DKL DPNG DJOH = DSGOR =
the APt slope shifter for Kuala Lumpur the APt slope shifter for Penang the APt slope shifter for Johore the APt slope shifter for Selangor dummy variable for Kuala Lumpur dummy variable for Penang dummy variable for Johore dummy variable for Selangor
(5)
The coefficient for API in Equation 5 was significant and the same as Equation 4. The coefficients for all other APt slope shifters were not significant. This suggests that the dose-response coefficient for Sarawak can plausibly be used to represent the true DRC I for the haze affected states.
The estimation of DRC2 also used the data on the number of inpatient treatment cases per 10,000 population in public hospitals and .-\PI data for the state of Sarawak. The dose-response coefficient was 0.000055 and statistically signi ficant at 99 percent confidence level. The adjusted R-sq was 0.13.
The notation F2 in Equation 2 is a factor which reflects the proportion of people seeking for self-treatment in slate i. Interviews with medical doctors in Sarawak suggest a factor of I for Sarawak a"d Sabah and 0.5 for most states in Peninsular Malaysia. The number of [lazy days in state i (HD) , is 60 for Sarawak, 75 for Kuala Lumpur and Selangor and 30 days for the other at-risk states. The population at risk in state i (POP) is 18,018,795 . This fi gure is the entire population of
10 JI/mal Ekollomi Malaysia 33
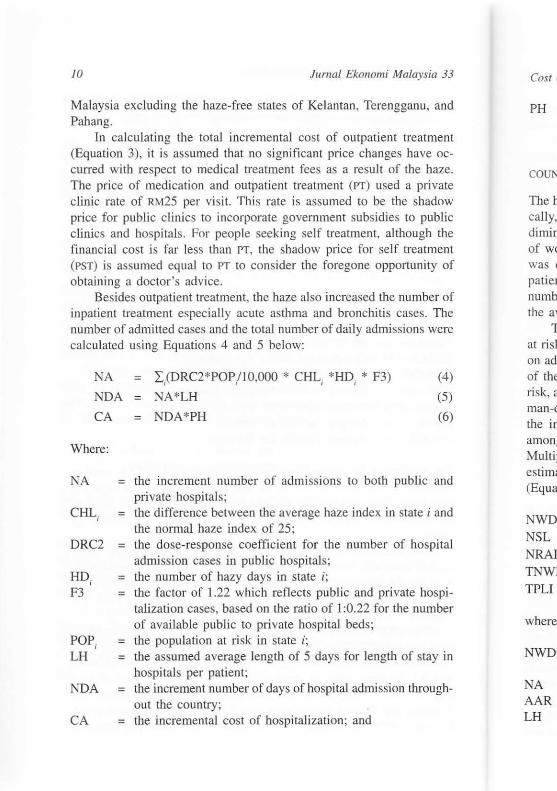
Malaysia excluding the haze-free states of Kelantan, Terengganu , and Pahang.
In calculating the total incremental cost of outpatient treatment (Equation 3), it is assumed that no significant price changes have occurred with respect to medical treatment fees as a result of [he haze. The price of medication and outpatient treatment (PT) used a private clinic rate of R.t\.125 per visit. This rate is assumed to be the shadow price for public clinics to incorporate government subsidies to public clinics and hospitals. For people seeking self treatment, although the financial cost is far less than PT, the shadow price for self treatment (PST) is assumed equal to PT to consider the foregone opportunity of obtaining a doctor's advice.
Besides outpatient treatment, the haze also increased the number of inpatient treatment especially acute asthma and bronchi tis cases. The number o f admitted cases and the total number of daily admissions were calculated using Equations 4 and 5 below:
NA
NDA
CA
Where :
NA =
CHL = ,
DRC2 =
HD . = , F3 =
POP i = LH =
NDA =
CA =
= I / DRC2*POP/ IO,OOO' CHL i ' HD, * F3)
NA*LH
= NDA *PH
(4)
(5)
(6)
the increment number of admi ssions to both publi c and private hospitals; the difference between the average haze index in state i and the normal haze index of 25; the dose-response coeffic ient for the number of hospital admission cases in public hospitals; the number of hazy days in state i ; the fac tor of 1.22 which reflects public and private hospitalization cases, based on the ratio of I :0.22 for the number of available public to private hospital beds; the population at risk in state i; the assumed average length of 5 days for length of stay in hospitals per patient; the increment number of days of hospital admi ssion throughout the country; the incremental cost of hospitali zation; and
Cost ~
PH
COUN'
The h, cally, dimini of wo was c pat ien numb( the av
T at ri sk on adl
of the ri sk, a man-d the in amon! Multil estim~
(Equa'
NWD NSL NRAI TNWI TPLI
where
NWD
NA AAR LH
·ia 33
, and
:ment e ochaze. rivate adow !Ublic h the tment ity of
Jer of . The were
(4) (5)
(6)
: and
i and
spital
10spiImber
lay in
ough-
Cost of Trans-bollndmy Haze EXlemaliries 11
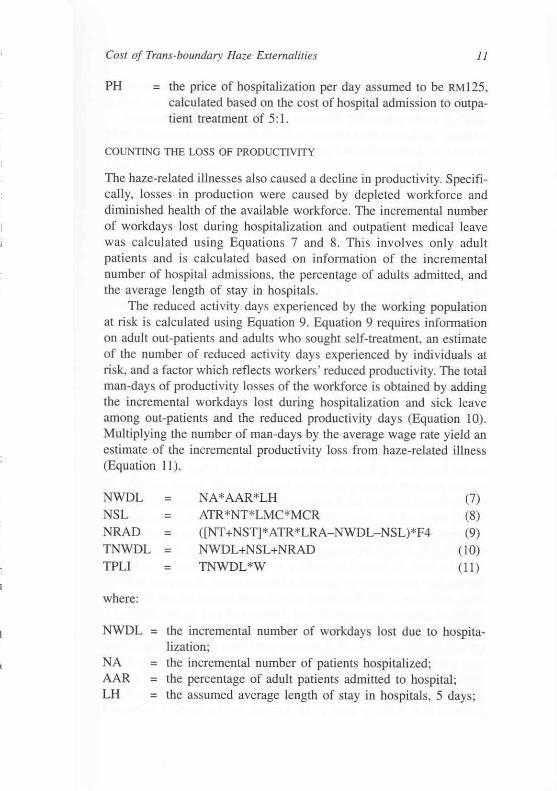
PH = the price of hospitalization per day assumed to be RM 125, calculated based on the cost of hospital adrrussion to outpatient treatment of 5: 1.
COUNTING THE LOSS OF PRODUCTIVITY
The haze-related illnesses also caused a decline in productivity. Specifically, losses in production were caused by depleted workforce and diminished health of the avai lable workforce. The incremental number of workdays lost during hospitalization and outpatient medical leave was calculated using Equations 7 and 8. This involves only adult patients and is calculated based on information of the incremental number of hospital admissions, the percentage of adults admitted, and the average length of stay in hospitals .
The reduced activity days experienced by the working population at ri sk is calculated using Equation 9. Equation 9 requires infonnation on adult out-patients and adults who sought self-treatment, an estimate of the number of reduced activity days experienced by indi viduals at risk, and a factor which reflects workers' reduced productivity. The total man-days of productivity losses of the workforce is obtained by adding the incremental workdays lost during hospitalization and sick leave among out-patients and the reduced productivity days (Equation 10). Multiplying the number of man-days by the average wage rate yield an est imate of the incremental productivity loss from haze-related illness (Equation II ).
NWDL NSL NRAD TNWDL TPLI
where:
NWDL =
NA = AAR = LH =
= NA*AAR*LH (7) ATR *NT*LMC*MCR (8)
= ([NT +NST]* ATR *LRA-NWDL-NSL)*F4 (9) = NWDL+NSL+NRAD (10)
= TNWDL*W (11)
the incremental number of workdays lost due to hospitalization; the incremental number of patients hospitalized; the percentage of adult patients admitted to hospital; the assumed average length of stay in hospitals. 5 days;
12
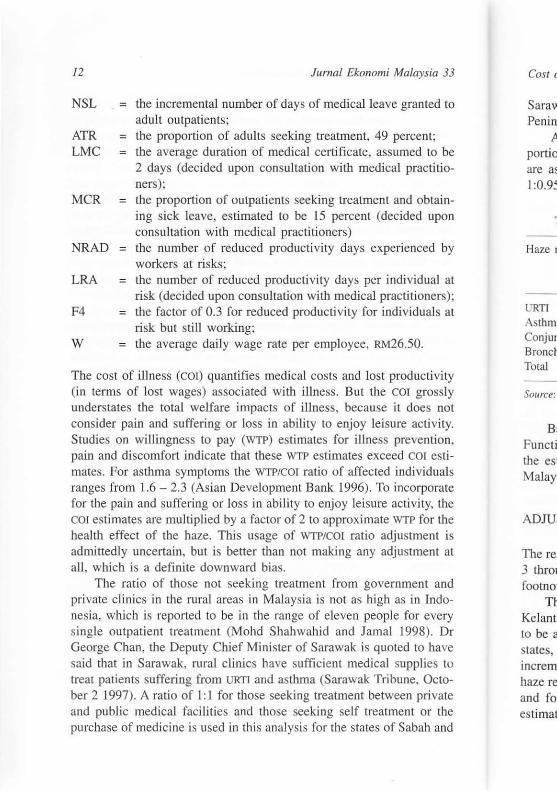
NSL
ATR LMC
MCR
NRAD
LRA
F4
W
=
=
=
=
JumaJ Ekol1omi Malaysia 33
the incremental number of days of medical leave granted to adult outpatients; the proportion of adults seeking treatment, 49 percent; the average duration of medical certificate, assumed to be 2 days (decided upon consultation with medical practitioners); the proportion of outpatients seeking treatment and obtai ning sick leave, estimated to be 15 percent (decided upon consultation with medical practitioners) the number of reduced productivity days experienced by workers at risks; the number of reduced productivity days per individual at risk (decided upon consultation with medical practitioners); the factor of 0.3 for reduced productivity for individuals at risk but still working; the average daily wage rate per employee, RM26.50.
The cost of illness (COr) quantifies medical costs and lost productivity (in terms of lost wages) associated with illness. But the COl grossly understates the total welfare impacts of illness, because it does not consider pain and suffering or loss in ability to enjoy leisure activity. Studies on willingness to pay (\VTP) estimates for illness prevention, pain and discomfort indicate that these WTP estimates exceed COl estimates. For asthma symptoms the WTP/COI ratio of affected individuals ranges from 1.6 - 2.3 (Asian Development Bank 1996). To incorporate for the pain and suffering or loss in ability to enjoy leisure activity, the COl estimates are multiplied by a factor of 2 to approximate WTP for the health effect of the haze. Thi s usage of WTP/COI ratio adjustment is admittedly uncertain, but is better than not making any adjustment at all , which is a definite downward bias.
The ratio of those not seeking treatment from government and private clinics in the rural areas in Malaysia is not as high as in Indonesia, which is reported to be in the range of eleven people for every single outpatient treatment (Mohd Shahwahid and Jamal 1998). Dr George Chan, the Deputy Chief Minister of Sarawak is quoted to have said that in Sarawak, rural clinics have sufficient medical supplies to
treat patients suffering from URTI and asthma (Sarawak Tribune, October 2 1997). A ratio of I: 1 for those seeking treatment between private and public medical facil ities and those seeki ng self treatment or the purchase of medicine is used in thi s analysis for the states of Sabah and
Cost q
Sara", Penin!
A portio are as 1:0.95
1
Haze r
URTI
Asthm. Conjun Bronch Total
SOllrce:
B, Functi the eSi Malay:
ADJU:
The re: 3 thrOl footn01
Tt Kelant to be a states, mcrem haze re and fo estimat
's ia 33
Ited to
nt; to be
ctitio-
btainupon
ed by
ual at .ners) ; mls at
::tivity rossly !s not tivity. :ntion, 'I estiiduals porate ty, the 'or the ent is
ent at
It and lndoevery l). Dr ) have jes to Octo,rivate )f the ill and
Cost of Trans-boundary Haze ExterfJalilies /3
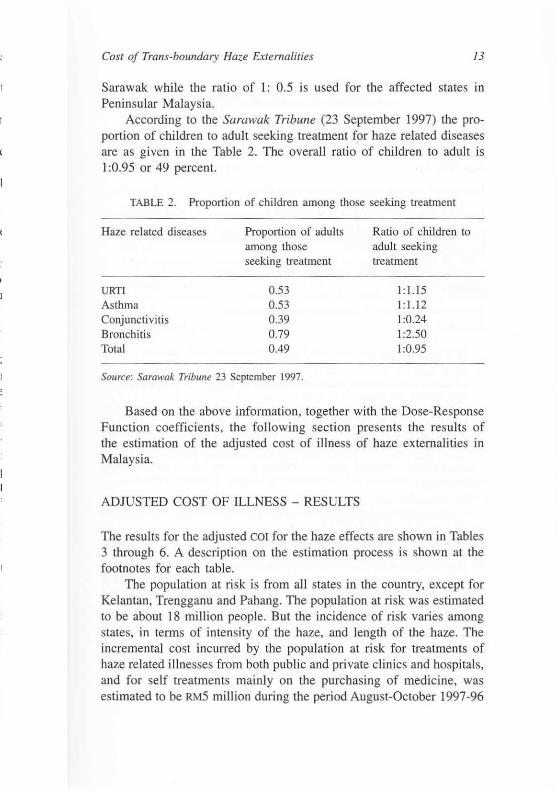
Sarawak while the ratio of l: 0.5 is used for the affected states in Peninsular Malaysia.
According to the Sarawak Tribune (23 September 1997) the proportion of children to adult seeking treatment for haze related diseases are as given in the Table 2. The overall ratio of children to adult is I :0.95 or 49 percent.
TABLE 2. Proportion of children among those seeking treatment
Haze related di seases
URTI
Asthma Conjunctivitis Bronchitis Total
Proportion of adults among those seeking treatment
0.53 0.53 0.39 0.79 0.49
SOllrce: Samwak Tribune 23 September 1997.
Ratio of children to adu lt seeking treatment
I: 1.15 I: 1.12 1:0.24 1:2.50 1:0.95
Based on the above information, together with the Dose-Response Function coefficients, the following section presents the results of the estimation of the adjusted cost of illness of haze externalities in Malaysia.
ADJUSTED COST OF ILLNESS - RESULTS
The results for the adjusted COl for the haze effects are shown in Tables 3 through 6. A description on the estimation process is shown at the footnotes for each table.
The population at risk is from all states in the country, except for Kelantan, Trengganu and Pahang. The population at risk was estimated to be about 18 million people. But the incidence of risk varies among states, in terms of intensity of the haze, and length of the haze. The incremental cost incurred by the population at ri sk for treatments of haze related illnesses from both public and private cl inics and hospitals , and for self treatments mainly on the purchasing of medicine, was estimated to be RM5 million during the period August-October 1997-96
14 JUrl/al Ekollomi Malaysia 33
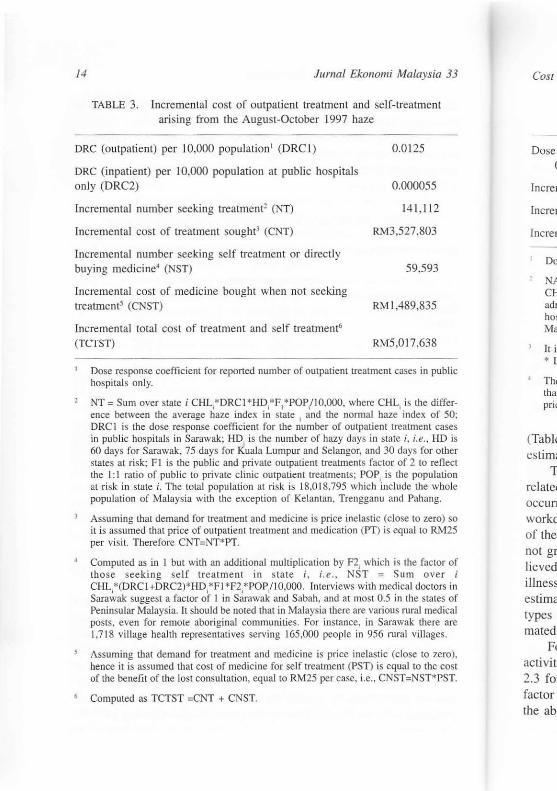
TABLE 3. Incremental cost of outpatient treatment and self-treatment aris ing from the August-October 1997 haze
DRC (outpatient) per 10,000 population' (DRC I) 0.0125
ORe (inpatient) per 10,000 population at public hospitals only (DRC2) 0.000055
Incremental number seeking lreatment2 (NT) 14 1,1 12
Incremental cos t of treatment sought3 (CNT) RM3,527,803
Incremental number seeking self treatment or direct ly buying medicine4 (NST) 59,593
Incremental cost of medicine bought when not seeking treatment' (CNST) RMI ,489,835
Incremental total cost of treatment and se lf trealmcnt6
(TCTST) RM5,0 17,638
Dose response coefficient for reponed number of outpatient treatment cases in public hospital s only.
NT = Sum over state i CHL;*DRCI *HD;*F1*POP/ IO.OOO. where CHL, is the difference between the average haze index in state ; and the nonnal haze index of 50; DRe I is the dose response coefficient for the number of outpatient treatment cases in public hospital s in Sarawak: HD. is the number of hazy days in state i, i.e., HD is 60 days for Sarawak. 75 days for Kuala Lumpur and Selangor, and 30 days for other states at risk; FI is the public and private outpatient treatments factor of 2 to reflect the I: I ratio of public to private clinic outpatient treatments; POP; is the population at risk in state i. The total population at risk is 18.01 8,795 wh ich incl ude the whole population of Malaysia with the exception of Kelantan. Trengganu and Pahang.
Assuming that demand for treatment and medicine is price inelastic (close to zero) so it is assumed that price of outpatient treatment and medication (PT) is equal to RM25 per vi sit. Therefore CNT=NT*PT.
Computed as in I but with an additional multiplication by F2, which is the factor of those seeking self treatment in s tate i , i.e., NST = Sum over i CHL;*(DRC I +DRC2)*HD;* FI *F2,*PO P,I 1 O,OCHl Interviews with med ical doctors in Sarawak suggest a factor of I in Sarawak and Sabah, and m most 0.5 in the states of Peninsular Malaysia. It should be nDled that in Malaysia there are various rural medical posts, even fo r remote aboriginal communities. For instance. in Sarawak there are 1,718 village health representatives serving 165,000 people in 956 rural villages.
Assuming that demand for treatment and medicine is price inelastic (close to zero). hence it is assumed that cost of medicine for self treatment (PST) is equal to the cost of the benefit of the lost consultation, equal 10 RM25 per case. i.e .. CNST=NST*PST.
Computed as TCTST =CNT + CNST.
Cost c
Dose ) o
Incrcrr
fnercrr
fnercrr
Do~
NA CH adn hos Mal
It is • L
The thar pric
(Table
estim( T
relate( occur! workd
of the not gr lieved illness
estima types mated
F, ac tivit 2.3 fo factor the ab
e n!
55
112
03
35
. 38
n public
e differ;: of 50: nt cases .. HD is 'or other J reflect pulation e whole ang.
zero) so oRM25
:actor of over i :x;lors in states of medical
here are lages.
to zero). the cost
H *PST.
Cost of Trafis-bolllldary Haze £ftemalilies
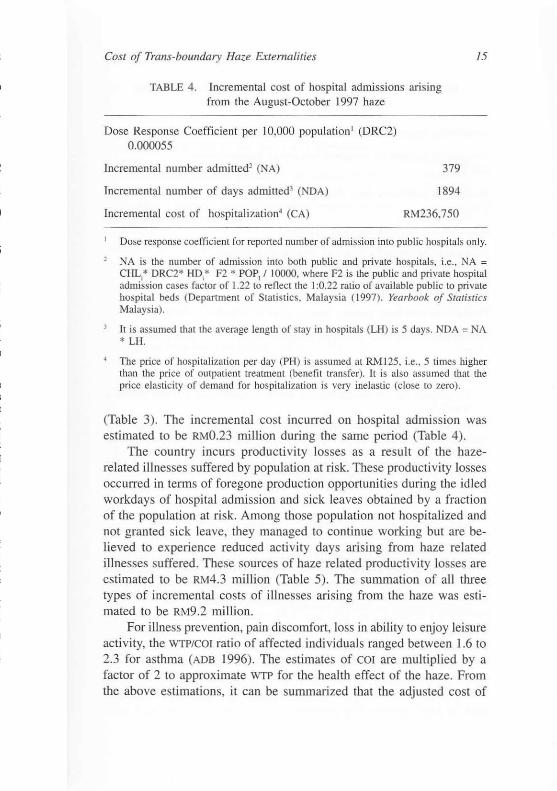
TABLE 4. Incremental cost of hospital admissions aris ing from the August-October 1997 haze
Dose Response Coefficien t per 10,000 population I (DRC2)
0.000055
Incremental number admi tted2 (NA)
Incremental number of days admitted3 (NDA)
Incremental cost of hospitalization~ (CA)
379
1894
RM236,750
15
Dose response coefficient for reported number of admission into publ ic hospitals only.
NA is the number of admission into both public and private hospitals, i.e., NA = CHLi* DRC2* HDi* F2 * POP! I 10000, where F2 is the public and private hospital admission cases factor of 1.22 to reflect the I :0.22 ratio of available public to private hospital beds (Department of Statist ics. Ma lays ia (1997). Yearbook of Slatj.~lics Malaysia) .
It is assumed that the average length of stay in hospitals (LH) is 5 days. NDA = NA * LH.
The price of hospitalization per day (PH) is assumed at RM 125. i.e., 5 times higher than the price of outpatient treatment (benefit transfer). It is also assumed that the price elastici ty of demand for hospitalization is very inelastic (close to zero) .
(Table 3). The incremental cost incurred on hospital admission was estimated to be RMO.23 million during the same period (Table 4).
The country incurs productivity losses as a result of the hazerelated illnesses suffered by population at risk. These productivity losses occurred in terms of foregone production opportunities during the idled workdays of hospital admission and sick leaves obtained by a fraction of the population at risk. Among those population not hospitalized and not granted sick leave, they managed to continue working but are believed to experience reduced activity days arising from haze related illnesses suffered. These sources of haze related productivity losses are estimated to be RM4.3 million (Table 5). The summation of all three types of incremental costs of illnesses arising from the haze was estimated to be RM9 .2 million.
For illness prevention, pain discomfort, loss in ability to enjoy leisure activity, the WTP/COI ratio of affected individuals ranged between 1.6 to 2.3 for asthma (ADB 1996) . The estimates of COl are multiplied by a facto r of 2 to approximate WfP for the health effect of the haze. From the above estimations, it can be summarized that the adjusted cost of
16 Jumai Eko1lomi Malaysia 33
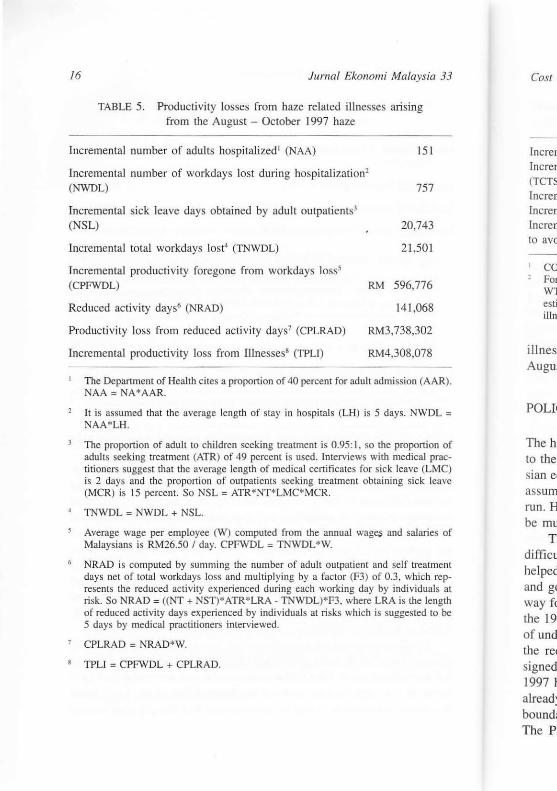
TABLE 5. Producti vity losses from haze related illnesses ari sing from the August - October 1997 haze
Incremental number of adults hospitali zed l (NAA) 15 1
Incremental number of workdays lost during hospitalization2
(NWDL) 757
Incremental sick leave days obtained by adult outpatients3
~W ~m
Incremental total workdays lost" (TNWDL) 21,501
Incremental productivity foregone from workdays loss5 (CPFWDL) RM 596,776
Reduced acti vity days' (NRAD) 141 ,068
Producti vity loss from reduced acti vity days7 (CPLRAD)
Incremental productivity loss from IIInessesB (TPU)
RM3,738,302
RM4,308,078
The Department of Health cites a proportion of 40 percent for adult admission (AA R). NAA = NA * AAR.
It is assumed that the average length of stay in hospitals (LH) is 5 days. NWDL = NAA*LH.
The proportion of adult to children seeking treatment is 0.95: 1, so the proportion of adults seeking treatment (ATR) of 49 percent is used. Interviews wi th medical practilioners suggest that the average length of medical certificates fo r sick leave (LMC) is 2 days and the proportion of outpatients seeking treatment obtaining sick leave (MCR) is 15 percent. So NS L = ATR*NT*LMC* MCR.
TNWDL = NWDL + NSL.
Average wage per employee (W) computed from the annual wag~ and salaries of Malaysians is RM26.50 I day. CPFWDL = TNWDL"'W.
NRAD is computed by sum ming the number of adult outpatient and self treatment days net of total workdays loss and multipl ying by a factor (F3) of 0.3, which represents the reduced activity experienced durin g each working day by individuals at risk. So NRAD = ((NT + NST)*ATR*LRA - TNWDL)*F3, where LRA is the length of reduced activity days experienced by indiv iduals at risks which is suggested to be 5 days by medical practitioners interviewed.
CPLRAD = NRAD*W.
TPLJ = CPFWDL + CPLR AD,
Cos/ c
(ncrCIT
fneren (TCTS'
Increrr locfeIT (nereIT
to avo
CO Fm WT eSli l
illm
i1 lnes: Augw
POL[(
The h; to the sian e( assum run. H be mu
Tl diffic u
helped and g( way f( the 19' of und the re< signed 1997 I atread: bound; The P
sia 33
51
57
43
01
76
'68
02
78
(AAR).
.vDL =
rtion of al prac(LMC) k leave
aries of
ea(ment ich repduals at ~ length ~d to be
Cost of Trails-boundary Haze Externalities
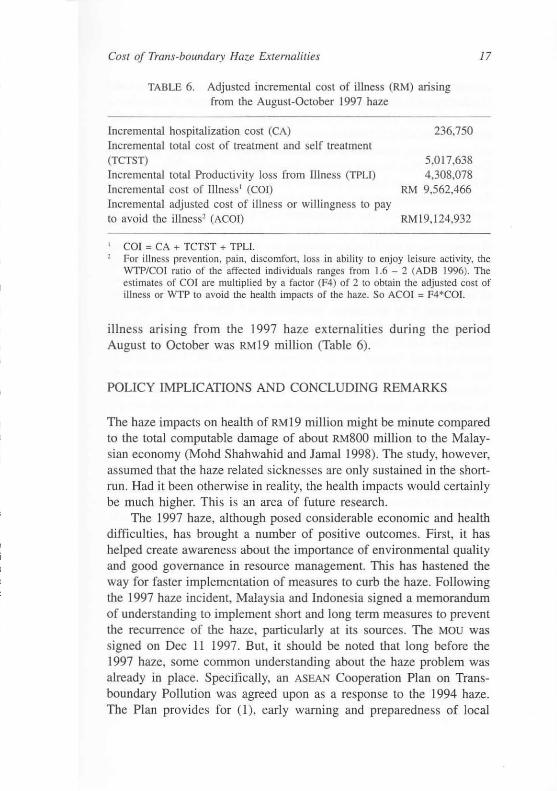
TABLE 6. Adjusted incremental cost of illness (RM) ari sing from the August-October 1997 haze
Incremental hospitali zation cost (CA) Incremental total cost of treatment and self treatment (TCTST) Incremental lotal Productivity loss from Illness (TPU) Incremental cost of IIlness l (COr) Incremental adjusted cosl of illness or willingness to pay to avoid the illness2 (ACO!)
COl = CA + TCTST + TPU.
236,750
5,017,638 4,308,078
RM 9,562,466
RMI9,124,932
17
For illness prevention, pain, discomfort, loss in ability to enjoy leisure activity, the WTP/COI ratio of the affected individual s ranges from 1.6 - 2 (ADB 1996). The estimates of COl are multiplied by a factor (F4) of 2 to obtain the adjusted cost of illness or WTP to avoid the health impacts of the haze. So ACOI = F4*COI.
illness ari sing from the 1997 haze externalities during the period August to October was RMI9 million (Table 6).
POLICY IMPLICATIONS AND CONCLUDING REMARKS
The haze impacts on health of RMI9 million might be minute compared to the total computable damage of about RM800 million to the Malaysian economy (Mohd Shahwahid and Jamal 1998). The study, however, assumed that the haze related sicknesses are only sustained in the shortrun. Had it been otherwise in reality, the health impacts would certainly be much higher. This is an area of future research.
The 1997 haze, although posed considerable economic and health difficulties, has brought a number of positive outcomes. First, it has helped create awareness about the importance of environmental quality and good governance in resource management. This has hastened the way for faster implementation of measures to curb the haze. Following the 1997 haze incident, Malaysia and Indonesia signed a memorandum of understanding to implement short and long term measures to prevent the recurrence of the haze, particularly at its sources. The MOU was signed on Dec II 1997. But, it should be noted that long before the 1997 haze, some common understanding about the haze problem was already in place. Specifically, an ASEAN Cooperation Plan on Transboundary Pollution was agreed upon as a response to the 1994 haze. The Plan provides for (I), early warning and preparedness of local
18 Jllmai Ekonomi Malaysia 33
communities, (2) prohibition of biomass burning during dry periods. (3) sharing of information and (4) promoting investment in alternati ve uses of biomass. The re were also longer-term measures, which include awareness building to eliminate the use of fire as a land clearing method and zero-burning strategies in all economic sectors. Apparently the ASEAN
Cooperation Plan has remain unimplemented to a large extent, resulting in large-scale open buming practices in Indones ia in 1997. In Malaysia, the 'zero-burning strategy' is being implemented for agricultural crop replanting activities. The unprecedented proportion of the 1997 haze in ter ms of inten s ity and duration and sub sequently it s ex terna l diseconomies to neighboring countries are expected to compel member countries to fully observe all the provisions of the Plan.
As noted earlier, the 1997 haze has been LO some extent att ributed to unsustainable land clearings by large plantation firm s in Indonesia for conversion LO agricul ture. particularly oil palm. Some competing vegetable oil producers have regarded the land clearing practice (open burning) as sort of "environmental subsidy" for oil palm production. In a trading world charged with green consumeri sm issues, this regard may have detrimental trade impacts on palm oil , a vital commodity for both Indonesia and Malaysia. 1t is only wise that both Indonesia and Malaysia address this trans-boundary pollution issue by adopting effecti vely the recommendation o f the ASEAN Cooperation Plan and identifying 'winwin' or 'win-no lose ' situation in oil palm investment, considering Malaysia is relatively land scarce while having the distinct advantage in capital and technology.
An important contribution of this study is its contribution to the literature on environmental valuation, especially in terms of the methodological rigor. The Dose-Response Function employed in this study utilized time series data of about 80 observations. This would not be made possible without the given haze incident, where all relevant health data and pollution level were collected nationwide and on a daily basis. The Malaysian Dose-Response coefficient may also be transferred to other similar studies .
REFERENCE
Asian Development Bank. 1997. Economic evolutuiol1 of environmental impoc/s. A workbook. Manila.
Jamal Othman, Mohd Fauzi MJ., Mohammad H.A. 1998. World palm oilmarkel under freer trade: Implications for Malaysia. ASEAN EcO//Omic Blllletin. t5 (2) .
COST of
~ I ohd S Tir ph!
Depal111 Pri
Sarawal
Jamal ( Faculty Univers ~3600 I Selango
Mohd 5 Faculty Univers ~3400 I Selangc
'y'sia 33
~riods,
-native nclude ,ethod ASEAN
;ulting laysia, ,I crop laze in ternal ember
,bOled onesia peting (open
.on. In d may r both 4alay;tively : 'WIn
jering mtage
to the methstudy
lot be health bas is.
red to
1pacls.
market tlletill.
COS! oj Tralls-botmdw:y Haze Externalities 19
Mohd Shahwahid H.O. & Jamal Othman. 1998. Malaysia. In David Glover & Timoth y Jessup (eds), Indonesias Fires alld Haze - The COS! ojCatastrophe. Singapore: Institute of South East Asian Studies.
Department of Stati stics. 1997. Yearbook of Statistics. Kuala Lumpur: Gov!. Printer.
Sarawak Tribune (various dates).
Jamal Othman Facuily of Economks Universiti Kebangsaan Malaysia 43600 UKM Bangi Selangor Darul Ehsan
Mohd Shahwahid H.D. Faculty of Economics and Management Universiti PUlrn Malaysia 43400 UPM Serdang Selangor Darul Ehsan


![Dnevne nezavisne novine [broj 4795, 14.2.2012]](https://img.pdfslide.tips/doc/110x75/577d21871a28ab4e1e956cc5/dnevne-nezavisne-novine-broj-4795-1422012.jpg)