Embed Size (px)
Citation preview

CPFIS FUNDS REPORT Semi-Annual Report For The
Half Year Ended 31 December 2008
March 2009 Lipper, a Thomson Reuters company

1
TABLE OF CONTENTS Section Page 1. Introduction - Using the Simplified Report: CPFIS Funds Report 2 2. Common Investor Behaviour 3 3. Regular savings through ‘Dollar Cost Averaging’ 4 4. Scatter Plot for CPFIS Unit Trusts 6 Investment-linked Insurance Products 6 5. Expense ratio graphs by Risk Category
1. Higher Risk Category 7 2. Medium to High Risk 8 3. Low to Medium Risk 9 4. Lower Risk 10
6. Annex A – Supporting Tables 11
2
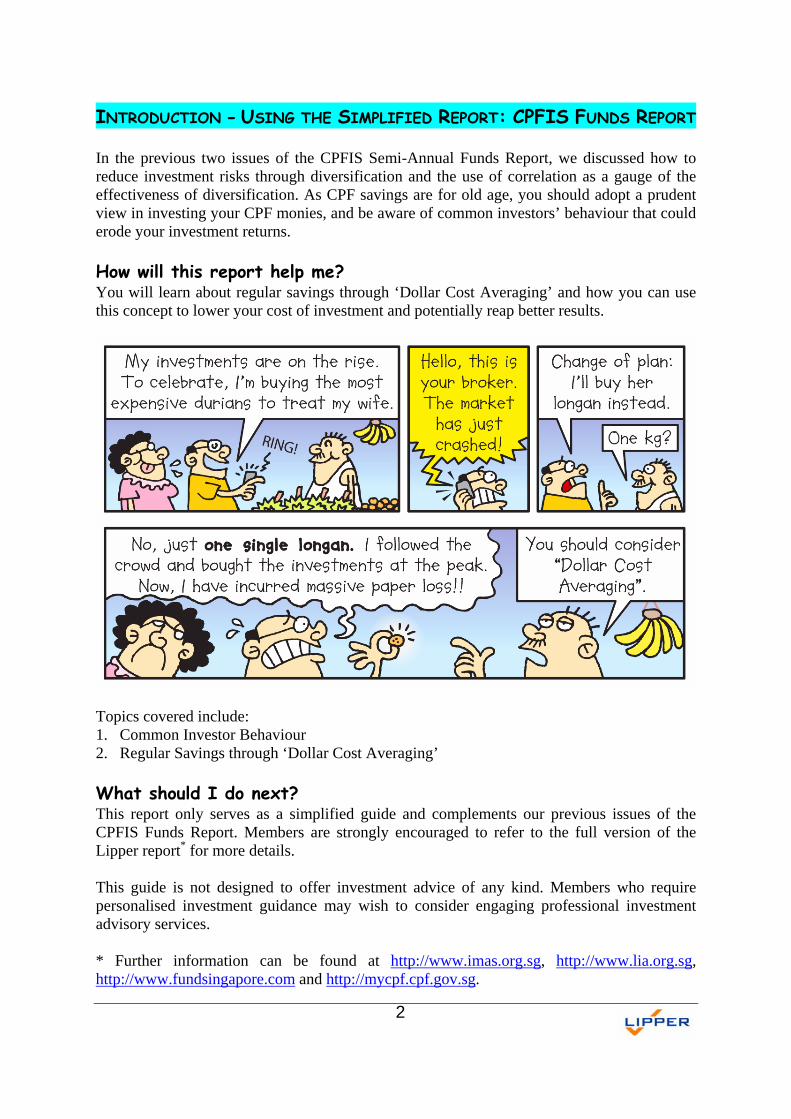
INTRODUCTION - USING THE SIMPLIFIED REPORT: CPFIS FUNDS REPORT In the previous two issues of the CPFIS Semi-Annual Funds Report, we discussed how to reduce investment risks through diversification and the use of correlation as a gauge of the effectiveness of diversification. As CPF savings are for old age, you should adopt a prudent view in investing your CPF monies, and be aware of common investors’ behaviour that could erode your investment returns. How will this report help me? You will learn about regular savings through ‘Dollar Cost Averaging’ and how you can use this concept to lower your cost of investment and potentially reap better results.
Topics covered include: 1. Common Investor Behaviour 2. Regular Savings through ‘Dollar Cost Averaging’ What should I do next? This report only serves as a simplified guide and complements our previous issues of the CPFIS Funds Report. Members are strongly encouraged to refer to the full version of the Lipper report* for more details. This guide is not designed to offer investment advice of any kind. Members who require personalised investment guidance may wish to consider engaging professional investment advisory services. * Further information can be found at http://www.imas.org.sg, http://www.lia.org.sg, http://www.fundsingapore.com and http://mycpf.cpf.gov.sg.

3
2. COMMON INVESTOR BEHAVIOUR All investors invest their money with the hope of making a gain and achieving a decent return on their investment. A surefire way to make money is to buy low and sell high. In reality, investors, being human beings can be easily swayed by sentiments and driven by their greed and fear. When the market is going up, everyone wants a share of the pie and starts investing. When the market is coming down, everyone is fearful of losing money and exits their investments. This creates a ‘herd mentality’ (see illustration below) where people follow what others do. Illustration on “Herd Mentality”
When investors shop for an investment, they would want to buy when prices are low and avoid buying when prices are high. Unfortunately, investors often fail to apply this principle. Instead, they often end up buying high and selling low, falling victim to the “herd mentality” and end up losing money.

4
3. REGULAR SAVINGS THROUGH ‘DOLLAR COST AVERAGING’ Even investment experts cannot accurately time the market to perfection. For an investor who is not good at timing the market but who would like to set aside money regularly for investing purposes, he can consider the principle known as ‘Dollar Cost Averaging’. ‘Dollar Cost Averaging’ combines simplicity, risk reduction and affordability by averaging down the cost of an investment. It requires an investor to set aside a fixed amount of money to purchase a well diversified investment at regular intervals. More units of an investment are bought when the prices are low and fewer units are bought when the prices are high. This helps to reduce market risk by spreading the purchases across different market conditions as compared to a single purchase. By doing so, it also reduces the risk of investing at the top of the market cycle. However, ‘Dollar Cost Averaging’ requires the investor to maintain good discipline since he needs to commit cash even when the market sentiments are low or when other investors are fearful.
While ‘Dollar Cost Averaging’ helps investors to accumulate investments at a lower per unit cost, it does not always result in profit for the investors. ‘Dollar Cost Averaging’ works only if securities prices eventually rise over time, which is usually the case after a reasonable period of time. It does not work in a prolonged bear market. Investors may also make a loss on investment, if they retire and exit from the market when the market is at its trough.

5
DESCRIPTION & INTERPRETATION OF RISK/RETURN SCATTER PLOTS The scatterplots on page 6 compare the return performance of CPFIS-included unit trusts (UTs) and Investment-Linked Insurance Products (ILPs) against their risk level (i.e. volatility). Return performance is shown on the vertical axis and the funds’ volatility on the horizontal axis. Using the median lines (dotted in red) as dividers, four distinct quadrants are formed, representing the following: Quadrant A might be seen as the most optimal choice where the fund managers have managed to produce relatively higher returns while minimising the funds’ volatility. All quadrants with the exception of D are desirable depending on the investor’s risk tolerance level and return requirements. Which quadrant does your CPFIS funds fall under? Refer to Annex A for a full listing.
Funds with above-average return and below-average risk
Funds with above-average return but above-average risk
Funds with below-average return but below-average risk
Funds with below-average return and above-average risk

6
4. SCATTER PLOT FOR CPFIS SUMMARY OF RISK-ADJUSTED PERFORMANCE Risk-Return Analysis Over the Past Three Years
-50
-40
-30
-20
-10
0
10
20
30
40
50
0 5 10 15 20 25 30 35 40 45
Annualised Monthly Risk %
Ann
ualis
ed M
onth
ly R
etur
n %
BAbove-average return but
above-average risk
A (23.91%)Above-average return and
below -average risk
CBelow -average return but
below -average risk
D (31.16%)Below -average return and
above-average risk
Over the three-year period from 1 January 2006 to 31 December 2008, 23.91% of all CPFIS-included unit trusts fell into quadrant A, while 31.16% of the funds were in quadrant D.
-50
-40
-30
-20
-10
0
10
20
30
40
50
0 5 10 15 20 25 30 35 40 45
Annualised Monthly Risk %
Ann
ualis
ed M
onth
ly R
etur
n %
A (39.86%)Above-average return and
below -average risk
BAbove-average return but
above-average risk
CBelow -average return but
below -average risk
D (34.06%)Below -average return and
above-average risk
In the three years from 1 January 2006 to 31 December 2008, 39.86% of the ILPs were in quadrant A, while 34.06% of the CPFIS-included ILPs were in quadrant D. * For the complete list of funds in each quadrant, please see Annex A.
Risk and Return Analysis Jan 2006 to Dec 2008
CPFIS-Included Unit Trusts
Risk and Return Analysis Jan 2006 to Dec 2008 CPFIS-Included ILPs

7
5. EXPENSE RATIO GRAPHS BY RISK CATEGORY A) Higher Risk Category
CPFIS-Included Unit Trusts & Investment-linked Insurance Products
Higher Risk Category - CPFIS-UTs
2.71 2.64 2.64 2.59 2.56
1.88
1.14 1.080.96
0.700.50
0
0.5
1
1.5
2
2.5
3
Alli
ance
Ber
nste
in-
Asi
anTe
chno
logy
Port
folio
A S
GD
#
Tem
plet
on K
orea
A A
cc S
GD
#
Uni
ted
Glo
bal
Tech
nolo
gyFu
nd#
Tem
plet
onEm
ergi
ngM
arke
ts A
Acc
SGD
#
Tem
plet
onTh
aila
nd A
Acc
SGD
#
Ave
rage
Exp
ense
Rat
io in
Hig
her
Ris
k C
ateg
ory
Infin
ity E
urop
ean
Stoc
k In
dex
SGD
Infin
ity U
S 50
0St
ock
Inde
x SG
D
DB
S Sh
ento
nTh
rift
HSB
C A
man
ahG
loba
l Equ
ity Z
DU
SD
APS
Alp
ha S
GD
Expe
nse
Rat
io (%
)
Higher Risk Category- CPFIS-ILPs
3.51 3.453.32 3.27 3.17
1.91
1.19 1.13 1.09
0.70
0.010
0.5
1
1.5
2
2.5
3
3.5
4
Avi
va H
ende
rson
Euro
pean
Fun
d(S
P)#
Avi
vaA
llian
ceB
erns
tein
Glo
bal G
row
thTr
ends
(SP)
#
Avi
va L
ionG
loba
lJa
pan
Gro
wth
(SP)
#
Avi
va A
berd
een
Paci
fic E
quity
(SP)
#
AXA
Jap
anG
row
th F
und
Ave
rage
Exp
ense
Rat
io in
Hig
her
Ris
k C
ateg
ory
UO
B L
ife F
OF
Uni
Fund
Avi
va M
M C
apita
lG
row
th F
und
NTU
C A
man
ahEq
uity
Fun
d
NTU
C S
inga
pore
Equi
ty F
und
PruL
ink
Glo
bal
Lead
ers
Fund
Expe
nse
Rat
io (%
)
* The expense ratios of Aviva’s ILPs include all expenses and costs necessary to issue and maintain the ILPs. Unlike other ILPs, Aviva’s ILPs do not charge an upfront sales charge, mortality fee, policy fee, bid-offer spread and switching fee separately from their management fee.

8
B) Medium to High Risk Category
CPFIS-Included Unit Trusts & Investment-linked Insurance Products
Medium to High Risk Category- CPFIS-UTs
2.77
2.47
2.071.92
1.791.67
1.431.31 1.25 1.23 1.21
0
0.5
1
1.5
2
2.5
3
Uni
ted
Mill
enni
umI#
Uni
ted
Mill
enni
umII#
Hen
ders
on G
loba
lB
alan
ced#
Fide
lity
Fund
s -
Fid
Targ
etTM
201
0A
USD
#
Alli
ance
Ber
nste
in-
Glo
bal B
alan
ced
Port
folio
A S
GD
Ave
rage
Exp
ense
Rat
io in
Med
ium
to H
igh
Ris
kC
ateg
ory
PRU
Asi
anB
alan
ced
Uni
ted
Gro
wth
Path
201
0
Uni
ted
Gro
wth
Path
202
0
Uni
ted
Gro
wth
Path
203
0
Uni
ted
Gro
wth
Path
204
0
Expe
nse
Rat
io (%
)
Medium to High Risk Category- CPFIS-ILPs
3.092.77
2.47 2.33 2.16
1.57
0.97 0.94 0.92 0.91 0.90
0
0.5
1
1.5
2
2.5
3
3.5
Avi
va T
empl
eton
Glo
bal B
alan
ced
(SP)
#
UO
B L
ife F
OF
Mill
enni
um T
rust
I#
UO
B L
ife F
OF
Mill
enni
um T
rust
II#
John
Han
cock
Mon
ey G
row
th P
lan#
AXA
Insp
ire -
Glo
bal G
row
th F
und
Ave
rage
Exp
ense
Rat
io in
Med
ium
to H
igh
Ris
k C
ateg
ory
GE
Gre
atLi
nk L
ifeSt
yle
Secu
rePo
rtfo
lio
NTU
C E
nhan
ced
Fund
NTU
C C
onse
rvat
ive
Fund
NTU
C P
rime
Fund
NTU
C T
rust
Fun
d
Expe
nse
Rat
io (%
)
* The expense ratios of Aviva’s ILPs include all expenses and costs necessary to issue and maintain the ILPs. Unlike other ILPs, Aviva’s ILPs do not charge an upfront sales charge, mortality fee, policy fee, bid-offer spread and switching fee separately from their management fee.

9
C) Low to Medium Risk Category
CPFIS-Included Unit Trusts & Investment-linked Insurance Products
Low to Medium Risk Category- CPFIS-UTs
1.76
1.561.48
1.291.15
1.01
0.72 0.680.60
0.52 0.45
0
0.2
0.4
0.6
0.8
1
1.2
1.4
1.6
1.8
2
Schr
oder
The
Acc
umul
ator
#
SGA
M T
otal
Ret
urn
Bon
d SG
D#
Schr
oder
Asi
an P
rem
ium
Bon
d#
Fran
klin
US
Gov
ernm
ent A
Mdi
s SG
D-H
1#
Fide
lity
Fund
s - I
nter
natio
nal B
ond
II A
Ave
rage
Exp
ense
Rat
io in
Low
toM
ediu
m R
isk
Cat
egor
y
DW
S Li
on B
ond
SGD
Lion
Glo
bal S
inga
pore
Fix
ed In
com
eIn
vest
men
t A
SIS
Inte
rnat
iona
l Fix
ed In
tere
st
UO
B O
ptim
ix S
GD
Fun
d
DB
S En
hanc
ed In
com
e SG
D
Expe
nse
Rat
io (%
)
Low to Medium Risk Category- CPFIS-ILPs
2.372.16 2.13
1.55 1.451.19
0.870.73 0.73 0.72
0.51
0
0.5
1
1.5
2
2.5
Avi
va L
egg
Mas
on G
loba
l Bon
dTr
ust (
SP)#
AXA
Insp
ire -
Glo
bal S
ecur
e Fu
nd
Avi
va D
BS
Enha
nced
Inco
me
(SP)
#
AXA
Insp
ire -
Glo
bal D
efen
sive
Fund
John
Han
cock
Wor
ldw
ide
Bon
dFu
nd#
Ave
rage
Exp
ense
Rat
io in
Low
toM
ediu
m R
isk
Cat
egor
y
NTU
C G
loba
l Bon
d Fu
nd
GE
Gre
atLi
nk S
tabl
e B
ond
Fund
PruL
ink
Glo
bal B
ond
Fund
(HSB
C In
sura
nce)
HSB
C-L
ink
Sing
apor
e B
ond
Fund
NTU
C S
inga
pore
Bon
d Fu
nd
Expe
nse
Rat
io (%
)
* The expense ratios of Aviva’s ILPs include all expenses and costs necessary to issue and maintain the ILPs. Unlike other ILPs, Aviva’s ILPs do not charge an upfront sales charge, mortality fee, policy fee, bid-offer spread and switching fee separately from their management fee.

10
D) Lower Risk Category
CPFIS-Included Unit Trusts & Investment-linked Insurance Products
Lower Risk Category- CPFIS-ILPs
0.320.31
0.28
0.19
0.02 0.02
0
0.05
0.1
0.15
0.2
0.25
0.3
0.35
AIA
S$
Mon
eyM
arke
t Fun
d
GE
Gre
atLi
nkC
ash
Fund
PruL
ink
Sing
apor
eC
ash
Fund
Ave
rage
Expe
nse
Rat
ioin
Low
er R
isk
Cat
egor
y
John
Han
cock
Sing
apor
eC
ash
Fund
Man
ulife
Sing
apor
eC
ash
Fund
Expe
nse
Rat
io (%
)
* No separate graph available for UTs as there is no UT in the lower risk category * There are only 5 ILPs in the lower risk category for ILPs * The expense ratios of Aviva’s ILPs include all expenses and costs necessary to issue and maintain the ILPs.
Unlike other ILPs, Aviva’s ILPs do not charge an upfront sales charge, mortality fee, policy fee, bid-offer spread and switching fee separately from their management fee.
1. Closed-end funds are excluded from the computation as their management fees
are generally charged upfront. 2. Fixed term funds are excluded from the expense ratio rankings 3. All the expense ratios are in percentages (%).

11
6. ANNEX A: SUPPORTING TABLES
CPFIS-Included Unit Trusts Annex A
Value Date
Quadrant AUOB Optimix SGD Fund -0.25 1.8 -4.18 0.96 0.52 30/06/2008 -0.64 5.5 8.24 L-MR Bond SGDDWS Lion Bond SGD -0.02 2.45 -1.9 1.38 0.72 30/09/2008 1.37 7.54 10.2 L-MR Bond GlobalDBS Enhanced Income SGD -0.23 1.05 -5.03 1.97 0.45 30/09/2008 -3.16 3.17 8.15 L-MR Bond SGDPRU Protected Global Titans SGD 0.27 4.75 2.29 2.33 0.78 31/12/2008 2.14 14.93 17.28 L-MR ProtectedUnited Singapore Bond Fund -0.11 1.53 -4.48 2.68 0.78 30/06/2008 -1.83 4.68 NA L-MR Bond SGDLionGlobal Singapore Fixed Income Investment A 0.03 2.86 -2.98 2.82 0.65 31/12/2008 2.24 8.83 14.71 L-MR Bond SGDLegg Mason Singapore Bond A 0.1 3.96 -1.75 3.72 1.15 30/09/2008 4.89 12.36 14.24 L-MR Bond SGDSIS International Fixed Interest 0 -0.26 -4.86 4.67 0.60 31/03/2008 1.3 -0.77 -1.52 L-MR Bond GlobalUnited GrowthPath Today -0.18 -0.34 0.92 4.73 1.14 30/06/2008 -10.25 -1.01 5.9 L-MR Target MaturityAIG International Funds - Singapore Bond -0.16 -0.14 -6.37 4.79 1.10 30/06/2008 -9.06 -0.41 15.57 L-MR Bond SGDUnited GrowthPath 2010 -0.17 -0.78 0.49 5.49 1.31 30/06/2008 -12.63 -2.33 7.06 M-HR Target MaturitySchroder The Accumulator -0.16 -0.52 0.74 5.64 1.76 30/06/2008 -8.59 -1.55 NA L-MR Equity GlobalLionGlobal SGD Income Plus -0.26 -2.69 -1.37 5.9 1.38 31/12/2008 -16.43 -7.86 NA M-HR Mixed Asset Other FlexibleLegg Mason Global Bond Trust -0.02 2.2 -2.18 6.04 0.94 30/09/2008 4.7 6.74 9.95 L-MR Bond GlobalAllianceBernstein-Global Conservative Pf A SGD -0.53 -8.14 -7.37 6.05 1.63 31/08/2008 -20.95 -22.48 NA M-HR Mixed Asset USD ConservativeAllianceBernstein-Global Conservative Pf A2 SGD -0.53 -8.2 -7.43 6.08 1.63 31/08/2008 -21.01 -22.64 NA M-HR Mixed Asset USD ConservativeSIS Defensive Growth -0.27 -8.44 -7.67 6.21 1.52 31/03/2008 -20.56 -23.26 -21.27 M-HR Mixed Asset USD ConservativeHenderson Global Bond A -0.04 1.63 -2.8 6.66 1.01 30/06/2008 8.55 4.96 3.25 L-MR Bond GlobalUnited GrowthPath 2020 -0.2 -3.23 -1.89 8.35 1.25 30/06/2008 -21.26 -9.37 2.02 M-HR Target MaturityUnited Millennium I -0.2 -3.44 -2.1 8.64 2.77 31/12/2007 -20.56 -9.97 -2.88 M-HR Mixed Asset SGD BalancedFirst State Global Balanced SGD -0.27 -6.15 -4.73 9.19 1.76 31/03/2008 -23.86 -17.33 -9.25 M-HR Mixed Asset SGD BalancedSGAM Total Return Bond SGD -0.11 -1.06 -4.93 9.83 1.56 31/03/2008 -2.97 -3.14 -0.18 L-MR Bond USDUnited GrowthPath 2030 -0.2 -4.32 -2.95 9.97 1.23 30/06/2008 -25.31 -12.41 -1.01 M-HR Target MaturityHenderson Global Balanced -0.26 -6.56 -5.13 10.2 2.07 30/06/2008 -25.6 -18.42 -9.71 M-HR Mixed Asset SGD BalancedUnited Millennium II -0.15 -2.93 -1.6 10.36 2.47 31/12/2007 -24.28 -8.54 2.1 M-HR Mixed Asset SGD BalancedDWS Premier Select Trust SGD -0.18 -4.71 -3.33 11.36 1.43 30/09/2008 -28.87 -13.47 5.65 M-HR Mixed Asset SGD BalancedUnited GrowthPath 2040 -0.21 -5.91 -4.5 11.66 1.21 30/06/2008 -29.81 -16.7 -3.68 M-HR Target MaturityFirst State Bridge -0.15 -4.18 -2.82 12.54 1.60 31/03/2008 -30.13 -12.03 12.14 M-HR Mixed Asset SGD BalancedUnited Global Healthcare Fund -0.2 -6.77 0.6 13.44 2.25 30/06/2008 -21.34 -18.98 3.96 HR Equity Sector Pharma&HealthUnited Millennium III -0.23 -8.35 -4.01 13.57 2.42 31/12/2007 -37.12 -23.01 -9.99 HR Mixed Asset SGD AggressiveAberdeen Malaysian Equity SGD 0 2.52 4.93 13.97 1.82 31/12/2008 -24.42 7.76 28.27 HR Equity MalaysiaPRU Asian Balanced -0.19 -6.85 -5.42 14.37 1.45 31/12/2008 -33.28 -19.19 -1.76 M-HR Mixed Asset SGD BalancedLionGlobal Singapore Balanced SGD -0.05 -0.09 1.16 14.65 1.51 31/12/2008 -30.72 -0.28 20.08 M-HR Mixed Asset SGD BalancedQuadrant BFirst State Dividend Advantage SGD -0.07 -2.22 5.34 18.7 1.88 31/03/2008 -38.51 -6.51 NA HR Equity Asia Pacific Ex JapanFirst State Asian Growth SGD -0.07 -1.98 5.55 19.19 1.88 31/03/2008 -42.12 -5.83 27.57 HR Equity Asia Pacific Ex JapanAberdeen Pacific Equity SGD -0.15 -7.69 0.69 19.42 1.90 31/12/2008 -46.52 -21.33 16.95 HR Equity Asia Pacific Ex JapanDBS Malaysia Equity SGD -0.16 -8.57 -5.57 20.52 2.04 30/09/2008 -48.2 -23.57 NA HR Equity MalaysiaAberdeen Singapore Equity SGD -0.1 -5.14 2.64 21.36 1.79 31/12/2008 -39.98 -14.63 25.63 HR Equity SingaporeLionGlobal Asia Pacific SGD -0.09 -4.43 3.45 22.19 1.82 31/12/2008 -46.1 -12.71 20.63 HR Equity Asia Pacific Ex JapanAberdeen Global Emerging Markets SGD -0.1 -5.33 3.12 22.39 1.95 31/12/2008 -44.23 -15.16 NA HR Equity Emerging Mkts GlobalLionGlobal Malaysia SGD -0.03 0.23 2.75 22.68 1.64 31/12/2008 -45.98 0.7 10.33 HR Equity MalaysiaAberdeen China Opportunities SGD -0.11 -6.27 -39.97 22.83 1.95 31/12/2008 -50.33 -17.65 4.92 HR Equity ChinaSchroder Singapore Trust Class A -0.07 -3.74 3.84 23.23 1.49 30/06/2008 -44.83 -10.8 10.16 HR Equity SingaporeDWS Singapore Equity -0.09 -5 2.75 23.33 1.79 30/09/2008 -48.89 -14.27 25.27 HR Equity SingaporeSGAM Singapore Dividend Growth -0.08 -4.64 3.06 23.39 1.48 31/03/2008 -46.65 -13.29 24.84 HR Equity SingaporeFidelity Funds - Asian Special Sits A -0.04 -3.64 4.12 23.52 1.97 30/04/2008 -46.01 -10.53 29.45 HR Equity Asia Pacific Ex JapanUnited Growth Fund -0.13 -8.29 -0.03 23.78 1.21 30/06/2008 -48.2 -22.86 1.36 HR Equity SingaporeFirst State Regional China SGD -0.01 1.9 6.67 23.96 1.88 31/03/2008 -45.51 5.81 47.06 HR Equity Greater ChinaFidelity Funds - Greater China A USD -0.08 -3.1 2.14 24.07 1.98 30/04/2008 -43.95 -9.01 12.21 HR Equity Greater ChinaDWS Asia Premier Trust SGD -0.13 -8.29 0.18 24.13 1.62 30/09/2008 -51.25 -22.86 7.78 HR Equity Asia Pacific Ex JapanAberdeen Indonesia Equity SGD -0.04 -0.61 -1.58 24.19 1.84 31/12/2008 -44.76 -1.82 50.64 HR Equity IndonesiaLionGlobal Singapore Trust SGD -0.08 -4.72 3 24.69 1.55 31/12/2008 -49.64 -13.51 8.56 HR Equity SingaporeSchroder Emerging Markets -0.13 -8.84 0.19 25.17 2.13 30/06/2008 -51.73 -24.25 12.95 HR Equity Emerging Mkts GlobalFidelity Funds - South East Asia A USD -0.03 -3.59 4.17 25.64 1.98 30/04/2008 -50.61 -10.38 29.81 HR Equity Asia Pacific Ex JapanLionGlobal China Growth SGD 0.01 3.1 7.77 25.68 1.54 31/12/2008 -46.42 9.59 43.32 HR Equity Greater ChinaUnited Asia Fund -0.1 -6.25 1.9 25.88 1.68 30/06/2008 -53.37 -17.6 8.06 HR Equity Asia Pacific Ex JapanLionGlobal Singapore/Malaysia SGD -0.08 -5.37 -0.26 26.33 1.47 31/12/2008 -55.91 -15.25 3.49 HR Equity Malaysia/SingaporeSchroder Greater China -0.05 -2.31 2.85 26.34 2.18 30/06/2008 -49.56 -6.78 25.74 HR Equity Greater ChinaPRU Dragon Peacock -0.04 -2.11 5.29 28.99 1.80 31/12/2008 -57.63 -6.21 NA HR Equity Emerging Mkts Far EastLionGlobal India SGD -0.06 -3.95 2.6 29.54 1.65 31/12/2008 -56.27 -11.38 59.68 HR Equity IndiaUnited Greater China Fund -0.02 0.32 5.23 30.16 1.84 30/06/2008 -54.43 0.97 24.2 HR Equity Greater ChinaDWS China Equity A SGD 0.1 14.49 -3.68 31.17 1.82 30/09/2008 -47.61 50.08 NA HR Equity ChinaSGAM Golden China SGD 0 2.61 7.32 32.76 1.99 31/03/2008 -55.27 8.04 NA HR Equity Greater ChinaLegg Mason Southeast Asia Special Sits Trust -0.08 -6.35 1.81 33.11 1.85 30/09/2008 -62.59 -17.87 1.33 HR Equity Asia Pacific Ex JapanHSBC GIF Chinese Equity AD SGD 0 4.22 -19.33 34.87 1.91 30/06/2008 -53.9 13.22 24.21 HR Equity China
Singapore Unit Trust 12/30/200512/31/2008AnnualisedExcessReturn2
(SGD %)
12/31/200312/31/20085-Year FundPerformance
12/30/200512/31/20083-Year FundPerformance
LipperGlobalClassification
12/30/200512/31/2008AnnualisedMonthlyRisk (SGD %)
SharpeRatio1
(3 Year)
Expense Ratio12/30/200512/31/2008AnnualisedMonthlyReturn (SGD %)
12/31/200712/31/20081-Year FundPerformance
CPFIS RiskClassification3

12
CPFIS-Included Unit Trusts Annex A
Value Date
Quadrant CFidelity Funds - Fid TargetTM 2010 A USD -0.21 -9.33 -0.61 9.84 1.92 30/04/2008 -27.94 -25.46 -13.02 M-HR Target MaturityHenderson Japanese Equity -0.49 -15.06 -0.02 10.9 1.64 30/06/2008 -23.23 -38.71 NA HR Equity JapanAberdeen Japan Equity -0.63 -19.53 -3.18 10.93 1.95 31/12/2008 -32.05 -47.89 -31.27 HR Equity JapanAllianceBernstein-Global Balanced Portfolio A SGD -0.41 -12.99 -8.41 11.16 1.79 31/08/2008 -35.92 -34.14 NA M-HR Mixed Asset USD Bal - GlobalSIS Growth -0.27 -14.38 -9.65 12.85 1.68 31/03/2008 -38.84 -37.23 -29.75 M-HR Mixed Asset USD Bal - GlobalDBS Horizon Japanese Equity SGD -0.49 -18.17 -2.24 12.9 1.80 30/09/2008 -31.54 -45.21 -19.77 HR Equity JapanDBS Japan Growth -0.45 -16.44 -1.01 12.92 1.28 30/09/2008 -30.48 -41.65 -16.9 HR Equity JapanDBS Eight Portfolio D -0.28 -10.66 -6.11 13.7 1.96 30/09/2008 -37.41 -28.69 -15.21 HR Mixed Asset SGD AggressiveInfinity US 500 Stock Index SGD -0.35 -13.86 -0.93 14.12 1.07 31/12/2008 -38.06 -36.08 -29.61 HR Equity North AmericaHSBC GIF Japanese Equity PD SGD -0.3 -17.5 -1.77 14.55 1.35 30/06/2008 -33.52 -43.85 NA HR Equity JapanFidelity Funds - America A USD -0.29 -16.18 -2.67 14.73 1.91 30/04/2008 -40.67 -41.12 -26.3 HR Equity North AmericaLionGlobal Japan SGD -0.47 -20.25 -3.68 14.8 1.55 31/12/2008 -36.92 -49.29 -24.56 HR Equity JapanInfinity Global Stock Index SGD -0.3 -12.93 -0.78 15.09 1.23 31/12/2008 -41.29 -33.98 -20.57 HR Equity GlobalFidelity Funds - Japan A JPY -0.33 -20.96 -4.16 15.36 1.92 30/04/2008 -38.65 -50.61 -32.25 HR Equity JapanUnited International Growth Fund -0.26 -11.21 0.55 15.54 1.26 30/06/2008 -41.69 -29.99 -14.32 HR Equity GlobalSchroder Japanese Equity Alpha -0.47 -21.15 -4.29 15.58 2.43 30/06/2008 -36.3 -50.98 NA HR Equity JapanLionGlobal Japan Growth SGD -0.44 -20.46 -3.82 15.82 1.90 31/12/2008 -38.7 -49.69 -20.92 HR Equity JapanFidelity Funds - Fid TargetTM 2020 A USD -0.22 -14.34 -4.73 16.09 2.23 30/04/2008 -43.11 -37.15 -20.89 HR Target MaturityAberdeen Global Opportunities SGD -0.21 -9.46 1.92 16.18 1.95 31/12/2008 -39.63 -25.79 0.85 HR Equity GlobalFirst State Global Opportunities SGD -0.28 -12.88 -0.74 16.19 1.90 31/03/2008 -41.78 -33.87 -23.42 HR Equity GlobalSchroder Pan Asia -0.29 -13.59 -1.09 16.23 1.95 30/06/2008 -41.7 -35.48 -11.33 HR Equity Asia PacificFidelity Funds - FPS Global Growth A USD -0.23 -15.09 -2.43 16.32 2.43 30/04/2008 -44.62 -38.77 -22.44 HR Equity GlobalDBS Horizon US Equity SGD -0.32 -15.03 -1.81 16.44 1.97 30/09/2008 -42.99 -38.66 -30.36 HR Equity North AmericaSIS High Growth Fund -0.28 -18.15 -4.73 16.61 1.87 31/03/2008 -47 -45.17 -36.54 HR Equity GlobalDBS Horizon Global Equity SGD -0.31 -15.21 -2.52 16.63 1.78 30/09/2008 -44.99 -39.04 -24.39 HR Equity GlobalDBS Eight Portfolio E -0.27 -13.53 -1.25 17.25 1.95 30/09/2008 -45.22 -35.36 -20.13 HR Equity GlobalSIS International Equity -0.26 -17.57 -4.29 17.27 1.93 31/03/2008 -48.62 -44 -32.67 HR Equity GlobalFidelity Funds - Global Focus A USD -0.2 -13.85 -1.49 17.56 1.96 30/04/2008 -46.61 -36.07 -21.2 HR Equity GlobalUnited Global Technology Fund -0.25 -12.43 1.96 17.99 2.64 30/06/2008 -40.67 -32.84 -33.67 HR Equity Sector Information TechInfinity European Stock Index SGD -0.22 -11.12 2.18 18.15 1.17 31/12/2008 -46.88 -29.79 -10.94 HR Equity EuropeQuadrant DSchroder Global Smaller Companies -0.24 -12.47 2.25 18.34 2.27 30/06/2008 -42.84 -32.94 -10.5 HR Equity Global Sm&Mid CapAllianceBernstein-Global Equity Blend Pf A SGD -0.36 -19.63 -5.81 18.38 1.95 31/08/2008 -52.48 -48.08 NA HR Equity GlobalPRU Global Technology -0.34 -18.79 -2.6 18.68 1.92 31/12/2008 -46.8 -46.44 -34.17 HR Equity Sector Information TechABN AMRO Star Europe Equity -0.28 -15.73 -1.25 18.86 1.54 30/06/2008 -50.1 -40.16 -30.48 HR Equity EuropeFidelity Funds - European Growth A EUR -0.28 -12.1 1.44 19.09 1.94 30/04/2008 -48.2 -32.08 -5.71 HR Equity EuropeAberdeen Global Technology -0.26 -14.04 0.78 19.11 1.83 31/12/2008 -42.91 -36.48 -30.85 HR Equity Sector Information TechSchroder European Large Cap Equity -0.2 -11.07 2.22 19.12 1.94 30/06/2008 -45.22 -29.67 -12.73 HR Equity EuropeHenderson Global Technology -0.23 -12.34 2.02 19.31 2.41 30/06/2008 -42.31 -32.63 -25.62 HR Equity Sector Information TechUnited Global Capital Fund -0.32 -18.63 1.58 19.33 2.07 30/06/2008 -50 -46.12 -32.67 HR Equity Sector Banks&FinancialSchroder Asian Equity Yield -0.2 -11.45 -2.44 19.46 2.10 30/06/2008 -44.84 -30.56 NA HR Equity Asia Pacific Ex JapanAIG International Funds - Acorns of Asia Balanced -0.18 -9.58 -8.06 19.48 1.65 30/06/2008 -44.8 -26.07 -7.71 M-HR Mixed Asset SGD BalancedABN AMRO Star Global Technology -0.31 -17.71 -1.85 19.87 1.29 30/06/2008 -50.21 -44.29 -50.21 HR Equity Sector Information TechDBS Horizon European Equity SGD -0.21 -12.55 -3.24 20.03 1.79 30/09/2008 -47.41 -33.13 -13.37 HR Equity Europe ex UKSchroder European Equity Alpha -0.2 -11.64 1.79 20.2 2.09 30/06/2008 -46.33 -31.01 NA HR Equity EuropeLegg Mason Value A Dis A USD -0.41 -28.56 -11.31 20.61 1.89 31/08/2008 -56.81 -63.54 -58.38 HR Equity North AmericaUnited Global Real Estate Securities Fund -0.26 -15.97 -0.17 20.95 2.22 30/06/2008 -45.71 -40.67 NA HR Equity Sector Real Est GlobalDBS Global Property Securities SGD -0.27 -17.46 -1.22 21.15 1.90 30/09/2008 -46.81 -43.76 NA HR Equity Sector Real Est GlobalUnited Regional Growth Fund -0.28 -17.51 -4.04 21.24 1.44 30/06/2008 -53.36 -43.87 -24.47 HR Equity Asia PacificHenderson European -0.22 -13.53 -4.04 21.27 2.45 30/06/2008 -49.21 -35.35 -15.79 HR Equity Europe ex UKUnited Asia Top 50 Fund -0.24 -15.57 -2.59 22.23 2.04 30/06/2008 -50.25 -39.81 -21.85 HR Equity Asia PacificPRU Pan European -0.17 -10.79 2.43 22.38 1.79 31/12/2008 -46.03 -28.99 -6.51 HR Equity EuropeDBS Shenton Global Opportunities -0.15 -9.07 2.23 22.66 1.62 30/09/2008 -53.31 -24.81 -9.77 HR Equity GlobalHenderson Global Property Equities -0.23 -16.23 -0.36 22.92 2.38 30/06/2008 -47.49 -41.22 NA HR Equity Sector Real Est GlobalAberdeen European Opportunities -0.22 -15.75 -1.26 22.94 1.95 31/12/2008 -51.28 -40.19 -25.5 HR Equity EuropeAPS Alpha SGD -0.28 -19.02 -8.54 22.96 0.50 31/12/2008 -49.15 -46.9 -41.75 HR Equity Asia Pacific Ex JapanFidelity Funds - Taiwan A USD -0.18 -16.21 -0.66 23.07 2.05 30/04/2008 -44.64 -41.18 -27.99 HR Equity TaiwanAberdeen Thailand Equity SGD -0.14 -9.37 3.24 23.28 1.80 31/12/2008 -43.35 -25.56 -14.33 HR Equity ThailandPRU Global Basics SGD -0.15 -10.29 1.27 23.5 1.74 31/12/2008 -47.1 -27.8 NA HR Equity GlobalAllianz Glo Investors PF-Global Internet -0.25 -17.23 -1.51 23.76 2.13 30/06/2008 -42.94 -43.29 -27.63 HR Equity Sector Information TechSchroder Asian Growth SGD -0.15 -10.34 -1.53 23.84 1.42 30/06/2008 -52.14 -27.93 -3.74 HR Equity Asia Pacific Ex JapanHenderson European Property Securities -0.31 -23.26 -1.43 24.64 2.37 30/06/2008 -56.58 -54.81 -22.29 HR Equity Sector Real Est EuropeDBS Shenton Thrift -0.14 -10.35 -1.76 25.4 0.96 30/09/2008 -54.95 -27.95 -7.76 HR Equity SingaporeHenderson Pacific Dragon -0.14 -10.57 -1.72 25.8 2.45 30/06/2008 -52.53 -28.47 -11.21 HR Equity Asia Pacific Ex JapanAberdeen India Opportunities SGD -0.12 -9.17 -1.93 27.68 1.95 31/12/2008 -53.2 -25.06 NA HR Equity IndiaLegg Mason Asian Enterprise Trust -0.15 -11.86 -2.78 28.61 1.85 30/09/2008 -59.74 -31.53 -4.2 HR Equity Asia Pacific Ex JapanLionGlobal Thailand SGD -0.13 -10.96 2.02 29.54 1.66 31/12/2008 -50.72 -29.42 -31.7 HR Equity ThailandFidelity Funds - Korea A USD -0.12 -16.77 0.32 31.14 1.98 30/04/2008 -57.46 -42.35 10.41 HR Equity KoreaUniFund -0.14 -12.37 -6.49 31.33 1.19 30/06/2008 -62.41 -32.7 -23.33 HR Equity Malaysia/SingaporeFidelity Funds - European Aggressive A EUR -0.26 -22.57 -6.06 31.75 1.96 30/04/2008 -66.62 -53.58 -30.5 HR Equity EuropeSchroder Emerging Europe -0.2 -19.25 0.99 32.19 2.19 30/06/2008 -65.75 -47.35 NA HR Equity Emerging Mkts EuropeFirst State Global Resources SGD -0.11 -10.01 -3.59 32.49 1.75 31/03/2008 -57.82 -27.12 NA HR Equity Sector Natural ResourceDWS India Equity A SGD -0.11 -10.03 -2.66 33.14 1.81 30/09/2008 -66.22 -27.16 NA HR Equity IndiaHSBC GIF Indian Equity AD SGD -0.1 -12.65 -4.89 38.41 1.91 30/06/2008 -70.32 -33.36 11.99 HR Equity India
Note 1: Sharpe Ratio is a measurement of a fund's annualized return that is in excess of the risk-free rate (a theoretical interest rate that would be returned on an investment that is completely free of risk) and adjusted for the fund's volatility. The calculation is as follows:(Fund Return – Risk-Free Return)/Fund Standard Deviation. From this formula, it can be derived that the higher a fund’s Sharpe ratio, the better its returns relative to the amount of investment risk it has taken.Note 2: Annualized Excess Return is a fund's excess return relative to its benchmark, on an annualised basis. Benchmarks are assigned by Lipper in accordance with the fund's stated investment mandate and Lipper Global Classifications and Methodology.Note 3: HR=Higher Risk, M-HR=Medium to High Risk, L-MR=Low to Medium Risk, LR=Lower Risk
Singapore Unit Trust 12/30/200512/31/2008AnnualisedExcessReturn2
(SGD %)
12/31/200312/31/20085-Year FundPerformance
12/30/200512/31/20083-Year FundPerformance
LipperGlobalClassification
12/30/200512/31/2008AnnualisedMonthlyRisk (SGD %)
SharpeRatio1
(3 Year)
Expense Ratio12/30/200512/31/2008AnnualisedMonthlyReturn (SGD %)
12/31/200712/31/20081-Year FundPerformance
CPFIS RiskClassification3

13
CPFIS-Included ILPs Annex A
Value Date
Quadrant AManulife Singapore Cash -0.42 2.25 -0.33 0.25 0.02 30/09/2008 1.47 6.92 NA LR Money Market SGDAIA S$ Money Market -1.51 1.72 -0.9 0.32 0.32 30/06/2008 0.48 5.24 6.96 LR Money Market SGDPruLink Singapore Cash 0.14 2.69 0.13 0.35 0.32 31/12/2008 1.77 8.29 11.19 LR Money Market SGDGE GreatLink Cash -0.2 2.31 -0.27 0.44 0.31 30/06/2008 1.43 7.1 9.94 LR Money Market SGDJohn Hancock Singapore Cash -0.24 2.08 -0.52 0.57 0.02 30/09/2008 1.48 6.36 7.71 LR Money Market SGDGE GreatLink Stable Bond -0.02 2.46 -1.89 1.41 0.73 30/06/2008 1.39 7.56 10.26 L-MR Bond Global(HSBC Insurance) HSBC-Link Singapore Bond 0.02 2.68 -1.64 1.41 0.72 30/09/2008 1.37 8.27 11.27 L-MR Bond GlobalPruLink Protected Global Titans 0.26 4.64 2.18 2.33 0.89 31/12/2008 2.02 14.58 16.63 L-MR ProtectedNTUC Global Bond -0.14 0.66 -3.86 3.98 0.87 30/06/2008 -0.53 1.99 8.27 L-MR Bond GlobalManulife Singapore Bond 0.11 4.17 -1.51 4.02 1.10 30/09/2008 4.78 13.05 NA L-MR Bond SGDAXA Inspire - Global Defensive -0.4 -3.15 -8.06 4.13 1.55 31/03/2008 -1.24 -9.16 -7.66 L-MR Bond GlobalAIA Regional Fixed Income -0.1 1.01 -5.07 4.45 0.88 30/06/2008 -7.16 3.07 16.01 L-MR Bond SGDGE GreatLink Global Bond -0.18 -0.27 -4.87 4.58 0.87 30/06/2008 -1.49 -0.8 3.22 L-MR Bond GlobalNTUC Singapore Bond 0.15 5.05 -0.53 4.66 0.51 30/06/2008 6.55 15.93 22.39 L-MR Bond SGDGE GreatLink LifeStyle Secure Portfolio -0.2 -0.71 -2.04 4.68 0.97 30/06/2008 -10.43 -2.1 5.78 M-HR Mixed Asset SGD ConservativeManulife Lifestyle Portfolios - Conservative -0.12 0.51 -0.8 4.81 1.14 30/09/2008 -4.9 1.54 NA M-HR Mixed Asset SGD ConservativePruLink International Bond -0.3 -2.76 -7.63 5.16 1.15 31/12/2008 -5.97 -8.06 NA L-MR Bond GlobalNTUC Conservative -0.22 -1.66 -3.03 5.43 0.92 30/06/2008 -12.56 -4.9 7.12 M-HR Mixed Asset SGD ConservativeAXA Inspire - Global Secure -0.5 -6.72 -8.25 5.46 2.16 31/03/2008 -16.73 -18.85 -11.95 L-MR Mixed Asset SGD ConservativePruLink Global Bond 0.04 3.4 -0.87 5.89 0.77 31/12/2008 8.84 10.54 11.15 L-MR Bond GlobalJohn Hancock Cautious Portfolio -0.14 -0.4 -1.73 5.99 1.53 30/09/2008 -4.66 -1.19 6.38 M-HR Mixed Asset SGD ConservativeManulife Golden International Bond 0 2.62 -1.72 6.31 0.94 30/09/2008 5.27 8.06 13.29 L-MR Bond GlobalAviva Legg Mason Global Bond Trust (SP) -0.07 0.99 -3.5 6.32 2.35 31/12/2008 3.63 2.99 NA L-MR Bond GlobalJohn Hancock Worldwide Bond -0.02 2.05 -2.34 6.36 1.45 30/09/2008 4.99 6.28 6.53 L-MR Bond GlobalManulife Lifestyle Portfolios - Secure -0.21 -2.23 -0.93 6.54 1.26 30/09/2008 -13.95 -6.56 NA M-HR Mixed Asset SGD Balanced(HSBC Insurance) HSBC-Link Ethical Capital Protected -0.38 -6.21 4.51 6.67 2.00 30/09/2008 -15.48 -17.51 -24.18 M-HR Equity GlobalAIA Portfolio 30 -0.25 -3.32 -4.74 6.71 1.15 30/06/2008 -16.84 -9.64 4.29 L-MR Mixed Asset SGD ConservativeAviva MM Income Growth -0.11 -0.07 -1.39 7.14 1.09 31/12/2008 -15.49 -0.2 15.58 M-HR Mixed Asset SGD ConservativeAviva Income Growth -0.15 -1.1 -2.45 7.16 2.09 31/12/2008 -16.5 -3.26 9.75 M-HR Mixed Asset SGD ConservativeGE GreatLink Global Supreme -0.32 -5.57 -4.17 7.32 1.29 30/06/2008 -18.98 -15.79 -7.98 M-HR Mixed Asset SGD BalancedGE GreatLink LifeStyle Steady Portfolio -0.28 -4.42 -3.05 7.32 1.14 30/06/2008 -20.25 -12.68 -3.16 M-HR Mixed Asset SGD BalancedPruLink Global Managed -0.29 -5.53 -4.13 8.01 1.38 31/12/2008 -19.63 -15.68 -6.62 M-HR Mixed Asset SGD BalancedNTUC Balanced -0.23 -4.14 -2.78 8.22 1.00 30/06/2008 -21.66 -11.93 3.03 M-HR Mixed Asset SGD BalancedAIA Portfolio 50 -0.28 -5.71 -4.31 8.47 1.69 30/06/2008 -21.46 -16.17 -5.18 M-HR Mixed Asset SGD BalancedUOB Life FOF Millennium Trust I -0.2 -3.44 -2.1 8.64 2.77 31/12/2007 -20.56 -9.97 -2.73 M-HR Mixed Asset SGD BalancedPruLink Adapt 2015 -0.17 -3.08 -1.75 9.56 1.53 31/12/2008 -22.62 -8.95 NA M-HR Target MaturityJohn Hancock Global Balanced -0.25 -6.21 -4.79 9.91 1.94 30/09/2008 -25.95 -17.48 -0.94 M-HR Mixed Asset SGD BalancedManulife Golden Global Balanced -0.24 -5.72 -4.32 9.93 1.58 30/09/2008 -25.69 -16.21 -3.5 M-HR Mixed Asset SGD BalancedUOB Life FOF Millennium Trust II -0.15 -2.93 -1.6 10.36 2.47 31/12/2007 -24.28 -8.54 2.54 M-HR Mixed Asset SGD BalancedGE GreatLink LifeStyle Balanced Portfolio -0.23 -6.2 -4.78 10.75 1.23 30/06/2008 -29.44 -17.47 -4.79 M-HR Mixed Asset SGD BalancedManulife Lifestyle Portfolios - Moderate -0.15 -3.66 -2.31 11.41 1.38 30/09/2008 -27.82 -10.57 NA M-HR Mixed Asset SGD Balanced(HSBC Insurance) HSBC-Link Premium Balanced -0.19 -5.1 -3.72 11.43 1.57 30/09/2008 -29.74 -14.54 4.4 M-HR Mixed Asset SGD BalancedJohn Hancock Balanced Portfolio -0.19 -5.25 -3.85 11.53 1.71 30/09/2008 -28.35 -14.93 1.92 M-HR Mixed Asset SGD BalancedNTUC Trust -0.05 0.08 1.33 12.79 0.90 30/06/2008 -25.2 0.25 25.82 M-HR Mixed Asset SGD BalancedPruLink Adapt 2025 -0.21 -7.03 -5.59 13.12 1.59 31/12/2008 -32.4 -19.65 NA M-HR Target MaturityNTUC Prime -0.05 0.19 1.43 13.31 0.91 30/06/2008 -27.25 0.56 18.84 M-HR Mixed Asset SGD BalancedUOB Life FOF Global Healthcare -0.2 -6.77 0.6 13.44 2.25 30/06/2008 -21.34 -18.98 3.96 HR Equity Sector Pharma&HealthManulife Golden Balanced Growth -0.07 -0.71 0.56 13.87 1.41 30/09/2008 -29.79 -2.12 23.41 M-HR Mixed Asset SGD BalancedPruLink Asian Reach Managed -0.18 -6.72 -5.29 14.39 1.51 31/12/2008 -33.31 -18.84 -0.92 M-HR Mixed Asset SGD BalancedAviva Balanced Growth -0.15 -4.85 -3.47 14.6 2.07 31/12/2008 -32.13 -13.85 8.38 M-HR Mixed Asset SGD BalancedAviva MM Balanced Growth -0.13 -3.88 -2.53 14.6 1.07 31/12/2008 -31.41 -11.2 14.08 M-HR Mixed Asset SGD BalancedJohn Hancock Adventurous Portfolio -0.17 -6.3 -2.14 14.72 1.75 30/09/2008 -35.31 -17.74 -1.48 M-HR Mixed Asset SGD AggressiveNTUC Enhanced -0.06 -0.77 2.97 15.2 0.94 30/06/2008 -31.09 -2.3 16.94 M-HR Mixed Asset SGD AggressiveJohn Hancock Money Growth Plan -0.02 1.63 2.84 15.36 2.33 30/09/2008 -30.53 4.97 31.33 M-HR Mixed Asset SGD BalancedManulife Lifestyle Portfolios - Growth -0.16 -6.42 -2.25 15.42 1.54 30/09/2008 -37.36 -18.05 NA HR Mixed Asset SGD AggressiveQuadrant BAIA India Balanced -0.13 -5.18 -3.79 17.31 1.78 30/06/2008 -38.39 -14.75 NA M-HR Mixed Asset SGD BalancedPruLink Singapore Managed -0.08 -2.6 1.27 17.42 1.32 31/12/2008 -36.22 -7.61 16.68 M-HR Mixed Asset SGD AggressiveAIA Greater China Balanced -0.1 -3.77 -2.43 18.59 1.66 30/06/2008 -39 -10.9 4.93 M-HR Mixed Asset SGD BalancedAIA Growth -0.06 -1.83 1.99 19.28 1.29 30/06/2008 -41.25 -5.39 24.21 M-HR Mixed Asset SGD AggressiveAXA Asian Growth -0.11 -5.8 2.28 20.84 1.81 31/03/2008 -43.61 -16.41 NA HR Equity Asia Pacific Ex JapanAXA Investor’s Choice-AXA Value Growth -0.11 -5.73 2.34 20.87 1.72 31/03/2008 -43.62 -16.23 2.51 HR Equity Asia Pacific Ex JapanJohn Hancock Pacific Harvest -0.11 -5.73 -1.61 21.66 1.92 30/09/2008 -45.19 -16.23 6.22 M-HR Mixed Asset SGD AggressiveAXA Fortress A -0.09 -5.1 2.67 22.3 1.81 31/03/2008 -46 -14.54 29.83 HR Equity SingaporeNTUC Singapore Equity -0.1 -5.96 1.94 22.52 0.70 30/06/2008 -47.52 -16.83 13.7 HR Equity SingaporeGE GreatLink Enhancer -0.05 -1.43 6.02 22.85 1.19 30/06/2008 -45.56 -4.24 36.45 HR Equity Asia Pacific Ex JapanManulife Golden Singapore Growth -0.09 -4.78 2.94 22.89 1.92 30/09/2008 -47.94 -13.67 27.15 HR Equity SingaporeGE GreatLink Singapore Equities -0.07 -3.09 4.4 22.96 1.19 30/06/2008 -47.38 -8.98 19.67 HR Equity SingaporeGE GreatLink Far East ex Japan Equities -0.09 -5.17 2.82 23.95 1.35 30/06/2008 -50.42 -14.71 10.52 HR Equity Asia Pacific Ex JapanAXA Fortress B -0.07 -4.28 3.38 24.71 1.81 31/03/2008 -45.36 -12.29 32.97 HR Equity SingaporeUOB LifeLink Asia -0.1 -6.75 1.48 25.41 3.31 31/12/2008 -52.88 -18.9 2.09 HR Equity Asia Pacific Ex JapanGE GreatLink ASEAN Growth -0.06 -3.03 0.32 25.78 1.20 30/06/2008 -53.1 -8.82 1.31 HR Equity Asia Pacific Ex JapanUOB Life FOF Asia -0.1 -6.25 1.9 25.88 1.68 30/06/2008 -53.37 -17.6 8.06 HR Equity Asia Pacific Ex JapanAIA Greater China Equity -0.09 -6.34 -0.76 26.41 1.68 30/06/2008 -51.54 -17.83 -1.58 HR Equity Greater ChinaPrulink China-India -0.05 -2.12 5.28 28.72 1.81 31/12/2008 -57.56 -6.23 NA HR Equity Emerging Mkts Far EastAviva LionGlobal India (SP) -0.07 -4.63 2.01 29.46 3.08 31/12/2008 -56.11 -13.25 NA HR Equity IndiaUOB Life FOF Greater China -0.02 0.32 5.23 30.16 1.84 30/06/2008 -54.43 0.97 24.23 HR Equity Greater ChinaManulife Golden Regional China 0.09 13.84 -4.61 30.99 1.95 30/09/2008 -47.47 47.52 82.76 HR Equity ChinaJohn Hancock Greater China 0.09 13.86 17.73 31.18 1.95 30/09/2008 -47.69 47.59 95.54 HR Equity Greater ChinaManulife Golden S.E.A. Special Situations -0.07 -6.32 -2.74 33.78 1.79 30/09/2008 -62.14 -17.77 3.41 HR Equity Asia Pacific Ex Japan(HSBC Insurance) HSBC-Link China Equity 0 3.15 -21.15 34.88 1.91 30/09/2008 -54.26 9.75 21.77 HR Equity China
LipperGlobalClassification
12/30/200512/31/2008AnnualisedMonthlyRisk (SGD %)
SharpeRatio1
(3 Year)
12/30/200512/31/2008AnnualisedMonthlyReturn (SGD %)
12/31/200712/31/20081-Year FundPerformance
CPFIS RiskClassification3
Singapore Insurance-Linked Product 12/30/200512/31/2008AnnualisedExcessReturn2
(SGD %)
12/31/200312/31/20085-Year FundPerformance
12/30/200512/31/20083-Year FundPerformance
Expense Ratio

14
CPFIS-Included ILPs Annex A
Value Date
Quadrant CGE GreatLink Global Optimum -0.39 -7.84 -6.37 7.67 1.36 30/06/2008 -21.31 -21.73 -16.44 M-HR Mixed Asset SGD BalancedAXA Inspire - Global Balanced -0.43 -10.41 -8.86 8.81 2.02 31/03/2008 -27.95 -28.08 -19.3 M-HR Mixed Asset SGD BalancedAIA Portfolio 70 -0.32 -8.57 -4.21 10.21 1.75 30/06/2008 -28.22 -23.56 -13.17 M-HR Mixed Asset SGD AggressiveAviva Templeton Global Balanced (SP) -0.32 -9.41 -7.89 10.76 3.10 31/12/2008 -30.5 -25.65 -15.4 M-HR Mixed Asset SGD BalancedNTUC Growth -0.24 -7.14 -2.9 11.48 1.02 30/06/2008 -30.87 -19.92 -2.95 M-HR Mixed Asset SGD AggressiveAIA Global Balanced -0.3 -9.26 -7.75 11.5 1.78 30/06/2008 -31.21 -25.3 -15.34 M-HR Mixed Asset SGD BalancedAIA International Health Care -0.4 -13.39 -4.99 12.16 2.28 30/06/2008 -28.67 -35.03 -20.41 HR Equity Sector Pharma&HealthAXA Inspire - Global Growth -0.34 -12.4 -7.68 12.8 2.16 31/03/2008 -37.79 -32.77 -19.44 M-HR Mixed Asset SGD AggressiveUOB Life FOF Millennium Trust III -0.23 -8.35 -4.01 13.57 2.42 31/12/2007 -37.12 -23.01 -9.79 HR Mixed Asset SGD AggressiveManulife Japan Growth -0.48 -19.69 -3.29 14.26 1.60 30/09/2008 -32.26 -48.19 NA HR Equity JapanJohn Hancock Japan Growth -0.47 -19.16 -2.93 14.31 1.75 30/09/2008 -31.91 -47.17 -27.54 HR Equity JapanGE GreatLink LifeStyle Progressive Portfolio -0.22 -8.54 -4.18 14.57 1.35 30/06/2008 -38.09 -23.49 -8.5 HR Mixed Asset SGD AggressiveGE GreatLink Global Value Equity -0.37 -15.82 -2.99 14.75 1.57 30/06/2008 -41.8 -40.35 -29.71 HR Equity GlobalPruLink America -0.39 -16.5 -2.9 14.79 1.91 31/12/2008 -40.61 -41.77 NA HR Equity North AmericaJohn Hancock Life Sciences -0.29 -12.6 -4.33 15.03 2.10 30/09/2008 -29.16 -33.23 -19.98 HR Equity Sector Pharma&HealthNTUC Amanah Equity -0.24 -9.93 1.55 15.03 1.09 30/06/2008 -36.66 -26.94 NA HR Equity GlobalManulife Golden Life Sciences -0.28 -12.12 -3.16 15.05 1.67 30/09/2008 -28.93 -32.13 -18.39 HR Equity Sector Pharma&HealthPruLink Adapt 2035 -0.22 -9.39 -7.87 15.13 1.65 31/12/2008 -37.54 -25.61 NA HR Target MaturityAIA Portfolio 100 -0.33 -14.58 -2.05 15.15 1.80 30/06/2008 -41.67 -37.68 -26.84 HR Equity GlobalNTUC Global Equity -0.32 -14.51 -1.99 15.5 1.42 30/06/2008 -43.35 -37.52 -22.58 HR Equity GlobalUOB Life FOF International Growth -0.26 -11.21 0.55 15.54 1.26 30/06/2008 -41.69 -29.99 -14.29 HR Equity GlobalGE GreatLink Global Equity -0.33 -14.74 -2.17 15.6 1.78 30/06/2008 -42.03 -38.03 -26.54 HR Equity GlobalAviva LionGlobal Japan Growth (SP) -0.48 -21.78 -4.72 15.65 3.30 31/12/2008 -39.51 -52.15 NA HR Equity JapanUOB LifeLink Global -0.23 -9.74 1.7 15.73 3.16 31/12/2008 -40.65 -26.47 -14.04 HR Equity GlobalQuadrant DJohn Hancock Worldwide Equities -0.26 -12.26 -0.26 16.3 1.92 30/09/2008 -42.88 -32.45 -17.16 HR Equity GlobalManulife Golden Worldwide Equity -0.26 -11.9 0.02 16.31 1.76 30/09/2008 -42.69 -31.61 -17.87 HR Equity GlobalPruLink Global Equity -0.31 -14.53 -2.01 16.42 1.59 31/12/2008 -41.89 -37.55 -24.65 HR Equity GlobalGE GreatLink Global Intersection -0.34 -17.53 -4.26 17.44 1.57 30/06/2008 -47.13 -43.9 -33.15 HR Equity Global(HSBC Insurance) Global Leaders -0.33 -17.33 -4.11 17.57 1.76 30/09/2008 -46.74 -43.49 -28.17 HR Equity GlobalGE GreatLink LifeStyle Dynamic Portfolio -0.24 -12.12 -0.16 17.81 1.49 30/06/2008 -45.82 -32.14 -17.16 HR Equity GlobalNTUC Takaful -0.17 -8.1 3 17.92 1.55 30/06/2008 -41.81 -22.38 -12.6 HR Equity Global(HSBC Insurance) HSBC-Link Ethical Global Equity -0.27 -14.74 -2.17 18.06 2.21 30/09/2008 -45.59 -38.02 -29.5 HR Equity GlobalGE GreatLink Pan Asia -0.3 -16.45 -3.25 18.45 2.13 30/06/2008 -47.38 -41.67 -21.04 HR Equity Asia PacificGE GreatLink Global Growth Trends Portfolio -0.37 -20.05 -6.11 18.49 1.78 30/06/2008 -53.73 -48.89 -34.7 HR Equity GlobalAXA Inspire - Global High Growth Portfolio -0.32 -17.31 -4.1 18.54 2.52 31/03/2008 -50.03 -43.46 -29.73 HR Equity GlobalPruLink Global Technology -0.34 -18.62 -2.49 18.71 1.74 31/12/2008 -46.72 -46.11 -33.42 HR Equity Sector Information TechGE GreatLink European Equity -0.25 -13.78 0.19 18.95 1.89 30/06/2008 -47.45 -35.9 -18.68 HR Equity EuropeNTUC Europe Equity -0.24 -13.58 0.33 19.09 1.38 30/06/2008 -48.92 -35.47 -14.94 HR Equity EuropeAsia Life Asia Regional Asian Equity -0.15 -7.91 0.5 19.38 1.44 30/09/2008 -45.08 -21.9 13.7 HR Equity Asia Pacific Ex JapanAIA Acorns of Asia -0.18 -9.61 -8.09 19.53 1.67 30/06/2008 -44.83 -26.16 -7.96 M-HR Mixed Asset SGD BalancedGE GreatLink Global Real Estate Securities -0.26 -14.95 0.56 19.84 1.53 30/06/2008 -43.84 -38.47 NA HR Equity Sector Real Est Global(HSBC Insurance) HSBC-Link Europe Equity -0.21 -12.04 1.48 20.03 2.11 30/09/2008 -46.91 -31.95 NA HR Equity EuropeGE GreatLink Choice (Oct 2010) -0.26 -16.03 -22.76 20.16 1.66 30/06/2008 -47.77 -40.79 NA L-MR ProtectedAviva Henderson European -0.25 -14.81 -5.07 20.39 3.49 31/12/2008 -49.42 -38.18 NA HR Equity Europe ex UKAIA Global Technology -0.23 -13.53 1.15 20.83 1.87 30/06/2008 -39.71 -35.34 -29.64 HR Equity Sector Information TechUOB Life FOF Regional Growth -0.28 -17.51 -4.04 21.24 1.44 30/06/2008 -53.36 -43.87 -24.3 HR Equity Asia Pacific(HSBC Insurance) HSBC-Link Ethical Asia Equity -0.16 -9.36 -0.71 21.39 1.78 30/09/2008 -47.66 -25.54 NA HR Equity Asia Pacific Ex JapanManulife Lifestyle Portfolios - Aggressive -0.16 -9.46 1.92 21.48 1.74 30/09/2008 -49.43 -25.77 NA HR Equity GlobalGE GreatLink Global Technology -0.29 -18.16 -2.17 21.63 1.79 30/06/2008 -48.42 -45.19 -45.19 HR Equity Sector Information TechAviva MM Capital Growth -0.14 -8.38 0.1 21.83 1.15 31/12/2008 -44.99 -23.09 8.79 HR Equity Asia Pacific Ex JapanAviva Capital Growth -0.16 -9.32 -0.68 21.84 2.15 31/12/2008 -45.56 -25.45 3.34 HR Equity Asia Pacific Ex JapanUOB Life FOF Asia Top 50 -0.24 -15.57 -2.59 22.23 2.04 30/06/2008 -50.25 -39.81 -21.85 HR Equity Asia PacificPruLink Pan European -0.17 -10.82 2.4 22.38 1.79 31/12/2008 -46.04 -29.09 -6.62 HR Equity EuropeManulife European Equity -0.22 -15.72 -1.24 23.41 1.91 30/09/2008 -55.56 -40.13 NA HR Equity EuropeJohn Hancock European Equity -0.22 -15.99 -1.43 23.43 2.31 30/09/2008 -55.71 -40.71 -15.54 HR Equity EuropeUOB Life FOF Growth -0.13 -8.88 -0.53 23.81 1.21 30/06/2008 -48.49 -24.36 -4.3 HR Equity SingaporeUOB LifeLink Growth -0.12 -8.28 -0.02 24.15 3.49 31/12/2008 -47.13 -22.84 -3.31 HR Equity Singapore(HSBC Insurance) HSBC-Link Asia Equity -0.13 -8.68 -0.14 24.33 1.86 30/09/2008 -51.75 -23.83 6.11 HR Equity Asia Pacific Ex JapanNTUC Technology -0.26 -18.48 -2.38 24.35 1.27 30/06/2008 -50 -45.82 -42.86 HR Equity Sector Information TechPruLink Emerging Markets -0.18 -12.62 -2.9 24.44 1.89 31/12/2008 -52.32 -33.28 NA HR Equity Emerging Mkts GlobalAIA Regional Equity -0.15 -10.41 -1.75 24.93 1.33 30/06/2008 -53.65 -28.1 -0.36 HR Equity Emerging Mkts Far EastAIA India Opportunities -0.14 -10.08 -2.7 26.33 1.65 30/06/2008 -54.15 -27.28 NA HR Equity IndiaPruLink Asian Equity -0.16 -12.23 -3.08 26.54 1.55 31/12/2008 -55.31 -32.37 -4.69 HR Equity Asia Pacific Ex JapanAviva Emerging Countries Growth -0.17 -14.06 -4.06 27.77 2.89 31/12/2008 -58.05 -36.52 6.51 HR Equity Emerging Mkts GlobalAviva EU Convergence Growth -0.14 -11.78 5.97 27.86 3.04 31/12/2008 -60.35 -31.33 35.93 HR Equity Emerging Mkts EuropeManulife Golden Asia Growth -0.14 -11.66 4.73 29.41 1.75 30/09/2008 -59.37 -31.06 -12.36 HR Equity Asia Pacific Sm&Mid CapJohn Hancock Pacific Equity -0.14 -11.35 -2.37 29.56 1.85 30/09/2008 -59.24 -30.34 -2.07 HR Equity Asia Pacific Ex JapanAviva Legg Mason Asian Enterprise Trust (SP) -0.15 -12.77 3.95 29.56 2.59 31/12/2008 -59.97 -33.64 NA HR Equity Asia Pacific Sm&Mid CapUOB Life FOF UniFund -0.14 -12.37 -6.49 31.33 1.19 30/06/2008 -62.41 -32.7 -24.54 HR Equity Malaysia/SingaporeManulife India Equity -0.1 -9.27 -2.02 32.48 1.84 30/09/2008 -65.62 -25.32 NA HR Equity India(HSBC Insurance)HSBC-Link India Equity -0.1 -12.5 -4.76 39.32 1.91 30/09/2008 -70.11 -33 NA HR Equity India
Note 1: Sharpe Ratio is a measurement of a fund's annualized return that is in excess of the risk-free rate (a theoretical interest rate that would be returned on an investment that is completely free of risk) and adjusted for the fund's volatility. The calculation is as follows:(Fund Return – Risk-Free Return)/Fund Standard Deviation. From this formula, it can be derived that the higher a fund’s Sharpe ratio, the better its returns relative to the amount of investment risk it has taken.Note 2: Annualized Excess Return is a fund's excess return relative to its benchmark, on an annualised basis. Benchmarks are assigned by Lipper in accordance with the fund's stated investment mandate and Lipper Global Classifications and Methodology.Note 3: HR=Higher Risk, M-HR=Medium to High Risk, L-MR=Low to Medium Risk, LR=Lower Risk
LipperGlobalClassification
12/30/200512/31/2008AnnualisedMonthlyRisk (SGD %)
SharpeRatio1
(3 Year)
12/30/200512/31/2008AnnualisedMonthlyReturn (SGD %)
12/31/200712/31/20081-Year FundPerformance
CPFIS RiskClassification3
Singapore Insurance-Linked Product 12/30/200512/31/2008AnnualisedExcessReturn2
(SGD %)
12/31/200312/31/20085-Year FundPerformance
12/30/200512/31/20083-Year FundPerformance
Expense Ratio