Embed Size (px)
Citation preview
CRedcarbon reduction
1
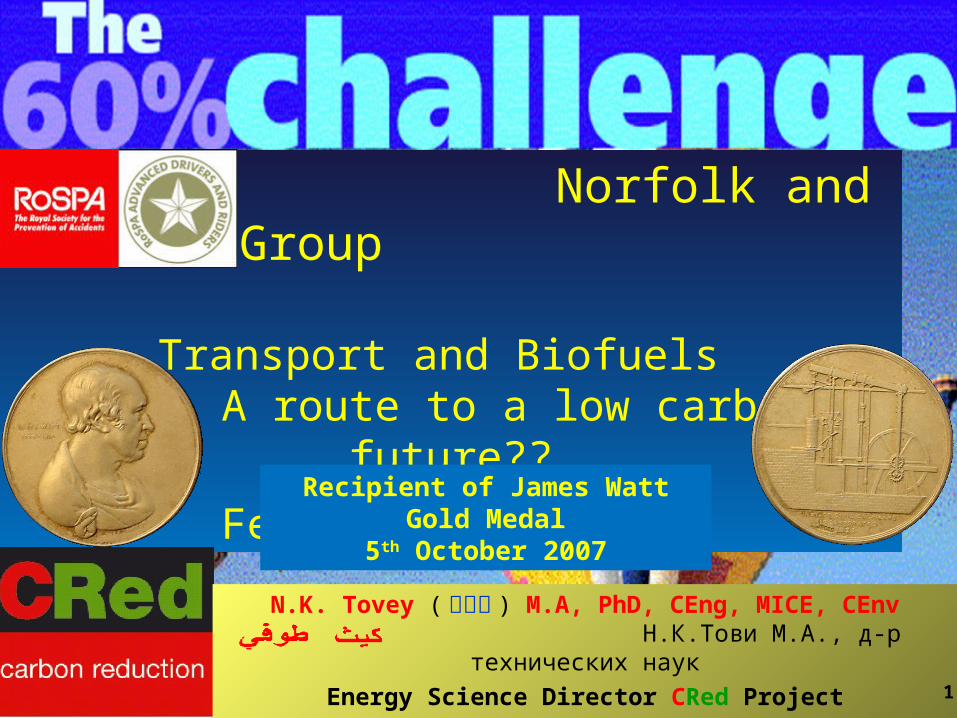
Norfolk and Norwich Group
Transport and Biofuels A route to a low carbon future??
February 27th 2008
N.K. Tovey ( 杜伟贤 ) M.A, PhD, CEng, MICE, CEnv Н.К.Тови М.А., д-р технических наук
Energy Science Director CRed Project
HSBC Director of Low Carbon Innovation
Recipient of James Watt Gold Medal
5th October 2007
1
CRedcarbon reduction
CRedcarbon reduction
2
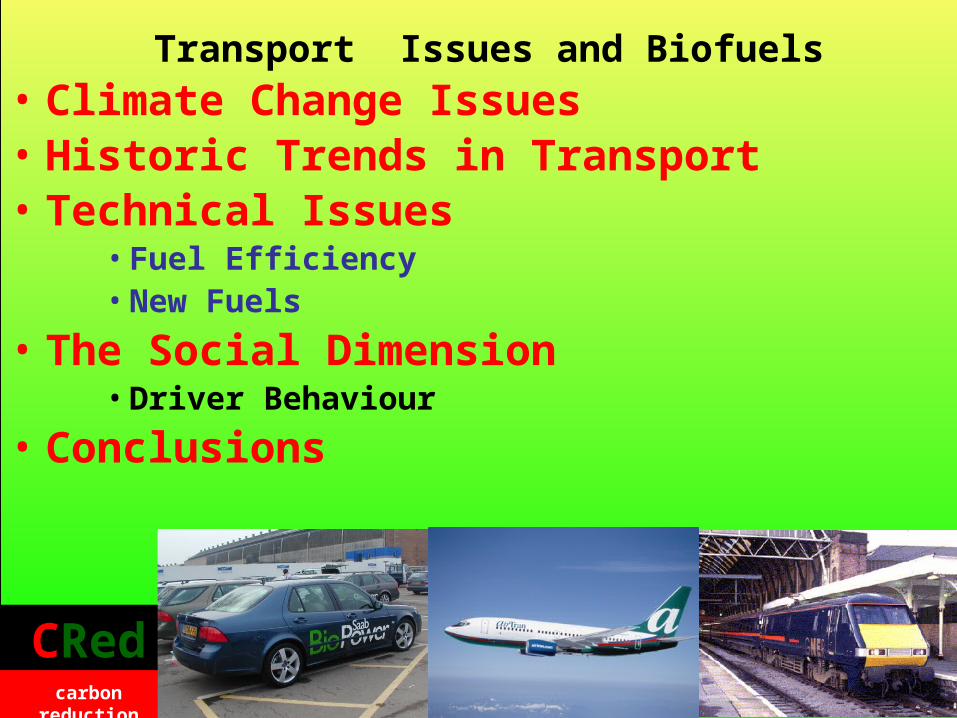
• Climate Change Issues• Historic Trends in Transport• Technical Issues
• Fuel Efficiency• New Fuels
• The Social Dimension• Driver Behaviour
• Conclusions
Transport Issues and Biofuels
CRedcarbon reduction
CRedcarbon reduction
33
Concentration of C02 in Atmosphere
300
310
320
330
340
350
360
370
380
1960 1965 1970 1975 1980 1985 1990 1995 2000
(ppm
)
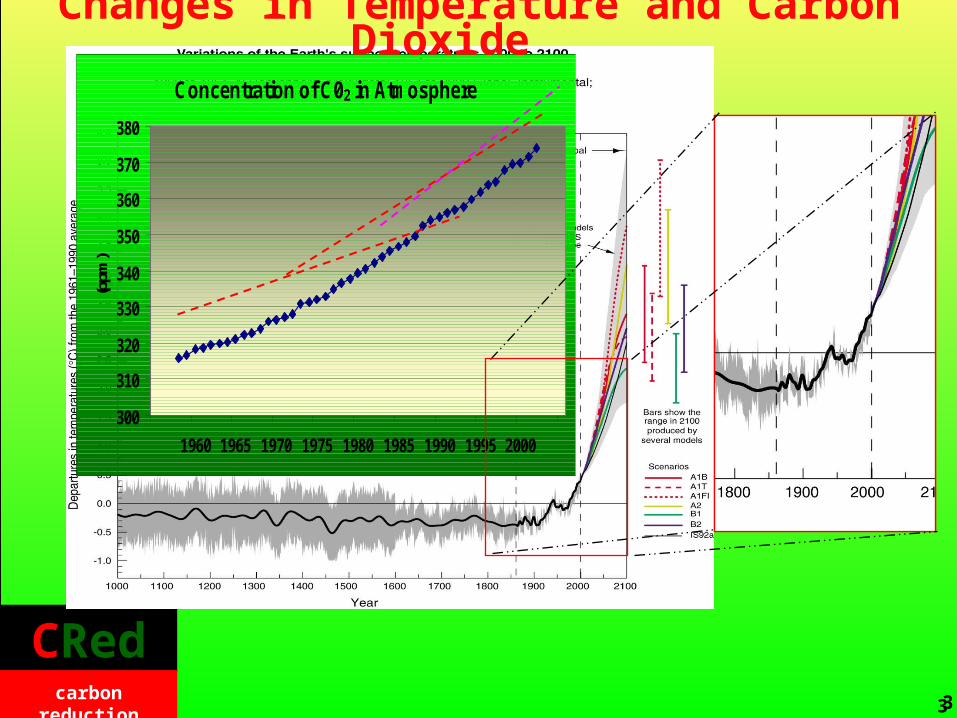
Changes in Temperature and Carbon Dioxide
3
CRedcarbon reduction
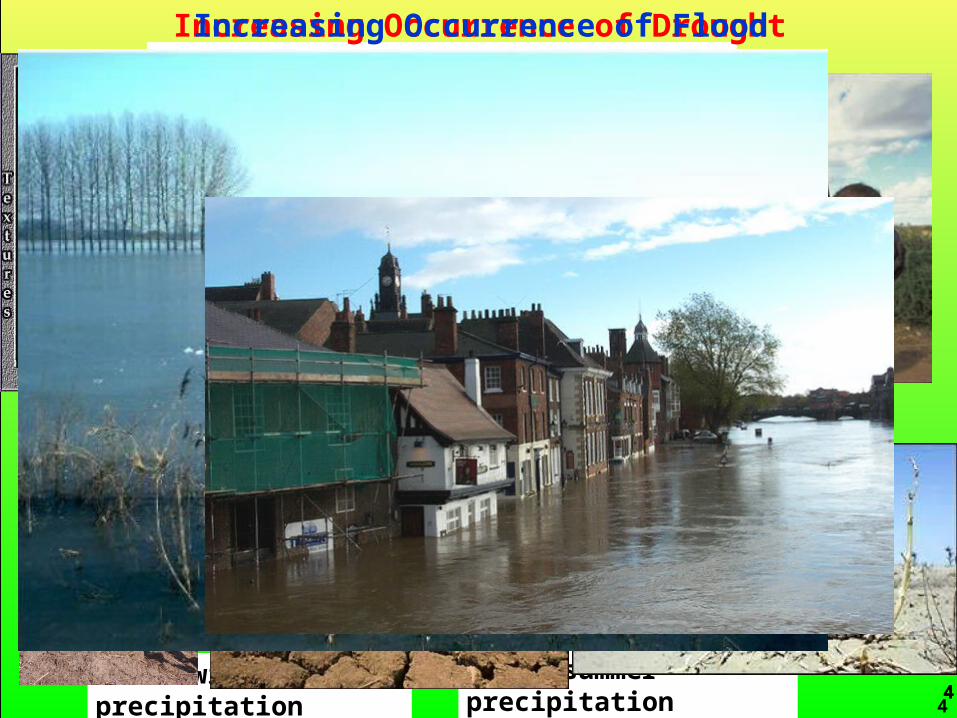
44Total winter precipitation Total summer precipitation
Source: Tim
Osborne, C
RU
Change in precipitation 1961-2001Increasing Occurrence of DroughtIncreasing Occurrence of Flood
4
CRedcarbon reduction 5
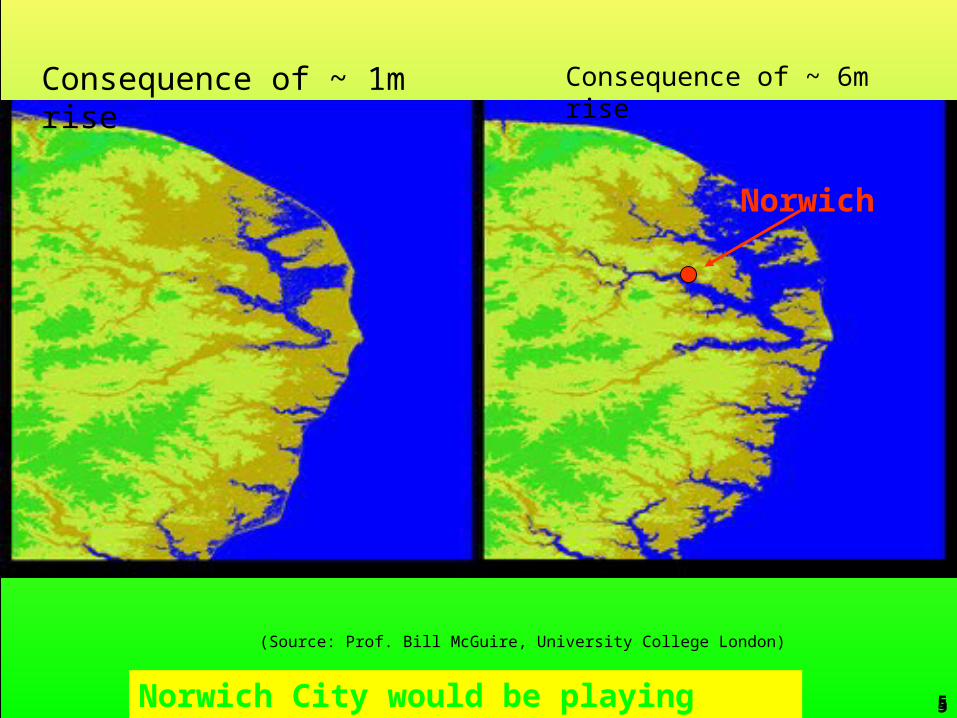
(Source: Prof. Bill McGuire, University College London)
Norwich
Consequence of ~ 1m rise Consequence of ~ 6m rise
Norwich City would be playing water polo! 5
CRedcarbon reduction
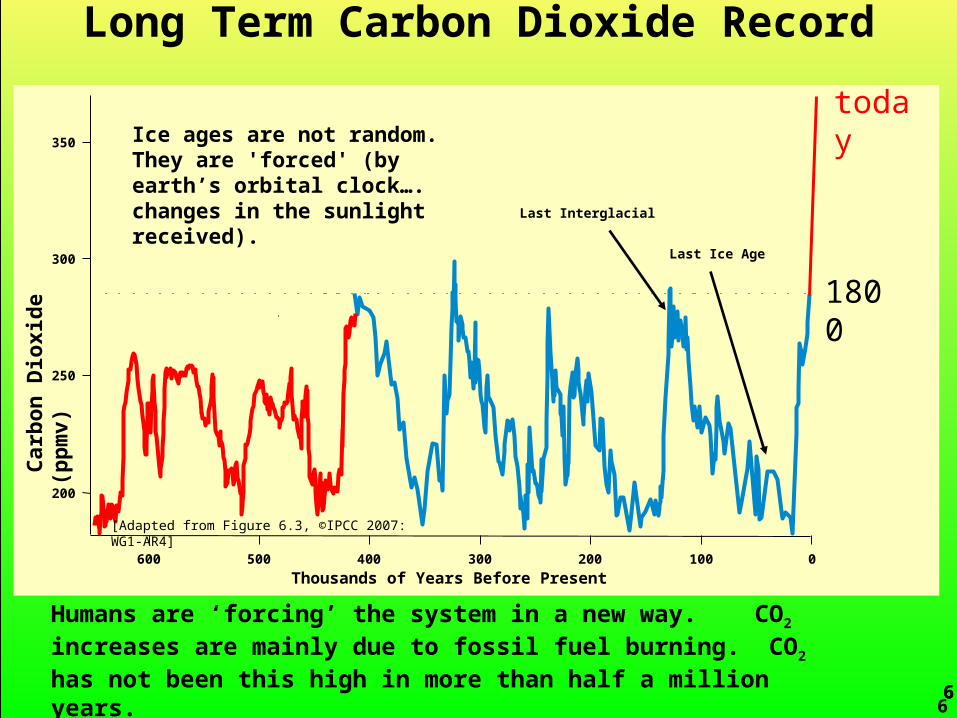
6
Last Ice Age
Humans are ‘forcing’ the system in a new way. CO2 increases are mainly due to fossil fuel burning. CO2 has not been this high in more than half a million years.
Last Interglacial
Ice ages are not random. They are 'forced' (by earth’s orbital clock…. changes in the sunlight received).
350
300
250
200
Car
bon
Dio
xid
e
(p
pm
v)
600 500 400 300 200 100 0
Thousands of Years Before Present
[Adapted from Figure 6.3, ©IPCC 2007: WG1-AR4]
1800
today
6
Long Term Carbon Dioxide Record
6
CRedcarbon reduction
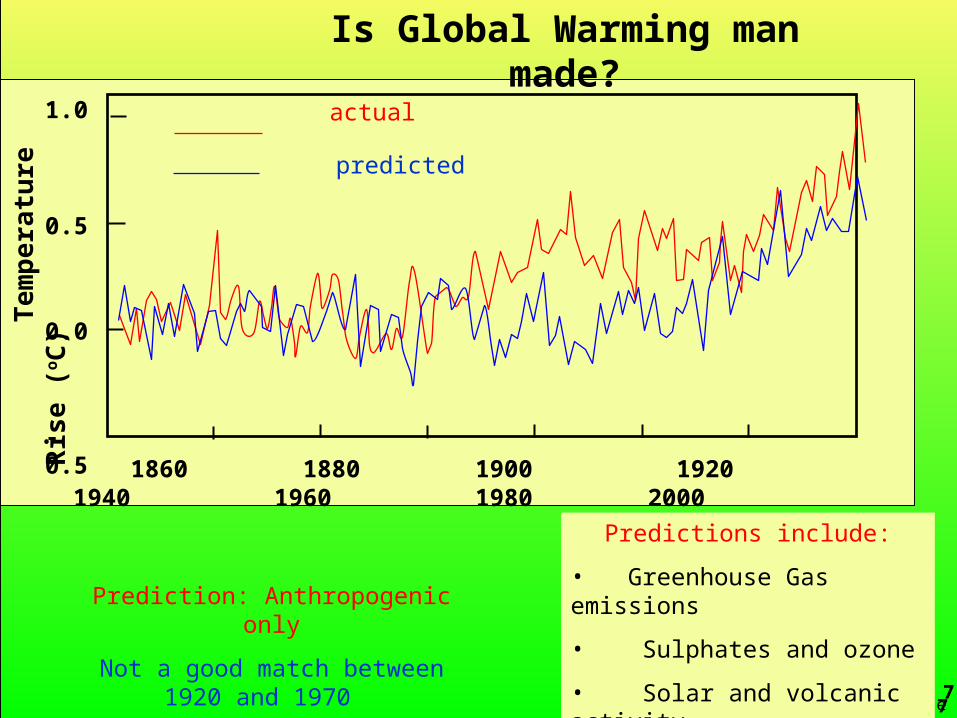
7Source: Hadley Centre, The Met.Office
1.0
0.5
0.0
-0.5 1860 1880 1900 1920 1940 1960 1980 2000
Tem
per
atu
re R
ise
(o C)
actual
predicted
Is Global Warming man made?
Prediction: Anthropogenic only
Not a good match between 1920 and 1970
Predictions include:
• Greenhouse Gas emissions
• Sulphates and ozone
• Solar and volcanic activity7
7
CRedcarbon reduction
8
Is Global Warming man made?
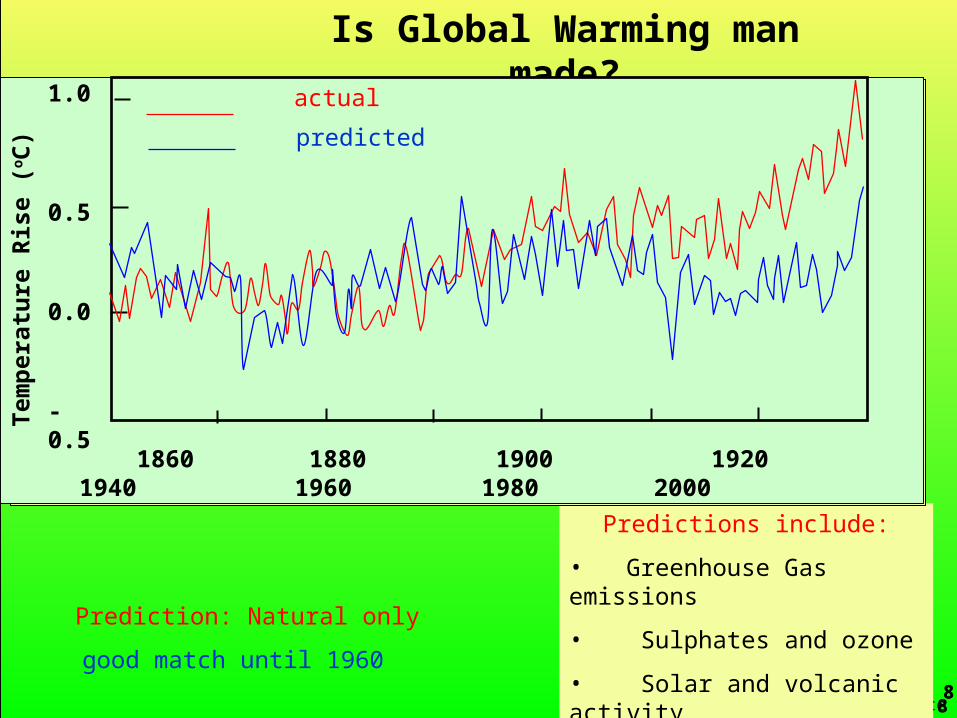
Source: Hadley Centre, The Met.Office
Prediction: Natural only
good match until 1960
Predictions include:
• Greenhouse Gas emissions
• Sulphates and ozone
• Solar and volcanic activity
1.0
0.5
0.0
-0.5
1860 1880 1900 1920 1940 1960 1980 2000Tem
per
atu
re R
ise
(o C)
1.0
0.5
0.0
-0.5
1860 1880 1900 1920 1940 1960 1980 2000
Tem
per
atur
e R
ise
(o C)
actual
predicted
88
CRedcarbon reduction
9
1.0
0.5
0.0
-0.5
1860 1880 1900 1920 1940 1960 1980 2000
Tem
per
atu
re R
ise
(o C)
actualpredicted
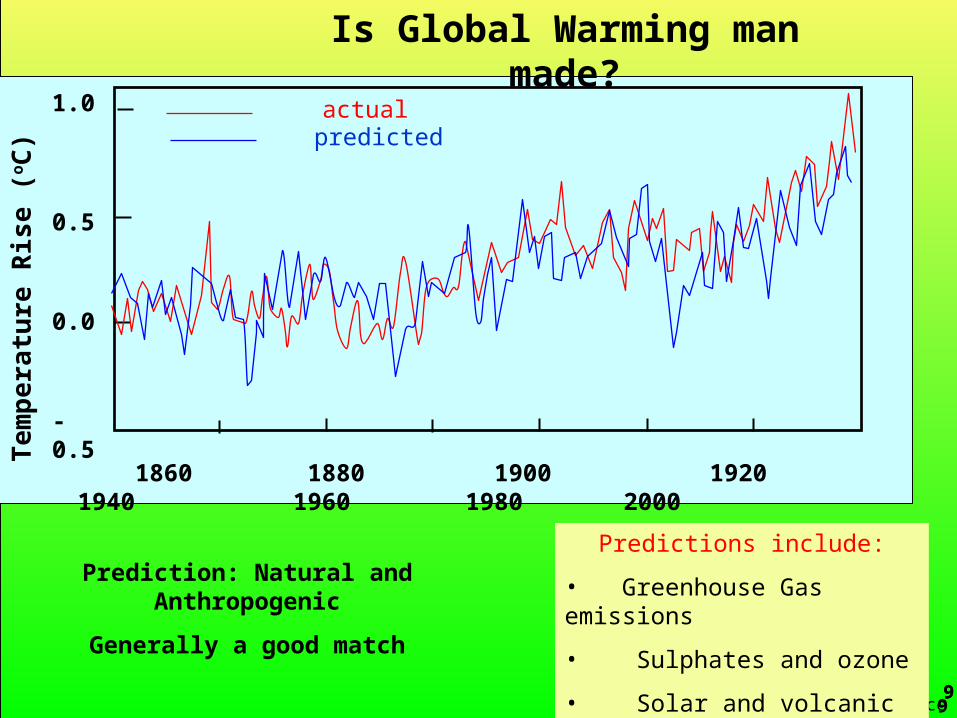
Source: Hadley Centre, The Met.Office
Prediction: Natural and Anthropogenic
Generally a good match
Predictions include:
• Greenhouse Gas emissions
• Sulphates and ozone
• Solar and volcanic activity
Is Global Warming man made?
99
CRedcarbon reduction 10
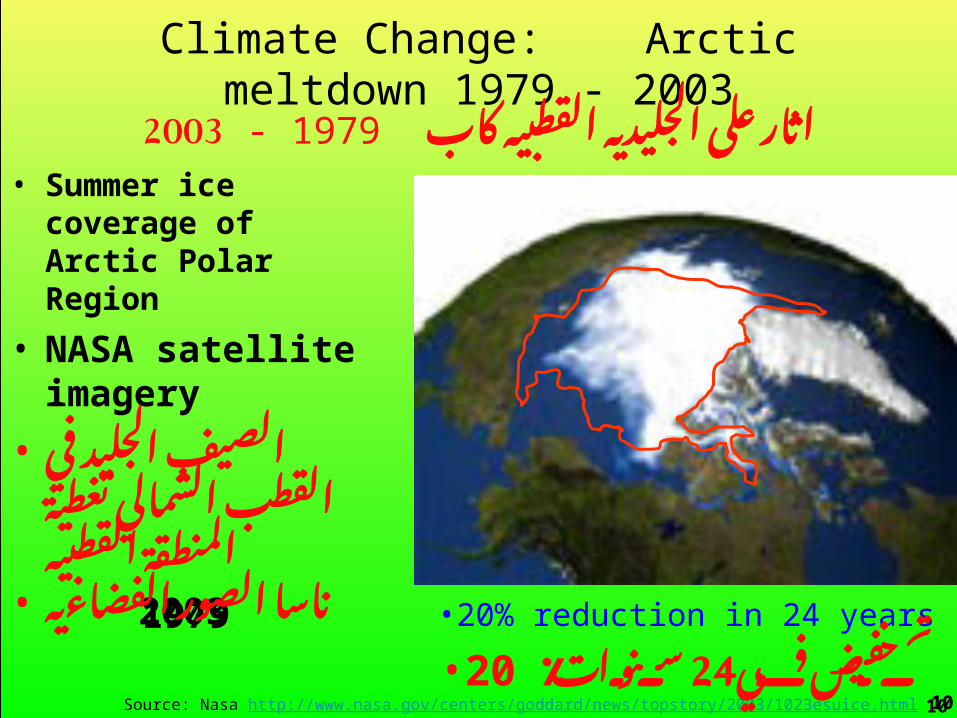
19792003
Climate Change: Arctic meltdown 1979 - 2003
10
• Summer ice coverage of Arctic Polar Region
• NASA satellite imagery
• الجليد الصيفالقطب في
تغطية الشماليالقطبيه المنطقة
• الصور ناساالفضاءيه
Source: Nasa http://www.nasa.gov/centers/goddard/news/topstory/2003/1023esuice.html
•20% reduction in 24 years
في ٪ 20• سنوات 24تخفيض
كاب القطبيه الجليديه على 2003 - 1979 اثار
10
CRedcarbon reduction
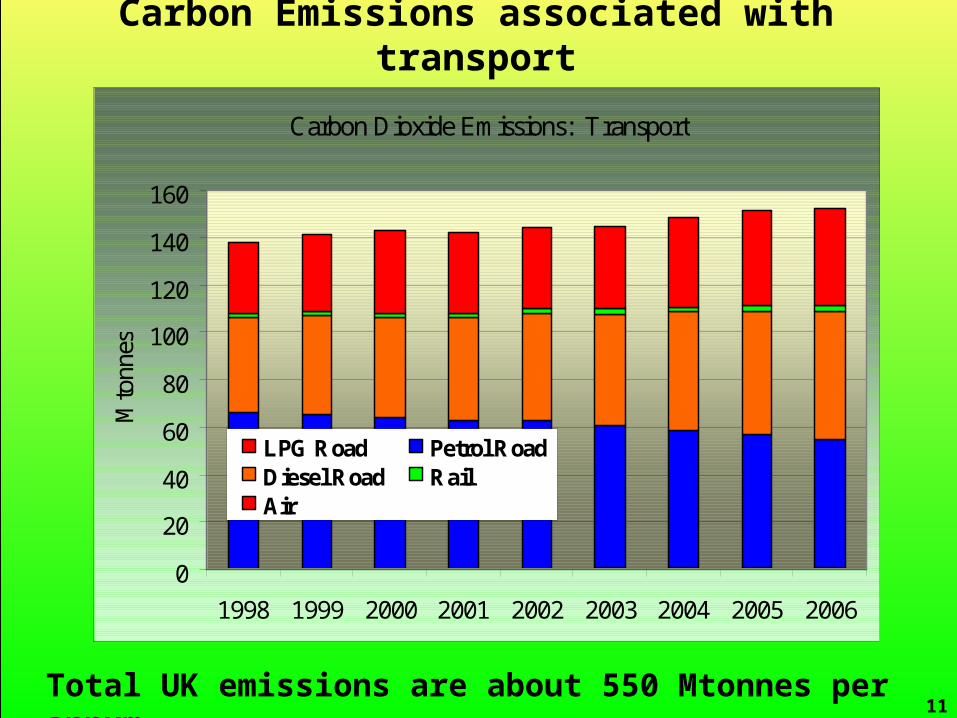
Carbon Emissions associated with transport
11
Carbon Dioxide Emissions: Transport
0
20
40
60
80
100
120
140
160
1998 1999 2000 2001 2002 2003 2004 2005 2006
Mto
nnes
LPG Road Petrol RoadDiesel Road RailAir
Total UK emissions are about 550 Mtonnes per annum
CRedcarbon reduction
CRedcarbon reduction
CRedcarbon reduction
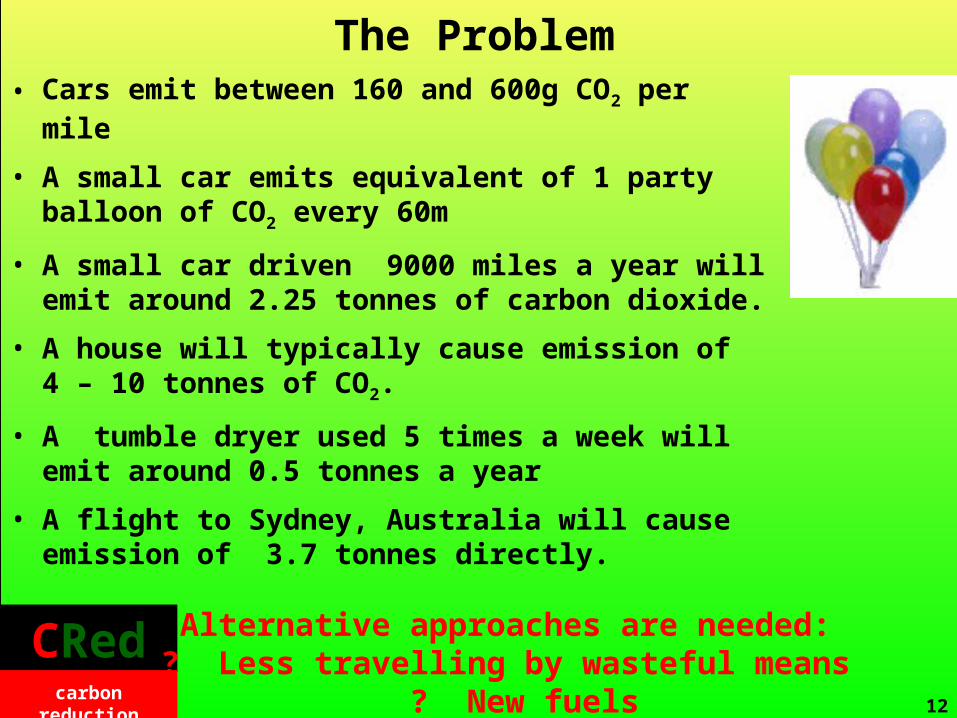
The Problem
12
• Cars emit between 160 and 600g CO2 per mile
• A small car emits equivalent of 1 party balloon of CO2 every 60m
• A small car driven 9000 miles a year will emit around 2.25 tonnes of carbon dioxide.
• A house will typically cause emission of 4 – 10 tonnes of CO2.
• A tumble dryer used 5 times a week will emit around 0.5 tonnes a year
• A flight to Sydney, Australia will cause emission of 3.7 tonnes directly.
Alternative approaches are needed:? Less travelling by wasteful means
? New fuels
CRedcarbon reduction
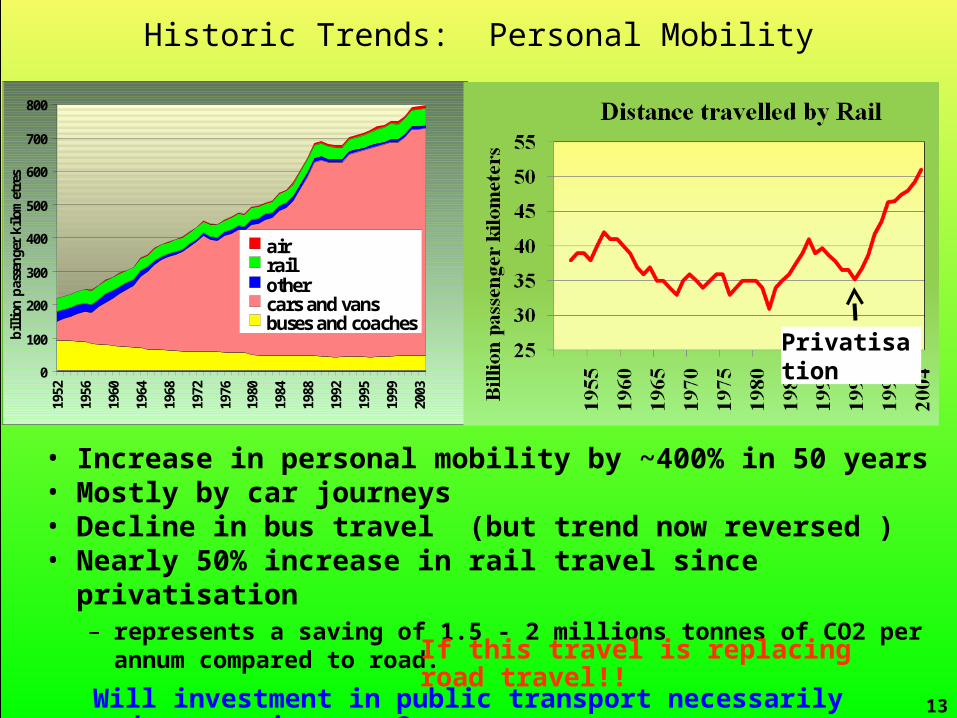
Historic Trends: Personal Mobility
13
• Increase in personal mobility by ~400% in 50 years• Mostly by car journeys• Decline in bus travel (but trend now reversed )• Nearly 50% increase in rail travel since privatisation
– represents a saving of 1.5 - 2 millions tonnes of CO2 per annum compared to road.
0
100
200
300
400
500
600
700
800
1952
1956
1960
1964
1968
1972
1976
1980
1984
1988
1992
1995
1999
2003
bil
lion
pas
sen
ger
kil
omet
res
airrailothercars and vansbuses and coaches
If this travel is replacing road travel!!
Will investment in public transport necessarily reduce car journeys?
Privatisation
CRedcarbon reduction
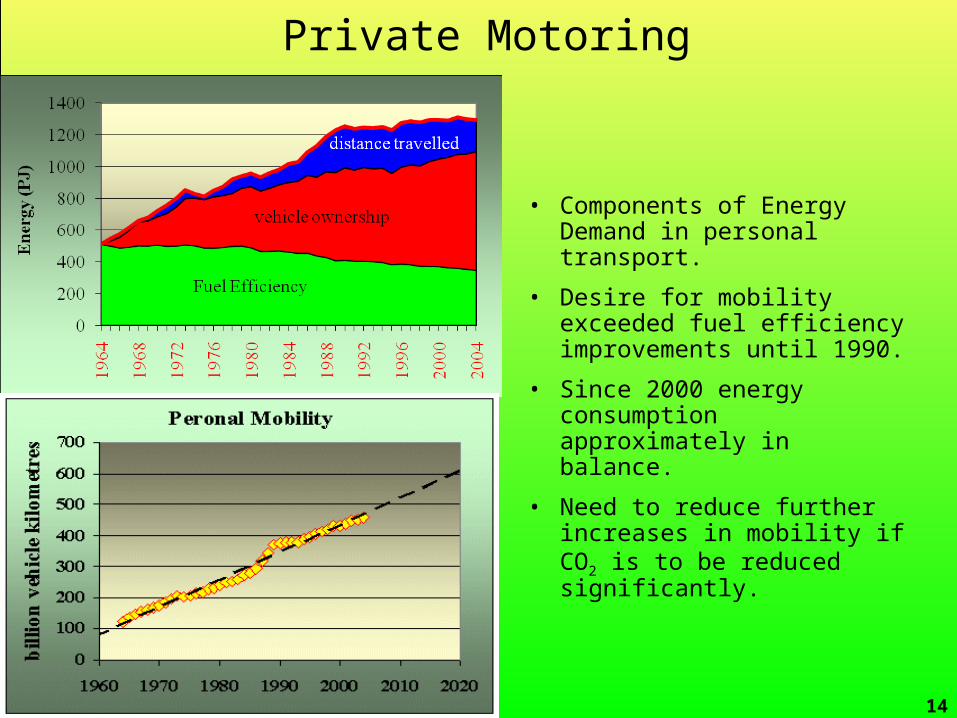
Private Motoring
14
• Components of Energy Demand in personal transport.
• Desire for mobility exceeded fuel efficiency improvements until 1990.
• Since 2000 energy consumption approximately in balance.
• Need to reduce further increases in mobility if CO2 is to be reduced significantly.
CRedcarbon reduction
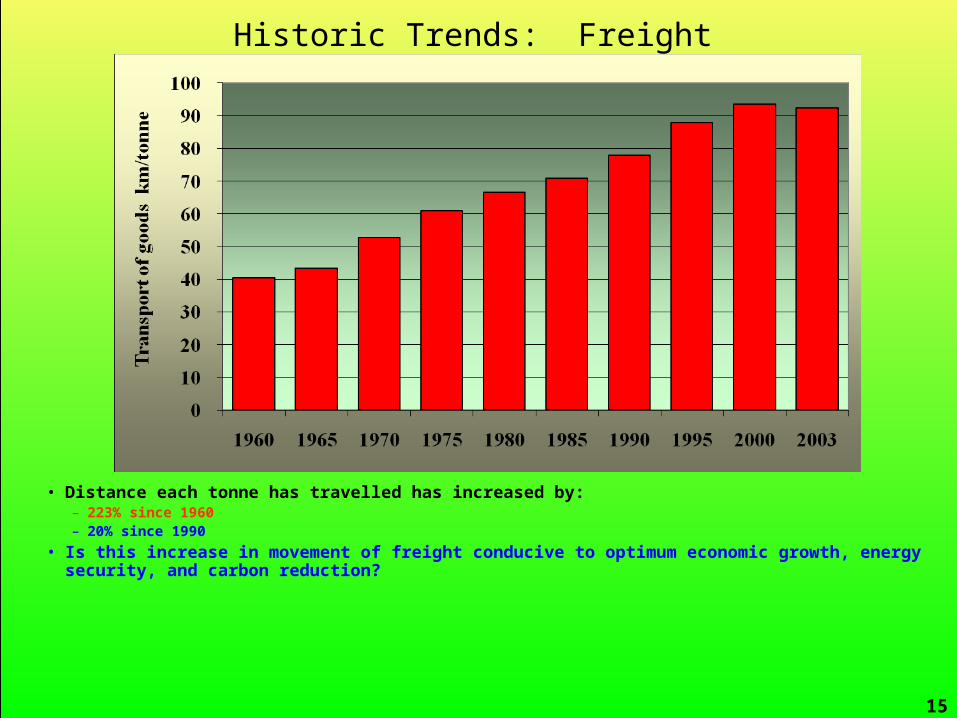
Historic Trends: Freight
15
• Distance each tonne has travelled has increased by:– 223% since 1960– 20% since 1990
• Is this increase in movement of freight conducive to optimum economic growth, energy security, and carbon reduction?
CRedcarbon reduction 16
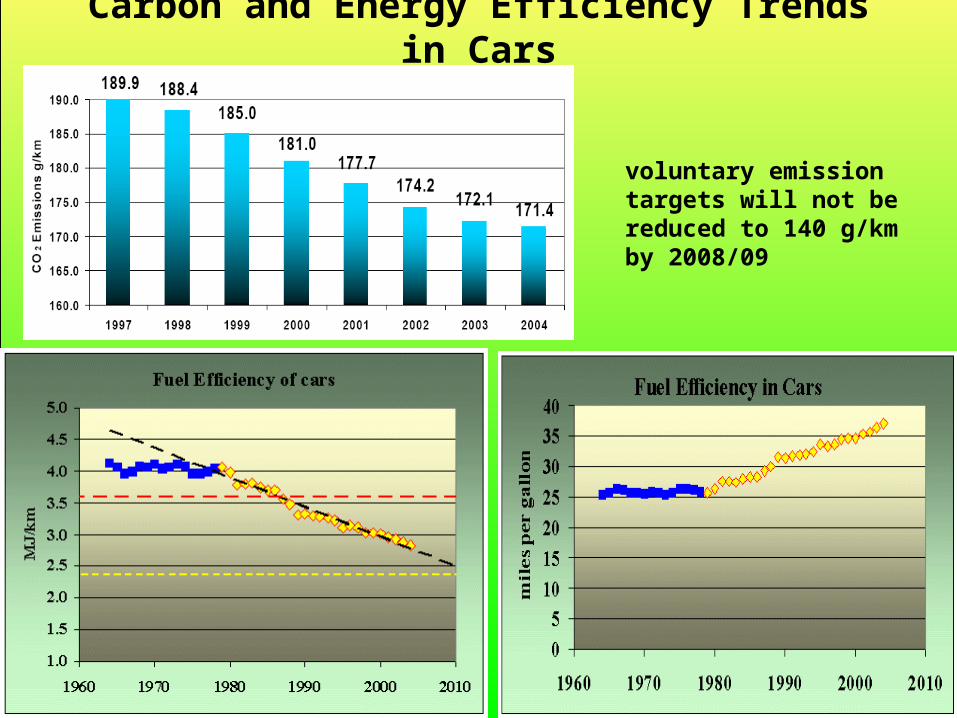
Carbon and Energy Efficiency Trends in Cars
voluntary emission targets will not be reduced to 140 g/km by 2008/09
CRedcarbon reduction 17
Data from Transport Statistics 2005. Table 2005.
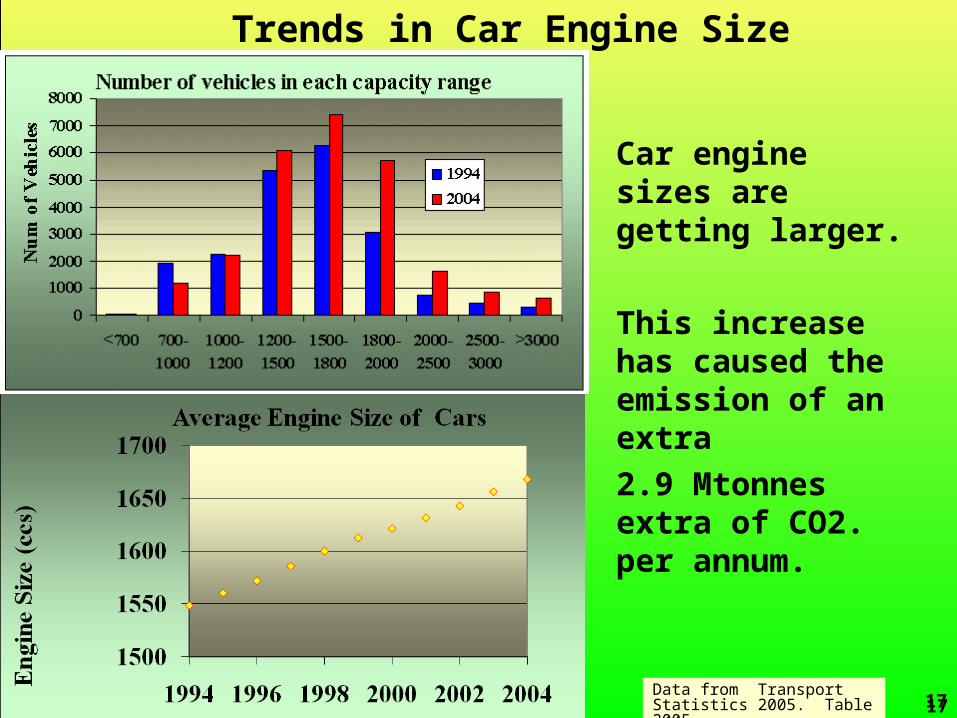
Trends in Car Engine Size
Car engine sizes are getting larger.
This increase has caused the emission of an extra
2.9 Mtonnes extra of CO2. per annum.
17
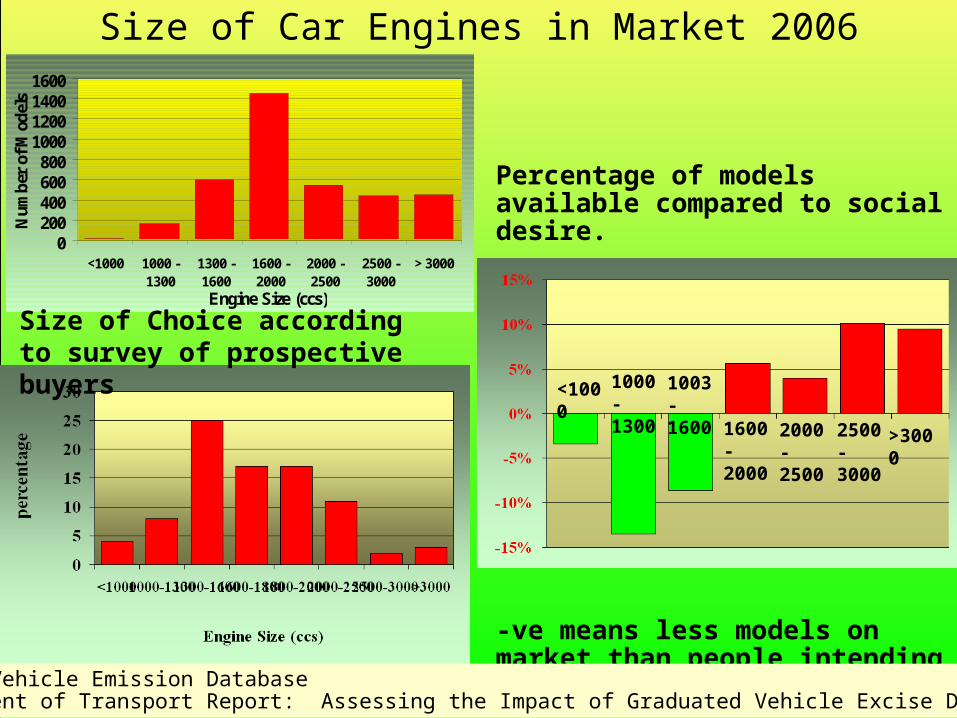
CRedcarbon reduction 18
Percentage of models available compared to social desire.
-ve means less models on market than people intending to buy.
Size of Car Engines in Market 2006
0200400600800
1000120014001600
<1000 1000 -1300
1300 -1600
1600 -2000
2000 -2500
2500 -3000
> 3000
Engine Size (ccs)
Nu
mb
er o
f M
odel
s
Size of Choice according to survey of prospective buyers
Data: Vehicle Emission DatabaseDepartment of Transport Report: Assessing the Impact of Graduated Vehicle Excise Duty”
<1000 1000 - 1300
1003 - 1600
1600 - 2000
2000 - 2500
2500 - 3000
>3000
CRedcarbon reduction 19
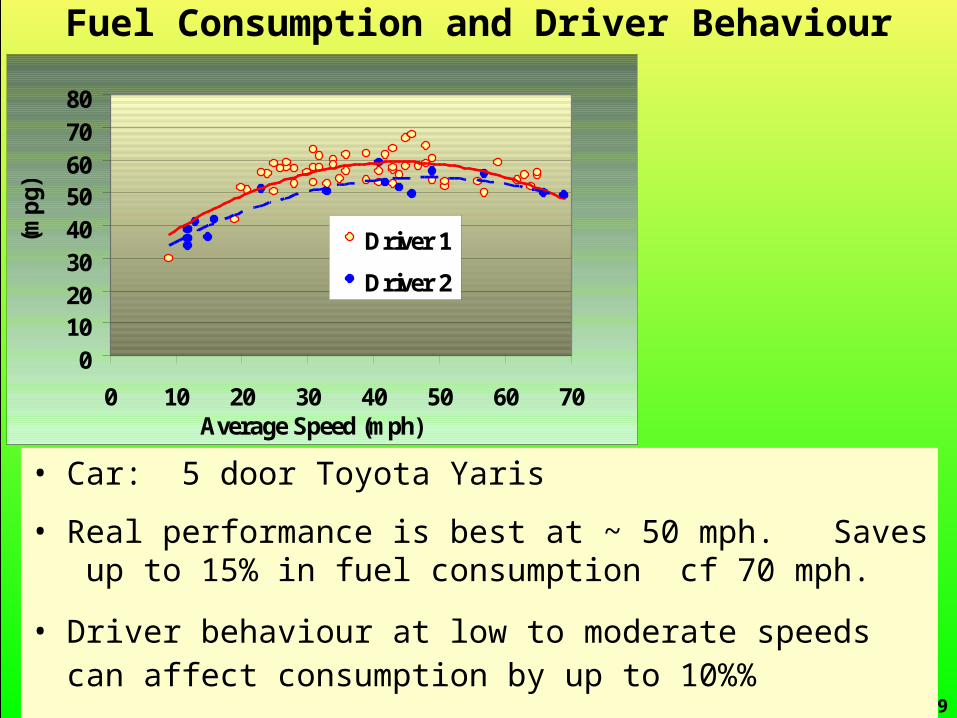
Fuel Consumption and Driver Behaviour
• Car: 5 door Toyota Yaris
• Real performance is best at ~ 50 mph. Saves up to 15% in fuel consumption cf 70 mph.
• Driver behaviour at low to moderate speeds can affect consumption by up to 10%%
01020304050607080
0 10 20 30 40 50 60 70Average Speed (mph)
(m
pg)
Driver 1
Driver 2
CRedcarbon reduction
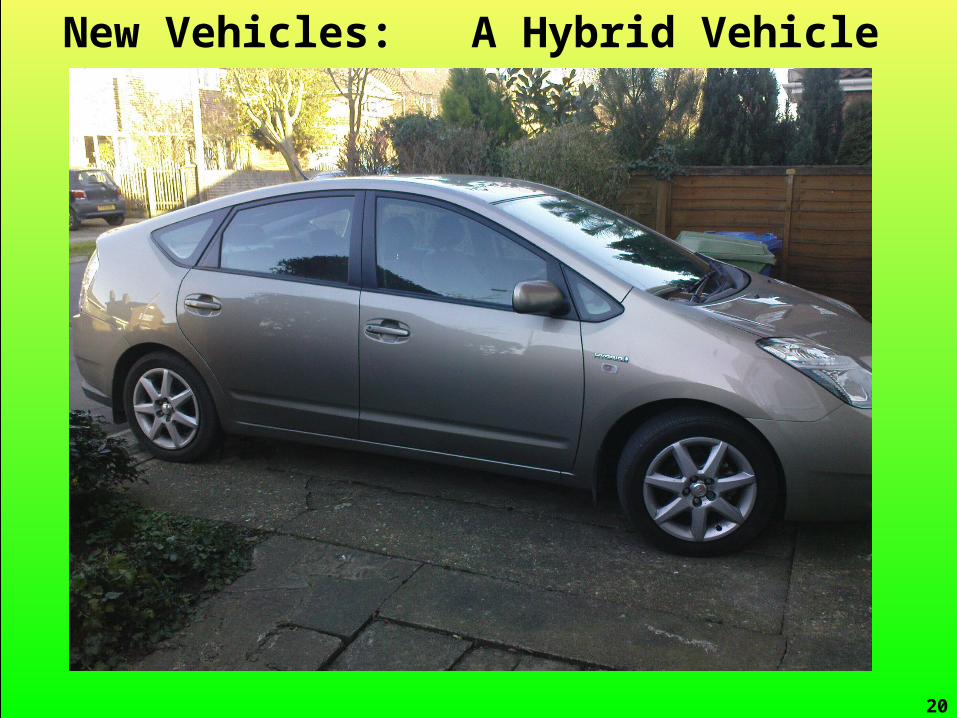
New Vehicles: A Hybrid Vehicle
20
CRedcarbon reduction 21
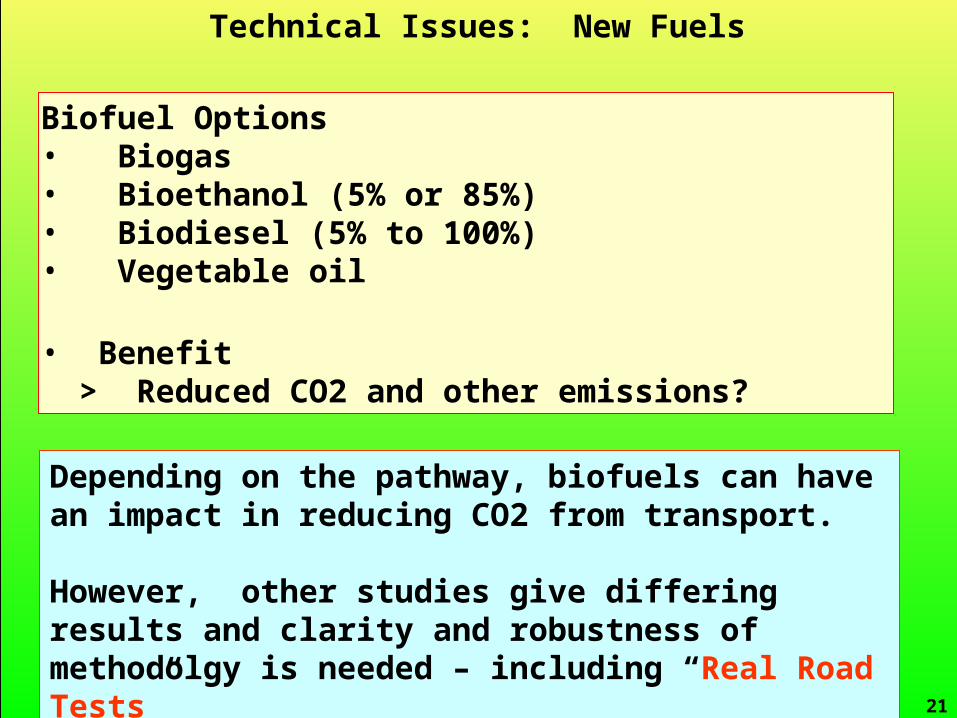
Depending on the pathway, biofuels can have an impact in reducing CO2 from transport.
However, other studies give differing results and clarity and robustness of methodolgy is needed – including “Real Road Tests”
Biofuel Options• Biogas• Bioethanol (5% or 85%)• Biodiesel (5% to 100%)• Vegetable oil
• Benefit > Reduced CO2 and other emissions?
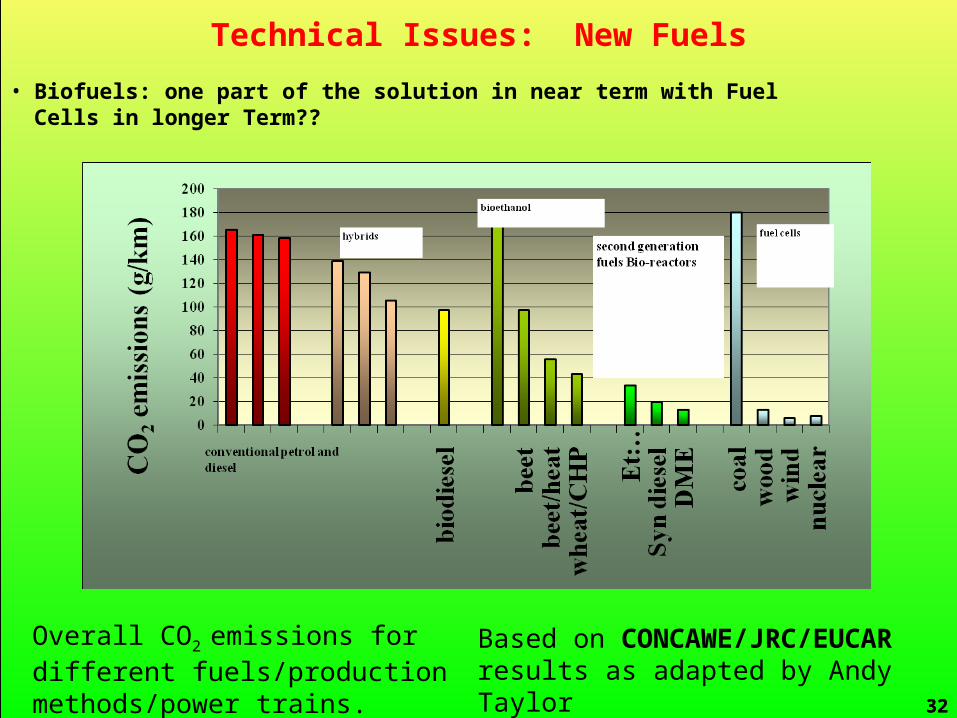
Technical Issues: New Fuels
CRedcarbon reduction
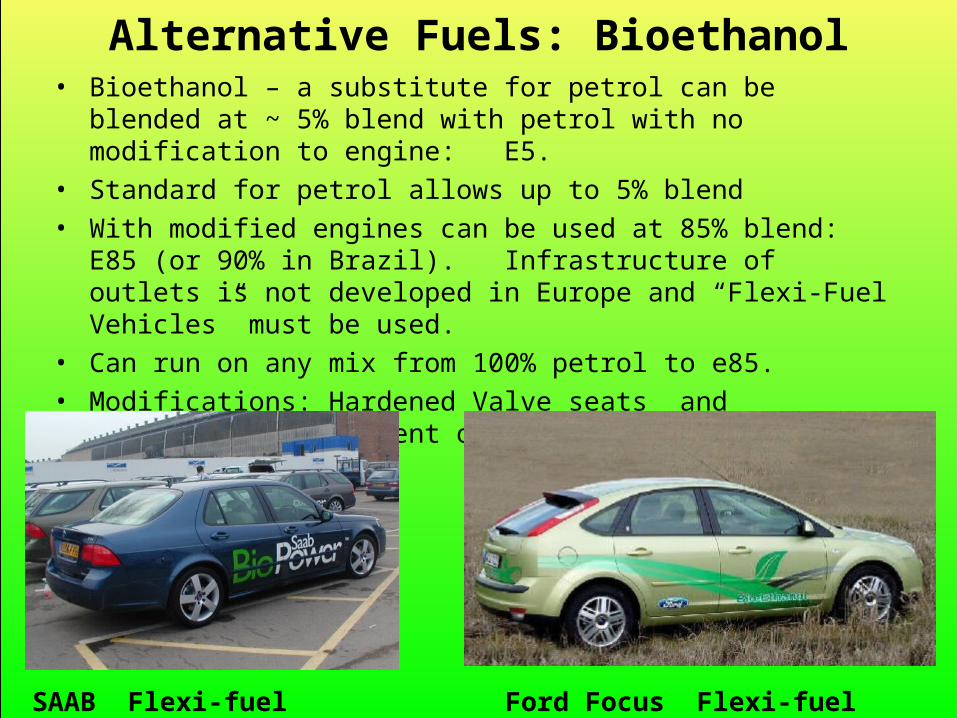
Alternative Fuels: Bioethanol• Bioethanol – a substitute for petrol can be blended at ~ 5% blend
with petrol with no modification to engine: E5. • Standard for petrol allows up to 5% blend• With modified engines can be used at 85% blend: E85 (or 90% in
Brazil). Infrastructure of outlets is not developed in Europe and “Flexi-Fuel Vehicles” must be used.
• Can run on any mix from 100% petrol to e85.• Modifications: Hardened Valve seats and intelligent adjustment of
timing depending on fuel mix in car
Ford Focus Flexi-fuelSAAB Flexi-fuel
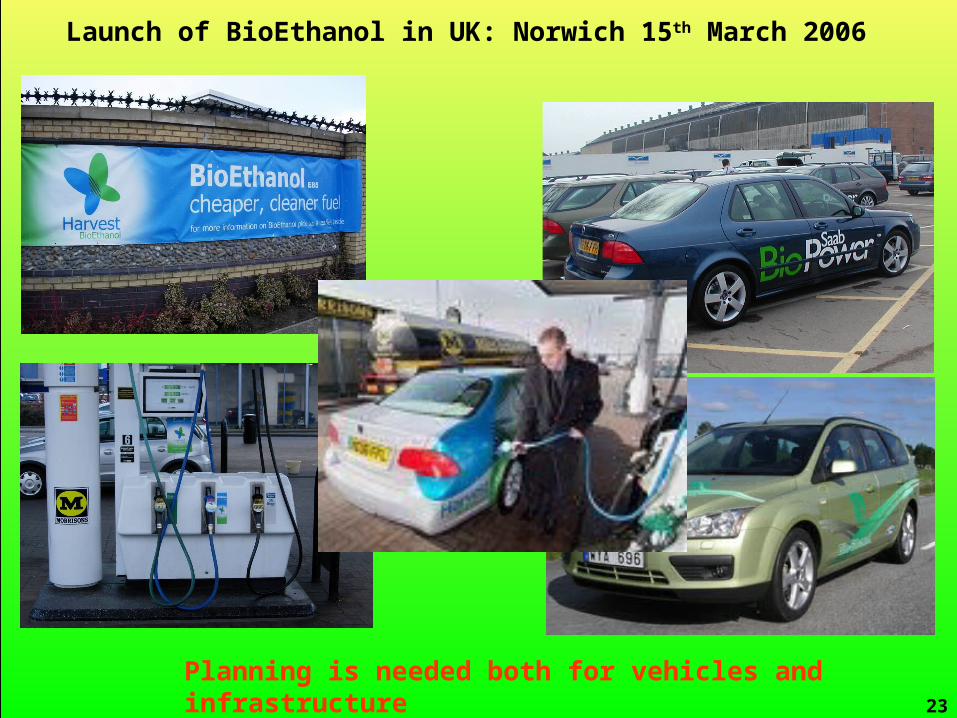
CRedcarbon reduction 23
Launch of BioEthanol in UK: Norwich 15th March 2006
Planning is needed both for vehicles and infrastructure
CRedcarbon reduction
CRedcarbon reduction
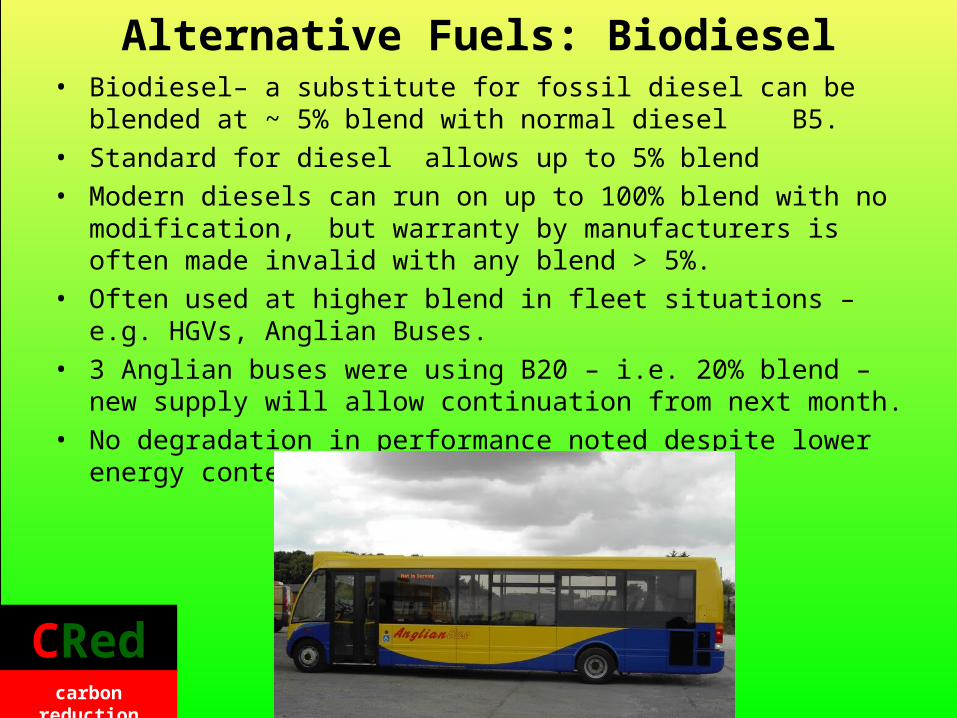
Alternative Fuels: Biodiesel• Biodiesel– a substitute for fossil diesel can be blended at ~ 5% blend
with normal diesel B5. • Standard for diesel allows up to 5% blend• Modern diesels can run on up to 100% blend with no modification, but
warranty by manufacturers is often made invalid with any blend > 5%.• Often used at higher blend in fleet situations – e.g. HGVs, Anglian
Buses. • 3 Anglian buses were using B20 – i.e. 20% blend – new supply will
allow continuation from next month.• No degradation in performance noted despite lower energy content.
CRedcarbon reduction
CRedcarbon reduction
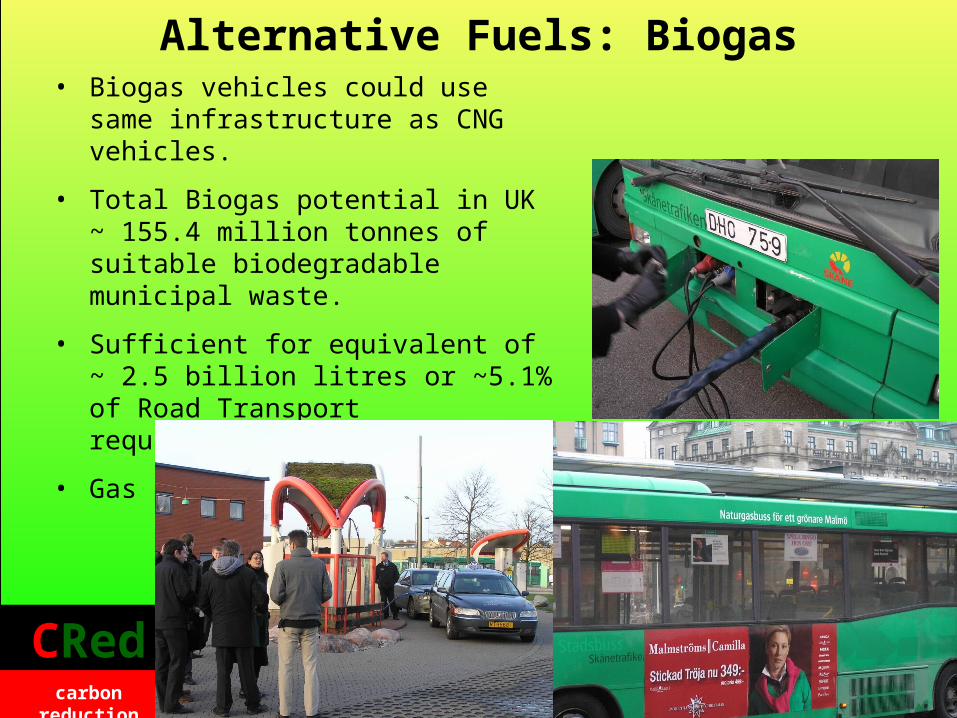
Alternative Fuels: Biogas• Biogas vehicles could use same
infrastructure as CNG vehicles.
• Total Biogas potential in UK ~ 155.4 million tonnes of suitable biodegradable municipal waste.
• Sufficient for equivalent of ~ 2.5 billion litres or ~5.1% of Road Transport requirements
• Gas powered vehicles in Malmo
CRedcarbon reduction
CRedcarbon reduction
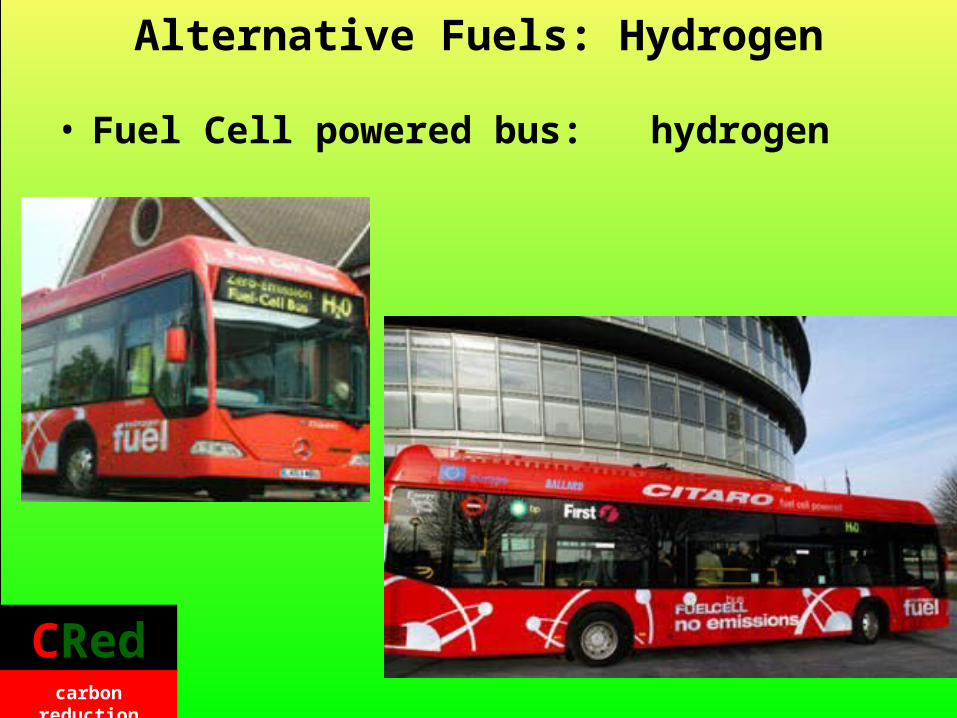
• Fuel Cell powered bus: hydrogen
Alternative Fuels: Hydrogen
CRedcarbon reduction
CRedcarbon reduction
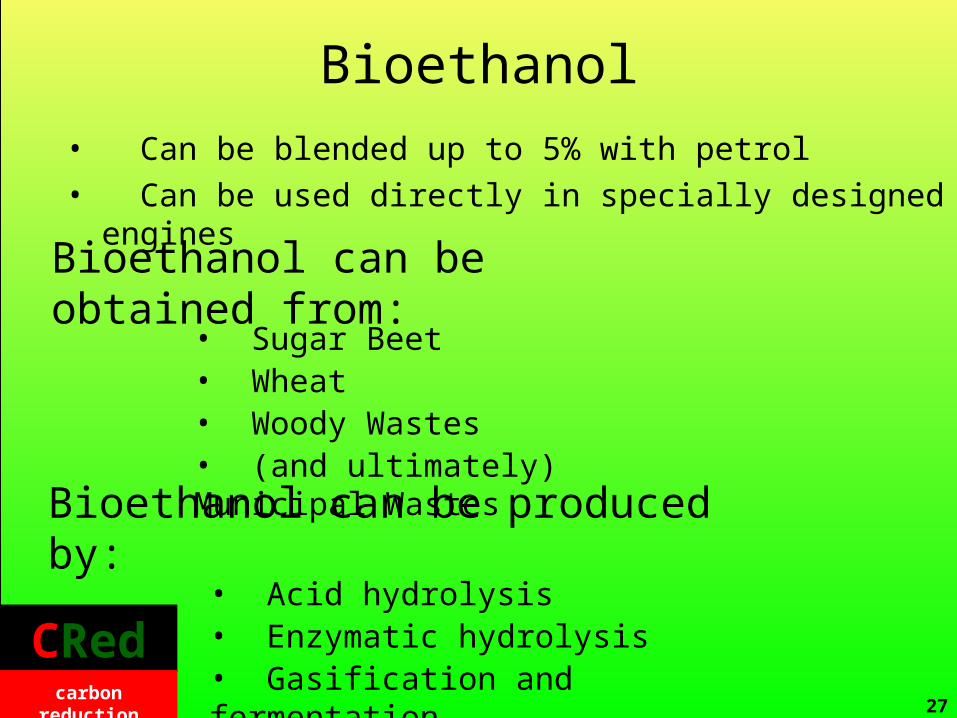
Bioethanol
27
• Can be blended up to 5% with petrol• Can be used directly in specially designed engines
CRedcarbon reduction
• Sugar Beet• Wheat• Woody Wastes• (and ultimately) Municipal Wastes
Bioethanol can be obtained from:
Bioethanol can be produced by:
• Acid hydrolysis• Enzymatic hydrolysis• Gasification and fermentation
CRedcarbon reduction
CRedcarbon reduction
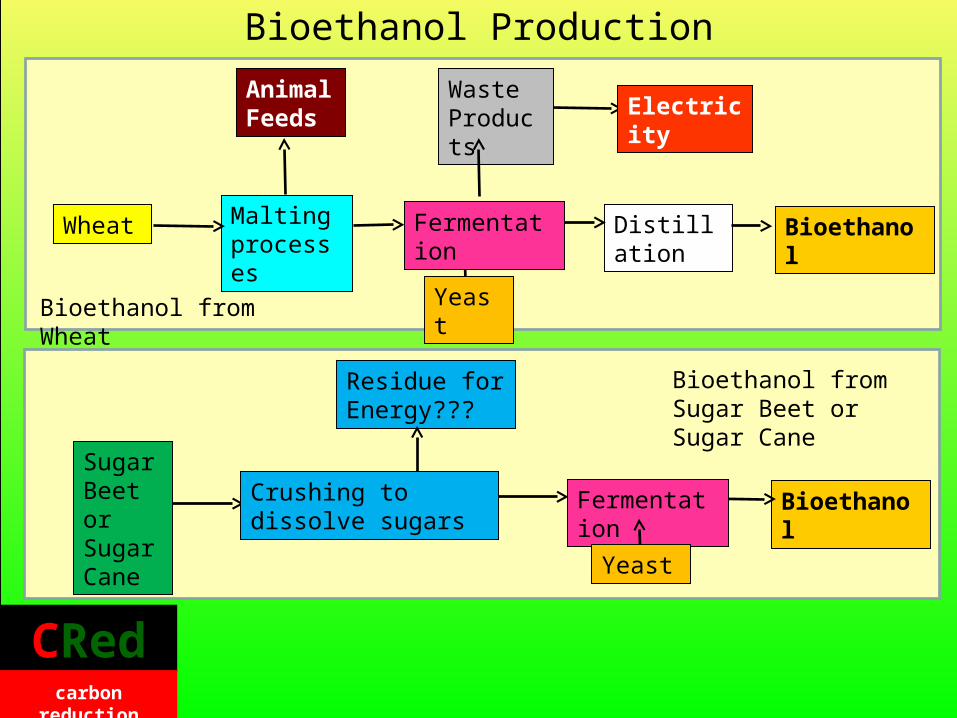
Bioethanol from Sugar Beet or Sugar Cane
Bioethanol from Wheat
Bioethanol Production
Wheat
Sugar Beet or Sugar Cane
Malting processes
Animal Feeds
Waste Products Electricity
BioethanolFermentation
Yeast
Residue for Energy???
Crushing to dissolve sugars
Distillation Bioethanol
Yeast
Fermentation
CRedcarbon reduction
CRedcarbon reduction
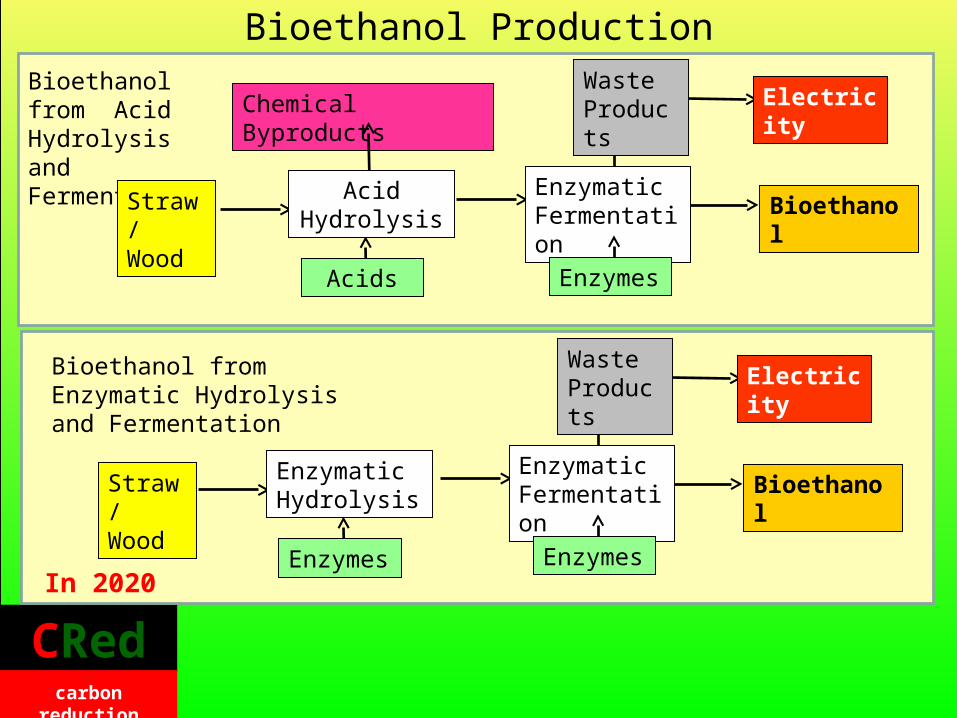
Bioethanol from Enzymatic Hydrolysis and Fermentation
Bioethanol from Acid Hydrolysis and Fermentation
ElectricityWaste Products
Straw/ Wood
BioethanolEnzymatic Hydrolysis
Enzymes
Enzymatic Fermentation
Enzymes
Bioethanol Production
ElectricityWaste Products
BioethanolEnzymatic Fermentation
Enzymes
Straw/ Wood
Chemical Byproducts
Acids
AcidHydrolysis
In 2020
CRedcarbon reduction
CRedcarbon reduction
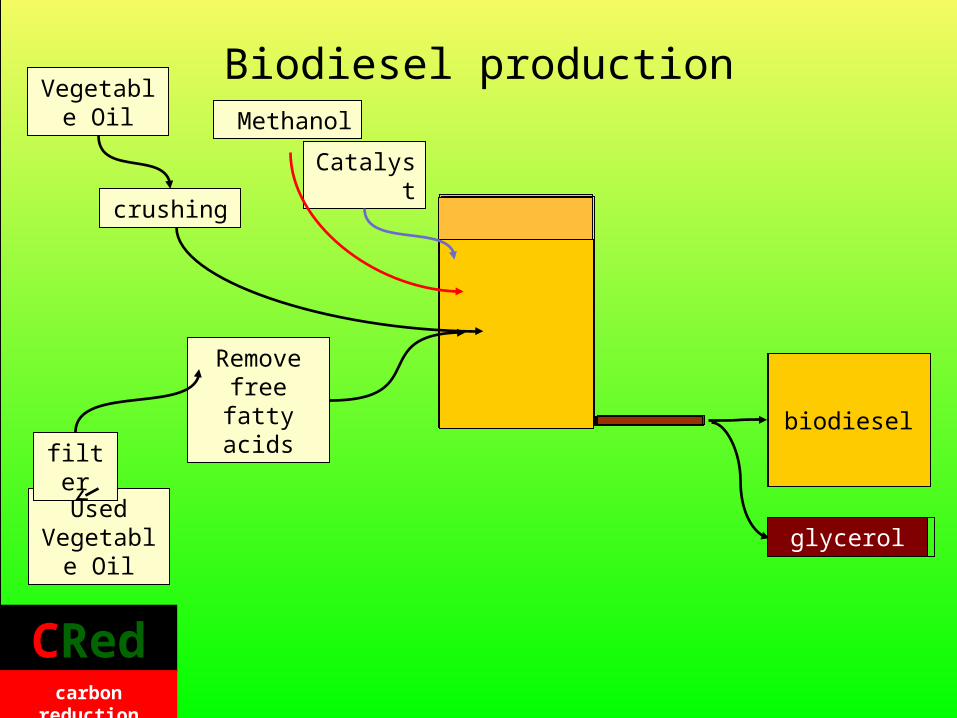
Biodiesel production
biodiesel
Vegetable Oil Methanol
Catalyst
crushing
Used Vegetable
Oil
filter
Remove free fatty
acids
glycerol
CRedcarbon reduction
CRedcarbon reduction
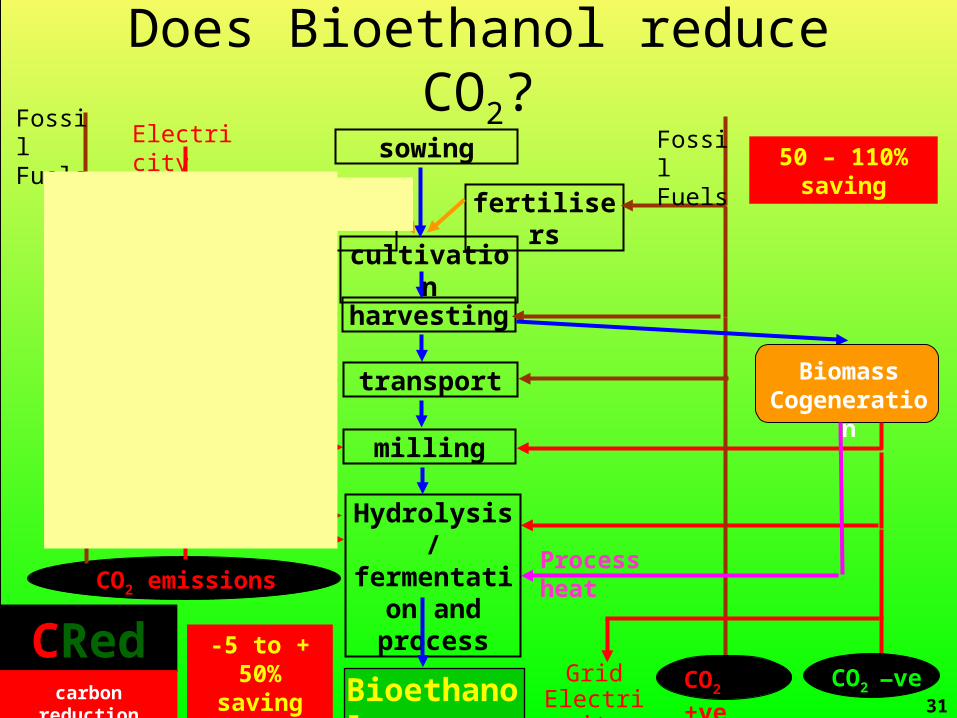
Does Bioethanol reduce CO2?
CRedcarbon reduction
CO2 emissions
transport
milling
Hydrolysis / fermentation and process
harvesting
sowing
cultivation
fertilisers
Bioethanol
Fossil Fuels Electricity
fertilisers
Fossil Fuels
Biomass Cogeneration
CO2 +ve CO2 ve Grid
Electricity
Process heat
-5 to + 50% saving
50 – 110% saving
31
CRedcarbon reduction 32
Technical Issues: New Fuels
32
• Biofuels: one part of the solution in near term with Fuel Cells in longer Term??
Overall CO2 emissions for different fuels/production methods/power trains.
Based on CONCAWE/JRC/EUCAR results as adapted by Andy Taylor
CRedcarbon reduction
CRedcarbon reduction
CRedcarbon reduction
The Problem
33
• New Fuels such as biofuels are a possible solution, but only if exploited sustainably.• What area of land is needed to supply fuel for road transport needs?• In 2006 we needed 49.035 billion litres of road transport fuel• If provided solely by biofuels that would require and area of 200 000 – 240 000 sq km.
• The area of the UK is 225 000 sq km
• Biofuels could perhaps provide up to 5 - 10% but no more. Some coming from used cooking oil
CRedcarbon reduction
CRedcarbon reduction
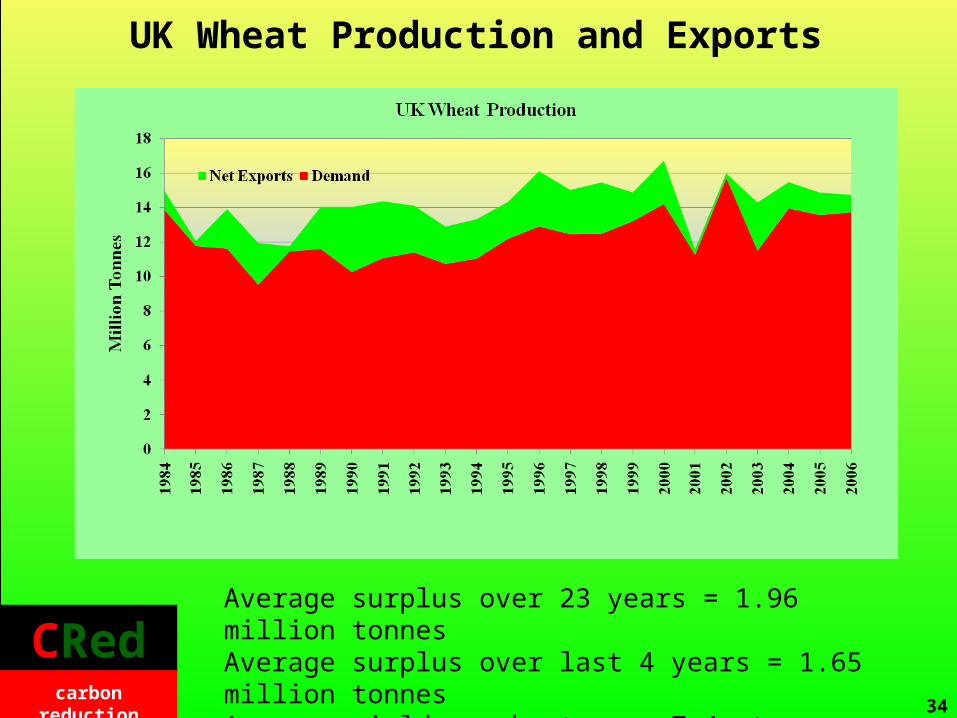
UK Wheat Production and Exports
34
Average surplus over 23 years = 1.96 million tonnesAverage surplus over last 4 years = 1.65 million tonnesAverage yield per hectare = 7.4 tonnes
CRedcarbon reduction
CRedcarbon reduction
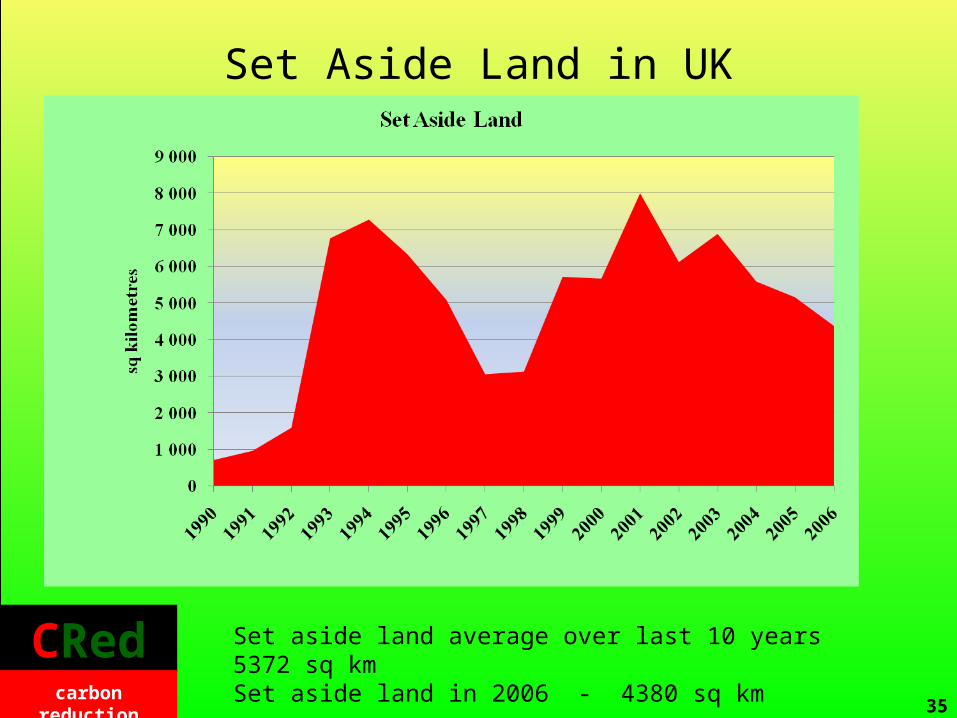
Set Aside Land in UK
35
Set aside land average over last 10 years 5372 sq kmSet aside land in 2006 - 4380 sq km
CRedcarbon reduction
CRedcarbon reduction
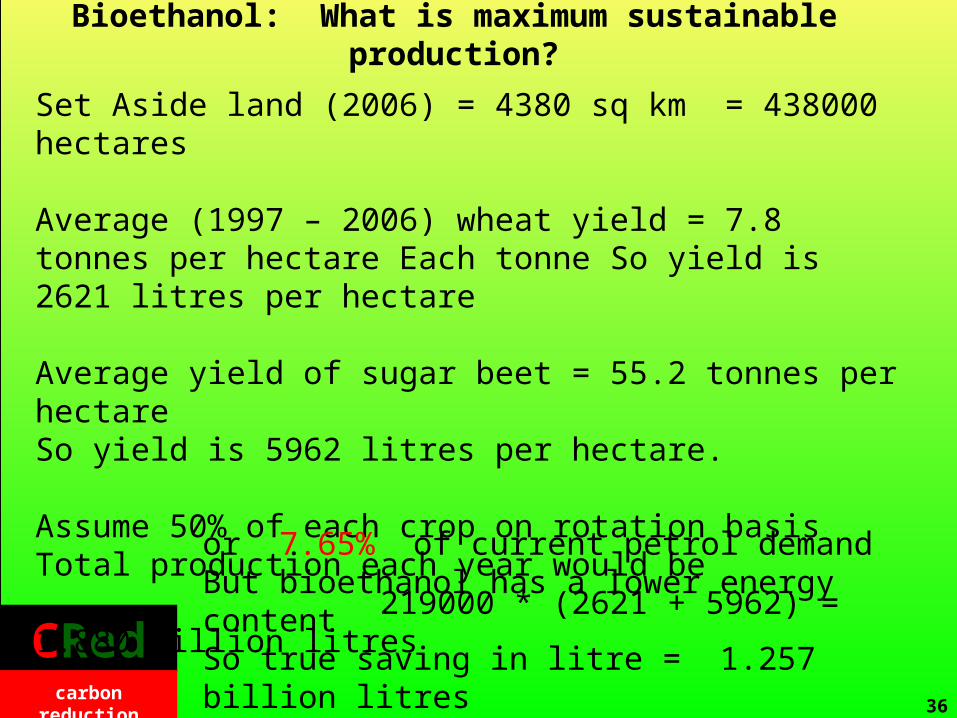
Bioethanol: What is maximum sustainable production?
36
Set Aside land (2006) = 4380 sq km = 438000 hectares
Average (1997 – 2006) wheat yield = 7.8 tonnes per hectare Each tonne So yield is 2621 litres per hectare
Average yield of sugar beet = 55.2 tonnes per hectareSo yield is 5962 litres per hectare.
Assume 50% of each crop on rotation basisTotal production each year would be 219000 * (2621 + 5962) = 1.880 billion litres
or 7.65% of current petrol demandBut bioethanol has a lower energy contentSo true saving in litre = 1.257 billion litresor 5.11% by energy content
CRedcarbon reduction
CRedcarbon reduction
Biodiesel: What is maximum sustainable production?
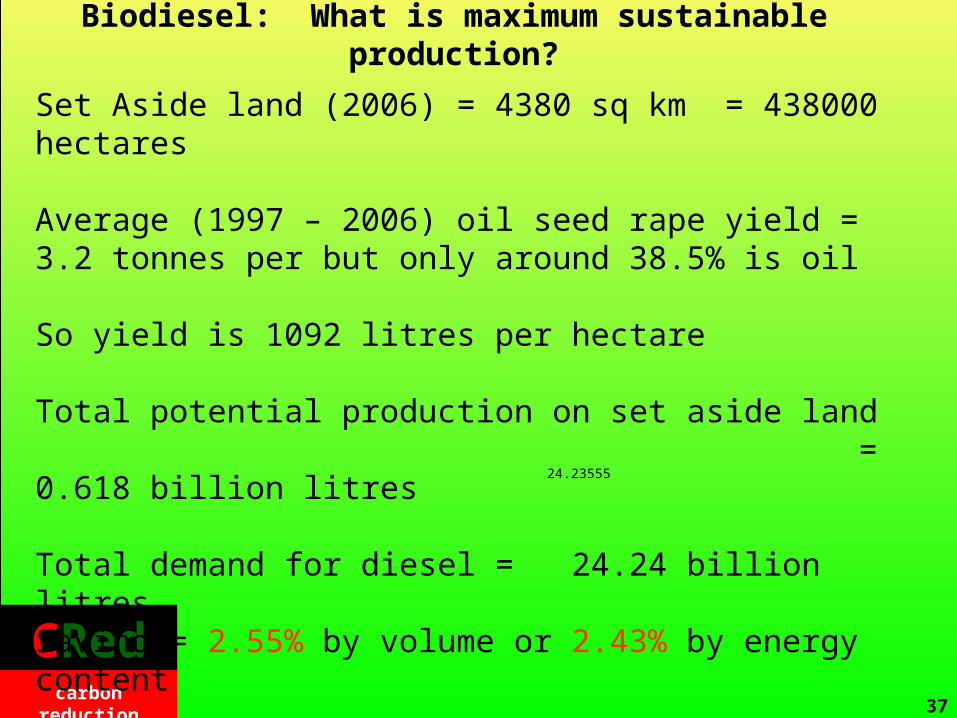
37
Set Aside land (2006) = 4380 sq km = 438000 hectares
Average (1997 – 2006) oil seed rape yield = 3.2 tonnes per but only around 38.5% is oil
So yield is 1092 litres per hectare
Total potential production on set aside land = 0.618 billion litres
Total demand for diesel = 24.24 billion litresSaving = 2.55% by volume or 2.43% by energy content
24.23555
CRedcarbon reduction
CRedcarbon reduction
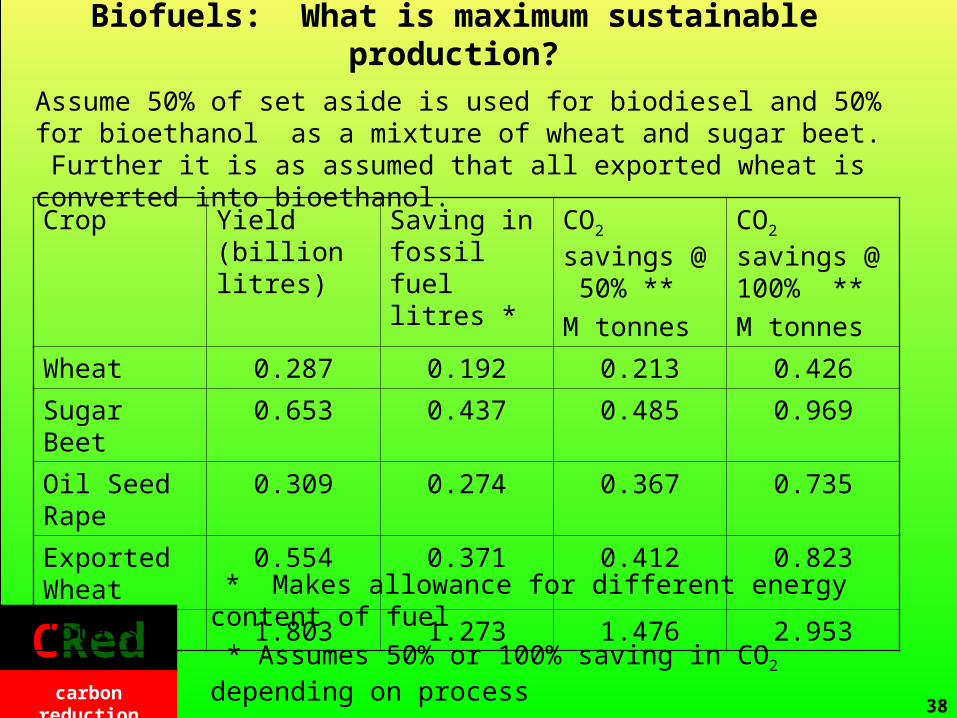
Biofuels: What is maximum sustainable production?
38
Assume 50% of set aside is used for biodiesel and 50% for bioethanol as a mixture of wheat and sugar beet. Further it is as assumed that all exported wheat is converted into bioethanol.
Crop Yield (billion litres)
Saving in fossil fuel litres *
CO2 savings @ 50% **
M tonnes
CO2 savings @ 100% **
M tonnes
Wheat 0.287 0.192 0.213 0.426
Sugar Beet 0.653 0.437 0.485 0.969
Oil Seed Rape 0.309 0.274 0.367 0.735
Exported Wheat
0.554 0.371 0.412 0.823
Totals 1.803 1.273 1.476 2.953
* Makes allowance for different energy content of fuel
* Assumes 50% or 100% saving in CO2 depending on process
Only achieves 3.69% saving in raw volume cf. 5% RTFO
CRedcarbon reduction
CRedcarbon reduction
39
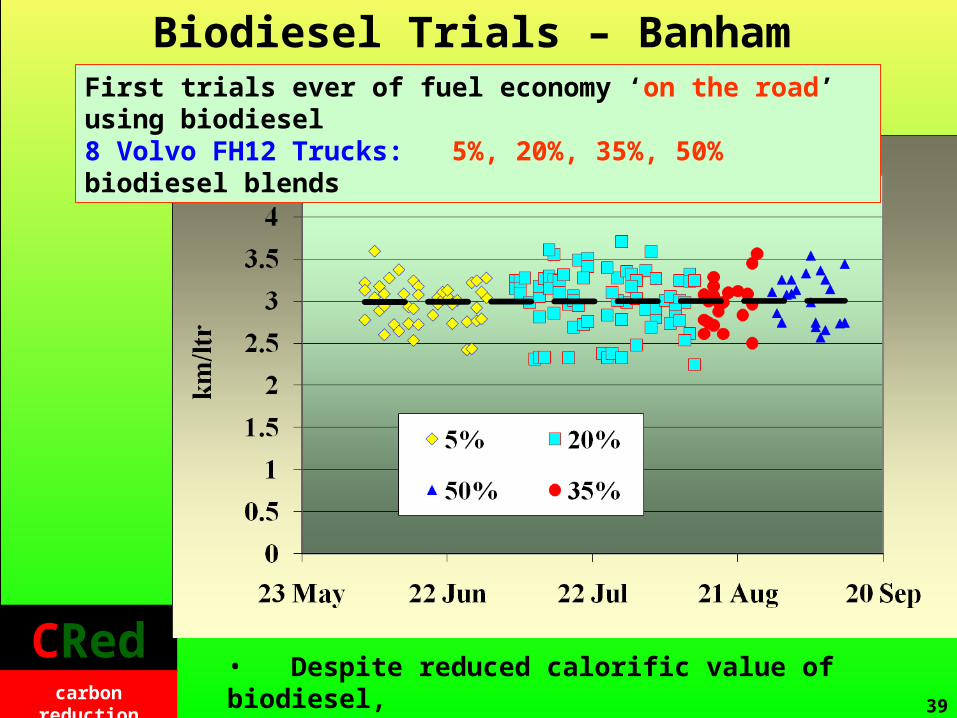
Biodiesel Trials – Banham Poultry 2004
• Despite reduced calorific value of biodiesel, fuel consumption remained the same
First trials ever of fuel economy ‘on the road’ using biodiesel8 Volvo FH12 Trucks: 5%, 20%, 35%, 50% biodiesel blends
CRedcarbon reduction
CRedcarbon reduction
40
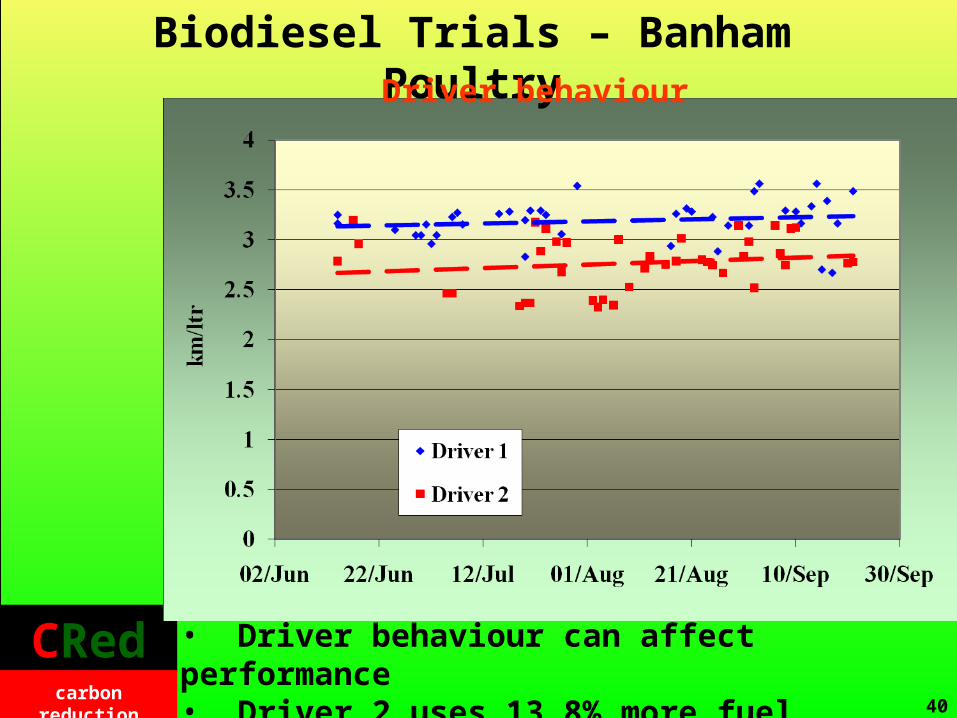
• Driver behaviour can affect performance• Driver 2 uses 13.8% more fuel than driver 1
Biodiesel Trials – Banham PoultryDriver behaviour
CRedcarbon reduction
CRedcarbon reduction
41
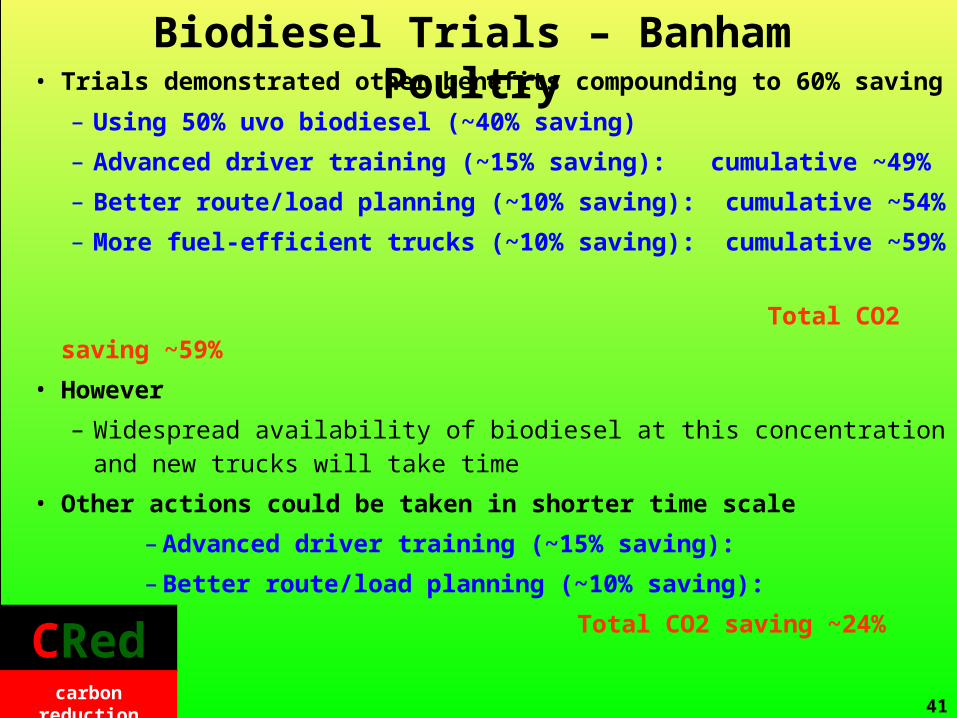
• Trials demonstrated other benefits compounding to 60% saving
– Using 50% uvo biodiesel (~40% saving)
– Advanced driver training (~15% saving): cumulative ~49%
– Better route/load planning (~10% saving): cumulative ~54%
– More fuel-efficient trucks (~10% saving): cumulative ~59%
Total CO2 saving ~59%
• However
– Widespread availability of biodiesel at this concentration and new trucks will take time
• Other actions could be taken in shorter time scale
– Advanced driver training (~15% saving):
– Better route/load planning (~10% saving):
Total CO2 saving ~24%
Biodiesel Trials – Banham Poultry
CRedcarbon reduction
CRedcarbon reduction
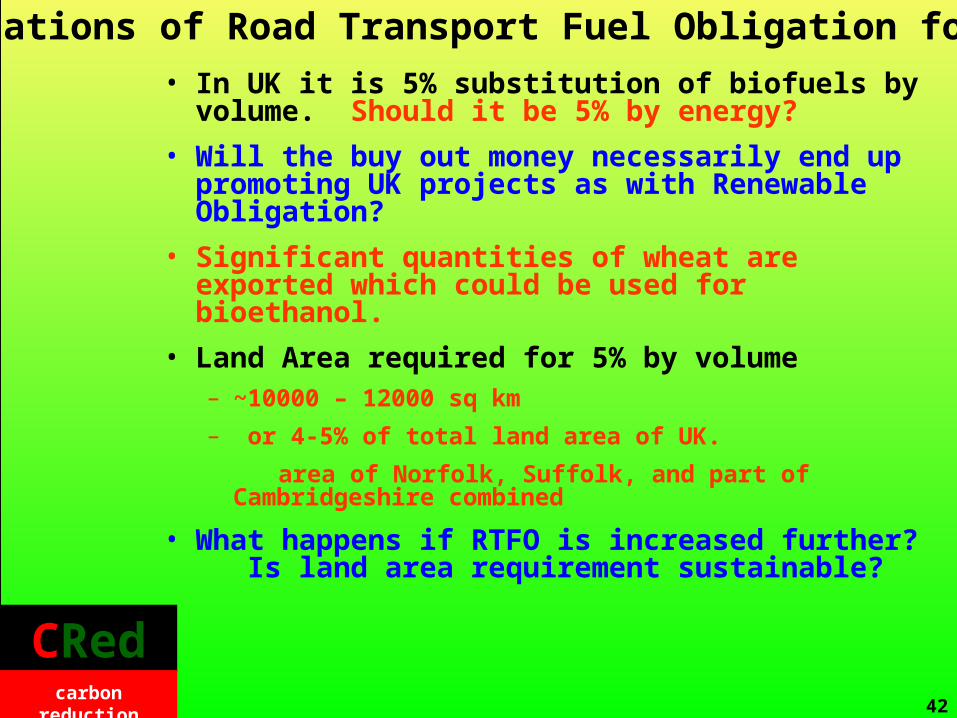
42
• In UK it is 5% substitution of biofuels by volume. Should it be 5% by energy?
• Will the buy out money necessarily end up promoting UK projects as with Renewable Obligation?
• Significant quantities of wheat are exported which could be used for bioethanol.
• Land Area required for 5% by volume– ~10000 – 12000 sq km
– or 4-5% of total land area of UK.
area of Norfolk, Suffolk, and part of Cambridgeshire combined
• What happens if RTFO is increased further? Is land area requirement sustainable?
Implications of Road Transport Fuel Obligation for 2010
CRedcarbon reduction
CRedcarbon reduction
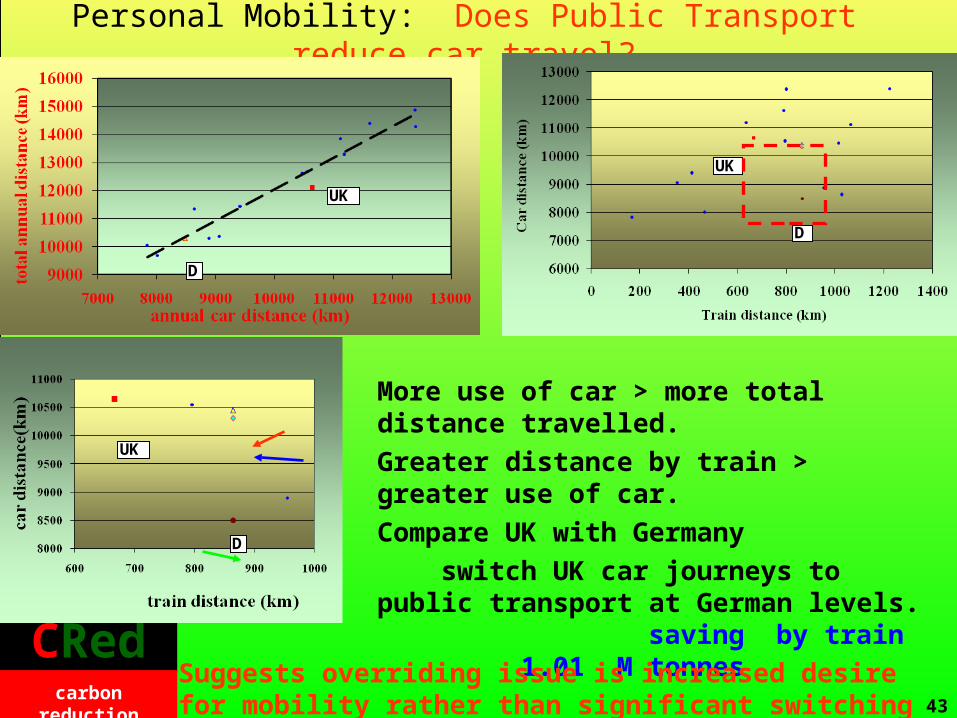
Personal Mobility: Does Public Transport reduce car travel?
43
UK
D
More use of car > more total distance travelled.
Greater distance by train > greater use of car.
Compare UK with Germany
switch UK car journeys to public transport at German levels. saving by train 1.01 M tonnes saving by bus 0.74 M tonnesReducing mobility desire 9.22 M tonnesSuggests overriding issue is increased desire for mobility rather
than significant switching of mode of transport.
D
UK
D
UK
CRedcarbon reduction
CRedcarbon reduction
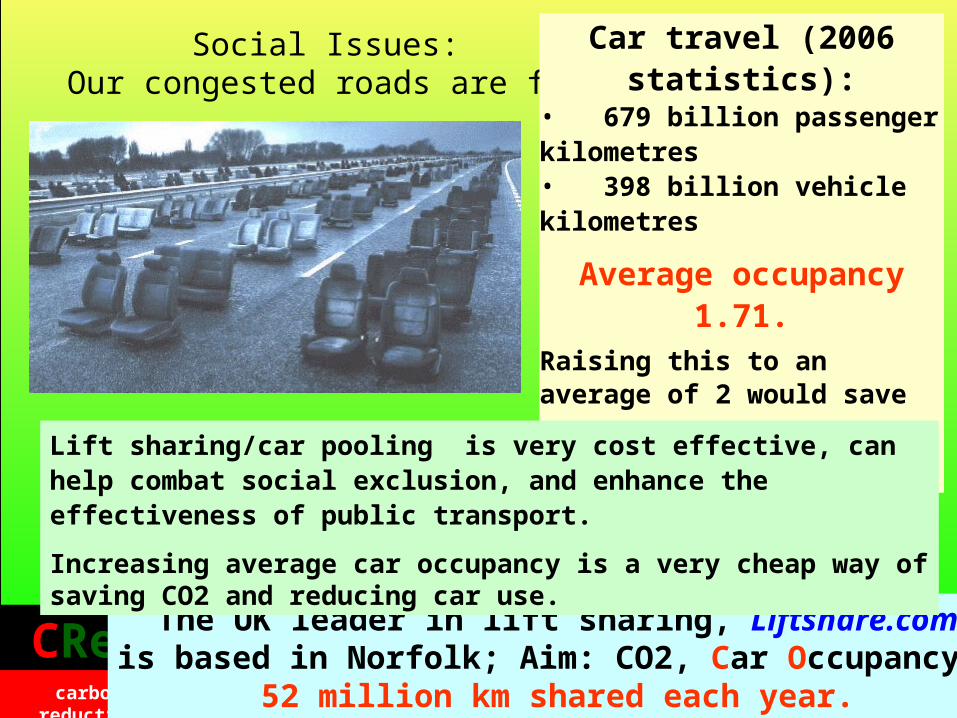
Social Issues: Lift SharingOur congested roads are full of empty seats
44
The UK leader in lift sharing, Liftshare.comis based in Norfolk; Aim: CO2, Car Occupancy 2
52 million km shared each year.
Car travel (2006 statistics):• 679 billion passenger kilometres• 398 billion vehicle kilometres
Average occupancy 1.71.Raising this to an average of 2 would save
9.9 Mtonnes CO2.
Lift sharing/car pooling is very cost effective, can help combat social exclusion, and enhance the effectiveness of public transport.
Increasing average car occupancy is a very cheap way of saving CO2 and reducing car use.
CRedcarbon reduction
CRedcarbon reduction
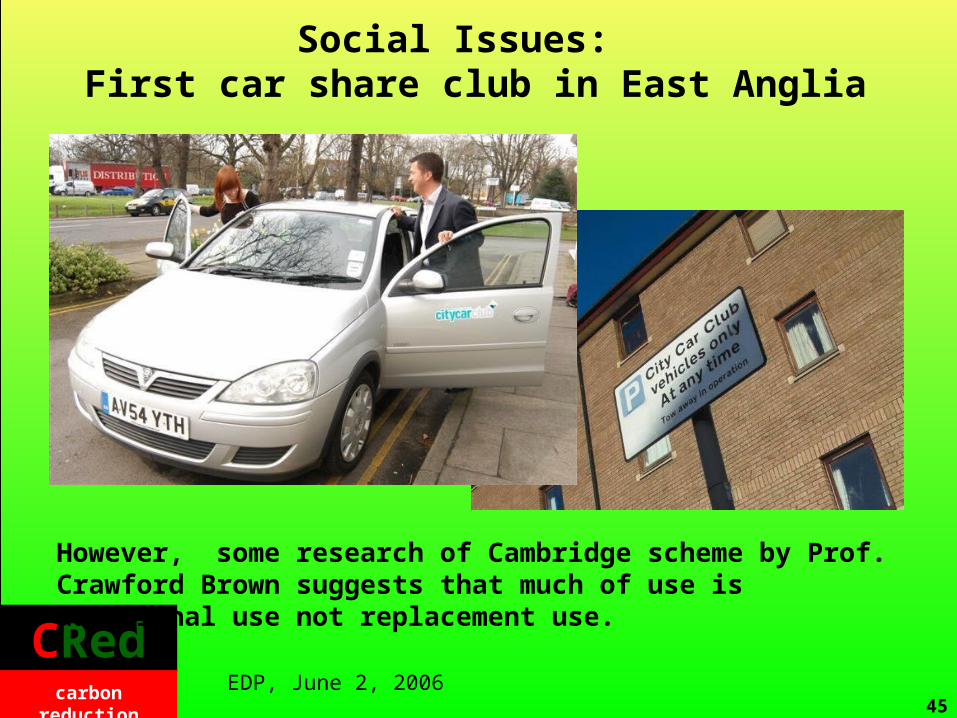
Social Issues: First car share club in East Anglia
EDP, June 2, 2006
However, some research of Cambridge scheme by Prof. Crawford Brown suggests that much of use is additional use not replacement use.
45
CRedcarbon reduction
CRedcarbon reduction
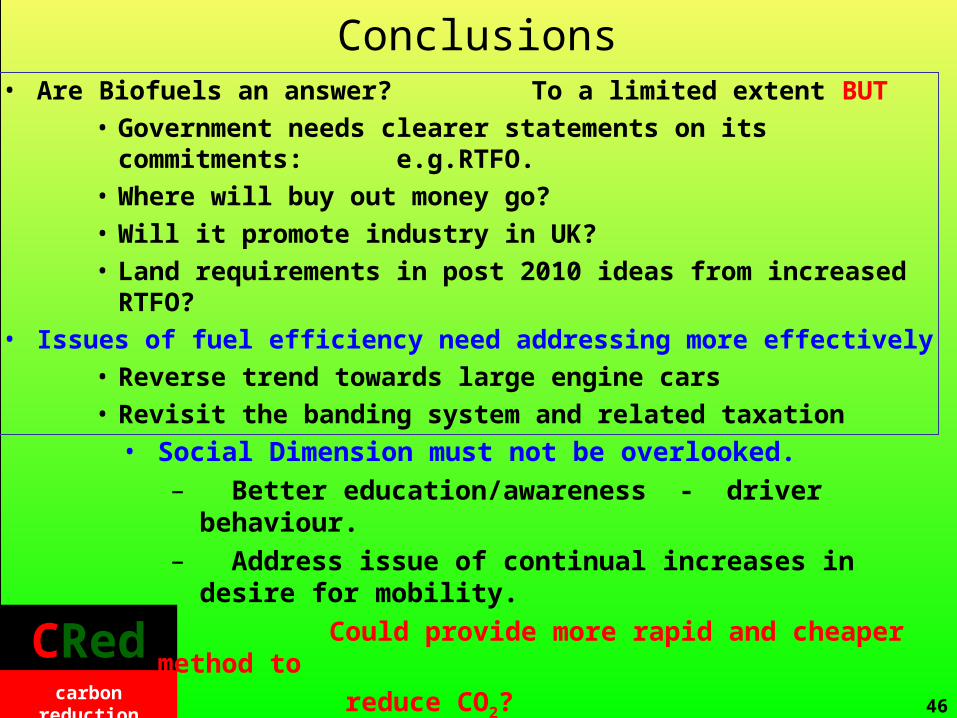
Conclusions
46
• Are Biofuels an answer? To a limited extent BUT • Government needs clearer statements on its commitments:
e.g.RTFO. • Where will buy out money go?• Will it promote industry in UK?• Land requirements in post 2010 ideas from increased RTFO?
• Issues of fuel efficiency need addressing more effectively• Reverse trend towards large engine cars• Revisit the banding system and related taxation
• Social Dimension must not be overlooked.– Better education/awareness - driver behaviour.– Address issue of continual increases in desire for
mobility.
Could provide more rapid and cheaper method to
reduce CO2?

CRedcarbon reduction
CRedcarbon reduction
WEBSITE www.cred-uk.org
This presentation will be available from tomorrow:> Follow the Academic Resources Link
Conclusions
Lao Tzu (604-531 BC) Chinese Artist and Taoist philosopher
"If you do not change direction, you may end up where you are heading."