Embed Size (px)
Citation preview
i
SUDAN UNIVERSITY OF SCIENCE & TECHNOLOGY
FACULTY OF COMPUTER SCIENCE & INFORMATION TECHNOLOGY
Data warehouse and Business intelligence
(Sudanese electricity companies)
مستودع البيانات واألعمال الذكية
(شركات الكهرباء السودانية)
OCTOBER 2015
THESIS SUMITTED AS A PARTIAL REQUIREMENTS 0F B.Sc. (HONOR) DEGREE IN
COMPUTER AND INFORMATION SYSTEM
ii
بسم ميحرلا نمحرلا هللا
SUDAN UNIVERSITY OF SCIENCE & TECHNOLOGY FACULTY OF
COMPUTER SCIENCE & INFORMATION TECHNOLOGY
DEPARTMENT OF COMPUTER AND INFORMATION SYSTEM
Data warehouse and Business intelligence
(Sudanese electricity companies)
مستودع البيانات واألعمال الذكية
(شركات الكهرباء السودانية)
THESIS SUMITTED AS A PARTIAL REQUIREMENTS 0F B.Sc. (HONOR) DEGREE IN
COMPUTER SCIENCE
OCTOBER 2015
PREPARED BY
Ehsan Gareballah Mustafa
Safa Khalid Satti Ali Mahmod
Usra Mohamed Ahmed Alfaki
Supervisor:
AL Sharif Hago Almugadam Yusuf

iii
الرحيم الرحمن هللا بسم
ماء ماء فأخرجنا به ثمرات مختلفا ألوانها ومن الجبال جد ﴿ أنزل من الس مر مختل ألم تر أن للا د ض وواب والنعام مختل ألوانه ك ( 72)ألوانها وغرايب سود من عباده ومن الناس والد ذلك إنما يخشى للا
عزيز غفور .فاطرسورة ﴾)72)العلماء إن للا
iv
Abstract
The development of the business environment and technology in the world, The automation of
systems which led to the accumulation of transaction data in the organizations and the need of
information that enabling organizations to make tactical and strategy decisions that help them move
forward to its goals, For that the need of business intelligence(BI) is came, BI help the organization in
collection and integration the data from various sources and analysis it to help in extract information to
help in decision-making.
Sudanese power companies that follow to the Ministry of Electricity and Dams lack of integration
between their systems and these companies have appreciable amount of data generated by their systems
and it need system to help in the analysis of this data to produce information help in decision-making.
The result of this study is provided BI system in accounting data that do integration between two
companies from the electricity companies are Sudanese distribution electricity company (sedc) and the
Sudanese thermal production company (stpc) to generate synthesis reports that help in decision-making
by using the pentaho program, It is an open source program contains many build-in tools that help the
developer to build business intelligence solution.

v
المستخلص
مالت في لتراكم بيانات المعا ظمةاألنأتمتة تطور بيئة األعمال التجارية وغيرها في العالم وتطور التكنولوجيا وأدي
وإستراتجية تساعدها في ةيمن اتخاذ قرارات تكتيك ات تمكن هذه المؤسساتلي توفر معلومالمؤسسات وأصبحت هنالك حاجة إ
ا لذكاء األعمال الذي يساعد المؤسسات في تجميع بياناته الحاجة جاءت ألعمال والمضي قدما نحو أهدافها من هنا امواكبة بيئة
.معلومات تساعدها في اتخاذ القرارات ستخرجوتحليلها إلمن مختلف المصادر
ك هذه الشركات تمتلك تكامل بين أنظمتها وكذللتقر لفشركات الكهرباء السودانية التي تتبع لوزارة الكهرباء والسدود ت
الناتجة من أنظمة ج البيانات لنظام يساعدها في دممن البيانات الناتجة من أنظمتها وتحتاج وزارة الكهرباء والسدود كمية مقدره
.الشركات وتحليلها إلنتاج معلومات تساعدها في اتخاذ القرارات
السودانية لتوزيع الكهرباء مل علي البيانات الحسابية للشركةهذه الدراسة نظام ذكاء أعمال يع النتائج التي توصلت لها
في تساعدها يساعدها في استخراج تقارير تجميعية( stpc) المحدودةلحراري لتوليد االسودانية لشركة الو( sedc)المحدودة
التي مفتوح المصدر يحتوي علي العديد من األدوات عبارة عن برنامجوهو pentaho اتخاذ القرار وذلك باستخدام برامج
. الذكية تساعد المطور في بناء حل لألعمال
vi
Dedication To our dear mothers, you are provided us the guidance we needed throughout our life, things just seem to
get a little more complicated the older we get. Thanks for all your support, you’re always near a tender
smile to guide us way you’re the sunshine to light our life.
To our dear fathers Thanks for being there when we need you the most and even when we didn’t. To all
our family's members whom were source of success, by giving us the confidence.

vii
Acknowledgements
We thank Almighty God for giving us the courage and the determination, As well as guidance us in
conducting this research study, Despite all difficulties.
We would like to express our gratitude to our Supervisor AL Sharif Hago Almugadam Yusuf and
everyone how supply us from Nile center for technical research and from Sudanese electricity
companies.
Finally, thanks to all our friends who endured this long process with us and always offered support.
viii
Table of Figures
Figure (2. 1)Components of Business Intelligence system .................................................................................................... 6
Figure (2. 2) Star schema of data warehouse........................................................................................................................ 8
Figure (2. 3) Snowflake schema of data warehouse .............................................................................................................. 9
Figure (2. 4) Fact constellations of data warehouse.............................................................................................................. 9
Figure (2. 5) Application of Business Intelligence in Manufacturing .................................................................................... 14
Figure (3. 6) Pentaho BI stack ............................................................................................................................................. 18
Figure (3. 7) Use Case Diagram for the system ................................................................................................................... 21
Figure (3. 8) Sequence Diagram for login user ................................................................................................................... 22
Figure (3. 9) Sequence Diagram view report for user.......................................................................................................... 23
Figure (3. 10) Sequence Diagram login system for administator ......................................................................................... 24
Figure (3. 11) Sequence Diagram connection to data source for administrator................................................................... 25
Figure (3. 12) Sequence Diagram authorization for administrator ...................................................................................... 26
Figure (3. 13) Sequence Diagram view report for administrator ......................................................................................... 27
Figure (3. 14) Activity Diagram for System.......................................................................................................................... 28
Figure (4. 15) Pentaho login page ....................................................................................................................................... 30
Figure (4 .16) Pentaho administrator console .................................................................................................................... 31
Figure (4. 17) Pentaho non administrator console ............................................................................................................. 32
Figure (4. 18) Browse file page ........................................................................................................................................... 33
Figure (4. 19) Manage data source ..................................................................................................................................... 34
Figure (4. 20) Database as data source connection............................................................................................................. 35
Figure (4. 21) Succeeded massage ..................................................................................................................................... 35
Figure (4. 22) User role ...................................................................................................................................................... 36
Figure (4. 23) Control mail server ....................................................................................................................................... 36
Figure (2. 25) Control thr report duration and schedule ..................................................................................................... 37
Figure (4. 26) Schedule page .............................................................................................................................................. 38
Figure (4. 27) Comparison between the current system and the proposed system ............................................................. 39
ix
Table of Content Abstract ..................................................................................................................................... iv
v .................................................................................................................................. المستخلص
Dedication ................................................................................................................................. vi
Acknowledgements .................................................................................................................. vii
Table of Figures................................................................................................................... viii
CHAPTER 1 .............................................................................................................................. 1
INTRODUCTION ...................................................................................................................... 1
1.1 Introduction: ..................................................................................................................... 2
1.2 Problem Statement: ........................................................................................................... 2
1.3 Objectives: ........................................................................................................................ 2
1.4 Scope: ............................................................................................................................... 3
1.5 Thesis Layout: .................................................................................................................. 3
CHAPTER 2 .............................................................................................................................. 4
BACKGROUND TO BUSSINESS INTELEGANCE AND PREVIOUS STUDIES ................... 4
2.1 Introduction: ..................................................................................................................... 5
2.2 Business intelligence (BI) Definition: ............................................................................... 5
2.3 Business intelligence (BI) overview: ................................................................................. 5
2.4 The Key Components of Business Intelligence system: ..................................................... 6
2.4.1Data sources: ............................................................................................................... 6
2.4.2 Data warehouse and data mart: ................................................................................... 6
2.4.3 ETL: .......................................................................................................................... 9
2.4.4 OLAP (On line Analytical Processing): .................................................................... 10
2.4.5 Data mining: ............................................................................................................ 10
2.4.6 Dashboard: ............................................................................................................... 10
2.5 Business intelligence applications: .................................................................................. 11
2.6 open source Business intelligence applications:............................................................... 11
2.6 Related Studies: .............................................................................................................. 11
CHAPTER 3 ............................................................................................................................ 16
WORK ENVIROMENT AND PROPOSED SYSTEM ANALYSIS ......................................... 16
x
3.1 Introduction: ................................................................................................................... 17
3.2 System Requirement specification: ................................................................................. 17
3.3 Techniques used in the system: ....................................................................................... 17
3.3.1 Pentaho tool: ............................................................................................................ 17
3.3.2 Release of pentaho: .................................................................................................. 17
3.3.3 Pentaho BI stack: ..................................................................................................... 18
3.3.4 The Pentaho BA Suite divided into two parts: .......................................................... 19
3.4 UML technology: ........................................................................................................... 20
3.5 System Analysis: ............................................................................................................ 21
3.5.1 Use Case Diagram: ................................................................................................... 21
3.5.2 Sequence Diagram: .................................................................................................. 22
3.5.3 Activity Diagram: .................................................................................................... 28
CHAPTER 4 ............................................................................................................................ 29
RESULTS AND DISCUSSION ............................................................................................... 29
4.1 Introduction: ................................................................................................................... 30
4.2 system implementation: .................................................................................................. 30
4.3 The Result: ..................................................................................................................... 39
CHAPTER 5 ............................................................................................................................ 40
CONCLUSION AND RECOMMENDATIONS ....................................................................... 40
5.1 Conclusion:..................................................................................................................... 41
5.2 Recommendations: ......................................................................................................... 41
References: ........................................................................................................................... 42
Appendix A: ......................................................................................................................... 43
Table (A.1) comparison between pentaho and other open source tool ................................... 43

xi

1
CHAPTER 1
INTRODUCTION
2
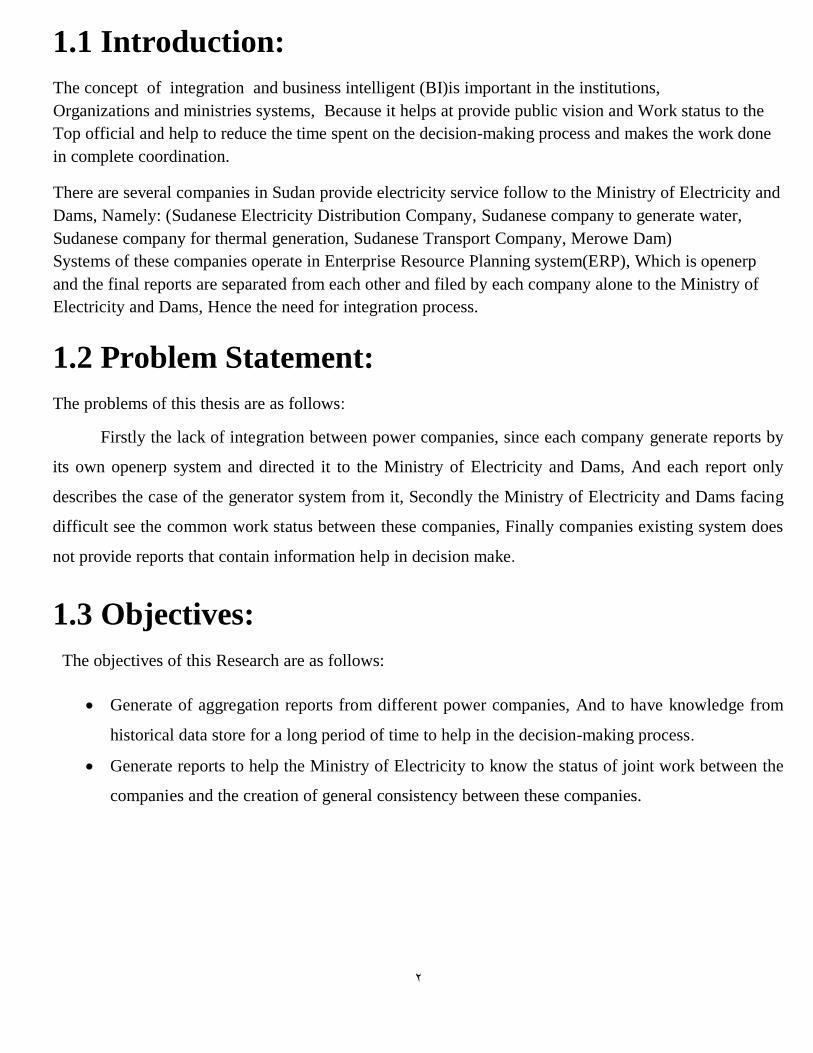
1.1 Introduction:
The concept of integration and business intelligent (BI)is important in the institutions,
Organizations and ministries systems, Because it helps at provide public vision and Work status to the
Top official and help to reduce the time spent on the decision-making process and makes the work done
in complete coordination.
There are several companies in Sudan provide electricity service follow to the Ministry of Electricity and
Dams, Namely: (Sudanese Electricity Distribution Company, Sudanese company to generate water,
Sudanese company for thermal generation, Sudanese Transport Company, Merowe Dam)
Systems of these companies operate in Enterprise Resource Planning system(ERP), Which is openerp
and the final reports are separated from each other and filed by each company alone to the Ministry of
Electricity and Dams, Hence the need for integration process.
1.2 Problem Statement:
The problems of this thesis are as follows:
Firstly the lack of integration between power companies, since each company generate reports by
its own openerp system and directed it to the Ministry of Electricity and Dams, And each report only
describes the case of the generator system from it, Secondly the Ministry of Electricity and Dams facing
difficult see the common work status between these companies, Finally companies existing system does
not provide reports that contain information help in decision make.
1.3 Objectives:
The objectives of this Research are as follows:
Generate of aggregation reports from different power companies, And to have knowledge from
historical data store for a long period of time to help in the decision-making process.
Generate reports to help the Ministry of Electricity to know the status of joint work between the
companies and the creation of general consistency between these companies.
3
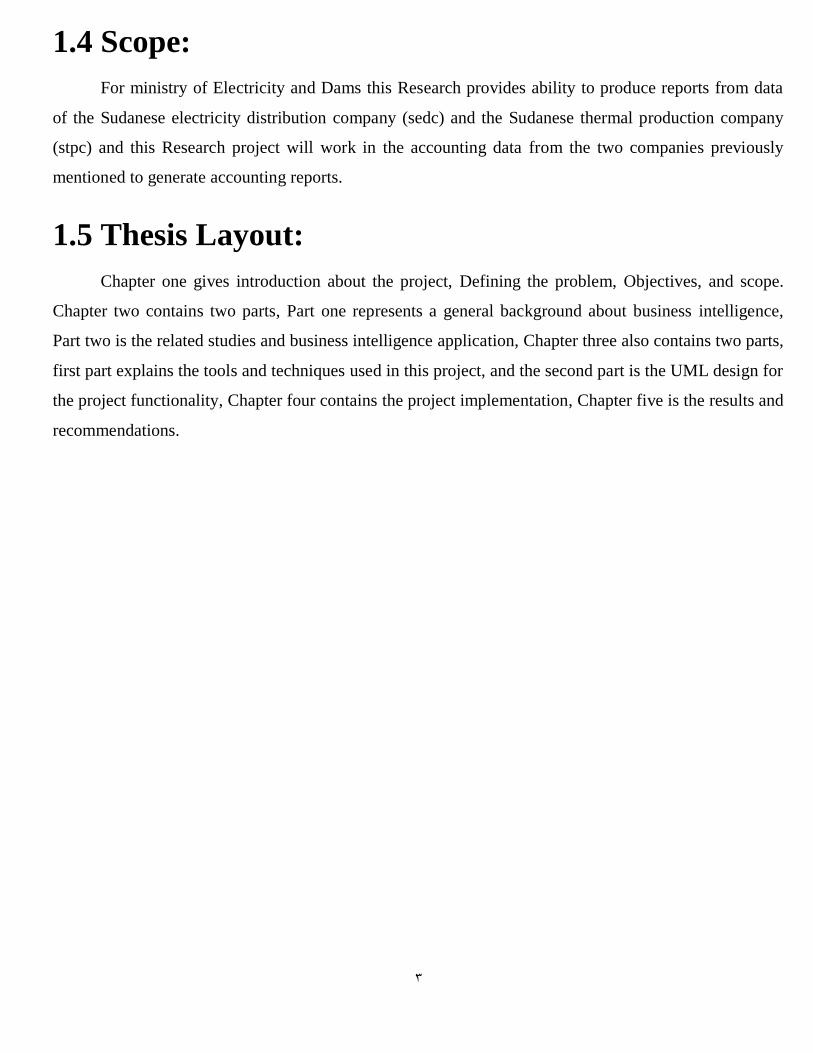
1.4 Scope:
For ministry of Electricity and Dams this Research provides ability to produce reports from data
of the Sudanese electricity distribution company (sedc) and the Sudanese thermal production company
(stpc) and this Research project will work in the accounting data from the two companies previously
mentioned to generate accounting reports.
1.5 Thesis Layout:
Chapter one gives introduction about the project, Defining the problem, Objectives, and scope.
Chapter two contains two parts, Part one represents a general background about business intelligence,
Part two is the related studies and business intelligence application, Chapter three also contains two parts,
first part explains the tools and techniques used in this project, and the second part is the UML design for
the project functionality, Chapter four contains the project implementation, Chapter five is the results and
recommendations.

4
CHAPTER 2
BACKGROUND TO BUSSINESS
INTELEGANCE AND PREVIOUS STUDIES
5
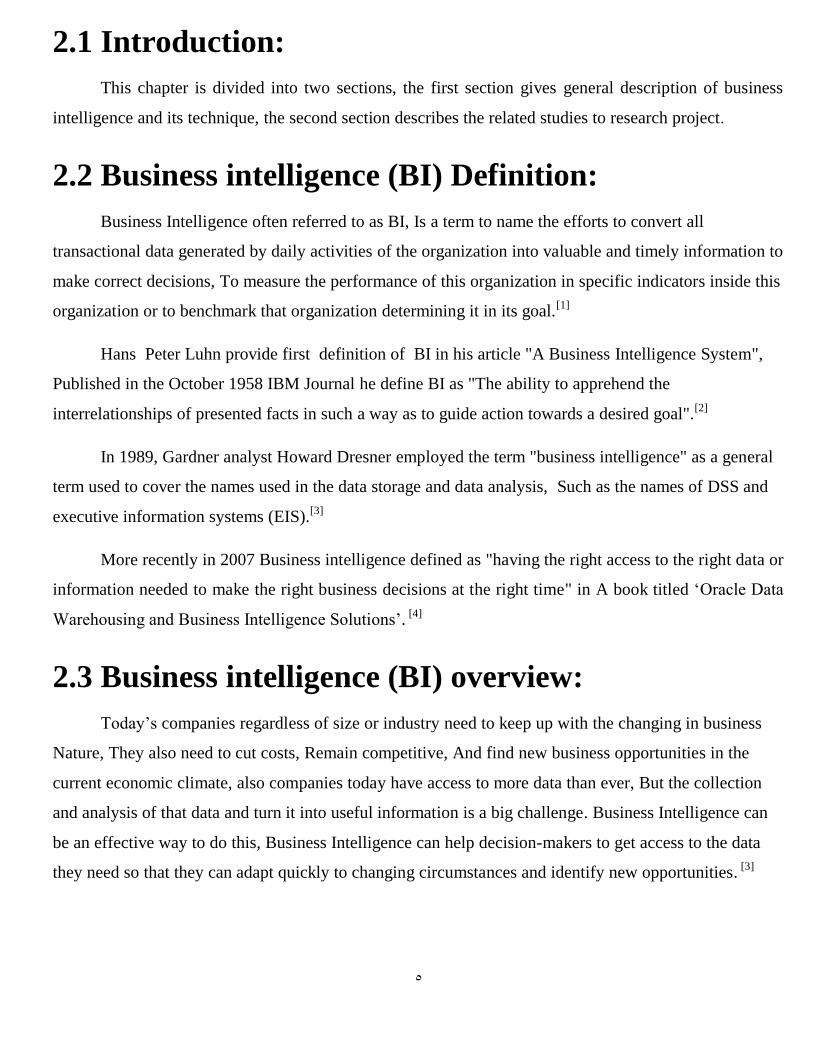
2.1 Introduction:
This chapter is divided into two sections, the first section gives general description of business
intelligence and its technique, the second section describes the related studies to research project.
2.2 Business intelligence (BI) Definition:
Business Intelligence often referred to as BI, Is a term to name the efforts to convert all
transactional data generated by daily activities of the organization into valuable and timely information to
make correct decisions, To measure the performance of this organization in specific indicators inside this
organization or to benchmark that organization determining it in its goal.[1]
Hans Peter Luhn provide first definition of BI in his article "A Business Intelligence System",
Published in the October 1958 IBM Journal he define BI as "The ability to apprehend the
interrelationships of presented facts in such a way as to guide action towards a desired goal".[2]
In 1989, Gardner analyst Howard Dresner employed the term "business intelligence" as a general
term used to cover the names used in the data storage and data analysis, Such as the names of DSS and
executive information systems (EIS).[3]
More recently in 2007 Business intelligence defined as "having the right access to the right data or
information needed to make the right business decisions at the right time" in A book titled ‘Oracle Data
Warehousing and Business Intelligence Solutions’. [4]
2.3 Business intelligence (BI) overview:
Today’s companies regardless of size or industry need to keep up with the changing in business
Nature, They also need to cut costs, Remain competitive, And find new business opportunities in the
current economic climate, also companies today have access to more data than ever, But the collection
and analysis of that data and turn it into useful information is a big challenge. Business Intelligence can
be an effective way to do this, Business Intelligence can help decision-makers to get access to the data
they need so that they can adapt quickly to changing circumstances and identify new opportunities. [3]
6
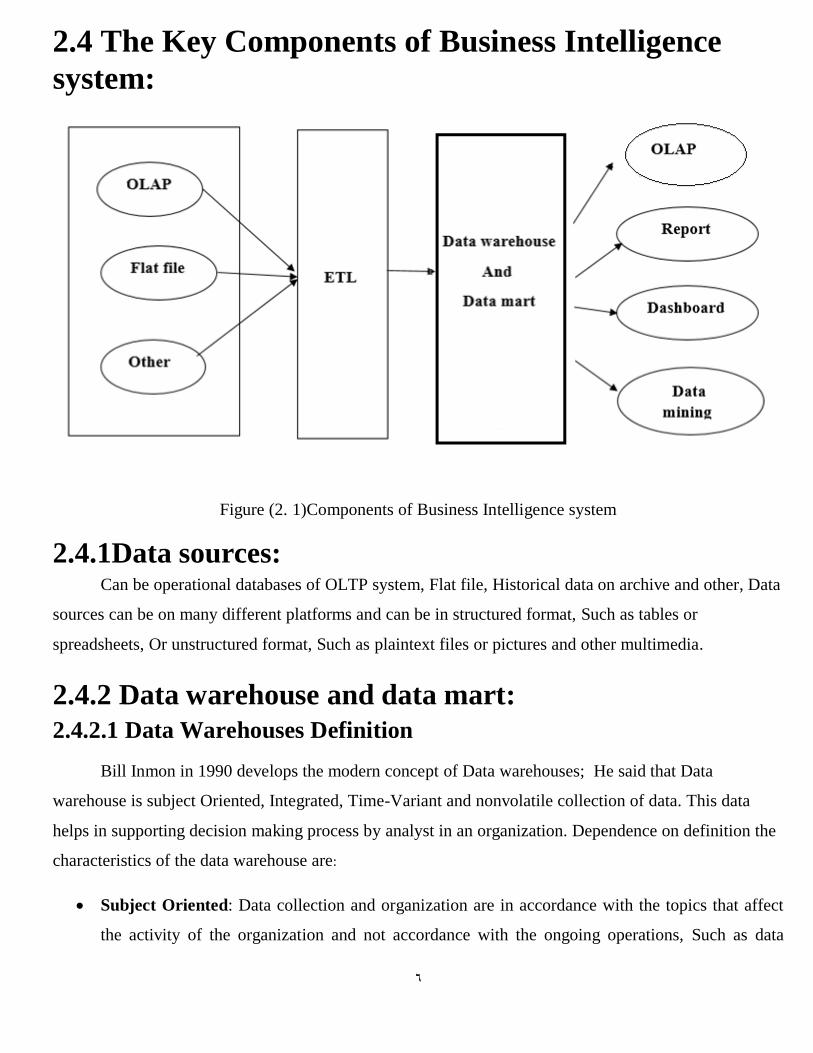
2.4 The Key Components of Business Intelligence
system:
Figure (2. 1)Components of Business Intelligence system
2.4.1Data sources:
Can be operational databases of OLTP system, Flat file, Historical data on archive and other, Data
sources can be on many different platforms and can be in structured format, Such as tables or
spreadsheets, Or unstructured format, Such as plaintext files or pictures and other multimedia.
2.4.2 Data warehouse and data mart:
2.4.2.1 Data Warehouses Definition
Bill Inmon in 1990 develops the modern concept of Data warehouses; He said that Data
warehouse is subject Oriented, Integrated, Time-Variant and nonvolatile collection of data. This data
helps in supporting decision making process by analyst in an organization. Dependence on definition the
characteristics of the data warehouse are:
Subject Oriented: Data collection and organization are in accordance with the topics that affect
the activity of the organization and not accordance with the ongoing operations, Such as data
7
about customers, Products, ETL mean focus is on modeling and analyzing the data necessary to
make decisions.
Integrated: Data were collected from different source, Therefore must be integration and
cohesion to give Unified meaning, Understand for user.
Non Volatile: Non-adjustable when you load the data in the warehouse it used only for analysis,
Study and display.
Time-Variant: means that any changes in the data should be recorded to reflect the resulting
reports those changes to have occurred in previous periods.[5]
2.4.2.2 Data mart: Data mart an integral part of the data warehouses, where the stores are divided into a set of
specialized stores, such as financial management, and other special human resources management or
division be based on the branches of Enterprise. The cause of division is to helps focus and precision of
What is the knowledge that will be discovered as well as to reduce efforts, The creation of data marts
allows the split of data which helps in the process accessible, To speed up queries by reducing the
scanning process of the data, Also allow setting any data mart in different hardware platforms and To
organize the data in a form suitable for user access. Before build data mart the data mart strategy must be
appropriate for the particular solution and taking into consideration the cost of hardware, software,
Network and Access Time. [5]
2.4.2.3 Terminology in data warehouse:
Fact table: In data warehousing, The Fact table consists of the measure or facts of a business process, It
is placed in the center of a star schema or a snowflake schema and dimension tables around it.
dimension table: is a table that linked to a fact table, The fact table contains business facts (or
measures), and foreign keys which refer to primary keys in the dimension tables, Dimension tables
contain descriptive attributes (or fields) these attributes do two purposes: to apply query constraining and
filtering resulted data.
2.4.2.4 Why Data Warehouse Separated from Operational Databases: A data warehouse is type of database that contains tables, Indexes, Queries and other but the
fundamental difference:
8
Firstly-In terms of design: - databases are designed to store and organize operational data, While Data
warehouses are designed to store and analyze the collection of data from different source and reorganized
it to allow for analyzing and extracting important information from them to help in decision-making,
Also use the data warehouses to store huge amounts of data for periods long.
Secondly-In terms of purpose: -The usual databases used in the daily operations of the input, Modify,
And delete immediate and query, While data warehouse do not use to usual daily operations, But the goal
of it is to implement long-analytical queries, And extraction of complex reports in order to facilitate
decision-making in enterprises, Therefore data warehouse is only to read. [6]
2.4.2.5 Schema of data warehouse: The schema is a logical description of the entire data warehouse, The schema includes the name
and description of records of all record types including all associated data-items and aggregates,
Likewise the data warehouse requires the schema, The data warehouse uses the Stars, snowflake and fact
constellation schema. [5]
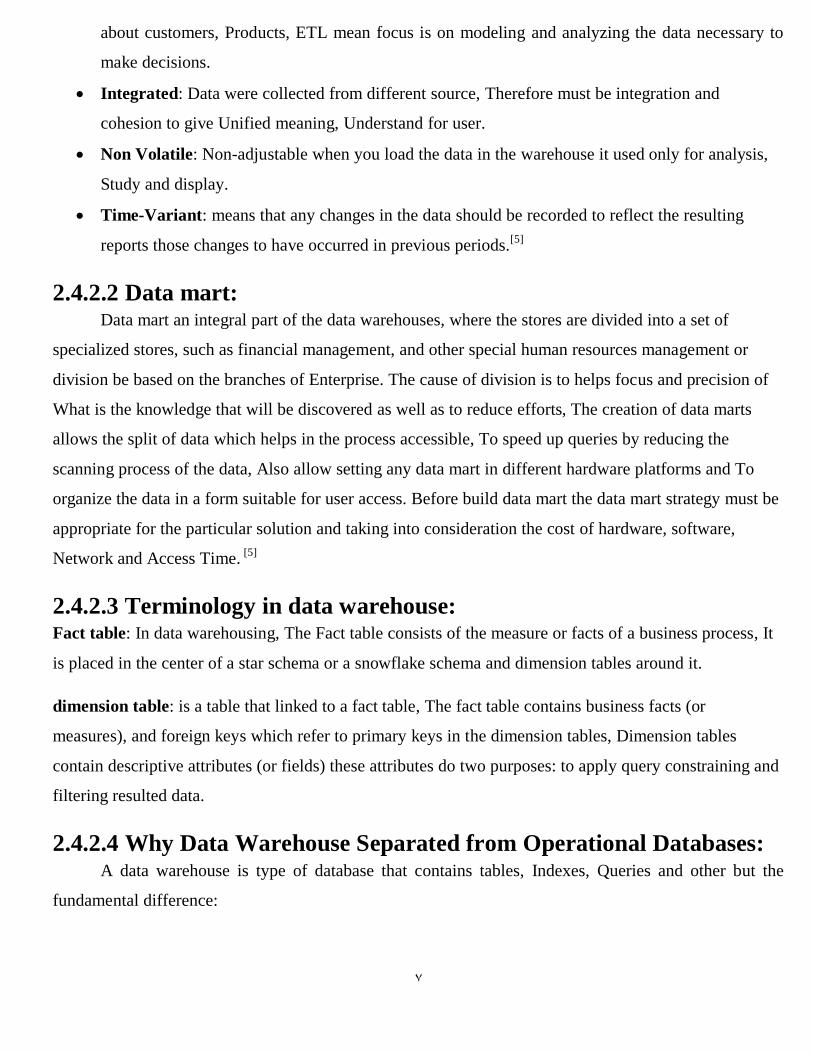
Star schema: A fact table in the middle connected to a set of dimension tables.
Figure (2. 2) Star schema of data warehouse
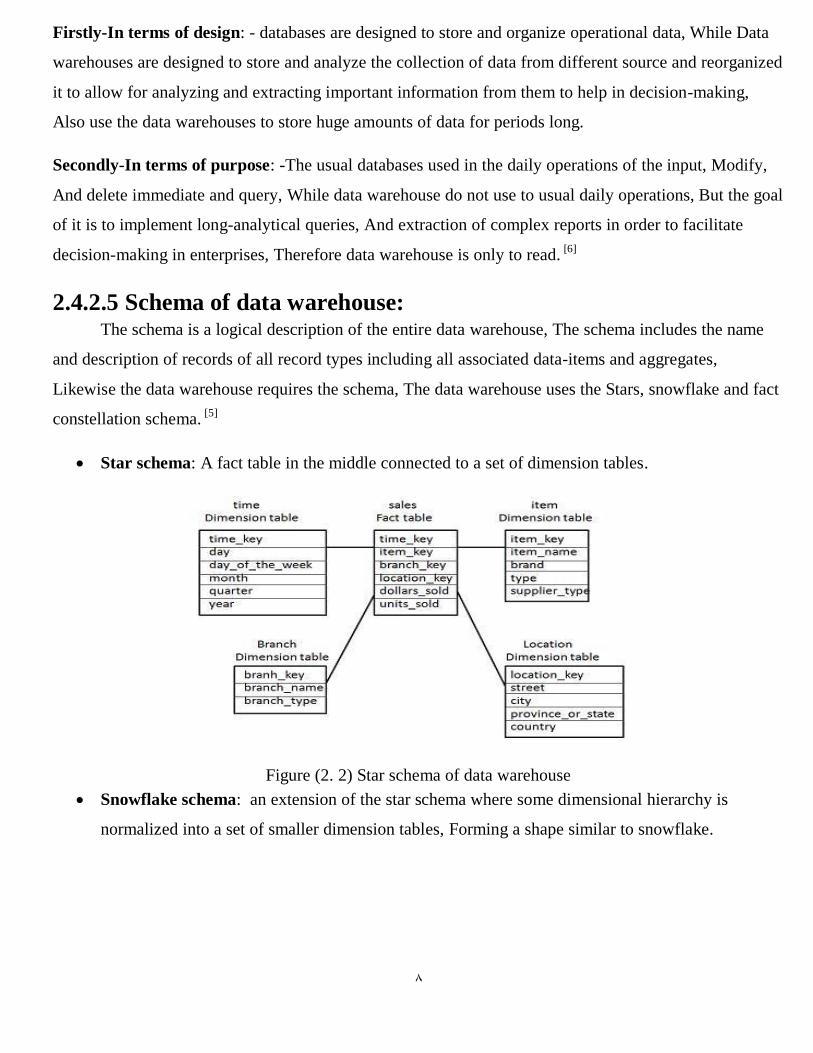
Snowflake schema: an extension of the star schema where some dimensional hierarchy is
normalized into a set of smaller dimension tables, Forming a shape similar to snowflake.
9
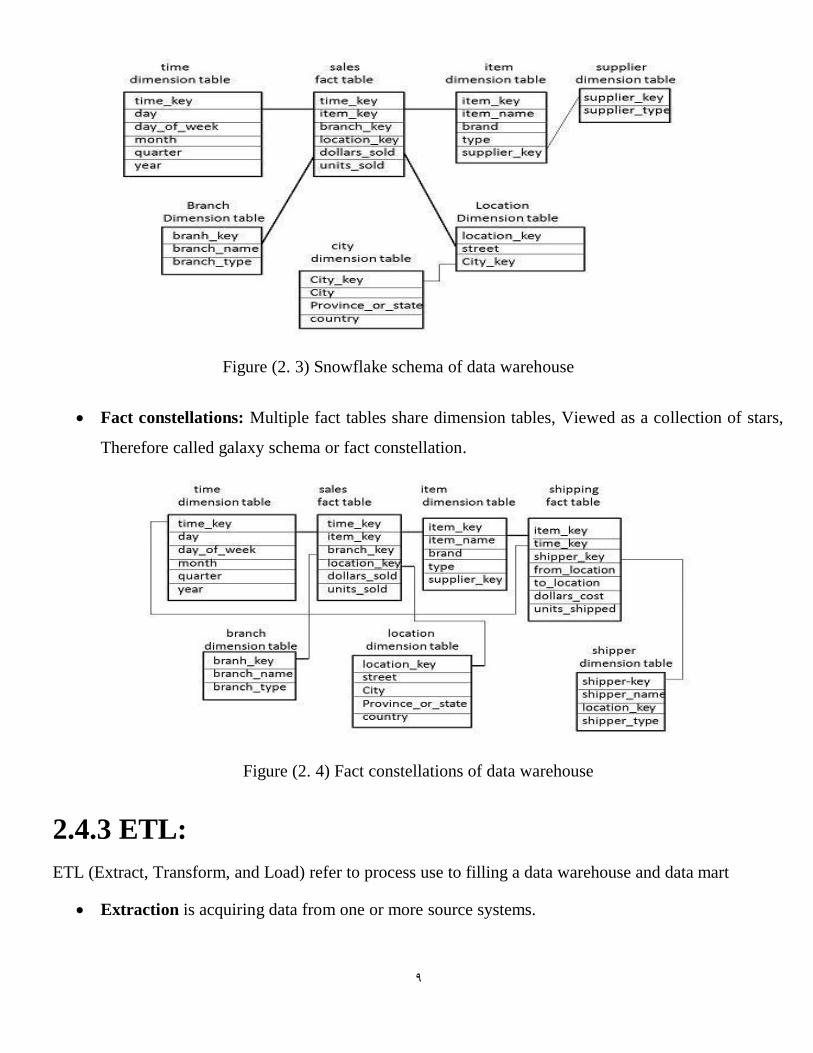
Fact constellations: Multiple fact tables share dimension tables, Viewed as a collection of stars,
Therefore called galaxy schema or fact constellation.
Figure (2. 4) Fact constellations of data warehouse
2.4.3 ETL:
ETL (Extract, Transform, and Load) refer to process use to filling a data warehouse and data mart
Extraction is acquiring data from one or more source systems.
Figure (2. 3) Snowflake schema of data warehouse
11
Transformation is changing the format and/or content of the data to fit it into the structure of the
target data warehouse or data mart another operation is data cleaning: data cleaning involves
finding and correcting the errors in data.
Loading is actually storing data in the target data warehouse or data mart.[7]
2.4.4 OLAP (On line Analytical Processing): Is aims to extract knowledge from a data warehouse or data marts, Its main idea is providing
navigation through data to non-expert users, So that they are able to interactively generate ad-hoc queries
without the intervention of IT professionals, The OLAP is based on the multidimensional view of data
(Looking at data in several dimensions), And the OLAP operations:-
ROLL-UP, DRILL-DOWN operation: ROLL-UP and DRILL-DOWN is Opposite operations
Where the tow operation performs aggregation on a data cube the ROLL-UP process do By
climbing up and concept of hierarchy for a dimension and dimension reduction, But the drilling
down By stepping down a concept hierarchy for a dimension, And the introduction of a new
dimension.
SLICE, DICE operations: SLICE and DICE operations gives us a new sub cube The slice
operation performs selection of one dimension but The Dice operation performs selection of two
or more dimension.
PIVOT: The pivot operation is also known as rotation, It rotates the data axes in view in order to
provide an alternative presentation of data.
2.4.5 Data mining: Data mining is process of analysis accurate and intelligent, Such as association, Clustering,
Classification, Prediction can be integrated with OLAP operations to enhance managers of activities
when using this process to make decisions, Analysis of a large amount of data considered in order to
create rules and examples and models that can lead decision-makers, To show the predicted future
behavior.
2.4.6 Dashboard: Dashboard is outputs of the leading business intelligence applications at this time, Is defined as
user interface, Graphical presentation often single page, Making it easy to read and give a view of the
11
current situation of the organization and historical trends for the organization or the computers of key
performance indicators to enable to give immediate decisions and informed choices.
2.5 Business intelligence applications:
Business Intelligence applications is a kind of software designed to retrieve, Analyze, Convert and
report the data that have already stored ,and provide information on the Business Intelligence system
business intelligence applications can be standalone tools or suites of tools.
2.6 open source Business intelligence applications:
Open Source Business Intelligence applications are capable tools to build BI system, Most of
Open Source Business Intelligence applications (OSBI apps) can be used promptly by developers with no
licensing costs.
OSBI applications have friendly graphics users interfaces for developers, Aimed to standardize
and make little more easy developers’ work, a developer easily can do a wide range of work including,
JDBC connectivity, ETL process, Access virtually all databases and data repositories, And easy data
integration processes development.
OSBI applications requires less hardware and software resources than it commercial counterparts,
also OSBI tools support can be obtained commercially from OSBI big players: Pentaho, Jaspersoft,
SpagoBI[8].
2.6 Related Studies:
Pentaho helps the Rio Negro Province to recover money and prepare for the future ( 2014,
Pentaho)[9]
The purpose of this study to know the problems that faced ARTRN Company and how they
overcame it using pentaho.ARTRN's problems was to create a set of management reports that were
flexible, Friendly, Easy to interpret and accessible for users in real time, And also ARTRN needed to
provide the user ad-hoc analysis of information, As well as to provide static reporting, ARTRN
company solve this problems with Pentaho Data Integration for loading, Updating and orchestration
12
the creation of a new Data Warehouse and Pentaho Business Analytics to allow users to easily
visualize their data and analyze key trends.
WebAssign Uses Business Analytics to Improve Education (2015, Pentaho).[10]
WebAssign distributes educational materials to more than 600,000 students worldwide each
semester, The amount of data generated exceeded the capabilities of their legacy data analysis tool, For
each new report that executives wanted to run, WebAssign needed a developer to write custom code,
which resulted in a backlog of IT requests and severely limited the types of data reports that could be
created. In addition, data was spread across various databases, spreadsheets, Google documents, and
customized code in the WebAssign web application, Complicating efforts to compile and analyze the
data. As a result, WebAssign executives lacked insight into critical information, Such as which textbooks
were most popular and by how much, WebAssign needed a business analytics solution to automate the
collection of disparate data across the organization and provide real-time data analysis, By implementing
the Pentaho Business Analytics platform, Centralizing company data and making data analysis accessible
to users across the company, WebAssign has achieved unprecedented visibility into its finances and
business operations, Customized Pentaho dashboards allow users to visualize data in different ways
through histograms and graphs. In a glance, WebAssign executives can see statistics on usage and
student performance, Enabling them to improve operations, control expenditures and help students to
learn more efficiently.
Metro Bank Building a bank that can surprise and delight with Power BI [11]
The vision of Metro Bank is to redefine the relationship people have with their bank by innovating
customer service, To go for word to this vision Metro Bank decided to implement Microsoft Power BI
because the solution integrated easily with the bank’s existing Microsoft stack, And was easy for its
employee to quickly learn for their daily needs, Metro Bank use Microsoft Power BI in different services
and areas (Call center operations, Mobile and Internet banking, Customer dissatisfaction reports and
Staffing and workload planning).
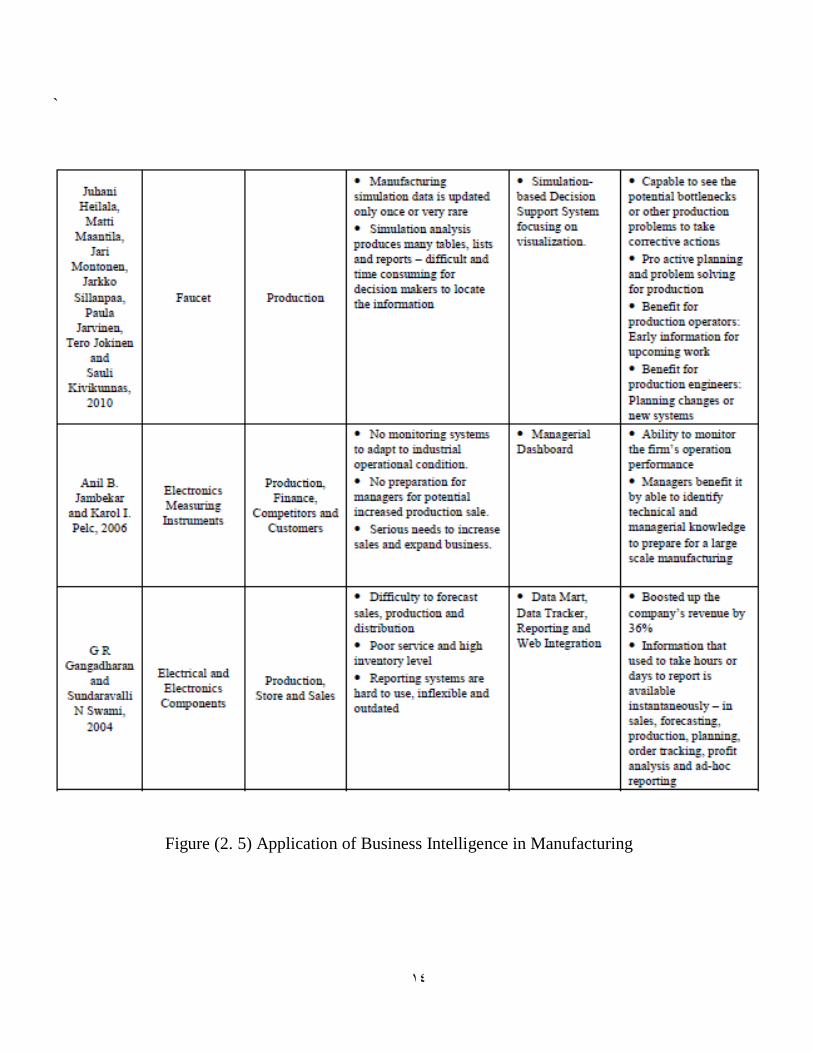
The Study on the Application of Business Intelligence in Manufacturing (2013
International Journal of Computer Science Issues).[12]
13
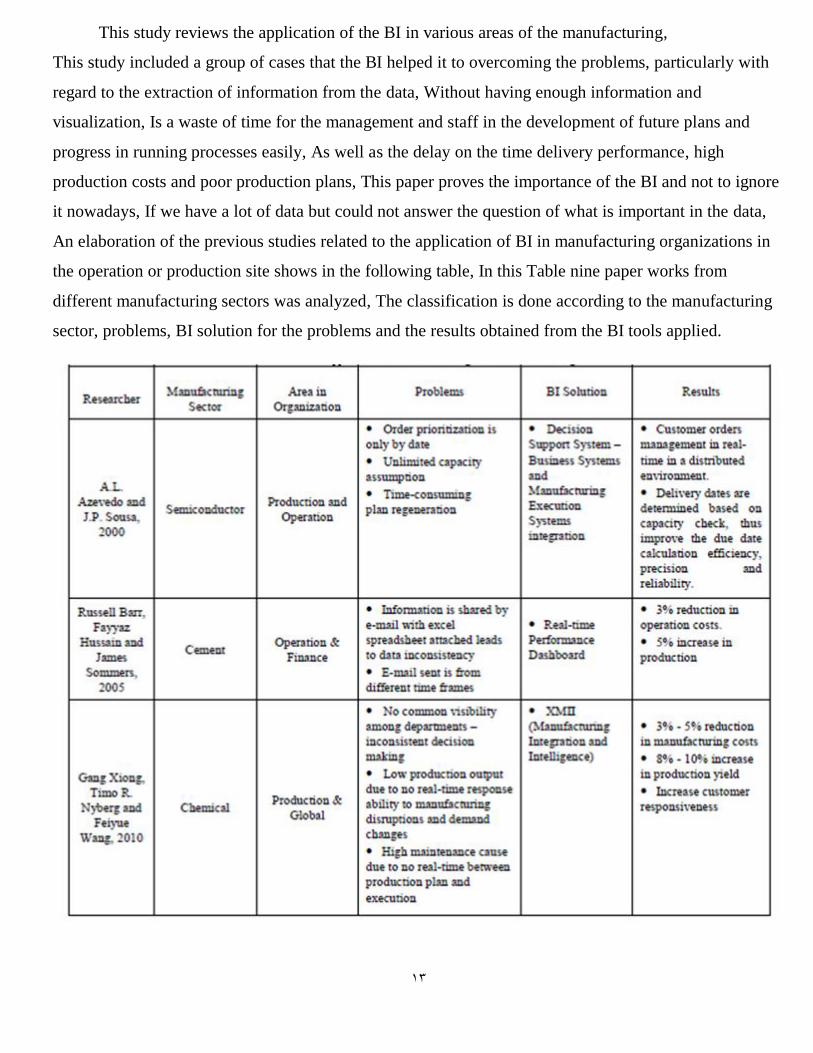
This study reviews the application of the BI in various areas of the manufacturing,
This study included a group of cases that the BI helped it to overcoming the problems, particularly with
regard to the extraction of information from the data, Without having enough information and
visualization, Is a waste of time for the management and staff in the development of future plans and
progress in running processes easily, As well as the delay on the time delivery performance, high
production costs and poor production plans, This paper proves the importance of the BI and not to ignore
it nowadays, If we have a lot of data but could not answer the question of what is important in the data,
An elaboration of the previous studies related to the application of BI in manufacturing organizations in
the operation or production site shows in the following table, In this Table nine paper works from
different manufacturing sectors was analyzed, The classification is done according to the manufacturing
sector, problems, BI solution for the problems and the results obtained from the BI tools applied.
14
`
Figure (2. 5) Application of Business Intelligence in Manufacturing
15
Summary of previous studies:
According to the studies above, Business intelligence help companies that apply it to take
effective decisions and provide insight into the Executive manager about company and business trends,
also reduce the time and effort that was carried out by companies in the previous to production reports to
help in decisions making and we find that the Business Intelligence application is not confined to a
particular area, Business Intelligence enabled companies to follow best work processes that reduce the
cost and increase the productivity, Through the business Intelligence provided information to help in
make better Business decisions and helping companies move towards strategic objectives.

16
CHAPTER 3
WORK ENVIROMENT AND PROPOSED
SYSTEM ANALYSIS
17
3.1 Introduction:
This chapter describes specification of devices, operating system, work environment, and
techniques used to build the system, and then describe the system analysis using UML technology.
3.2 System Requirement specification:
Ubuntu : 14.04
Installed java JDK 7
Installed java JRE 7
CPU performance “GHz” 2.99
Number of cores 3
RAM “GB” 2 at least
Disk space “GB” 250 at minimum
3.3 Techniques used in the system:
3.3.1 Pentaho tool: In 2004 Pentaho were arise to offer complete BI suites that the existing stand-alone BI solutions
,[7]
Pentaho tool is comprehensive platform enables you to access, Integrate, Manipulate, Visualize, And
analyze your data, Whether stored data in a flat file, Relational databases, Hadoop , Analytic database,
social media streams, Operational stores, Or in the cloud , The Pentaho BA Suite help to discover,
Analyze and visualize data to reach for answers that we need and do not require programming experience
because developer can customize the reports, Queries and transformations, Or extend the functionality
using the extensive API to ours. [13]
3.3.2 Release of pentaho: The Pentaho suite consists of two offerings, An enterprise and community edition, The enterprise
edition contains features not found in the community edition, Require subscription annually
18
The enhancements, Service, and support packaged with the BI Suite Enterprise Edition are designed to
accommodate production environments, Especially where downtime and time spent figuring out how to
install, Configure, And maintain a business intelligence solution are prohibitively expensive, As a
Pentaho BI Suite Community Edition user, You will have to install, Configure, And maintain the
software on your own, Your only support options are the community forum. [7]
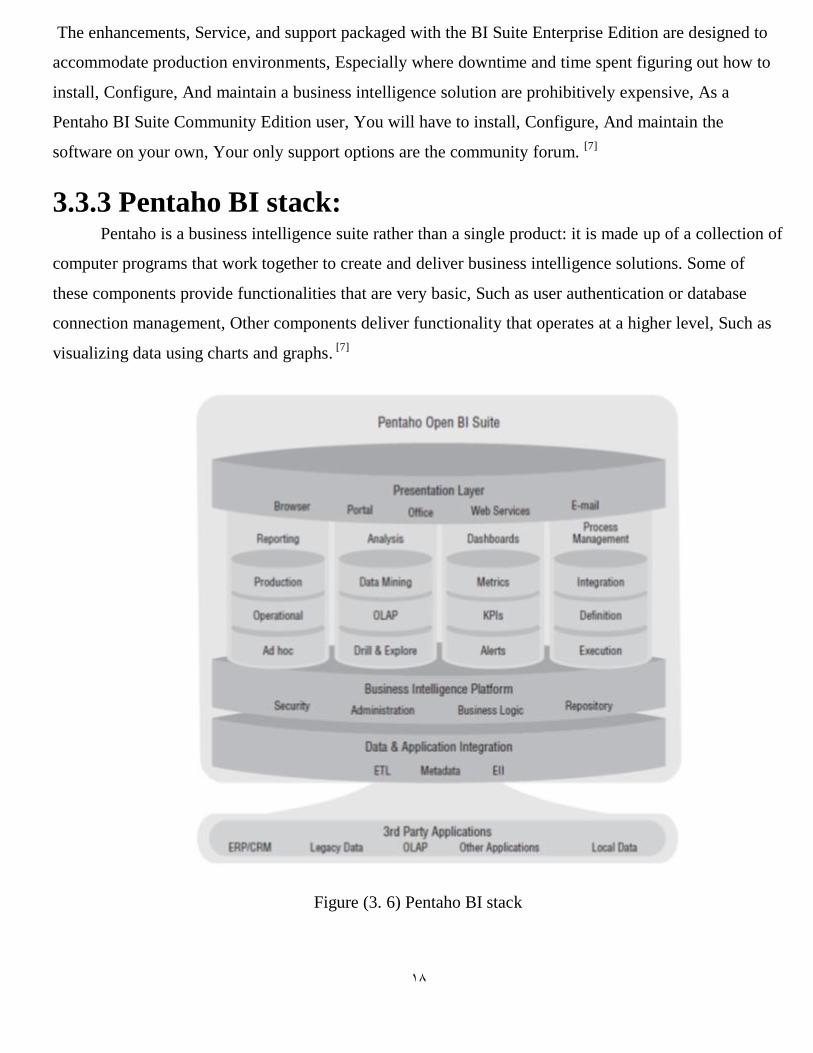
3.3.3 Pentaho BI stack: Pentaho is a business intelligence suite rather than a single product: it is made up of a collection of
computer programs that work together to create and deliver business intelligence solutions. Some of
these components provide functionalities that are very basic, Such as user authentication or database
connection management, Other components deliver functionality that operates at a higher level, Such as
visualizing data using charts and graphs. [7]
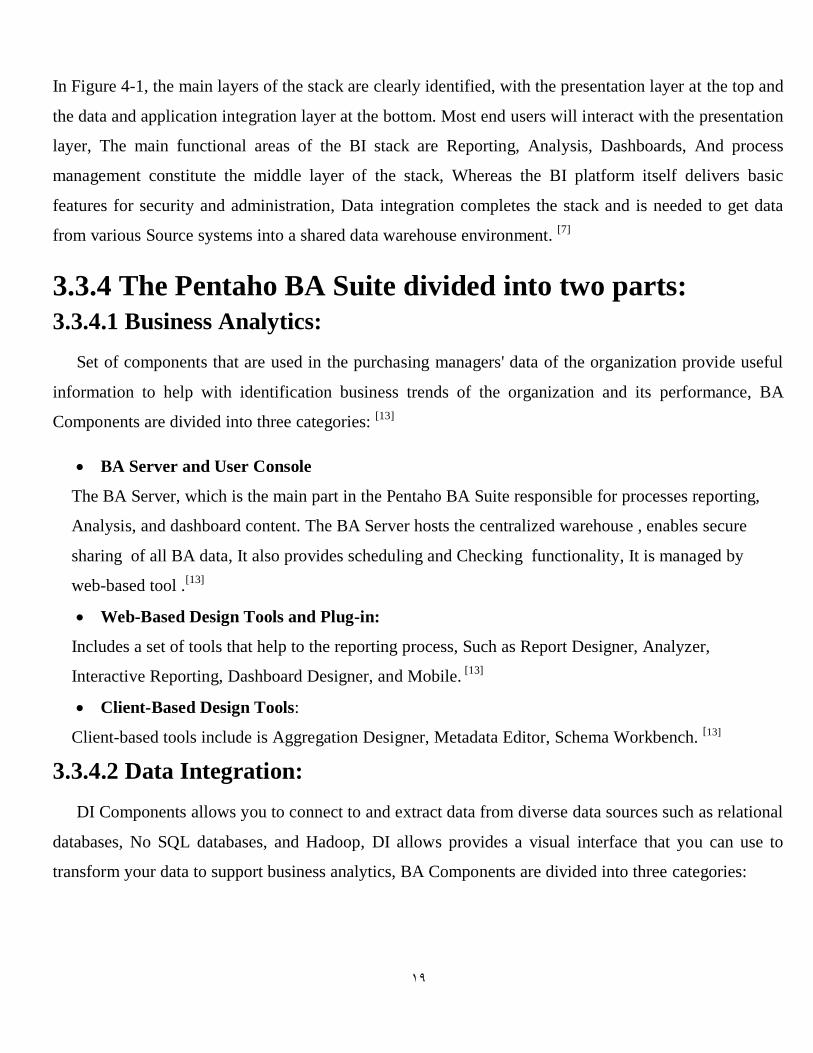
Figure (3. 6) Pentaho BI stack
19
In Figure 4-1, the main layers of the stack are clearly identified, with the presentation layer at the top and
the data and application integration layer at the bottom. Most end users will interact with the presentation
layer, The main functional areas of the BI stack are Reporting, Analysis, Dashboards, And process
management constitute the middle layer of the stack, Whereas the BI platform itself delivers basic
features for security and administration, Data integration completes the stack and is needed to get data
from various Source systems into a shared data warehouse environment. [7]
3.3.4 The Pentaho BA Suite divided into two parts:
3.3.4.1 Business Analytics:
Set of components that are used in the purchasing managers' data of the organization provide useful
information to help with identification business trends of the organization and its performance, BA
Components are divided into three categories: [13]
BA Server and User Console
The BA Server, which is the main part in the Pentaho BA Suite responsible for processes reporting,
Analysis, and dashboard content. The BA Server hosts the centralized warehouse , enables secure
sharing of all BA data, It also provides scheduling and Checking functionality, It is managed by
web-based tool .[13]
Web-Based Design Tools and Plug-in:
Includes a set of tools that help to the reporting process, Such as Report Designer, Analyzer,
Interactive Reporting, Dashboard Designer, and Mobile. [13]
Client-Based Design Tools:
Client-based tools include is Aggregation Designer, Metadata Editor, Schema Workbench. [13]
3.3.4.2 Data Integration:
DI Components allows you to connect to and extract data from diverse data sources such as relational
databases, No SQL databases, and Hadoop, DI allows provides a visual interface that you can use to
transform your data to support business analytics, BA Components are divided into three categories:
21
Data Integration Server
The DI Server runs centrally stored transformations and jobs, The DI Server also hosts the DI
repository and processing engine, provides a service layer for security and authentication, and allows
scheduling, Manage the DI Server through its related tool, Spoon. [13]
Design Tools and Command Line Utilities
Spoon is the only DI design tool component.
Spoon: The DI Server is a main component that executes data integration jobs and transformations using
the Pentaho Data Integration Engine, It also provides the services allowing you to schedule and monitor
scheduled activities, Drag job entries onto the Spoon canvas, or choose from a rich library of more than
200 pre-built steps to create a series of data integration processing instructions. [13]
Kitchen, Pan, and Carte: Use Pan to execute PDI transformations, which represent a data stream
through a set of independent tasks, Kitchen can orchestrate PDI jobs, which contain transformations and
other job entries as part of a larger business process. Use Carte to set up dedicated, remote PDI servers,
so you can coordinate jobs across a collection of clustered computers, and execute transformations within
a cluster of Carte cluster nodes. [13]
Plug-in and Command Line Utilities
PDI has hundreds of plug-in that can be accessed from the marketplace, but there are two plug-in that
are installed by default Interview and Agile BI. [13]
3.4 UML technology:
Unified Modeling Language (UML) is the industry standard language for describing, visualizing,
and documenting object-oriented (OO) systems. UML is a collection of a variety of diagrams for
differing purposes. Each type of diagram models a particular aspect of OO design in an easy to
understand, visual manner. The UML standard specifies exactly how the diagrams are to be drawn and
what each component in the diagram means. UML is not dependent on any particular programming
language, instead it focuses on the fundamental concepts and ideas that model a system. Using UML
enables anyone familiar with its specifications to instantly read and understand diagrams drawn by other
people. [14]
There are UML diagram for modeling static class relationships, dynamic temporal interactions
between objects, the usages of objects, the particulars of an implementation, and the state transitions of
systems. In general, a UML diagram consists of the following features:
21
1. Entities: These may be classes, objects, users or systems behaviors.
2. Relationship Lines: that models the relationships between entities in the system.
3. Generalization: a solid line with an arrow that points to higher abstraction of the present item.
4. Association: a solid line that represents that one entity uses another entity as part of its behavior.
5. Dependency: a dotted line with an arrowhead that shows some entity depends on the behavior of
another entity.
3.5 System Analysis:
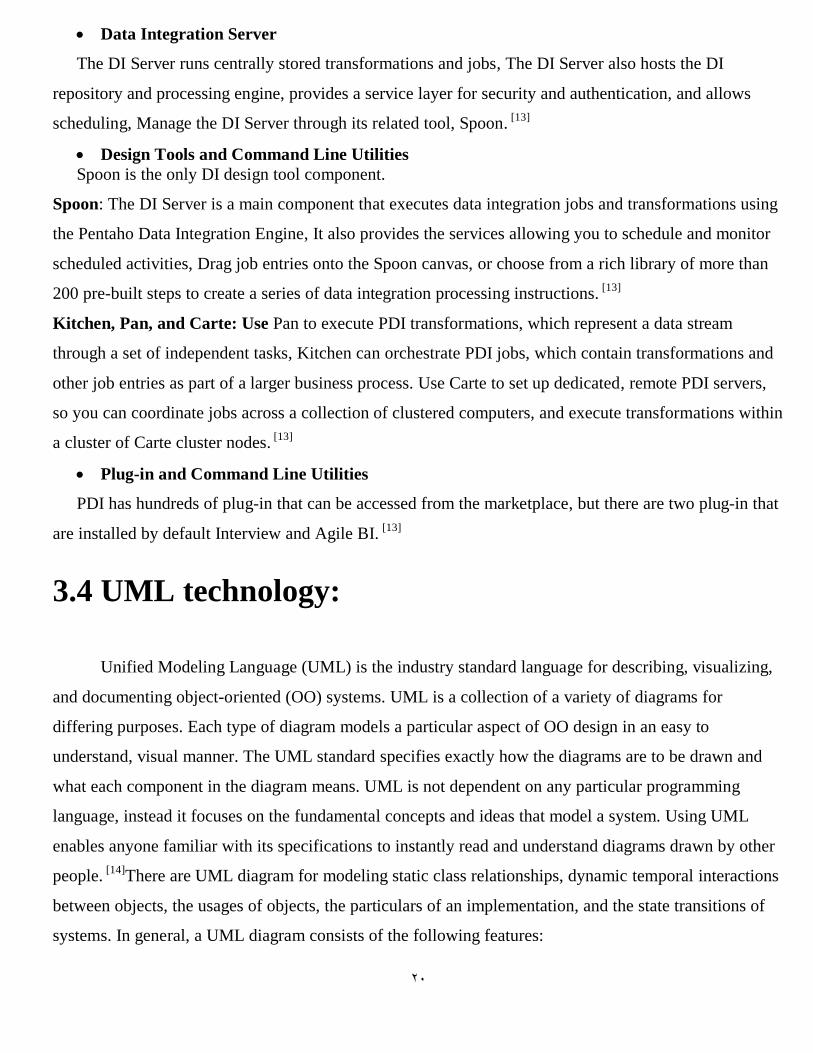
3.5.1 Use Case Diagram:
Figure (3. 7) Use Case Diagram for the system
22
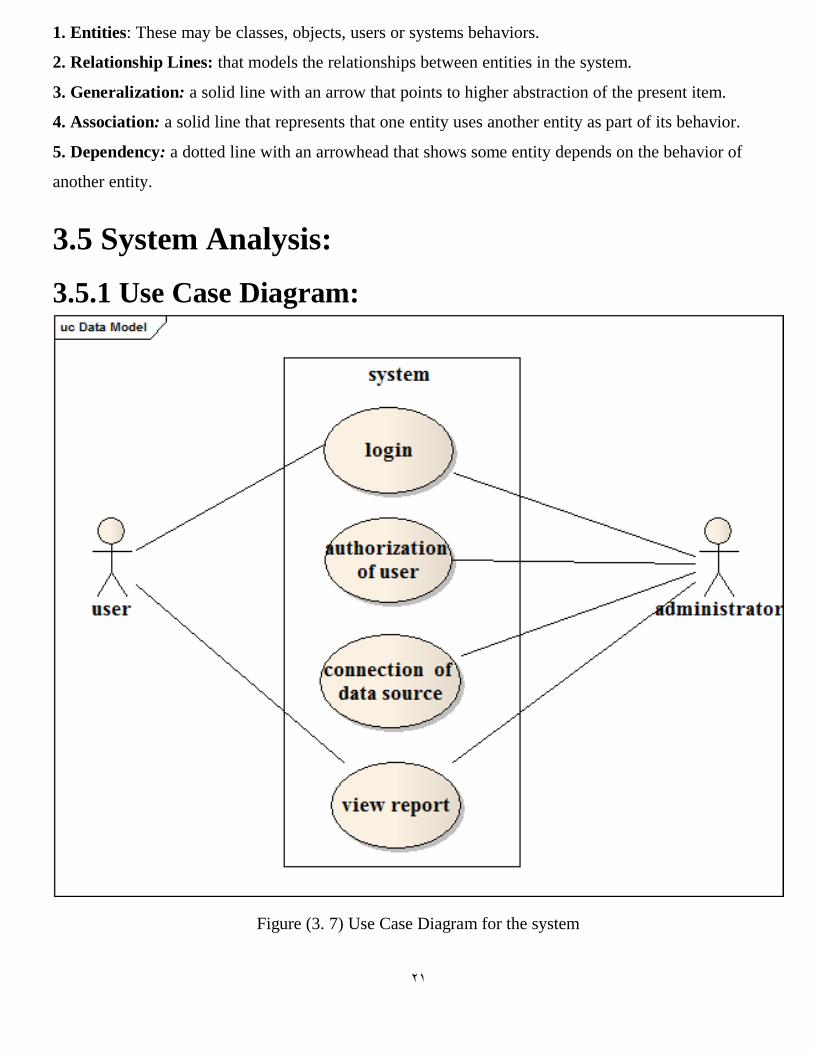
3.5.2 Sequence Diagram:
Figure (3. 8) Sequence Diagram for login user
23
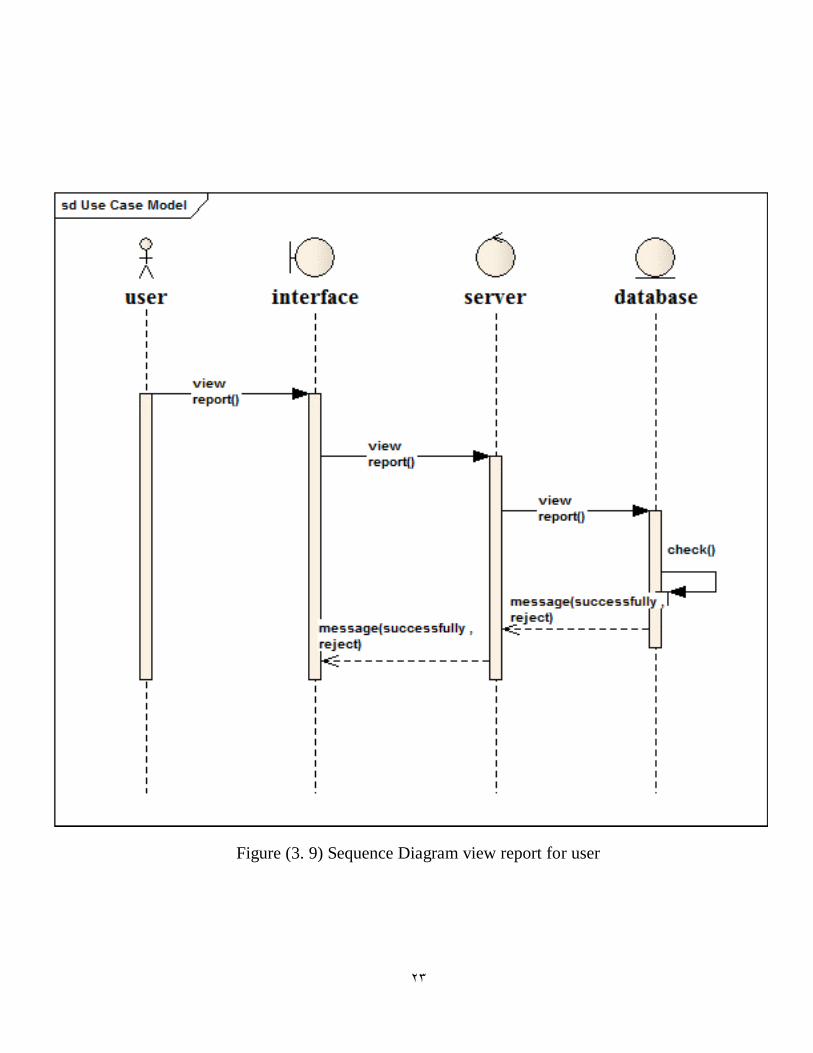
Figure (3. 9) Sequence Diagram view report for user
24
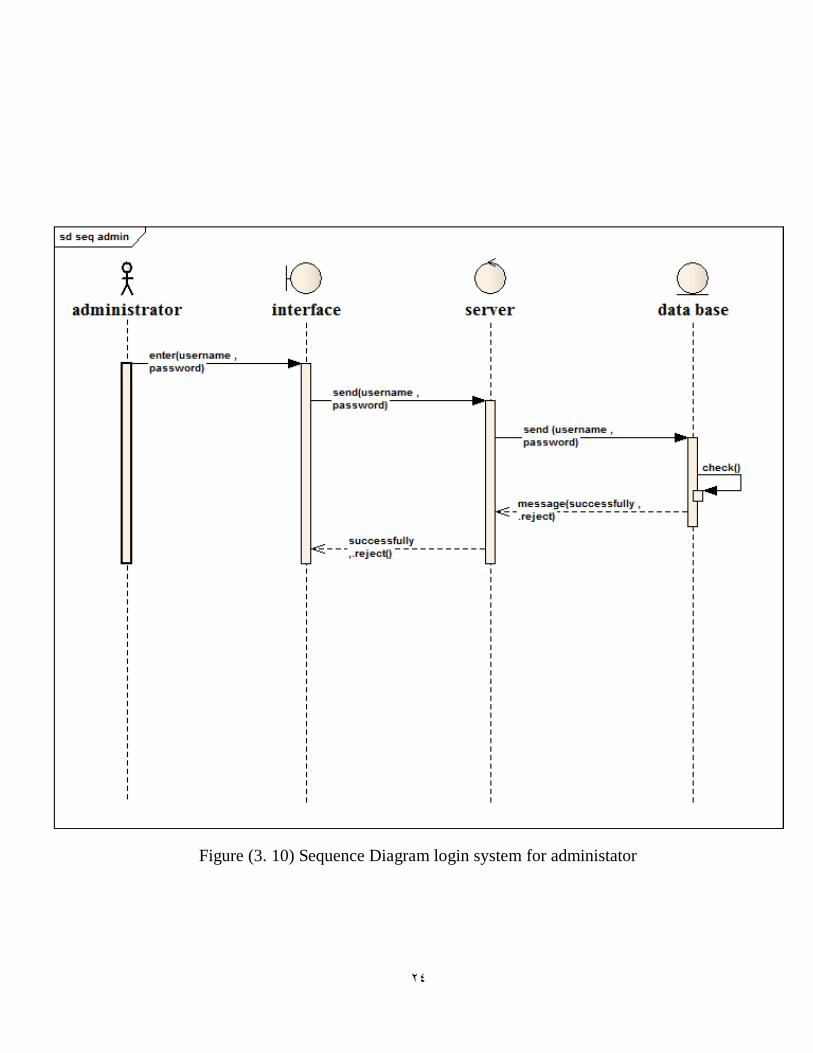
Figure (3. 10) Sequence Diagram login system for administator
25
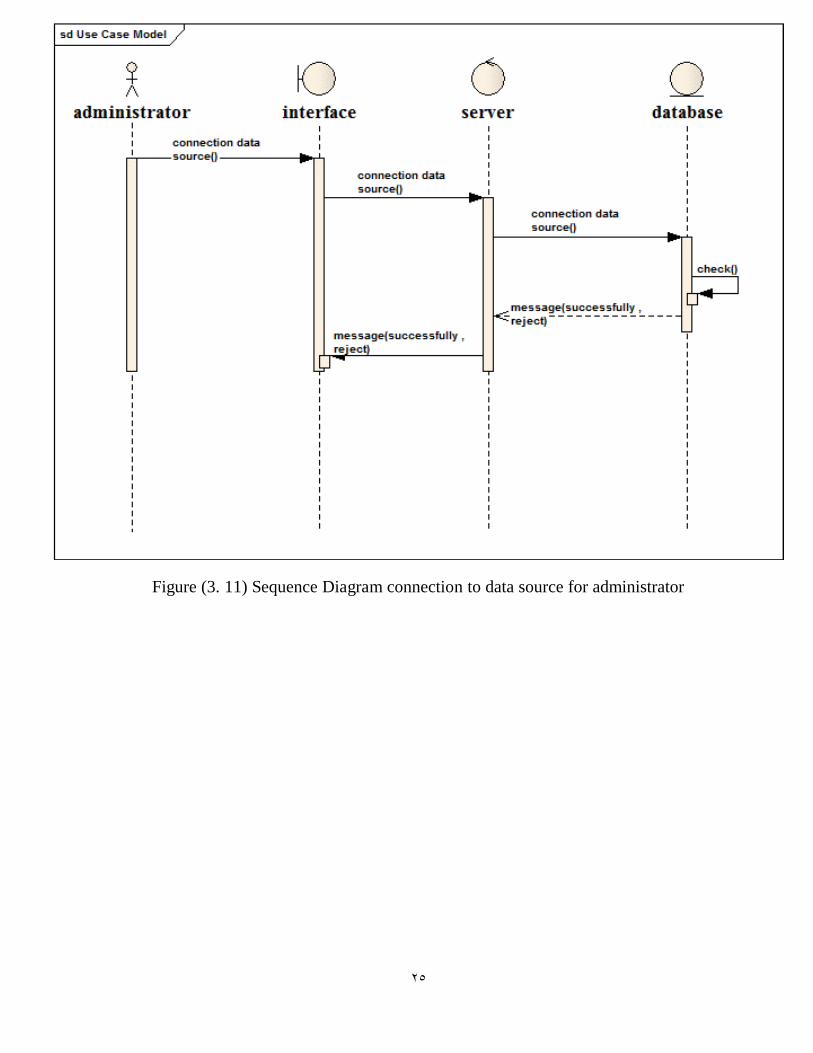
Figure (3. 11) Sequence Diagram connection to data source for administrator
26
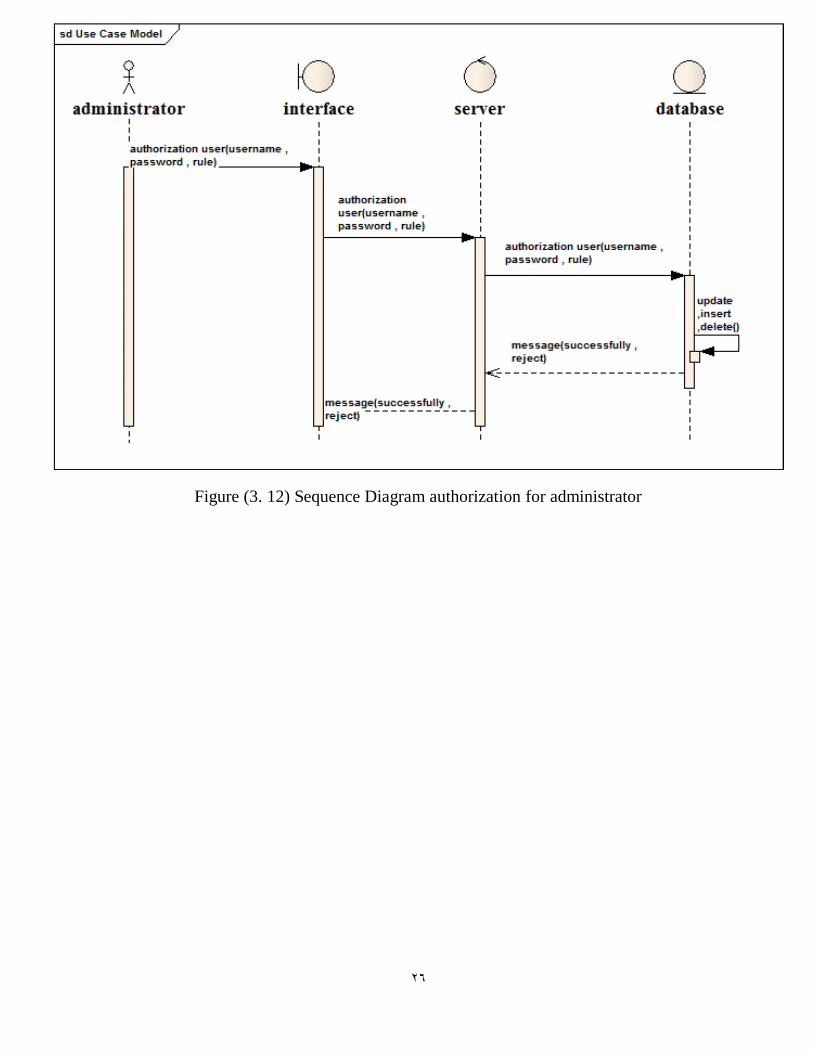
Figure (3. 12) Sequence Diagram authorization for administrator
27
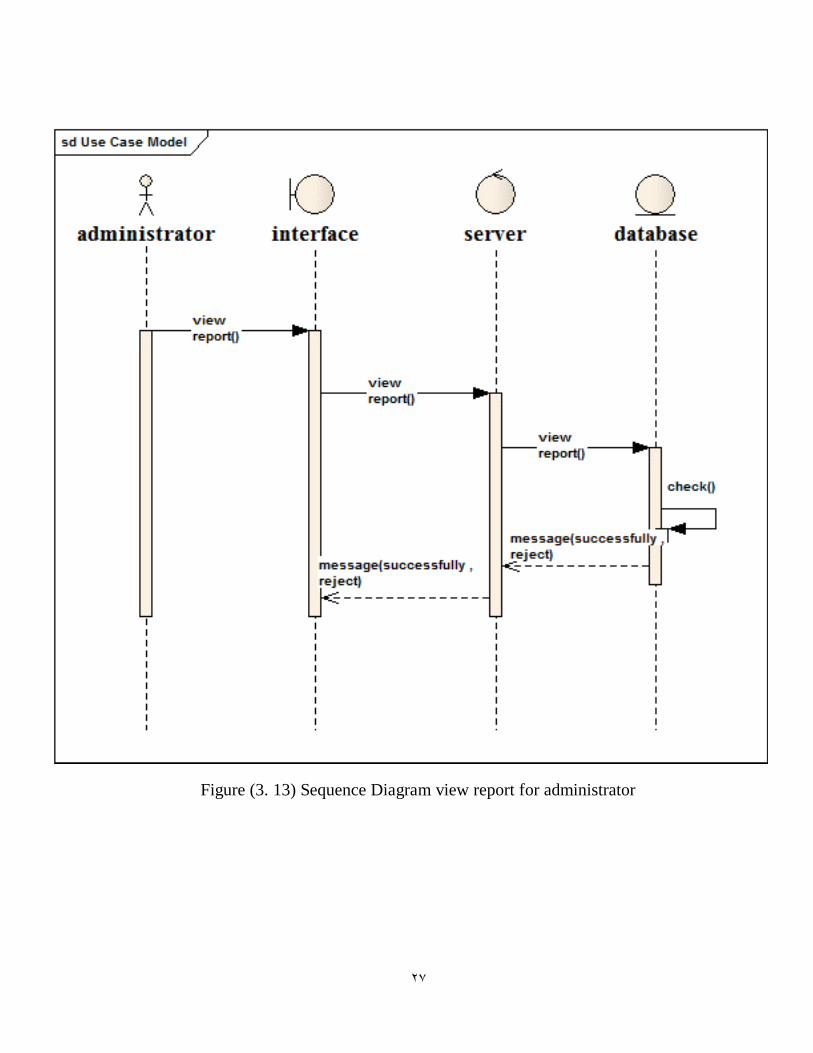
Figure (3. 13) Sequence Diagram view report for administrator
28
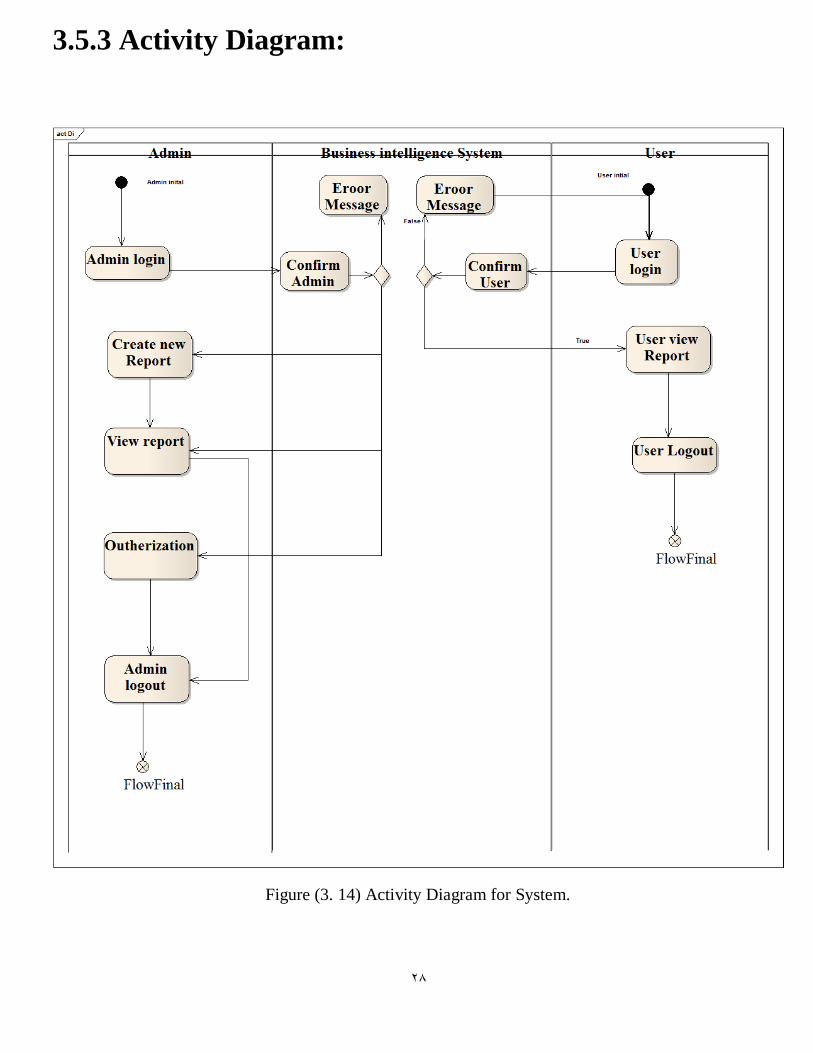
3.5.3 Activity Diagram:
Figure (3. 14) Activity Diagram for System.

29
CHAPTER 4
RESULTS AND DISCUSSION
31
4.1 Introduction:
This chapter is divided into two sections, the first section discusses the implementation of the
proposed system, and the second section discusses the final results of the system.
4.2 system implementation:
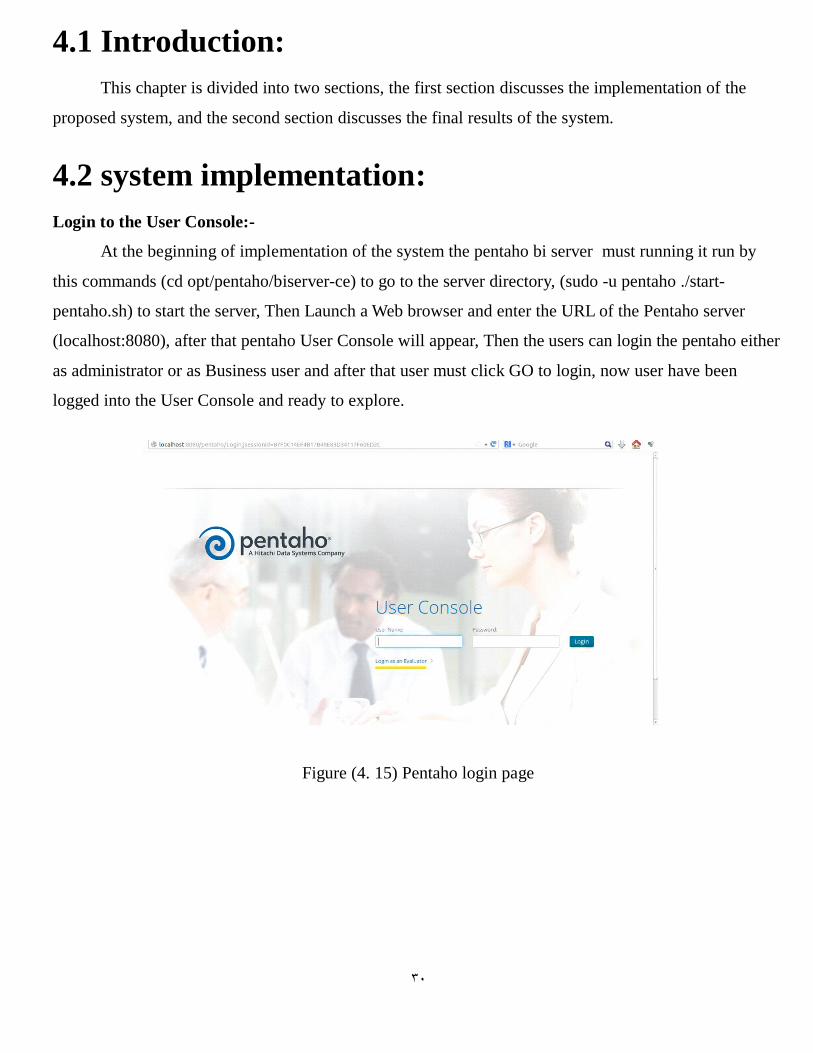
Login to the User Console:-
At the beginning of implementation of the system the pentaho bi server must running it run by
this commands (cd opt/pentaho/biserver-ce) to go to the server directory, (sudo -u pentaho ./start-
pentaho.sh) to start the server, Then Launch a Web browser and enter the URL of the Pentaho server
(localhost:8080), after that pentaho User Console will appear, Then the users can login the pentaho either
as administrator or as Business user and after that user must click GO to login, now user have been
logged into the User Console and ready to explore.
Figure (4. 15) Pentaho login page
31
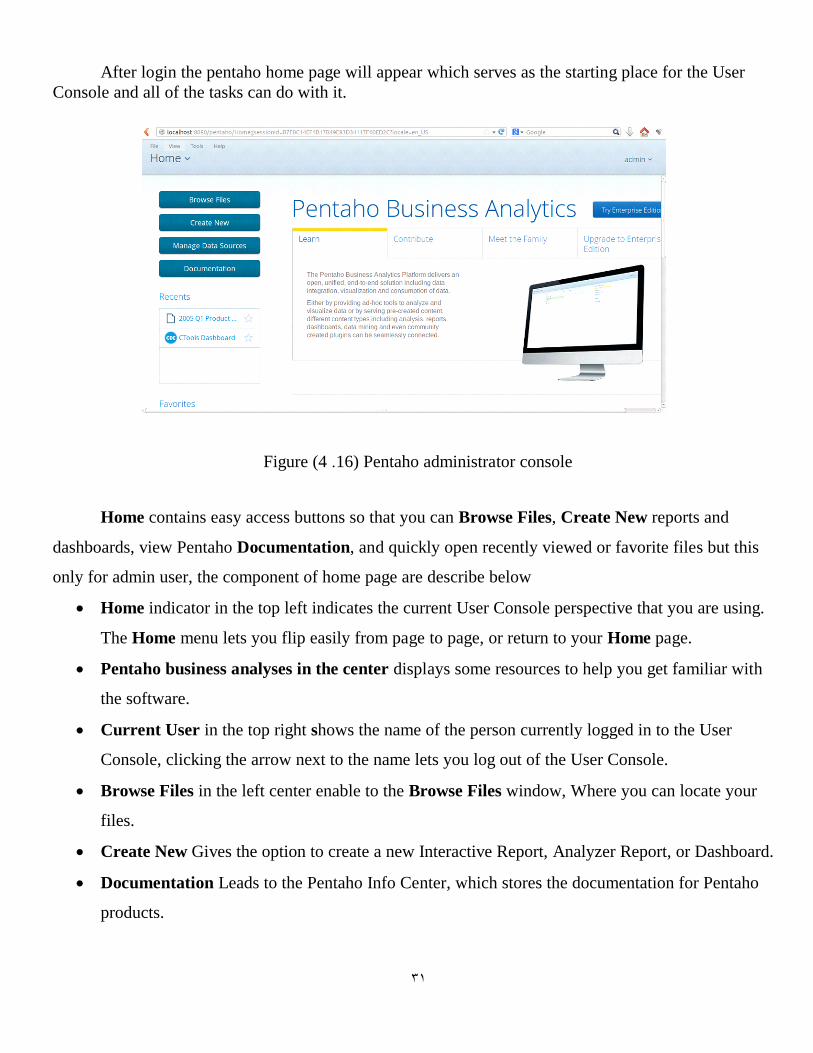
After login the pentaho home page will appear which serves as the starting place for the User
Console and all of the tasks can do with it.
Figure (4 .16) Pentaho administrator console
Home contains easy access buttons so that you can Browse Files, Create New reports and
dashboards, view Pentaho Documentation, and quickly open recently viewed or favorite files but this
only for admin user, the component of home page are describe below
Home indicator in the top left indicates the current User Console perspective that you are using.
The Home menu lets you flip easily from page to page, or return to your Home page.
Pentaho business analyses in the center displays some resources to help you get familiar with
the software.
Current User in the top right shows the name of the person currently logged in to the User
Console, clicking the arrow next to the name lets you log out of the User Console.
Browse Files in the left center enable to the Browse Files window, Where you can locate your
files.
Create New Gives the option to create a new Interactive Report, Analyzer Report, or Dashboard.
Documentation Leads to the Pentaho Info Center, which stores the documentation for Pentaho
products.
32
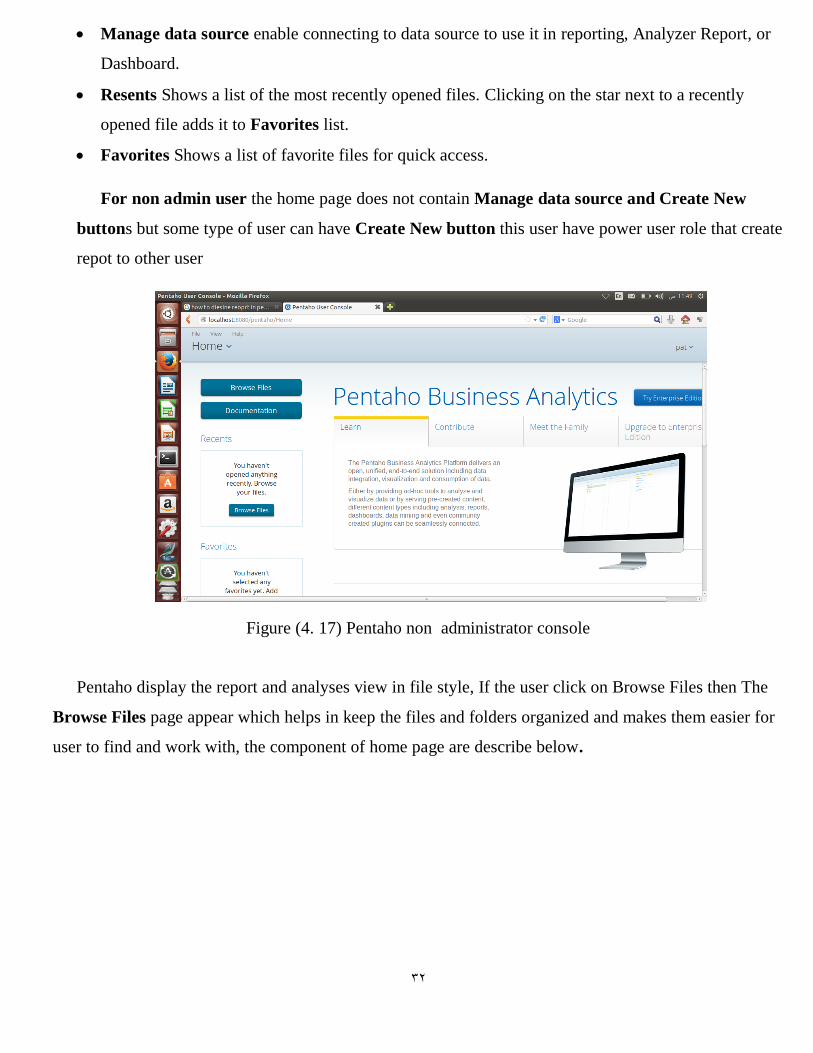
Manage data source enable connecting to data source to use it in reporting, Analyzer Report, or
Dashboard.
Resents Shows a list of the most recently opened files. Clicking on the star next to a recently
opened file adds it to Favorites list.
Favorites Shows a list of favorite files for quick access.
For non admin user the home page does not contain Manage data source and Create New
buttons but some type of user can have Create New button this user have power user role that create
repot to other user
Figure (4. 17) Pentaho non administrator console
Pentaho display the report and analyses view in file style, If the user click on Browse Files then The
Browse Files page appear which helps in keep the files and folders organized and makes them easier for
user to find and work with, the component of home page are describe below.
33
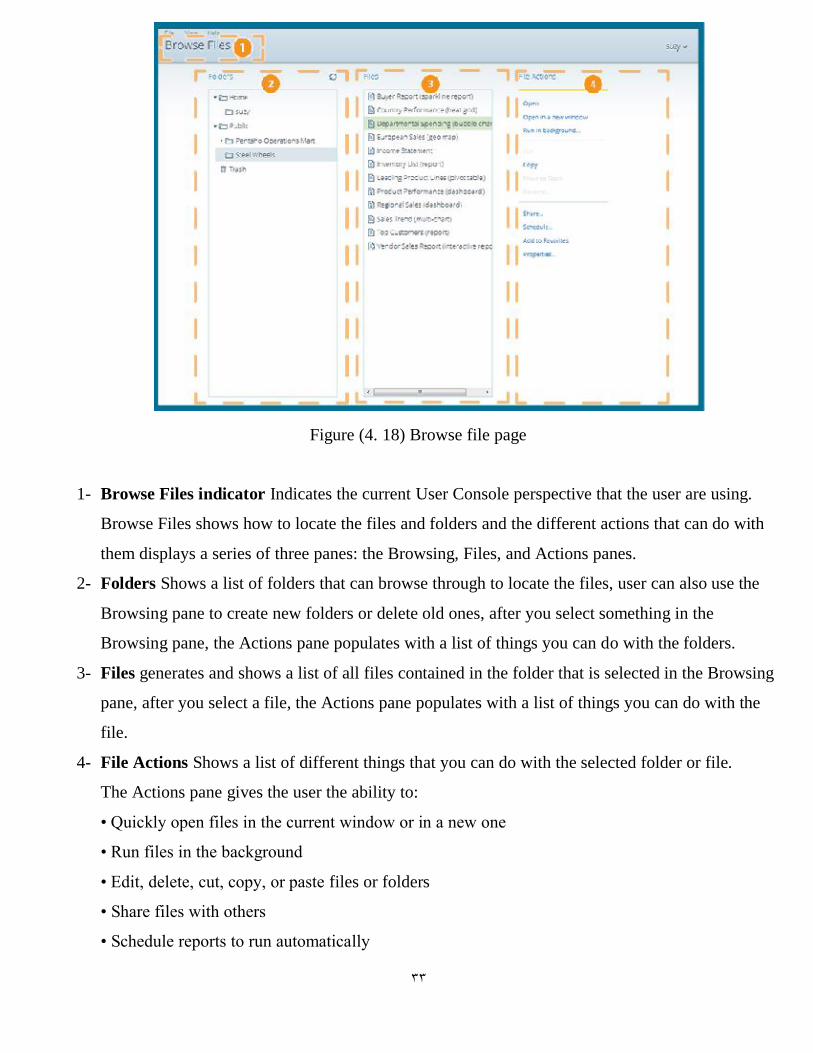
Figure (4. 18) Browse file page
1- Browse Files indicator Indicates the current User Console perspective that the user are using.
Browse Files shows how to locate the files and folders and the different actions that can do with
them displays a series of three panes: the Browsing, Files, and Actions panes.
2- Folders Shows a list of folders that can browse through to locate the files, user can also use the
Browsing pane to create new folders or delete old ones, after you select something in the
Browsing pane, the Actions pane populates with a list of things you can do with the folders.
3- Files generates and shows a list of all files contained in the folder that is selected in the Browsing
pane, after you select a file, the Actions pane populates with a list of things you can do with the
file.
4- File Actions Shows a list of different things that you can do with the selected folder or file.
The Actions pane gives the user the ability to:
• Quickly open files in the current window or in a new one
• Run files in the background
• Edit, delete, cut, copy, or paste files or folders
• Share files with others
• Schedule reports to run automatically
34
• Add files to your Favorites widget
• View the Properties of a file or folder
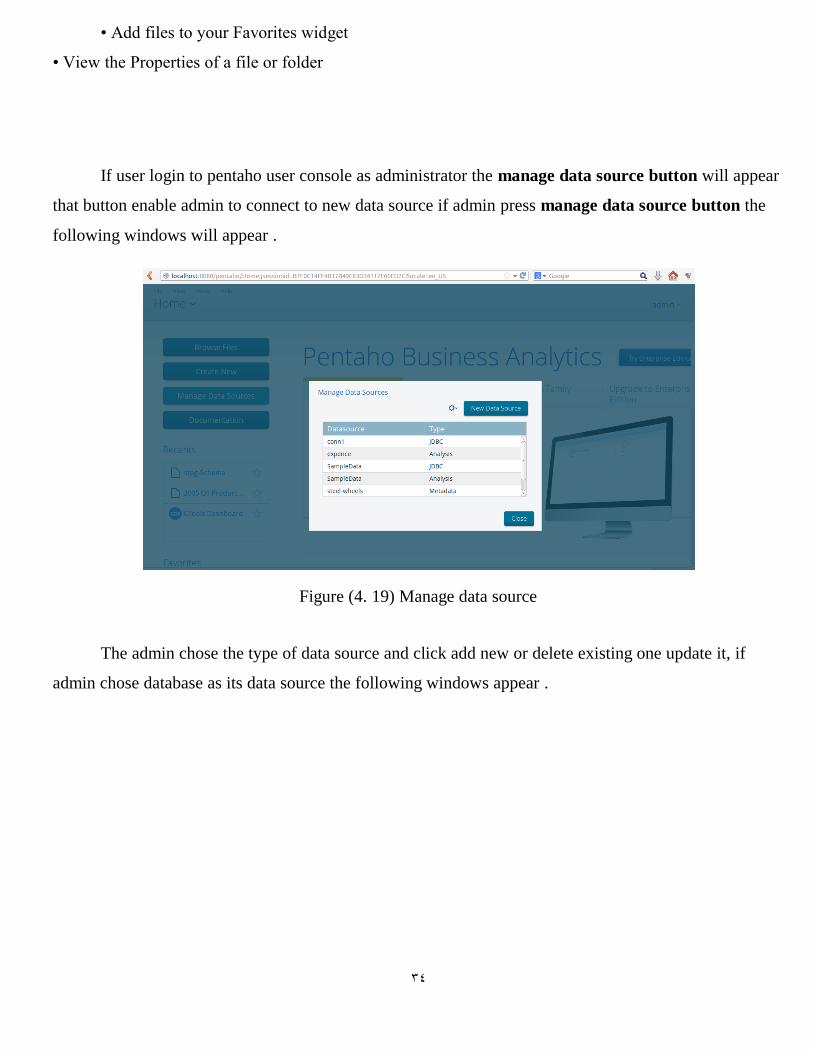
If user login to pentaho user console as administrator the manage data source button will appear
that button enable admin to connect to new data source if admin press manage data source button the
following windows will appear .
Figure (4. 19) Manage data source
The admin chose the type of data source and click add new or delete existing one update it, if
admin chose database as its data source the following windows appear .
35
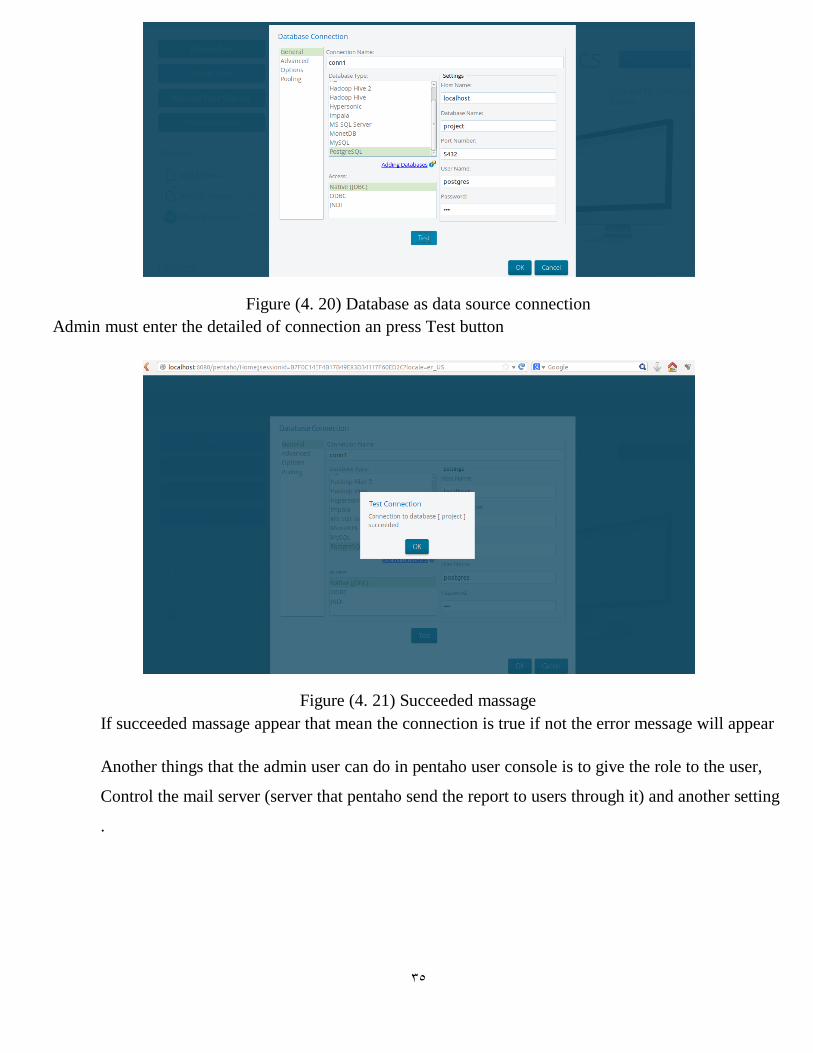
Figure (4. 20) Database as data source connection
Admin must enter the detailed of connection an press Test button
Figure (4. 21) Succeeded massage
If succeeded massage appear that mean the connection is true if not the error message will appear
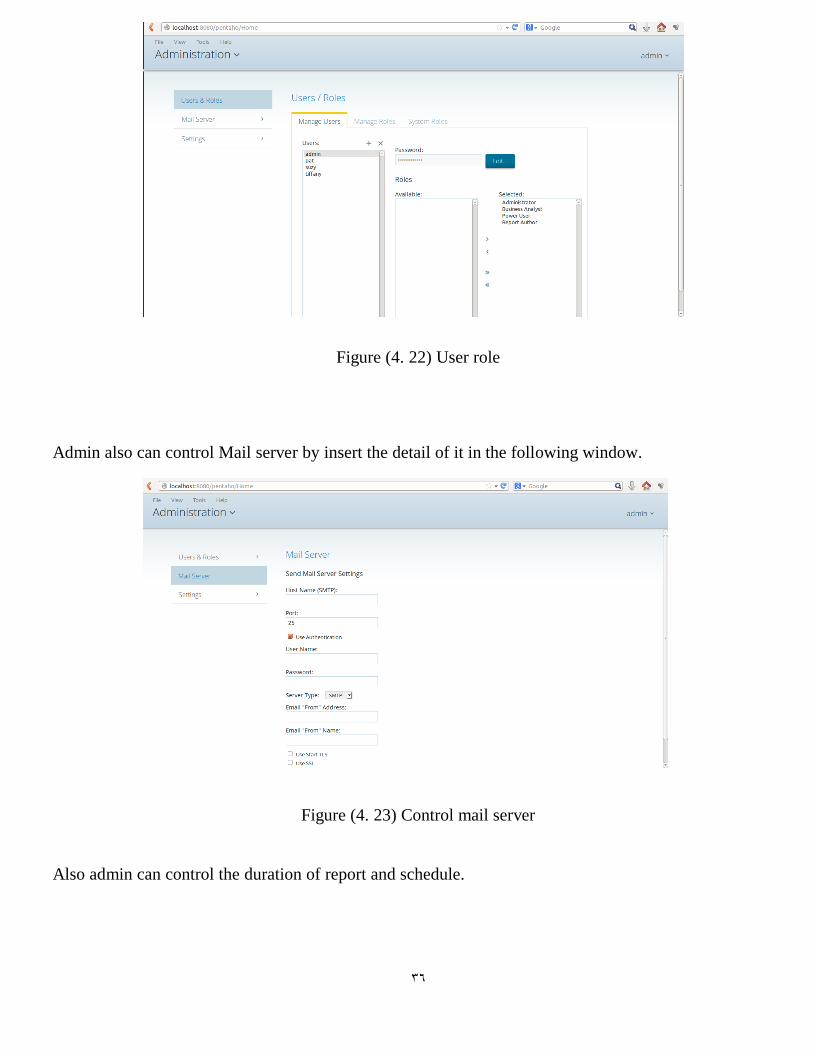
Another things that the admin user can do in pentaho user console is to give the role to the user,
Control the mail server (server that pentaho send the report to users through it) and another setting
.
36
Figure (4. 22) User role
Admin also can control Mail server by insert the detail of it in the following window.
Figure (4. 23) Control mail server
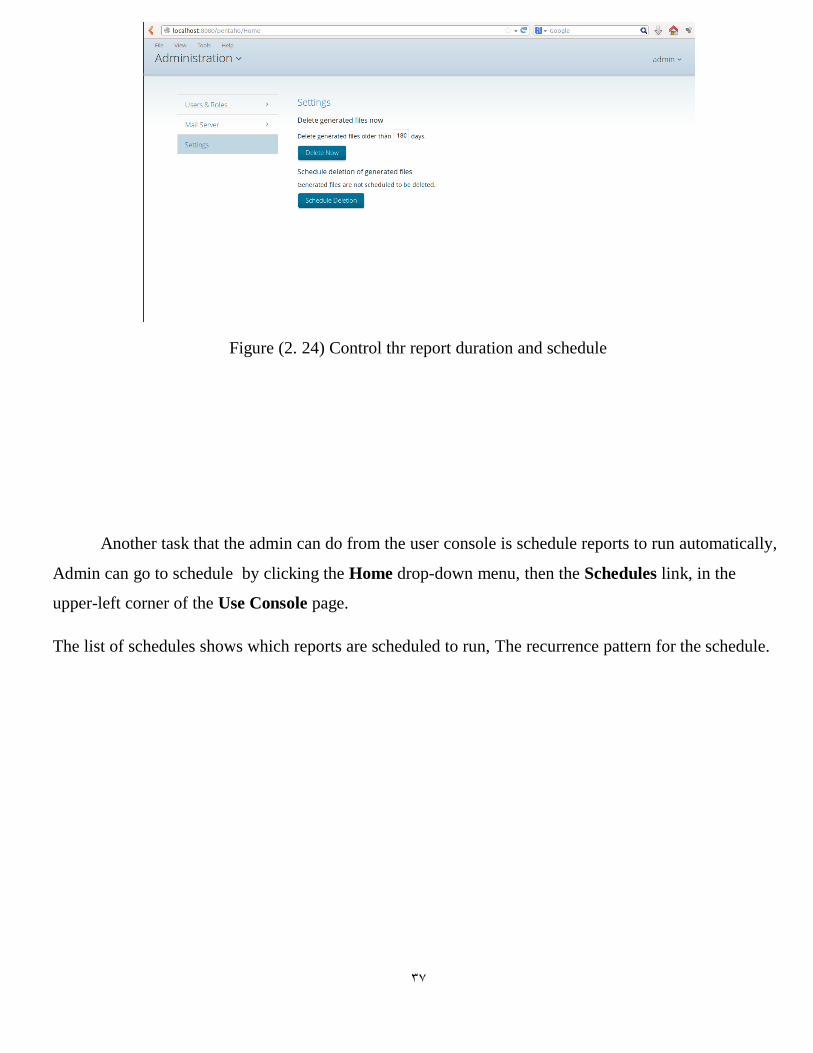
Also admin can control the duration of report and schedule.
37
Figure (2. 24) Control thr report duration and schedule
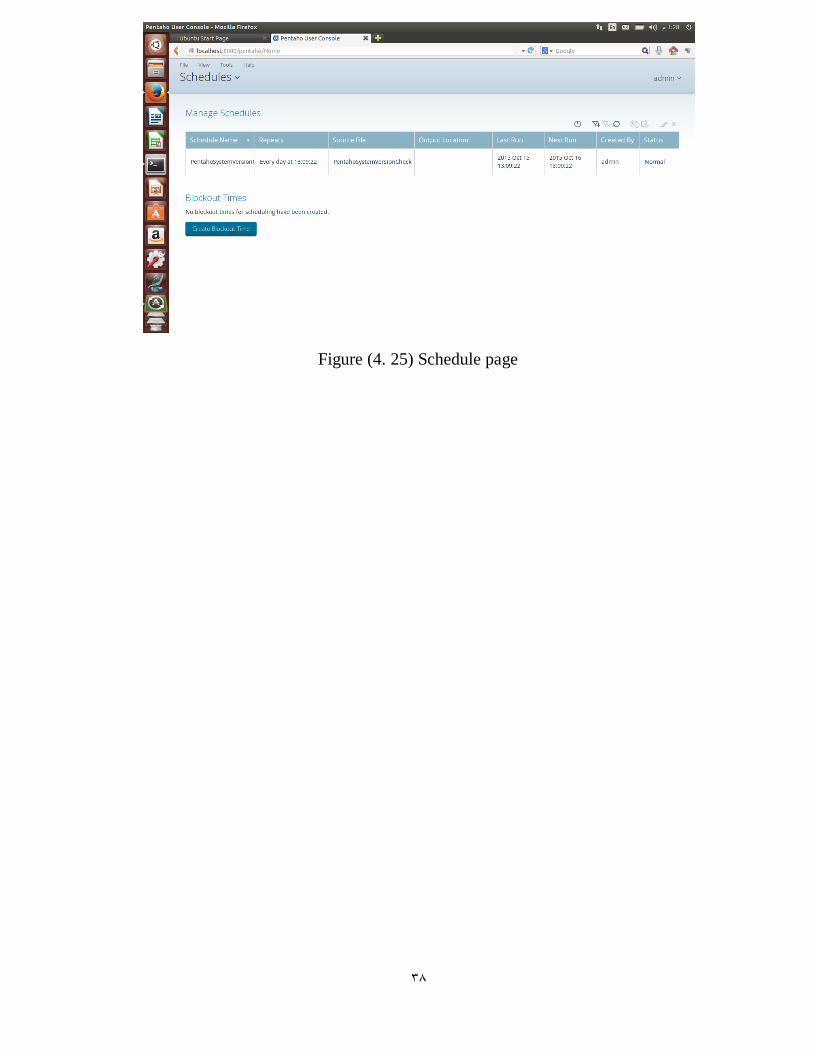
Another task that the admin can do from the user console is schedule reports to run automatically,
Admin can go to schedule by clicking the Home drop-down menu, then the Schedules link, in the
upper-left corner of the Use Console page.
The list of schedules shows which reports are scheduled to run, The recurrence pattern for the schedule.
38
Figure (4. 25) Schedule page
39
4.3 The Result:
This system has been applied on two companies of the Sudanese electricity companies its
Sudanese electricity distribution company (SEDC), and the Sudanese thermal production company
(STPC), it was applied specifically on accounting data, have been reached to the following result:
Produce reports showing status of the two companies' accounts state during all time periods,
where they help the Ministry of Electricity and Dams to show the accounting performance of the
two companies, and provide them with General vision to develop a summary vision of accounts in
these companies.
Produce reports provide information that help in decision-making.
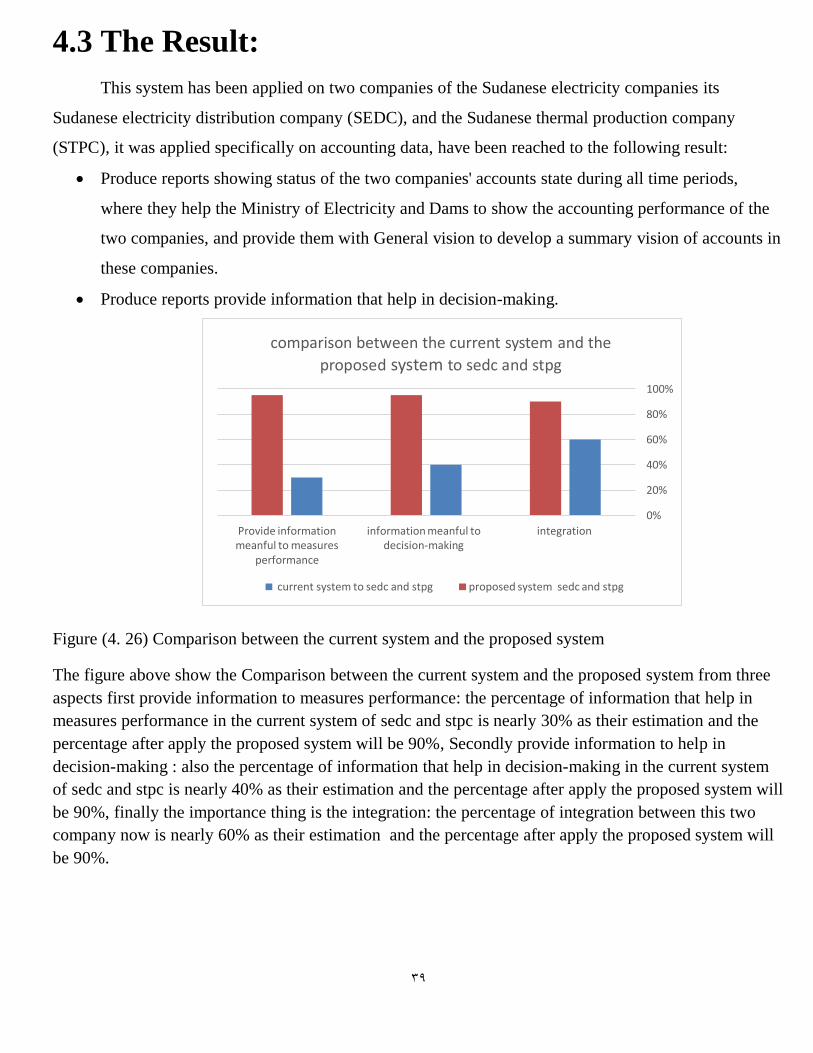
Figure (4. 26) Comparison between the current system and the proposed system
The figure above show the Comparison between the current system and the proposed system from three
aspects first provide information to measures performance: the percentage of information that help in
measures performance in the current system of sedc and stpc is nearly 30% as their estimation and the
percentage after apply the proposed system will be 90%, Secondly provide information to help in
decision-making : also the percentage of information that help in decision-making in the current system
of sedc and stpc is nearly 40% as their estimation and the percentage after apply the proposed system will
be 90%, finally the importance thing is the integration: the percentage of integration between this two
company now is nearly 60% as their estimation and the percentage after apply the proposed system will
be 90%.
0%
20%
40%
60%
80%
100%
integration information meanful to decision-making
Provide information meanful to measures
performance
comparison between the current system and the
proposed system to sedc and stpg
current system to sedc and stpg proposed system sedc and stpg

41
CHAPTER 5
CONCLUSION AND RECOMMENDATIONS
41
5.1 Conclusion:
Praise of God we were able to provide search that help in applied the business intelligence (BI) in
accounting data for Sudanese Distribution Electricity Company (SEDC) and Sudanese Thermal
Producing Company (STPC) help in give comprehensive overview of the executive manager and the
Ministry of Electricity and Dams of the conditions of companies and provide reports that support the
decision-making process.
5.2 Recommendations:
To make this system more valuable and provide attractive value it is recommend doing some tasks:
Do integration between all parts of the Electricity Sudanese Company, namely: (Sudanese
Electricity Distribution Company, Sudanese company to generate water, Sudanese company for
thermal generation, Sudanese Transport Company, Merowe Dam).
Work in all type of data not only accounting data.
Apply all Business Intelligence Features like dashboard that depend on determine the key
performance indicator to measure the performance.
42
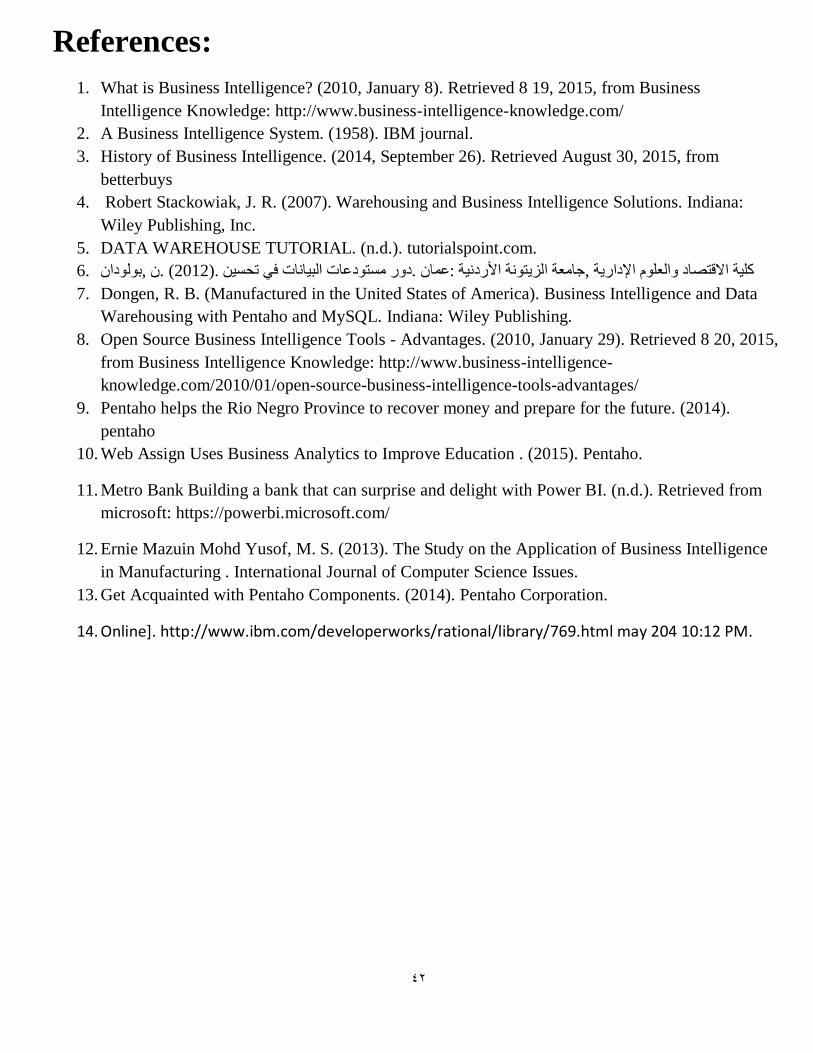
References:
1. What is Business Intelligence? (2010, January 8). Retrieved 8 19, 2015, from Business
Intelligence Knowledge: http://www.business-intelligence-knowledge.com/
2. A Business Intelligence System. (1958). IBM journal.
3. History of Business Intelligence. (2014, September 26). Retrieved August 30, 2015, from
betterbuys
4. Robert Stackowiak, J. R. (2007). Warehousing and Business Intelligence Solutions. Indiana:
Wiley Publishing, Inc.
5. DATA WAREHOUSE TUTORIAL. (n.d.). tutorialspoint.com.
ت البيانات في تحسيندور مستودعا .(2012) .ن ,بولودان .6 كلية االقتصاد والعلوم اإلدارية ,جامعة الزيتونة األردنية :عمان .
7. Dongen, R. B. (Manufactured in the United States of America). Business Intelligence and Data
Warehousing with Pentaho and MySQL. Indiana: Wiley Publishing.
8. Open Source Business Intelligence Tools - Advantages. (2010, January 29). Retrieved 8 20, 2015,
from Business Intelligence Knowledge: http://www.business-intelligence-
knowledge.com/2010/01/open-source-business-intelligence-tools-advantages/
9. Pentaho helps the Rio Negro Province to recover money and prepare for the future. (2014).
pentaho
10. Web Assign Uses Business Analytics to Improve Education . (2015). Pentaho.
11. Metro Bank Building a bank that can surprise and delight with Power BI. (n.d.). Retrieved from
microsoft: https://powerbi.microsoft.com/
12. Ernie Mazuin Mohd Yusof, M. S. (2013). The Study on the Application of Business Intelligence
in Manufacturing . International Journal of Computer Science Issues.
13. Get Acquainted with Pentaho Components. (2014). Pentaho Corporation.
14. Online]. http://www.ibm.com/developerworks/rational/library/769.html may 204 10:12 PM.
43
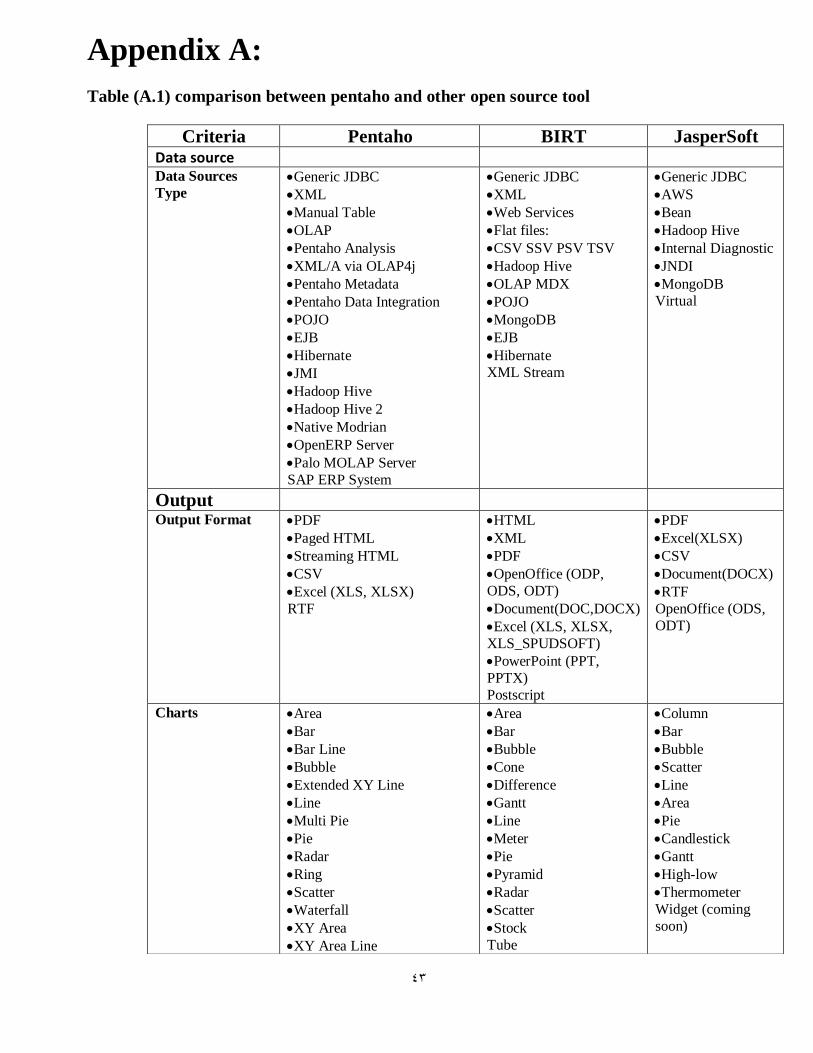
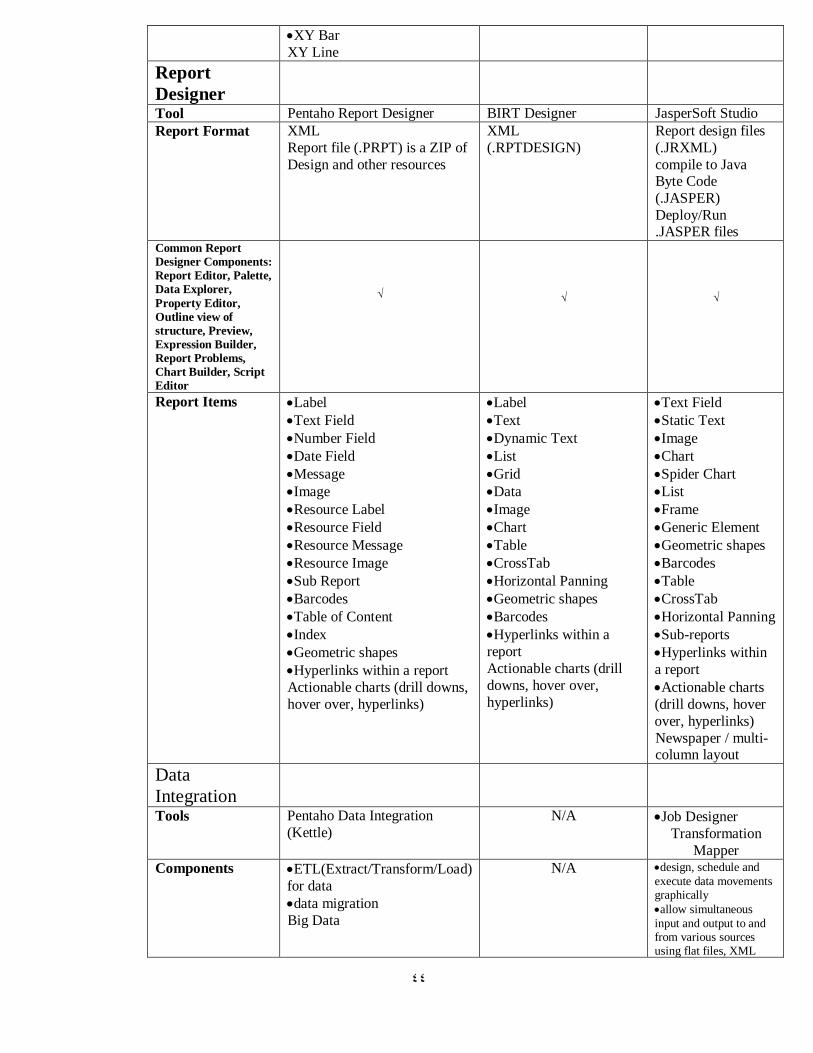
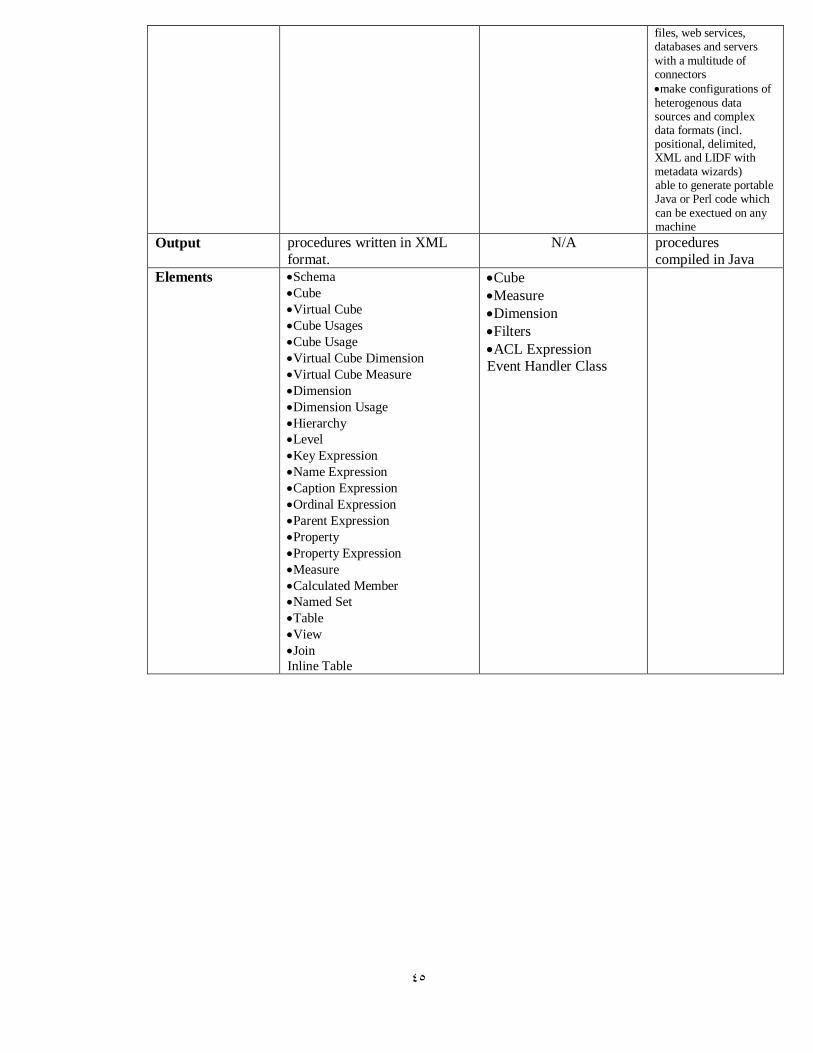
Appendix A:
Table (A.1) comparison between pentaho and other open source tool
JasperSoft BIRT Pentaho Criteria Data source
Generic JDBC
AWS
Bean
Hadoop Hive
Internal Diagnostic
JNDI
MongoDB
Virtual
Generic JDBC
XML
Web Services
Flat files:
CSV SSV PSV TSV
Hadoop Hive
OLAP MDX
POJO
MongoDB
EJB
Hibernate
XML Stream
Generic JDBC
XML
Manual Table
OLAP
Pentaho Analysis
XML/A via OLAP4j
Pentaho Metadata
Pentaho Data Integration
POJO
EJB
Hibernate
JMI
Hadoop Hive
Hadoop Hive 2
Native Modrian
OpenERP Server
Palo MOLAP Server
SAP ERP System
Data Sources
Type
Output PDF
Excel(XLSX)
CSV
Document(DOCX)
RTF
OpenOffice (ODS,
ODT)
HTML
XML
OpenOffice (ODP,
ODS, ODT)
Document(DOC,DOCX)
Excel (XLS, XLSX,
XLS_SPUDSOFT)
PowerPoint (PPT,
PPTX)
Postscript
Paged HTML
Streaming HTML
CSV
Excel (XLS, XLSX)
RTF
Output Format
Column
Bar
Bubble
Scatter
Line
Area
Pie
Candlestick
Gantt
High-low
Thermometer
Widget (coming
soon)
Area
Bar
Bubble
Cone
Difference
Gantt
Line
Meter
Pie
Pyramid
Radar
Scatter
Stock
Tube
Area
Bar
Bar Line
Bubble
Extended XY Line
Line
Multi Pie
Pie
Radar
Ring
Scatter
Waterfall
XY Area
XY Area Line
Charts
44
XY Bar
XY Line
Report
Designer JasperSoft Studio BIRT Designer Pentaho Report Designer Tool
Report design files
(.JRXML)
compile to Java Byte Code
(.JASPER)
Deploy/Run .JASPER files
XML
(.RPTDESIGN) XML
Report file (.PRPT) is a ZIP of
Design and other resources
Report Format
√
√
√
Common Report
Designer Components:
Report Editor, Palette,
Data Explorer,
Property Editor,
Outline view of
structure, Preview,
Expression Builder,
Report Problems,
Chart Builder, Script
Editor
Text Field
Static Text
Image
Chart
Spider Chart
List
Frame
Generic Element
Geometric shapes
Barcodes
Table
CrossTab
Horizontal Panning
Sub-reports
Hyperlinks within
a report
Actionable charts
(drill downs, hover
over, hyperlinks)
Newspaper / multi-column layout
Label
Text
Dynamic Text
List
Grid
Data
Image
Chart
Table
CrossTab
Horizontal Panning
Geometric shapes
Barcodes
Hyperlinks within a
report
Actionable charts (drill
downs, hover over,
hyperlinks)
Label
Text Field
Number Field
Date Field
Message
Image
Resource Label
Resource Field
Resource Message
Resource Image
Sub Report
Barcodes
Table of Content
Index
Geometric shapes
Hyperlinks within a report
Actionable charts (drill downs,
hover over, hyperlinks)
Report Items
Data
Integration Job Designer
Transformation
Mapper
N/A
Pentaho Data Integration
(Kettle)
Tools
design, schedule and
execute data movements graphically
allow simultaneous
input and output to and from various sources using flat files, XML
N/A
ETL(Extract/Transform/Load)
for data
data migration
Big Data
Components
45
files, web services, databases and servers
with a multitude of connectors
make configurations of
heterogenous data sources and complex data formats (incl. positional, delimited, XML and LIDF with metadata wizards) able to generate portable Java or Perl code which
can be exectued on any machine
procedures
compiled in Java N/A
procedures written in XML
format. Output
Cube
Measure
Dimension
Filters
ACL Expression
Event Handler Class
Schema
Cube
Virtual Cube
Cube Usages
Cube Usage
Virtual Cube Dimension
Virtual Cube Measure
Dimension
Dimension Usage
Hierarchy
Level
Key Expression
Name Expression
Caption Expression
Ordinal Expression
Parent Expression
Property
Property Expression
Measure
Calculated Member
Named Set
Table
View
Join
Inline Table
Elements