Embed Size (px)
Citation preview
DEMARK.RTF DeMark Studies 12/19/96 Page 1 of 45
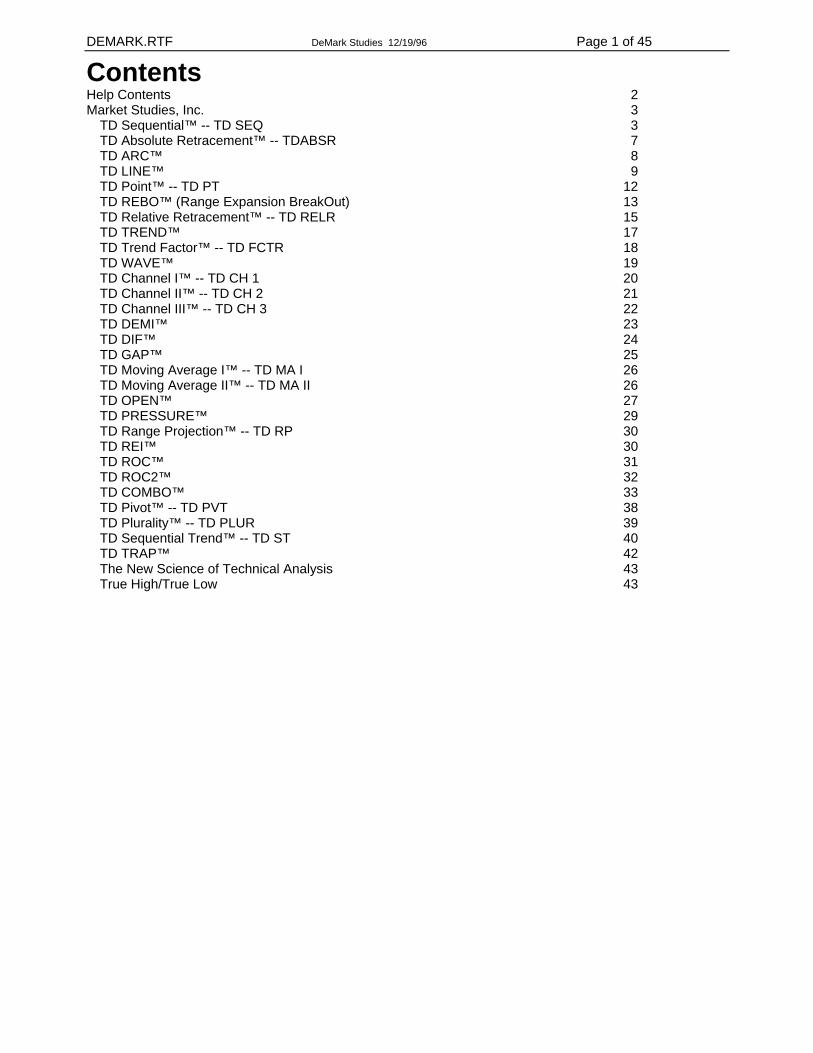
Contents Help Contents 2 Market Studies, Inc. 3
TD Sequential™ -- TD SEQ 3 TD Absolute Retracement™ -- TDABSR 7 TD ARC™ 8 TD LINE™ 9 TD Point™ -- TD PT 12 TD REBO™ (Range Expansion BreakOut) 13 TD Relative Retracement™ -- TD RELR 15 TD TREND™ 17 TD Trend Factor™ -- TD FCTR 18 TD WAVE™ 19 TD Channel I™ -- TD CH 1 20 TD Channel II™ -- TD CH 2 21 TD Channel III™ -- TD CH 3 22 TD DEMI™ 23 TD DIF™ 24 TD GAP™ 25 TD Moving Average I™ -- TD MA I 26 TD Moving Average II™ -- TD MA II 26 TD OPEN™ 27 TD PRESSURE™ 29 TD Range Projection™ -- TD RP 30 TD REI™ 30 TD ROC™ 31 TD ROC2™ 32 TD COMBO™ 33 TD Pivot™ -- TD PVT 38 TD Plurality™ -- TD PLUR 39 TD Sequential Trend™ -- TD ST 40 TD TRAP™ 42 The New Science of Technical Analysis 43 True High/True Low 43
DEMARK.RTF DeMark Studies 12/19/96 Page 2 of 45
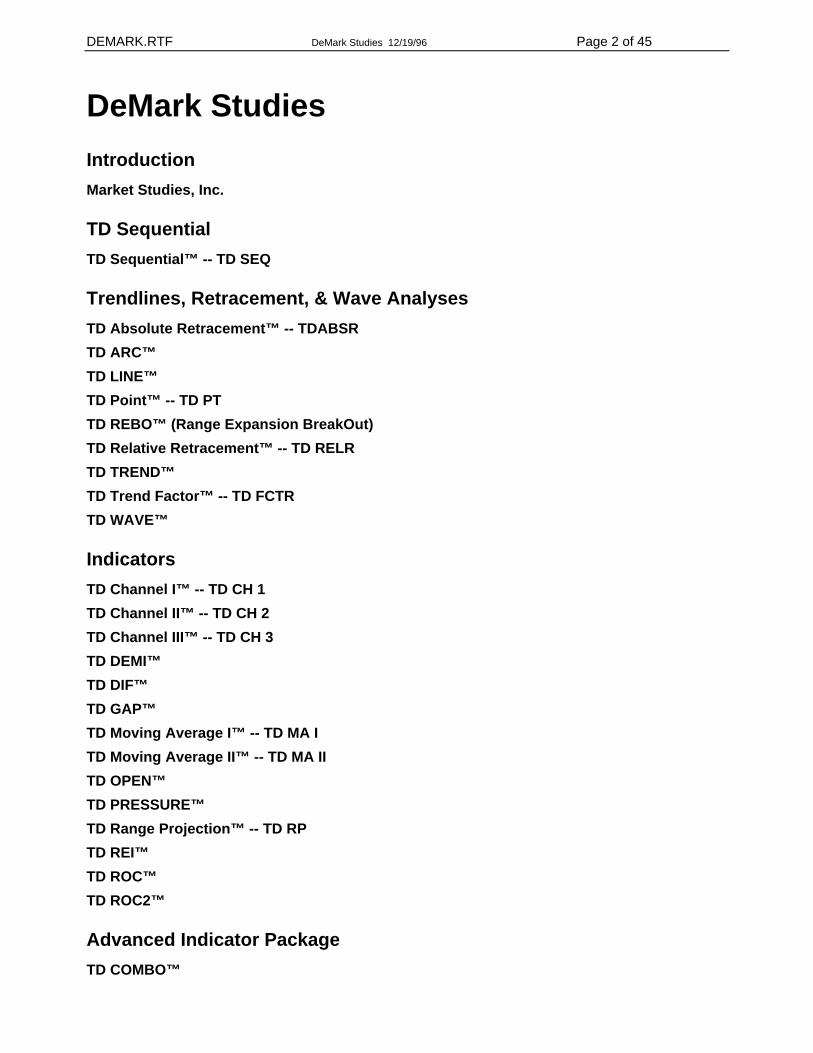
DeMark Studies Introduction Market Studies, Inc.
TD Sequential TD Sequential™ -- TD SEQ
Trendlines, Retracement, & Wave Analyses TD Absolute Retracement™ -- TDABSR TD ARC™ TD LINE™ TD Point™ -- TD PT TD REBO™ (Range Expansion BreakOut) TD Relative Retracement™ -- TD RELR TD TREND™ TD Trend Factor™ -- TD FCTR TD WAVE™
Indicators TD Channel I™ -- TD CH 1 TD Channel II™ -- TD CH 2 TD Channel III™ -- TD CH 3 TD DEMI™ TD DIF™ TD GAP™ TD Moving Average I™ -- TD MA I TD Moving Average II™ -- TD MA II TD OPEN™ TD PRESSURE™ TD Range Projection™ -- TD RP TD REI™ TD ROC™ TD ROC2™
Advanced Indicator Package TD COMBO™
DEMARK.RTF DeMark Studies 12/19/96 Page 3 of 45
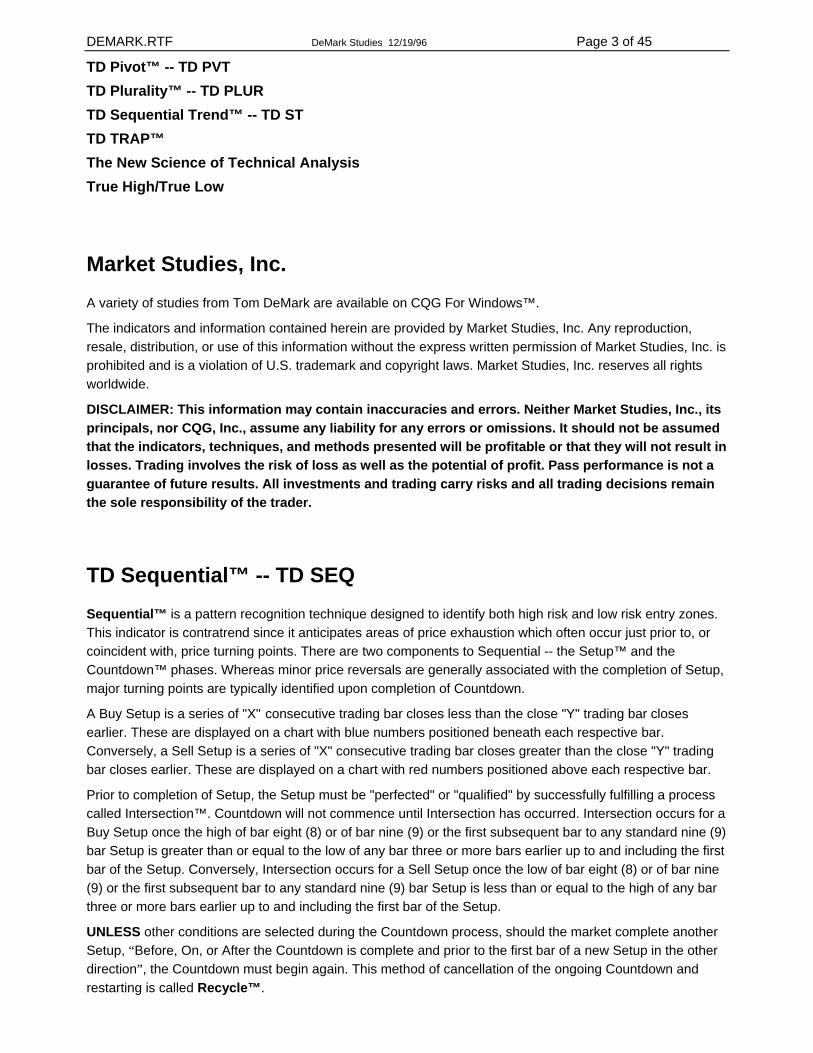
TD Pivot™ -- TD PVT TD Plurality™ -- TD PLUR TD Sequential Trend™ -- TD ST TD TRAP™ The New Science of Technical Analysis True High/True Low
Market Studies, Inc. A variety of studies from Tom DeMark are available on CQG For Windows™.
The indicators and information contained herein are provided by Market Studies, Inc. Any reproduction, resale, distribution, or use of this information without the express written permission of Market Studies, Inc. is prohibited and is a violation of U.S. trademark and copyright laws. Market Studies, Inc. reserves all rights worldwide.
DISCLAIMER: This information may contain inaccuracies and errors. Neither Market Studies, Inc., its principals, nor CQG, Inc., assume any liability for any errors or omissions. It should not be assumed that the indicators, techniques, and methods presented will be profitable or that they will not result in losses. Trading involves the risk of loss as well as the potential of profit. Pass performance is not a guarantee of future results. All investments and trading carry risks and all trading decisions remain the sole responsibility of the trader.
TD Sequential™ -- TD SEQ Sequential™ is a pattern recognition technique designed to identify both high risk and low risk entry zones. This indicator is contratrend since it anticipates areas of price exhaustion which often occur just prior to, or coincident with, price turning points. There are two components to Sequential -- the Setup™ and the Countdown™ phases. Whereas minor price reversals are generally associated with the completion of Setup, major turning points are typically identified upon completion of Countdown.
A Buy Setup is a series of "X" consecutive trading bar closes less than the close "Y" trading bar closes earlier. These are displayed on a chart with blue numbers positioned beneath each respective bar. Conversely, a Sell Setup is a series of "X" consecutive trading bar closes greater than the close "Y" trading bar closes earlier. These are displayed on a chart with red numbers positioned above each respective bar.
Prior to completion of Setup, the Setup must be "perfected" or "qualified" by successfully fulfilling a process called Intersection™. Countdown will not commence until Intersection has occurred. Intersection occurs for a Buy Setup once the high of bar eight (8) or of bar nine (9) or the first subsequent bar to any standard nine (9) bar Setup is greater than or equal to the low of any bar three or more bars earlier up to and including the first bar of the Setup. Conversely, Intersection occurs for a Sell Setup once the low of bar eight (8) or of bar nine (9) or the first subsequent bar to any standard nine (9) bar Setup is less than or equal to the high of any bar three or more bars earlier up to and including the first bar of the Setup.
UNLESS other conditions are selected during the Countdown process, should the market complete another Setup, “Before, On, or After the Countdown is complete and prior to the first bar of a new Setup in the other direction”, the Countdown must begin again. This method of cancellation of the ongoing Countdown and restarting is called Recycle™.
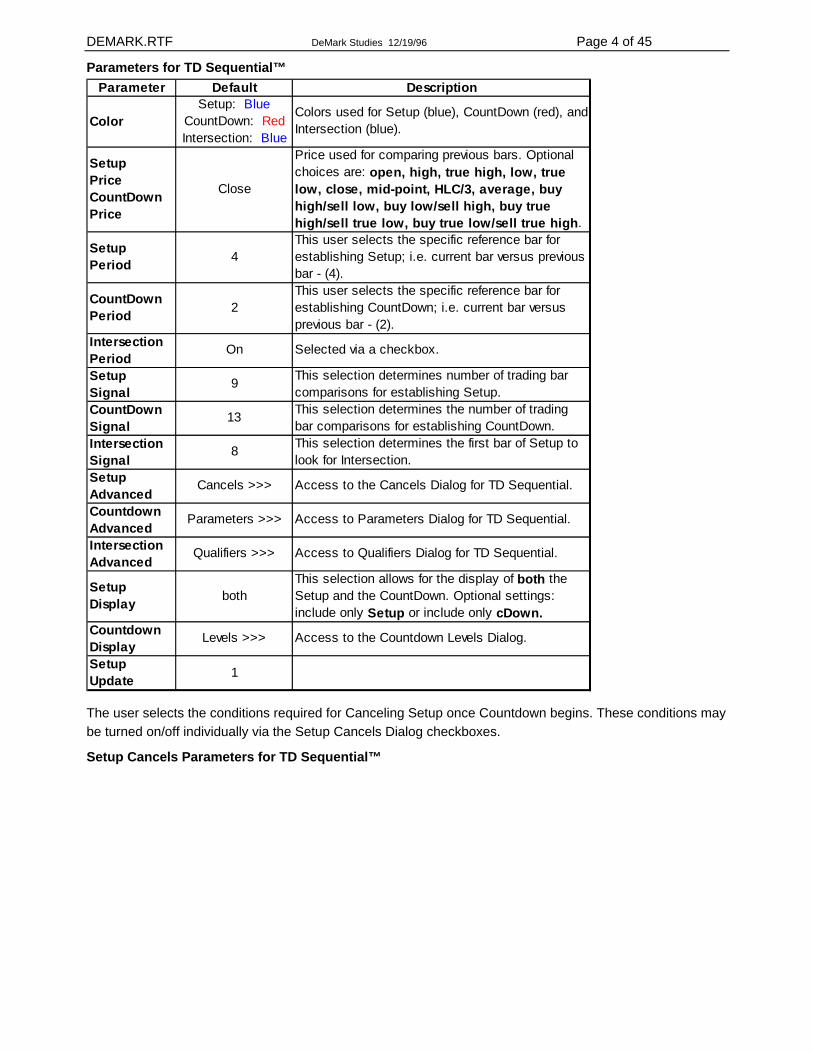
DEMARK.RTF DeMark Studies 12/19/96 Page 4 of 45
Parameters for TD Sequential™ Parameter Default Description
ColorSetup: Blue
CountDown: Red Intersection: Blue
Colors used for Setup (blue), CountDown (red), and Intersection (blue).
Setup Price CountDown Price
Close
Price used for comparing previous bars. Optional choices are: open, high, true high, low, true low, close, mid-point, HLC/3, average, buy high/sell low, buy low/sell high, buy true high/sell true low, buy true low/sell true high.
Setup Period 4
This user selects the specific reference bar for establishing Setup; i.e. current bar versus previous bar - (4).
CountDown Period 2
This user selects the specific reference bar for establishing CountDown; i.e. current bar versus previous bar - (2).
Intersection Period
On Selected via a checkbox.
Setup Signal
9 This selection determines number of trading bar comparisons for establishing Setup.
CountDown Signal
13 This selection determines the number of trading bar comparisons for establishing CountDown.
Intersection Signal
8 This selection determines the first bar of Setup to look for Intersection.
Setup Advanced
Cancels >>> Access to the Cancels Dialog for TD Sequential.
Countdown Advanced
Parameters >>> Access to Parameters Dialog for TD Sequential.
Intersection Advanced
Qualifiers >>> Access to Qualifiers Dialog for TD Sequential.
Setup Display both
This selection allows for the display of both the Setup and the CountDown. Optional settings: include only Setup or include only cDown.
Countdown Display
Levels >>> Access to the Countdown Levels Dialog.
Setup Update 1
The user selects the conditions required for Canceling Setup once Countdown begins. These conditions may be turned on/off individually via the Setup Cancels Dialog checkboxes.
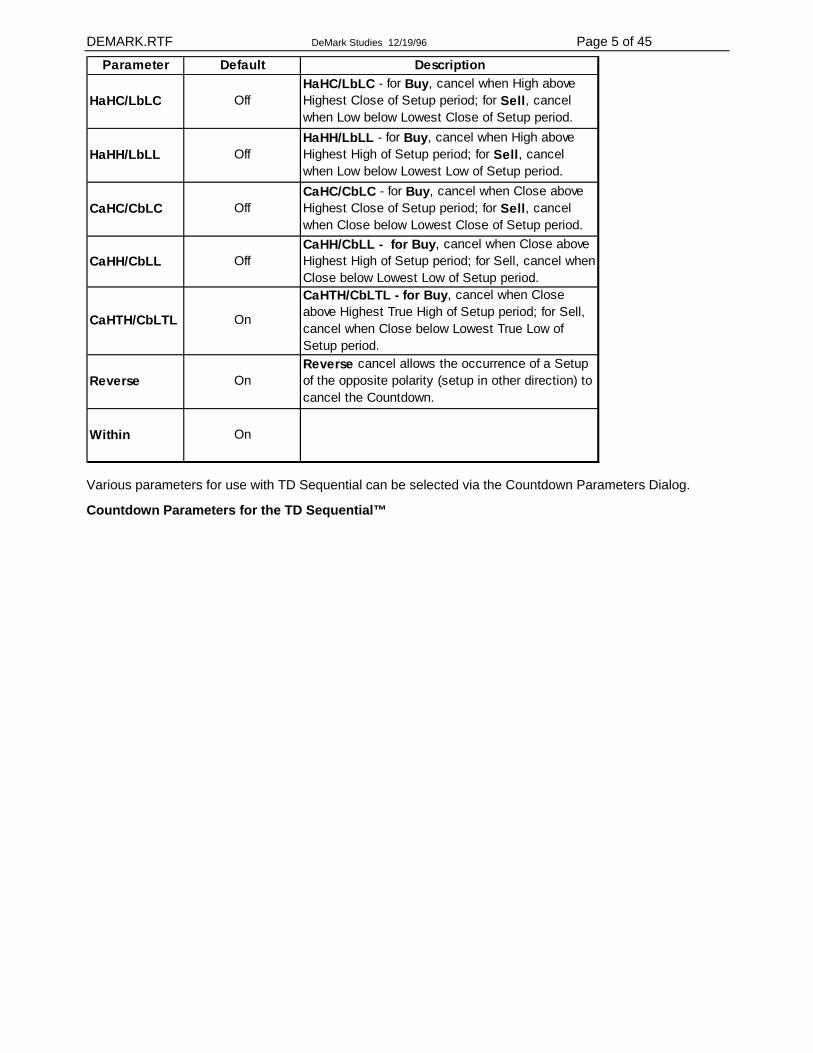
Setup Cancels Parameters for TD Sequential™
DEMARK.RTF DeMark Studies 12/19/96 Page 5 of 45
Parameter Default Description
HaHC/LbLC OffHaHC/LbLC - for Buy, cancel when High above Highest Close of Setup period; for Sell, cancel when Low below Lowest Close of Setup period.
HaHH/LbLL OffHaHH/LbLL - for Buy, cancel when High above Highest High of Setup period; for Sell, cancel when Low below Lowest Low of Setup period.
CaHC/CbLC OffCaHC/CbLC - for Buy, cancel when Close above Highest Close of Setup period; for Sell, cancel when Close below Lowest Close of Setup period.
CaHH/CbLL OffCaHH/CbLL - for Buy, cancel when Close above Highest High of Setup period; for Sell, cancel when Close below Lowest Low of Setup period.
CaHTH/CbLTL On
CaHTH/CbLTL - for Buy, cancel when Close above Highest True High of Setup period; for Sell, cancel when Close below Lowest True Low of Setup period.
Reverse OnReverse cancel allows the occurrence of a Setup of the opposite polarity (setup in other direction) to cancel the Countdown.
Within On
Various parameters for use with TD Sequential can be selected via the Countdown Parameters Dialog.
Countdown Parameters for the TD Sequential™
DEMARK.RTF DeMark Studies 12/19/96 Page 6 of 45
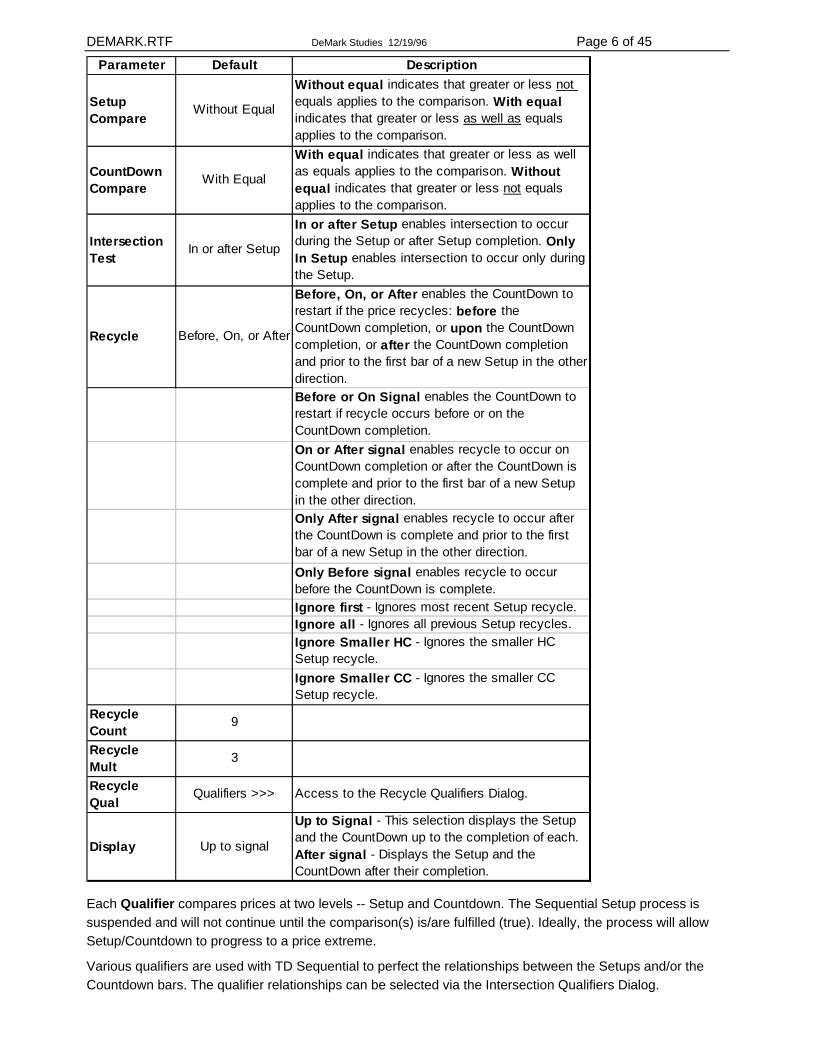
Parameter Default Description
Setup Compare
Without Equal
Without equal indicates that greater or less not equals applies to the comparison. With equal indicates that greater or less as well as equals applies to the comparison.
CountDown Compare
With Equal
With equal indicates that greater or less as well as equals applies to the comparison. Without equal indicates that greater or less not equals applies to the comparison.
Intersection Test
In or after Setup
In or after Setup enables intersection to occur during the Setup or after Setup completion. Only In Setup enables intersection to occur only during the Setup.
Recycle Before, On, or After
Before, On, or After enables the CountDown to restart if the price recycles: before the CountDown completion, or upon the CountDown completion, or after the CountDown completion and prior to the first bar of a new Setup in the other direction.
Before or On Signal enables the CountDown to restart if recycle occurs before or on the CountDown completion.
On or After signal enables recycle to occur on CountDown completion or after the CountDown is complete and prior to the first bar of a new Setup in the other direction.
Only After signal enables recycle to occur after the CountDown is complete and prior to the first bar of a new Setup in the other direction.
Only Before signal enables recycle to occur before the CountDown is complete.
Ignore first - Ignores most recent Setup recycle.Ignore all - Ignores all previous Setup recycles.Ignore Smaller HC - Ignores the smaller HC Setup recycle.
Ignore Smaller CC - Ignores the smaller CC Setup recycle.
Recycle Count
9
Recycle Mult
3
Recycle Qual
Qualifiers >>> Access to the Recycle Qualifiers Dialog.
Display Up to signal
Up to Signal - This selection displays the Setup and the CountDown up to the completion of each. After signal - Displays the Setup and the CountDown after their completion.
Each Qualifier compares prices at two levels -- Setup and Countdown. The Sequential Setup process is suspended and will not continue until the comparison(s) is/are fulfilled (true). Ideally, the process will allow Setup/Countdown to progress to a price extreme.
Various qualifiers are used with TD Sequential to perfect the relationships between the Setups and/or the Countdown bars. The qualifier relationships can be selected via the Intersection Qualifiers Dialog.
DEMARK.RTF DeMark Studies 12/19/96 Page 7 of 45
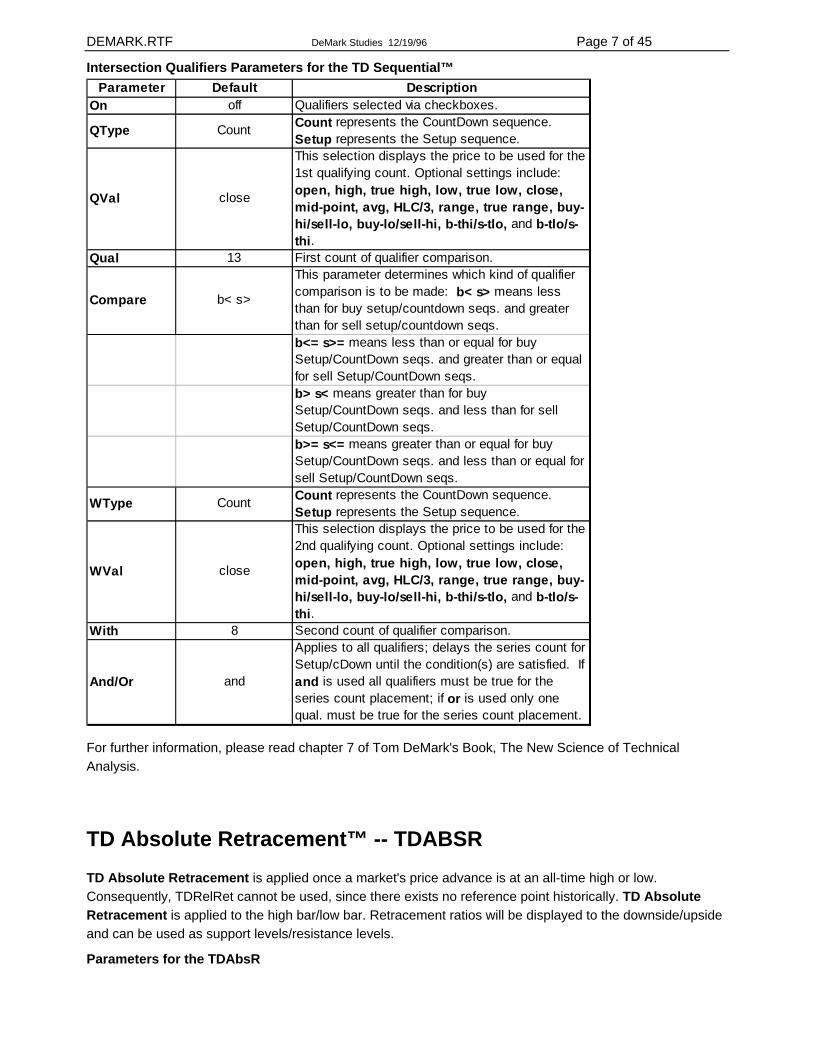
Intersection Qualifiers Parameters for the TD Sequential™ Parameter Default Description
On off Qualifiers selected via checkboxes.
QType Count Count represents the CountDown sequence. Setup represents the Setup sequence.
QVal close
This selection displays the price to be used for the 1st qualifying count. Optional settings include: open, high, true high, low, true low, close, mid-point, avg, HLC/3, range, true range, buy-hi/sell-lo, buy-lo/sell-hi, b-thi/s-tlo, and b-tlo/s-thi.
Qual 13 First count of qualifier comparison.
Compare b< s>
This parameter determines which kind of qualifier comparison is to be made: b< s> means less than for buy setup/countdown seqs. and greater than for sell setup/countdown seqs.b<= s>= means less than or equal for buy Setup/CountDown seqs. and greater than or equal for sell Setup/CountDown seqs.b> s< means greater than for buy Setup/CountDown seqs. and less than for sell Setup/CountDown seqs.b>= s<= means greater than or equal for buy Setup/CountDown seqs. and less than or equal for sell Setup/CountDown seqs.
WType Count Count represents the CountDown sequence. Setup represents the Setup sequence.
WVal close
This selection displays the price to be used for the 2nd qualifying count. Optional settings include: open, high, true high, low, true low, close, mid-point, avg, HLC/3, range, true range, buy-hi/sell-lo, buy-lo/sell-hi, b-thi/s-tlo, and b-tlo/s-thi.
With 8 Second count of qualifier comparison.
And/Or and
Applies to all qualifiers; delays the series count for Setup/cDown until the condition(s) are satisfied. If and is used all qualifiers must be true for the series count placement; if or is used only one qual. must be true for the series count placement.
For further information, please read chapter 7 of Tom DeMark's Book, The New Science of Technical Analysis.
TD Absolute Retracement™ -- TDABSR TD Absolute Retracement is applied once a market's price advance is at an all-time high or low. Consequently, TDRelRet cannot be used, since there exists no reference point historically. TD Absolute Retracement is applied to the high bar/low bar. Retracement ratios will be displayed to the downside/upside and can be used as support levels/resistance levels.
Parameters for the TDAbsR
DEMARK.RTF DeMark Studies 12/19/96 Page 8 of 45
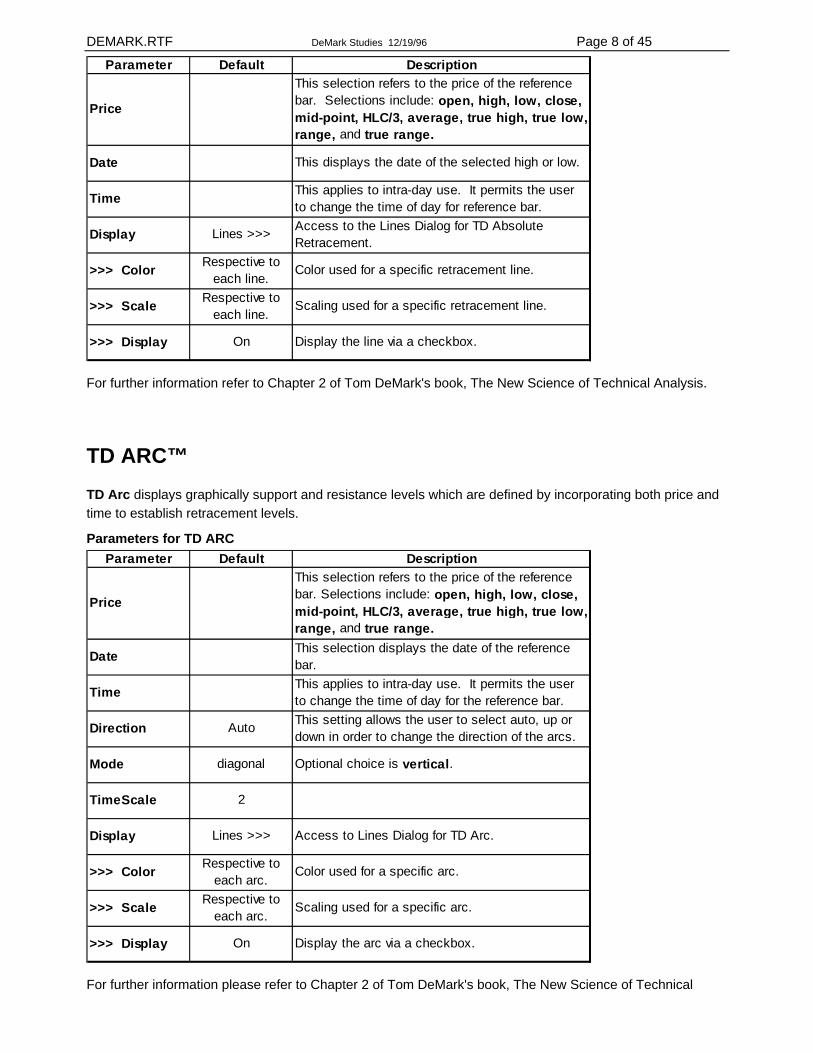
Parameter Default Description
Price
This selection refers to the price of the reference bar. Selections include: open, high, low, close, mid-point, HLC/3, average, true high, true low, range, and true range.
Date This displays the date of the selected high or low.
Time This applies to intra-day use. It permits the user to change the time of day for reference bar.
Display Lines >>> Access to the Lines Dialog for TD Absolute Retracement.
>>> Color Respective to each line.
Color used for a specific retracement line.
>>> Scale Respective to each line.
Scaling used for a specific retracement line.
>>> Display On Display the line via a checkbox.
For further information refer to Chapter 2 of Tom DeMark's book, The New Science of Technical Analysis.
TD ARC™ TD Arc displays graphically support and resistance levels which are defined by incorporating both price and time to establish retracement levels.
Parameters for TD ARC Parameter Default Description
Price
This selection refers to the price of the reference bar. Selections include: open, high, low, close, mid-point, HLC/3, average, true high, true low, range, and true range.
Date This selection displays the date of the reference bar.
Time This applies to intra-day use. It permits the user to change the time of day for the reference bar.
Direction Auto This setting allows the user to select auto, up or down in order to change the direction of the arcs.
Mode diagonal Optional choice is vertical.
TimeScale 2
Display Lines >>> Access to Lines Dialog for TD Arc.
>>> Color Respective to each arc.
Color used for a specific arc.
>>> Scale Respective to each arc.
Scaling used for a specific arc.
>>> Display On Display the arc via a checkbox.
For further information please refer to Chapter 2 of Tom DeMark's book, The New Science of Technical
DEMARK.RTF DeMark Studies 12/19/96 Page 9 of 45
Analysis.
TD LINE™ TD Line mechanically and systematically draws trendlines. Once the trendlines are broken and are preceded by a qualified bar the study automatically calculates a price projection.
TD Lines are constructed connecting ( TD Points ). A TD Point high occurs once a high is made with a lower high on both sides -- this would be a level one TD Point. A level 2 TD Point would be a high surrounded by 2 lower highs on each side of the highest high. Levels can go up to 20.
REVERSE the logic for TD Point Lows.
Qualifying TD Lines
By first qualifying a TD Line, the user reduces the risk that intra-day entry ( going with the breakout ) will fail, at the same time, increases the chance of success should the user fade the disqualified trade ( going against the breakout ). To be a qualified TD Line, one of the following conditions must be satisfied:
1) The close of the bar prior to upside/downside penetration is down/up versus the close of the previous bar (Qual #1 Parameter = on).
OR
2) The open of the first bar exceeds upside/downside the TD Line and also opens above/below the previous bar’s close (Qual #2 Parameter = on).
OR
3) The difference between the previous bar's close and its true low/high added to/ subtracted from the previous bar's close is less than/greater than TD Line. (See definition of true highs/lows.) (Qual #3 Parameter = on).
Disqualifying TD Lines
To be a disqualified TD Line none of the previous conditions (1, 2, 3) can apply.
Cancelling Qualified TD Lines
1) The TD Supply/Demand Line is cancelled if the next bar's open is below/above the TD Line.
OR
2) The TD Supply/Demand Line is cancelled if the next bar's high/low is less/greater than the previous close and the next bar's close closes below/above the TD Line.
OR
3) The TD Supply/Demand Line is cancelled if the next bar's high/low is less/greater than the previous bar's high/low.
Cancelling Disqualified TD Lines
To cancel a disqualified TD Line use the REVERSE LOGIC of the above conditions.
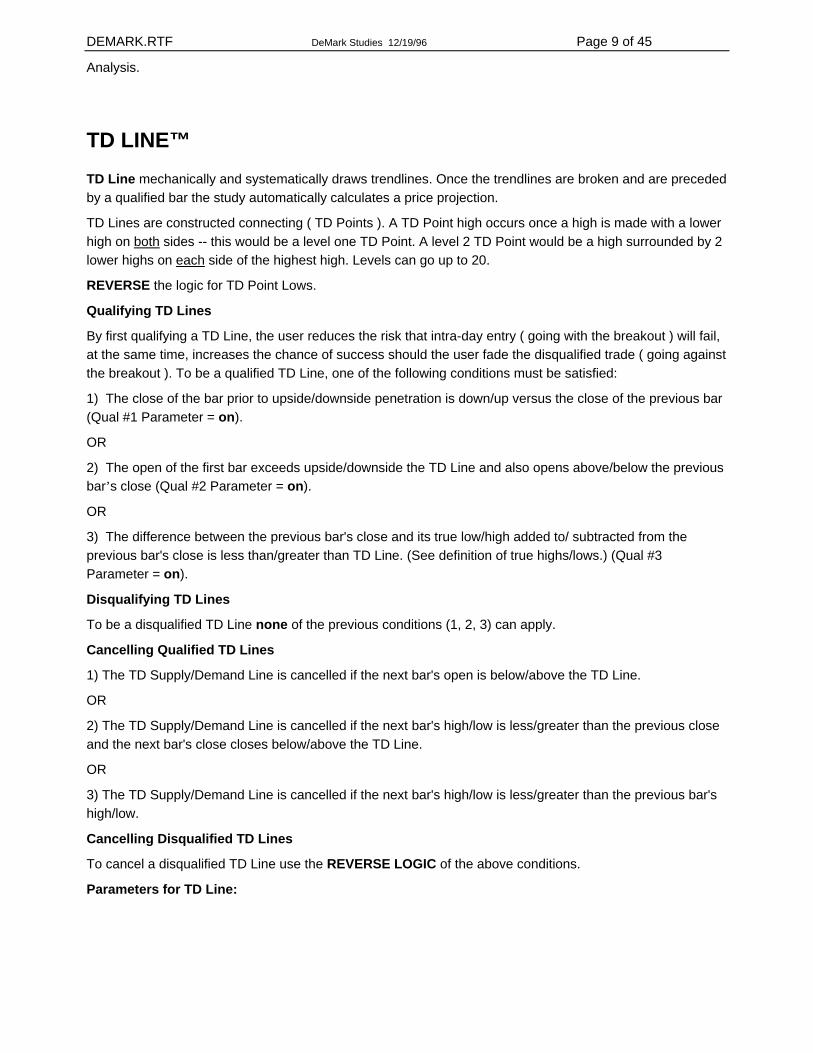
Parameters for TD Line:
DEMARK.RTF DeMark Studies 12/19/96 Page 10 of 45
Parameter Default Description
ColorTrend: Blue
CountDown: Red BrkO: Black
Colors used for Trend (blue) and Projection (red) and Breakout (black).
Trend Level 1 This defines the level at which TD point is active.
Proj. Level Type 1This selection determines which of the three (3) possible price projection methods is used: Type 1, Type 2, Type 3, or none.
Trend TDP chart
The Chart high or low is the actual price displayed on the bar chart. True highs or lows are defined as a bar chart's high/low or the close of the previous bar whichever is greater/less.
Proj. TDP Val On
The "Val" (Validation) of a TD Point relates to the necessity to close at least one bar after the most recent TD Point low above the TD Demand Line and to close at least one bar after a TD Point high below the most recent TD Supply Line.
Trend Display Both Both display the TD Supply Line and TD Demand Line. May display supply/demand individually.
Proj. Display AllThis feature displays both qualified and disqualified TD Lines. Other selections include: only qual or disqual.
BrKO Display 0 0 indicates "Off". When in the "On" position, will show all TD Points (up to 20).
Trend Supply HighThe supply feature refers to the price to be used for the TD Supply Line. Open, High, Low, Close, Mid-Point, and HLC/3.
Trend Demand LowThe demand feature refers to the price to be used for the TD Demand Line. Open, High, Low, Close, Mid-Point, and HLC/3.
Trend Connect 1The connect feature refers to the number of times a (left) TD point can be used for constructing a TD Line. (max = 10)
Trend Lookback 100 If not qualified within this time parameter, indicator is silent.
Parameters for TD Line (Continued):
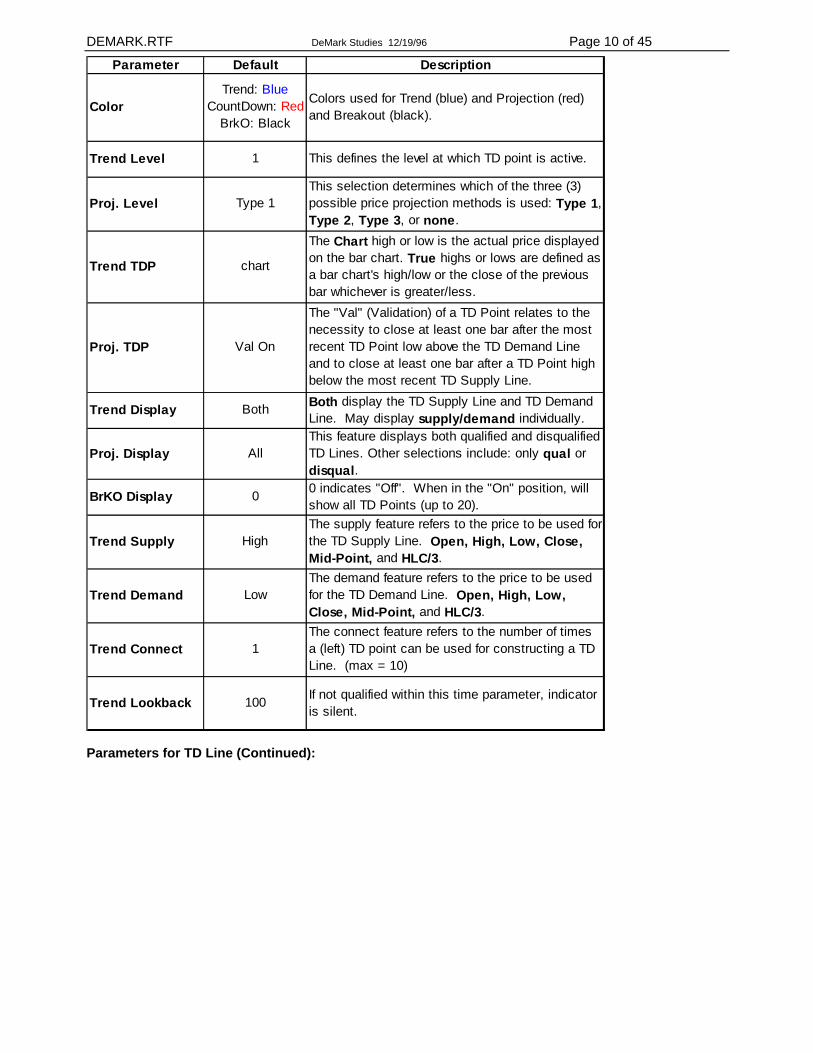
DEMARK.RTF DeMark Studies 12/19/96 Page 11 of 45
Parameter Default Description
Qualifier #1 On See above text for description. Other choices: Off
Qualifier #2 On See above text for description. Other choices: Off
Qualifier #3 On See above text for description. Other choices: Off
Custom Qual >>> Access to Custom Qualifier Dialog for TD Line. Allows user to construct own Qualifiers.
Project Qpen 1 "Qpen" adds additional ticks to qualifier #2.
BrkO Qpen 1 "Qpen" adds additional ticks to qualifier #3.
QCancel #1; QCancel #2; QCancel #3
On On/Off via checkbox. See above text for description.
DCancel #1; DCancel #2; DCancel #3
Off On/Off via checkbox. See above text for description.
Trend Parameter End at First
End at First - The TD Line extends only to the point of first penetration whether qualified or not. End at Qual - implies the TD Line extends to the point of the first qualified breakout.
Proj. Parameter 100% This selects the % of price projection for calculation.
BrkO Parameter 0 This selection defines the number of price ticks to validate penetration of TD Line.
Custom Qualifiers may be entered via the Custom Qualifiers Dialog.
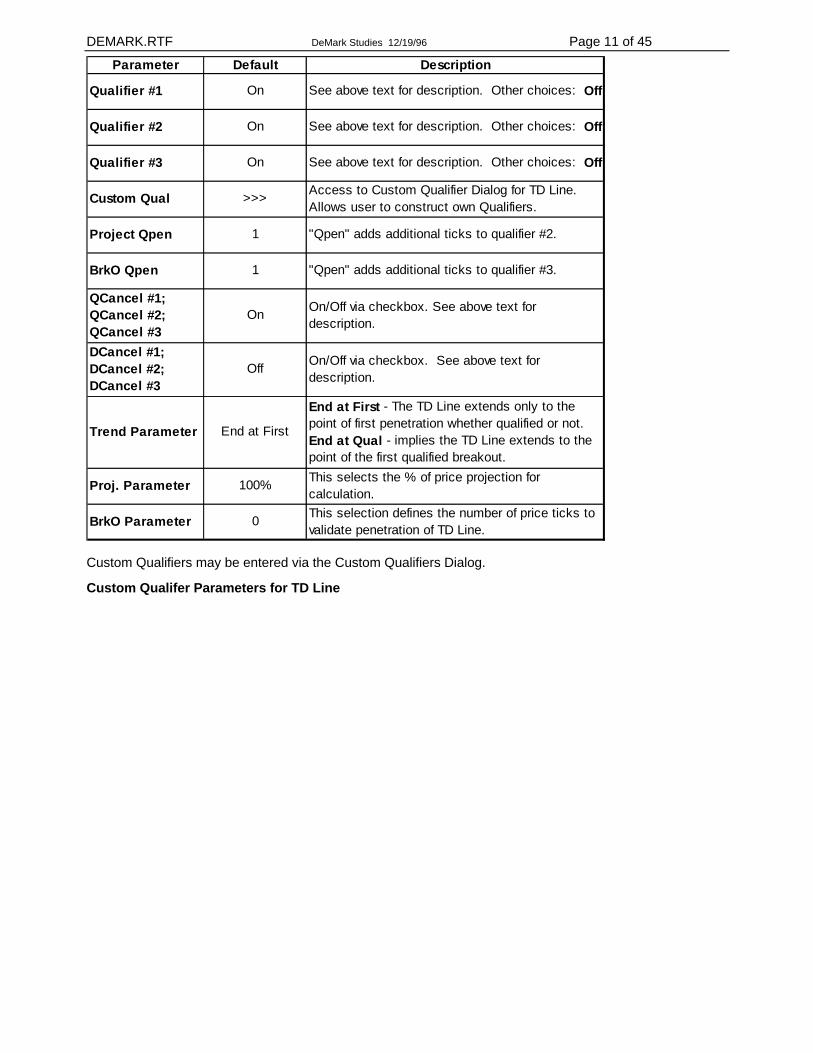
Custom Qualifer Parameters for TD Line
DEMARK.RTF DeMark Studies 12/19/96 Page 12 of 45
Parameter Default DescriptionQ>>> On Off Checkbox to either have qualifier On/Off.
Q>>> Price1 Close
This selection displays the price to be used for the 1st qualifying count. Optional settings include: open, high, true high, low, true low, close, mid-point, HLC/3, average, range, and true range.
Q>>> Ago1 0 First count of bars prior to the breakout.
Q>>> Rel s< d>
This parameter determines which kind of qualifier comparison is to be made: s< d> means less than for TD Supply Line and greater than for TD Demand Line.
s<= d>= means less than or equal for TD Supply Line and greater than or equal for TD Demand Line.
s> d< means greater than for TD Supply Line and less than for TD Demand Line.
s>= d<= means greater than or equal forTD Supply Line and less than or equal for TD Demand Line.
Q>>> Price2 Close
This selection displays the price to be used for the 2nd qualifying count. Optional settings include: open, high, true high, low, true low, close, mid-point, HLC/3, average, range, and true range.
Q>>> Ago2 0 Second count of bars prior to the breakout.
Q>>> And/Or AndApplies to each qualifier which is "On". If and is used both qualifiers must be true; if or is used only one qualifier must be true.
For further information please refer to Chapter 1 of Tom DeMark's book, The New Science of Technical Analysis.
TD Point™ -- TD PT TD PT (Point) low is a low preceded and succeeded by higher low(s). TD PT high is a high preceded and succeeded by lower high(s).
Parameters for TD PT
DEMARK.RTF DeMark Studies 12/19/96 Page 13 of 45
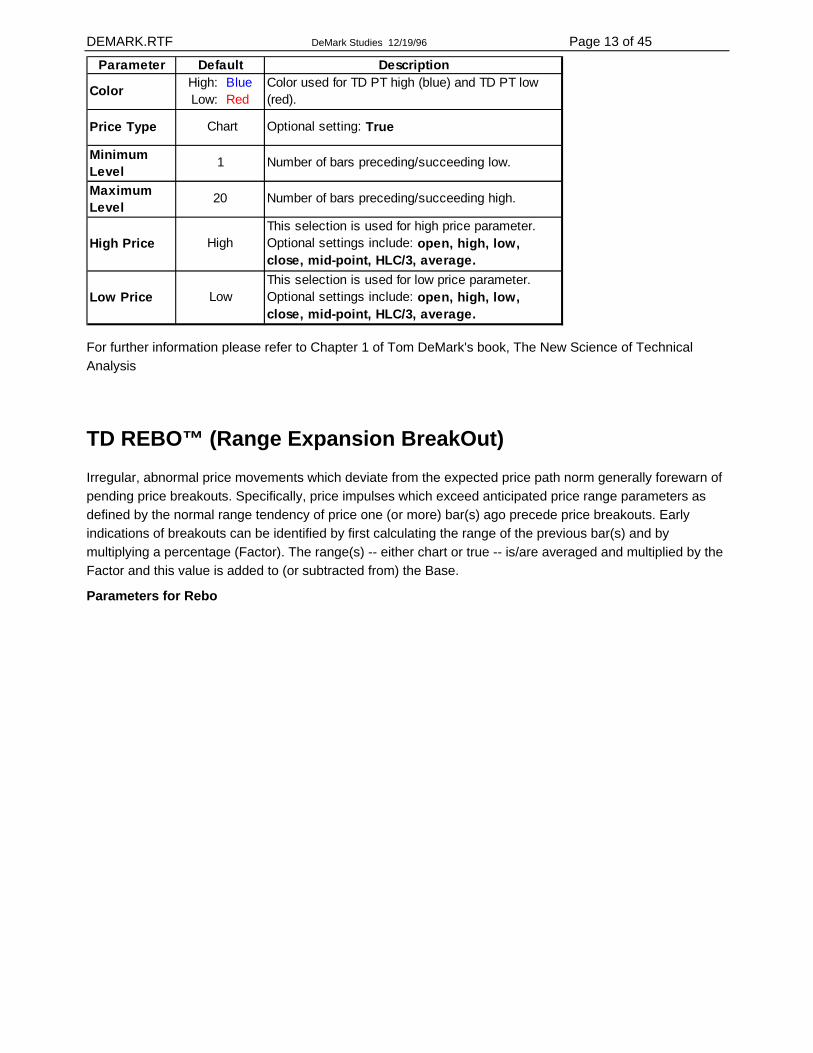
Parameter Default Description
Color High: Blue Low: Red
Color used for TD PT high (blue) and TD PT low (red).
Price Type Chart Optional setting: True
Minimum Level
1 Number of bars preceding/succeeding low.
Maximum Level
20 Number of bars preceding/succeeding high.
High Price HighThis selection is used for high price parameter. Optional settings include: open, high, low, close, mid-point, HLC/3, average.
Low Price LowThis selection is used for low price parameter. Optional settings include: open, high, low, close, mid-point, HLC/3, average.
For further information please refer to Chapter 1 of Tom DeMark's book, The New Science of Technical Analysis
TD REBO™ (Range Expansion BreakOut) Irregular, abnormal price movements which deviate from the expected price path norm generally forewarn of pending price breakouts. Specifically, price impulses which exceed anticipated price range parameters as defined by the normal range tendency of price one (or more) bar(s) ago precede price breakouts. Early indications of breakouts can be identified by first calculating the range of the previous bar(s) and by multiplying a percentage (Factor). The range(s) -- either chart or true -- is/are averaged and multiplied by the Factor and this value is added to (or subtracted from) the Base.
Parameters for Rebo
DEMARK.RTF DeMark Studies 12/19/96 Page 14 of 45
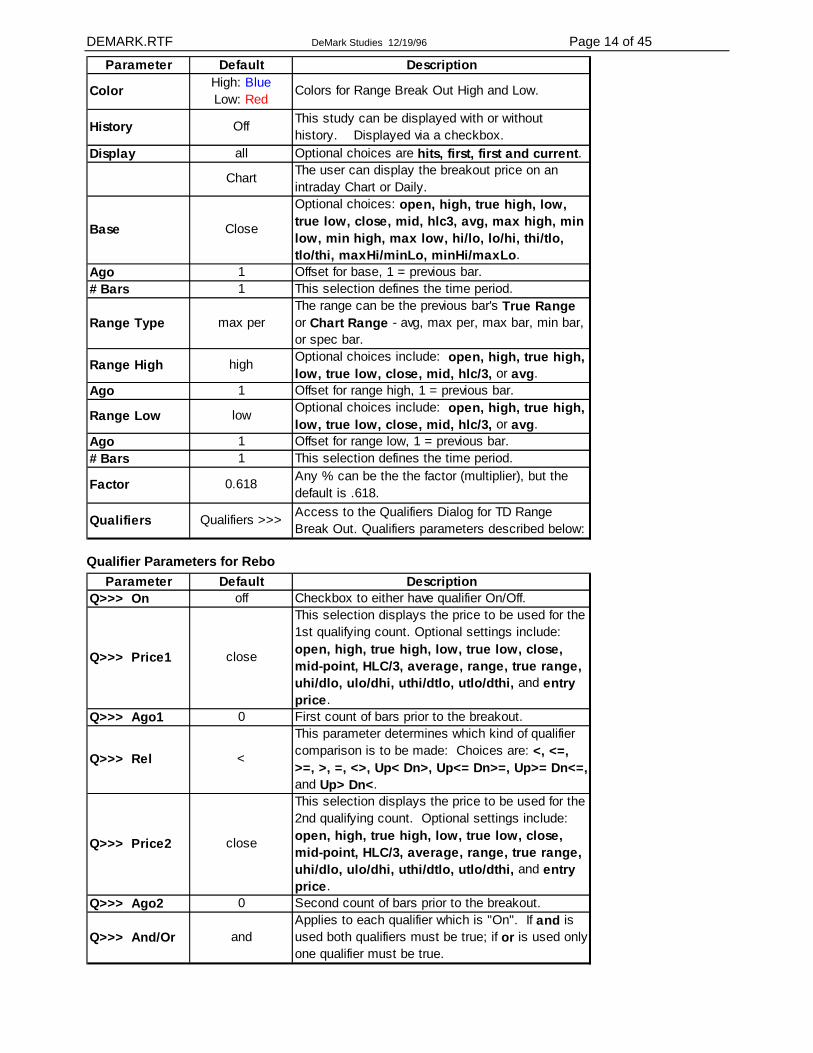
Parameter Default Description
Color High: Blue Low: Red
Colors for Range Break Out High and Low.
History Off This study can be displayed with or without history. Displayed via a checkbox.
Display all Optional choices are hits, first, first and current.
Chart The user can display the breakout price on an intraday Chart or Daily.
Base Close
Optional choices: open, high, true high, low, true low, close, mid, hlc3, avg, max high, min low, min high, max low, hi/lo, lo/hi, thi/tlo, tlo/thi, maxHi/minLo, minHi/maxLo.
Ago 1 Offset for base, 1 = previous bar.# Bars 1 This selection defines the time period.
Range Type max perThe range can be the previous bar's True Range or Chart Range - avg, max per, max bar, min bar, or spec bar.
Range High high Optional choices include: open, high, true high, low, true low, close, mid, hlc/3, or avg.
Ago 1 Offset for range high, 1 = previous bar.
Range Low low Optional choices include: open, high, true high, low, true low, close, mid, hlc/3, or avg.
Ago 1 Offset for range low, 1 = previous bar.# Bars 1 This selection defines the time period.
Factor 0.618 Any % can be the the factor (multiplier), but the default is .618.
Qualifiers Qualifiers >>> Access to the Qualifiers Dialog for TD Range Break Out. Qualifiers parameters described below:
Qualifier Parameters for Rebo Parameter Default Description
Q>>> On off Checkbox to either have qualifier On/Off.
Q>>> Price1 close
This selection displays the price to be used for the 1st qualifying count. Optional settings include: open, high, true high, low, true low, close, mid-point, HLC/3, average, range, true range, uhi/dlo, ulo/dhi, uthi/dtlo, utlo/dthi, and entry price.
Q>>> Ago1 0 First count of bars prior to the breakout.
Q>>> Rel <
This parameter determines which kind of qualifier comparison is to be made: Choices are: <, <=, >=, >, =, <>, Up< Dn>, Up<= Dn>=, Up>= Dn<=, and Up> Dn<.
Q>>> Price2 close
This selection displays the price to be used for the 2nd qualifying count. Optional settings include: open, high, true high, low, true low, close, mid-point, HLC/3, average, range, true range, uhi/dlo, ulo/dhi, uthi/dtlo, utlo/dthi, and entry price.
Q>>> Ago2 0 Second count of bars prior to the breakout.
Q>>> And/Or andApplies to each qualifier which is "On". If and is used both qualifiers must be true; if or is used only one qualifier must be true.
DEMARK.RTF DeMark Studies 12/19/96 Page 15 of 45
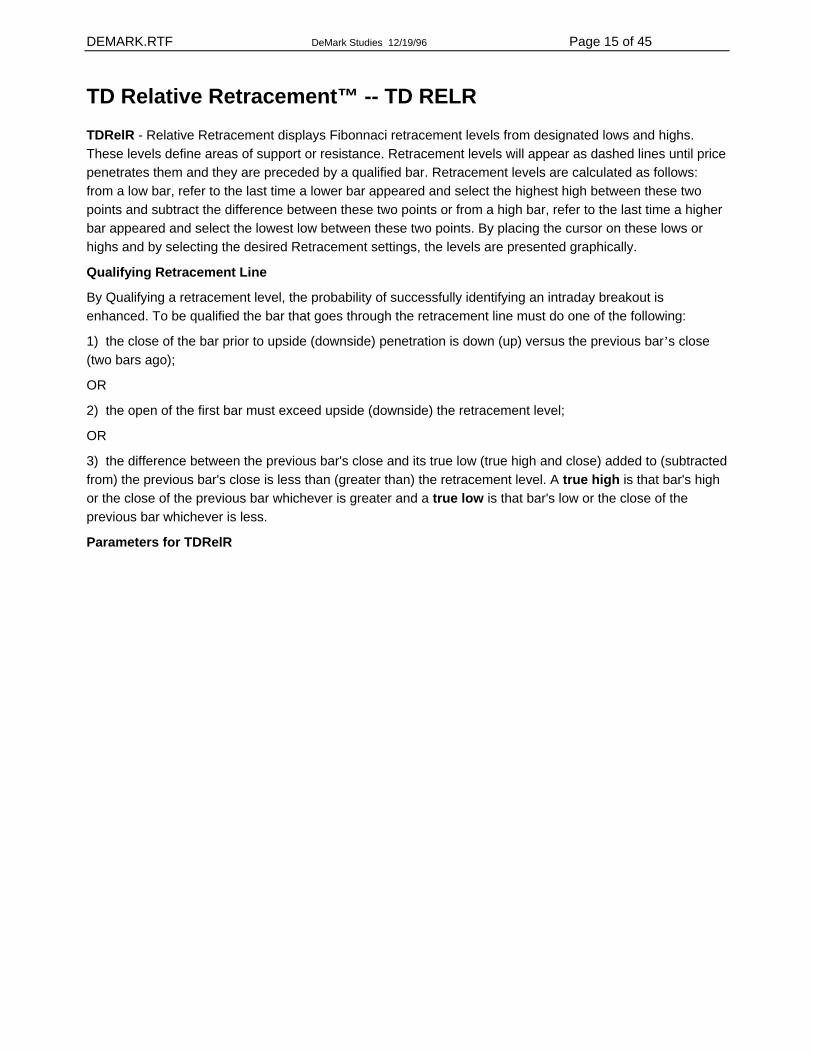
TD Relative Retracement™ -- TD RELR TDRelR - Relative Retracement displays Fibonnaci retracement levels from designated lows and highs. These levels define areas of support or resistance. Retracement levels will appear as dashed lines until price penetrates them and they are preceded by a qualified bar. Retracement levels are calculated as follows: from a low bar, refer to the last time a lower bar appeared and select the highest high between these two points and subtract the difference between these two points or from a high bar, refer to the last time a higher bar appeared and select the lowest low between these two points. By placing the cursor on these lows or highs and by selecting the desired Retracement settings, the levels are presented graphically.
Qualifying Retracement Line
By Qualifying a retracement level, the probability of successfully identifying an intraday breakout is enhanced. To be qualified the bar that goes through the retracement line must do one of the following:
1) the close of the bar prior to upside (downside) penetration is down (up) versus the previous bar’s close (two bars ago);
OR
2) the open of the first bar must exceed upside (downside) the retracement level;
OR
3) the difference between the previous bar's close and its true low (true high and close) added to (subtracted from) the previous bar's close is less than (greater than) the retracement level. A true high is that bar's high or the close of the previous bar whichever is greater and a true low is that bar's low or the close of the previous bar whichever is less.
Parameters for TDRelR
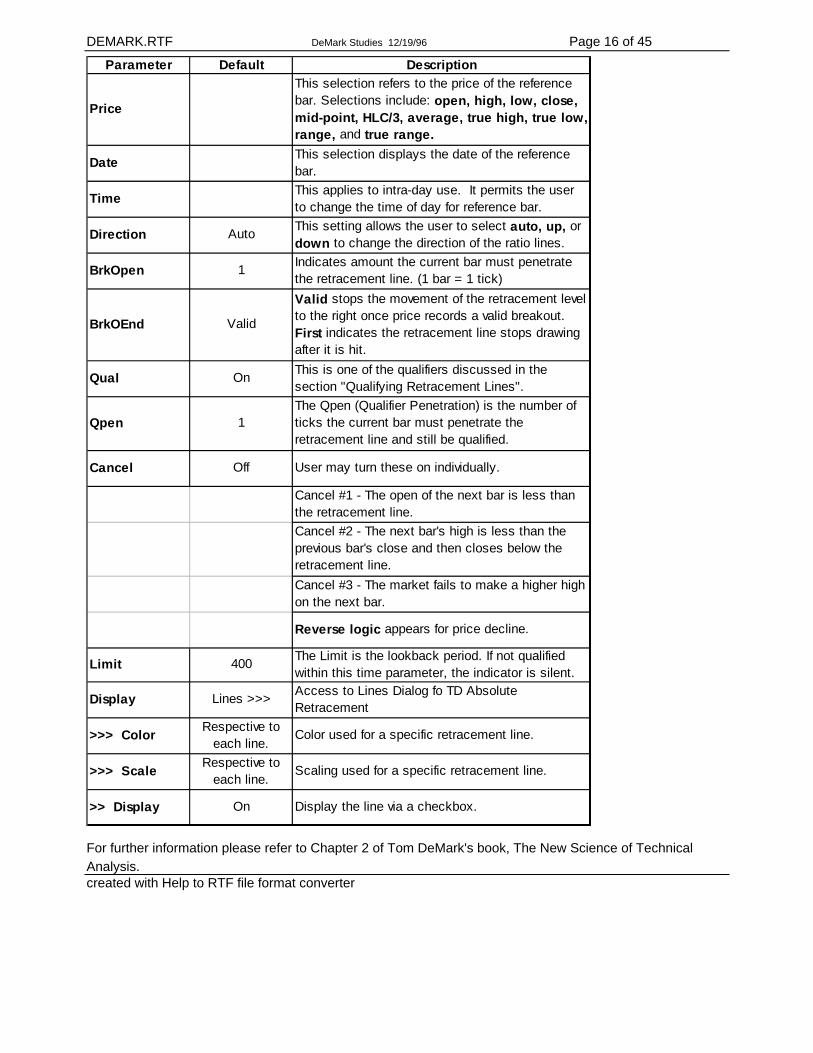
DEMARK.RTF DeMark Studies 12/19/96 Page 16 of 45
Parameter Default Description
Price
This selection refers to the price of the reference bar. Selections include: open, high, low, close, mid-point, HLC/3, average, true high, true low, range, and true range.
Date This selection displays the date of the reference bar.
Time This applies to intra-day use. It permits the user to change the time of day for reference bar.
Direction Auto This setting allows the user to select auto, up, or down to change the direction of the ratio lines.
BrkOpen 1 Indicates amount the current bar must penetrate the retracement line. (1 bar = 1 tick)
BrkOEnd Valid
Valid stops the movement of the retracement level to the right once price records a valid breakout. First indicates the retracement line stops drawing after it is hit.
Qual On This is one of the qualifiers discussed in the section "Qualifying Retracement Lines".
Qpen 1The Qpen (Qualifier Penetration) is the number of ticks the current bar must penetrate the retracement line and still be qualified.
Cancel Off User may turn these on individually.
Cancel #1 - The open of the next bar is less than the retracement line.Cancel #2 - The next bar's high is less than the previous bar's close and then closes below the retracement line.Cancel #3 - The market fails to make a higher high on the next bar.
Reverse logic appears for price decline.
Limit 400 The Limit is the lookback period. If not qualified within this time parameter, the indicator is silent.
Display Lines >>> Access to Lines Dialog fo TD Absolute Retracement
>>> Color Respective to each line.
Color used for a specific retracement line.
>>> Scale Respective to each line.
Scaling used for a specific retracement line.
>> Display On Display the line via a checkbox.
For further information please refer to Chapter 2 of Tom DeMark's book, The New Science of Technical Analysis. created with Help to RTF file format converter
DEMARK.RTF DeMark Studies 12/19/96 Page 17 of 45
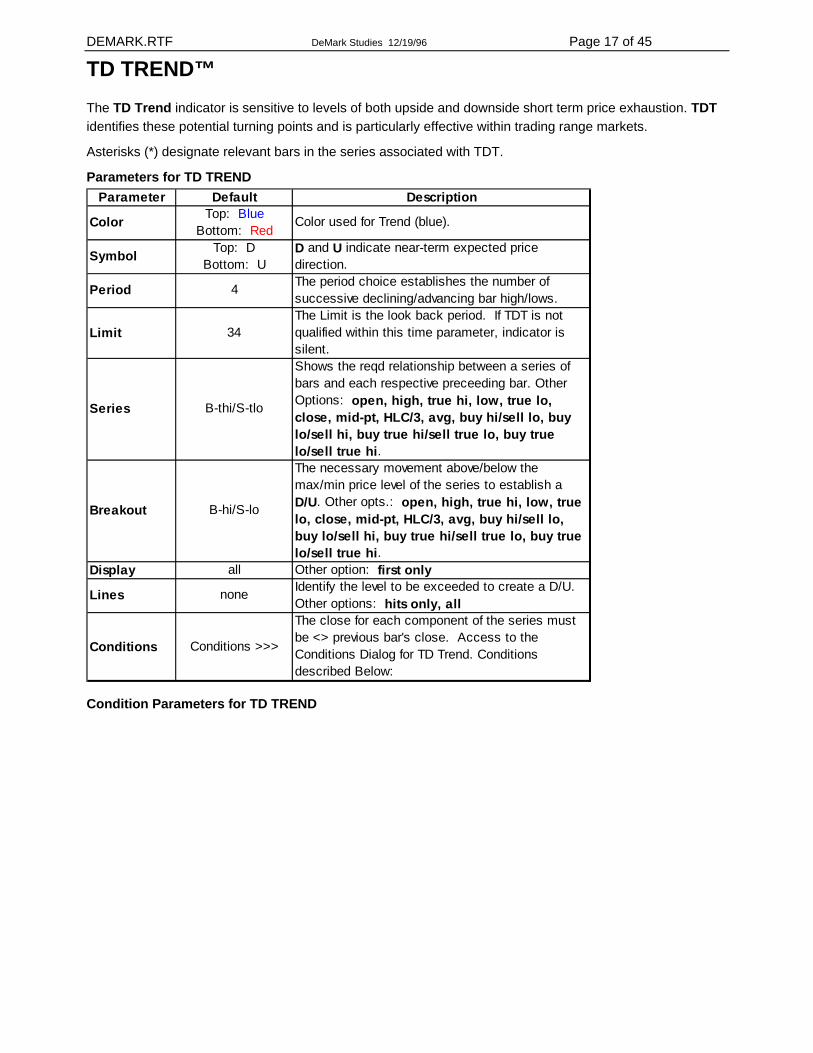
TD TREND™ The TD Trend indicator is sensitive to levels of both upside and downside short term price exhaustion. TDT identifies these potential turning points and is particularly effective within trading range markets.
Asterisks (*) designate relevant bars in the series associated with TDT.
Parameters for TD TREND Parameter Default Description
Color Top: Blue Bottom: Red
Color used for Trend (blue).
Symbol Top: D Bottom: U
D and U indicate near-term expected price direction.
Period 4 The period choice establishes the number of successive declining/advancing bar high/lows.
Limit 34The Limit is the look back period. If TDT is not qualified within this time parameter, indicator is silent.
Series B-thi/S-tlo
Shows the reqd relationship between a series of bars and each respective preceeding bar. Other Options: open, high, true hi, low, true lo, close, mid-pt, HLC/3, avg, buy hi/sell lo, buy lo/sell hi, buy true hi/sell true lo, buy true lo/sell true hi.
Breakout B-hi/S-lo
The necessary movement above/below the max/min price level of the series to establish a D/U. Other opts.: open, high, true hi, low, true lo, close, mid-pt, HLC/3, avg, buy hi/sell lo, buy lo/sell hi, buy true hi/sell true lo, buy true lo/sell true hi.
Display all Other option: first only
Lines none Identify the level to be exceeded to create a D/U. Other options: hits only, all
Conditions Conditions >>>
The close for each component of the series must be <> previous bar's close. Access to the Conditions Dialog for TD Trend. Conditions described Below:
Condition Parameters for TD TREND
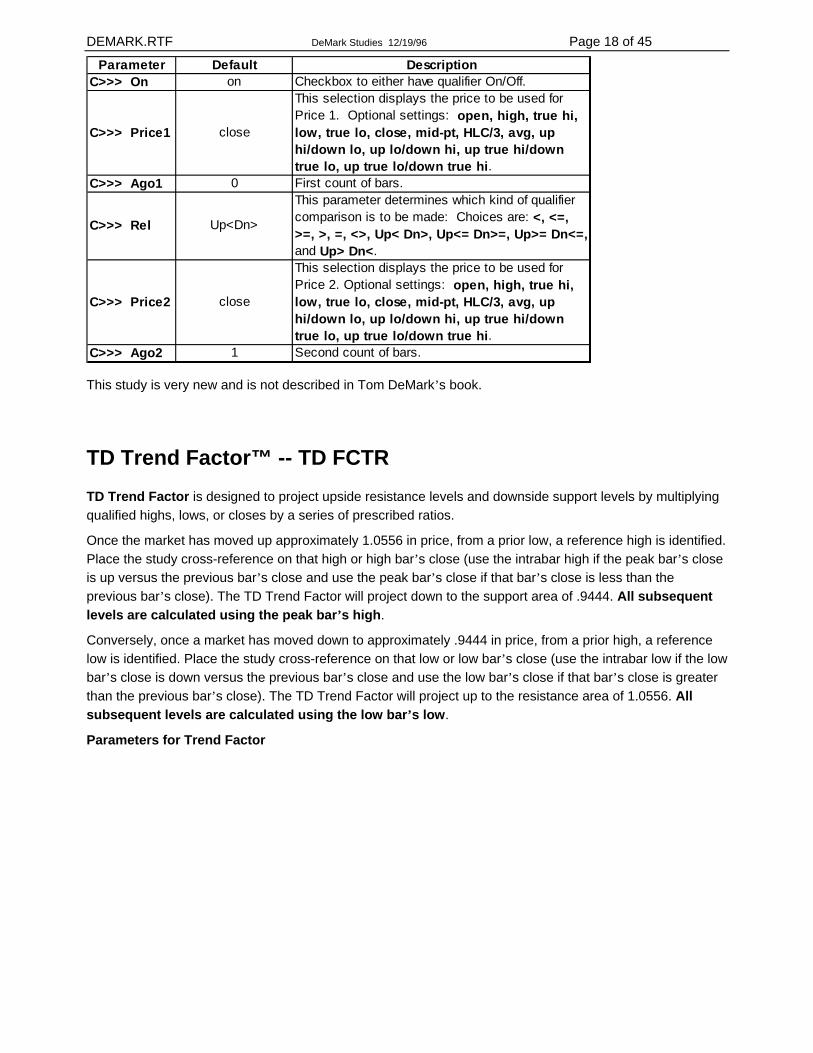
DEMARK.RTF DeMark Studies 12/19/96 Page 18 of 45
Parameter Default DescriptionC>>> On on Checkbox to either have qualifier On/Off.
C>>> Price1 close
This selection displays the price to be used for Price 1. Optional settings: open, high, true hi, low, true lo, close, mid-pt, HLC/3, avg, up hi/down lo, up lo/down hi, up true hi/down true lo, up true lo/down true hi.
C>>> Ago1 0 First count of bars.
C>>> Rel Up<Dn>
This parameter determines which kind of qualifier comparison is to be made: Choices are: <, <=, >=, >, =, <>, Up< Dn>, Up<= Dn>=, Up>= Dn<=, and Up> Dn<.
C>>> Price2 close
This selection displays the price to be used for Price 2. Optional settings: open, high, true hi, low, true lo, close, mid-pt, HLC/3, avg, up hi/down lo, up lo/down hi, up true hi/down true lo, up true lo/down true hi.
C>>> Ago2 1 Second count of bars.
This study is very new and is not described in Tom DeMark’s book.
TD Trend Factor™ -- TD FCTR TD Trend Factor is designed to project upside resistance levels and downside support levels by multiplying qualified highs, lows, or closes by a series of prescribed ratios.
Once the market has moved up approximately 1.0556 in price, from a prior low, a reference high is identified. Place the study cross-reference on that high or high bar’s close (use the intrabar high if the peak bar’s close is up versus the previous bar’s close and use the peak bar’s close if that bar’s close is less than the previous bar’s close). The TD Trend Factor will project down to the support area of .9444. All subsequent levels are calculated using the peak bar’s high.
Conversely, once a market has moved down to approximately .9444 in price, from a prior high, a reference low is identified. Place the study cross-reference on that low or low bar’s close (use the intrabar low if the low bar’s close is down versus the previous bar’s close and use the low bar’s close if that bar’s close is greater than the previous bar’s close). The TD Trend Factor will project up to the resistance area of 1.0556. All subsequent levels are calculated using the low bar’s low.
Parameters for Trend Factor
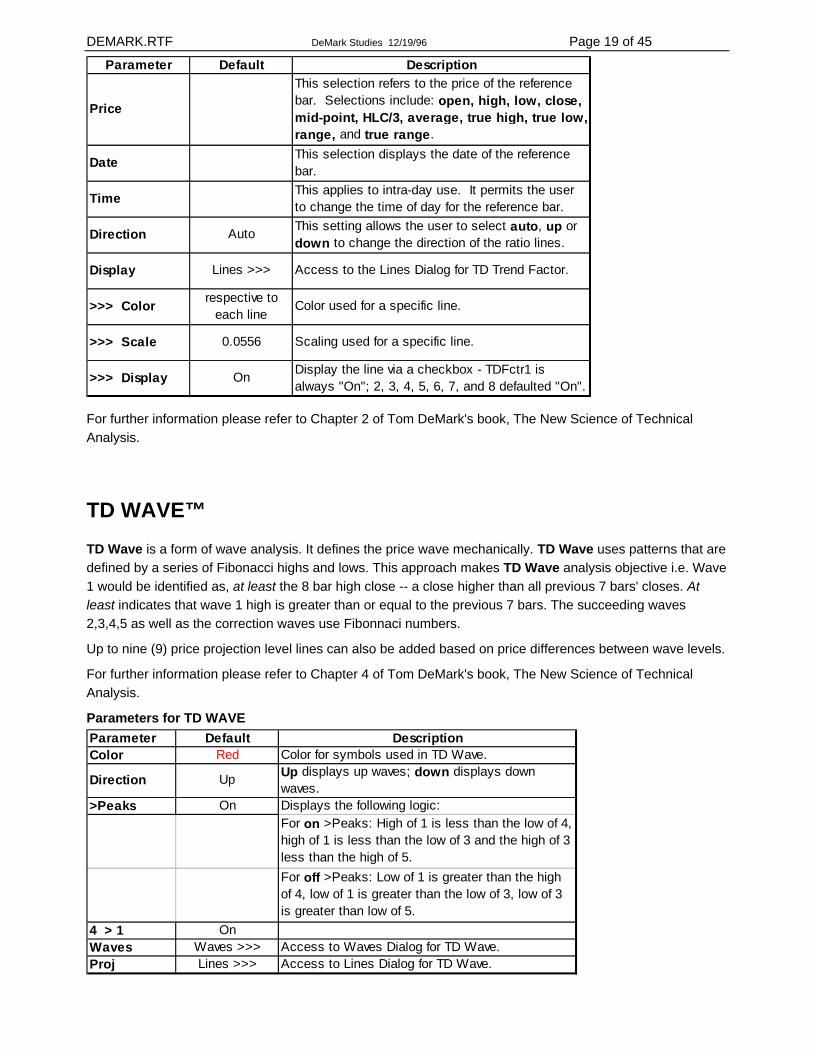
DEMARK.RTF DeMark Studies 12/19/96 Page 19 of 45
Parameter Default Description
Price
This selection refers to the price of the reference bar. Selections include: open, high, low, close, mid-point, HLC/3, average, true high, true low, range, and true range.
Date This selection displays the date of the reference bar.
Time This applies to intra-day use. It permits the user to change the time of day for the reference bar.
Direction Auto This setting allows the user to select auto, up or down to change the direction of the ratio lines.
Display Lines >>> Access to the Lines Dialog for TD Trend Factor.
>>> Color respective to each line
Color used for a specific line.
>>> Scale 0.0556 Scaling used for a specific line.
>>> Display On Display the line via a checkbox - TDFctr1 is always "On"; 2, 3, 4, 5, 6, 7, and 8 defaulted "On".
For further information please refer to Chapter 2 of Tom DeMark's book, The New Science of Technical Analysis.
TD WAVE™ TD Wave is a form of wave analysis. It defines the price wave mechanically. TD Wave uses patterns that are defined by a series of Fibonacci highs and lows. This approach makes TD Wave analysis objective i.e. Wave 1 would be identified as, at least the 8 bar high close -- a close higher than all previous 7 bars' closes. At least indicates that wave 1 high is greater than or equal to the previous 7 bars. The succeeding waves 2,3,4,5 as well as the correction waves use Fibonnaci numbers.
Up to nine (9) price projection level lines can also be added based on price differences between wave levels.
For further information please refer to Chapter 4 of Tom DeMark's book, The New Science of Technical Analysis.
Parameters for TD WAVE Parameter Default DescriptionColor Red Color for symbols used in TD Wave.
Direction Up Up displays up waves; down displays down waves.
>Peaks On Displays the following logic:For on >Peaks: High of 1 is less than the low of 4, high of 1 is less than the low of 3 and the high of 3 less than the high of 5.For off >Peaks: Low of 1 is greater than the high of 4, low of 1 is greater than the low of 3, low of 3 is greater than low of 5.
4 > 1 OnWaves Waves >>> Access to Waves Dialog for TD Wave.Proj Lines >>> Access to Lines Dialog for TD Wave.
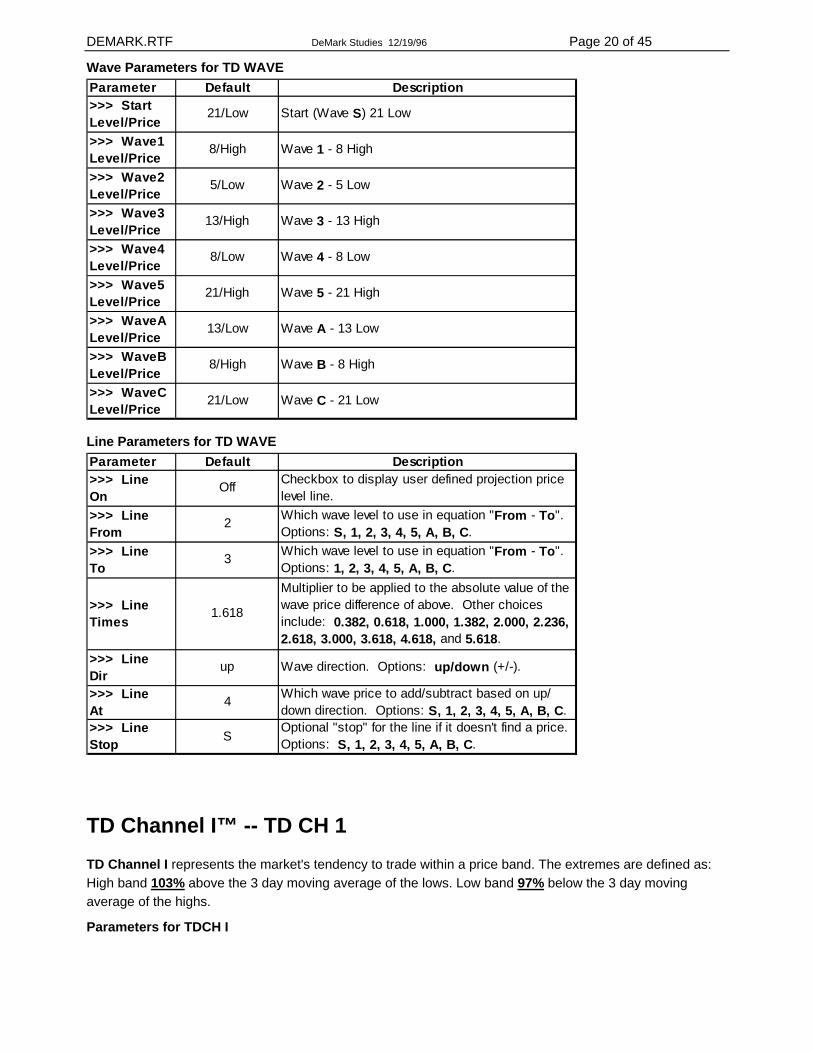
DEMARK.RTF DeMark Studies 12/19/96 Page 20 of 45
Wave Parameters for TD WAVE Parameter Default Description>>> Start Level/Price
21/Low Start (Wave S) 21 Low
>>> Wave1 Level/Price
8/High Wave 1 - 8 High
>>> Wave2 Level/Price
5/Low Wave 2 - 5 Low
>>> Wave3 Level/Price
13/High Wave 3 - 13 High
>>> Wave4 Level/Price
8/Low Wave 4 - 8 Low
>>> Wave5 Level/Price
21/High Wave 5 - 21 High
>>> WaveA Level/Price
13/Low Wave A - 13 Low
>>> WaveB Level/Price
8/High Wave B - 8 High
>>> WaveC Level/Price
21/Low Wave C - 21 Low
Line Parameters for TD WAVE Parameter Default Description>>> Line On
Off Checkbox to display user defined projection price level line.
>>> Line From
2 Which wave level to use in equation "From - To". Options: S, 1, 2, 3, 4, 5, A, B, C.
>>> Line To
3 Which wave level to use in equation "From - To". Options: 1, 2, 3, 4, 5, A, B, C.
>>> Line Times
1.618
Multiplier to be applied to the absolute value of the wave price difference of above. Other choices include: 0.382, 0.618, 1.000, 1.382, 2.000, 2.236, 2.618, 3.000, 3.618, 4.618, and 5.618.
>>> Line Dir
up Wave direction. Options: up/down (+/-).
>>> Line At
4 Which wave price to add/subtract based on up/ down direction. Options: S, 1, 2, 3, 4, 5, A, B, C.
>>> Line Stop S
Optional "stop" for the line if it doesn't find a price. Options: S, 1, 2, 3, 4, 5, A, B, C.
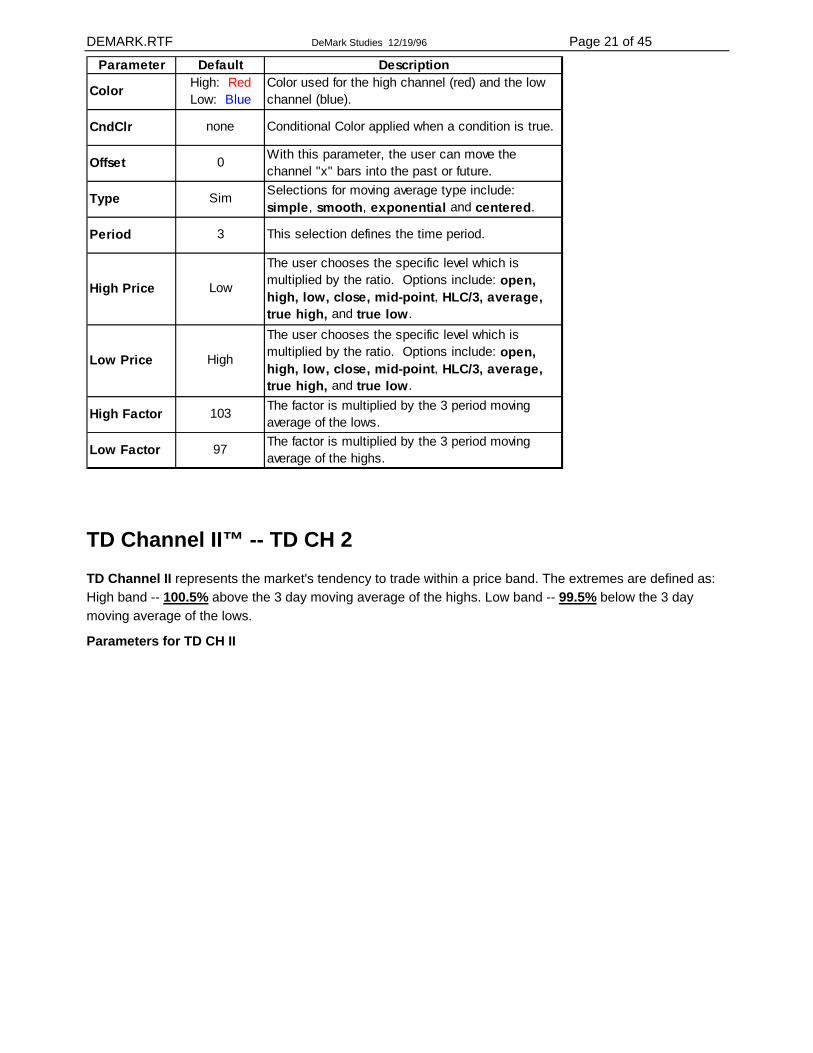
TD Channel I™ -- TD CH 1 TD Channel I represents the market's tendency to trade within a price band. The extremes are defined as: High band 103% above the 3 day moving average of the lows. Low band 97% below the 3 day moving average of the highs.
Parameters for TDCH I
DEMARK.RTF DeMark Studies 12/19/96 Page 21 of 45
Parameter Default Description
Color High: Red Low: Blue
Color used for the high channel (red) and the low channel (blue).
CndClr none Conditional Color applied when a condition is true.
Offset 0 With this parameter, the user can move the channel "x" bars into the past or future.
Type Sim Selections for moving average type include: simple, smooth, exponential and centered.
Period 3 This selection defines the time period.
High Price Low
The user chooses the specific level which is multiplied by the ratio. Options include: open, high, low, close, mid-point, HLC/3, average, true high, and true low.
Low Price High
The user chooses the specific level which is multiplied by the ratio. Options include: open, high, low, close, mid-point, HLC/3, average, true high, and true low.
High Factor 103 The factor is multiplied by the 3 period moving average of the lows.
Low Factor 97 The factor is multiplied by the 3 period moving average of the highs.
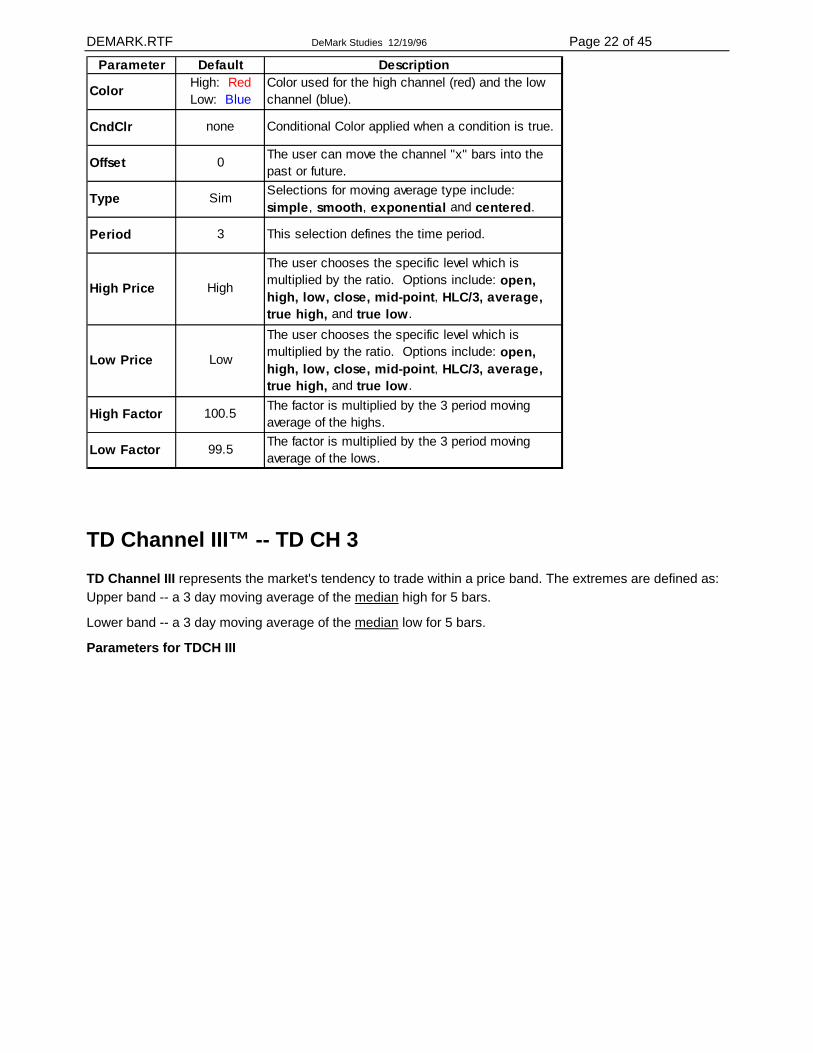
TD Channel II™ -- TD CH 2 TD Channel II represents the market's tendency to trade within a price band. The extremes are defined as: High band -- 100.5% above the 3 day moving average of the highs. Low band -- 99.5% below the 3 day moving average of the lows.
Parameters for TD CH II
DEMARK.RTF DeMark Studies 12/19/96 Page 22 of 45
Parameter Default Description
Color High: Red Low: Blue
Color used for the high channel (red) and the low channel (blue).
CndClr none Conditional Color applied when a condition is true.
Offset 0 The user can move the channel "x" bars into the past or future.
Type Sim Selections for moving average type include: simple, smooth, exponential and centered.
Period 3 This selection defines the time period.
High Price High
The user chooses the specific level which is multiplied by the ratio. Options include: open, high, low, close, mid-point, HLC/3, average, true high, and true low.
Low Price Low
The user chooses the specific level which is multiplied by the ratio. Options include: open, high, low, close, mid-point, HLC/3, average, true high, and true low.
High Factor 100.5 The factor is multiplied by the 3 period moving average of the highs.
Low Factor 99.5 The factor is multiplied by the 3 period moving average of the lows.
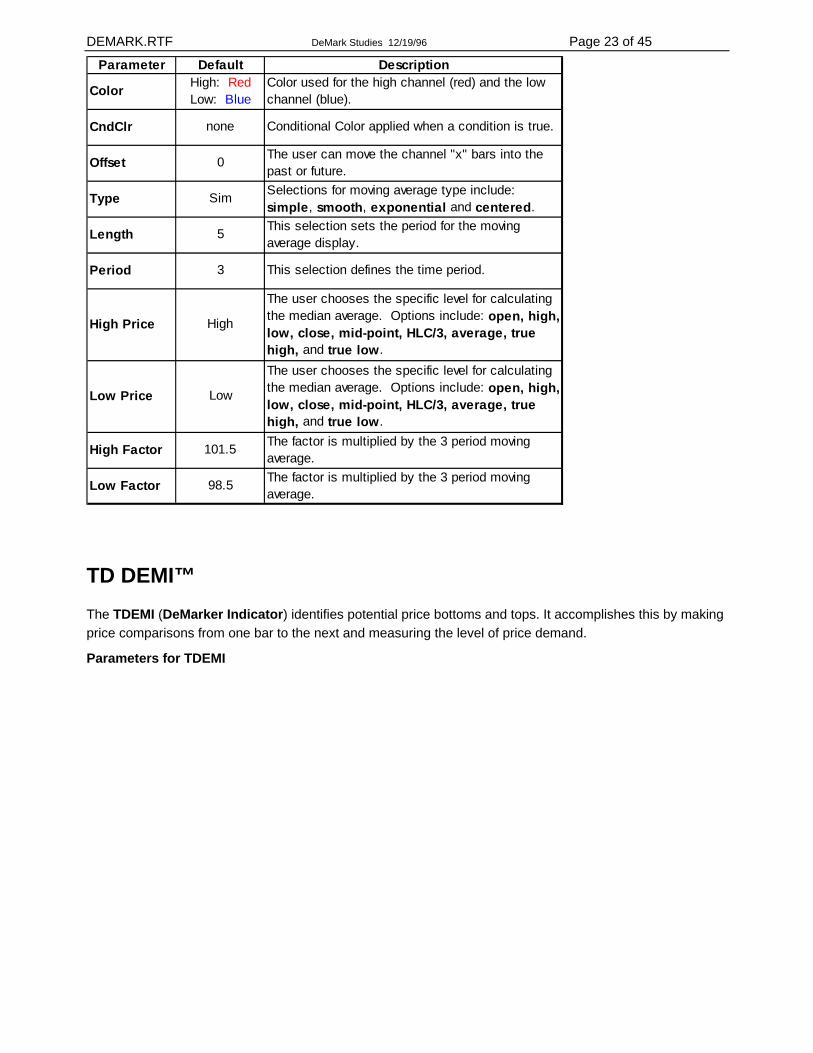
TD Channel III™ -- TD CH 3 TD Channel III represents the market's tendency to trade within a price band. The extremes are defined as: Upper band -- a 3 day moving average of the median high for 5 bars.
Lower band -- a 3 day moving average of the median low for 5 bars.
Parameters for TDCH III
DEMARK.RTF DeMark Studies 12/19/96 Page 23 of 45
Parameter Default Description
Color High: Red Low: Blue
Color used for the high channel (red) and the low channel (blue).
CndClr none Conditional Color applied when a condition is true.
Offset 0 The user can move the channel "x" bars into the past or future.
Type Sim Selections for moving average type include: simple, smooth, exponential and centered.
Length 5 This selection sets the period for the moving average display.
Period 3 This selection defines the time period.
High Price High
The user chooses the specific level for calculating the median average. Options include: open, high, low, close, mid-point, HLC/3, average, true high, and true low.
Low Price Low
The user chooses the specific level for calculating the median average. Options include: open, high, low, close, mid-point, HLC/3, average, true high, and true low.
High Factor 101.5 The factor is multiplied by the 3 period moving average.
Low Factor 98.5 The factor is multiplied by the 3 period moving average.
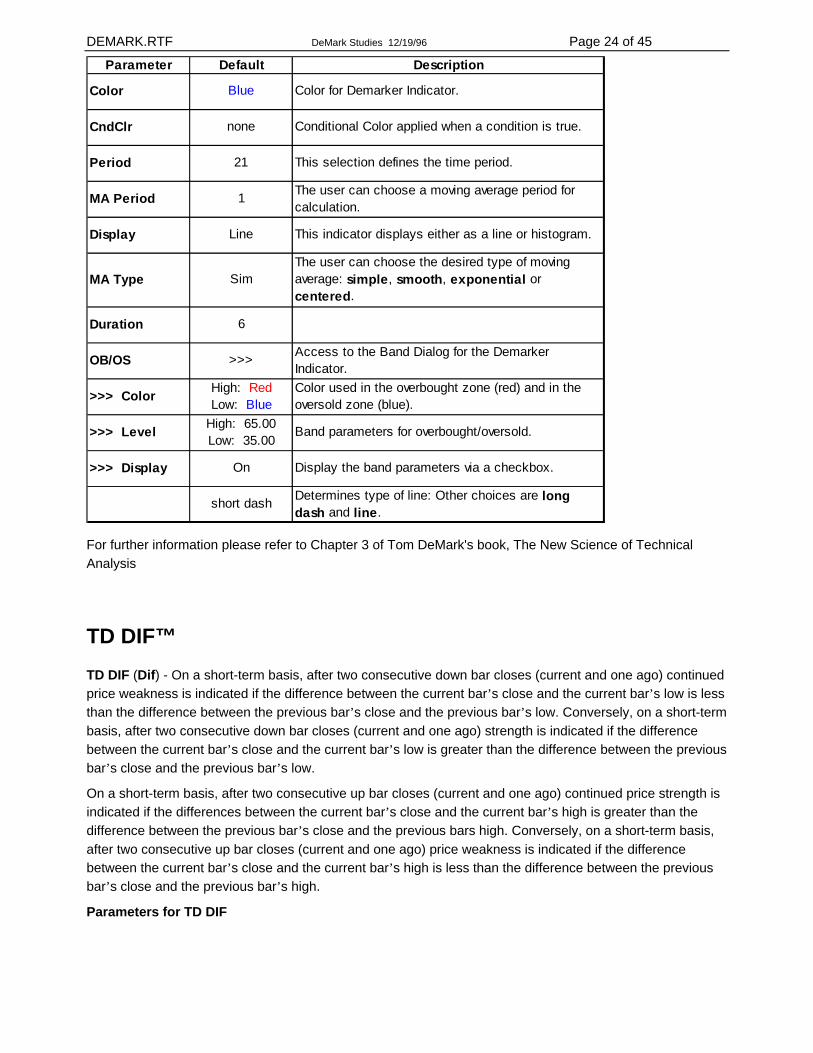
TD DEMI™ The TDEMI (DeMarker Indicator) identifies potential price bottoms and tops. It accomplishes this by making price comparisons from one bar to the next and measuring the level of price demand.
Parameters for TDEMI
DEMARK.RTF DeMark Studies 12/19/96 Page 24 of 45
Parameter Default Description
Color Blue Color for Demarker Indicator.
CndClr none Conditional Color applied when a condition is true.
Period 21 This selection defines the time period.
MA Period 1 The user can choose a moving average period for calculation.
Display Line This indicator displays either as a line or histogram.
MA Type SimThe user can choose the desired type of moving average: simple, smooth, exponential or centered.
Duration 6
OB/OS >>> Access to the Band Dialog for the Demarker Indicator.
>>> Color High: Red Low: Blue
Color used in the overbought zone (red) and in the oversold zone (blue).
>>> Level High: 65.00 Low: 35.00
Band parameters for overbought/oversold.
>>> Display On Display the band parameters via a checkbox.
short dash Determines type of line: Other choices are long dash and line.
For further information please refer to Chapter 3 of Tom DeMark's book, The New Science of Technical Analysis
TD DIF™ TD DIF (Dif) - On a short-term basis, after two consecutive down bar closes (current and one ago) continued price weakness is indicated if the difference between the current bar’s close and the current bar’s low is less than the difference between the previous bar’s close and the previous bar’s low. Conversely, on a short-term basis, after two consecutive down bar closes (current and one ago) strength is indicated if the difference between the current bar’s close and the current bar’s low is greater than the difference between the previous bar’s close and the previous bar’s low.
On a short-term basis, after two consecutive up bar closes (current and one ago) continued price strength is indicated if the differences between the current bar’s close and the current bar’s high is greater than the difference between the previous bar’s close and the previous bars high. Conversely, on a short-term basis, after two consecutive up bar closes (current and one ago) price weakness is indicated if the difference between the current bar’s close and the current bar’s high is less than the difference between the previous bar’s close and the previous bar’s high.
Parameters for TD DIF
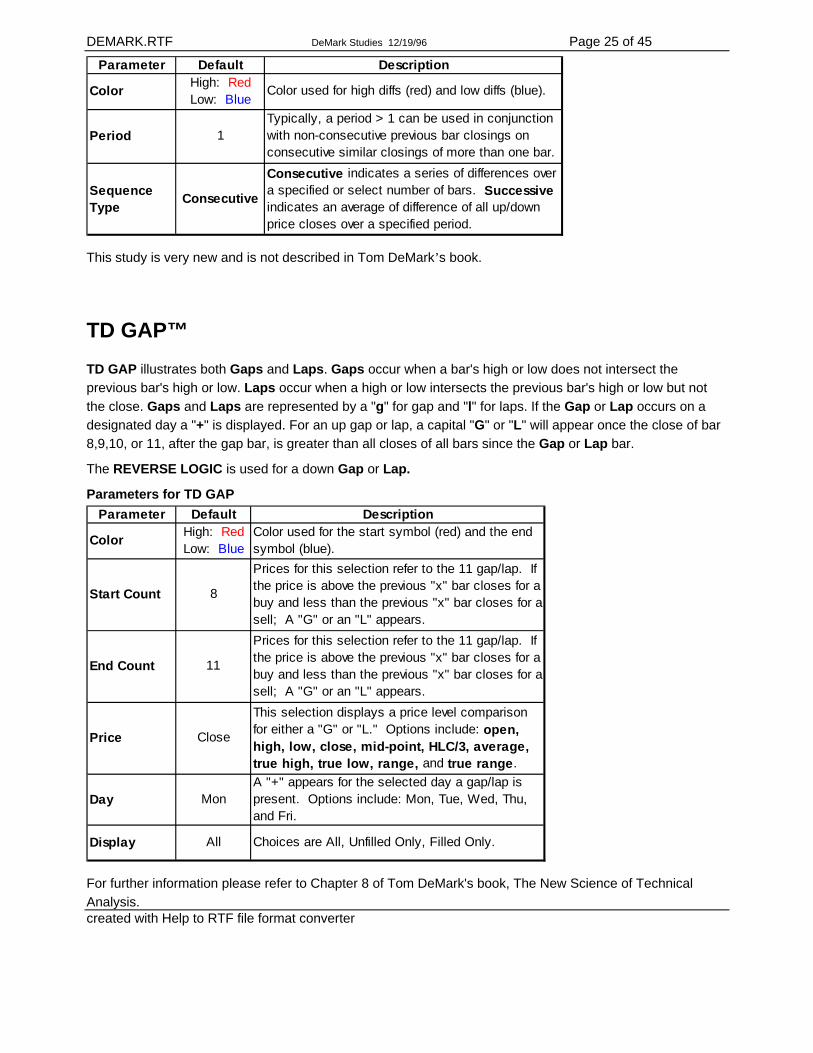
DEMARK.RTF DeMark Studies 12/19/96 Page 25 of 45
Parameter Default Description
Color High: Red Low: Blue
Color used for high diffs (red) and low diffs (blue).
Period 1Typically, a period > 1 can be used in conjunction with non-consecutive previous bar closings on consecutive similar closings of more than one bar.
Sequence Type Consecutive
Consecutive indicates a series of differences over a specified or select number of bars. Successive indicates an average of difference of all up/down price closes over a specified period.
This study is very new and is not described in Tom DeMark’s book.
TD GAP™ TD GAP illustrates both Gaps and Laps. Gaps occur when a bar's high or low does not intersect the previous bar's high or low. Laps occur when a high or low intersects the previous bar's high or low but not the close. Gaps and Laps are represented by a "g" for gap and "l" for laps. If the Gap or Lap occurs on a designated day a "+" is displayed. For an up gap or lap, a capital "G" or "L" will appear once the close of bar 8,9,10, or 11, after the gap bar, is greater than all closes of all bars since the Gap or Lap bar.
The REVERSE LOGIC is used for a down Gap or Lap.
Parameters for TD GAP Parameter Default Description
Color High: Red Low: Blue
Color used for the start symbol (red) and the end symbol (blue).
Start Count 8
Prices for this selection refer to the 11 gap/lap. If the price is above the previous "x" bar closes for a buy and less than the previous "x" bar closes for a sell; A "G" or an "L" appears.
End Count 11
Prices for this selection refer to the 11 gap/lap. If the price is above the previous "x" bar closes for a buy and less than the previous "x" bar closes for a sell; A "G" or an "L" appears.
Price Close
This selection displays a price level comparison for either a "G" or "L." Options include: open, high, low, close, mid-point, HLC/3, average, true high, true low, range, and true range.
Day MonA "+" appears for the selected day a gap/lap is present. Options include: Mon, Tue, Wed, Thu, and Fri.
Display All Choices are All, Unfilled Only, Filled Only.
For further information please refer to Chapter 8 of Tom DeMark's book, The New Science of Technical Analysis. created with Help to RTF file format converter
DEMARK.RTF DeMark Studies 12/19/96 Page 26 of 45
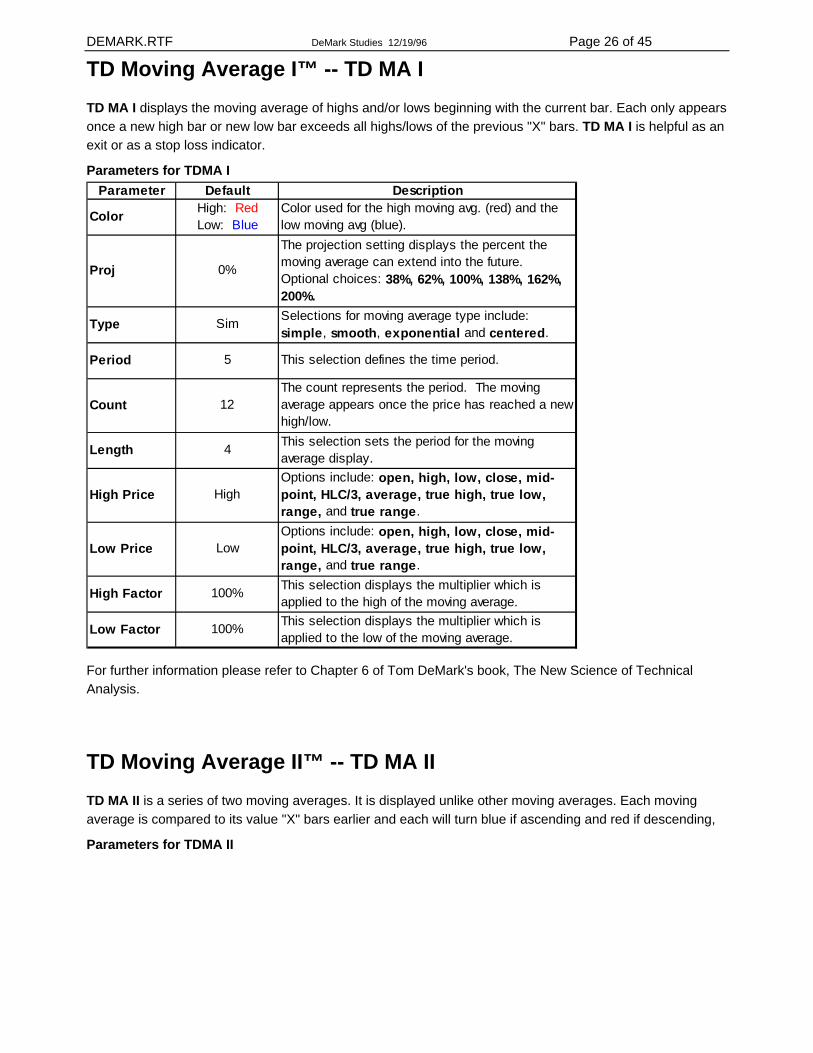
TD Moving Average I™ -- TD MA I TD MA I displays the moving average of highs and/or lows beginning with the current bar. Each only appears once a new high bar or new low bar exceeds all highs/lows of the previous "X" bars. TD MA I is helpful as an exit or as a stop loss indicator.
Parameters for TDMA I Parameter Default Description
Color High: Red Low: Blue
Color used for the high moving avg. (red) and the low moving avg (blue).
Proj 0%
The projection setting displays the percent the moving average can extend into the future. Optional choices: 38%, 62%, 100%, 138%, 162%, 200%.
Type Sim Selections for moving average type include: simple, smooth, exponential and centered.
Period 5 This selection defines the time period.
Count 12The count represents the period. The moving average appears once the price has reached a new high/low.
Length 4 This selection sets the period for the moving average display.
High Price HighOptions include: open, high, low, close, mid-point, HLC/3, average, true high, true low, range, and true range.
Low Price LowOptions include: open, high, low, close, mid-point, HLC/3, average, true high, true low, range, and true range.
High Factor 100% This selection displays the multiplier which is applied to the high of the moving average.
Low Factor 100% This selection displays the multiplier which is applied to the low of the moving average.
For further information please refer to Chapter 6 of Tom DeMark's book, The New Science of Technical Analysis.
TD Moving Average II™ -- TD MA II TD MA II is a series of two moving averages. It is displayed unlike other moving averages. Each moving average is compared to its value "X" bars earlier and each will turn blue if ascending and red if descending,
Parameters for TDMA II
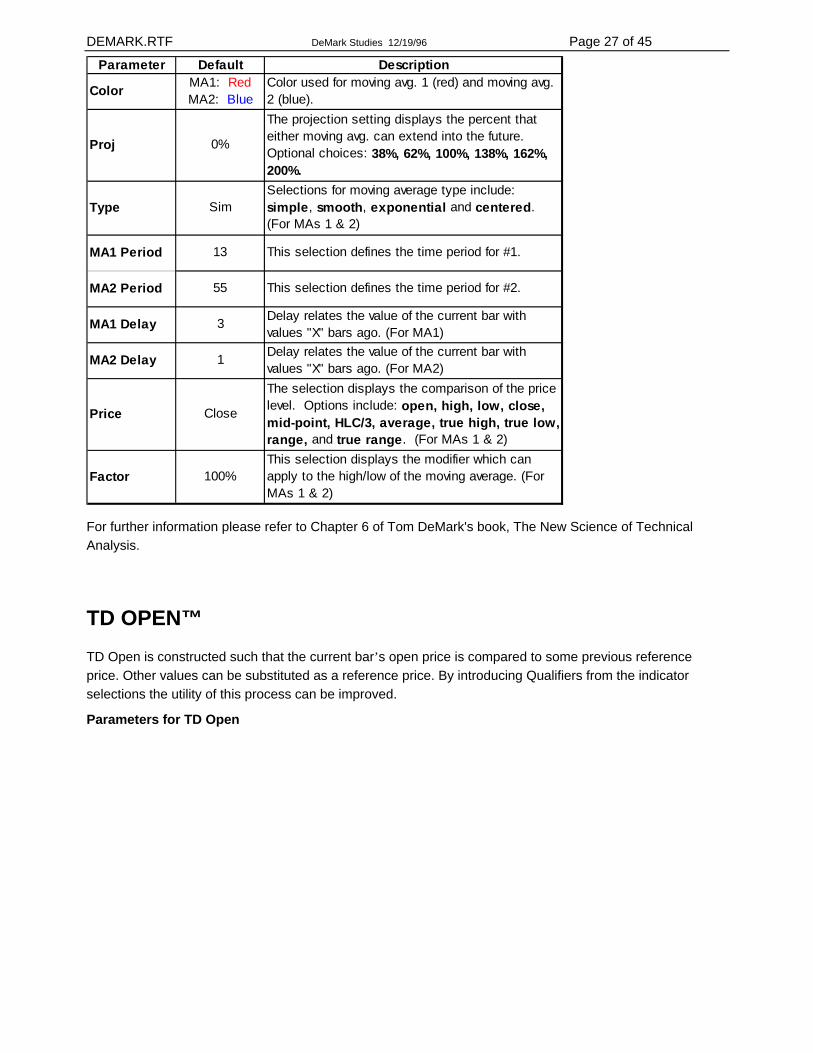
DEMARK.RTF DeMark Studies 12/19/96 Page 27 of 45
Parameter Default Description
Color MA1: Red MA2: Blue
Color used for moving avg. 1 (red) and moving avg. 2 (blue).
Proj 0%
The projection setting displays the percent that either moving avg. can extend into the future. Optional choices: 38%, 62%, 100%, 138%, 162%, 200%.
Type SimSelections for moving average type include: simple, smooth, exponential and centered. (For MAs 1 & 2)
MA1 Period 13 This selection defines the time period for #1.
MA2 Period 55 This selection defines the time period for #2.
MA1 Delay 3 Delay relates the value of the current bar with values "X" bars ago. (For MA1)
MA2 Delay 1 Delay relates the value of the current bar with values "X" bars ago. (For MA2)
Price Close
The selection displays the comparison of the price level. Options include: open, high, low, close, mid-point, HLC/3, average, true high, true low, range, and true range. (For MAs 1 & 2)
Factor 100%This selection displays the modifier which can apply to the high/low of the moving average. (For MAs 1 & 2)
For further information please refer to Chapter 6 of Tom DeMark's book, The New Science of Technical Analysis.
TD OPEN™ TD Open is constructed such that the current bar’s open price is compared to some previous reference price. Other values can be substituted as a reference price. By introducing Qualifiers from the indicator selections the utility of this process can be improved.
Parameters for TD Open
DEMARK.RTF DeMark Studies 12/19/96 Page 28 of 45
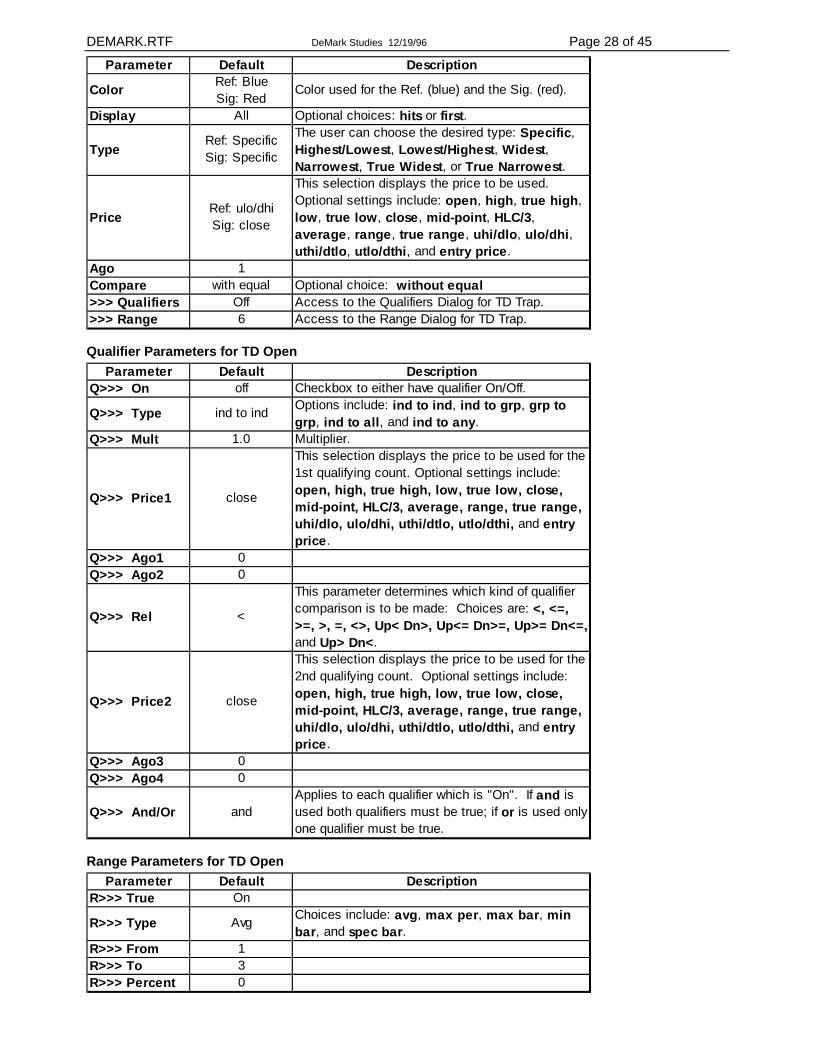
Parameter Default Description
Color Ref: Blue Sig: Red
Color used for the Ref. (blue) and the Sig. (red).
Display All Optional choices: hits or first.
Type Ref: Specific Sig: Specific
The user can choose the desired type: Specific, Highest/Lowest, Lowest/Highest, Widest, Narrowest, True Widest, or True Narrowest.
PriceRef: ulo/dhi Sig: close
This selection displays the price to be used. Optional settings include: open, high, true high, low, true low, close, mid-point, HLC/3, average, range, true range, uhi/dlo, ulo/dhi, uthi/dtlo, utlo/dthi, and entry price.
Ago 1Compare with equal Optional choice: without equal>>> Qualifiers Off Access to the Qualifiers Dialog for TD Trap.>>> Range 6 Access to the Range Dialog for TD Trap.
Qualifier Parameters for TD Open Parameter Default Description
Q>>> On off Checkbox to either have qualifier On/Off.
Q>>> Type ind to ind Options include: ind to ind, ind to grp, grp to grp, ind to all, and ind to any.
Q>>> Mult 1.0 Multiplier.
Q>>> Price1 close
This selection displays the price to be used for the 1st qualifying count. Optional settings include: open, high, true high, low, true low, close, mid-point, HLC/3, average, range, true range, uhi/dlo, ulo/dhi, uthi/dtlo, utlo/dthi, and entry price.
Q>>> Ago1 0Q>>> Ago2 0
Q>>> Rel <
This parameter determines which kind of qualifier comparison is to be made: Choices are: <, <=, >=, >, =, <>, Up< Dn>, Up<= Dn>=, Up>= Dn<=, and Up> Dn<.
Q>>> Price2 close
This selection displays the price to be used for the 2nd qualifying count. Optional settings include: open, high, true high, low, true low, close, mid-point, HLC/3, average, range, true range, uhi/dlo, ulo/dhi, uthi/dtlo, utlo/dthi, and entry price.
Q>>> Ago3 0Q>>> Ago4 0
Q>>> And/Or andApplies to each qualifier which is "On". If and is used both qualifiers must be true; if or is used only one qualifier must be true.
Range Parameters for TD Open Parameter Default Description
R>>> True On
R>>> Type Avg Choices include: avg, max per, max bar, min bar, and spec bar.
R>>> From 1R>>> To 3R>>> Percent 0
DEMARK.RTF DeMark Studies 12/19/96 Page 29 of 45
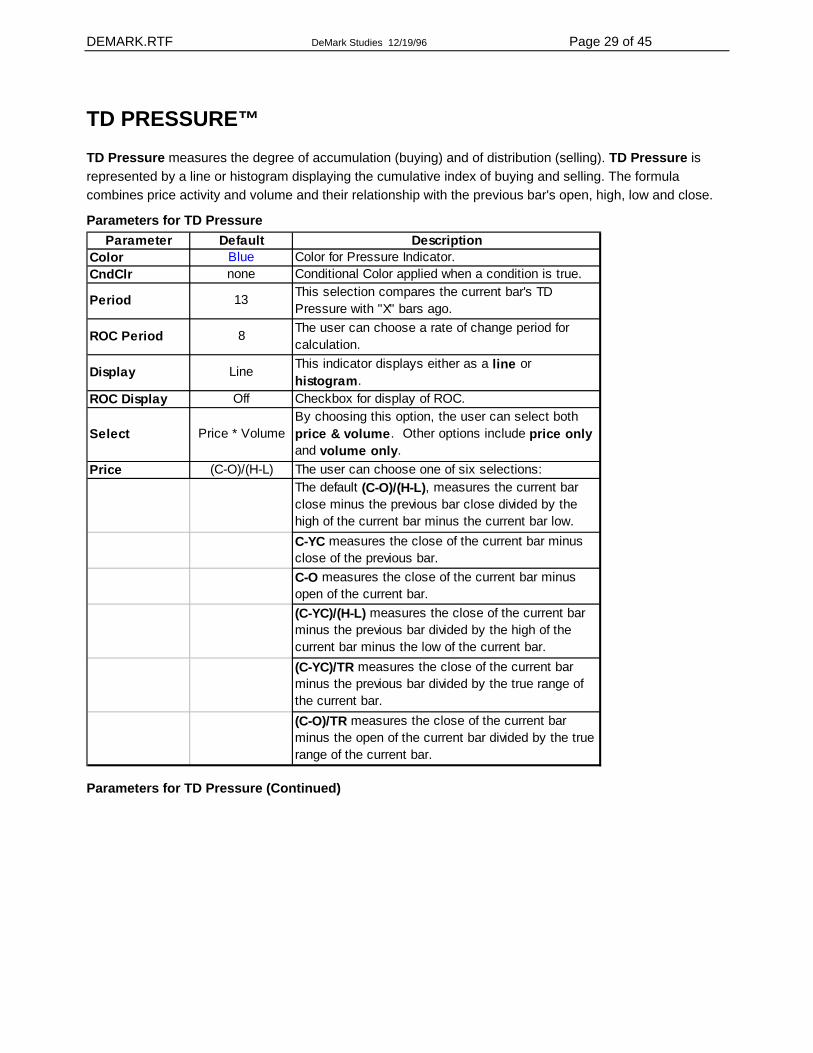
TD PRESSURE™ TD Pressure measures the degree of accumulation (buying) and of distribution (selling). TD Pressure is represented by a line or histogram displaying the cumulative index of buying and selling. The formula combines price activity and volume and their relationship with the previous bar's open, high, low and close.
Parameters for TD Pressure Parameter Default Description
Color Blue Color for Pressure Indicator.CndClr none Conditional Color applied when a condition is true.
Period 13 This selection compares the current bar's TD Pressure with "X" bars ago.
ROC Period 8 The user can choose a rate of change period for calculation.
Display Line This indicator displays either as a line or histogram.
ROC Display Off Checkbox for display of ROC.
Select Price * VolumeBy choosing this option, the user can select both price & volume. Other options include price only and volume only.
Price (C-O)/(H-L) The user can choose one of six selections: The default (C-O)/(H-L), measures the current bar close minus the previous bar close divided by the high of the current bar minus the current bar low.C-YC measures the close of the current bar minus close of the previous bar.C-O measures the close of the current bar minus open of the current bar.(C-YC)/(H-L) measures the close of the current bar minus the previous bar divided by the high of the current bar minus the low of the current bar. (C-YC)/TR measures the close of the current bar minus the previous bar divided by the true range of the current bar. (C-O)/TR measures the close of the current bar minus the open of the current bar divided by the true range of the current bar.
Parameters for TD Pressure (Continued)
DEMARK.RTF DeMark Studies 12/19/96 Page 30 of 45
Parameter Default Description
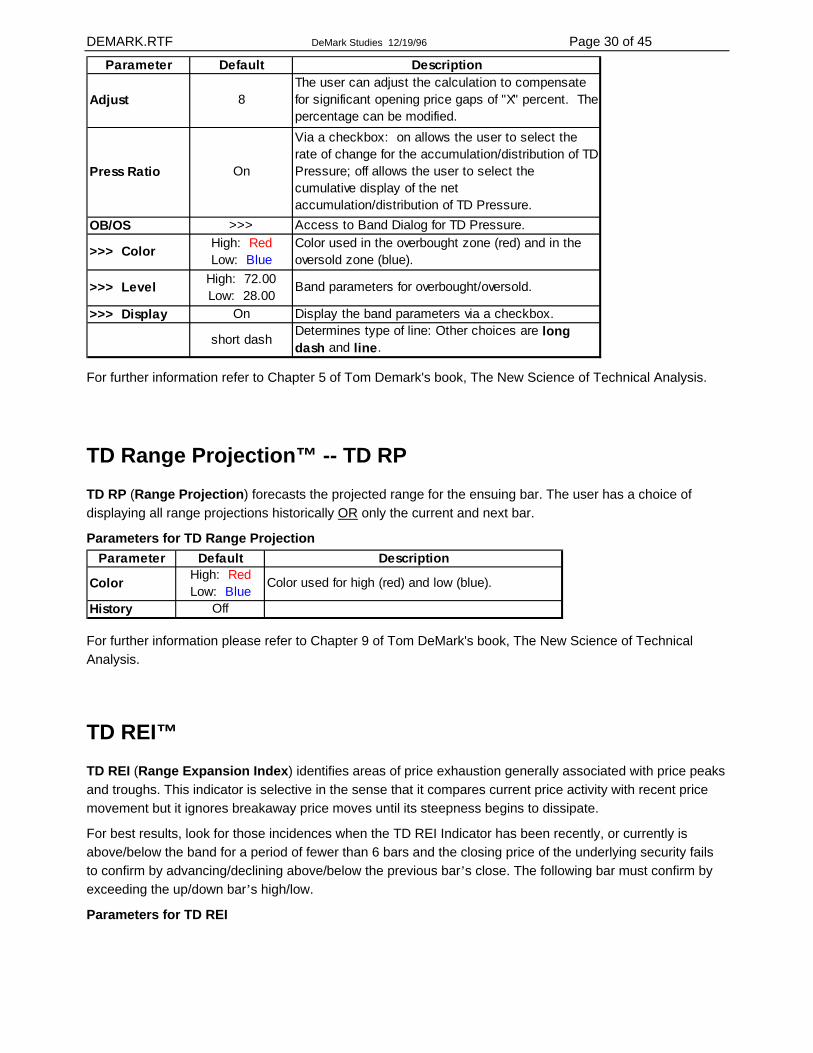
Adjust 8The user can adjust the calculation to compensate for significant opening price gaps of "X" percent. The percentage can be modified.
Press Ratio On
Via a checkbox: on allows the user to select the rate of change for the accumulation/distribution of TD Pressure; off allows the user to select the cumulative display of the net accumulation/distribution of TD Pressure.
OB/OS >>> Access to Band Dialog for TD Pressure.
>>> Color High: Red Low: Blue
Color used in the overbought zone (red) and in the oversold zone (blue).
>>> Level High: 72.00 Low: 28.00
Band parameters for overbought/oversold.
>>> Display On Display the band parameters via a checkbox.
short dashDetermines type of line: Other choices are long dash and line.
For further information refer to Chapter 5 of Tom Demark's book, The New Science of Technical Analysis.
TD Range Projection™ -- TD RP TD RP (Range Projection) forecasts the projected range for the ensuing bar. The user has a choice of displaying all range projections historically OR only the current and next bar.
Parameters for TD Range Projection Parameter Default Description
Color High: Red Low: Blue
Color used for high (red) and low (blue).
History Off
For further information please refer to Chapter 9 of Tom DeMark's book, The New Science of Technical Analysis.
TD REI™ TD REI (Range Expansion Index) identifies areas of price exhaustion generally associated with price peaks and troughs. This indicator is selective in the sense that it compares current price activity with recent price movement but it ignores breakaway price moves until its steepness begins to dissipate.
For best results, look for those incidences when the TD REI Indicator has been recently, or currently is above/below the band for a period of fewer than 6 bars and the closing price of the underlying security fails to confirm by advancing/declining above/below the previous bar’s close. The following bar must confirm by exceeding the up/down bar’s high/low.
Parameters for TD REI
DEMARK.RTF DeMark Studies 12/19/96 Page 31 of 45
Parameter Default Description
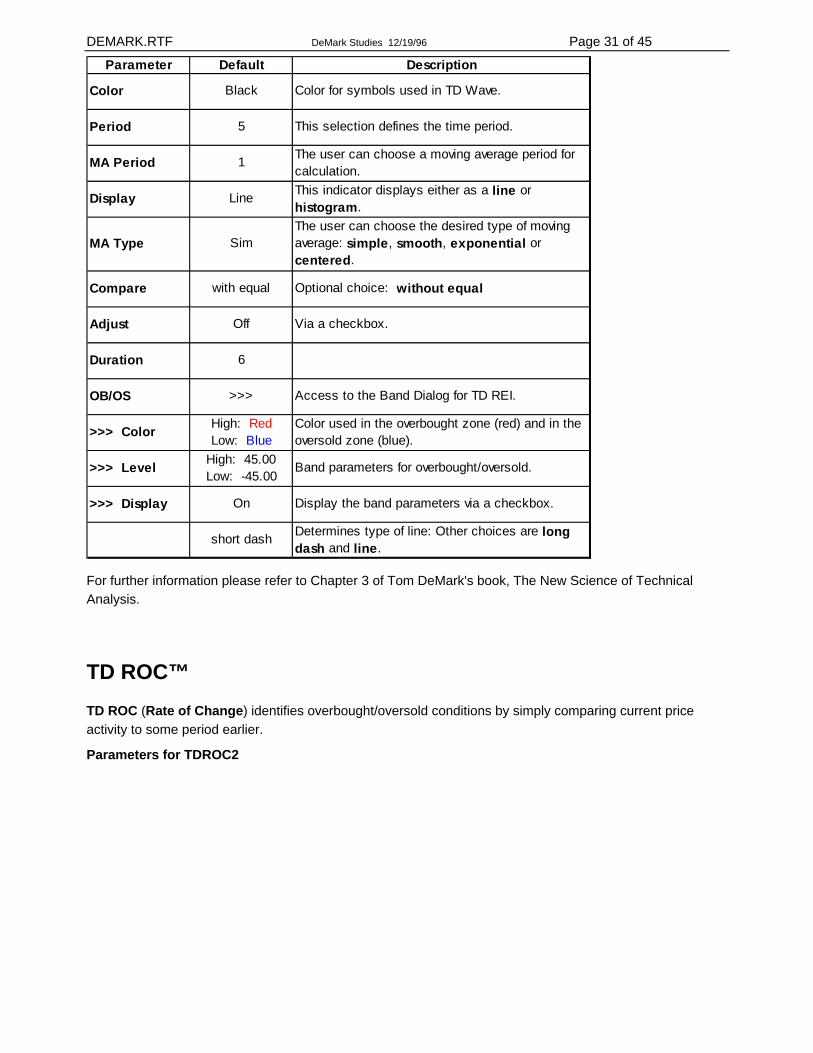
Color Black Color for symbols used in TD Wave.
Period 5 This selection defines the time period.
MA Period 1 The user can choose a moving average period for calculation.
Display Line This indicator displays either as a line or histogram.
MA Type SimThe user can choose the desired type of moving average: simple, smooth, exponential or centered.
Compare with equal Optional choice: without equal
Adjust Off Via a checkbox.
Duration 6
OB/OS >>> Access to the Band Dialog for TD REI.
>>> Color High: Red Low: Blue
Color used in the overbought zone (red) and in the oversold zone (blue).
>>> Level High: 45.00 Low: -45.00
Band parameters for overbought/oversold.
>>> Display On Display the band parameters via a checkbox.
short dash Determines type of line: Other choices are long dash and line.
For further information please refer to Chapter 3 of Tom DeMark's book, The New Science of Technical Analysis.
TD ROC™ TD ROC (Rate of Change) identifies overbought/oversold conditions by simply comparing current price activity to some period earlier.
Parameters for TDROC2
DEMARK.RTF DeMark Studies 12/19/96 Page 32 of 45
Parameter Default Description
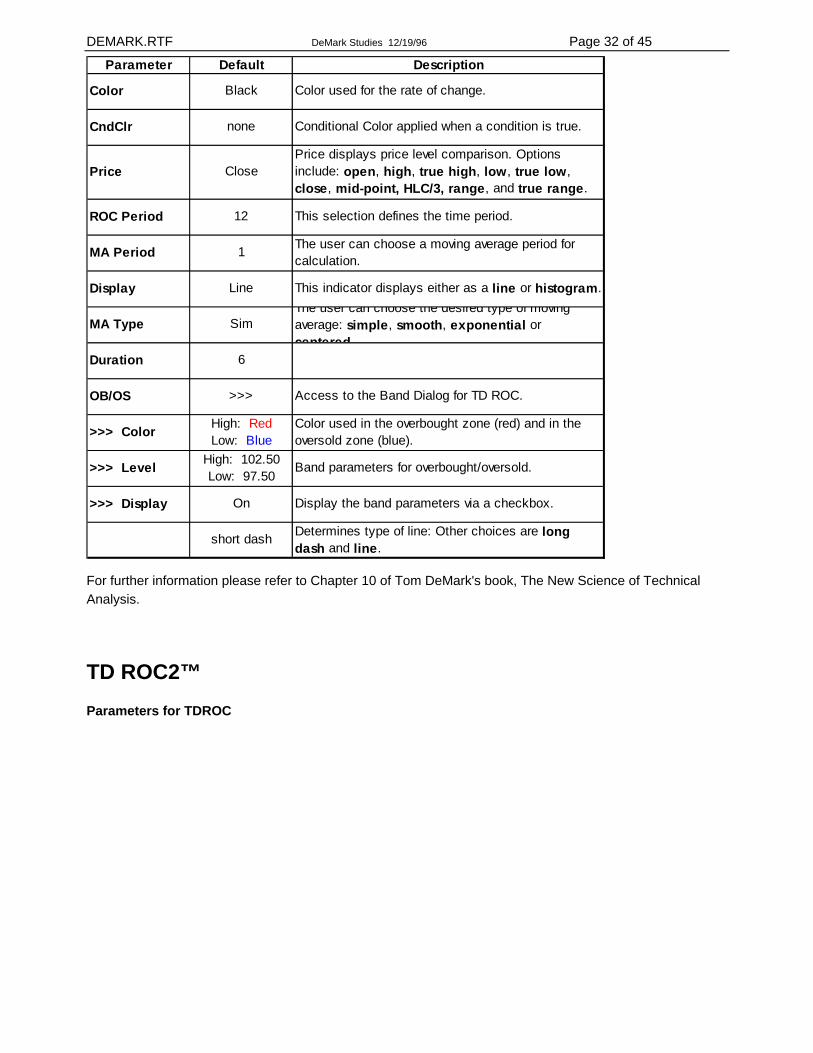
Color Black Color used for the rate of change.
CndClr none Conditional Color applied when a condition is true.
Price ClosePrice displays price level comparison. Options include: open, high, true high, low, true low, close, mid-point, HLC/3, range, and true range.
ROC Period 12 This selection defines the time period.
MA Period 1 The user can choose a moving average period for calculation.
Display Line This indicator displays either as a line or histogram.
MA Type SimThe user can choose the desired type of moving average: simple, smooth, exponential or centered
Duration 6
OB/OS >>> Access to the Band Dialog for TD ROC.
>>> Color High: Red Low: Blue
Color used in the overbought zone (red) and in the oversold zone (blue).
>>> Level High: 102.50 Low: 97.50
Band parameters for overbought/oversold.
>>> Display On Display the band parameters via a checkbox.
short dash Determines type of line: Other choices are long dash and line.
For further information please refer to Chapter 10 of Tom DeMark's book, The New Science of Technical Analysis.
TD ROC2™ Parameters for TDROC
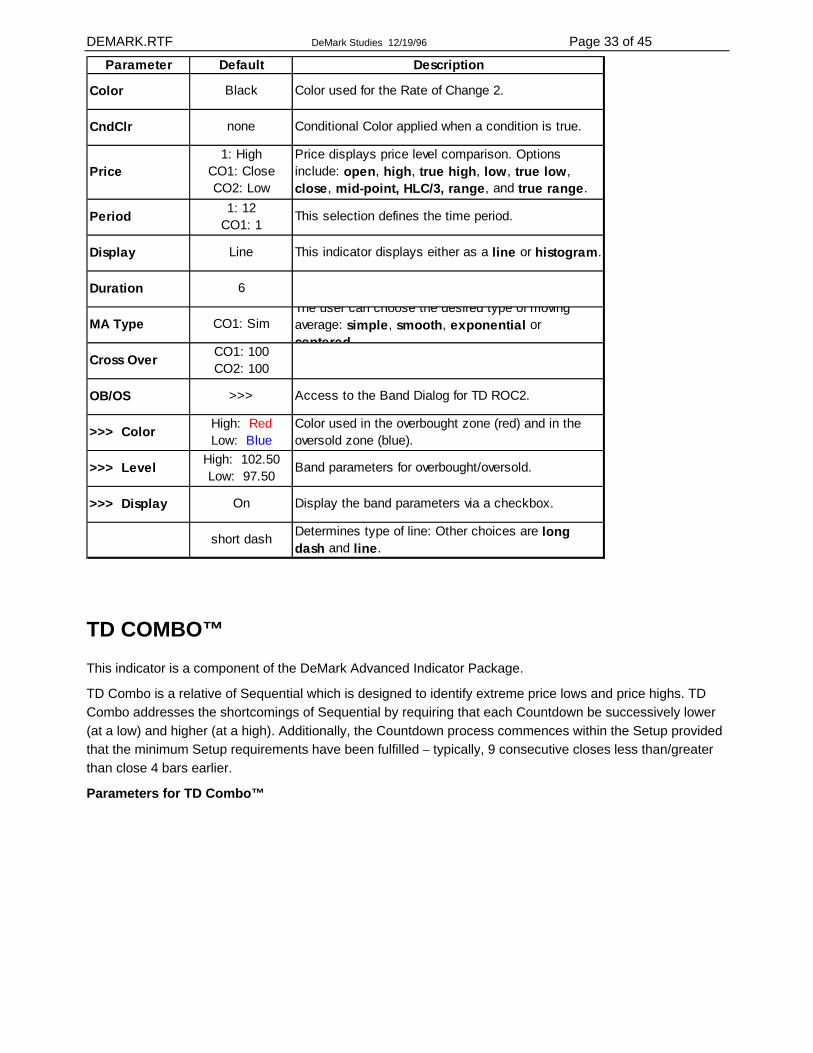
DEMARK.RTF DeMark Studies 12/19/96 Page 33 of 45
Parameter Default Description
Color Black Color used for the Rate of Change 2.
CndClr none Conditional Color applied when a condition is true.
Price1: High
CO1: Close CO2: Low
Price displays price level comparison. Options include: open, high, true high, low, true low, close, mid-point, HLC/3, range, and true range.
Period 1: 12 CO1: 1
This selection defines the time period.
Display Line This indicator displays either as a line or histogram.
Duration 6
MA Type CO1: SimThe user can choose the desired type of moving average: simple, smooth, exponential or centered
Cross Over CO1: 100 CO2: 100
OB/OS >>> Access to the Band Dialog for TD ROC2.
>>> Color High: Red Low: Blue
Color used in the overbought zone (red) and in the oversold zone (blue).
>>> Level High: 102.50 Low: 97.50
Band parameters for overbought/oversold.
>>> Display On Display the band parameters via a checkbox.
short dash Determines type of line: Other choices are long dash and line.
TD COMBO™ This indicator is a component of the DeMark Advanced Indicator Package.
TD Combo is a relative of Sequential which is designed to identify extreme price lows and price highs. TD Combo addresses the shortcomings of Sequential by requiring that each Countdown be successively lower (at a low) and higher (at a high). Additionally, the Countdown process commences within the Setup provided that the minimum Setup requirements have been fulfilled – typically, 9 consecutive closes less than/greater than close 4 bars earlier.
Parameters for TD Combo™
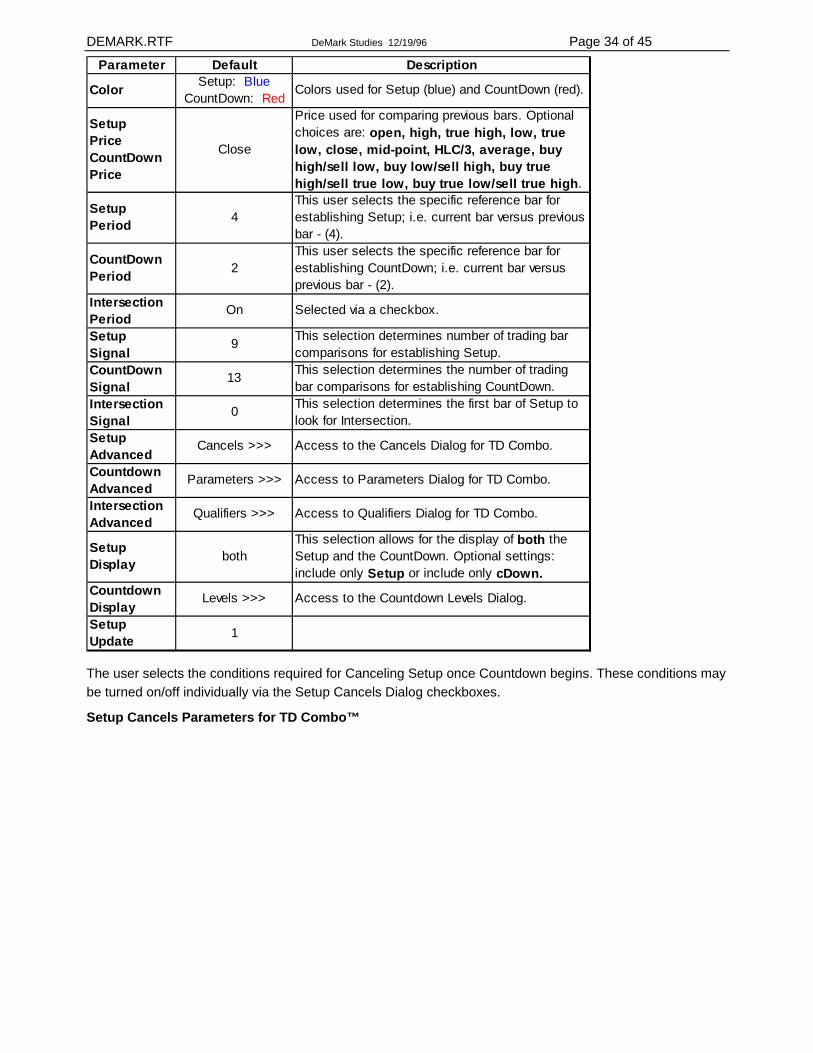
DEMARK.RTF DeMark Studies 12/19/96 Page 34 of 45
Parameter Default Description
Color Setup: Blue CountDown: Red
Colors used for Setup (blue) and CountDown (red).
Setup Price CountDown Price
Close
Price used for comparing previous bars. Optional choices are: open, high, true high, low, true low, close, mid-point, HLC/3, average, buy high/sell low, buy low/sell high, buy true high/sell true low, buy true low/sell true high.
Setup Period 4
This user selects the specific reference bar for establishing Setup; i.e. current bar versus previous bar - (4).
CountDown Period 2
This user selects the specific reference bar for establishing CountDown; i.e. current bar versus previous bar - (2).
Intersection Period
On Selected via a checkbox.
Setup Signal
9 This selection determines number of trading bar comparisons for establishing Setup.
CountDown Signal
13 This selection determines the number of trading bar comparisons for establishing CountDown.
Intersection Signal
0 This selection determines the first bar of Setup to look for Intersection.
Setup Advanced
Cancels >>> Access to the Cancels Dialog for TD Combo.
Countdown Advanced
Parameters >>> Access to Parameters Dialog for TD Combo.
Intersection Advanced
Qualifiers >>> Access to Qualifiers Dialog for TD Combo.
Setup Display both
This selection allows for the display of both the Setup and the CountDown. Optional settings: include only Setup or include only cDown.
Countdown Display
Levels >>> Access to the Countdown Levels Dialog.
Setup Update 1
The user selects the conditions required for Canceling Setup once Countdown begins. These conditions may be turned on/off individually via the Setup Cancels Dialog checkboxes.
Setup Cancels Parameters for TD Combo™

DEMARK.RTF DeMark Studies 12/19/96 Page 35 of 45
Parameter Default Description
HaHC/LbLC OffHaHC/LbLC - for Buy, cancel when High above Highest Close of Setup period; for Sell, cancel when Low below Lowest Close of Setup period.
HaHH/LbLL OffHaHH/LbLL - for Buy, cancel when High above Highest High of Setup period; for Sell, cancel when Low below Lowest Low of Setup period.
CaHC/CbLC OffCaHC/CbLC - for Buy, cancel when Close above Highest Close of Setup period; for Sell, cancel when Close below Lowest Close of Setup period.
CaHH/CbLL OffCaHH/CbLL - for Buy, cancel when Close above Highest High of Setup period; for Sell, cancel when Close below Lowest Low of Setup period.
CaHTH/CbLTL On
CaHTH/CbLTL - for Buy, cancel when Close above Highest True High of Setup period; for Sell, cancel when Close below Lowest True Low of Setup period.
Reverse OnReverse cancel allows the occurrence of a Setup of the opposite polarity (setup in other direction) to cancel the Countdown.
Within On
Various parameters for use with TD Combo can be selected via the Countdown Parameters Dialog.
Countdown Parameters for the TD Combo™
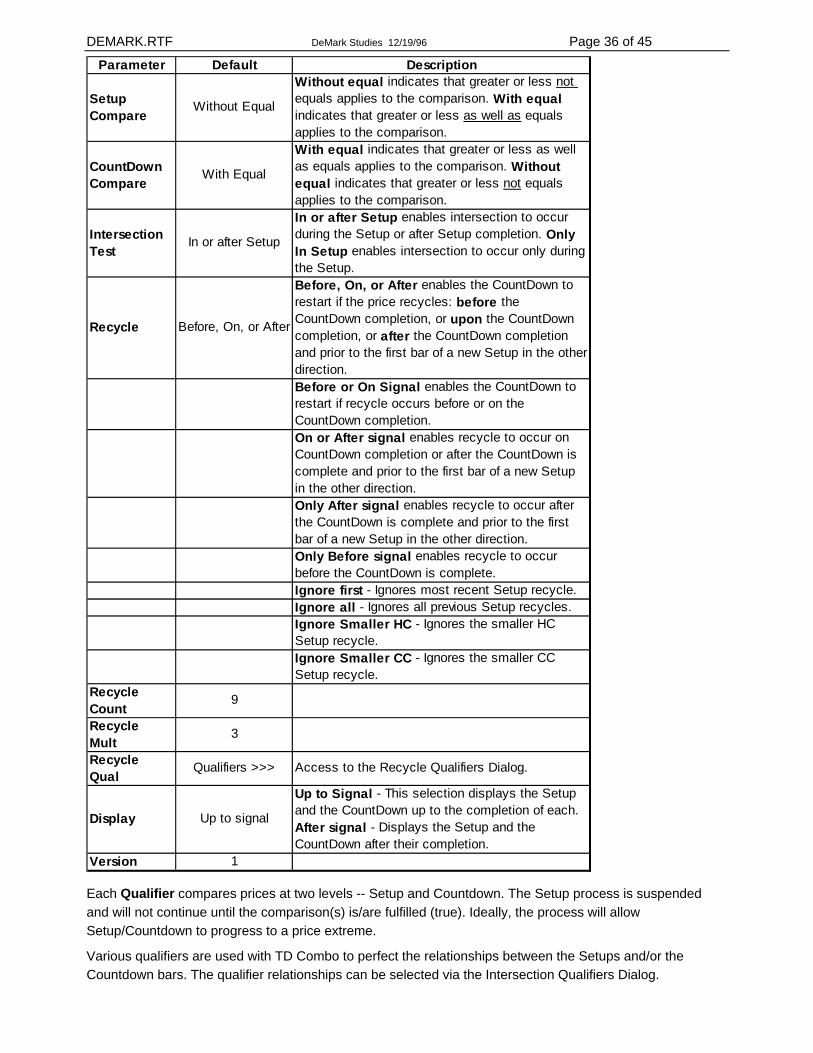
DEMARK.RTF DeMark Studies 12/19/96 Page 36 of 45
Parameter Default Description
Setup Compare
Without Equal
Without equal indicates that greater or less not equals applies to the comparison. With equal indicates that greater or less as well as equals applies to the comparison.
CountDown Compare
With Equal
With equal indicates that greater or less as well as equals applies to the comparison. Without equal indicates that greater or less not equals applies to the comparison.
Intersection Test
In or after Setup
In or after Setup enables intersection to occur during the Setup or after Setup completion. Only In Setup enables intersection to occur only during the Setup.
Recycle Before, On, or After
Before, On, or After enables the CountDown to restart if the price recycles: before the CountDown completion, or upon the CountDown completion, or after the CountDown completion and prior to the first bar of a new Setup in the other direction.
Before or On Signal enables the CountDown to restart if recycle occurs before or on the CountDown completion.
On or After signal enables recycle to occur on CountDown completion or after the CountDown is complete and prior to the first bar of a new Setup in the other direction.
Only After signal enables recycle to occur after the CountDown is complete and prior to the first bar of a new Setup in the other direction.
Only Before signal enables recycle to occur before the CountDown is complete.
Ignore first - Ignores most recent Setup recycle.Ignore all - Ignores all previous Setup recycles.Ignore Smaller HC - Ignores the smaller HC Setup recycle.
Ignore Smaller CC - Ignores the smaller CC Setup recycle.
Recycle Count
9
Recycle Mult
3
Recycle Qual
Qualifiers >>> Access to the Recycle Qualifiers Dialog.
Display Up to signal
Up to Signal - This selection displays the Setup and the CountDown up to the completion of each. After signal - Displays the Setup and the CountDown after their completion.
Version 1
Each Qualifier compares prices at two levels -- Setup and Countdown. The Setup process is suspended and will not continue until the comparison(s) is/are fulfilled (true). Ideally, the process will allow Setup/Countdown to progress to a price extreme.
Various qualifiers are used with TD Combo to perfect the relationships between the Setups and/or the Countdown bars. The qualifier relationships can be selected via the Intersection Qualifiers Dialog.
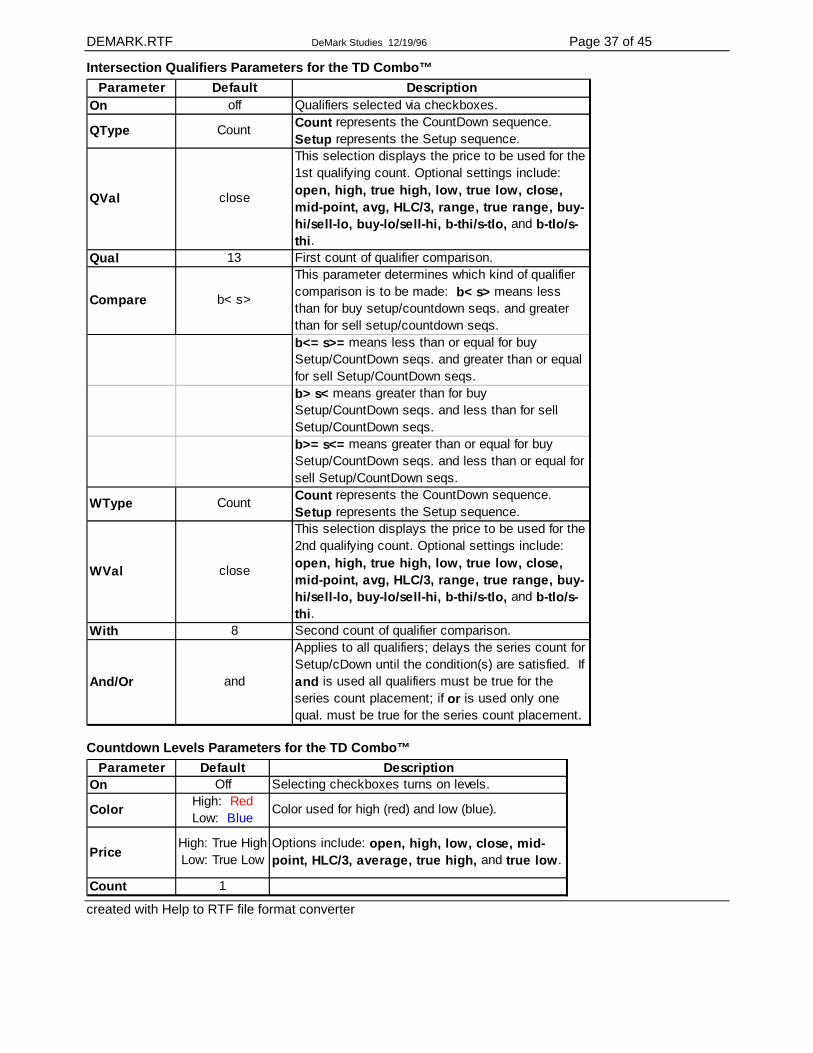
DEMARK.RTF DeMark Studies 12/19/96 Page 37 of 45
Intersection Qualifiers Parameters for the TD Combo™ Parameter Default Description
On off Qualifiers selected via checkboxes.
QType Count Count represents the CountDown sequence. Setup represents the Setup sequence.
QVal close
This selection displays the price to be used for the 1st qualifying count. Optional settings include: open, high, true high, low, true low, close, mid-point, avg, HLC/3, range, true range, buy-hi/sell-lo, buy-lo/sell-hi, b-thi/s-tlo, and b-tlo/s-thi.
Qual 13 First count of qualifier comparison.
Compare b< s>
This parameter determines which kind of qualifier comparison is to be made: b< s> means less than for buy setup/countdown seqs. and greater than for sell setup/countdown seqs.b<= s>= means less than or equal for buy Setup/CountDown seqs. and greater than or equal for sell Setup/CountDown seqs.b> s< means greater than for buy Setup/CountDown seqs. and less than for sell Setup/CountDown seqs.b>= s<= means greater than or equal for buy Setup/CountDown seqs. and less than or equal for sell Setup/CountDown seqs.
WType Count Count represents the CountDown sequence. Setup represents the Setup sequence.
WVal close
This selection displays the price to be used for the 2nd qualifying count. Optional settings include: open, high, true high, low, true low, close, mid-point, avg, HLC/3, range, true range, buy-hi/sell-lo, buy-lo/sell-hi, b-thi/s-tlo, and b-tlo/s-thi.
With 8 Second count of qualifier comparison.
And/Or and
Applies to all qualifiers; delays the series count for Setup/cDown until the condition(s) are satisfied. If and is used all qualifiers must be true for the series count placement; if or is used only one qual. must be true for the series count placement.
Countdown Levels Parameters for the TD Combo™ Parameter Default Description
On Off Selecting checkboxes turns on levels.
Color High: Red Low: Blue
Color used for high (red) and low (blue).
PriceHigh: True High Low: True Low
Options include: open, high, low, close, mid-point, HLC/3, average, true high, and true low.
Count 1 created with Help to RTF file format converter
DEMARK.RTF DeMark Studies 12/19/96 Page 38 of 45
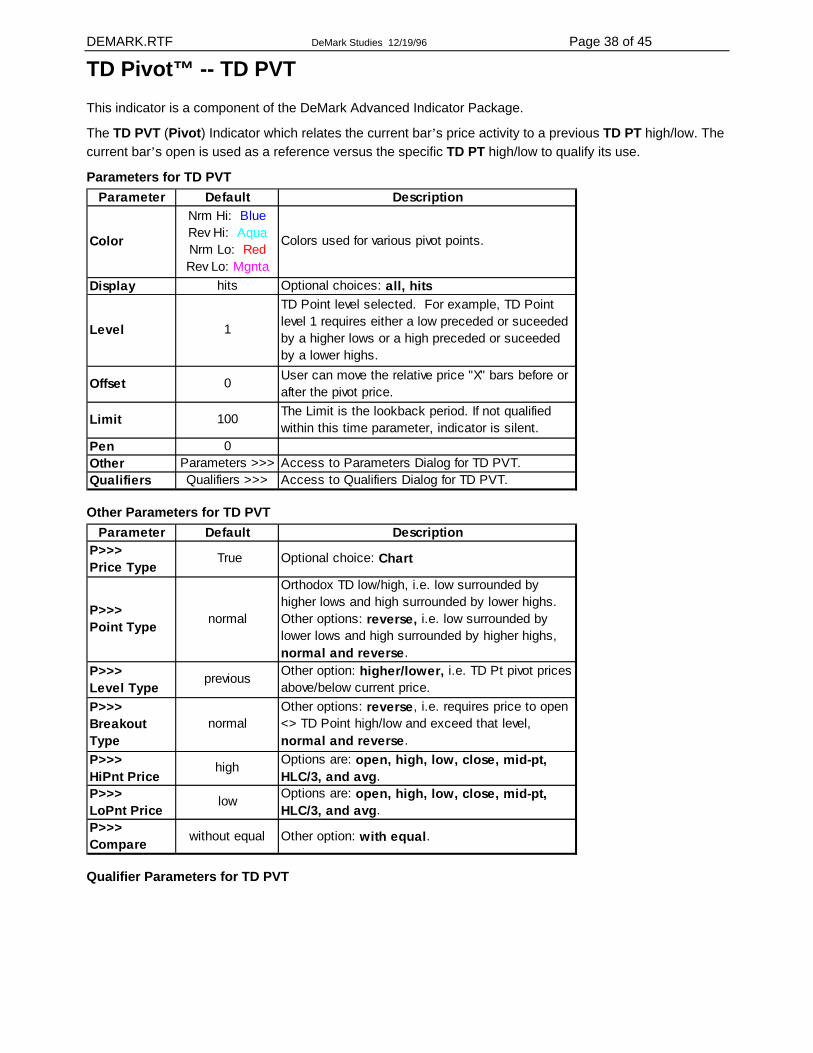
TD Pivot™ -- TD PVT This indicator is a component of the DeMark Advanced Indicator Package.
The TD PVT (Pivot) Indicator which relates the current bar’s price activity to a previous TD PT high/low. The current bar’s open is used as a reference versus the specific TD PT high/low to qualify its use.
Parameters for TD PVT Parameter Default Description
Color
Nrm Hi: Blue Rev Hi: Aqua Nrm Lo: Red Rev Lo: Mgnta
Colors used for various pivot points.
Display hits Optional choices: all, hits
Level 1
TD Point level selected. For example, TD Point level 1 requires either a low preceded or suceeded by a higher lows or a high preceded or suceeded by a lower highs.
Offset 0 User can move the relative price "X" bars before or after the pivot price.
Limit 100 The Limit is the lookback period. If not qualified within this time parameter, indicator is silent.
Pen 0Other Parameters >>> Access to Parameters Dialog for TD PVT.Qualifiers Qualifiers >>> Access to Qualifiers Dialog for TD PVT.
Other Parameters for TD PVT Parameter Default Description
P>>> Price Type
True Optional choice: Chart
P>>> Point Type normal
Orthodox TD low/high, i.e. low surrounded by higher lows and high surrounded by lower highs. Other options: reverse, i.e. low surrounded by lower lows and high surrounded by higher highs, normal and reverse.
P>>> Level Type
previous Other option: higher/lower, i.e. TD Pt pivot prices above/below current price.
P>>> Breakout Type
normalOther options: reverse, i.e. requires price to open <> TD Point high/low and exceed that level, normal and reverse.
P>>> HiPnt Price
high Options are: open, high, low, close, mid-pt, HLC/3, and avg.
P>>> LoPnt Price
low Options are: open, high, low, close, mid-pt, HLC/3, and avg.
P>>> Compare without equal Other option: with equal.
Qualifier Parameters for TD PVT
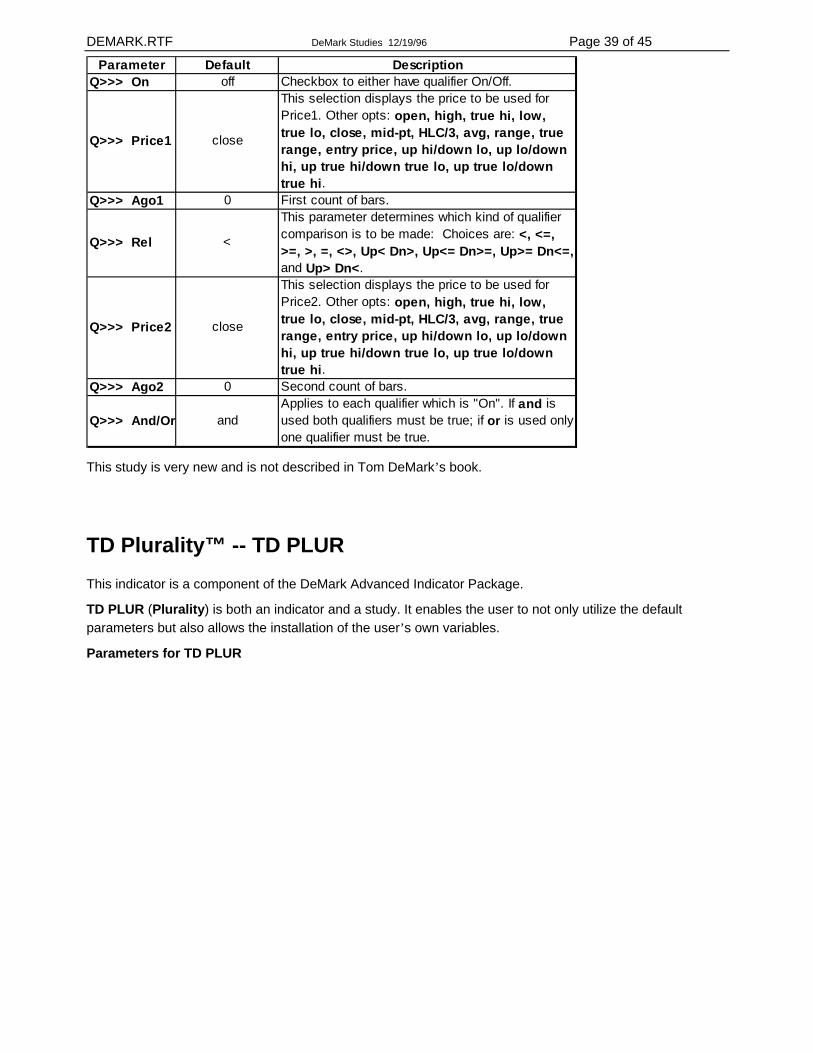
DEMARK.RTF DeMark Studies 12/19/96 Page 39 of 45
Parameter Default DescriptionQ>>> On off Checkbox to either have qualifier On/Off.
Q>>> Price1 close
This selection displays the price to be used for Price1. Other opts: open, high, true hi, low, true lo, close, mid-pt, HLC/3, avg, range, true range, entry price, up hi/down lo, up lo/down hi, up true hi/down true lo, up true lo/down true hi.
Q>>> Ago1 0 First count of bars.
Q>>> Rel <
This parameter determines which kind of qualifier comparison is to be made: Choices are: <, <=, >=, >, =, <>, Up< Dn>, Up<= Dn>=, Up>= Dn<=, and Up> Dn<.
Q>>> Price2 close
This selection displays the price to be used for Price2. Other opts: open, high, true hi, low, true lo, close, mid-pt, HLC/3, avg, range, true range, entry price, up hi/down lo, up lo/down hi, up true hi/down true lo, up true lo/down true hi.
Q>>> Ago2 0 Second count of bars.
Q>>> And/Or andApplies to each qualifier which is "On". If and is used both qualifiers must be true; if or is used only one qualifier must be true.
This study is very new and is not described in Tom DeMark’s book.
TD Plurality™ -- TD PLUR This indicator is a component of the DeMark Advanced Indicator Package.
TD PLUR (Plurality) is both an indicator and a study. It enables the user to not only utilize the default parameters but also allows the installation of the user’s own variables.
Parameters for TD PLUR
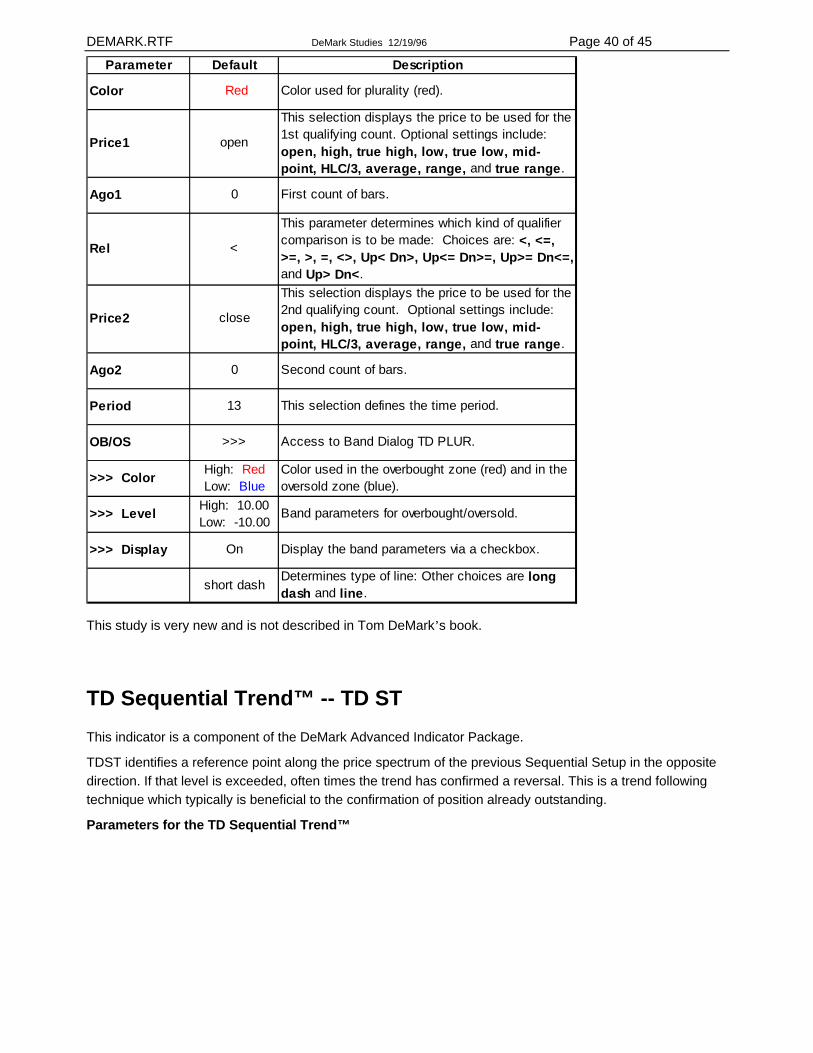
DEMARK.RTF DeMark Studies 12/19/96 Page 40 of 45
Parameter Default Description
Color Red Color used for plurality (red).
Price1 open
This selection displays the price to be used for the 1st qualifying count. Optional settings include: open, high, true high, low, true low, mid-point, HLC/3, average, range, and true range.
Ago1 0 First count of bars.
Rel <
This parameter determines which kind of qualifier comparison is to be made: Choices are: <, <=, >=, >, =, <>, Up< Dn>, Up<= Dn>=, Up>= Dn<=, and Up> Dn<.
Price2 close
This selection displays the price to be used for the 2nd qualifying count. Optional settings include: open, high, true high, low, true low, mid-point, HLC/3, average, range, and true range.
Ago2 0 Second count of bars.
Period 13 This selection defines the time period.
OB/OS >>> Access to Band Dialog TD PLUR.
>>> Color High: Red Low: Blue
Color used in the overbought zone (red) and in the oversold zone (blue).
>>> Level High: 10.00 Low: -10.00
Band parameters for overbought/oversold.
>>> Display On Display the band parameters via a checkbox.
short dashDetermines type of line: Other choices are long dash and line.
This study is very new and is not described in Tom DeMark’s book.
TD Sequential Trend™ -- TD ST This indicator is a component of the DeMark Advanced Indicator Package.
TDST identifies a reference point along the price spectrum of the previous Sequential Setup in the opposite direction. If that level is exceeded, often times the trend has confirmed a reversal. This is a trend following technique which typically is beneficial to the confirmation of position already outstanding.
Parameters for the TD Sequential Trend™
DEMARK.RTF DeMark Studies 12/19/96 Page 41 of 45
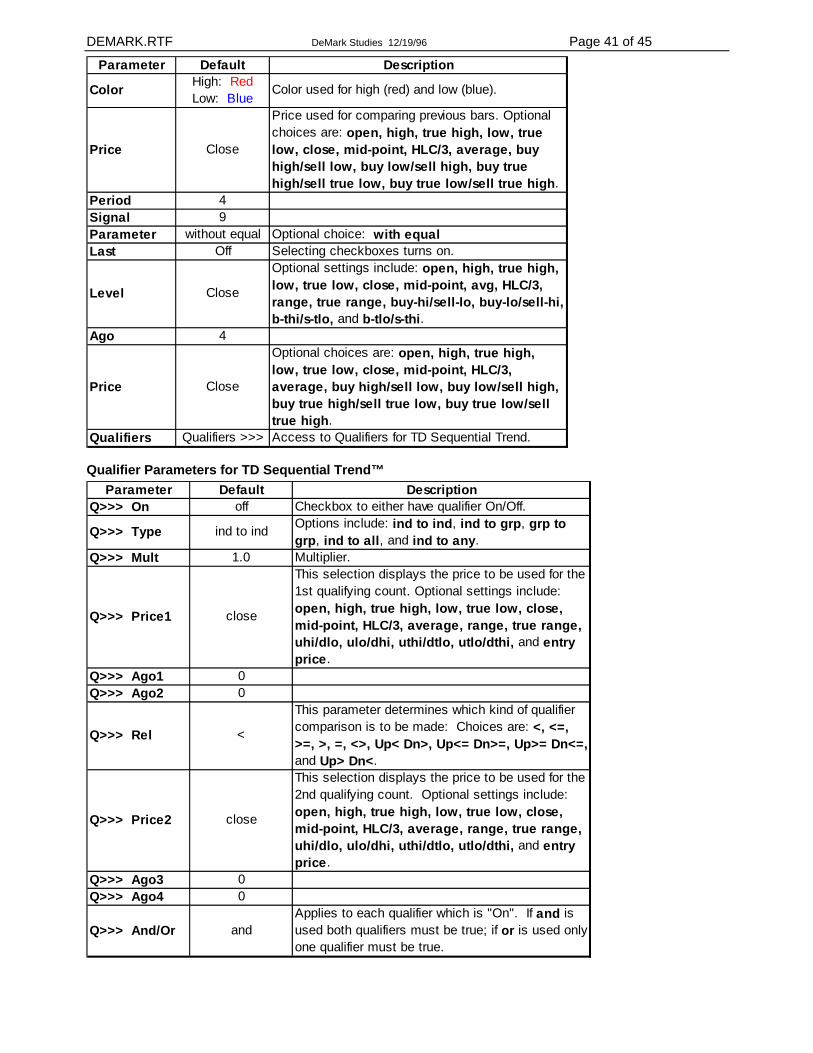
Parameter Default Description
Color High: Red Low: Blue
Color used for high (red) and low (blue).
Price Close
Price used for comparing previous bars. Optional choices are: open, high, true high, low, true low, close, mid-point, HLC/3, average, buy high/sell low, buy low/sell high, buy true high/sell true low, buy true low/sell true high.
Period 4Signal 9Parameter without equal Optional choice: with equalLast Off Selecting checkboxes turns on.
Level Close
Optional settings include: open, high, true high, low, true low, close, mid-point, avg, HLC/3, range, true range, buy-hi/sell-lo, buy-lo/sell-hi, b-thi/s-tlo, and b-tlo/s-thi.
Ago 4
Price Close
Optional choices are: open, high, true high, low, true low, close, mid-point, HLC/3, average, buy high/sell low, buy low/sell high, buy true high/sell true low, buy true low/sell true high.
Qualifiers Qualifiers >>> Access to Qualifiers for TD Sequential Trend.
Qualifier Parameters for TD Sequential Trend™ Parameter Default Description
Q>>> On off Checkbox to either have qualifier On/Off.
Q>>> Type ind to ind Options include: ind to ind, ind to grp, grp to grp, ind to all, and ind to any.
Q>>> Mult 1.0 Multiplier.
Q>>> Price1 close
This selection displays the price to be used for the 1st qualifying count. Optional settings include: open, high, true high, low, true low, close, mid-point, HLC/3, average, range, true range, uhi/dlo, ulo/dhi, uthi/dtlo, utlo/dthi, and entry price.
Q>>> Ago1 0Q>>> Ago2 0
Q>>> Rel <
This parameter determines which kind of qualifier comparison is to be made: Choices are: <, <=, >=, >, =, <>, Up< Dn>, Up<= Dn>=, Up>= Dn<=, and Up> Dn<.
Q>>> Price2 close
This selection displays the price to be used for the 2nd qualifying count. Optional settings include: open, high, true high, low, true low, close, mid-point, HLC/3, average, range, true range, uhi/dlo, ulo/dhi, uthi/dtlo, utlo/dthi, and entry price.
Q>>> Ago3 0Q>>> Ago4 0
Q>>> And/Or andApplies to each qualifier which is "On". If and is used both qualifiers must be true; if or is used only one qualifier must be true.
DEMARK.RTF DeMark Studies 12/19/96 Page 42 of 45
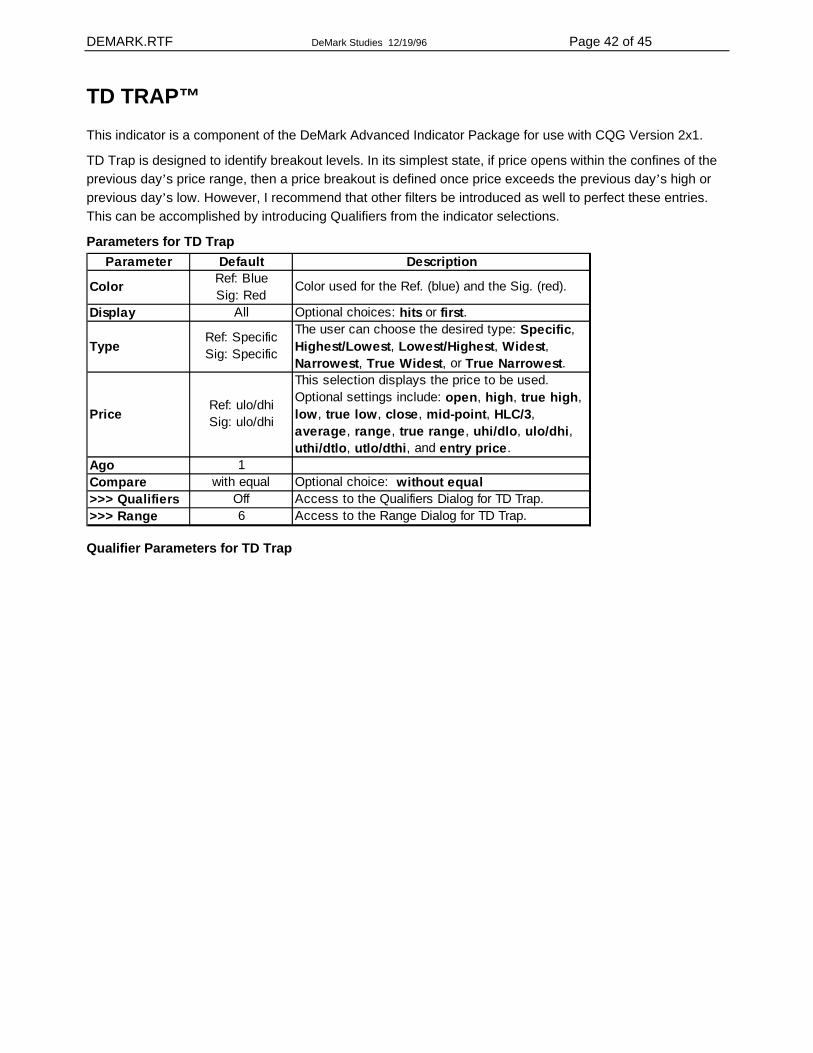
TD TRAP™ This indicator is a component of the DeMark Advanced Indicator Package for use with CQG Version 2x1.
TD Trap is designed to identify breakout levels. In its simplest state, if price opens within the confines of the previous day’s price range, then a price breakout is defined once price exceeds the previous day’s high or previous day’s low. However, I recommend that other filters be introduced as well to perfect these entries. This can be accomplished by introducing Qualifiers from the indicator selections.
Parameters for TD Trap Parameter Default Description
Color Ref: Blue Sig: Red
Color used for the Ref. (blue) and the Sig. (red).
Display All Optional choices: hits or first.
Type Ref: Specific Sig: Specific
The user can choose the desired type: Specific, Highest/Lowest, Lowest/Highest, Widest, Narrowest, True Widest, or True Narrowest.
PriceRef: ulo/dhi Sig: ulo/dhi
This selection displays the price to be used. Optional settings include: open, high, true high, low, true low, close, mid-point, HLC/3, average, range, true range, uhi/dlo, ulo/dhi, uthi/dtlo, utlo/dthi, and entry price.
Ago 1Compare with equal Optional choice: without equal>>> Qualifiers Off Access to the Qualifiers Dialog for TD Trap.>>> Range 6 Access to the Range Dialog for TD Trap.
Qualifier Parameters for TD Trap
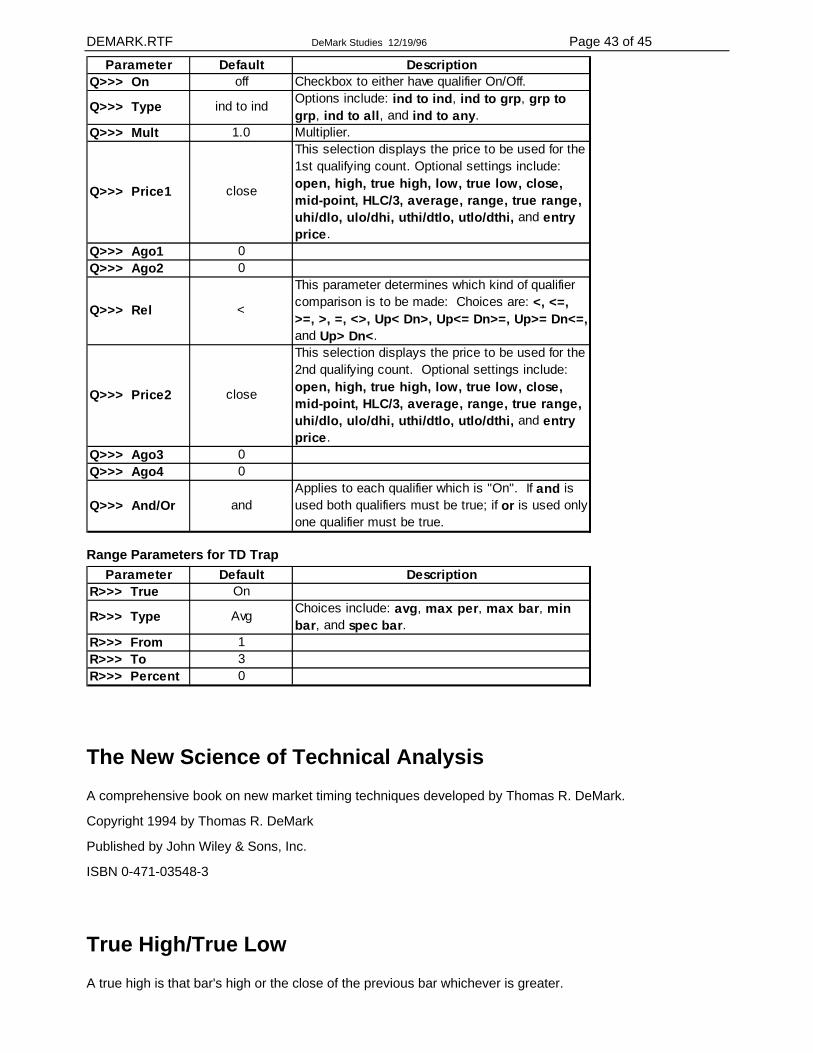
DEMARK.RTF DeMark Studies 12/19/96 Page 43 of 45
Parameter Default DescriptionQ>>> On off Checkbox to either have qualifier On/Off.
Q>>> Type ind to ind Options include: ind to ind, ind to grp, grp to grp, ind to all, and ind to any.
Q>>> Mult 1.0 Multiplier.
Q>>> Price1 close
This selection displays the price to be used for the 1st qualifying count. Optional settings include: open, high, true high, low, true low, close, mid-point, HLC/3, average, range, true range, uhi/dlo, ulo/dhi, uthi/dtlo, utlo/dthi, and entry price.
Q>>> Ago1 0Q>>> Ago2 0
Q>>> Rel <
This parameter determines which kind of qualifier comparison is to be made: Choices are: <, <=, >=, >, =, <>, Up< Dn>, Up<= Dn>=, Up>= Dn<=, and Up> Dn<.
Q>>> Price2 close
This selection displays the price to be used for the 2nd qualifying count. Optional settings include: open, high, true high, low, true low, close, mid-point, HLC/3, average, range, true range, uhi/dlo, ulo/dhi, uthi/dtlo, utlo/dthi, and entry price.
Q>>> Ago3 0Q>>> Ago4 0
Q>>> And/Or andApplies to each qualifier which is "On". If and is used both qualifiers must be true; if or is used only one qualifier must be true.
Range Parameters for TD Trap Parameter Default Description
R>>> True On
R>>> Type Avg Choices include: avg, max per, max bar, min bar, and spec bar.
R>>> From 1R>>> To 3R>>> Percent 0
The New Science of Technical Analysis A comprehensive book on new market timing techniques developed by Thomas R. DeMark.
Copyright 1994 by Thomas R. DeMark
Published by John Wiley & Sons, Inc.
ISBN 0-471-03548-3
True High/True Low A true high is that bar's high or the close of the previous bar whichever is greater.
DEMARK.RTF DeMark Studies 12/19/96 Page 44 of 45
A true low is that bar's low or the close of the previous bar whichever is less.
Index
—B— BreakOut:, 16 —C— Channel I:, 24 Channel II:, 25 Channel III:, 26 —D— DeMark:, 3, 7, 8, 9, 13, 16, 17, 20, 21, 22,
24, 25, 26, 27, 28, 29, 30, 31, 34, 36, 43, 49
DeMarker Indicator:, 27 Dif:, 28 —G— Gap:, 29 —M— Market Studies, Inc.:, 3 Moving Average:, 30, 31 —P— Pivot:, 43 Point:, 13 Pressure:, 34 —R— Range Expansion:, 16 Rate Of Change:, 36 Relative Retracement:, 17 Retracement:, 7, 8, 17 —S— Sequential:, 3 —T— TD CH 1:, 24 TD CH 2:, 25 TD CH 3:, 26 TD FCTR:, 21 TD MA I:, 30 TD MA II:, 31 TD RELR:, 17 TD SEQ:, 3 TD STUDIES:, 3 TDABSR:, 7, 8 Tom Demark:, 3 Trap:, 49 Trend Factor:, 21 Trend:, 20

DEMARK.RTF DeMark Studies 12/19/96 Page 45 of 45

![Tom Demark Trend Lines...Tom Demark Trend Lines . Forex Survivor - GBPWSD - [GBPUSD, View Actions Charts Quotes TOP 240 min - British Pound vs US Dollar] System Tools Window Help 1m](https://img.pdfslide.tips/doc/110x75/611de324b0b1e003e012a115/tom-demark-trend-lines-tom-demark-trend-lines-forex-survivor-gbpwsd-gbpusd.jpg)