Embed Size (px)
Citation preview
i
UNIVERSIDAD SAN FRANCISCO DE QUITO
Colegio de Postgrados
Comparison of the Molecular Methods, Terminal Restriction Fragment
Length Polymorphism and Denaturant Gradient Gel Electrophoresis, to
Characterize the Microbiota in Feces from Breastfed Infants
(el idioma de esta tesis es inglés)
Diego Hernán Granja Matovelle
Tesis de grado presentada como requisito para la obtención
del título de Magíster en Microbiología
Quito, mayo de 2007
ii
Universidad San Francisco de Quito
Colegio de Postgrados
HOJA DE APROBACIÓN DE TESIS
Comparison of the Molecular Methods, Terminal Restriction Fragment Length
Polymorphism and Denaturant Gradient Gel Electrophoresis, to Characterize
the Microbiota in Feces from Breastfed Infants
(el idioma de esta tesis es inglés)
Diego Hernán Granja Matovelle
Manuel Baldeón, Ph.D. ___________________________
Profesor de la Maestría en Microbiología y
Director de Tesis
Gabriel Trueba, Ph.D. ___________________________
Director de la Maestría en Microbiología y
Miembro del Comité de Tesis
Philip Cooper, Ph.D. __________________________
Miembro del Comité de Tesis
Hugo Valdebenito, Ph.D. ___________________________
Decano del Colegio de
Ciencias Biológicas y Ambientales
Víctor Viteri Breedy, Ph.D. ___________________________
Decano del Colegio de Postgrados
Quito, mayo de 2007

iii
© Derechos de autor
Diego Hernán Granja Matovelle
2007

iv
Dedicatoria
Este trabajo va dedicado a mi Rosy, por su motivación, apoyo y amor incondicionales, a mi
familia y nueva familia, por ser ejemplo vivo de honestidad, unidad, sacrificio y superación.
v
Agradecimientos
Gracias a mis maestros, Gabriel, por su constante guía y por mantener vivo el entusiasmo de
quienes formamos parte del grupo de la Maestría en Microbiología de la USFQ, a Philip, por
su apertura y confianza, al Dr.G y a Noriko, por brindarme su tiempo y haberme hecho
partícipe de su saber, a mis compañeros, por su paciencia, buen humor y por haber hecho de
estos dos años un recuerdo inolvidable en mi vida. Pero por sobre todo, un agradecimiento
especial a mi maestro, mentor y amigo, Manuel, por ser el modelo ideal de profesionalismo,
capacidad y generosidad.
vi
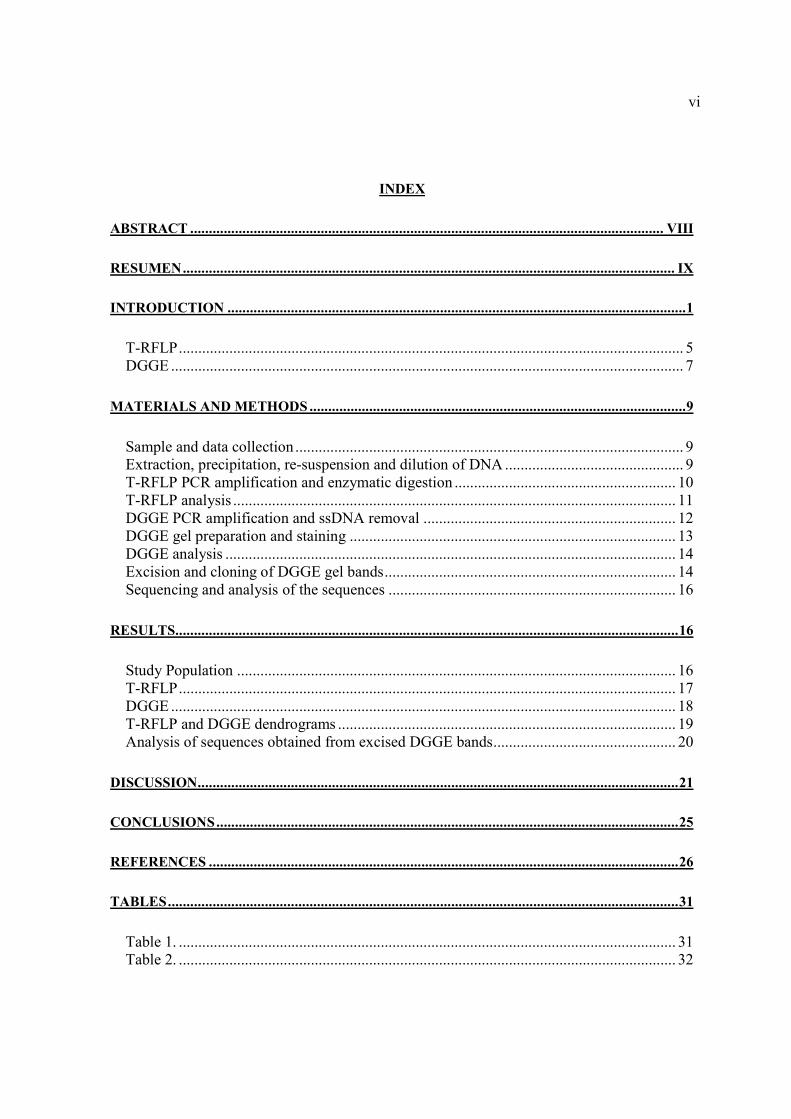
INDEX
ABSTRACT ............................................................................................................................... VIII
RESUMEN .................................................................................................................................... IX
INTRODUCTION ........................................................................................................................... 1
T-RFLP .................................................................................................................................. 5
DGGE .................................................................................................................................... 7
MATERIALS AND METHODS ..................................................................................................... 9
Sample and data collection .................................................................................................... 9
Extraction, precipitation, re-suspension and dilution of DNA .............................................. 9
T-RFLP PCR amplification and enzymatic digestion ......................................................... 10
T-RFLP analysis .................................................................................................................. 11
DGGE PCR amplification and ssDNA removal ................................................................. 12
DGGE gel preparation and staining .................................................................................... 13
DGGE analysis .................................................................................................................... 14
Excision and cloning of DGGE gel bands ........................................................................... 14
Sequencing and analysis of the sequences .......................................................................... 16
RESULTS ....................................................................................................................................... 16
Study Population ................................................................................................................. 16
T-RFLP ................................................................................................................................ 17
DGGE .................................................................................................................................. 18
T-RFLP and DGGE dendrograms ....................................................................................... 19
Analysis of sequences obtained from excised DGGE bands ............................................... 20
DISCUSSION ................................................................................................................................. 21
CONCLUSIONS ............................................................................................................................ 25
REFERENCES .............................................................................................................................. 26
TABLES ......................................................................................................................................... 31
Table 1. ................................................................................................................................ 31
Table 2. ................................................................................................................................ 32
vii
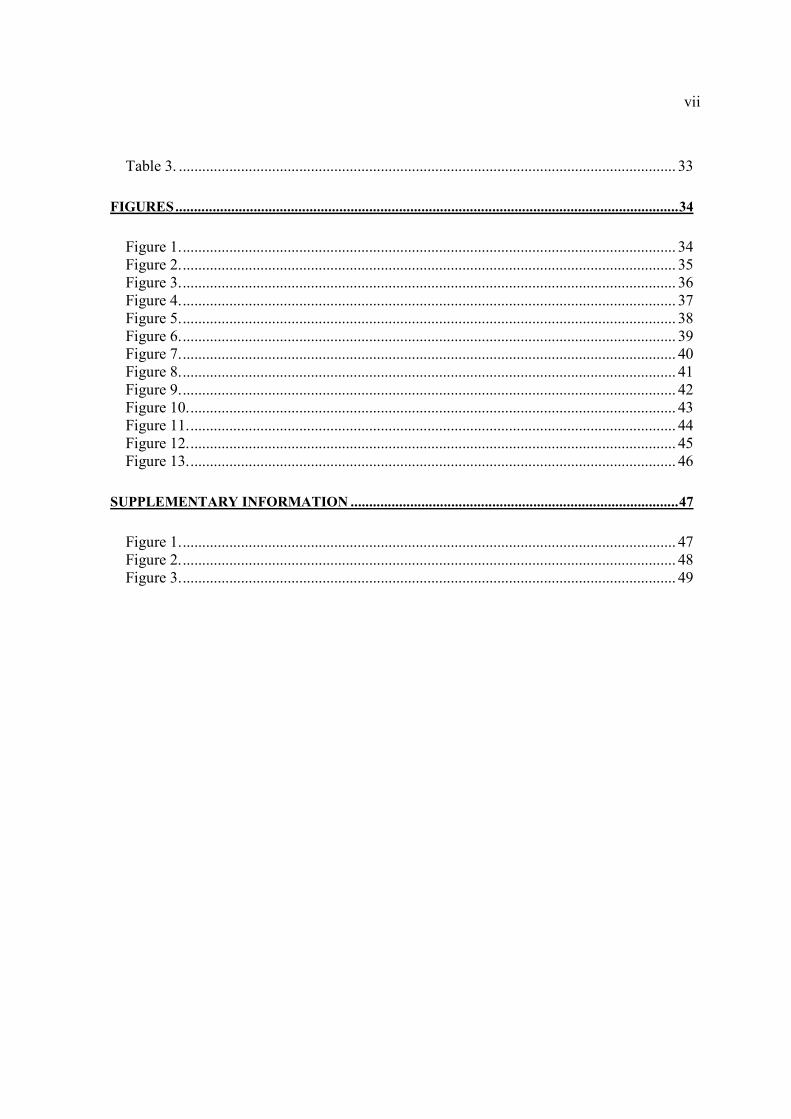
Table 3. ................................................................................................................................ 33
FIGURES ....................................................................................................................................... 34
Figure 1. ............................................................................................................................... 34
Figure 2. ............................................................................................................................... 35
Figure 3. ............................................................................................................................... 36
Figure 4. ............................................................................................................................... 37
Figure 5. ............................................................................................................................... 38
Figure 6. ............................................................................................................................... 39
Figure 7. ............................................................................................................................... 40
Figure 8. ............................................................................................................................... 41
Figure 9. ............................................................................................................................... 42
Figure 10. ............................................................................................................................. 43
Figure 11. ............................................................................................................................. 44
Figure 12. ............................................................................................................................. 45
Figure 13. ............................................................................................................................. 46
SUPPLEMENTARY INFORMATION ........................................................................................ 47
Figure 1. ............................................................................................................................... 47
Figure 2. ............................................................................................................................... 48
Figure 3. ............................................................................................................................... 49
viii
Abstract
Terminal restriction fragment length polymorphism (T-RFLP) and denaturant gradient gel
electrophoresis (DGGE) were applied to characterize the intestinal microbiota in stool
samples from seven breastfed infants during the first seven months of life. A comparison of
dendrograms revealed differences between the cluster patterns obtained using the two
methods. These results do not support the findings of previous studies that have demonstrated
strong similarities between dendrograms constructed from stool samples using the two
techniques. However, both techniques were able to show patterns of bacterial succession and
unique differences in the microbiota composition of each individual studied. Sequencing of
bands excised from the DGGE gel retrieved data about colonization of certain types of
bacteria at three different moments of life of the infants studied: within the first fifteen days,
at three months, and at seven months of age. The advantages and drawbacks of applying T-
RFLP and/or DGGE in the assessment of the diversity of intestinal microbiota are discussed.
ix
Resumen
Se aplicaron las técnicas “terminal restriction fragment length polymorphism” (T-RFLP) y
“denaturant gradient gel electrophoresis” (DGGE) para caracterizar la microbiota intestinal
de muestras de heces de siete lactantes durante sus primeros siete meses de vida. La
comparación de los dendrogramas reveló diferencias entre los patrones de agrupamiento
obtenidos usando los dos métodos. Estos resultados no concuerdan con hallazgos de
estudios previos que han demostrado grandes similitudes entre los dendrogramas
construidos a partir de muestras fecales usando las dos técnicas. Sin embargo, ambas
técnicas fueron capaces de mostrar patrones de sucesión bacteriana y diferencias únicas en
la composición de la microbiota de cada individuo estudiado. El secuenciamiento de
bandas extraídas del gel de DGGE arrojó datos acerca de la colonización de cierto tipo de
bacterias en tres momentos distintos de la vida de los infantes estudiados: dentro de los
quince primeros días, a los tres meses, y a los siete meses de edad. Se discuten las ventajas
y desventajas de aplicar T-RFLP y /o DGGE en la valoración de la diversidad de la
microbiota intestinal.
1
Introduction
The intestine is the organ most densely populated with microorganisms (Hooper et
al., 2001). It sustains all three domains of life: eukarya, archaea, and bacteria, the latter
represented in quantities that vary from 1010
to 1012
bacterial cells per gram (Mackie et al.
1999; Bernbom et al., 2006). It has been estimated that nearly 800 species of bacteria
constitute the intestinal microbiota, most of which are anaerobic (Zoetendal et al., 2004)
and this number exceeds by a factor of 10 the number of human somatic and germ cells
(Bäckhed et al., 2005). The bacterial genera that predominate in the human intestine are:
Bacteroides, Eubacterium, Clostridium, Bifidobacterium, Fusobacterium, Ruminococcus,
Peptococcus and Peptostreptococcus; accompanied by less predominant species such as:
Escherichia coli, and Lactobacillus (Wang et al., 1996).
Microbial succession is a process characterized by the progressive establishment of
specific microorganisms in the host at different times in life. There are four clearly
distinguished phases of the development of the intestinal microbiota (Mackie et al., 1999;
Favier et al., 2002). Phase 1 starts at birth and lasts during the first or second week of life.
In this phase, bacteria from the surrounding environment of the newborn starts to colonize
the intestine, especially the ones that come from the mother, where enterobacteria (E. coli)
and streptococci begin to dominate along with clostridia and lactobacilli. Phase 2 is
characterized by a period of time where breast milk is the only source of food, in which the
intestinal environment starts to be dominated by anaerobes such as bifidobacteria and less
colonized by E. coli, streptococci, bacteroides, and clostridia. Phase 3 is marked by initial
introduction of food supplementation other than breast milk. Phase 4 begins as when breast
milk is withdrawn from the baby’s diet (weaning). These last two phases are characterized

2
by the progressive addition of Streptococcus, Bacteroides, Clostridium, anaerobic gram-
positive cocci, peptostreptococci, and peptococci, and a decline in bacteria such as E. coli,
until the second year of life where the microbiota starts to resemble adult patterns (Conway,
1997; Mackie et al., 1999; Favier et al., 2002).
The most important functions in which the human and animal microbiota are related
with the host are: development of the immune system (Kimura et al., 1997; Toivanen et al.,
2001; Deplancke and Gaskins., 2001; Svensson and Wenneras., 2005), source of hormone-
like compounds (Clavel et al. 2005), carcinogenesis, host metabolism (Tannock., 1999; Ley
et al. 2005), nutrition, and prevention of establishment of pathogens (Mai and Morris.
2003; Coolen et al. 2005). Due to this latter reason, the need to find a better way to study
the microflora in developing countries is critical. Gastrointestinal diseases constitute a
main health problem worldwide and are among the most prevalent causes of death in
developing countries. They are water related diseases and are also strongly associated to
deficient sanitary conditions, poverty, lack of hygiene and education (WHO). Ecuador is
not an excluding example to these problems. According to the last Ecuadorian census
performed in 2001, 63.1% of the entire population lack of basic amenities; 61.3% of the
people are affected by poverty, and 31.9% live in extreme poverty (INEC, 2001).
According to the latest data published by the Ecuadorian National Ministry of Health, in
2003 there were a total of 258.265 reported cases of diarrhea in the general population.
During the same year, there were 450 fatal cases reported due to diarrhea and
gastroenteritis from presumed infectious etiology, from which 33.55% (151 cases) occurred
in children under their first year of life, placing this etiology as the 7th
cause of death in this
age group (INEC, OMS. 2004). Along with this, in that year, these very same etiologies
were considered as the 2nd
, 4th
and 5th
most common cause of morbidity in males, children
3
and females respectively (INEC. 2003). Because of this, places such as Ecuadorian rural
tropics constitute ideal locations in order to study the development of the intestinal
microbiota of infants that are exposed to different environments comparing to urban
children.
The study of the intestinal microbiota has proved extremely difficult because of
problems in cultivating the majority of the species dwelling in the digestive tract. It has
been estimated that nearly 60 to 80% of the bacterial species that form part of the intestinal
microbiota have not been able to be cultivated yet, in agreement with other studies that
describe that the cultivable species residing in the intestine range from 15 to 58% (Suau et
al. 1999; Vaughan et al., 2000).
Until now, most studies have focused on fecal samples, and few have evaluated the
differences between the microbiota residing in different anatomic sites within the digestive
tract, starting from the 500 species described in the oral cavity (Kroes et al.,1999; Paster et
al., 2001; Sakamoto et al, 2003) to those found in feces. Little is known about the
composition of bacteria along the digestive tract of humans. Several studies using animal
models have provided interesting data with respect to the molecular characterization of the
microbiota (Leser et al., 2002; Deplancke et al., 2002; Guan et al., 2003) and the
differences in composition between distinct levels of the digestive tract (Pryde et al., 1999).
It is also clear that in humans the composition of fecal microbiota differs greatly from the
rest of the digestive microbial environments (Marteau et al., 2001; Zoetendal et al., 2002;
Mai and Morris., 2003).
Almost all the information collected in the past years comes from studies based on
cultivable bacteria (Zoetendal et al., 2002; Mai and Morris., 2003), methodology that has
shown enormous inconsistencies depending on the type of media used (Apajalahti et al.,
4
2003). In recent years, many molecular techniques have been developed in order to
expand our knowledge of the composition of the microbiota, and these have generated
valuable information through an analysis based on variability in bacterial 16S ribosomal
RNA genes (Figure 1) that have permitted new phylogenetic approaches (Amann et al.,
1995).
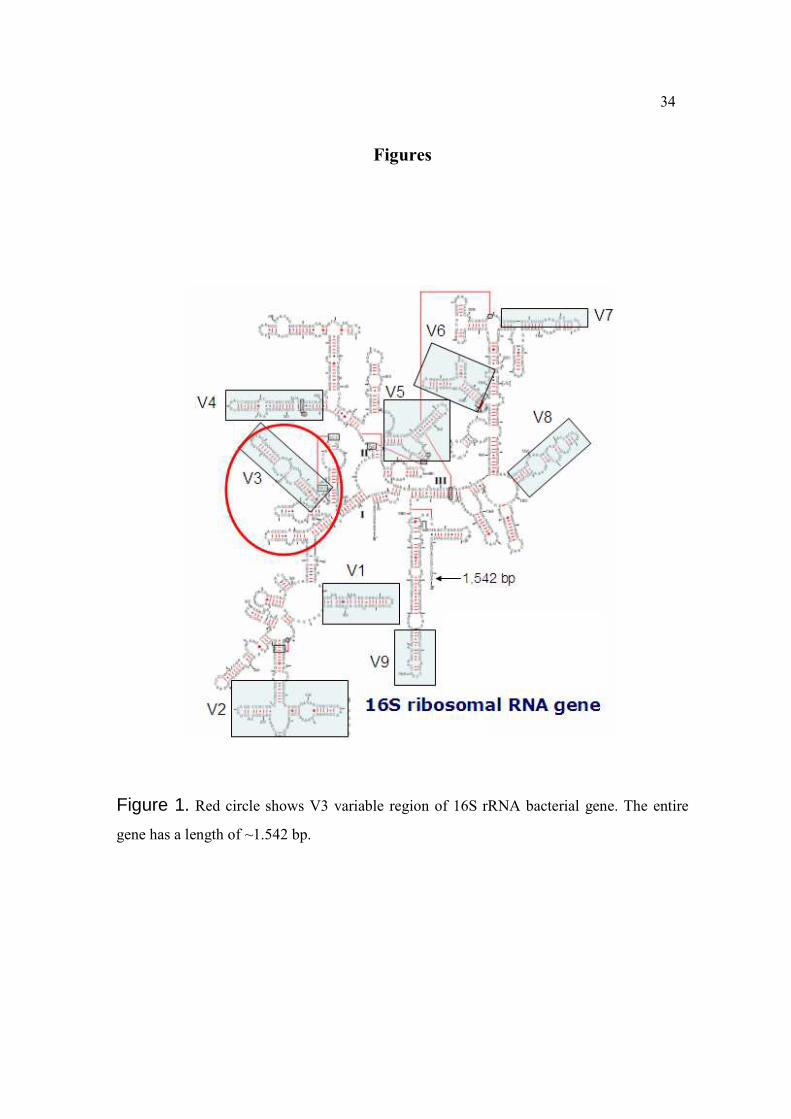
There are many reasons for using the 16S rRNA genes in order to classify bacteria:
1) the genes are highly conserved because of their essential function for life, 2) the genes
are present universally in all cellular life forms, 3) the ~1500 nucleotides that compose the
16S rRNA genes can provide adequate phylogenetic information through sequencing
compared to the much larger 23S rRNA genes (~3000 nucleotides), 4) the mutation rate of
these genes is sufficient to establish evolutionary divergence of organisms, 5) the structure
of their sequences alternate between variable and conserved segments which make them
ideal for the design of molecular probes, and 6) the specificity of their sequences are useful
to determine the exact genus and species to which they correspond (Vaughan et al. , 2000).
Several molecular techniques based on the study of the 16S rDNA of bacterial
communities have been employed including: PCR amplification (Wang et al., 1996),
cloning and sequencing (Wilson and Blitchington., 1996; Wang et al., 2003), Amplified
Fragment Length Polymorphism (AFLP) (Diaz and Rodarte., 2003), Denaturing Gradient
Gel Electrophoresis (DGGE), Temperature Gradient Gel Electrophoresis (TGGE) (Muyzer
and Smalla., 1998), 16S rRNA-targeted oligonucleotide probes and quantitative dot blot
hybridization (Sghir et al., 2000), Fluorescence in situ Hybridization (FISH) (Franks et al.,
1998), flow Cytometry (Wallner et al.., 1997; Zoetendal et al., 2002), Terminal Restriction
Fragment Length Polymorphisms (Liu et al., 1997) , Single Strand Conformation
Polymorphism (SSCP) (Orita et al., 1998) and DNA array (Microarray) technology (Loy et
5
al., 2002; El Fatroussi et al., 2003). These molecular techniques also allow investigators to
study less-abundant species of bacteria which are difficult to evaluate using culture-based
methods and have become extremely useful for the characterization of the intestinal
microbiota, allowing the detection of previously undescribed species. However, these
methods might not be able to detect all species found in the studied samples (Wilson et al.,
1996) and the data they produce cannot be transformed in 100% accurate numbers due to
minor factors that can alter an exact quantification (Zoetendal et al. 2002).
T-RFLP and DGGE have been described as useful techniques to evaluate fecal
microbiota (Satokari et al. 2001; Zoetendal et al. 2002; Nagashima et al. 2003), although
few studies have utilized both at the same time (Sakamoto et al. 2003; Bernbom et al.
2006)). One of those studies showed almost identical dendrograms constructed by T-RFLP
and DGGE (Moeseneder et al. 1999). A better understanding of the benefits and
inconveniencies that implies using one or both techniques is needed, especially to evaluate
stool samples. Figure 2 shows the main steps followed in the processing of fecal samples
by T-RFLP and DGGE. Relevant features of the techniques are described below:
T-RFLP
First described by Liu et al. in 1997 as a variant of Amplified rDNA Restriction
Analysis (ARDRA) (Guan et al. 2003), T-RFLP has been successfully used to create
fingerprints of a vast number of bacterial communities. It is based on the use of universal
primers to amplify a segment of each of the 16S rDNA sequences belonging to different
bacteria found in a community. The distinction from making a simple RFLP analysis of
16S rDNA relies on labeling the primers with a fluorescent dye. Thus, tagging both of the
6
primers ensures that only the terminal fragments of the amplicons are detected after being
cut with restriction enzymes and run in a sequencing gel (Liu et al. 1997). Sakamoto and
collaborators were the first research group to apply T-RFLP to the analysis of human fecal
samples (Sakamoto et al., 2003). Currently, the technique is widely used and new
applications for this method are constantly being described.
Advantages
It is considered to have a higher resolution than DGGE because of the larger
number of Operational Taxonomic Units (OTUs) that it detects (Moeseneder et al. 1999),
and constitutes a tool that has become extremely useful for the mass screening of stool
samples because of high reproducibility and throughput (Nagashima et al., 2003). There is
a smaller probability of investigator bias than for DGGE. Results are also semi-quantitative
and more reproducible.
Disadvantages
It is difficult to predict the precise length of the terminal fragments produced by
each enzyme. On the other hand, a variation between 0 and 5% of the amplified sequence is
expected to occur even among similar strains, constituting another problem when
evaluating a bacterial community with T-RFLP and many other techniques. (Liu et al.
1997). The resolution of the T-RFLP depends on choosing a suitable restriction enzyme to
evaluate a given bacterial community (Sakamoto et al., 2003; Bernbom et al. 2006). There
is a chance that two or more sequences could have an identical restriction site and produce
fragments of equal length (Moeseneder et al. 1999). The method requires sequencing
equipment and is less suitable for the study of unknown non-cultivable bacteria. Primers are
7
more expensive because of the fluorescent dyes. Species of bacteria cannot always be
identified by the peaks and peak identification requires a clone library (Zoetendal et al.,
2004). There is no possibility to further study OTUs (sequencing).
DGGE
Ever since Muyzer et al. described DGGE for the first time in 1993 as a useful tool
to separate and analyze amplification products from the variable region V3 of 16S rRNA
genes of bacteria, many investigators used this method to study the diversity of bacterial
communities. DGGE employs an increasing linear gradient of chemicals (urea and
formamide) in a polyacrylamide gel to separate the products of PCR amplification based on
the sequence difference rather than molecular weight (Muyzer and Smalla., 1998). The
primers used are designed to have a clamp of 40 GC that modifies the melting behavior of
the double-stranded DNA molecules and improves the resolution of the gels obtained.
Advantages
DGGE is highly sensitive and is capable of detecting bacterial species that
constitute at least 1% of the total amount of bacteria in a sample (Muyzer et al., 1993).It is
a simple methodology that does not use radioactive substances, and can provide semi-
quantitative information about bacterial communities. DGGE gel bands can be excised,
and the PCR products cloned and sequenced to allow identification of previously
unidentified bacteria.
Disadvantages
8
Bands may not have the same sequence even when sharing the same migrating
behavior and the same position in the gel (Muyzer and Smalla., 1998). It cannot separate
well DNA fragments larger than 500 base pairs, and short amplicons contain less
information to process and compare (Díez et al. 2001). The way samples are handled and
stored (aerobically and anaerobically) and the different DNA extraction protocols used
might influence banding patterns (Muyzer and Smalla., 1998). Genes rich in GC are
difficult to analyze by this method and the method involves the use of toxic substances such
as formamide and silver nitrate. It is more susceptible to observer or investigator bias,
especially in the identification and selection of bands. Finally, the identification of
specimens requires a clone library (Zoetendal et al., 2004).
We pretend to supply useful information about the convenience to apply the most
suitable method to study human intestinal bacterial communities in developing countries,
and by these means to retrieve larger amounts of data combining variables directly
affecting or affected by the intestinal microbiota. In the following study, we intended to
prove that T-RFLP and DGGE are not entirely comparable methods regarding to the
evaluation of intestinal microbiota because of the different analysis methodology that they
require and the different type of data that they retrieve. The use of T-RFLP and DGGE was
evaluated to evidence the diversity of microbial communities in stool samples of breastfed
infants residing in rural areas and the fingerprint clusters obtained using each method were
compared. Additionally, representative DGGE bands were excised to be cloned and
sequenced, in order to identify bacteria that are consistently present in individuals of the
same group of age.

9
Materials and Methods
Sample and data collection
Stool samples were collected from infants (3 females and 4 males) recruited into the
ECUAVIDA Project, a study that is investigating the effect of environmental exposures in
early life on the development of systemic and mucosal immunity and the later risk of the
development of inflammatory diseases (e.g. asthma). The study is recruiting newborns
living in the Canton of Quinindé in Esmeraldas Province, Ecuador. Quinindé is a largely
rural area with agriculture being the major source of income. Stool samples were collected
within the first 15 days of life (sample N1), at 3 (N2), and at 7 months of age (N3). After
collection, stool samples were immediately frozen at -20 ºC until processed. Pre-tested
questionnaires were administered to the infant mothers at the time of the collection of
samples N1 and N3, and detailed information including the following factors was obtained:
lifestyle factors (breast feeding, complementary feeding, socio-economic level,
overcrowding, diet/weaning, etc) and other relevant factors such as parity, neonatal and
infant data (method of delivery and birth date) (Table 1). Informed written consent was
obtained from the infants’ mothers to participate in the study and the study protocol was
approved by the Ethics Committee of the Hospital Pedro Vicente Maldonado, Pichincha
Province, Ecuador.
Extraction, precipitation, re-suspension and dilution of DNA
DNA from stool samples was extracted with a QIAamp DNA Stool Mini Kit
(Qiagen) according to the manufacturer’s “Protocol for isolation of DNA from stool for

10
pathogen detection”. Lysis temperature was increased to 95ºC after adding Buffer ASL to
improve DNA extraction for Gram-positive bacteria. Final volumes of 200 uL were
obtained. For transportation reasons, DNA was precipitated using a DNA concentration
protocol (MoBio). Twenty uL of 5M NaCL were added to each tube. After mixing, 400 uL
of cold 100% ethanol was added, mixed and centrifuged for 5 min. Liquid was decanted
and 1.5 mL Eppendorf tubes were air dried and transported at room temperature from Quito
to the University of Illinois at Urbana –Champaign. In Illinois, DNA was resuspended in 50
uL of deionized water and quantified by comparing each sample’s band intensity to a
standard ladder (Hyperladder II, Bioline) with Image J software after running ladder and
samples in a 2% agarose gel stained with ethidium bromide. DNA was diluted to 5 ng/uL
for DGGE and to 10 ng/uL for T-RFLP PCR amplifications after testing 1 ng/uL, 5 ng/uL
and 10 ng/uL dilutions to choose a best amplification product.
T-RFLP PCR amplification and enzymatic digestion
A ~1503 bp fragment was amplified with the primers Fam-27f Bac (5’ GAG TTT
GAT YMT GGC TCA G 3’; 5’ labeled with phosphoramidite fluorochrome 5-
carboxyfluorescein, blue dye) and Hex-1492r (5’ TAC CTT GTT ACG ACT T 3’, labeled
with 4,7,2’,4’,5’,7’-hexachloro-6-carboxyfluorescein, green dye) both synthesized by
Integral DNA Technologies, Inc (IDT) (Moeseneder et al. 1999; Wang et al. 2003). Each
50 uL of PCR mixture contained 5 uL of 10X HotMaster Taq Buffer with MgCl
(Eppendorf), 4 uL of Purified BSA (100ug/mL) (BioLabs), 1 uL of dNTP mix (Promega)
each deoxynucleoside triphosphate at 10 mM, 1.8 uL of both primers (25 uM each)
reaching a final concentration of 0.4 nM each, 0.1 uL of HotMaster Taq DNA Polymerase

11
(5U/uL, Eppendorf) and 35.3 uL of distilled water. Only 1 uL of DNA template was used at
a concentration of 10 ng/uL. PCR cycling conditions were: initial denaturation temperature
at 94ºC for 4 min, 30 cycles of: denaturation step at 94ºC for 1 min, annealing step at 48ºC
for 30 s and an extension step at 72ºC for 2 min, followed by a final extension step at 72ºC
for 12 min. A GeneAmp PCR System 2700 thermal cycler (Applied Biosystems) was used.
Amplicons were purified with a QIAquick PCR Purification kit (Qiagen), a SPIN protocol
(using a microcentrifuge) was performed as described by the manufacturer. The enzymatic
digestion was performed with Hae III. A better resolution and larger amount of peaks were
obtained with this enzyme in previous tests (Nakamura N, unpublished data) The mixture
reaction for each purified sample contained 2 uL of NE Buffer 2 10X (New England
BioLabs), 0.5 (5 U) of Restriction Enzyme Hae III (10U/uL) (New England BioLabs), 7.5
uL of deionized water. Ten uL of purified PCR product were added to have a final volume
of 20 uL. After incubating the mixture for 30 min at 37ºC, 0.5 uL of NE Buffer 2 10X, 0.5
uL of Restriction Enzyme Hae III and 4 uL of deionized water were added to each reaction
tube to have a final volume of 25 uL. Again the mixture was incubated for 30 min at 37ºC.
T-RFLP analysis
Digested products were sent to the Biotechnology Center of University of Illinois at
Urbana-Champaign (UIUC Core Sequencing Facility) for fragment analysis. Data and
graphs were processed with GeneMapper v3.7 software. Only data from the undiluted
digested products were used and processed by perl (http://www.perl.com), R (http://www.r-
project.org) and SAS software. Similarity comparison was done using Ward's algorithm,
12
dendrograms were constructed by UPGMA (Unweighted Pair Group Method with
Mathematical Averages) method.
DGGE PCR amplification and ssDNA removal
The primers used amplified a fragment of ~193 bp of the V3 region of 16S rDNA.
16SV3F-GC (341F 5’CGC CCG CCG CGC GCG GCG GGC GGG GCG GGG GCA CGG
GGG GCC TAC GGG AGG CAG CAG 3’) and 16SV3R (534R 5’ ATT ACC GCG GCT
GCT GG 3’) (Muyzer et al., 1993) were both synthesized by Integral DNA Technologies,
Inc (IDT). Each 25 uL of PCR mixture contained 2.5 uL of 10X HotMaster Taq Buffer with
MgCl (Eppendorf), 2.5 uL of Purified BSA (100ug/mL) (BioLabs), 0.5 uL of dNTP mix
(Promega) each deoxynucleoside triphosphate at 10 mM, 1 uL of both primers (25 uM
each), 0.25 uL of HotMaster Taq DNA Polymerase (5U/uL, Eppendorf) and 16.25 uL of
distilled water. Only 1 uL of DNA template was used at a concentration of 5 ng/uL.
Touchdown PCR cycling conditions were: initial denaturation temperature at 94ºC for 4
min, 20 cycles of: denaturation step at 94ºC for 30 s, annealing step at 65ºC for 30 s,
reducing 0.5 ºC the annealing temperature with each cycle and an extension step at 72ºC for
30 s, then 10 cycles of: denaturation step at 94ºC for 30 s, annealing step at 55ºC for 30 s,
and an extension step at 72ºC for 30 s, followed by a final extension step at 72ºC for 7 min.
A GeneAmp PCR System 2700 thermal cycler (Applied Biosystems) was used. Removal of
ssDNA was performed using the following protocol. Mung Bean Nuclease stock (MBNs)
solution was prepared by adding 0.5 uL of Mung Bean Nuclease (10.000 U/mL, New
England Biolabs) to 99.5 ul of deionized water. One and a half uL of 10X Mung Bean
Buffer (New England Biolabs), 1 uL of MBNs and 2.5 uL of deionized water were added to
13
each 10 uL of PCR product to reach a final volume of 15 uL. Samples were incubated at
30ºC for 10 min and 5 uL of 2X Loading Buffer (0.05% bromophenol blue, 0.05% xylene
cyanol, 70% glycerol w/v in H2O) to stop the reaction were added (Simpson et al. 1999).
DGGE gel preparation and staining
A parallel gel was performed with a D-Code System (Bio-Rad; Hercules, CA) as
described previously (Simpson JM, et al. 1999). Linear gradients of denaturant were
performed with a Bio-Rad Gradient Former Model 385 going from 35 to 60 % (100% of
denaturant corresponding to 40% formamide and 7 M urea) in an 8% polyacrylamide gel
with 1X TAE buffer (0.5 nM Na2 EDTA, 10mM sodium acetate, 20 mM Tris-acetate, pH
7.4). The gel polymerized onto a gel support film (FMC) and a Bio-Rad casting stand in
about 40 min (Zwart and Bok. 2004). Ten uL of each PCR product and Loading Buffer
mixture were loaded into the wells when 1X TAE Buffer reached 60ºC. The standard
ladder used was made with 16S V3 region amplicons of the following bacteria: Bacteroides
fragilis, Eubacterium rectale, S. aureus, Lactobacillus delbrueckii, E. coli ,
Bifidobacterium adolescents and Clostridium paraputrificum. The gel ran at 150 V for 2
hours and then at 200 V for 1 hour. Silver staining was performed. Gel was set on a belly
dancer with Fixation Solution (15 mL of Acetic Acid, 30 mL 100% ethanol, and deionized
water up to 300 mL) for 2 hours, then washed 3 times with deionized water. Solution I (0.2
g of silver nitrate in 200 mL of deionized water) was added and left for 20 min on belly
dancer, then washed one time with deionized water. Solution II (0.02 sodium borohydride,
1.5% (3 g) sodium hydroxide, 800 uL of 37% formaldehyde, and deionized water up to 200
14
mL) was added and set on a belly dancer for 12 min until developed. The gel was finally
washed four times with deionized water to stop reaction.
DGGE analysis
Scanning of the gel was performed with a GS-710 Calibrated Imaging Densitometer
(Bio-Rad). After being scanned, the digitized DGGE images were analyzed with Diversity
Database software 2.2.0 (Bio-Rad). The image analysis evaluated the presence or absence
of bands on each lane and their intensity (Díez et al. 2001). Each band was considered as a
different Operational Taxonomic Units (OTUs) after background subtraction. Similarity
comparison was done using Dice’s coefficient analysis and Ward’s algorithm.
Dendrograms were constructed by UPGMA (Unweighted Pair Group Method with
Mathematical Averages) method to show relationships between all the DGGE fingerprints
and between age groups (Diversity Database Software 2.2.0) (Simpson et al. 2000).
Excision and cloning of DGGE gel bands
Bands from DGGE gel were chosen because of their predominant presence on
different groups of age. Bands coded 28, were more prevalent on samples from the 7th
month, bands coded 61 were more prevalent on samples from 15 days and 3rd
month and
finally, bands coded 64 were predominant on samples from the first 15 days of life. Bands
were excised from the DGGE gel using a needle and transferred to 1.5 ml Eppendorf tubes
containing 20 uL of deionized water. After staying over night at 4°C, 3 uL of the DNA
solution from each diluted band was used to be re-amplified with the following primers:
16SV3F (341F 5’CC TAC GGG AGG CAG CAG 3’) and 16SV3R (534R 5’ ATT ACC
15
GCG GCT GCT GG 3’) (Muyzer et al., 1993), both synthesized by Integral DNA
Technologies, Inc (IDT). Each 25 uL of PCR reaction mixture contained 2.5 uL of 10X
HotMaster Taq Buffer with MgCl (Eppendorf), 2.5 uL of Purified BSA (100ug/mL)
(BioLabs), 0.5 uL of dNTP mix (Promega) each deoxynucleoside triphosphate at 10 mM, 1
uL of both primers (25 uM each), 0.25 uL of HotMaster Taq DNA Polymerase (5U/uL,
Eppendorf) and 14.25 uL of distilled water. PCR cycling conditions were: initial
denaturation temperature at 94ºC for 4 min, 30 cycles of: denaturation step at 94ºC for 30 s,
annealing step at 55ºC for 30 s, and an extension step at 72ºC for 30 s, followed by a final
extension step at 72ºC for 7 min. A GeneAmp PCR System 2700 thermal cycler (Applied
Biosystems) was used. A 2% agarose gel was run to verify PCR amplification products.
Positive products were cloned utilizing a TOPO TA Cloning Kit (Invitrogen) following
instructions of the manufacturer. “One Shot Chemical Transformation Protocol” was
applied on “Transforming One Shot TOP 10 E. coli Competent Cells” (Invitrogen).
Recovery and plating of cells were performed spreading 50 uL of “heat shock”transformed
cells on LB (Luria Bertani, 1% tryptone, 0.5% yeast extract, 1% NaCl, pH 7) Petri agar
(15g/L agar) dishes with an additional final concentration of 50 ug/ml of ampicillin
(sodium salt, Sigma) and 20 ug/ml of X-gal (5-bromo-4-chloro-3-indolyl-ß-D-galacto-
pyranoside, Sigma). Plates were incubated over night at 37ºC. Next morning, white or light
blue colonies were recovered from each plate, and placed on 5 mL of LB liquid medium
into 15 ml Falcon tubes, one for each colony. Tubes were placed on a shaker in a 37ºC
incubation room for 24 hours. Next morning, after centrifugating 1.9 ml of culture using 2
ml microcentrifuge tubes for 5 min at 13.000 rpm twice, a “QIAprep Plasmid DNA
purification kit” (Qiagen) was used for each sample. A “Spin miniprep kit and a
microgentrifuge using LyseBlue reagent protocol” was applied, following instructions of
16
the manufacturer. Plasmid analysis was performed digesting each purified plasmid with
EcoR1 utilizing the following protocol for each sample: 5 uL plasmid DNA, 1 uL React 3
10X buffer (Invitrogen), 1 uL EcoR1 enzyme (Invitrogen), and 3 uL of distilled water.
Tubes were placed in 37ºC water bath for 90 min. Efficiency of the restriction enzyme was
evidenced running the samples in a 2% agarose gel stained with ethidium bromide.
Sequencing and analysis of the sequences
Twelve samples were sent to be sequenced to the Biotechnology Center of
University of Illinois at Urbana-Champaign (UIUC Core Sequencing Facility), but only ten
sequences were considered reliable. The obtained sequences were processed by Mega
3.1.software and compared to sequences found in the National Center for Biotechnology
Information Nucleotide Data Base (BLAST, http://www.ncbi.nlm.nih.gov/blast).
Phylogenetic trees were constructed by bootstrap using Neighbor Joining method for each
sequence. Rhabdochlamydia crassificans (AY928092) and Leptonema illini 16S rDNA
sequences were used as out-groups for phylogenetic analysis (Supplementary information,
figures 1, 2 and 3).
Results
Study Population
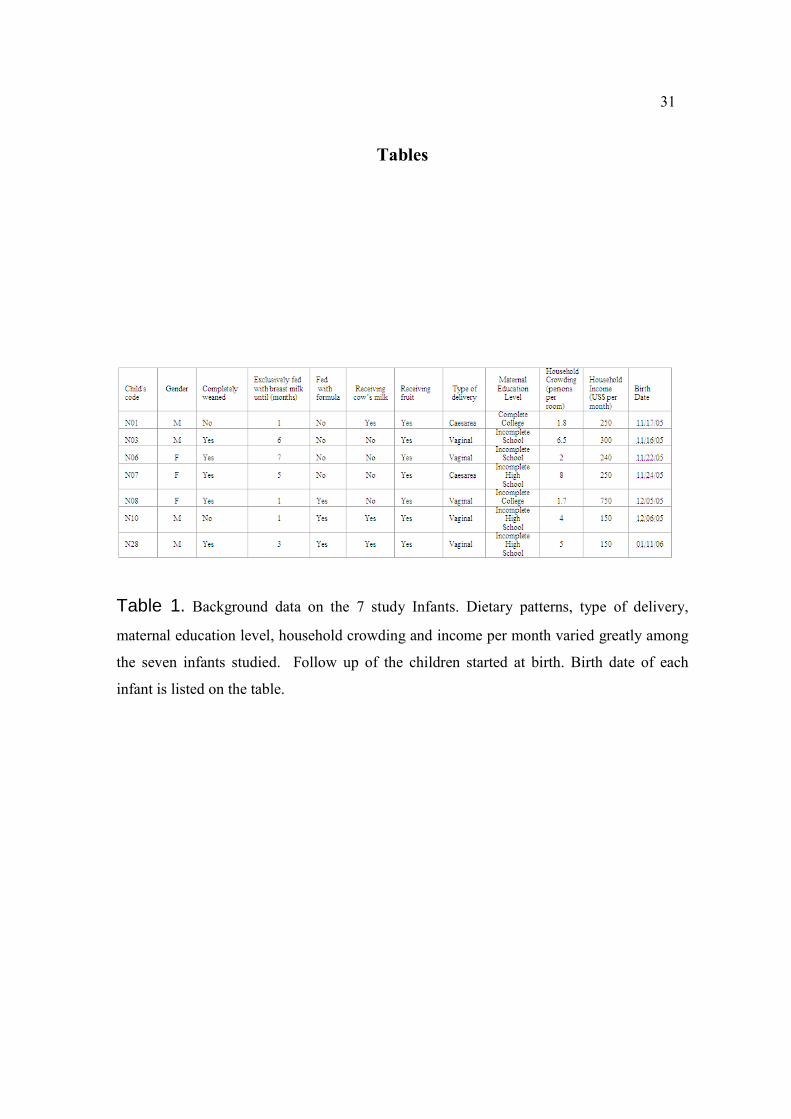
The study population was composed by three females and four males. Only two of
the infants were not completely weaned by the seventh month. Supplementation other than
breast milk started at different times in most of the children, three of them started weaning
17
at their first month, the rest of the infants started at the third, fifth, sixth and seventh
months. By the seventh month, three of them were fed with formula, another three were
receiving cow’s milk, and all were receiving fruit. Two were born by caesarean section and
five were vaginally delivered. Regarding to maternal education, only two reached college
level and the rest had an education level below high school (two did not complete basic
school). House crowding varied from 1.7 to 8 persons per room and household income
varied from 150 to 750 US dollars per month (Table 1).
T-RFLP
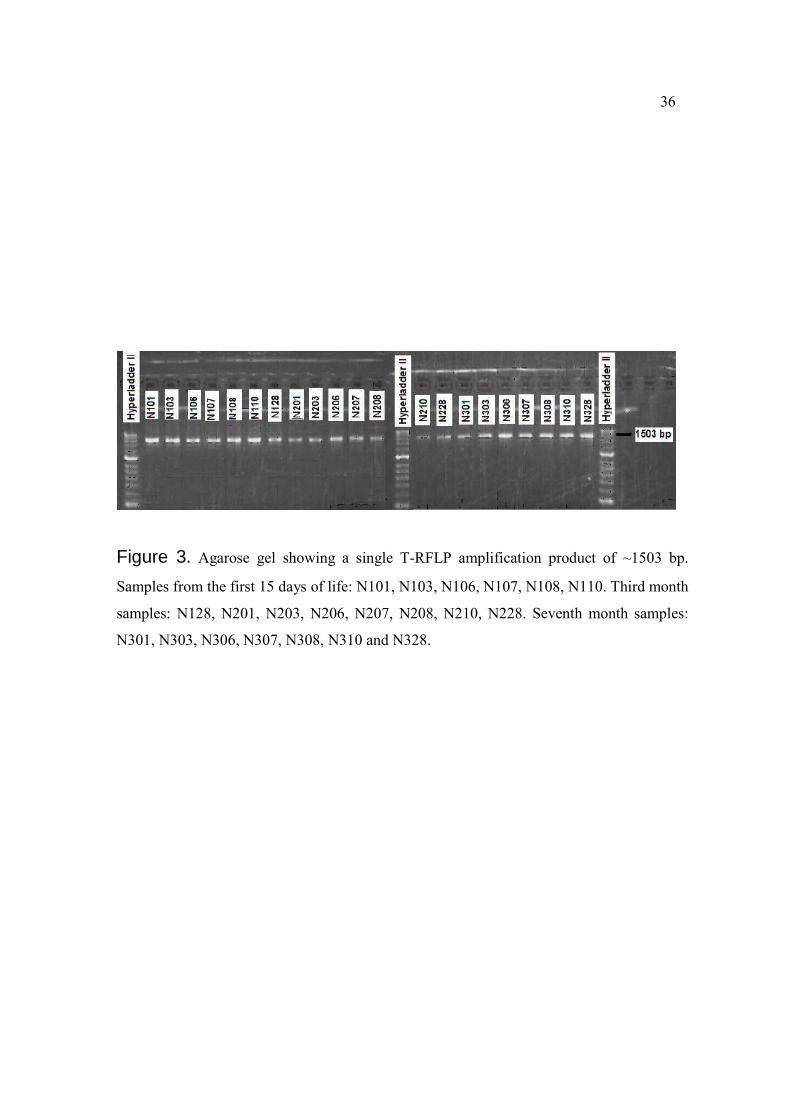
As shown in Figure 3, an amplification product of ~1503 bp (almost the entire 16S
rDNA gene), with no unspecific bands was obtained for each sample. None of the samples
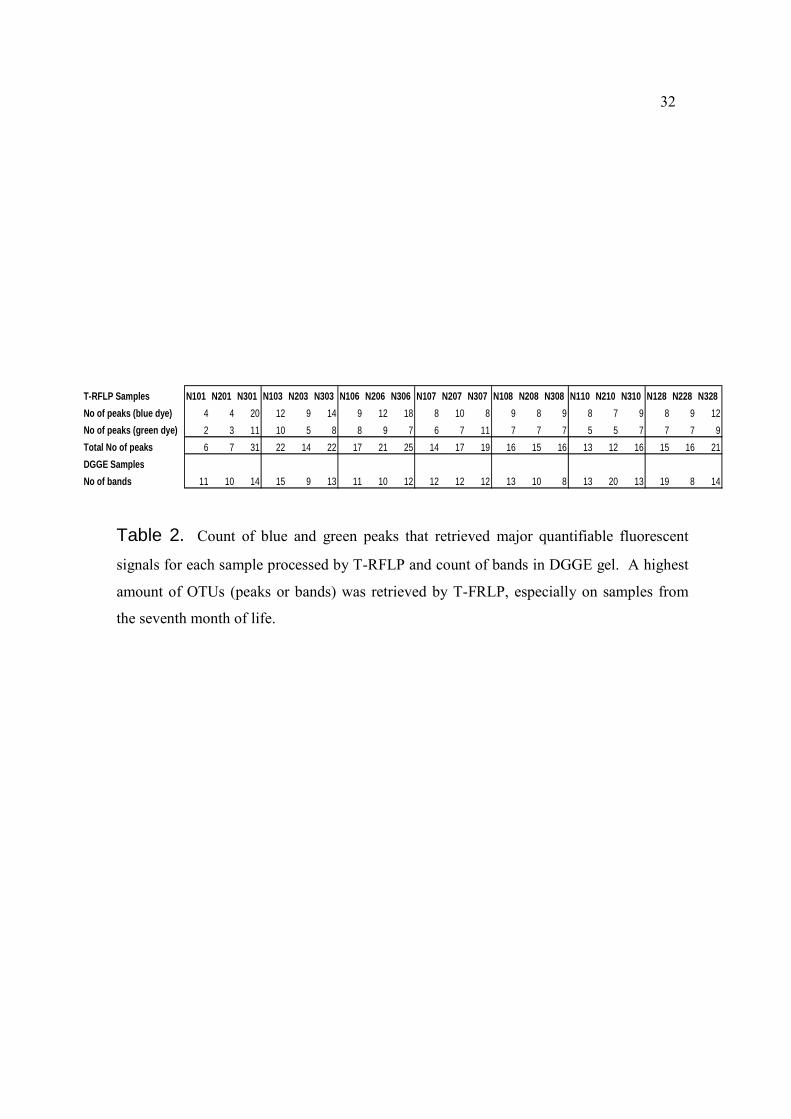
showed PCR amplification problems due to fecal inhibitory substances. Table 2 shows the
number of green and blue T-RFLP major peaks counted on each sample. A total of 26
different green peaks were counted among all the samples and 74 different blue peaks were
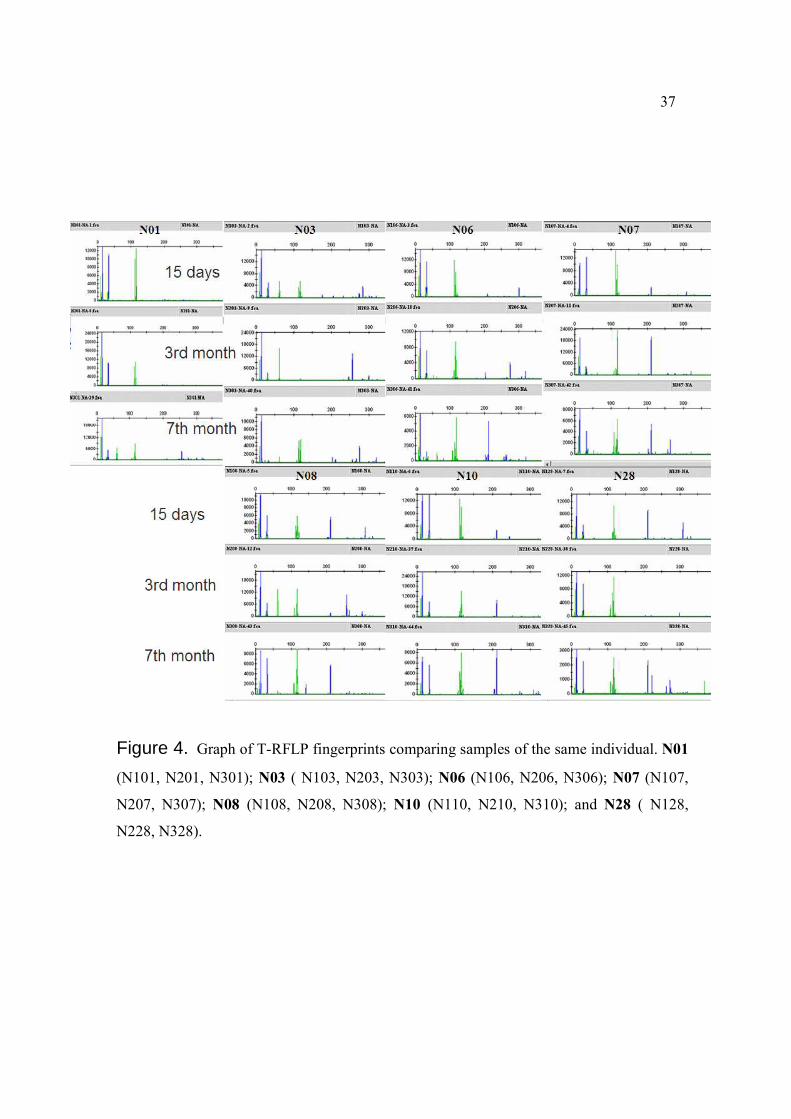
also recognized. Figure 4 shows T-RFLP graphics from all the samples processed.
Changes of the microbiota were observed by distinguishing presence or absence of peaks,
as well as by their differences in fluorescence intensity (height of peaks). The average of
number of peaks were 14.7, 14.5 and 21.4 for N1 (15 days), N2 (third month) and N3
(seventh month) groups respectively. These data agreed with the expected increase of
complexity that bacterial communities acquire as they develop within time. Peaks that
seemed to appear at the same level on the T-RFLP graphics from samples of the same
individual did not have equal number of base pairs, and were classified as different by the
precise detection of the gel scanning process. After analyzing the numerical data of peaks,
18
differences were found between samples from the same individuals at different time
periods, showing evident patterns of bacterial succession. Different patterns were observed
while comparing samples from each infant to the other, showing also enormous variability
of the microbiota between individuals.
DGGE
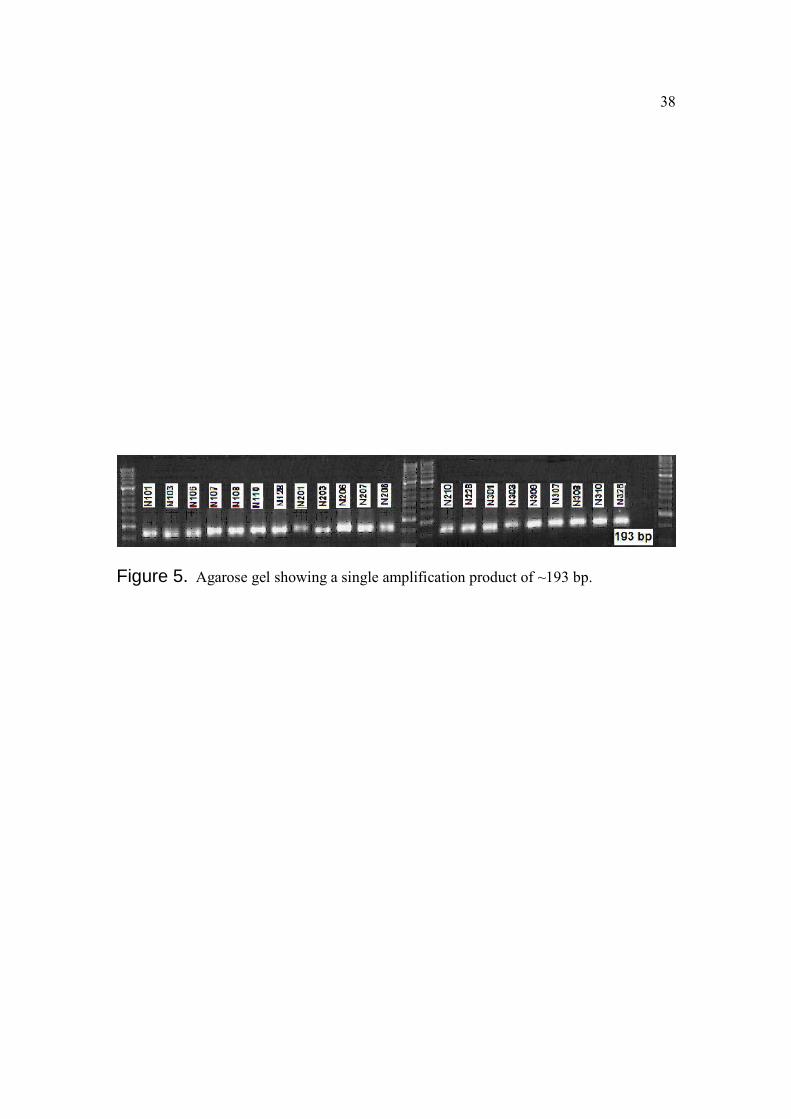
Touchdown PCR was performed to amplify the products of V3 variable region of
16S rDNA (~193 bp) of each sample (Figure 5). DGGE gels showed clear banding and
good resolution. A total of 76 different bands were detected by Diversity Database
Software. The average of number of bands from all the samples from N1 (first 15 days),
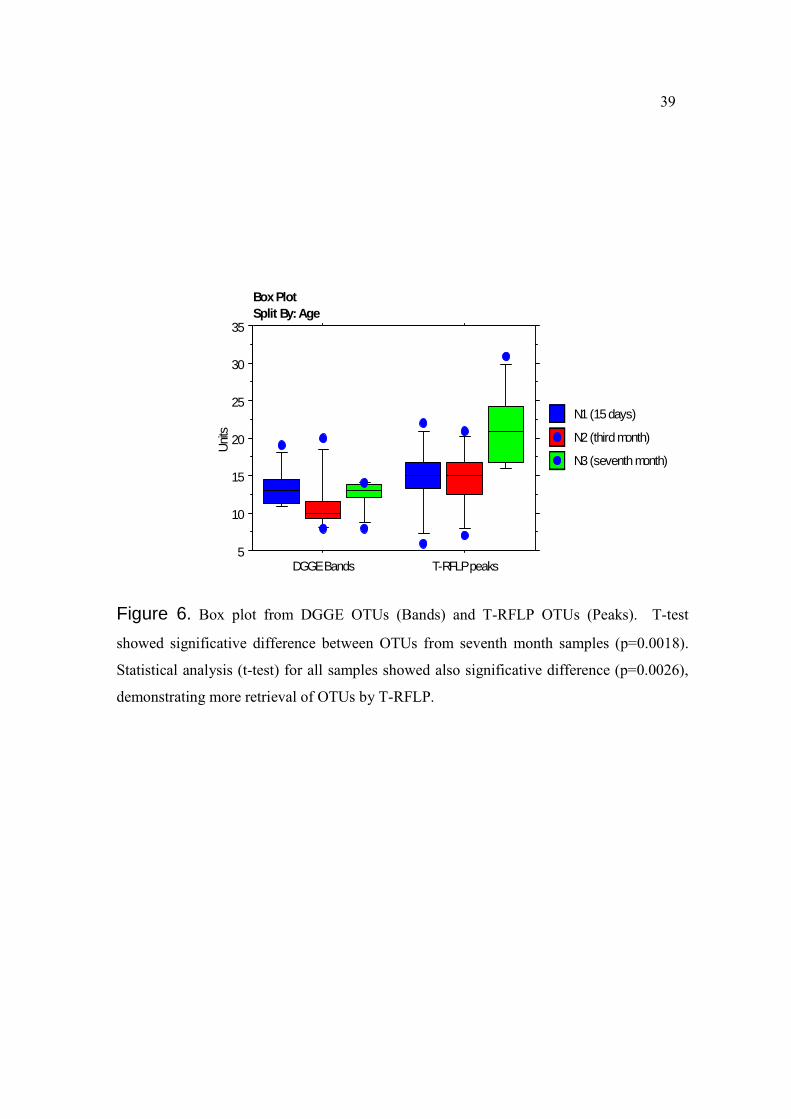
N2 (third month) and N3 (seventh month) were 13.4, 11.2 and 12.2 respectively. Table 2
shows the number of bands counted in DGGE gel for each sample. Statistical analysis
showed significative difference between the amount of information (OTUs, Operational
Taxonomic Units) that retrieved the total and the seventh month count of DGGE bands and
T-RFLP peaks. These results demonstrated that DGGE produced less data than T-RFLP
(Figure 6). Changes in number, intensity and type of banding patterns were observed
between samples of the same individual collected at different times, showing clear evidence
of bacterial succession. Counts and banding patterns were also different between
individuals of the same age, demonstrating unique fingerprints for each infant. Samples
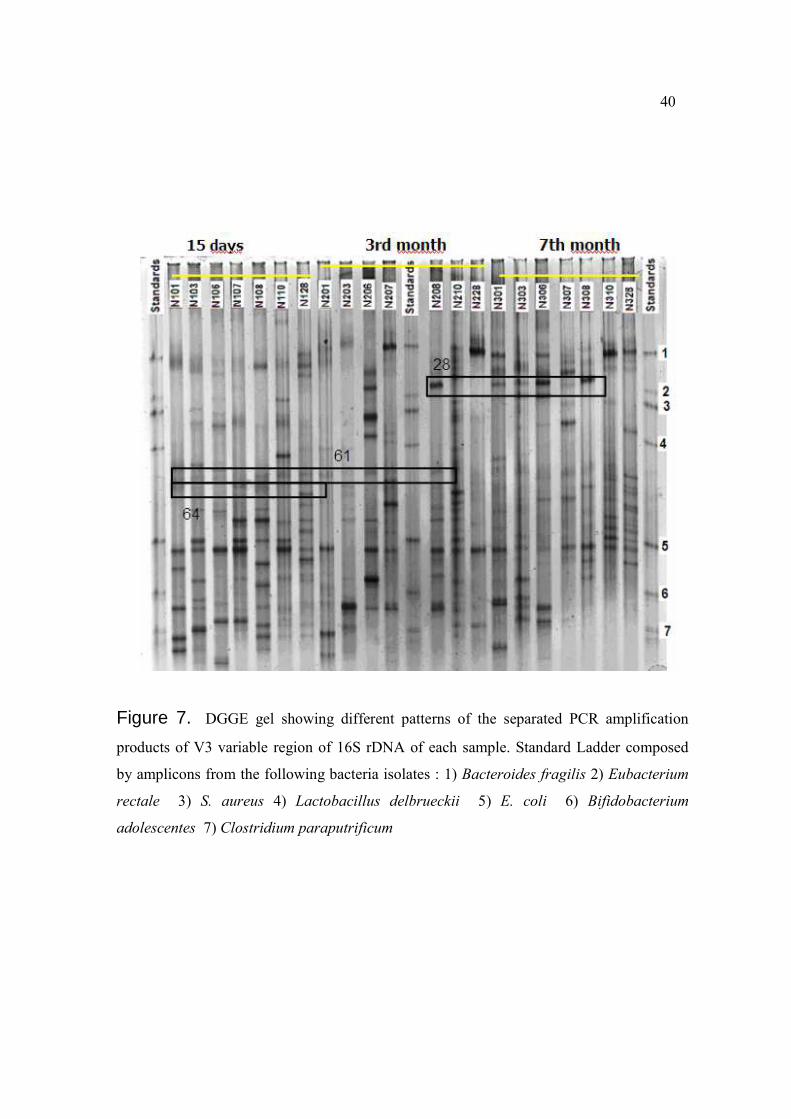
collected at the first 15 days of life (N1) showed more bands located at the lower zone of
the gel, where sequences with a higher content of CG (higher melting temperature) can be
contained, because of the higher amount of denaturing chemicals. Samples collected at the
seventh month (N3) showed more bands in the upper zone of the gel. A transition shift of
19
different CG containing bands was observed in N2 (third month) samples, where more
bands with a lower content of CG started to appear, balancing the amount of bands located
in the upper and lower zone of the gel (Figure 7). Additionally, only two types of bands
matched the standards set on the ladder, which corresponded to standard bands number one
(Bacteroides fragilis) and five (Escherichia coli). Bands corresponding to B. fragilis were
most prevalent on N3 samples (N301, N306, N310 and N328), and bands corresponding to
E. coli were most prevalent on N1 samples, specifically N103, N107, N108 and N110
(Figure 7).
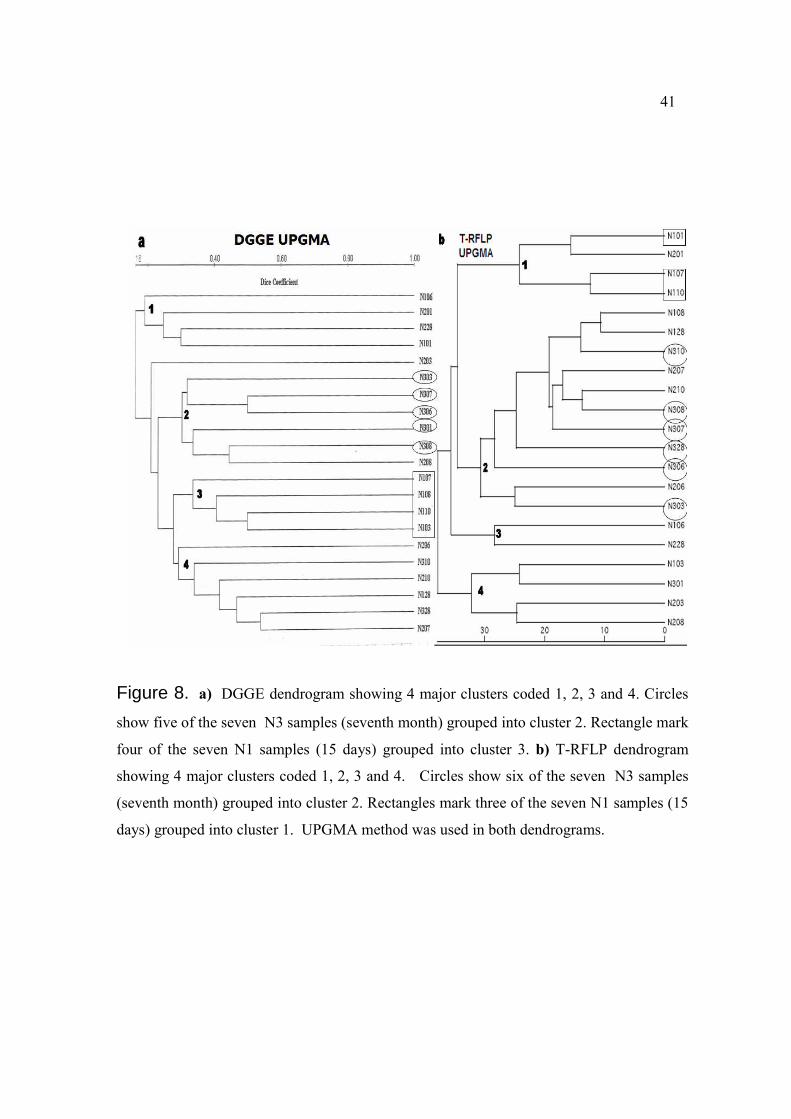
T-RFLP and DGGE dendrograms
The dendrograms produced comparing all the samples by T-RFLP and DGGE did
not match and did not follow a similar clustering pattern (Figure 8), the same absence of
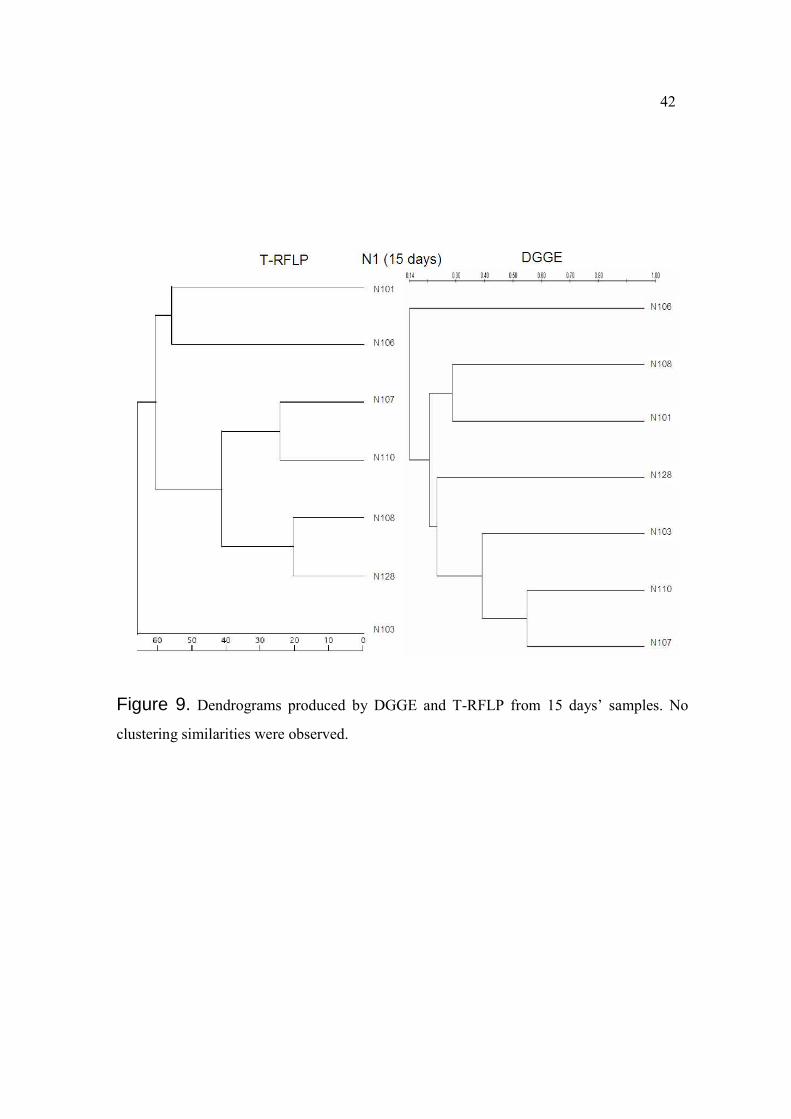
clustering similarities between techniques was observed also when additional dendrograms
constructed with samples from each group of age (N1, N2 and N3) were compared.
Moreover, N1, N2 and N3 dendrograms constructed with the information produced by the
same technique (Figures 9, 10 and 11), did not follow a similar clustering pattern either.
Only a few clusters from either one of the dendrograms containing all the samples
corresponded to individuals of the same age, specially the ones collected at the seventh
month of life (N3). A few of the 15 days samples (N2) also clustered together (Figure 8).
The T-RFLP dendrogram contained four main clusters, one of them composed by a
larger number of samples. Cluster number 2 contained six out of the seven samples from
breastfed infants at their seventh month of life (N3). Similarly, the DGGE dendrogram
formed four main clusters. As in the case of the T-RFLP dendrogram, cluster number 2
20
contained most of the samples collected at the seventh month of life, clustering together
five out of the seven samples corresponding to this group of age. When we analyzed the
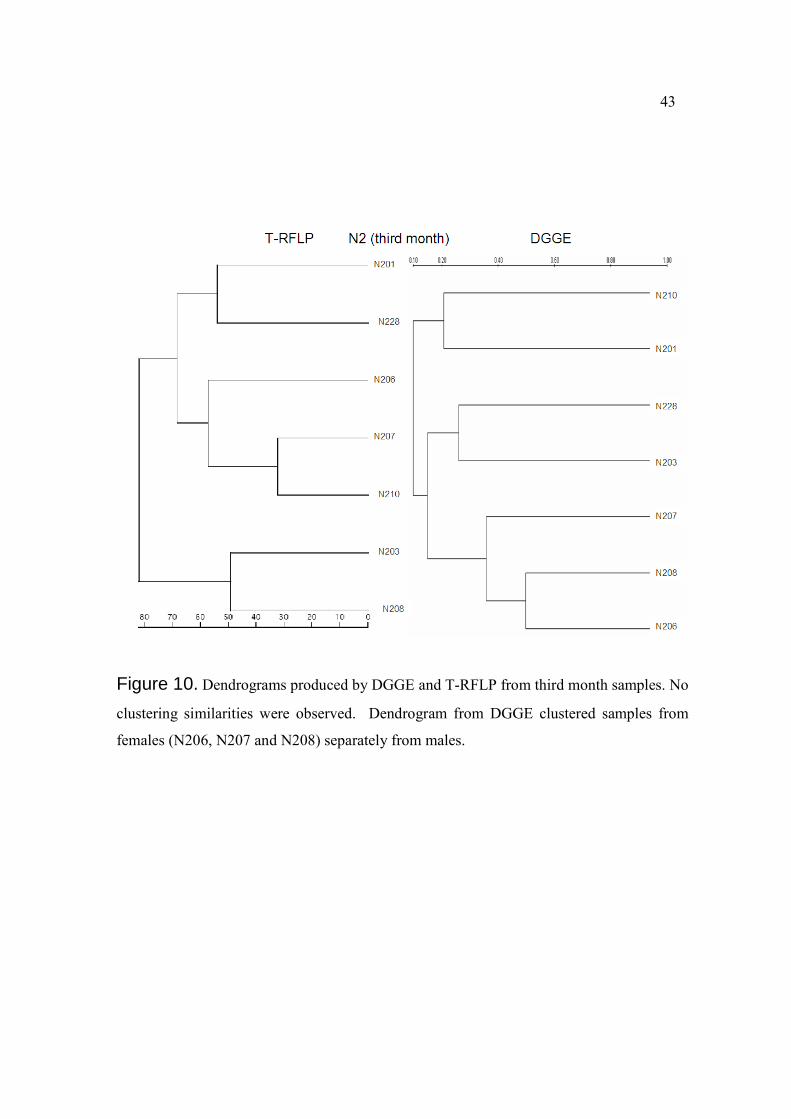
three samples obtained from the same individual at different times, none of them clustered.
No other similarity was observed among the dendrograms, except for clustering by gender
evidenced in the DGGE dendrogram constructed from third month samples, where female
samples were separated in a single cluster from male samples (Figure 10).
Analysis of sequences obtained from excised DGGE bands
We intended to identify bands that were present in most of the samples belonging to
certain group of age and were absent or less prevalent in the samples from the rest of the
groups. After excision of the bands, cloning and insertion of the sequences were verified
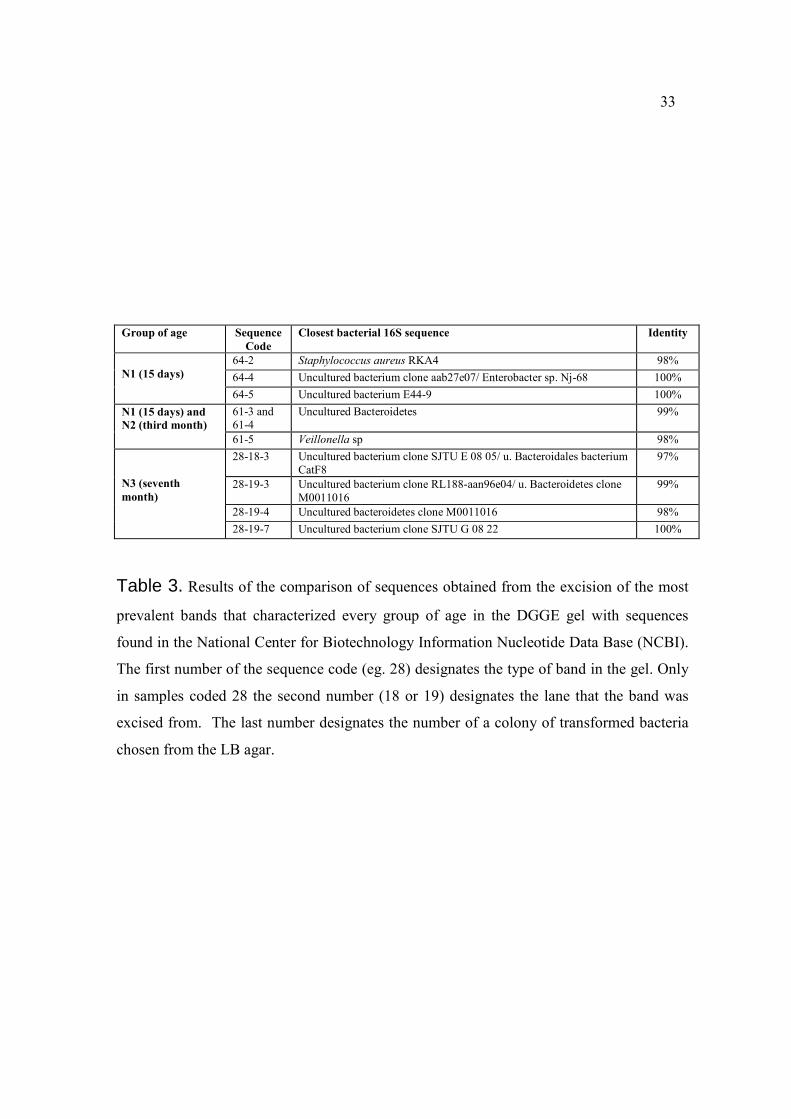
in an agarose gel (Figure 12). Twelve plasmids were chosen and sent to be sequenced. Ten
out of the twelve plasmids retrieved sequences that could be compared to sequences found
in the National Center for Biotechnology Information Nucleotide Data Base (NCBI). The
results are shown in Table 3. Sequences coded 28-18-3 and 28-19-7 were excised from
bands located in different lanes (different individual’s samples) of the gel that shared the
same migration distance, as expected, they clustered together when their sequences were
compared with Mega 3.1.software (Figure 13). As also expected, sequences 61-3 and 61-4
(derived from the same band and lane) clustered together as did sequences 64-4 and 64-5.
Sequences 61-3 and 61-4 matched both uncultured Bacteroidetes clones sequences.
Sequences 64-4 and 64-5 matched uncultured bacteria clone sequences, the first one
resembling also to certain types of enterobacteria (Enterobacter, E. coli, and uncultured
gama proteobacterium clones). All of the sequences coded as 28 showed similarity to
21
uncultured clones of bacteria, most of them clustered together with uncultured
Bacteroidetes/Bacteroidales sequences, and were present in samples N208,
N301,N303,N306, N307 and N308, being most prevalent on seventh month samples.
Although cloned from the same excised band, sequences 28-19-3 and 28-19-4
differed from 28-19-7, sequences 61-3 and 61-4 differed from 61-5, and sequences 64-4
and 64-5 differed also from 64-2, showing that different sequences originated from
different bacteria can be located in the same gel band because of their equal melting
temperature. Sequence 61-5 showed 98% identity to Veillonella sequences. Bands coded
61, were more prevalent on samples from the first 15 days and third month of life.
Sequence 64-2 showed 98% identity to Staphylococcus aureus which was not consistent
with the expected position of the band it was cloned from, comparing with the position of
band number 3 (S. aureus), located in the reference ladder (Figure 7). Sequences coded 64
were more prevalent on samples collected in the first 15 days.
Discussion
As in the present study, many other studies have shown before that intestinal
bacterial community patterns change continuously over time (Simpson et al. 2000). Others
have also indicated that the microbiota stays relatively stable, with only minor changes in
microbial intestinal patterns (Franks et al. 1998; Sghir et al. 2000) even when probiotics are
administrated (Zoetendal et al. 1998; Tannock et al. 2000; Toivanen et al., 2001),
demonstrating that samples that have been taken from the same individual usually cluster
together even when collected at different sampling times (Bernbom et al. 2006). These
stable patterns have also been observed in the microbiota of saliva (Sakamoto et al. 2003)
22
and vagina (Coolen et al. 2005). We could not evidence such minor changes or stability in
the samples studied, on the contrary, we observed major changes in banding (DGGE) and
peak (T-RFLP) patterns between the samples collected from the same individual at
different times, showing that intestinal bacterial succession is a dynamic process that
becomes more complex and evident in the early months of life. Along with this, samples
collected from different individuals showed also major differences in their banding pattern
that did not result in clear clustering in any of the dendrograms created. The major factors
involved in the maintenance, cycling, and composition of the microbiota are: diet, age, pH,
reduction potential, medicines (e.g. antibiotics), stress and host genetic background.
(Toivanen et al., 2001; Mai and Morris., 2003).
Since many of the factors described above are difficult to control in humans, the
lack of clustering between most of the samples from the same individual could be explained
by the following reasons: 1) The first two years of life in humans represent a period during
which there are enormous changes in the environment of the intestine caused by changes in
diet (eg breast-feeding, weaning, etc) that are likely to have significant effects on the
development of the microbiota, in contrast to the more stable flora observed in adults in
whom dietary changes tend to be minimal and the succession process is less evident
(Mackie et al., 1999; Franks et al. 1998; Sghir et al. 2000). 2) Each sampling time
represents totally different stages of bacterial colonization especially regarding to diet and
age (Simpson et al. 2000). The sampling between the 1st
(two weeks), 2nd
(third month)
and 3rd
(seventh month) collections could be too far away from each other. Besides, the
sampling periods in this study intended to show a separated phase of life that was
previously described as a phase that strongly marks the composition of the intestinal
microbiota depending on the substrates that become available for the bacteria newly added
23
to the intestine (Mai and Morris., 2003). 3) Even though the infants shared factors such as
similar environmental living conditions and age, differences in the own genetic background
of every infant may have affected clustering. Even though a few clusters had a
predominance of samples corresponding to individuals sharing the same age, in general,
most of the samples did not follow any clustering pattern directed by this latter factor. 4)
All children were included on the regular diet of the family by the 7th
month, and diet and
time of weaning varied from one infant to the other (Table 1). 5) Small sample size and
limit power to detect absolute patterns of the two different techniques used. 6) Finally, the
software used to process each methodology was different and this could also influence the
lack of clustering similarities.
Only one of the DGGE dendrograms (third month samples) was able to cluster
samples by gender (Figure 10), influencing factor that has previously been associated with
stool microbiota clustering in an animal model study (Bernbom et al. 2006). None of the
rest of the dendrograms created showed similar gender clustering patterns.
Contrary to the data shown here, there are studies where the OTUs of T-RFLP
produced the same clustering patters as the DGGE ones, resulting in identical dendrograms
except for the length of their branches, differences that were attributed to the larger number
of OTUs that T-RFLP retrieved (Moeseneder et al. 1999).
A study conducted by Sakamoto M (2003) showed at the same time concordances
and discrepancies between PCR data and the analysis performed by T-RFLP and DGGE.
PCR bias was the main reason to explain discrepancies in one of the samples studied
(Sakamoto et al., 2003). PCR bias can favor the amplification of certain sequences over
others due to preferential priming (Díez et al. 2001) and thus, may alter fingerprint patterns.
24
The use of different primers and different 16S rDNA sequence targets, could also affect
clustering similarities in this study due to preferential priming.
In other studies (Moeseneder et al. 1999), T-RFLP demonstrated a better resolution
and retrieved larger amount of data (OTUs) (Table 2) than DGGE. T-RFLP showed to be a
technique that demanded less time of processing and less possibility of bias. The better
sensitivity of T-RFLP and its finer detection of OTUs were also shown in this study.
DGGE proved to be more time-consuming and had more possibilities of bias, but was very
useful on the characterization of known and unknown bacterial sequences.
Sequencing of excised bands allowed us to evidence early colonization (at 15 days
of life) of bacteria such as: Veillonella sp, uncultured bacteroidetes and other uncultured
bacteria in the infants studied. Persistent colonization of Veillonella sp and uncultured
Bacteroidetes was observed by the presence of the corresponding bands in most of the
samples belonging to the third month of life. Similarly, sequences showing high identity to
uncultured bacterial clones that resembled Bacteroidales, Bacteroidetes and other unknown
bacteria clone sequences were present in most of the samples belonging to the seventh
month of life and absent in the rest of the age groups. These results are consistent with
previous reports where progressive addition of Bacteroidetes has been described during
phases 3 and 4 of bacterial succession (Conway, 1997; Mackie et al., 1999; Favier et al.,
2002). Furthermore, although DGGE bands that corresponded to the position of B. fragilis
and E. coli in the standard ladder were not cloned and sequenced, a possible early
colonization of E. coli and latter colonization of B. fragilis (seventh month) could be
inferred by the presence of the corresponding bands, data that are consistent with previous
reports (Conway, 1997; Mackie et al., 1999; Favier et al., 2002). Additionally, sequence
64-2 showed 98% identity to Staphylococcus aureus, but its position in the gel did not

25
correspond to the band set in the standard ladder and this makes difficult to infer an early
colonization of this bacterium on the sample studied.
The data shown in this study could not demonstrate marked differences by age
groups or specific phases of bacterial succession, but allowed us to observe major general
shifts in the development of the intestinal microbiota of human breastfed infants during
their first seventh months of life and to compare the benefits and drawbacks that DGGE
and T-RFLP offer.
Conclusions
Previous approaches such as cloning and sequencing of the products of 16S rDNA
amplification by PCR have been extensively used to evaluate bacterial communities.
Unfortunately, most of these techniques are extremely time-consuming, laborious and
provide only qualitative data. Even though T-RFLP and DGGE methods can not be
entirely comparable, the different benefits that each of them offer can be applied depending
on the necessities of every study. The less bias, more sensitivity and reproducibility of T-
RFLP may be more useful in mass screening, while DGGE can constitute a better option
while trying to characterize new genera and species of bacteria due to its capability to
perform further sequencing. Each technique can be complementary in aspects where the
other fails. For these reasons, DGGE and T-RFLP offer both important advantages for the
study of fecal microbiota. The methods, however, cannot always retrieve similar clustering
patterns and thus, can not solve entirely the understanding about the complex dynamics that
bacterial communities enclose. More studies and new techniques are needed to solve all
the uncertainties that the human microbiota hides.
26
References
Amann R. et al. 1995 Phylogenetic identification and In Situ detection on individual
microbial cells without cultivation. Micr Rev 59;1:143-169.
Apajalahti J, et al. 2003. Selective plating underestimates abundance and shows differential
recovery of Bifidobacterial species from human feces. App. Env. Micr. 69;9:5731-5735.
Bäckhed F. et al. 2005. Host-Bacterial mutualism in the human intestine. Science.
307:1915-1920.
Bernbom N et al. 2006. Comparison of methods and animal models commonly used for
investigation of fecal microbiota: Effects of time, host and gender. J Micr Meth. 66:87-95.
Clavel T, et al. 2005.Intestinal bacterial communities that produce active estrogen-like
compounds enterodiol and enterolactone in humans. Appl Env Micr. 71;10:6077-6085.
Conway P. 1997. Development of intestinal microbiota. In: Mackie RI, White BA, Isaacson
RE, eds. Gastrointestinal Microbiology. Vol 2. New York: Chapman and Hall, 3-38.
Coolen M, et al. 2005. Characterization of microbial communities found in the human
vagina by analysis of terminal restriction fragment length polymorphisms of 16 S rRNA
genes. App Env Micr. 71;12:8729-8737.
Deplancke B and Gaskins HR. 2001. Microbial modulation of innate defense: goblet cells
and the intestinal mucus layer. Am J Clin Nutr. 73(suppl):1131S-1141S.
Deplancke B, et al. 2002.Selective growth of mucolytic bacteria including Clostridium
perfringens in a neonatal piglet model of total parenteral nutrition. Am J Clin Nutr.
76:1117-1125.
Diaz G and Rodarte C. 2003. Methods for the study of microbial communities in fermented
foods. Rev Lat Micro. 45;1-2:30-40.
Díez B, et al. 2001. Application of denaturing gradient gel electrophoresis (DGGE) to study
the diversity of marine picoeukaryotic assemblages and comparison of DGGE with other
molecular techniques. Appl. Env. Micr. 67;7:2942-2951.
El Fatroussi S, et al. 2003. Direct profiling of environmental microbial populations by
thermal dissociation analysis of native rRNA hybridized to oligonucleotide microarrays.
App. Env. Micr. 69;4:2377-2382.
Favier C, et al. 2002. Molecular monitoring of succession of bacterial communities in
human neonates. Appl Env Micr. 68;1:219-226.

27
Franks A, et al. 1998. Variations of bacterial populations in human feces measured by
fluorescent in situ hybridization with group-specific 16S rRNA-targeted oligonucleotide
probes. App. Env. Micr. 64;9:3336-3345.
Guan L, et al. 2003. Detection and identification of Lactobacillus spacies in crops of
broilers of different ages by using PCR-denaturing gradient gel electrophoresis and
amplified ribosomal DNA restriction analysis. App. Env. Micr. 69;11:6750-6757.
Hooper L, et al. 2001. Molecular analysis of commensal host-microbial relationships in the
intestine. Science. 2001. 291:881-884.
INEC. 2001 Indicadores Sociales, Censo de Población y Vivienda, Ecuador.
INEC. 2003 Anuario de Camas y Egresos Hospitalarios 2003, Ecuador
INEC, OMS. 2004. Indicadores Básicos de Salud 2004, Ministerio de Salud Pública del
Ecuador.
Kimura K, McCartney A, McConnell M and Tannock G. 1997. Analysis of fecal
populations of Bifidobacteria and Lactobacilli and investigation of the immunological
responses of their human host to the predominant strains. Appl Env Micr. 63;9:3394-3398.
Kroes I, Lepp P and Relman D. 1999. Bacterial diversity within the human subgingival
crevice. PNAS. 96;25:14547-14552.
Leser T, et al. 2002. Culture-independent analysis of gut bacteria: the pig gastrointestinal
tract microbiota revisited. App. Env. Micr. 68;2:673-690.
Ley R, et al. 2005. Obesity alters gut microbial ecology. PNAS. 102;31:11070-11075.
Liu W, et al. 1997. Characterization of microbial diversity by determining terminal
restriction fragment length polymorphisms of genes encoding 16S rRNA. App. Env. Micr
63;11:4516-4522.
Loy A, et al. 2002. Oligonucleotide microarray for 16S rRNA gene-based detection of al
recognized lineages of sulfate-reducing prokaryotes in the environment. App. Env. Micr.
68;10:5064-5081.
Mackie R. et al. 1999. Developmental microbial ecology of the neonatal gastrointestinal
tract. Am J Clin Nutr. 69(suppl):1035S-1045S.
Mai V and Morris G Jr. 2003. Colonic bacterial flora: changing understanding in the
molecular age. J Nutr. 459-464.
Marteau P, et al. 2001. Comparative study of bacterial groups within the human cecal and
fecal microbiota. Appl Env Micr. 67;10:4939-4942.
28
Moeseneder M, et al. 1999. Optimization of terminal-restriction fragment length
polymorphism analysis for complex marine bacterioplankton communities and comparison
with denaturing gradient gel electrophoresis. Appl. Env. Micr. 65;8:3518-3525.
Muyzer G, De Waal E and Uitterlinden. 1993. Profiling of complex microbial populations
by denaturing gradient gel electrophoreses analysis of polymerase chain reaction-amplified
genes coding for 16SrRNA. App. Env. Micr. 59;3:695-700.
Muyzer G and Smalla K. 1998. Application of denaturing gradient gel electrophoresis
(DGGE) and temperature gradient gel electrophoresis (TGGE) in microbial ecology.
Antonie Van Leeuwenhoek 73:127-141.
Nagashima K, et al. 2003. Application of new primer-enzyme combinations to terminal
restriction fragment length polymorphism profiling of bacterial populations in human feces.
App Env Micr. 69;2:1251-1262.
Orita M, et al. 1998. Detection of polymorphisms of human by gel electrophoresis as
single-strand conformation polymorphisms. Proc Nat Acad Sci USA. 86:2766-2770.
O'Sullivan D. 1999. Methods for analysis of the intestinal microflora. In: Probiotics: A
critical review. G.W. Tannock, ed. Horizon Scientific Press. Norfolk, England. p. 23-44.
Paster B, et al. 2001. Bacterial diversity in human subgingival plaque. J Bact 183;12:3770-
3783.
Pryde S. et al. 1999. Molecular analysis of the microbial diversity present in the colonic
wall, colonic lumen, and cecal lumen of a pig. App. Env. Micr. 65;12:5372-5377.
Sakamoto M, Hayashi H and Benno Y. 2003. Terminal restriction fragment length
polumorphism analysis for human fecal microbiota and its application for analysis of
complex Bifidobacterial communities. Micr. Immun. 47;2:133-142.
Sakamoto M, et al. 2003. Application of terminal RFLP analysis to characterize oral
bacterial flora in saliva of healthy subjects and patients with periodontitis. J Med Micr.
52:79-89.
Sghir A, et al. 2000. Quantification of bacterial groups within human fecal flora by
oligonucleotide probe hybridization. App. Env Micr. 66;5:2263-2266).
Satokari R, et al. 2001. Bifidobacterial diversity in human feces detected by genus-specific
PCR and denaturing gradient gel electrophoresis. Appl Env Micr. 67;2:504-513.
Simpson JM, et al. 1999. Application of denaturant gradient gel electrophoresis for the
analysis of the porcine gastrointestinal microbiota. J Micr Meth. 36;3:167-179.

29
Simpson J, et al. 2000. Denaturing gradient gel electrophoresis analysis of 16S ribosomal
DNA amplicons to monitor changes in fecal bacterial populations of weaning pigs after
introduction of Lactobacillus reuteri strain MM53. Appl Env Micr. 66;11:4705-4714.
Suau A. et al. 1999. Direct analysis of genes encoding 16S rRNA from complex
communities reveals many novel molecular species within the human gut. Appl Env Micr.
65;11:4799-4807.
Svensson L and Wenneras C. 2005. Human eosinophils selectively recognize and become
activated by bacteria belonging to different taxonomic groups. Micr Inf. 7:750-728.
Tannock G. 1999. Analysis of the intestinal microflora: a renaissance. Antonie van
Leeuwenhoek. 76:265-278.
Tannock GW, et al. 2000 Analysis of the fecal microflora of human subjects consuming a
probiotic product containing Lactobacillus rhamnosus DR20. App. Env. Micr. 66;6:2578-
2588.
Toivanen P, Vaahtovuo J and Eerola E. 2001. Influence of major histocompatibility
complex of fecal flora. Inf Imm. 69;4:2372-2377.
Vaughan E. et al. 2000. A molecular view of the intestinal ecosystem. Curr Issu Int Micr
1;1:1-12.
Wallner G, et al. 1997. Flow sorting of microorganisms for molecular analysis. App. Env.
Micr. 63;11:4223-4231
Wang R, et al. 1996. PCR detection and quantitation of predominant anaerobic bacteria in
human and animal fecal samples. App Env Micr. 62;4:1242-1247.
Wang W, et al. 2003. Molecular characterization of the microbial species that colonize
human ileal and colonic mucosa by using 16S rDNA sequence analysis. J Appl Micr.
95:508-520.
WHO,http://ehpnet1.niehs.nih.gov/docs/2002/110p537-542prüss/abstract.html
Wilson K and Blitchington R 1996. Human colonic biota studied by ribosomal DNA
sequence analysis. Appl Env. Micr. 62:2273-2278.
Zoetendal E, et al. 1998. Temperature gradient gel elecrophoresis analysis of 16S rRNA
from human fecal samples reveals stable and host-specific communities of active bacteria.
App. Env. Micr. 64;10:3854-3859.
Zoetendal E, et al. 2002. Mucosa-associated bacteria in the human gastrointestinal tract are
uniformly distributed along the colon and differ from the community recovered from feces.
Appl. Env. Micr. 68;7:34-01-3407.

30
Zoetendal E, et al. 2002. Quantification of uncultured Ruminococcus obeum-like bacteria in
human fecal samples by fluorescent in situ hybridization and flow cytometry using 16S
rRNA-targeted probes. App. Env. Micr. 68;9:4225-4232.
Zoetendal E. et al 2004. Diet induced changes in the colonic environment and colorectal
cancer. Am Soc Nutr Sci. 465-472.
Zwart G and Bok J. 2004. Protocol DGGE. Center for Limnology, Netherlands Institute of
Ecology (NIOO-KNAW) 1-6.
31
Tables
Table 1. Background data on the 7 study Infants. Dietary patterns, type of delivery,
maternal education level, household crowding and income per month varied greatly among
the seven infants studied. Follow up of the children started at birth. Birth date of each
infant is listed on the table.
32
Table 2. Count of blue and green peaks that retrieved major quantifiable fluorescent
signals for each sample processed by T-RFLP and count of bands in DGGE gel. A highest
amount of OTUs (peaks or bands) was retrieved by T-FRLP, especially on samples from
the seventh month of life.
T-RFLP Samples N101 N201 N301 N103 N203 N303 N106 N206 N306 N107 N207 N307 N108 N208 N308 N110 N210 N310 N128 N228 N328
No of peaks (blue dye) 4 4 20 12 9 14 9 12 18 8 10 8 9 8 9 8 7 9 8 9 12
No of peaks (green dye) 2 3 11 10 5 8 8 9 7 6 7 11 7 7 7 5 5 7 7 7 9
Total No of peaks 6 7 31 22 14 22 17 21 25 14 17 19 16 15 16 13 12 16 15 16 21
DGGE Samples
No of bands 11 10 14 15 9 13 11 10 12 12 12 12 13 10 8 13 20 13 19 8 14
33
Group of age Sequence
Code Closest bacterial 16S sequence Identity
N1 (15 days)
64-2 Staphylococcus aureus RKA4 98%
64-4 Uncultured bacterium clone aab27e07/ Enterobacter sp. Nj-68 100%
64-5 Uncultured bacterium E44-9 100%
N1 (15 days) and N2 (third month)
61-3 and
61-4
Uncultured Bacteroidetes 99%
61-5 Veillonella sp 98%
N3 (seventh month)
28-18-3 Uncultured bacterium clone SJTU E 08 05/ u. Bacteroidales bacterium
CatF8
97%
28-19-3 Uncultured bacterium clone RL188-aan96e04/ u. Bacteroidetes clone
M0011016
99%
28-19-4 Uncultured bacteroidetes clone M0011016 98%
28-19-7 Uncultured bacterium clone SJTU G 08 22 100%
Table 3. Results of the comparison of sequences obtained from the excision of the most
prevalent bands that characterized every group of age in the DGGE gel with sequences
found in the National Center for Biotechnology Information Nucleotide Data Base (NCBI).
The first number of the sequence code (eg. 28) designates the type of band in the gel. Only
in samples coded 28 the second number (18 or 19) designates the lane that the band was
excised from. The last number designates the number of a colony of transformed bacteria
chosen from the LB agar.
34
Figures
Figure 1. Red circle shows V3 variable region of 16S rRNA bacterial gene. The entire
gene has a length of ~1.542 bp.

35
Figure 2. Steps followed in the processing of fecal samples by DGGE and T-RFLP.
Both techniques start with DNA extraction from stool samples. DGGE needs a touchdown
PCR protocol to amplify V3 16S rDNA region, followed by removal of ssDNA, creating a
linear chemical gradient gel, loading, running and staining of the gel. After scanning the
gel, software is needed to perform phylogenetic analysis and to construct dendrograms.
Excision of chosen bands can be performed to clone, analyze and compare sequences with
DNA sequence databases to classify bacterial genera and/or species. T-RFLP PCR
protocol amplifies almost the entire 16S rDNA region using dyed primers, then, restriction
enzymes are needed before running the samples in a gel used for sequencing. Data
obtained from the scanning and detection of dyed terminal fragments are evaluated with
computer software in order to perform phylogenetic analysis and construction of
dendrograms. In some cases, comparison of peak databases can be done to find specific
bacterial genera and/or species.
36
Figure 3. Agarose gel showing a single T-RFLP amplification product of ~1503 bp.
Samples from the first 15 days of life: N101, N103, N106, N107, N108, N110. Third month
samples: N128, N201, N203, N206, N207, N208, N210, N228. Seventh month samples:
N301, N303, N306, N307, N308, N310 and N328.
37
Figure 4. Graph of T-RFLP fingerprints comparing samples of the same individual. N01
(N101, N201, N301); N03 ( N103, N203, N303); N06 (N106, N206, N306); N07 (N107,
N207, N307); N08 (N108, N208, N308); N10 (N110, N210, N310); and N28 ( N128,
N228, N328).
38
Figure 5. Agarose gel showing a single amplification product of ~193 bp.
39
Figure 6. Box plot from DGGE OTUs (Bands) and T-RFLP OTUs (Peaks). T-test
showed significative difference between OTUs from seventh month samples (p=0.0018).
Statistical analysis (t-test) for all samples showed also significative difference (p=0.0026),
demonstrating more retrieval of OTUs by T-RFLP.
5
10
15
20
25
30
35
Uni
ts
DGGE Bands T-RFLP peaks
N3 (seventh month)
N2 (third month)
N1 (15 days)
Box PlotSplit By: Age
40
Figure 7. DGGE gel showing different patterns of the separated PCR amplification
products of V3 variable region of 16S rDNA of each sample. Standard Ladder composed
by amplicons from the following bacteria isolates : 1) Bacteroides fragilis 2) Eubacterium
rectale 3) S. aureus 4) Lactobacillus delbrueckii 5) E. coli 6) Bifidobacterium
adolescentes 7) Clostridium paraputrificum
41
Figure 8. a) DGGE dendrogram showing 4 major clusters coded 1, 2, 3 and 4. Circles
show five of the seven N3 samples (seventh month) grouped into cluster 2. Rectangle mark
four of the seven N1 samples (15 days) grouped into cluster 3. b) T-RFLP dendrogram
showing 4 major clusters coded 1, 2, 3 and 4. Circles show six of the seven N3 samples
(seventh month) grouped into cluster 2. Rectangles mark three of the seven N1 samples (15
days) grouped into cluster 1. UPGMA method was used in both dendrograms.
42
Figure 9. Dendrograms produced by DGGE and T-RFLP from 15 days’ samples. No
clustering similarities were observed.
43
Figure 10. Dendrograms produced by DGGE and T-RFLP from third month samples. No
clustering similarities were observed. Dendrogram from DGGE clustered samples from
females (N206, N207 and N208) separately from males.
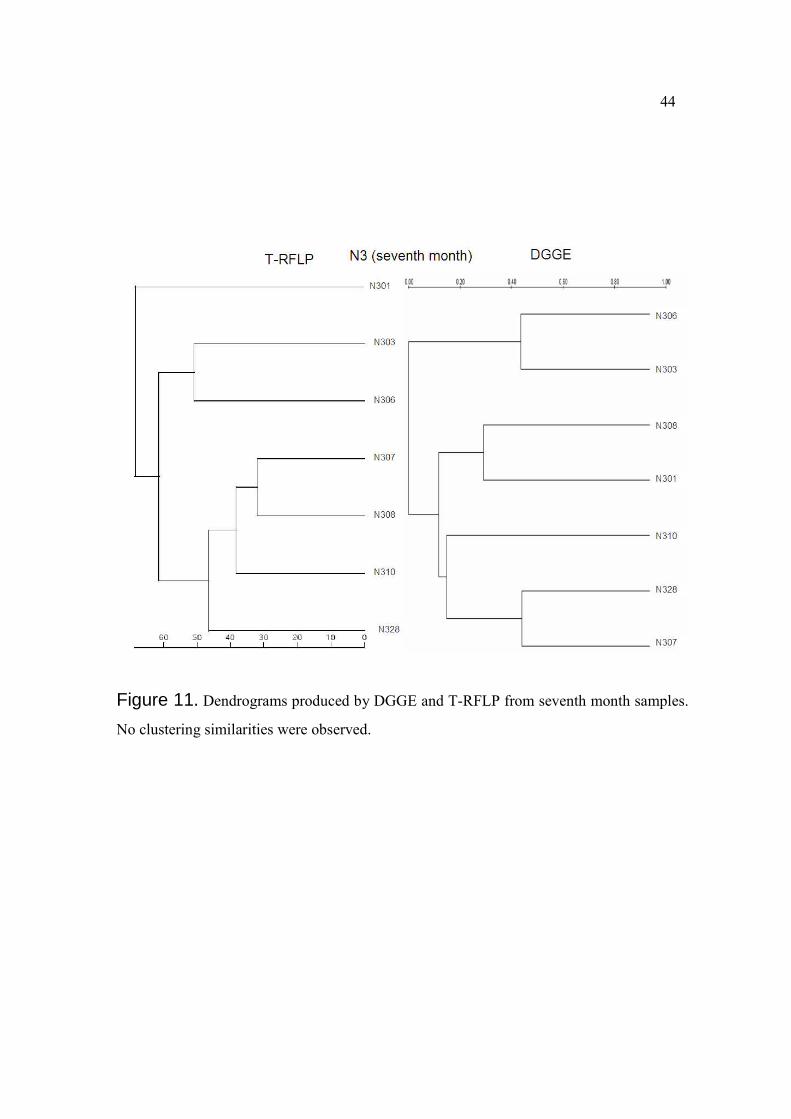
44
Figure 11. Dendrograms produced by DGGE and T-RFLP from seventh month samples.
No clustering similarities were observed.
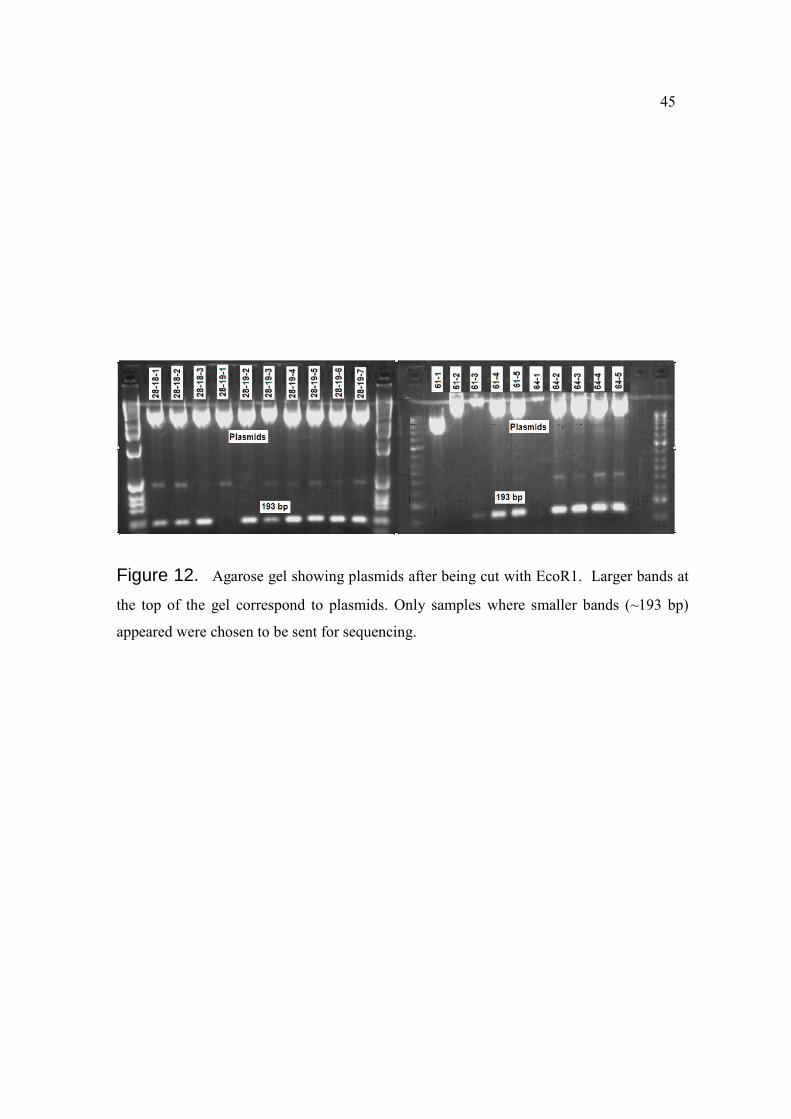
45
Figure 12. Agarose gel showing plasmids after being cut with EcoR1. Larger bands at
the top of the gel correspond to plasmids. Only samples where smaller bands (~193 bp)
appeared were chosen to be sent for sequencing.
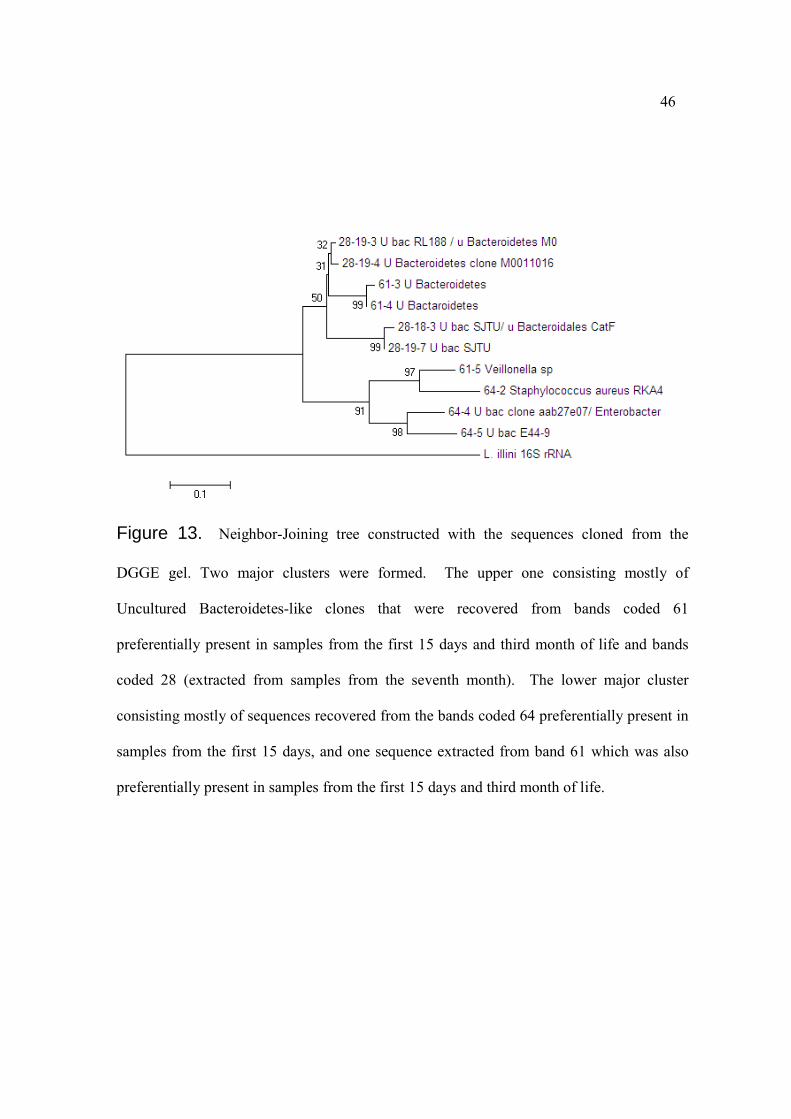
46
Figure 13. Neighbor-Joining tree constructed with the sequences cloned from the
DGGE gel. Two major clusters were formed. The upper one consisting mostly of
Uncultured Bacteroidetes-like clones that were recovered from bands coded 61
preferentially present in samples from the first 15 days and third month of life and bands
coded 28 (extracted from samples from the seventh month). The lower major cluster
consisting mostly of sequences recovered from the bands coded 64 preferentially present in
samples from the first 15 days, and one sequence extracted from band 61 which was also
preferentially present in samples from the first 15 days and third month of life.
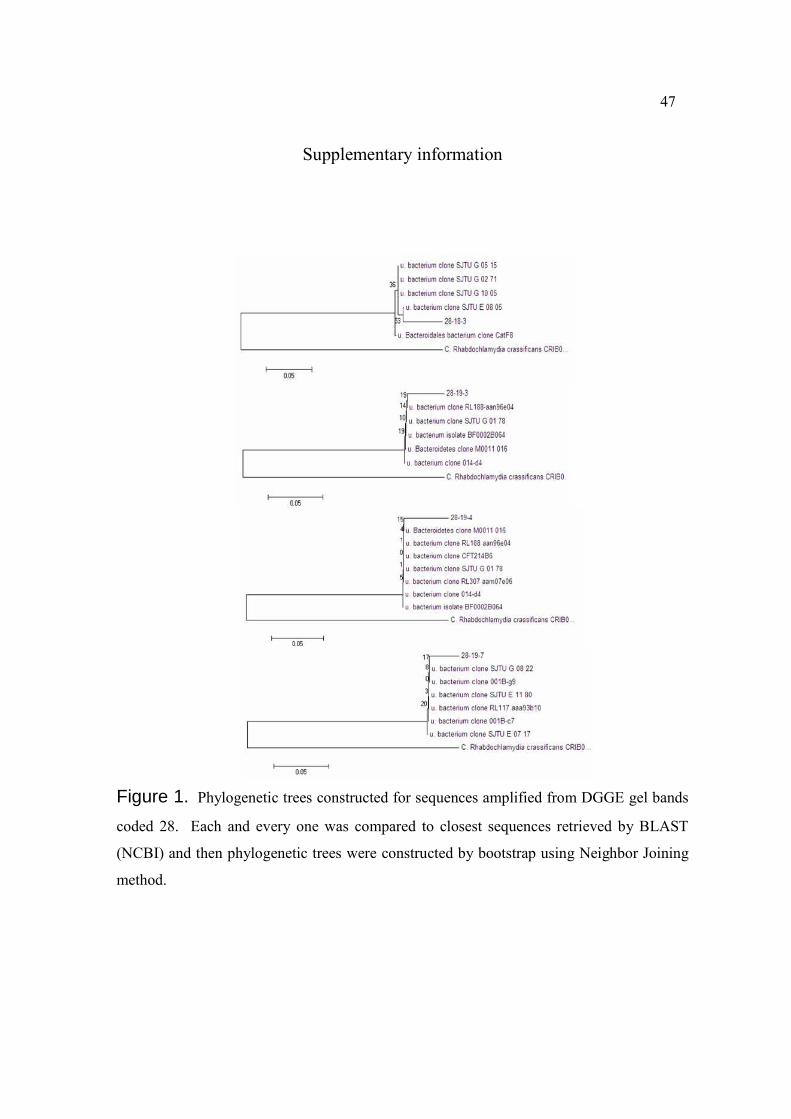
47
Supplementary information
Figure 1. Phylogenetic trees constructed for sequences amplified from DGGE gel bands
coded 28. Each and every one was compared to closest sequences retrieved by BLAST
(NCBI) and then phylogenetic trees were constructed by bootstrap using Neighbor Joining
method.
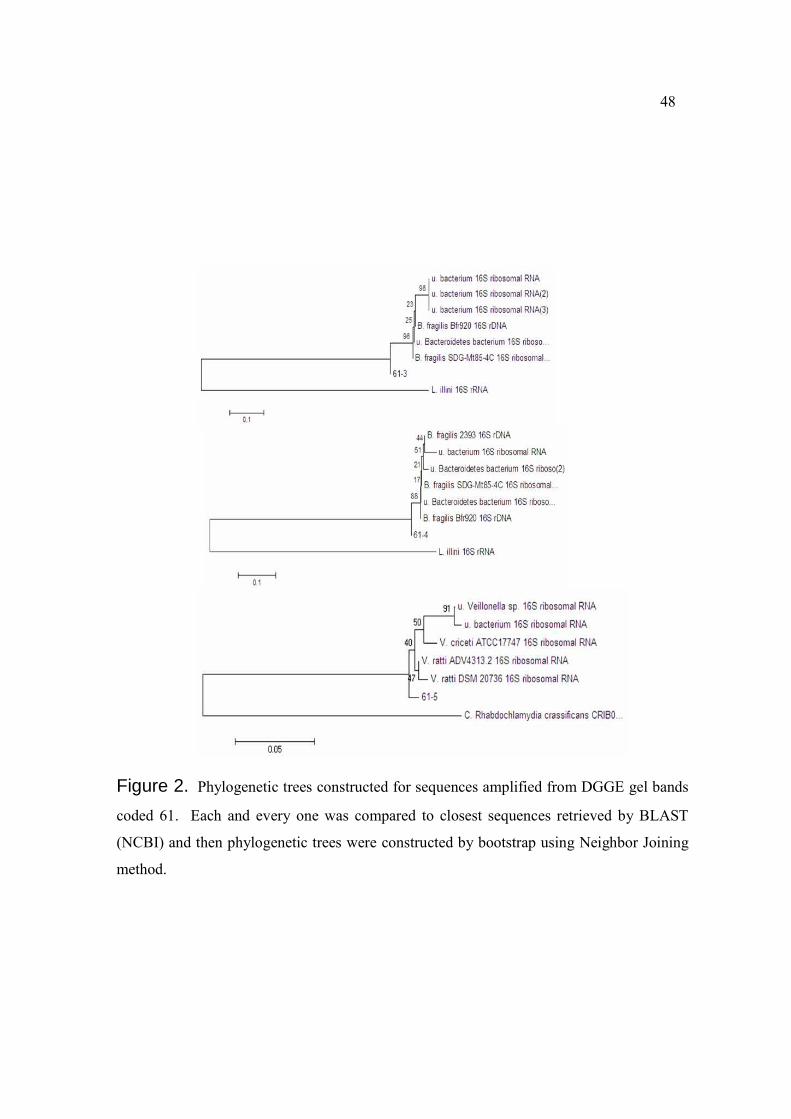
48
Figure 2. Phylogenetic trees constructed for sequences amplified from DGGE gel bands
coded 61. Each and every one was compared to closest sequences retrieved by BLAST
(NCBI) and then phylogenetic trees were constructed by bootstrap using Neighbor Joining
method.

49
Figure 3. Phylogenetic trees constructed for sequences amplified from DGGE gel bands
coded 64. Each and every one was compared to closest sequences retrieved by BLAST
(NCBI) and then phylogenetic trees were constructed by bootstrap using Neighbor Joining
method.