Embed Size (px)
Citation preview
DIFFUSION AND SURFACE REACTIONS OF SINGLET EXCITONS
IN ANTHRACENE
B.J.MULDER
DIFFUSION AND SURFACE REACTIONS OF SINGLET
EXCITONS IN ANTHRACENE
PROEFSCHRIFT
TER VERKRIJGING VAN DE GRAAD VAN DOCTOR IN DE TECHNISCHE WETENSCHAPPEN AAN DE TECHNISCHE HOGESCHOOL TE EINDHOVEN OP GEZAG VAN DE RECTOR MAGNIFICOS, PROF. DR. K. POSTHUMUS, HOOGLERAAR IN DE AFDELING DER SCHEIKUNDIGE TECHNOLOGIE, VOOR EEN COMMISSIE UIT DE SENAAT TE VERDEDIGEN OP VRIJDAG 7 JULI 1967 DES
NAMIDDAGS TE 4 UUR
DOOR
BEREND JAN MULDER CHEMISCH DOCTORANDUS
GEBOREN TE UITHUIZERMEEDEN
DIT PROEFSCHRIFT IS GOEDGEKEURD DOOR DE PROMOTOR PROF. DR. F. VANDER MAESEN
CONTENTS
1. INTRODUCTION . . . . . . . . . . . I
1.1. Exciton diffusion and the fluorescence and photoconduction of anthracene . . . . . . . . I
1.2. Outline of the present work . . 3
2. EXPERIMENTAL PROCEDURES 5
2.1. Preparation of the crystals . . . 5 2.2.1. Purification of starting materials 5 2.1.2. Crystal growing . . . . . . 5
2.2. Measurement of spectral intensities 8 2.2.1. Excitation spectra. . 8 2.2.2. Reflection spectrum . . . . 9 2.2.3. Emission spectrum 10
2.3. Measurements of the photoconduction 11 2.3.1. Experimental arrangement for measuring photocurrents . 11 2.3.2. Preparation of the surface of the crystals . 12 2.3.3. Measurements of photoconduction spectra 12 2.3.4. The absorption spectrum of anthracene 13
3. THE EXCITON-DIFFUSION MODEL . . . . 16
3.1. The diffusion model without reabsorption of :fluorescent light 16 3.1.1. One-dimensional case . . . . . . . . . . . . . . 16 3.1.2. Three-dimensional diffusion of excitons in anisotropic
crystals . . . . . . . . . . . . . . . . . . . . . . 19 3.2. The diffusion model with reabsorption of :fluorescent light . . . 22
3.2.1. The effect of reabsorption on the concentration of the excitons at the illuminated surface . . . . . . . . . . . • 22
3.2.2. The spectral distribution of the fluorescence of anthracene 31 3.2.3. The absorption coefficient for fluorescent light in anthracene 33
4. METHODS FOR MEASURING SURFACE CONCENTRATIONS OF EXCITONS . . . . . . . . . . . . . . . . . . . . . . . 37
4.1. "Sensitized" fluorescence emitted by rhodamine B adsorbed on anthracene . . . . . . . . . . . . . 4.1.1. Experimental procedure . . . . . . . . . 4.1.2. Results and their interpretation . . . . . . 4.1.3. Analysis of the excitation spectrum with
diffusion model . . . . . . . . . . . . . the exciton-
37 37 38
40
4.2. Photoconduction . . . . . . . . . . . . . . . . . . . . . 43 4.2.1. Excitation spectrum of the photocurrent in anthracene with
alkali in the positive-electrode compartment . . . . . . 43 4.2.2. Effects of the composition of the electrolytic electrode on
the shape of the photoconduction spectrum . . . . . . 45 4.2.3. Possible causes of variations in the shape of the photo
conduction spectrum . . . . . . . . . . . . . . . . 47 4.2.4. Validity of the exciton-diffusion model for the photo
current measured with alkali in the positive compartment 48 4.3. Photoconduction in sensitized anthracene crystals . . . . . . 49
4.3.1. Effects of rhodamine B on the photoconduction . . . . 49 4.3.2. Effect of sensitization on the shape of the photoconduction
spectrum . . . . . . . . . . . . . . . . . . . . . . 52 4.4. Quenching of the crystal fluorescence . . . . . . . . . . . . . 53
4.4.1. Excitation spectra of the crystal fluorescence as means of observing the surface quenching of excitons . . . . . 53
4.4.2. Crystal fluorescence and exciton diffusion to the surface . 55 4.4.3. Results . . . . . . . . . . . . . . . . . . . . . . 56
4.5. Conclusions with respect to the validity of the exciton-diffusion model in the analysis of excitation spectra . . . . . . . . . . 59
5. EXCITON DIFFUSION IN VARIOUS CRYSTALS 60
5.1. Exciton diffusion in anthracene; absorption spectrum of anthra-cene for light polarized in the a,c-plane . 60 5.1.1. Effect of mode of preparation of the crystals on the exciton
diffusion length . 60 5.1.2. Anisotropy of exciton diffusion in anthracene 61 5.1.3. Comparison of present and reported data . 64 5.1.4. Absorption spectra of anthracene for light polarized in
the a,c-plane 65 5.2. Exciton diffusion in anthracene doped with tetracene 67
5.2.1. Effects of doping with tetracene on the photoconduction of anthracene . 67
5.2.2. Variation of the exciton diffusion length with the concen-tration of tetracene 70
5.2.3. Evidence of trap-to-trap migration of excitons 73 5.3. Exciton diffusion in anthracene doped with phenazine and acridine 74
5.3.1. Measurements of the sensitized fluorescence 74 5.3.2. Measurements of the photoconduction 76
5.4. Exciton diffusion in crystals of the hydrocarbons pyrene and perylene. . 78
5.4.1. Photoconduction spectrum of pyrene . . . . . . . . . 78 5.4.2. Photoconduction spectrum of perylene . . . . . . . . 79 5.4.3. Discussion on the mobility of excitons in various crystals 83 5.4.4. Absorption coefficient of perylene . . . 84
5.5. Measurements on tetracene and phenanthrene . . 84 5.5.1. Photoconduction spectrum of tetracene 84 5.5.2. Photoconduction spectrum of phenanthrene 87
6. REACTIONS OF EXCITONS AT THE SURFACE OF ANTHRACENE CRYSTALS . . . . . . . . . . . . . . . . . . . . . . 89
6.1. The efficiency of the quenching of the fluorescence at the surface. 89 6.2. Effects of acid on the fluorescence and the photoconduction of
anthracene crystals . . . . . . . . . . . . 92 6.2.1. Quenching of the fluorescence by acids . . . . . . . . 92 6.2.2. Effect of acid on the photoconduction . . . . . . . . . 94 6.2.3. "Primary" photoconduction in anthracene crystals with
acidic electrode solutions . . . . . . . . . . . . . . 94 6.2.4. Chemical formulation of the surface reaction of excitons
in anthracene crystals in contact with concentrated solutions of mineral acids. . . . . . . . . . . . . . . . . . . 96
6.2.5. Generation of holes in acridine-doped crystals with acidic electrodes . . . . . . . . . . . . . . . . . . . . 97
6.3. Effects of oxygen on the fluorescence and the photoconduction 99 6.3.1. Effect of oxygen on the fluorescence . . . . . . . . . 99 6.3.2. Effect of oxygen on the photoconduction . . . . . . 100 6.3.3. Chemical formulation of the surface reaction of excitons
with oxygen . . . . . . . . . . . . . . . . . . . . 101 6.4. Superficial oxidation of anthracene crystals· and its effect on the
photoconduction . . . . . . . . . . . . . . . . . . . . . 103 6.4.1. Formation of oxidation products in the discharge of holes
at the negative electrode . . . . . . . . . . . . . . . 103 6.4.2. Formation of oxidation products at the illuminated positive
electrode . . . . . . . . . . . • . . . . . . . . . . 105 6.4.3. Formation of oxidation products at the positive electrode
in a dark process . . . . . . . . . . . . . . . . . . 106 6.5. Photoconduction in anthracene under illumination through the
negative electrode. . . . . . . . . . . . . . . . . . . . . 107 6.5.1. Photogeneration of holes under illumination through the
negative electrode . . . . . . . . . . . . 107 6.5.2. Photogeneration of negative charge carriers . . . . . . 110
7. GENERATION OF CHARGE CARRIERS AT DEEPER CENTRES. . . . . . . . . . . . . . . . . . . . . . . 113
7.1. Deeper centres associated with concentrated mineral acids. 113 7.2. Deeper centres associated with oxygen molecules and hydrogen
ions. . . . . . . . . . . . . . . . . . . . . . . . . . . 114 7.3. Mechanisms of the generation of holes at deeper centres . . . . 116 7.4. The photoconduction spectrum in the case of an exponential
distribution of deeper centres . . 117
8. CONCLUSIONS AND REMARKS .. 119
8.1. Effect of reabsorption of fluorescent light on the shape of excita-tion spectra . . . . . . . . . . . . . . . . . . . . . 119
8.2. Measurements of exciton diffusion lengths. . . . . . ~ . . 120 8.3. Reactions of excitons at the surface of anthracene crystals. . 124
REFERENCES . . 126
Acknowledgement 128
Summary 129
Samenvatting . 131
-1-
1. INTRODUCTION
1.1. Exciton diffusion and the fluorescence and photoconduction of anthracene
Since the discovery of its photoconductivity in 1910 by Byck and Bork 1 )
and Steubing 2), anthracene has developed into a kind of standard substance
for measurements of electric and photoeffects on organic compounds. Anthracene has a number of attractive properties that can explain why it has been so widely investigated. It can be purified by a variety of techniques and can be grown into large single crystals. It is available in quantity and absorbs light in an easily accessible range of the spectrum, at wavelengths below 4200 A. Other features that were particularly convenient in our investigations are a high absorption coefficient with large variations in quite a small spectral interval and a nearly unit quantum yield of the fluorescence. The molecular structure of anthracene is shown in fig. 1.1. The plane molecules form monoclinic crystals with two molecules per unit cell.
H tf H c c ~
11c#"~c49~c# ~r 11 r ,,, ,1, ij .k,~%'7,,.fc.
H H H
Fig. 1.1. Structural formula of anthracene.
The intermolecular interactions in crystals of anthracene and related compounds are of the Van der Waals type and weak compared to interactions in ionic and covalent crystals. As a result the optical-absorption spectra of the organic crystals are not very different from the spectra of the isolated molecules. Absorption oflight in such crystals can, in theory, give rise to coherent excitation waves, called excitons *), that travel in the crystal until they are scattered at lattice defects or otherwise. The migration of excitons in actual crystals can be adequately described, however, as a diffusion process in which the mean free path of the excitons is of the order of the lattice constant 4 ). This means that the excitons rapidly become "self-trapped" and migrate in a process of diffusion, jumping from site to site in a random fashion by resonance transfer. After each jump there is time for the lattice to relax around the "localized" exciton. The exciton is ultimately annihilated by emission of a quantum of fluorescent light or by some other process.
*) These "Frenkel excitons" are closely related to the lowest excited states of th"' ,~v late.:i molecules. As such they are distinct from Wannier excitons (electron-hole pairs) in inorganic semiconductors. A general discussion on excitons has been given by Knox 3).
-2-
An early application of the concept of exciton diffusion was the explanation given by Bowen 5
) of the green "sensitized" fluorescence that is observed when very small amounts of tetracene are incorporated in anthracene crystals, that emit a blue fluorescence when pure. The light is absorbed by anthracene but the excitation energy diffuses as excitons in the crystal until it is captured and emitted by tetracene molecules. Diffusion of excitons through thin sublimed layers of anthracene was demonstrated by Simpson 6
) by illuminating one side and observing the green emission from a detecting layer of anthracene doped with tetracene evaporated onto the non-illuminated side.
Annihilation of excitons at the crystal surface can be made responsible for the spectral structure of the excitation spectrum of the fluorescence of anthracene. Excitons ending their life in the interior of anthracene crystals give rise with high probability to a quantum of fluorescent light. Excitons diffusing to the surface can be annihilated non-radiatively (quenched) by interactions with impurities at the surface 7
). The resulting decrease in the fluorescence intensity will be the greater, the closer to the surface the excitons are generated, that is, the larger the absorption coefficient for the exciting light. As a resultthe excitation spectrum of the crystal fluorescence is "antibatic" with the absorption spectrum (maxima in one spectrum at wavenumbers where minima occur in the other). From an analysis of the excitation spectrum of the fluorescence of anthracene crystals the mean diffusion length of the excitons was calculated to be 1000 A 8).
The importance of reactions of excitons at the crystal surface for the photoconduction of anthracene was first stated by Lyons 9). He worked with a surface type of cell in which the two electrodes are applied on one side of the crystal and in which the light is incident on the surface between the electrodes. The excitation spectrum of the photocurrent was symbatic with the absorption spectrum (maxima and minima at the same wavenumber in either spectrum). This can be explained in terms of a generation of charge carriers in reactions of excitons at the surface of the crystal. Eremenko and Medvedev 10) found that the excitation spectra of the fluorescence and the photocurrent in anthracene crystals in a surface cell can be described in terms of the diffusion of excitons to the surface with one and the same value (2000 A) for the mean diffusion length of the excitons.
Anthracene crystals are photoconductive also when sandwiched between two transparent electrodes. In this arrangement the charge carriers pass through the bulk of the crystals 11). Kallmann and Pope 12) measured the photoconduction of anthracene crystals in a sandwich cell with aqueous electrodes. From the dependence of the photocurrent on the composition of the electrode and on the electric polarization of the cell it was concluded that the charge carriers are mainly holes generated at the positive electrode. Steketee and DeJonge 13
)
found that the excitation spectrum of the photocurrent measured with electrolytic electrodes is symbatic with the absorption spectrum. They calculated an
3
exciton diffusion length of 700-2000 A. In earlier measurements of the photoconduction of anthracene in a sandwich cell with semitransparent metal electrodes it had been found that the photoconduction spectrum was antibatic with the absorption spectrum 14). It was concluded from these results that generation of charge carriers took place in the bulk of the crystal and was followed by a partial recombination. It was recently found, however, that with semitransparent gold electrodes evaporated onto well-purified surfaces the photoconduction spectrum closely resembles the absorption spectrum of anthracene. Clearly, in these experiments with metal electrodes, as also with aqueous electrodes, the charge carriers (positive holes) are generated at the surface of the crystal 15
).
The foregoing shows that in the photoconduction of anthracene the charge carriers are generated, not as in many inorganic semiconductors by the direct photoexcitation of an electron from the valence band to the conduction band at the site where the photon is absorbed, but rather indirectly by a reaction of excitons at the surface of the crystal. This holds equally for the photoconduction of anthracene in surface and sandwich cells.
Investigations of the transport of charge carriers through anthracene were initiated by Kepler 16), who measured the transit time of the charge carriers by admitting a short flash of strongly absorbed light to a crystal held between the transparent plates of a capacitor. The pulse of the displacement current following the flash gives information on the transit time and hence on the mobility of the carriers. Kepler found mobilities for both electrons and holes of the order of 1 cm2 /V s. In order to interpret these experiments LeBlanc 17)
introduced a Bloch-band model for anthracene. For the mobility of electrons in anthracene the predictions of this model are not so good 18
). The motion of the carriers has been described also as hopping from site to site.
Although the generation of charge carriers at the surface is by far the most important cause for the photoconductivity of anthracene, charge carriers can be generated also, with a low efficiency, in the bulk of the crystals. Carriers can be generated in the bulk at very high intensities of the light in a process involving two excitons 19) and also by photons with an energy greater than 4 eV 20
). Finally, weak photocurrents have been observed which must be attributed to a detrapping of carriers generated at the surface and trapped in the bulk of the crystal. Holes in anthracene can be detrapped by singlet excitons (generated with ultraviolet light), triplet excitons (generated with visible light 21 •22 •23)) or by direct absorption of visible light by the carriers 15).
Reviews of the photoconduction of anthracene have been given by LeBlanc 24)
Kommandeur 25), Kepler 26) and Inokuchi and Akamatu 27).
1.2. Outline of the present work
In this thesis a study is made of those aspects of the photoconduction and
-4-
the fluorescence of aromatic hydrocarbons that can be interpreted in terms of the diffusion of singlet excitons and their annihilation at the crystal surface. It is investigated to what extent and under what conditions the simple diffusion model is valid. The nature of the surface reactions is studied.
The experimental procedures are described in chapter 2. In chapter 3 the diffusion model for surface reactions of excitons is discussed.
A calculation is made of the contribution from the reabsorption of fluorescent light to the concentration of excitons at the illuminated surface.
Chapter 4 gives an analysis, in terms of the exciton-diffusion model, of excitation spectra for three types of effects observed on anthracene. These are: (a) excitation spectra of the "sensitized" fluorescence emitted by very small
amounts of the dye rhodamine B adsorbed from aqueous solutions on the surface of the crystal; this is a novel and simple method giving reliable information on the exciton diffusion length;
{b) excitation spectra of the photoconduction of crystals in a sandwich cell with aqueous electrodes;
(c) excitation spectra of the fluorescence of crystals in contact with aqueous solutions of various compositions.
The values of the exciton diffusion length obtained by the three methods are compared.
In chapter 5 a study is made of the diffusion of excitons in various crystallographic directions in anthracene and of the exciton diffusion in doped anthracene crystals and in crystals of some other aromatic hydrocarbons.
Chapter 6 is concerned with the nature of the surface reactions of excitons. The reactions are investigated by varying the composition of the aqueous solution in contact with anthracene crystals.
Observed deviations from the exciton-diffusion model are considered in chapter 7, in the light of the reaction mechanisms discussed in chapter 6.
In chapter 8 some conclusions and remarks are formulated. A summary is given at the end of this thesis.
-5-
2. EXPERIMENTAL PROCEDURES
2.1. Preparation of the crystals
2.1.1. Purification of starting materials
The aromatic hydrocarbons studied in this work were purified by chromatography on a column of alumina in the dark in an atmosphere of argon. In the case of pyrene silica was used instead of alumina. With anthracene, pyrene and phenanthrene, the solvent was hexane, with perylene and tetracene benzene was used. The solvent was continually recycled by distillation from the receiving vessel. The rate of heating was controlled by a photocell: when the level of the solvent above the column rose above the level of the photocell a narrow beam · of light was refracted away from the photocell by the solvent acting as a cylindrical lens.
The chromatography eliminates only impurities whose retention coefficient is large compared with that of the substance to be purified. These are retained as coloured rings in the upper part of the column.
Since we studied the effect of exciton diffusion on the photoconduction and the fluorescence, the most undesirable type of impurity is that which interferes with the diffusion of excitons in the crystals. Tetracene occurring in anthracene and anthracene in phenanthrene are such impurities.
The concentration of tetracene in anthracene was reduced by "steam" distillation with glycol 28), prior to the chromatography. This treatment reduced the concentration of tetracene in commercial "pure" anthracene to well below w- 6 M/M tetracene. The anthracene in phenanthrene was destructed by a treatment with chromic oxide in boiling acetic acid 29
) followed by repeated sublimation and distillation.
2.1.2. Crystal growing
Anthracene Nearly all experiments with anthracene were carried out on thin, plate-shaped
crystals with the a,b-plane developed. They were grown from solutions of 2 g of anthracene in 50 ml of dichloroethane heated to boiling point, and placed in a slowly cooling furnace in the dark after a small amount of hexane had been carefully poured on top of the dichloroethane 30
). Some crystals were grown from solutions in benzene or toluene. Crystals were obtained also by sublimation in an evacuated tube and from the melt.
It was found that the most fruitful method of growing crystals was from solutions in dichloroethane, especially when 10% of trichloroethane was added. The reason seems to be the specific weight of the solutions, which is close to
6
that of the growing crystals, so that the latter remain suspended in the solution during growth. The surface area of the crystals was not infrequently more than l 0 cm2 • The thickness of the crystals ranged from 20 to 200 [Lm but was generally close to 50 [LID. The amount of solvent in the crystals was estimated by an X-ray-fluorescence analysis *) of chlorine, which indicated a concentration of w- 3 M/M dichloroethane. The actual content may well be lower, however, since the analysis required a large amount of crystalline material including many small crystals with irregular rims. Such crystals may contain occluded solvent even though they were rinsed with hexane prior to the analysis.
Doped anthracene crystals Crystals of anthracene doped with tetracene, acridine and phenazine were
grown from solutions in dichloroethane. Well-developed crystals containing w-z M/M acridine (S.I0- 4 M/M phenazine) were obtained from solutions containing lS.I0- 2 M/M acridine (phenazine). The highest proportion of tetracene that could be incorporated in anthracene was about 10- 3 M/M in crystals grown from solutions saturated with tetracene.
The content of the dopants in the crystals was determined spectrophotometrically after dissolution of the crystals in acetone. To determine tetracene the difference was measured between the optical densities at the absorption peak at 4750 A and at a wavelength just outside the absorption region of tetracene. To determine phenazine and acridine a few drops of concentrated HCl were added to the solutions in acetone. This gives rise to a yellow proton adduct permitting measurement of its optical absorption. The lowest concentrations of phenazine in anthracene crystals used in our experiments could not be measured in this manner. In this case the concentrations were estimated from the known concentration in more heavily doped crystals: this was possible since at low concentrations the concentration of the dopant (phenazine or tetracene) in the crystals is proportional to the concentration in the solutions from which the crystals were grown.
Very small amounts of tetracene present in our anthracene were detected by recording the emission spectrum of crystals grown from the anthracene with added acridine (l0- 2 M/M in the crystals). Acridine selectively quenches the blue fluorescence of anthracene but leaves the green "impurity" fluorescence of tetracene in anthracene practically intact. This makes it possible to detect tetracene in anthracene in very small amounts. Without acridine the weak green emission from very small amounts of tetracene is masked by the tail of the blue anthracene emission. The concentration of tetracene in our purified anthracene was higher than in commercial «scintillation-grade" anthracene but too low
*) The analysis was carried out by the analytical department of this laboratory (Dr. N. W. H. Addink).
-7-
(probably lower than 0·5.10-6 M/M) to haveanyeffecton the photoconductive properties of interest in this work.
Perylene Crystals of perylene were grown from solutions in benzene. Since perylene
is susceptible to oxidation 31 •32) even in the dark and especially in solutions, the crystallization experiments were done in sealed glass tubes. Solid perylene was transferred directly from the chromatographic apparatus into the tubes, together with a predetermined amount of de-aerated benzene. The benzene in the tube was scrubbed with argon and then frozen in liquid nitrogen, after which the tubes were evacuated to a pressure of about 1 em Hg and sealed off. After this the perylene could be dissolved and crystallized a number of times until a 'Crop of sizable crystals was obtained. The method of growing crystals from solutions in sealed tubes offers the additional advantage that the initial concentration of the solute can be made higher, since the tubes can be heated far above the boiling point of the solvent. Two modifications of perylene were obtained, frequently in one and the same crystallization experiment. They were distinguished by the shape of the crystals which was nearly rectangular or square for one modification and strongly parallelogrammatic with an acute angle of almost 60° for the other. The two modifications had the same golden-yellow colour but different fluorescence tints (orange-red and greenish yellow). The rectangular crystals are of the well-known dimeric modification (a-perylene). The parallelogrammatic crystals probably belong to the ,8-modification recently described by Tanaka 33). The identity of the ,8-crystals is not evident from their spectral characteristics (sec. 5.4.2), but is probable from the determination of the lattice constants and the transition temperature for the transition to the stable modification *).
Tetracene, pyrene and phenanthrene Thin plate-shaped crystals of tetracene and pyrene were obtained by slow
sublimation in evacuated sealed tubes. Since tetracene is readily oxidized by air, it was transferred directly from the chromatographic apparatus into the sublimation tubes. The size of the tetracene crystals was quite small and rarely
*) The lattice constants of the two types of crystals were determined by Dr Braun of this laboratory. The following values were obtained for a-perylene (data between brackets from ref. 34: a = 11·28 ± 0·05 (11·35); b = 10·82 0·05 (10·87); c 10·31 ± 0·01 (10·31). The P-crystals had the following lattice constants between brackets from Tanaka): a= 10·62 ± 0·05 (11·27 ± 0·03); b = H6:!: 0·02 t5·88 ± 0·02); c 9·70 ± 0·01 (9·65 ± 0·03). There is good agreement for the b-axis and the c-axis. However, the lattice constant along the a-axis of the present crystals differs from the corresponding value reported for P-perylene by an amount well outside the experimental error. P-Perylene is reported to be metastable with a transition point at about 140 °C. The same holds for the present crystals as was established by heating and observing thechangeinthecolouroftheir emission under ultraviolet light (from green-yellow to orange-red). The Debye pattern the converted metastable crystals was identical with that of a-perylene.
8
exceeded 4 mm2 • The sublimations were carried out at 100 oc in the case of pyrene and at 200 oc in the case of tetracene. Crystals of phenanthrene were grown from solutions in methanol.
2.2. Measurement of spectral intensities
2.2.1. Excitation spectra
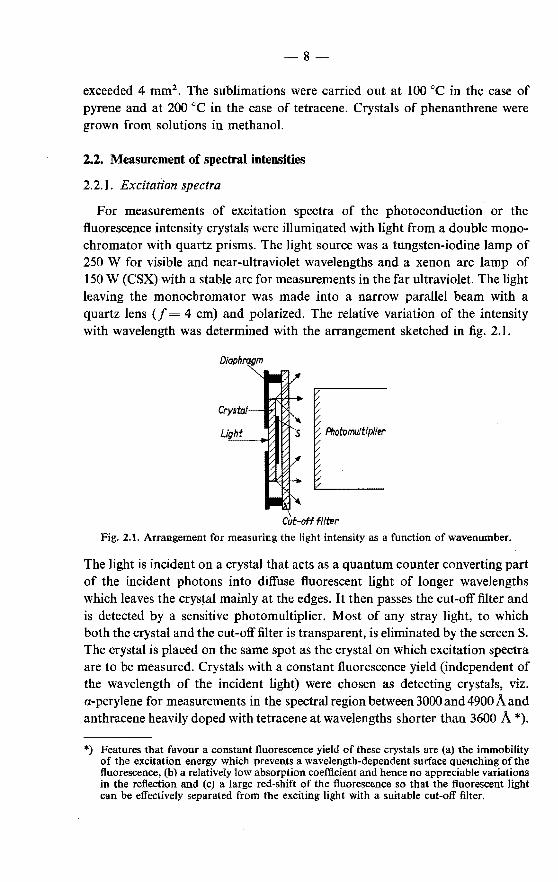
For measurements of excitation spectra of the photoconduction or the fluorescence intensity crystals were illuminated with light from a double monochromator with quartz prisms. The light source was a tungsten-iodine lamp of 250 W for visible and near-ultraviolet wavelengths and a xenon arc lamp of 150 W ( CSX) with a stable arc for measurements in the far ultraviolet. The light leaving the monochromator was made into a narrow parallel beam with a quartz lens (/ = 4 em) and polarized. The relative variation of the intensity with wavelength was determined with the arrangement sketched in fig. 2.1.
Diaphragm
Crystal
Light Photomultiplier
Cut-off filter
Fig. 2.1. Arrangement for measuring the light intensity as a function of wavenumber.
The light is incident on a crystal that acts as a quantum counter converting part of the incident photons into diffuse fluorescent light of longer wavelengths which leaves the crystal mainly at the edges. It then passes the cut-off filter and is detected by a sensitive photomultiplier. Most of any stray light, to which both the crystal and the cut-off filter is transparent, is eliminated by the screenS. The crystal is placed on the same spot as the crystal on which excitation spectra are to be measured. Crystals with a constant fluorescence yield (independent of the wavelength of the incident light) were chosen as detecting crystals, viz. a-perylene for measurements in the spectral region between 3000 and 4900 A and anthracene heavily doped with tetracene at wavelengths shorter than 3600 A *).
*) Features that favour a constant fluorescence yield of these crystals are (a) the immobility of the excitation energy which prevents a wavelength-dependent surface quenching of the fluorescence, (b) a relatively low absorption coefficient and hence no appreciable variations in the reflection and (c) a large red-shift of the fluorescence so that the fluorescent light can be effectively separated from the exciting light with a suitable cut-off filter.
-9-
The constancy of the quantum yield was ascertained by comparing the response of the combination of the crystal plus photomultiplier with that of calibrated photomultipliers and with the emission of sodium salicylate *).
At wavelengths longer than 4900 A a calibrated photomultiplier (Philips 150 CVP) was used to determine the variation of the output of the monochromator with wavelength.
2.2.2. Reflection spectrum
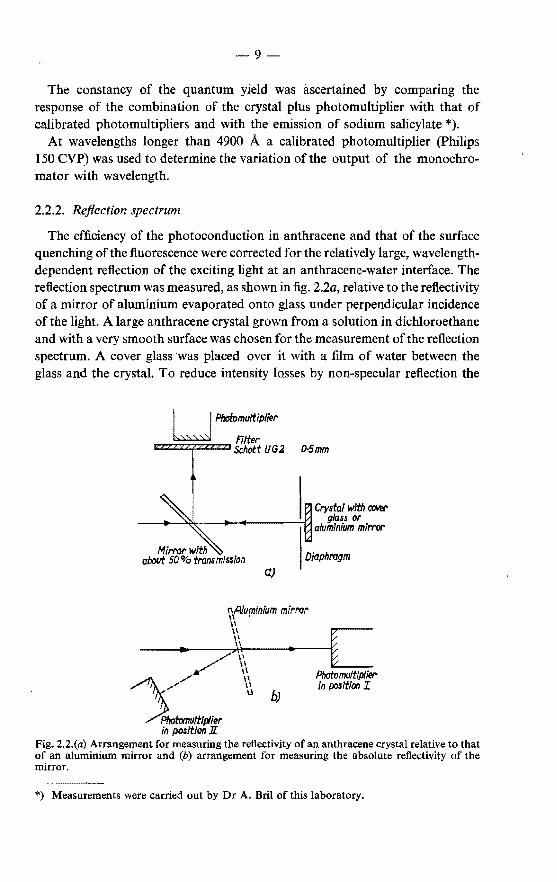
The efficiency of the photoconduction in anthracene and that of the surface quenching of the fluorescence were corrected for the relatively large, wavelengthdependent reflection of the exciting light at an anthracene-water interface. The reflection spectrum was measured, as shown in fig. 2.2a, relative to the reflectivity of a mirror of aluminium evaporated onto glass under perpendicular incidence of the light. A large anthracene crystal grown from a solution in dichloroethane and with a very smooth surface was chosen for the measurement of the reflection spectrum. A cover glass was placed over it with a film of water between the glass and the crystal. To reduce intensity losses by non-specular reflection the
LJ. Photomultiplier
filter O.Smm
YSchottUG2
~ Crystal with CO\ot\"'
glass or _ __,_.::.;~~,----lit~•~ -----, aluminium mirror
Mirror wit~ about 50% tronsmlssion Diaphragm
a)
r.Aiuminium mirror \I • \I
-----~·~--~~;~~~--··--~[ __ __ / \\ Phatomultlplier
~,."" \\ in position I
?Photomultiplier u b) in position ][
Fig. 2.2.(a) Arrangement for measuring the reflectivity of an anthracene crystal relative to that of an aluminium mirror and (b) arrangement for measuring the absolute reflectivity of the mirror.
*) Measurements were carried out by Dr A. Bril of this laboratory.
-10
optical path length between the crystal and the detecting photomultiplier was kept small (about 5 em in fig. 2.2a). A filter was used to reduce the amount of fluorescent light from the crystal reaching the photomultiplier. A diaphragm served the same purpose. The absolute reflectivity of the crystal was determined from its reflectivity relative to that of the mirror and the absolute reflectivity of the mirror. The latter was measured in the arrangement sketched in fig. 2.2b. In position II of the photomultiplier in fig. 2.2b the angle of incidence of the light on the mirror was about 5°.
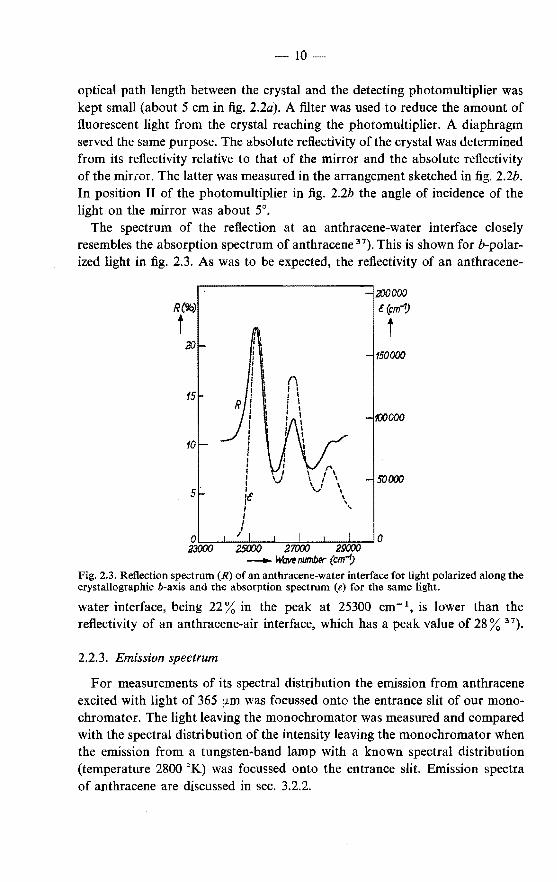
The spectrum of the reflection at an anthracene-water interface closely resembles the absorption spectrum of anthracene 37
). This is shown for b-polarized light in fig. 2.3. As was to be expected, the reflectivity of an anthracene-
Fig. 2.3. Reflection spectrum (R) of an anthracene-water interface for light polarized along the crystallographic b-axis and the absorption spectrum (e) for the same light.
water interface, being 22% in the peak at 25300 em-\ is lower than the reflectivity of an anthracene-air interface, which has a peak value of 28% 37).
2.2.3. Emission spectrum
For measurements of its spectral distribution the emission from anthracene excited with light of 365 !l-ID was focussed onto the entrance slit of our monochromator. The light leaving the monochromator was measured and compared with the spectral distribution of the intensity leaving the monochromator when the emission from a tungsten-band lamp with a known spectral distribution (temperature 2800 °K) was focussed onto the entrance slit. Emission spectra of anthracene are discussed in sec. 3.2.2.
-11
2.3. Measurements of the photoconduction
2.3.1. Experimental arrangement for measuring photocurrents
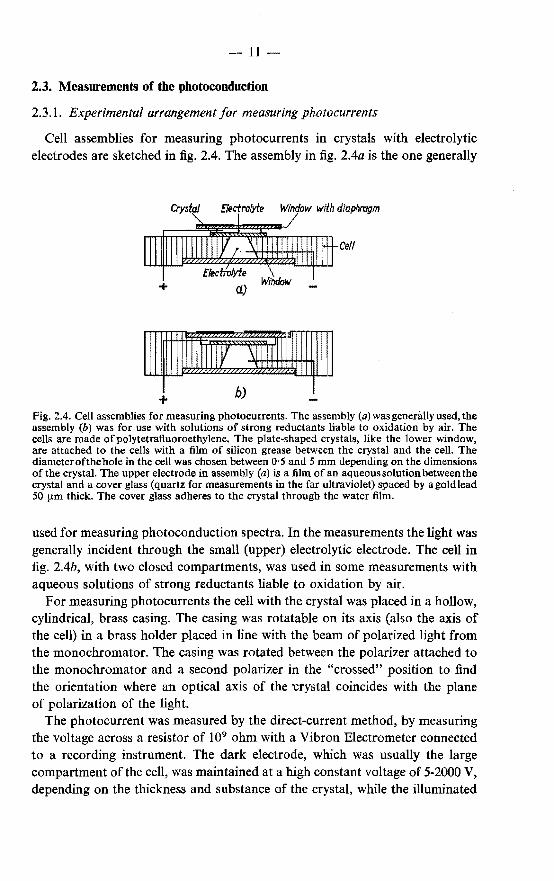
Cell assemblies for measuring photocurrents in crystals with electrolytic electrodes are sketched in fig. 2.4. The assembly in fig. 2.4a is the one generally
EJectrofyte Window with diaphragm
Cell
+
+ Fig. 2.4. Cell assemblies for measuring photocurrents. The assembly (a) was generally used, the assembly (b) was for use with solutions of strong reductants liable to oxidation by air. The cells are made ofpolytetrafluoroethylene. The plate-shaped crystals, like the lower window, are attached to the cells with a film of silicon grease between the crystal and the cell. The diameterofthehole in the cell was chosen between 0·5 and 5 mm depending on the dimensions of the crystal. The upper electrode in assembly (a) is a film of an aqueous solution between the crystal and a cover glass (quartz for measurements in the far ultraviolet) spaced by a gold lead 50 !LID thick. The cover glass adheres to the crystal through the water film.
used for measuring photoconduction spectra. In the measurements the light was generally incident through the small (upper) electrolytic electrode. The cell in fig. 2.4b, with two closed compartments, was used in some measurements with aqueous solutions of strong reductants liable to oxidation by air.
For measuring photocurrents the cell with the crystal was placed in a hollow, cylindrical, brass casing. The casing was rotatable on its axis (also the axis of the cell) in a brass holder placed in line with the beam of polarized light from the monochromator. The casing was rotated between the polarizer attached to the monochromator and a second polarizer in the "crossed" position to find the orientation where an optical axis of the 'Crystal coincides with the plane of polarization of the light.
The photocurrent was measured by the direct-current method, by measuring the voltage across a resistor of 109 ohm with a Vibron Electrometer connected to a recording instrument. The dark electrode, which was usually the large compartment of the cell, was maintained at a high constant voltage of 5-2000 V, depending on the thickness and substance of the crystal, while the illuminated
-12
electrode was at a low potential (10- 3-1 V) determined by the total current through the resistor. In most measurements the dark current was a small fraction of the photocurrent. When the dark current was appreciable, for instance when the positive-electrode compartment contained a concentrated solution of sulphuric acid, the resulting constant potential across the resistor was compensated by an adjustable bias from a battery source.
It was ascertained that the presence or absence of an earthed guard ring round the high-voltage electrode made no difference to the photocurrent, so that guard rings were dispensed with.
2.3.2. Preparation of the surface of the crystals
Crystals of many aromatic hydrocarbons are subject to superficial oxidation by air, as we saw already for perylene in sec. 2.1.2. Such oxidation products have to be removed from the illuminated surface of the crystals in order to make the measurements of the photocondilction and the fluorescence reproducible. To this end the surface was flushed with a suitable solvent (benzene, acetone or alcohol) followed by rinsing with an aqueous solution of alkali, immediately before the electrode solution was applied. An illustration of the importance of rinsing is the almost complete disappearance after rinsing of photoconduction in perylene under illumination with light oflong wavelengths outside the absorption region of the crystal 35).
2.3.3. Measurements of photoconduction spectra
In the chapters 4 and 5 we shall be concerned with photoconduction spectra. These represent the photocurrent as a function of the wavenumber of the light for a constant number of photons passing the illuminated surface of the crystal per second. The spectra can be given in absolute units in such a way that they represent the spectral variation of the efficiency of the photoconduction process, which is the number of charge carriers transported in the outer circuit per photon absorbed in the crystal. To calibrate the spectra it is sufficient to determine the efficiency of the photoconduction process at one wavenumber only. The determinations were made with light of 365 mfL emitted by a mercury lamp with additional filters, and illuminating the crystal through a piece of a metal film with a hole slightly smaller than the hole in the cell on which the crystal was mounted. The film with the hole was placed directly on the upper window of the cell assembly shown in fig. 2.4. The intensity of the emission from the mercury lamp was measured actinometrically with ferric oxalate 36). It was also measured with a photomultiplier calibrated by the National Physics Laboratory. The intensity measured with the calibrated photomultiplier was 9% lower than the intensity determined by actinometry.
The intensity, of the light from the monochromator varies with the wave-
~.13~.
number and hence the shape of the photoconduction spectrum is defined only when the photocurrent is proportional to the intensity of the light. This condition was always fulfilled in our experiments.
For a satisfactory measurement it is desirable that the response of the photocurrent to sudden changes in the intensity shall be prompt and "rectangular". This condition was fulfilled in measurements on crystals grown from purified materials with an alkaline aqueous solution in the illuminated positive-electrode compartment, provided the voltage was sufficiently high and provided also that the intensity of the light was riot higher than 1012-1013 photonsfcm2 s. With most crystals (including anthracene) a prompt response was observed also when the electrode solution was not alkaline but neutral or acidic. The use of concentrated acids led sometimes to a somewhat slow response, though still proportional to the intensity. A slow response was often observed when certain impurities were built into the crystals. Examples are anthracene crystals doped with acridine when using a non-alkaline electrode solution, anthracene doped with tetracene at low voltages and perylene crystals grown from material not subjected to chromatography. The slow response seems to be connected with the slow build-up or decay of a space charge of carriers trapped at the impurity molecules. The trapped charges will diminish the effective field strength at the electrode and hence the rate of the injection of charge carriers which takes place at the electrode. A slow response could frequently be improved by measures aiming at the detrapping of charge carriers in the crystal and at small relative
'variations of the space charge under illumination. These measures include an increase in the voltage, a decrease in the intensity of the light from the monochromator and illumination of the crystal with light from a second source of constant intensity.
It can be assumed that in our measurements of the photoconduction in anthracene the photocurrent was not directly limited by space charges in the crystal. This follows from the small current densities in these measurements. These were always less than IQ- 9 A/cm2 , which is four orders of magnitude lower than the space-charge-limited dark currents that were drawn through the same crystals with the same voltage when the positive compartment contained a saturated solution of eerie sulphate in dilute sulphuric acid (current densities round w- 5 A/cm2 ). In the measurements of the photocurrent the dark-current density was generally IQ- 12-10- 11 Afcm2
• It was higher with concentrated sulphuric acid in the positive compartment, but even here it did not exceed 5.10- 9 A/cm2 •
2.3.4. The absorption spectrum of anthracene
The absorption spectrum of anthracene has been measured by various authors. The difficulties of the measurement are considerable on account of the
-14-
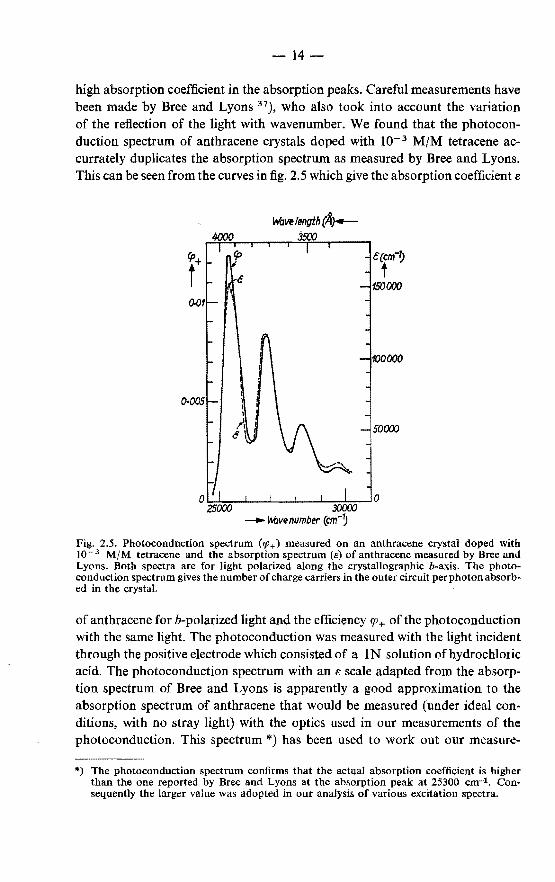
high absorption coefficient in the absorption peaks. Careful measurements have been made by Bree and Lyons 37), who also took into account the variation of the reflection of the light with wavenumber. We found that the photoconduction spectrum of anthracene crystals doped with 10- 3 M/M tetracene accurrately duplicates the absorption spectrum as measured by Bree and Lyons. This can be seen from the curves in fig. 2. 5 which give the absorption coefficient e
tp+
t
Fig. 2.5. Photoconduction spectrum (1p+) measured on an anthracene crystal doped with 10- 3 M/M tetracene and the absorption spectrum (s) of anthracene measured by Bree and Lyons. Both spectra are for light polarized along the crystallographic b-axis. The photoconduction spectrum gives the number of charge carriers in the outer circuit per photon absorbed in the crystal.
of anthracene forb-polarized light and the efficiency CfJ+ of the photoconduction with the same light. The photoconduction was measured with the light incident through the positive electrode which consisted of a lN solution of hydrochloric acid. The photoconduction spectrum with an e scale adapted from the absorption spectrum of Bree and Lyons is apparently a good approximation to the absorption spectrum of anthracene that would be measured (under ideal conditions, with no stray light) with the optics used in our measurements of the photoconduction. This spectrum *) has been used to work out our measure-
*) The photoconduction spectrum confirms that the actual absorption coefficient is higher than the one reported by Bree and Lyons at the absorption peak at 25300 cm-1. Consequently the larger value was adopted in our analysis of various excitation spectra.
-15
ments of the photoconduction and the fluorescence of anthracene crystals. The exciton-diffusion theory discussed in chapter 3 predicts that the inverse
photocurrent is a linear function of the inverse absorption coefficient of the exciting light. To test. this relationship measurements of thephotoconduction were made at the turning points of the absorption spectrum, which are also the turning points of the photoconduction spectrum. At the turning points the effect on the photoconduction of small errors in the setting of the monochromator is a minimum.
16
3. THE EXCITON-DIFFUSION MODEL
As mentioned in the introduction many phenomena observable on organic crystals are associated with the annihilation of excitons at the surface of the crystal. In the present chapter we shaH discuss the mathematical model for the diffusion of excitons and their annihilation at the illuminated surface of the crystal. This will be done first for the simple case where excitation energy is transported only as excitons, neglecting transport of excitation energy by emission and reabsorption of fluorescent light. The role of reabsorption of fluorescent light will be considered in a later section.
3.1. The ditfusion model without reabsorption of fluorescent light
3.1.1. One-dimensional case
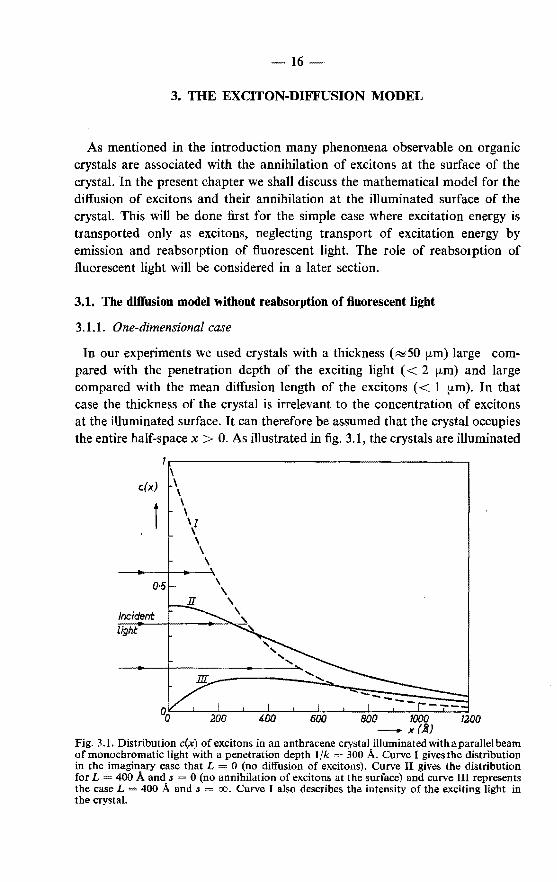
In our experiments we used crystals with a thickness (R::050 !km) large compared with the penetration depth of the exciting light ( < 2 !kiD) and large compared with the mean diffusion length of the excitons ( < 1 p.m). In that case the thickness of the crystal is irrelevant to the concentration of excitons at the illuminated surface. It can therefore be assumed that the crystal occupies the entire half-space x > 0. As illustrated in fig. 3.1, the crystals are illuminated
c(x)
i
light
1.------------------------------------. \ \ \ \ \ \] \ \ \ \
Fig. 3.1. Distribution c(x) of excitons in an anthracene crystal illuminated with a parallel beam of monochromatic light with a penetration depth 1/k 300 A. Curve I givesthe distribution in the imaginary case that L = 0 (no diffusion of excitons). Curve II gives the distribution for L 400 A and s 0 (no annihilation of excitons at the surface) and curve III represents the case L = 400 A and s = oo. Curve I also describes the intensity of the exciting light in the crystal.
-17-
with a parallel beam of light perpendicular to the plane x 0, so that under stationary conditions of illumination the distribution of the excitons in the crystal is a function c(x) of x only. Since all observed effects were proportional to the light intensity, it can be assumed that there is no mutual interaction of the excitons. In that case the concentration of excitons at a given plane is determined by (a) the generation of excitons by absorption of incident light at a rate of
l 0k exp (-kx), (b) the increase in the concentration of the excitons by diffusion at a rate of
De" and (c) the annihilation of excitons at a rate of Pe, where / 0 is the flux of unreflected photons entering the crystal, k the exponential absorption coefficient for the incident monochromatic light, D the diffusion coefficient associated with the transport of excitons in the x-direction and P the probability of (radiative or non-radiative) annihilation. In the stationary state the change in the number of excitons in time is zero. This leads to
De" Pe + k/0 exp (-kx) = 0. (3.1)
The following boundary conditions are imposed. At a large distance from the surface the concentration of the excitons is zero:
e(x) = 0 for x = oo. (3.2)
At the illuminated surface the excitons are annihilated by surface-determined processes at a rate proportional to the concentration of the excitons at the surface. When the rate constant of the annihilation process is s, the boundary equation is
De'(O) = sc(O). (3.3)
When s is infinitely large, all excitons that contact the surface are annihilated. When s has a finite value, part of the excitons that contact the surface are "reflected" back into the crystal.
Equation (3.1) with the boundary conditions (3.2) and (3.3) has been solved by Borisov and Vishnevskii 8). The solution is
l 0kL2
[ c(x) = exp (-kx) D(l- k2L2 )
kLD +sL J -~-exp (-x/L) , D+sL
(3.4)
where L (D/P) 112 • Curves c(x) are shown for a few cases in fig. 3.1. The concentration of excitons at the surface is obtained by substituting x = 0 in (3.4), which gives
Io c(O)-------
s(l + 1/kL) (1 + DfsL) (3.5)
-18-
The parameter L represents the mean diffusion length of the excitons in the crystal. The physical meaning of L can be seen from the stationary distribution of excitons in the crystal for the case where excitons are generated exclusively at the surface. The pertinent distribution can be found from (3.4) by substituting k oo. This leads to the simple result that
Io L exp (-x/L) c(x) = .
D+sL
so that L represents the distance from the planar source where the stationary concentration of the excitons has diminished by a factor 1/e.
From (3.5) it follows that in the general case, when k =F oo, the rate of annihilation of excitons at the surface is
sc(O) (I + lfkL) (I + D/sL)
(3.6)
In the case where all excitons arriving at the surface are annihilated (s oo), the result is
D c'(O) Io
s c(O) = 1 + IfkL (3.6a)
The efficiency (/Ia of the surface annihilation can be defined as the number of excitons annihilated at the surface per incident photon entering the crystal. This efficiency is according to (3.6):
(/Ia sc(O)flo (1 1/kL)- 1(1 + DfsL)- 1• (3.7)
The two factors in this expression have the following meaning. The first, (l + 1/kL)-t, represents the fraction of all excitons generated in the crystal that contact the surface during their lifetime. It is unity when the absorption coefficient k = oo and zero when k 0. The second factor, (1 + D/sL)-1, gives the fraction of the former fraction that is annihilated at the surface. It is unity when the rate constant s oo and zero when s = 0.
In chapter 4 we shall measure various photoeffects on anthracene which are determined by the number of excitons annihilated at the surface. The dependence of the effects on wavenumber gives therefore information on the variation of (/Ia with k at an anthracene-water interface. The experiments include: (a) measurement of the emission of a sensitized fluorescence which is emitted
by dye molecules adsorbed at the surface; (b) measurement of the photocurrent of holes or electrons injected into anthra
cene crystals with electrolytic electrodes; (c) measurement of the quenching of the fluorescence by aqueous solutions in
contact with the illuminated surface of the crystal. The efficiencies of these processes can be defined as the number of quanta of
-19-
fluorescent light emitted by the dye, the number of charge carriers injected, etc., per incident photon entering the crystal. They will be denoted respectively as cp, (efficiency of the sensitized fluorescence), r:p + (efficiency of the photoconduction process) and 'Pt~. (quenching efficiency). Only a certain fraction of the excitons annihilated at the sul'face give rise to a quantum of sensitized fluorescence, etc. Therefore the efficiencies r:p., 'P+• etc. are proportional to the total annihilation efficiency 'Pa· For instance, for the photocurrent
a
'P+ = affia= (1 + DjsL) (1 + 1/kL) . (3.8)
The results of the measurements (the variation of 'P+ with k) can be analysed by rewriting (3.8) as follows:
a 1/r:p+ = 1/bkL + 1/b, with b = .
1 + D/sL (3.9)
The plot of 1/r:p+ vs 1/k is thus expected to be a straight line. The ratio of the intercept (1/b) and the slope (1/bL) gives the mean diffusion length L of the excitons in the x-direction in the crystal.
Even when the intercept can be determined in absolute measure it does not give information on the value of each of the component parameters D, s and a. Only when the intercept is unity does it follow that a = 1 and s = oo. When experimental conditions can be found so that L is varied without changing a, sand D, one can find the ratio s/D and a. An example is discussed in sec. 5.2.1.
3.1.2. Three-dimensional diffusion of excitons in anisotropic crystals
The rate at which excitons diffuse in an anisotropic crystal like anthracene varies with the direction in the crystal in which the diffusion takes place. In the most general case the rate of change of the concentration of the excitons by diffusion at a given point in the crystal is 38)
<>c
()t (3.10)
where DIJ are the nine components of a diffusion tensor. By properly choosing the coordinate axes one can, however, frequently reduce the number of terms in this expression. In monoclinic anthracene crystals one can choose the direction of the z-axis in the crystallographic b-direction. Since the b-axis is a diad axis
-20-
and since the a,c-plane is a plane of symmetry (see fig. 3.8) it follows that*)
The x- and y-axes in the a,c-plane can be chosen in such a way that also the sum of the remaining asymmetric terms Dxy Dyx is zero in eq. (3.10). There exists thus a set of "principal" coordinates x,y,z in which the diffusion can be described with three diffusion coefficients, which can be denoted as Dx, Dy
and Dz (instead of D""' Dyy and Dzz). The mean diffusion length L, of excitons in an arbitrary direction n measured
in the manner discussed in the preceding section can now be expressed in terms of the mean diffusion lengths Lx, Ly and Lz in the directions of the principal coordinates and the direction angles 1J and 11'· To this end one can consider the :flux j, of excitons through planes perpendicular to the n-direction, parallel with the surface of the crystal. Since the concentration gradient c,' is in the n-direction, the :flux j 11 can be written jn -D11c11'. We shall consider the simple case where {} 0 (n in the x,y-plane). In that case the concentration gradient c11' has components in the x- andy-directions only. In terms of these components (en' cos 1p and c,.' sin w) the :flux j 11 can also be written
j" = jx cos 1p + j, sin 1p = -Dxc,' cos2 1p- Dye,.' sin2 tp.
Equating the two expressions for jn gives
D, = Dx cos2 tp + Dy sin2 tp
or (3.11) L, (Lx2 cos2 tp + Ly2 sin2 tp) 1
12
•
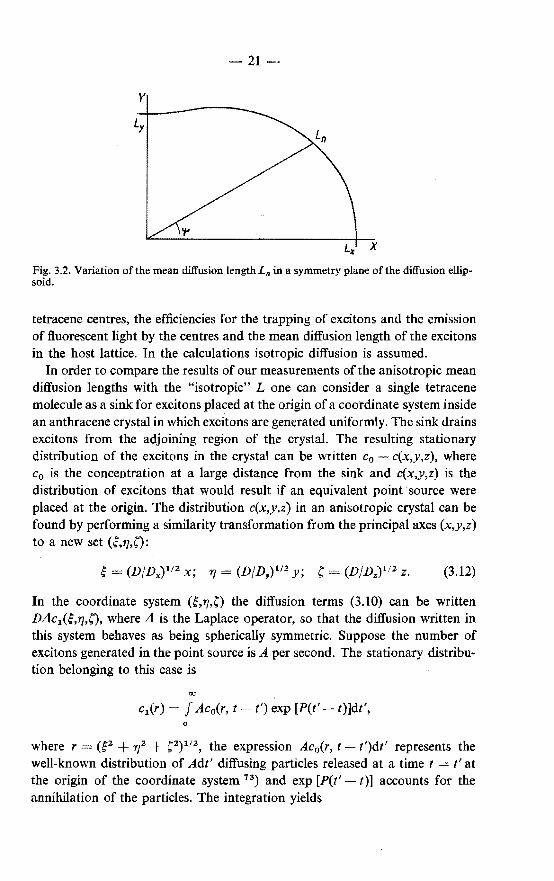
This dependence of L 11 on tp is illustrated in fig. 3.2 for a ratio of Lx and Ly which is the ratio experimentally found for the crystallographic a,c-plane of anthracene. The pertinent experiments are discussed in sec. 5.1.2. It is seen that L, varies but little with 1p for directions close to those. of the principal coordinate axes x andy.
Many authors have determined the diffusion length of excitons in anthracene from the ratio of the intensities of the blue host and the green guest :fluorescence of anthracene crystals doped with very small amounts of tetracene. The intensity of the green guest fluorescence is determined by the known concentration of the
*) For instance: the current density ix of excitons through the plane x 0 at a given point can be written
-jx = DxxCx' + DxyCy' + DxzCz'.
If the crystal with the given concentration gradient of excitons is now reflected in the plane of symmetry z 0 the physical situation remains the same except that the concentration gradient Cz' changes sign, so that
-jx = DxxCx' + DxyCy' DxzCz'·
TherefOre Dxz must be zero.
-21
y
Lx X
Fig. 3.2. Variation of the mean diffusion length Ln in a symmetry plane of the diffusion ellipsoid.
tetracene centres, the efficiencies for the trapping of excitons and the emission of fluorescent light by the centres and the mean diffusion length of the excitons in the host lattice. In the calculations isotropic diffusion is assumed.
In order to compare the results of our measurements of the anisotropic mean diffusion lengths with the "isotropic" L one can consider a single tetracene molecule as a sink for excitons placed at the origin of a coordinate system inside an anthracene crystal in which excitons are generated uniformly. The sink drains excitons from the adjoining region of the crystaL The resulting stationary distribution of the excitons in the crystal can be written c0 - c(x,y,z), where c0 is the concentration at a large distance from the sink and c(x,y,z) is the distribution of excitons that would result if an equivalent point source were placed at the origin. The distribution c(x,y,z) in an anisotropic crystal can be found by performing a similarity transformation from the principal axes (x,y,z) to a new set (.;,1J,C):
(3.12)
In the coordinate system (.;,1J,C) the diffusion terms (3.10) can be written DLJc1(.;,1],C), where LJ is the Laplace operator, so that the diffusion written in this system behaves as being spherically symmetric. Suppose the number of excitons generated in the point source is A per second. The stationary distribution belonging to this case is
c1(r) = J Ac0(r, t- t') exp [P(t'- t)]dt', 0
where r (.;2 + 1]2 + C2)
112, the expression Ac0(r, t- t')dt' represents the
well-known distribution of Adt' diffusing particles released at a time t t' at the origin of the coordinate system 73) and exp [P(t'- t)] accounts for the annihilation of the particles. The integration yields
-22-
A r --exp 4nDr L
(3.13)
where L2 = DfP. When this expression is integrated over all space the number of excitons in
the crystal is found to be A/P, as it should be. A proportion (1-2/e) of the total number of excitons in the crystal is found inside a sphere with radius r = L. When the transformation of coordinates (3.12) is reversed, the sphere with radius L is transformed into the ellipsoid
x2Lx 2 + y2Ly -2 + z2Lz -2 = 1.
In the case of a sink placed in an anisotropic crystal the excitons are thus drained from a region of ellipsoid shape with dimensions determined by the half-axes Lx, Ly and Lz. When the diffusion is assumed to be isotropic, the excitons are drained from a spherical region. The sink will have the same efficiency in the isotropic crystal as in the anisotropic crystal when equal volumes of the crystal are drained in each case, that is, when the volume of the sphere (radius L) is the same as the volume of the corresponding ellipsoid with halfaxes Lx, Ly and Lz. The experiments with doped crystals yielding the "isotropic" mean diffusion length L will therefore be consistent with our measurements of Lx, Ly and Lz if it turns out that L 3 = LxLyLz.
3.2. The diffusion model with reabsorption of ftuorescent light
3.2.1. The effect of reabsorption on the concentration of the excitons at the illuminated surface
Excitation energy in anthracene is transported not only as excitons but also by emission and reabsorption of fluorescent light. In eq. (3.1) this gives rise to an additional source term (R), in the form of an integral, for the generation of excitons at a given site by the reabsorption of fluorescent light emitted at all other sites in the crystal. The differential equation (3.1) thus becomes an integrodifferential equation:
De" -Pc + kl0 exp (-kx) + R = 0. (3.la)
Agranovich and Faidish 39) proposed for the reabsorption term in this equation
the expression
R = Q J lr- r1 l- 2 c(r1) exp [-k1 1 r- r 1 1 )dVl> v
where k 1 is the exponential absorption coefficient for the fluorescent light in the crystal and Q, the "reabsorption coefficient", stands for a number of factors. These authors assumed an isotropic emission and approximated the kernel of the integrodifferential equation by a simple exponential function and calculated c(x).
-23-
We are not interested in the function c(x) but only in its value c(O) at the surface. This offers the possibility to solve the appropriate integrodifferential equation without having recourse to an approximation for the kerneL It is moreover possible to take into account the following features which were not considered in the solution given by Agranovich and Faidish 39):
(a) the fluorescent light is not monochromatic but covers a considerable spectral interval with variations in the absorption coefficient k 1 between 400 000 cm- 1
and zero; (b) not all fluorescent light which strikes the inner side of the illuminated surface
leaves the crystal but a major part is totally reflected back into the crystal; (c) the fluorescent light stems from a dipole-dipole transition of molecules
oriented in a lattice. It is therefore polarized light emitted in an anisotropic fashion. The absorption coefficient k 1 markedly depends on the direction and polarization of the light in the crystal.
The reabsorption term R can now be found as follows. The total number of excitons annihilated per second in the element of volume d V(r 1) is P d V c(r 1 ).
Of this total number a fraction q( a, 1p, {}, i)dad{}d"P sin {} gives rise to a quantum of fluorescent light with a wavenumber in the interval da, a polarization i and a direction in the element of solid angle d{}d"P sin {}. For each direction (1p, &) in the crystal there are in general two possible polarizations i 1
and i2 of the fluorescent light. The intensity of the fluorescent light of a wavenumber in the interval da, originating in the element of volume dV(r1) and arriving at the point r in the crystal is thus
The rate R(r) of generation of excitons at the point r by reabsorption of fluorescent light originating in all other points of the crystal is found by multiplication with the absorption coefficient k 1 for fluorescent light and integration over the volume V of the crystal and over the spectral interval S of the fluorescent emission of anthracene. The reabsorption term thus becomes
R(r) = P 2:. fda f q k1 c(r1) exp [-k1!r1- r!] lr1 rl-2 d V(r1), is v
(3.14)
where q and k 1 are functions of f), 1p, a and i. The term R is largely determined by the values of the functions q and k 1 in the spectral region where the overlap of the two functions is greatest. This is the case for values of a around 25000 cm- 1, at the absorption edge of anthracene.
The following can be said about the functions q and k1 • The function q gives the angular and spectral distribution of the fluorescence as it is emitted in the annihilation of excitons. The spectral distribution (colour) is independent of the
-24
direction of the emission so that the spectral and angular distributions can be separated by writing q as the product of two functions:
The spectral distribution q 1 can be determined experimentally by observing the emission from a very thin layer of microcrystals. The experiments are discussed later on, in sec. 3.2.2; they lead to the spectral distribution shown in fig. 3.5. For the angular distribution function q2 we shall consider two extreme cases, viz. isotropic emission, so that q2 is a constant, and emission in planes perpendicular to the b-axis, so that q2 is zero except for directions perpendicular to the b-axis. The actual distribution of the fluorescence is intermediate between these two extreme cases. This is because the fluorescence of anthracene is strongly polarized in the direction of the crystallographic b-axis, especially at the shortwave end of the spectrum, where the reabsorption is greatest 40). The fluorescence is essentially a dipole emission and on account of its polarization it can be assumed that it is emitted by dipole emittors that are oriented mainly in the direction of the b-axis. The intensity of the emission emitted by such dipoles varies as sin2 X with the angle x between the b-axis and the direction in which the light is emitted. The light is thus emitted largely in directions more or less perpendicular to the b-axis, which is intermediate between isotropic emission and emission in planes perpendicular to the b-axis.
The function q should be normalized in such a way that integration over the spectral interval S of the emission and over all directions gives the "primary" fluorescence yield rp f of anthracene:
~ J da J q sin '!?d'!?d'tp = ({if· I
S sphere
We shall take J q1(a)da <pf, so that s
~fq2 sin '!?dfld'tp = 1. I .
sphere
It follows that in the case of isotropic emission ~q2(isotropic) = 1/4n, while in the case of emission in planes t
~=1<
~ J q2 (in planes) 1sin '!?id'!? = 1/2n. '
(3.15) 0.=0
The polarization of the fluorescent light has consequences also for the function k 1(a, 'tp, D, i), which gives the absorption coefficient for the fluorescent light of wavenumber a emitted in the direction ('tf!, '!?) in the crystal. As mentioned, most of the fluorescent light is b-polarized light emitted in directions more or less perpendicular to the b-axis of the crystal. Such light is absorbed with one and the same absorption coefficient kb, depending only on the wave-
-25-
number of the light 41). The function k 1(a, 'lfJ, f}, i) could thus be approximated by the absorption coefficient of anthracene forb-polarized light, kb( a). One can, however, improve the approximation by integrating k 1 over f} and 'lfJ, assuming a "dipole distribution" of the light and allowing for the incomplete polarization of the light with some simple assumptions. This leads to an angular average of k1 which can be denoted simply as k 1(a). Further details of the calculation are discussed separately in sec. 3.2.3.
The crystal can be supposed to occupy the half-space x )= 0. This makes it convenient to rewrite the reabsorption term (3.14) in cartesian coordinates. This is possible because q1 and k 1 are functions of a only. Since the exciting light is incident perpendicular to the plane x 0, the term R is a function of x only. In the case of isotropic emission of the fluorescent light, when
, l: q2 lf4n, the reabsorption term becomes i
R(x)
In the case of an emission in planes perpendicular to the b-axis the z-axis can be taken along the crystallographic b-axis (parallel with the illuminated surface of the crystal). One can now carry out the integration over{} in eq. (3.14) using eq. (3.15). Since the fluorescent light travels only in planesz=constant, the vector r- r1 is in the x,y-plane, so that the element of surface area !r r 1!d!r-r1!d'lfJcan be replaced by dx1dy1 • This leads to the reabsorption term R(x) =
p f Xfi=OO )'fexp[-ki{(x X1)2+(y-y1)2}1f2]
2n · q1(a)kl(a) c(x1) {(x x1r~ + (y _ y1)2)1 12 dy1dx1da.
S x1=0 Yl=-oo
(3.14b)
So far we have not considered the reflection of the fluorescent light at the inner side of the illuminated surface of the crystal. Reabsorption of reflected fluorescent light will increase the exciton concentration. The effect of the internal reflection offiuorescent light on the distribution of the excitons in the crystal is studied by considering again two extreme cases, viz. no reflection, as was assumed above, and complete reflection. In case of a complete reflection of the fluorescent light the reabsorption terms are the same as those given above except that the integration over x 1 is from -oo to oo instead of from 0 to oo. This is because light with its origin in the point (x1, Yr. z1) that is reflected at the plane x = 0 appears to have its origin in the point (-x1o Ji, z1) both as regards its direction and its intensity.
The integrodifferential equation (3.la) was solved for c(O) with the four
-26
expressions for R given above *). The boundary equations were those given by eqs (3.2) and (3.3). The respective solutions for c(O) will be designated as c(O,al) for the case of no reflection and isotropic emission of the fluorescent light, c(O,a2) for the case of no reflection and emission in planes, c(O,b l) for the case of complete reflection and isotropic emission and c(O,b2) for the case of complete reflection and emission in planes. The solutions are
c(O,al) = c(O,a2) = = /0s- 1{1 + 1/kL)-1(1 Ds- 1L- 1 -Jns- 1)- 1 x
00
(3.16) 0
and c(O,bl) = c(O,b2) =
0 =los-1-------------------------------------------------
oo
1 + D(sL)- 1 + 2(nL)- 1 f [GW- 1 -1] (~2L2 + 1)- 1 d,; 0
(3.17) with
and
s
K(~) = ~- 1 arctan~ in c(O,al) and in c(O,bl) and K(n (1 + ,;-2)- 1 ' 2 in c(O,a2) and in c(O,b2). When there is no emission and reabsorption of fluorescent light (q( a) 0) the expressions (3.16) and (3.17) are reduced to (3.5), as they should.
It is seen that in both (3.16) and (3.17), as also in (3.5), the absorption coefficient k for the incident light does not occur together with the annihilation constant s or the diffusion coefficient D in one factor. The relative variation of the concentration of the excitons with the absorption coefficient is therefore independent of the values of sand D. To calculate the variation of c(O) with k it is convenient to choose s = 0. For this case (s 0) the four expressions contained in (3.16) and (3.17) were numerically calculated for a number of realistic values of Land k **).The spectral distribution of the fluorescenceq1(a) and the dependence of k 1 on a, as used in this calculation, are discussed in sees 3.2.2 and 3.2.3. The results are given in table 3-I, in which are tabulated from left to right: L, the decimal absorption coefficient e (e = 0·434 k cm- 1),
*) Prof. Dr J. A. Geurst of this laboratory, unpublished results. **) The calculations were made by Ir W. J. P. Fontein of Philips Computing Centre.
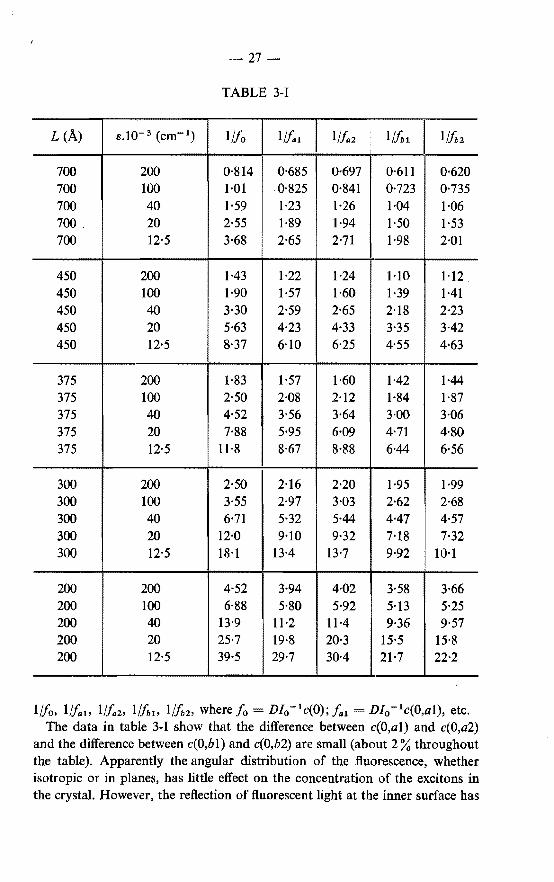
-27-
TABLE 3-1
L (A) s.I0- 3 (cm- 1) 1/fo 1/lal 1/faz 1/hl I 1/foz
700 200 0·814 0·685 0·697 0·611 0·620 700 100 1·01 0·825 0·841 0·723 0·735 700 40 1·59 1·23 1·26 1·04 1·06 700. 20 2·55 1·89 1·94 1·50 1·53 700 12·5 3·68 2·65 2·71 1·98 2·01
450 200 1·43 1·22 1·24 1·10 1·12 450 100 1·90 1·57 1·60 1·39 1·41 450 40 3·30 2·59 2·65 2·18 2·23 450 20 5·63 4·23 4·33 3·35 3·42 450 12·5 8·37 6·10 6·25 4·55 4·63
375 200 1·83 1·57 1·60 1·42 1·44 375 100 2·50 2·08 2·12 1·84 1·87 375 40 4·52 3·56 3·64 3·00 3·06 375 20 7·88 5·95 6·09 4·71 4·80 375 12·5 11·8 8·67 8·88 6·44 6·56
300 200 2·50 2·16 2·20 1·95 1·99 300 100 3·55 2·97 3·03 2·62 2·68 300 40 6·71 5·32 5·44 4·47 4·57 300 20 12·0 9·10 9·32 7·18 7·32 300 12·5 18·1 13·4 13-7 9·92 10·1
200 200 4·52 3·94 4·02 3·58 3·66 200 100 6·88 5·80 5·92 5·13 5·25 200 40 13·9 11·2 11·4 9·36 9·57 200 20 25·7 19·8 20·3 15·5 15·8 200 12·5 39·5 29·7 30·4 21·7 22·2
1//o. 1//a1 , Iflaz, 1//,1, 1/hz, where /o = D/0 -lc(O); /a1 D/0 -1c(O,al), etc.
The data in table 3-1 show that the difference between c(O,a1) and c(O,a2) and the difference between c(O,b1) and c(O,b2) are small (about 2% throughout the table). Apparently the angular distribution of the fluorescence, whether isotropic or in planes, has little effect on the concentration of the excitons in the crystal. However, the reflection of fluorescent light at the inner surface has
-28-
~·~----------------------~
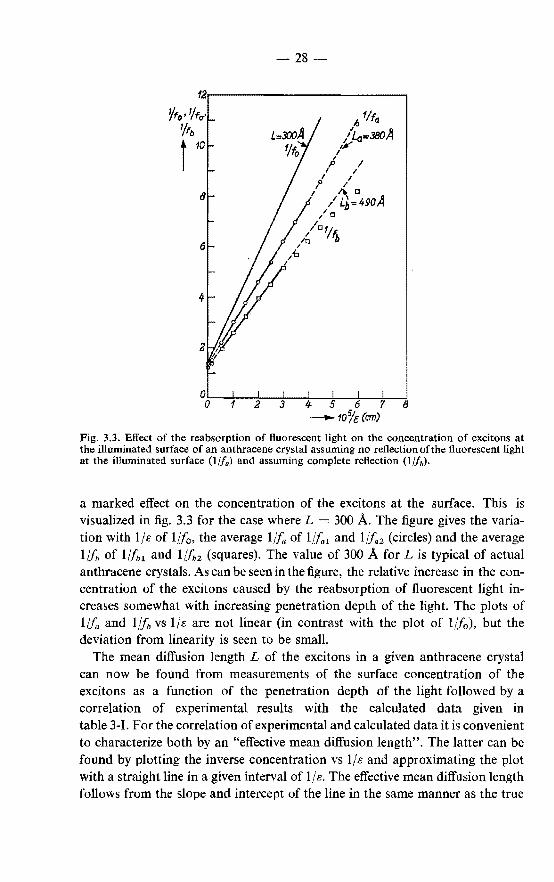
Fig. 3.3. Effect of the reabsorption of fluorescent light on the concentration of excitons at the illuminated surface of an anthracene crystal assuming no reflectionofthe fluorescent light at the illuminated surface (l/f.) and assuming complete reflection (1//b).
a marked effect on the concentration of the excitons at the surface. This is visualized in fig. 3.3 for the case where L = 300 A. The figure gives the variation with 1/s of 1//0 , the average 1/fa of l/!a 1 and l/!a2 (circles) and the average 1/h of 1/fbl and l/f~2 (squares). The value of 300 A for L is typical of actual anthracene crystals. As can be seen in the figure, the relative increase in the concentration of the excitons caused by the reabsorption of fluorescent light increases somewhat with increasing penetration depth of the light. The plots of l/fa and 1/fb vs 1/s are not linear (in contrast with the plot of 1//0), but the deviation from linearity is seen to be small.
The mean diffusion length L of the excitons in a given anthracene crystal can now be found from measurements of the surface concentration of the excitons as a function of the penetration depth of the light followed by a correlation of experimental results with the calculated data given in table 3-1. For the correlation of experimental and calculated data it is convenient to characterize both by an "effective mean diffusion length". The latter can be found by plotting the inverse concentration vs 1/s and approximating the plot with a straight line in a given interval of 1 Is. The effective mean diffusion length follows from the slope and intercept of the line in the same manner as the true
-29-
mean diffusion length L would be obtained from the linear plot of l/f0 vs 1/s in case there were no reabsorption of fluorescent light (eq. (3.9)).
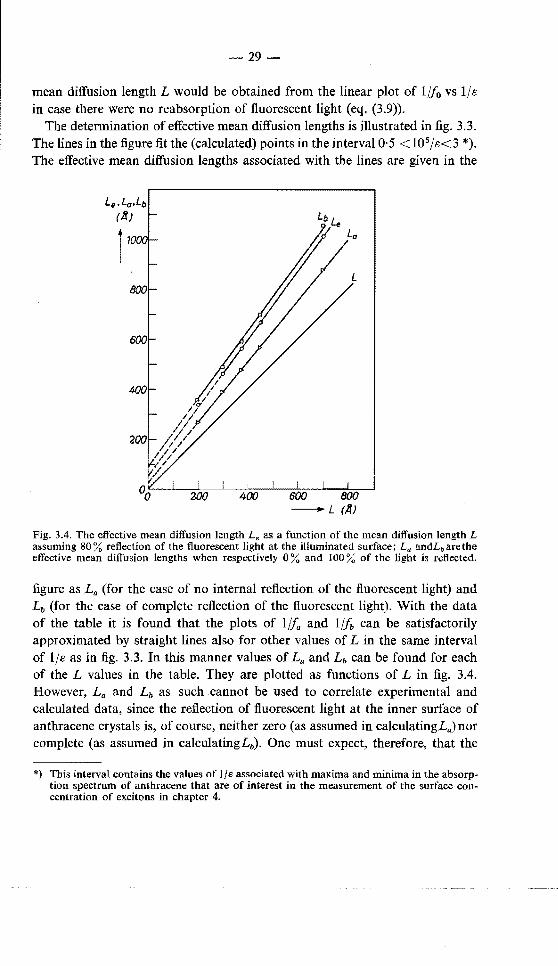
The determination of effective mean diffusion lengths is illustrated in fig. 3.3. The lines in the figure fit the (calculated) points in the interval 0· 5 < 105
/ e< 3 *). The effective mean diffusion lengths associated with the lines are given in the
Fig. 3.4. The effective mean diffusion length L. as a function of the mean diffusion length L assuming 80% reflection of the fluorescent light at the illuminated surface; La andLbarethe effective mean diffusion lengths when respectively 0% and 100% of the light is reflected.
figure as La (for the case of no internal reflection of the fluorescent light) and Lb (for the case of complete reflection of the fluorescent light). With the data of the table it is found that the plots of l!fa and 1/fb can be satisfactorily approximated by straight lines also for other values of L in the same interval of 1/e as in fig. 3.3. In this manner values of La and Lb can be found for each of the L values in the table. They are plotted as functions of L in fig. 3.4. However, La and Lb as such cannot be used to correlate experimental and calculated data, since the reflection of fluorescent light at the inner surface of anthracene crystals is, of course, neither zero (as assumed in calculatingLa)nor complete (as assumed in calculatingLb). One must expect, therefore, that the
*) This interval contains the values of 1/s associated with maxima and minima in the absorption spectrum of anthracene that are of interest in the measurement of the surface concentration of excitons in chapter 4.
-30-
"effective mean diffusion length" L. derived from experimental plots of the inverse exciton concentration will be intermediate between L" and Lb. To correlate the values of Le and L an assumption must be made about the degree of reflection of the fluorescent light. Obreimov, Prikhotko and Rodnikova 42
)
measured the following principal indices of refraction for anthracene at 24 700 cm- 1 (where the reabsorption of fluorescent light is most intense): n, = l ·71, np = 2·42 and ny = 2·53. With the average value n = 2·22 it is found that about 75% of the light is totally reflected at an anthracene-water interface, while the remainder is partially reflected. It seems fair therefore to take 0·8 fb + 0·2fa for the concentration of excitons at the surface of anthracene crystals. The effective mean diffusion length Le calculated on this assumption is also plotted in fig. 3.4. In order to find the true mean diffusion length L of excitons in a given anthracene crystal one can now derive the effective length Le from an experimental plot of the inverse concentration of excitons at the surface vs lfe and use the dependence of Le on L plotted in fig. 3.4.
Remark As mentioned already, the variation of the surface concentration of the
excitons with the absorption coefficient k is the same whatever the surface annihilation constants. In the calculations leading to the data of table 3-I this constant was assumed to be zero. In reality the rate of surface annihilation seems to be appreciable. From evidence given in sec. 5.2.1 it seems that a large part of the excitons arriving at the surface are annihilated radiatively. The resulting fluorescent light is reabsorbed in the crystal and gives rise to a generation term for excitons which has not been included in eq. (3.la). It can be argued, however, that fluorescence arising at the surface does not alter the relative variation of the concentration of excitons at the surface with the absorption coefficient k and, consequently, does not affect the effective mean diffusion length as it was defined above. To show this one can first assume that s is not zero, but that all excitons disappearing at the surface are annihilated non-radiatively. This leads to a surface concentration c0 (k) lower than the concentration given in the table which was calculated for the case that s = 0. As mentioned, the relative variation of c0 with k is the same as in the table. The rate of annihilation of excitons at the surface is s c0 (k). When part of the excitons annihilated at the surface are now assumed to fluoresce there is superimposed on the original concentration c0(k) an increase in the exciton concentration that is proportional to the original rate of surface annihilation s c0 (k). The surface concentration is thus increased by an amount ys c0 (k),
where y is a constant. The total concentration is now
c0 (k) {1 + ys }.
It follows that the shape of the excitation spectrum, and also the effective mean
-31-
diffusion length derived from the spectrum, is not affected by reabsorption of fluorescence originating at the surface.
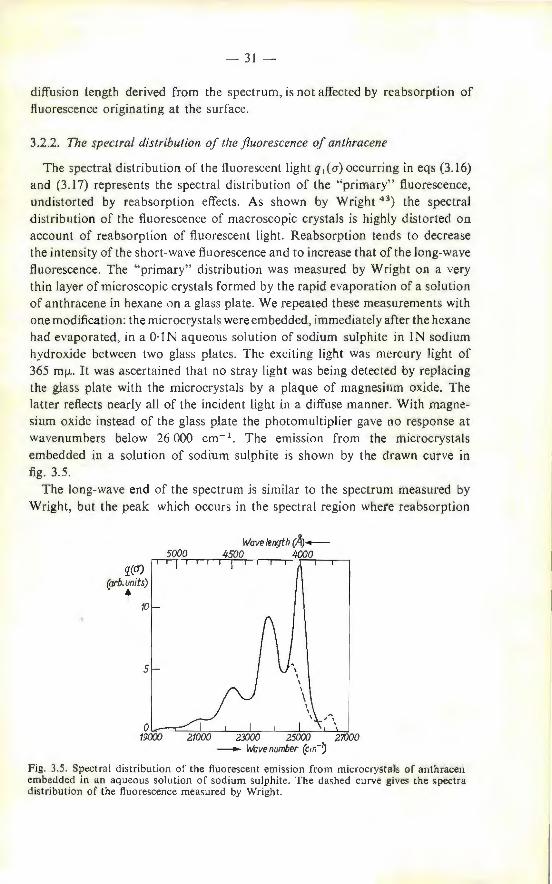
3.2.2. The spectral distribution of the fluorescence of anthracene
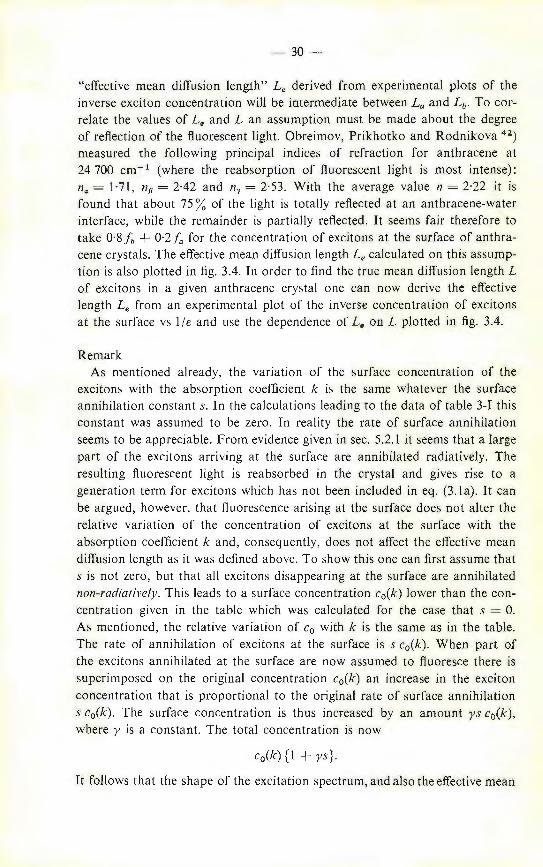
The spectral distribution of the fluorescent light q 1 (a) occurring in eqs (3.16) and (3.17) represents the spectral distribution of the "primary" fluorescence, undistorted by reabsorption effects. As shown by Wright 43
) the spectral
distribution of the fluorescence of macroscopic crystals is highly distorted on account of reabsorption of fluorescent light. Reabsorption tends to decrease the intensity of the short-wave fluorescence and to increase that of the long-wave fluorescence . The " primary" distribution was measured by Wright on a very thin layer of microscopic crystals formed by the rapid evaporation of a solution of anthracene in hexane on a glass pla te. We repeated these measurements with one modification: the microcrysta ls were embedded, immediately after the hexane had evaporated, in a O·!N aqueous solution of sodium sulphite in IN sodium hydroxide between two glass plates. The exciting light was mercury light of 365 mfl. It was ascertained that no stray light was being detected by replacing the glass plate with the microcrystals by a plaque of magnesium oxide. The latter reflects nearly all of the incident light in a diffuse manner. With magnesium oxide instead of the glass plate the photomultiplier gave no response at wavenumbers below 26 000 cm- 1 . The emission from the microcrystals embedded in a solution of sodium sulphite is shown by the drawn curve in fig. 3.5.
The long-wave end of the spectrum is similar to the spectrum measured by Wright, but the peak which occurs in the spectral region where reabsorption
q(a') (arb. units)
i 10
Fig. 3.5. Spectral distribution of the fluorescent emission from microcrysta'ls of anthracen embedded in an aqueous solution of sodium sulphite. The dashed curve gives the spectra distribution of the fluorescence measured by Wright.
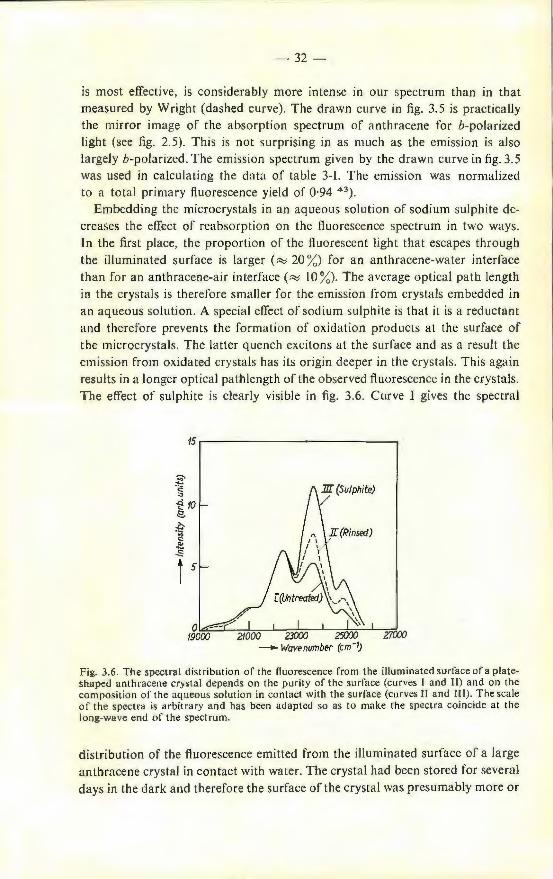
-32-
is most effective, is considerably more intense m our spectrum than in that measured by Wright (dashed curve). The drawn curve in fig. 3.5 is practically the mirror image of the absorption spectrum of anthracene for b-polarized light (see fig. 2.5). This is not surprising in as much as the emission is also largely b-polarized. The emission spectrum given by the drawn curve in fig. 3.5 was used in calculating the data of table 3-L. The emission was normalized to a total primary fluorescence yield of 0·94 43
).
Embedding the microcrystals in an aqueous solution of sodium sulphite decreases the effecr of reabsorption on the fluorescence spectrum in two ways. In the first place, the proportion of the fluorescent light that escapes through the illuminated surface is larger c~ 20 %) for an anthracene-water interface than for an anthracene-air interface ( ~ I 0 %). The average optical path length in the crystals is therefore smaller for the emission from crystals embedded in an aqueous solution. A special effect of sodium sulphite is that it is a reductant and therefore prevents the formation of oxidation products at the surface of the microcrystals. The latter quench excitons at the surface and as a result the emission from oxidated crystals has its origin deeper in the crystals. This again results in a longer optical path length of the observed fluorescence in the crystals. The effect of sulphite is clearly visible in fig. 3.6. Curve I gives the spectral
~r--------------------------.
27!XXJ
Fig. 3.6. The spectral distribution of the fluorescence from the illuminated surface of a plateshaped anthracene crystal depends on the purity of the surface (curves I and II) and on the composition of the aqueous solution in contact with the surface (curves II and Ill). The scale of the spectra is arbit rary and has been adapted so as to make the spectra coincide at the long-wave end of the spectrum.
distribution of the fluorescence emitted from the illuminated surface of a large anthracene crystal in contact with water. The crysta l had been stored for several days in the dark and therefore the surface of the crystal was presumably more or
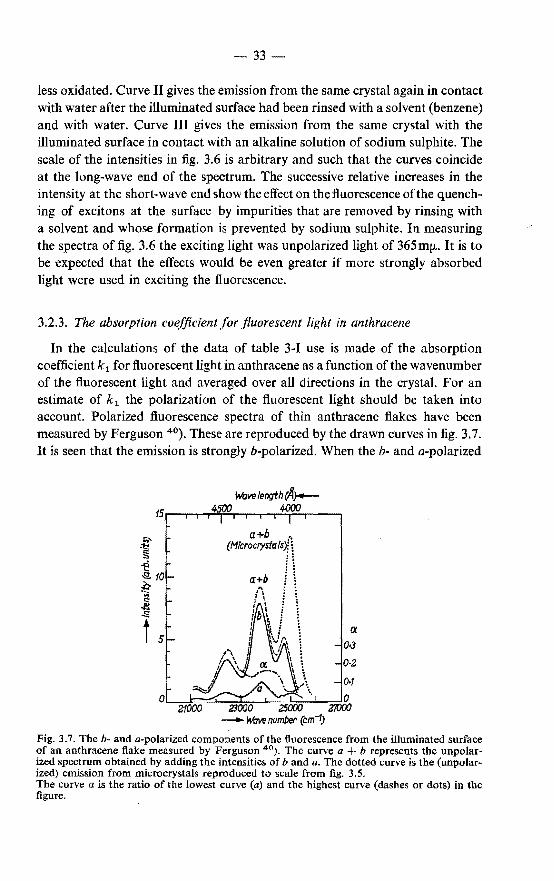
-33
less oxidated. Curve II gives the emission from the same crystal again in contact with water after the illuminated surface had been rinsed with a solvent (benzene) and with water. Curve III gives the emission from the same crystal with the illuminated surface in contact with an alkaline solution of sodium sulphite. The scale of the intensities in fig. 3.6 is arbitrary and such that the curves coincide at the long-wave end of the spectrum. The successive relative increases in the intensity at the short-wave end show the effect on the fluorescence of the quenching of excitons at the surface by impurities that are removed by rinsing with a solvent and whose formation is prevented by sodium sulphite. In measuring the spectra of fig. 3.6 the exciting light was unpolarized light of 365mr;.. It is to be expected that the effects would be even greater if more strongly absorbed light were used in exciting the fluorescence.
3.2.3. The absorption coefficient for fluorescent light in anthracene
In the calculations of the data of table 3-I use is made of the absorption coefficient k1 for fluorescent light in anthracene as a function of the wavenumber of the fluorescent light and averaged over all directions in the crystal. For an estimate of k 1 the polarization of the fluorescent light should be taken into account. Polarized fluorescence spectra of thin anthracene flakes have been measured by Ferguson 40). These are reproduced by the drawn curves in fig. 3.7. It is seen that the emission is strongly b-polarized. When the b- and a-polarized
Fig. 3.7. The b-and a-polarized components of the fluorescence from the illuminated surface of an anthracene flake measured by Ferguson 40). The curve a + b represents the unpolarized spectrum obtained by adding the intensities of b and a. The dotted curve is the (unpolarized) emission from microcrystals reproduced to scale from fig. 3.5. The curve a is the ratio of the lowest curve (a) and the highest curve (dashes or dots) in the figure.
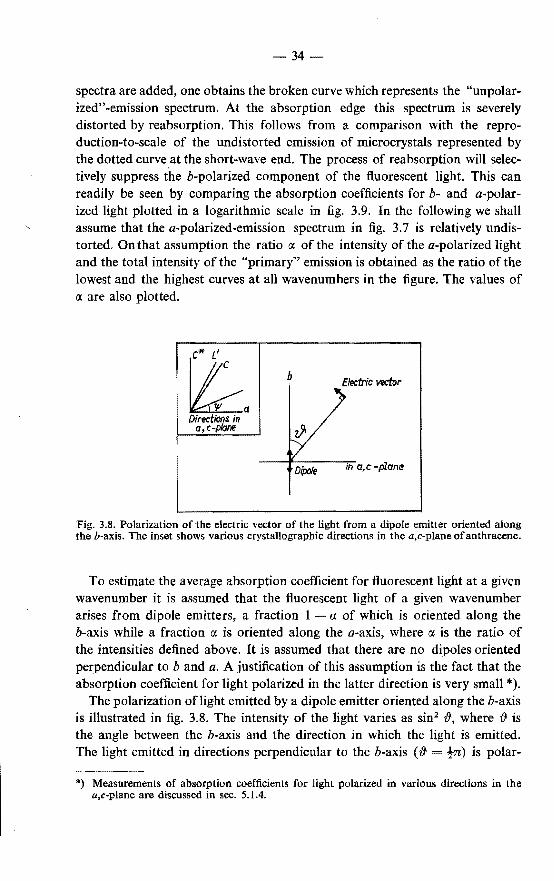
-34
spectra are added, one obtains the broken curve which represents the "unpolarized" -emission spectrum. At the absorption edge this spectrum is severely distorted by reabsorption. This follows from a comparison with the reproduction-to-scale of the undistorted emission of microcrystals represented by the dotted curve at the short-wave end. The process of reabsorption will selectively suppress the b-polarized component of the fluorescent light. This can readily be seen by comparing the absorption coefficients for b- and a-polarized light plotted in a logarithmic scale in fig. 3.9. In the following we shall assume that the a-polarized-emission spectrum in fig. 3.7 is relatively undistorted. On that assumption the ratio a of the intensity of the a-polarized light and the total intensity of the "primary" emission is obtained as the ratio of the lowest and the highest curves at all wavenumbers in the figure. The values of a are also plotted.
~. Directions in
a,c-plane
b Eledric vector
Dipole ill a, c -plane
Fig. 3.8. Polarization of the electric vector of the light from a dipole emitter oriented along the b-axis. The inset shows various crystallographic directions in the a,c-plane of anthracene.
To estimate the average absorption coefficient for fluorescent light at a given wavenumber it is assumed that the fluorescent light of a given wavenumber arises from dipole emitters, a fraction 1 - a of which is oriented along the b-axis while a fraction a is oriented along the a-axis, where a is the ratio of the intensities defined above. It is assumed that there are no dipoles oriented perpendicular to b and a. A justification of this assumption is the fact that the absorption coefficient for light polarized in the latter direction is very small *).
The polarization of light emitted by a dipole emitter oriented along the b-axis is illustrated in fig. 3.8. The intensity of the light varies as sin2 #, where # is the angle between the b-axis and the direction in which the light is emitted. The light emitted in directions perpendicular to the b-axis ( # tn) is polar-
*) Measurements of absorption coefficients for light polarized in various directions in the a,c-plane are discussed in sec. 5.1.4.
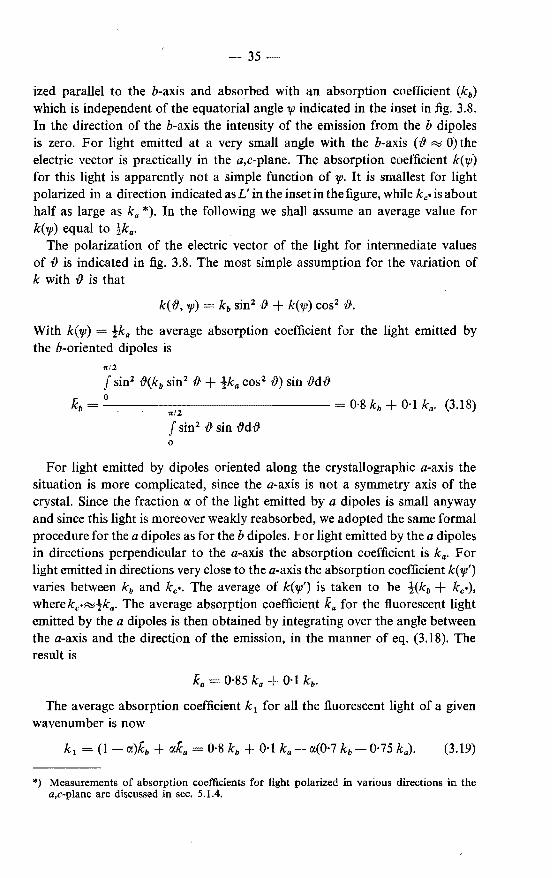
-35
ized parallel to the b-axis and absorbed with an absorption coefficient (kb) which is independent of the equatorial angle "P indicated in the inset in fig. 3.8. In the direction of the b-axis the intensity of the emission from the b dipoles is zero. For light emitted at a very small angle with the b-axis ( {} ~ 0) the electric vector is practically in the a,c-plane. The absorption coefficient k(w) for this light is apparently not a simple function of "P· It is smallest for light polarized in a direction indicated as L' in the inset in the figure, while kc• is about half as large as ka *). In the following we shall assume an average value for k("P) equal to tka.
The polarization of the electric vector of the light for intermediate values of{} is indicated in fig. 3.8. The most simple assumption for the variation of k with {} is that
k(iJ, "P) = kb sin2 {} + k('ljJ) cos2 {}.
With k("P) = !ka the average absorption coefficient for the light emitted by the b-oriented dipoles is
1t/2
J sin2 {}(ko sin2 {} + !ka cos2 {})sin {}d{}
0 Kb = = 0·8 kb + 0·1 k 0 • (3.18)
n/2
J sin2 {} sin {}d{}
0
For light emitted by dipoles oriented along the crystallographic a-axis the situation is more complicated, since the a-axis is not a symmetry axis of the crystal. Since the fraction IX of the light emitted by a dipoles is small anyway and since this light is moreover weakly reabsorbed, we adopted the same formal procedure for the a dipoles as for the b dipoles. For light emitted by the a dipoles in directions perpendicular to the a-axis the absorption coefficient is ka. For light emitted in directions very close to the a-axis the absorption coefficient k( "P') varies between kb and kc•· The average of k( "P') is taken to be t(kb + kc•), where kc·~tka. The average absorption coefficient Ka for the fluorescent light emitted by the a dipoles is then obtained by integrating over the angle between the a-axis and the direction of the emission, in the manner of eq. (3.18). The result is
Ka 0·85 ka O·l kb.
The average absorption coefficient k 1 for all the fluorescent light of a given wavenumber is now
(3.19)
*) Measurements of absorption coefficients for light polarized in various directions in the a,c-plane are discussed in sec. 5.1.4.
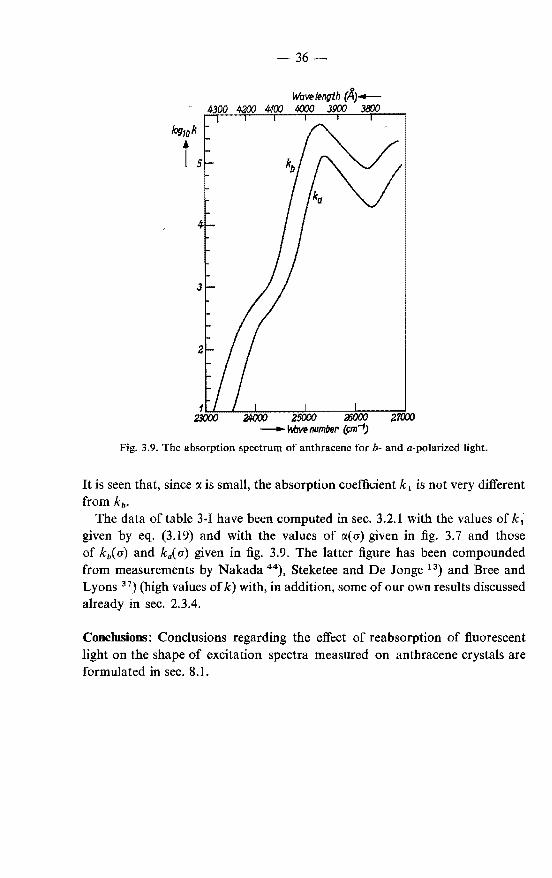
-36-
Fig. 3.9. The absorption spectrum of anthracene forb- and a-polarized light.
It is seen that, since a is small, the absorption coefficient k 1 is not very different from kb.
The data of table 3-I have been computed in sec. 3.2.1 with the values of k 1
given by eq. (3.19) and with the values of cx(a) given in fig. 3.7 and those of kb( a) and ka( a) given in fig. 3.9. The latter figure has been compounded from measurements by Nakada 44), Steketee and DeJonge 13) and Bree and Lyons 37) (high values of k) with, in addition, some of our own results discussed already in sec. 2.3.4.
Conclusions: Conclusions regarding the effect of reabsorption of fluorescent light on the shape of excitation spectra measured on anthracene crystals are formulated in sec. 8.1.
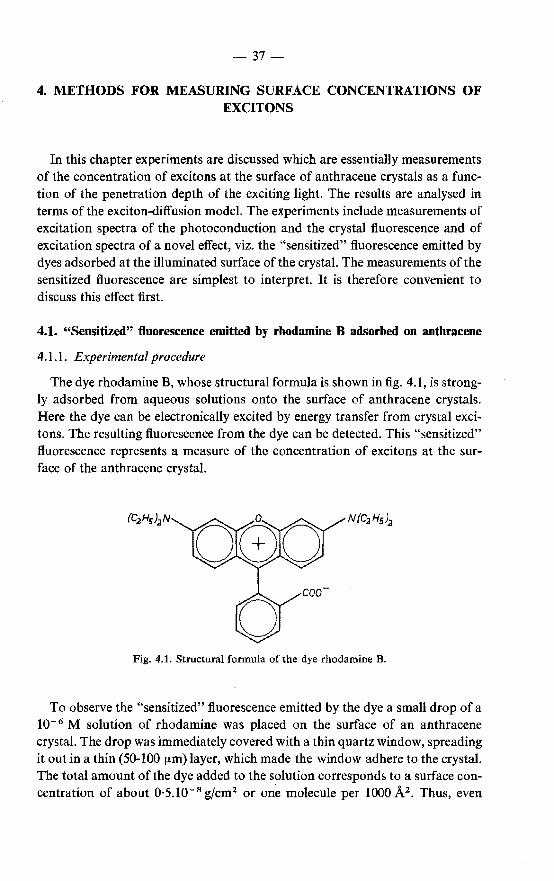
-37-
4. METHODS FOR MEASURING SURFACE CONCENTRATIONS OF EXCITONS
In this chapter experiments are discussed which are essentially measurements of the concentration of excitons at the surface of anthracene crystals as a function of the penetration depth of the exciting light. The results are analysed in terms of the exciton-diffusion model. The experiments include measurements of excitation spectra of the photoconduction and the crystal fluorescence and of excitation spectra of a novel effect, viz. the "sensitized" fluorescence emitted by dyes adsorbed at the illuminated surface of the crystal. The measurements of the sensitized fluorescence are simplest to interpret. It is therefore convenient to discuss this effect first.
4.1. "Sensitized" fluorescence emitted by rhodamine B adsorbed on anthracene
4.1.1. Experimental procedure
The dye rhodamine B, whose structural formula is shown in fig. 4.1, is strongly adsorbed from aqueous solutions onto the surface of anthracene crystals. Here the dye can be electronically excited by energy transfer from crystal excitons. The resulting fluorescence from the dye can be detected. This "sensitized" fluorescence represents a measure of the concentration of ex:citons at the surface of the anthracene crystal.
Fig. 4.1. Structural formula of the dye rhodamine B.
To observe the "sensitized" fluorescence emitted by the dye a small drop of a I o- 6 M solution of rhodamine was placed on the surface of an anthracene crystal. The drop was immediately covered with a thin quartz window, spreading it out in a thin (50-100 !lm) layer, which made the window adhere to the crystal. The total amount of the dye added to the solution corresponds to a surface concentration of about 0·5.10- 8 gjcm2 or one molecule per 1000 A2 • Thus, even
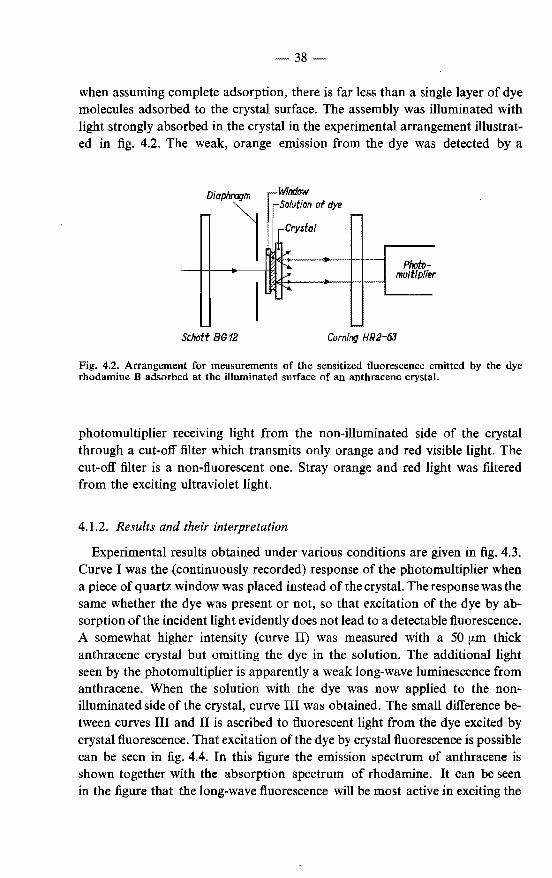
38
when assuming complete adsorption, there is far less than a single layer of dye molecules adsorbed to the crystal surface. The assembly was illuminated with light strongly absorbed in the crystal in the experimental arrangement illustrated in fig. 4.2. The weak, orange emission from the dye was detected by a
Window -· Diaphry;y;Jm
l r-Solution of dye
r-
Crystal
,or
) Photo-multipfier
I ""'
'-
Schott BG12 Corning HR2-63
Fig. 4.2. Arrangement for measurements of the sensitized fluorescence emitted by the dye rhodamine B adsorbed at the illuminated surface of an anthracene crystal.
photomultiplier receiving light from the non-illuminated side of the crystal through a cut-off filter which transmits only orange and red visible light. The cut-off filter is a non-fluorescent one. Stray orange and red light was filtered from the exciting ultraviolet light.
4.1.2. Results and their interpretation
Experimental results obtained under various conditions are given in fig. 4.3. Curve I was the (continuously recorded) response of the photomultiplier when a piece of quartz window was placed instead of the crystal. The response was the same whether the dye was present or not, so that excitation of the dye by absorption of the incident light evidently does not lead to a detectable fluorescence. A somewhat higher intensity (curve II) was measured with a 50 [LID thick anthracene crystal but omitting the dye in the solution. The additional light seen by the photomultiplier is apparently a weak long-wave luminescence from anthracene. When the solution with the dye was now applied to the nonilluminated side of the crystal, curve III was obtained. The small difference between curves III and II is ascribed to fluorescent light from the dye excited by crystal fluorescence. That excitation of the dye by crystal fluorescence is possible can be seen in fig. 4.4. In this figure the emission spectrum of anthracene is shown together with the absorption spectrum of rhodamine. It can be seen in the figure that the long-wave fluorescence will be most active in exciting the
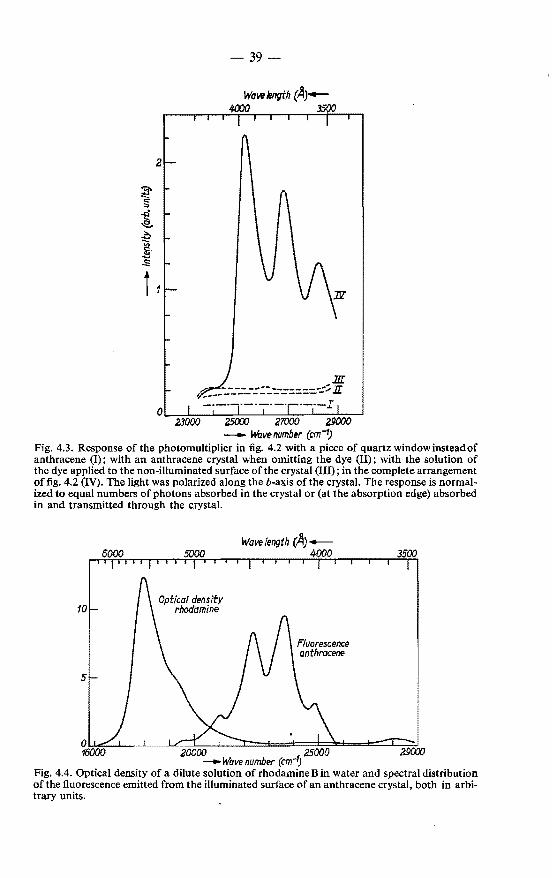
39-
o~~~~~~~~~J-~~~ 25000 27000 29000 -Wavenumber (cm-1)
Fig. 4.3. Response of the photomultiplier in fig. 4.2 with a piece of quartz window instead of anthracene (I) ; with an anthracene crystal when omitting the dye (II); with the solution of the dye applied to the non-illuminated surface of the crystal (Ill); in the complete arrangement of fig. 4.2 (IV). The light was polarized along the b-axis of the crystal. The response is normalized to equal numbers of photons absorbed in the crystal or (at the absorption edge) absorbed in and transmitted through the crystal.
Opticaf density rhodamine
3500
~~~~~_L __ LCz;oo~oo~L-~~~===7~~oo~o~b=~~c;~~ -wavenumber (em·?
Fig. 4.4. Optical density of a dilute solution of rhodamine Bin water and spectral distribution of the fluorescence emitted from the illuminated surface of an anthracene crystal, both in arbitrary units.
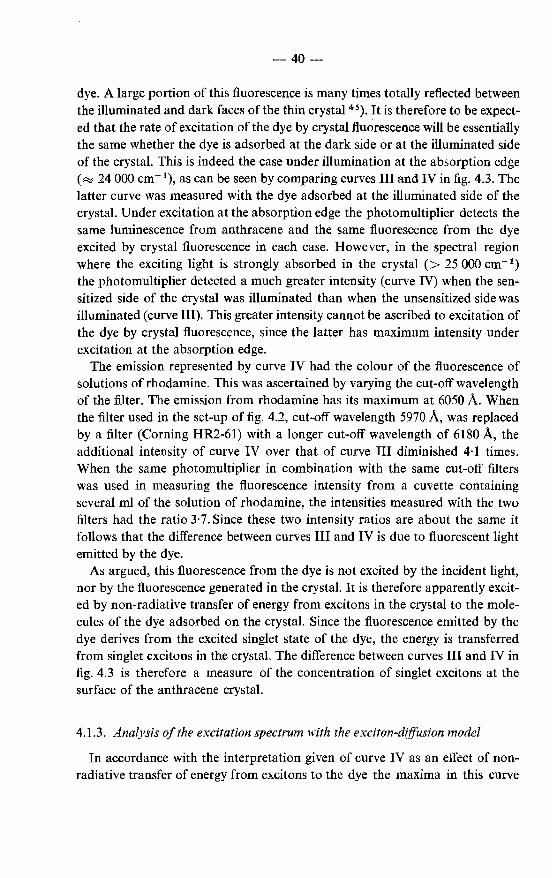
-40-
dye. A large portion of this fluorescence is many times totally reflected between the illuminated and dark faces of the thin crystal 45
). It is therefore to be expected that the rate of excitation of the dye by crystal fluorescence will be essentially the same whether the dye is adsorbed at the dark side or at the illuminated side of the crystal. This is indeed the case under illumination at the absorption edge (~ 24 000 cm- 1
), as can be seen by comparing curves III and IV in fig. 4.3. The latter curve was measured with the dye adsorbed at the illuminated side of the crystal. Under excitation at the absorption edge the photomultiplier detects the same luminescence from anthracene and the same fluorescence from the dye excited by crystal fluorescence in each case. However, in the spectral region where the exciting light is strongly absorbed in the crystal (> 25 000 cm- 1)
the photomultiplier detected a much greater intensity (curve IV) when the sensitized side of the crystal was illuminated than when the unsensitized side was illuminated (curve III). This greater intensity cannot be ascribed to excitation of the dye by crystal fluorescence, since the latter has maximum intensity under excitation at the absorption edge.
The emission represented by curve IV had the colour of the fluorescence of solutions of rhodamine. This was ascertained by varying the cut-off wavelength of the filter. The emission from rhodamine has its maximum at 6050 A. When the filter used in the set-up of fig. 4.2, cut-off wavelength 5970 A, was replaced by a filter (Corning HR2-61) with a longer cut-off wavelength of 6180 A, the additional intensity of curve IV over that of curve III diminished 4·1 times. When the same photomultiplier in combination with the same cut-off filters was used in measuring the fluorescence intensity from a cuvette containing several ml of the solution of rhodamine, the intensities measured with the two filters had the ratio 3·7. Since these two intensity ratios are about the same it follows that the difference between curves III and IV is due to fluorescent light emitted by the dye.
As argued, this fluorescence from the dye is not excited by the incident light, nor by the fluorescence generated in the crystal. It is therefore apparently excited by non-radiative transfer of energy from excitons in the crystal to the molecules of the dye adsorbed on the crystal. Since the fluorescence emitted by the dye derives from the excited singlet state of the dye, the energy is transferred from singlet excitons in the crystal. The difference between curves III and IV in fig. 4.3 is therefore a measure of the concentration of singlet excitons at the surface of the anthracene crystal.
4.1.3. Analysis of the excitation spectrum with the exciton-diffusion model
In accordance with the interpretation given of curve IV as an effect of nonradiative transfer of energy from excitons to the dye the maxima in this curve
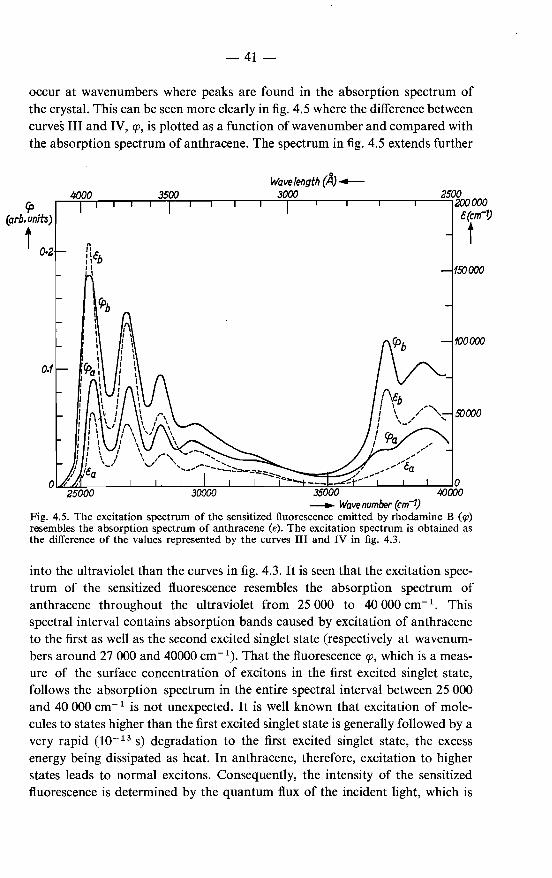
-41-
occur at wavenumbers where peaks are found in the absorption spectrum of the crystal. This can be seen more clearly in fig. 4.5 where the difference between curves III and IV, cp, is plotted as a function of wavenumber and compared with the absorption spectrum of anthracene. The spectrum in fig. 4.5 extends further
(p (arb. units)
t O·Z
Wavelength (A)-+-
..... ~~~~-r~~r-~~--~-.--~30~00~-r---r---.---,.-~2~~0 200000 c(cm-1)
t 150000
35000 -- Wavenumber (cm--'1)
Fig. 4.5. The excitation spectrum of the sensitized fluorescence emitted by rhodamine B (lf!) resembles the absorption spectrum of anthracene (e). The excitation spectrum is obtained as the difference of the values represented by the curves III and IV in fig. 4.3.
into the ultraviolet than the curves in fig. 4.3. It is seen that the excitation spectrum of the sensitized fluorescence resembles the absorption spectrum of anthracene throughout the ultraviolet from 25 000 to 40 000 em - 1 • This spectral interval contains absorption bands caused by excitation of anthracene to the first as well as the second excited singlet state (respectively at wavenumbers around 27 000 and 40000 cm- 1
). That the fluorescence cp, which is a measure of the surface concentration of excitons in the first excited singlet state, follows the absorption spectrum in the entire spectral interval between 25 000 and 40 000 cm- 1 is not unexpected. It is well known that excitation of molecules to states higher than the first excited singlet state is generally followed by a very rapid (l0- 13 s) degradation to the first excited singlet state, the excess energy being dissipated as heat. In anthracene, therefore, excitation to higher states leads to normal excitons. Consequently, the intensity of the sensitized fluorescence is determined by the quantum flux of the incident light, which is
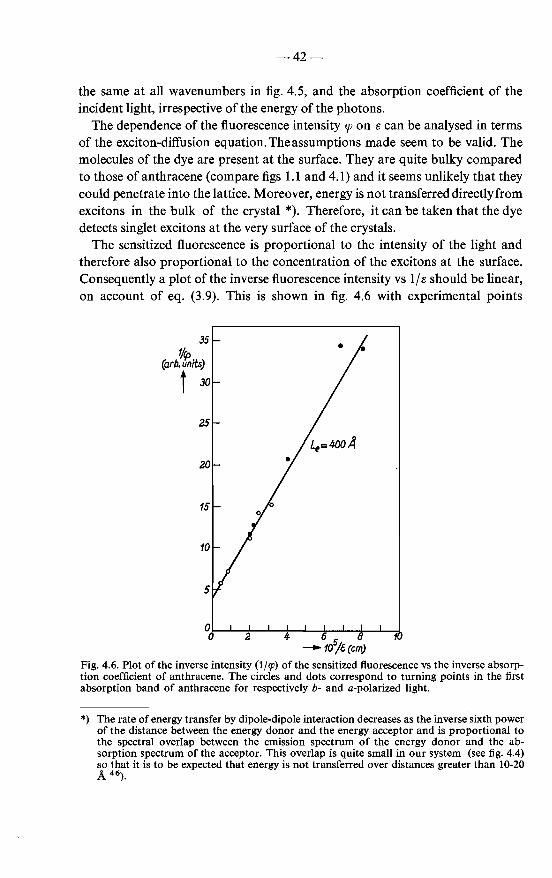
-42-
the same at all wavenumbers in fig. 4.5, and the absorption coefficient of the incident light, irrespective of the energy of the photons.
The dependence of the fluorescence intensity rp on 8 can be analysed in terms of the exciton-diffusion equation. The assumptions made seem to be valid. The molecules of the dye are present at the surface. They are quite bulky compared to those of anthracene (compare figs 1.1 and 4.1) and it seems unlikely that they could penetrate into the lattice. Moreover, energy is not transferred directly from excitons in the bulk of the crystal *). Therefore, it can be taken that the dye detects singlet excitons at the very surface of the crystals.
The sensitized fluorescence is proportional to the intensity of the light and therefore also proportional to the concentration of the excitons at the surface. Consequently a plot of the inverse fluorescence intensity vs 1/8 should be linear, on account of eq. (3.9). This is shown in fig. 4.6 with experimental points
35
~9> (arb. units)
i 30
or-~~~~~~~~-*~~ 0 2 4 65 8 10
-to/e(cm) Fig. 4.6. Plot of the inverse intensity (1/rp) of the sensitized fluorescence vs the inverse absorption coefficient of anthracene. The circles and dots correspond to turning points in the first absorption band of anthracene for respectively b- and a-polarized light.
*) The rate of energy transfer by dipole-dipole interaction decreases as the inverse sixth power of the distance between the energy donor and the energy acceptor and is proportional to the spectral overlap between the emission spectrum of the energy donor and the absorption spectrum of the acceptor. This overlap is quite small in our system (see fig. 4.4) so that it is to be expected that energy is not transferred over distances greater than 10-20 A 46).
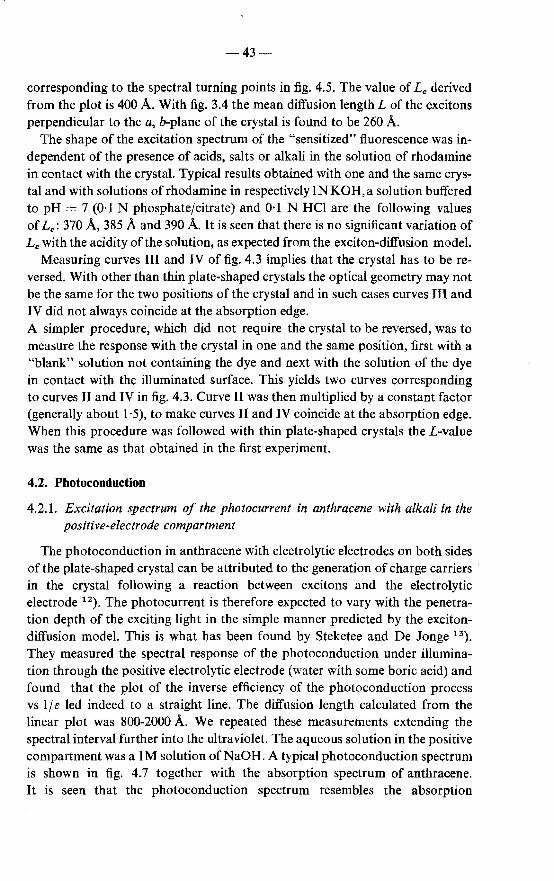
-43
corresponding to the spectral turning points in fig. 4.5. The value of Le derived from the plot is 400 A. With fig. 3.4 the mean diffusion length L of the excitons perpendicular to the a, b-plane of the crystal is found to be 260 A.
The shape of the excitation spectrum of the "sensitized" fluorescence was independent of the presence of acids, salts or alkali in the solution of rhodamine in contact with the crystal. Typical results obtained with one and the same crystal and with solutions of rhodamine in respectively 1NKOH,a solution buffered to pH = 7 (0·1 N phosphate/citrate) and 0·1 N HCl are the following values of Le: 370 A, 385 A and 390 A. It is seen that there is no significant variation of Le with the acidity of the solution, as expected from the exciton-diffusion model.
Measuring curves III and IV of fig. 4.3 implies that the crystal has to be reversed. With other than thin plate-shaped crystals the optical geometry may not be the same for the two positions of the crystal and in such cases curves III and IV did not always coincide at the absorption edge. A simpler procedure, which did not require the crystal to be reversed, was to measure the response with the crystal in one and the same position, first with a "blank" solution not containing the dye and next with the solution of the dye in contact with the illuminated surface. This yields two curves corresponding to curves II and IV in fig. 4.3. Curve II was then multiplied by a constant factor (generally about 1·5), to make curves II and IV coincide at the absorption edge. When this procedure was followed with thin plate-shaped crystals the L-value was the same as that obtained in the first experiment.
4.2. Pbotoconduction
4.2.1. Excitation spectrum of the photocurrent in anthracene with alkali in the positive-electrode compartment
The photoconduction in anthracene with electrolytic electrodes on both sides of the plate-shaped crystal can be attributed to the generation of charge carriers in the crystal following a reaction between excitons and the electrolytic electrode 12
). The photocurrent is therefore expected to vary with the penetration depth of the exciting light in the simple manner predicted by the excitondiffusion model. This is what has been found by Steketee and De Jonge 13).
They measured the spectral response of the photoconduction under illumination through the positive electrolytic electrode (water with some boric acid) and found that the plot of the inverse efficiency of the photoconduction process vs 1/ e led indeed to a straight line. The diffusion length calculated from the linear plot was 800-2000 A. We repeated these measurements extending the spectral interval further into the ultraviolet. The aqueous solution in the positive compartment was a 1M solution ofNaOH. A typical photoconduction spectrum is shown in fig. 4.7 together with the absorption spectrum of anthracene. It is seen that the photoconduction spectrum resembles the absorption
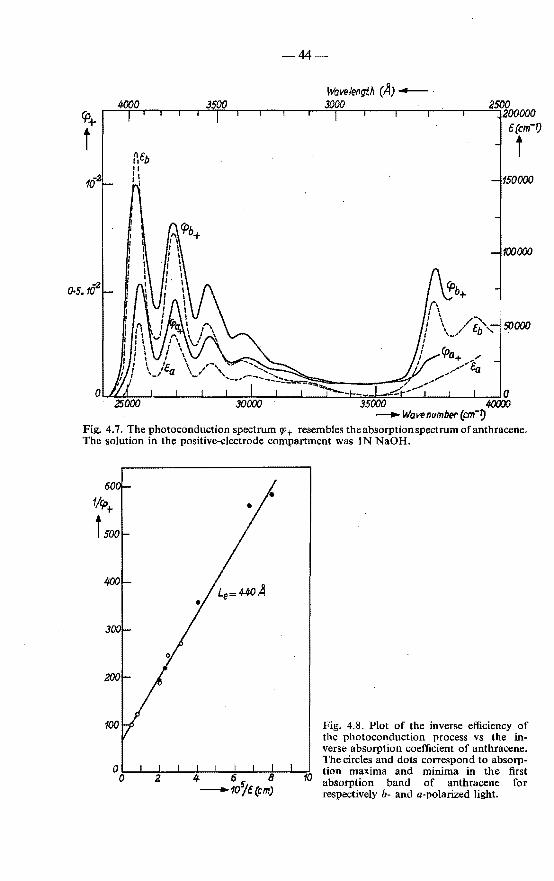
-2 o-5.10
-44
Wavelength (A) - ·
--~~-.-.-,r=3~~.--.--.--.~~~~--------.-~-.--~2500 . 200000 c(cm-1)
i
Fig. 4.7. The photoconduction spectrum If+ resembles theabsorptionspectrumofanthracene. The solution in the positive-electrode compartment was IN NaOH.
Fig. 4.8. Plot of the inverse efficiency of the photoconduction process vs the inverse absorption coefficient of anthracene. The circles and dots correspond to absorp-
0 ~...J...--,:!--1--!-...1.--J:-...L----k-.J....-:J.10 tion maxima and minima in the first 0 absorption band of anthracene for
respectively b- and a-polarized light.
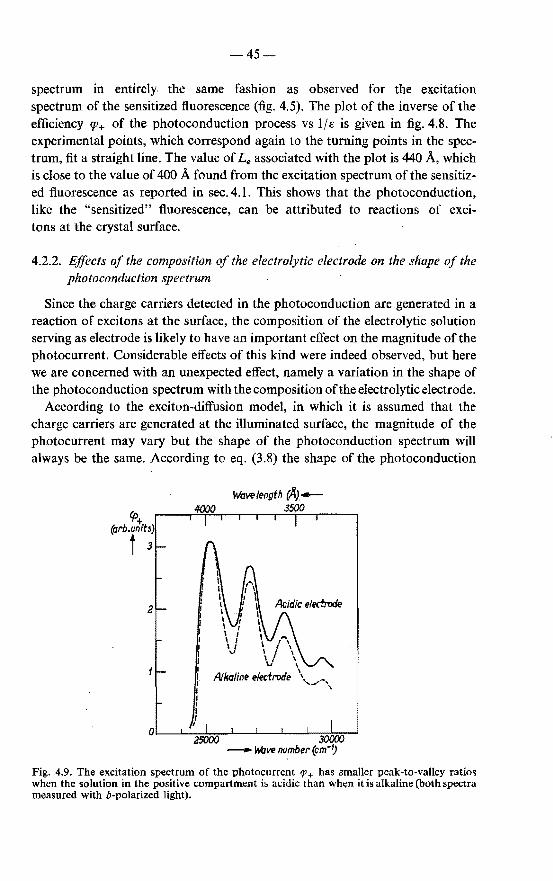
-45
spectrum in entirely. the same fashion as observed for the excitation spectrum of the sensitized fluorescence (fig. 4.5). The plot of the inverse of the efficiency Cf+ of the photoconduction process vs 1/s is given in fig. 4.8. The experimental points, which correspond again to the turning points in the spectrum, fit a straight line. The value of Le associated with the plot is 440 A, which is close to the value of 400 A found from the excitation spectrum of the sensitized fluorescence as reported in sec. 4.1. This shows that the photoconduction, like the "sensitized" fluorescence, can be attributed to reactions of excitons at the crystal surface.
4.2.2. Effects of the composition of the electrolytic electrode on the shape of the photoconduction spectrum
Since the charge carriers detected in the photoconduction are generated in a reaction of excitons at the surface, the composition of the electrolytic solution serving as electrode is likely to have an important effect on the magnitude of the photocurrent. Considerable effects of this kind were indeed observed, but here we are concerned with an unexpected effect, namely a variation in the shape of the photoconduction spectrum with the composition of the electrolytic electrode.
According to the exciton-diffusion model, in which it is assumed that the charge carriers are generated at the illuminated surface, the magnitude of the photocurrent may vary but the shape of the photoconduction spectrum will always be the same. According to eq. (3.8) the shape of the photoconduction
():>+ (arb.units)
i 3
Wavelength (AJ-4()()() 3500
f I I f f I
I I I I
l '
-IM:lve number (em"~
Fig. 4.9. The excitation spectrum of the photocurrent 'P+ has smaller peak-to-valley ratios when the solution in the positive compartment is acidic than when it is alkaline (both spectra measured with b-polarized light).
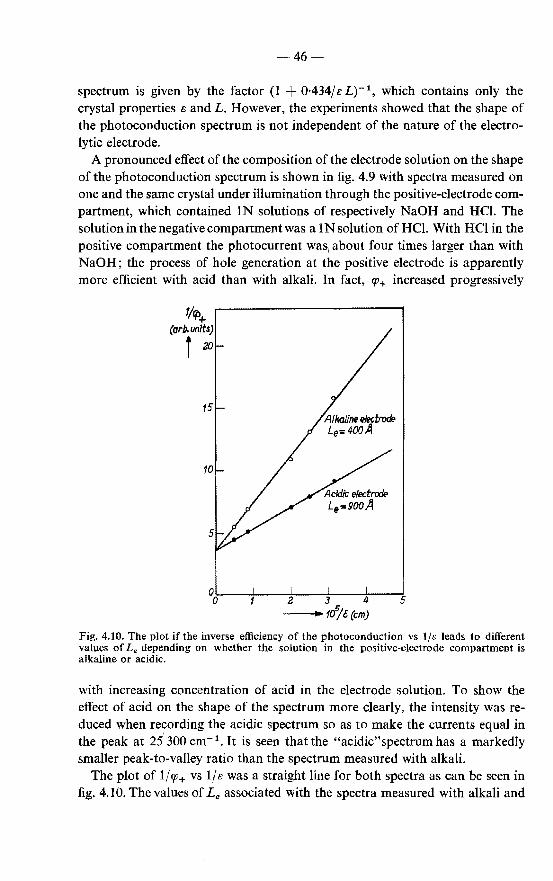
-46-
spectrum is given by the factor (1 + 0·434/ e L)- \ which contains only the crystal properties e and L. However, the experiments showed that the shape of the photoconduction spectrum is not independent of the nature of the electrolytic electrode.
A pronounced effect of the composition of the electrode solution on the shape of the photoconduction spectrum is shown in fig. 4.9 with spectra measured on one and the same crystal under illumination through the positive-electrode compartment, which contained lN solutions of respectively NaOH and HCI. The solution in the negative compartment was a 1 N solution of HCI. With HCI in the positive compartment the photocurrent was1 about four times larger than with NaOH; the process of hole generation at the positive electrode is apparently more efficient with acid than with alkali. In fact, q;+ increased progressively
Fig. 4.10. The plot if the inverse efficiency of the photoconduction vs 1/e leads to different values of L. depending on whether the solution in the positive-electrode compartment is alkaline or acidic.
with increasing concentration of acid in the electrode solution. To show the effect of acid on the shape of the spectrum more clearly, the intensity was reduced when recording the acidic spectrum so as to make the currents equal in the peak at 25 300 cm- 1
• It is seen that the "acidic" spectrum has a markedly smaller peak-to-valley ratio than the spectrum measured with alkali.
The plot of 1/q;+ vs 1/e was a straight line for both spectra as can be seen in fig. 4.10. The values of Le associated with the spectra measured with alkali and
-47-
acid were respectively 390 and 980 A. When photoconduction spectra were measured with aqueous solutions of various acidity in the positive compartment the lowest L-values were always found with dilute ( R!-J 1 N) solutions of alkali. These were typically 400-450 A, though somewhat higher, up to 600 A, with some crystals. Values a few hundred A higher than those measured with alkali were found with neutral aqueous solutions. The highest values, up to 1200 A, were found with I0- 2 - 1 N solutions of mineral acids. With 12 N HCl Le was lower again, namely about 800 A. With still more concentrated acid (24N H 2S04 ) the value of Le decreased to 500-600 A. It must be remarked that for all electrode solutions investigated the plot of lfcp+ vs 1/ s was a straight line.
It is clear that the values of Le derived from the photoconduction spectra cannot be taken to represent an exciton diffusion length. For the present the Lvalue derived from the photoconduction spectrum can be considered only as an experimental parameter which relates the shape of the photoconduction spectrum to that of the absorption spectrum.
4.2.3. Possible causes of variations in the shape of the photoconduction spectrum
It can be shown 47) that under the conditions of the experiments the photo
current is carried exclusively by charge carriers (holes) generated at the illuminated surface. Nevertheless the simple exciton-diffusion model apparently does not give a complete description of the photoconduction spectrum. In this connection it is important to note that various possible departures from the exciton-diffusion model (in which it is assumed that charge carriers are formed in reactions of excitons at the surface) would all tend to decrease the peak -to-valley ratios in the spectrum and thus lead to a high calculated value of Le. Some possibilities will be briefly considered:
(a) Excitons may be annihilated to give free charge carriers not only at the very surface, but also at "deeper centres" in an active layer of the crystal adjoining the surface and comprising several molecular layers. Deeper centres will enhance the activity of weakly absorbed light more than that of strongly absorbed light. This implies that deeper centres have a greater relative importance for the valleys than for the peaks in the photoconduction spectrum. The result will be a less resolved photoconduction spectrum.
Evidence of deeper centres formed by penetration of foreign molecules from the electrode solution into the crystal will be given in chapter 7.
(b) More than one kind of excitons (triplets in addition to singlets) may be active in producing charge carriers at the electrode. Absorption of light in anthracene gives rise primarily to singlet excitons, a small fraction of which is converted to the triplet state. The mean diffusion length of triplet excitons perpendicular to the t:t, b-plane of anthracene is known to be of the order of 106 A 48
),
48
whereas the diffusion length of singlet excitons is less than 103 A. Any contribution to the photocurrent from reactions of triplet excitons at the surface would again lead to a less resolved photoconduction spectrum on account of eq. (3.9).
It seems that triplet excitons can be important in the photoconduction of anthracene crystals doped with acridine and phenazine (sec. 5.3).
(c) It is possible that crystal fluorescence is absorbed by active "impurities" adsorbed at the crystal-water interface. When excitation of the impurity leads to generation of charge carriers, the excitation spectrum of the resulting photocurrent will resemble the excitation spectrum of the fluorescence intensity. The latter varies with wavenumber in a sense opposite to the variations of the absorption coefficient. Therefore also this effect tends to decrease the peak-tovalley ratios in the photoconduction spectrum. An example is the effect of the dye fluoresceine on the photoconduction discussed in ref. 45.
4.2.4. Validity of the exciton-diffusion model for the photocurrent measured with alkali in the positive compartment
As mentioned, the photoconduction spectrum is frequently less structured than corresponds to the exciton-diffusion model. The value of Le calculated from these spectra is therefore higher than the true "effective mean diffusion length". Of the photoconduction spectra discussed so far the one with the greatest peakto-valley ratios (and hence the lowest value of Le) was the spectrum measured with alkali in the positive compartment (fig. 4.9). The value of Le calculated from the photoconduction spectrum measured with alkali is in the same range as the value found from the excitation spectrum of the sensitized fluorescence. It seems therefore that the exciton-diffusion model is valid in the photoconduction with alkaline electrodes. A more rigid test is to compare the values of Le associated with the photoconduction spectrum and the sensitized-fluorescence spectrum measured on the same crystaL This was done in the experimental arrangement for measuring the sensitized fluorescence but with the crystal mounted on the cell for measuring photocurrents diagrammed in fig. 2.4a. The positive-electrode compartment was turned to the incident Jight. The measurements were started with a 1 M solution of alkali in the positive compartment. Both the photocurrent and the response of the photomultiplier were measured. The solution in the positive compartment was then replaced by a w- 6 M solution of rhodamine in 1 M alkali after which the measurements were repeated. The sequence of measurements was repeated a number of times on one and the same crystaL In between, the surface of the crystal was rinsed with alkali, to remove the dye, and with benzene, to expose a fresh surface. Results expressed in terms of the experimental parameter Le are given in columns 2 and 3 of table
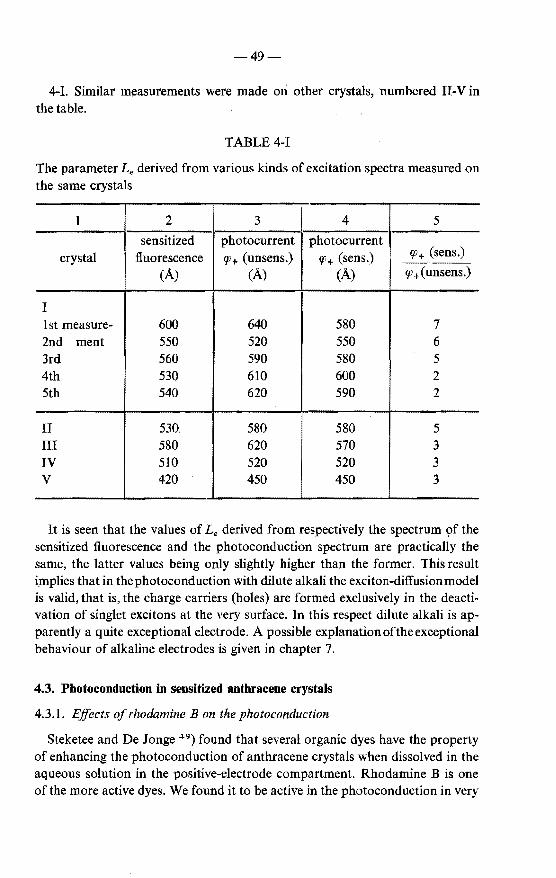
-49-
4-I. Similar measurements were made on other crystals, numbered II-V in the table.
TABLE 4-I
The parameter Le derived from various kinds of excitation spectra measured on the same crystals
1 2 3 4 5
sensitized photocurrent photocurrent crystal fluorescence fP+ (unsens.) fP+ (sens.) fP+ (sens.)
------(A) (A) (A) fP+(unsens.)
I 1st measure- 600 640 580 7 2nd nient 550 520 550 6 3rd 560 590 580 5 4th 530 610 600 2 5th 540 620 590 2
II 530. 580 580 5 III 580 620 570 3 IV 510 520 520 3 v 420 450 450 3
It is seen that the values of L., derived from respectively the spectrum 9f the sensitized fluorescence and the photoconduction spectrum are practically the same, the latter values being only slightly higher than the former. This result i.mplies that in thephotoconduction with dilute alkali the exciton-diffusionmodel is valid, that is, the charge carriers (holes) are formed exclusively in the deactivation of singlet excitons at the very surface. In this respect dilute alkali is apparently a quite exceptional electrode. A possible explanationoftheexceptional behaviour of alkaline electrodes is given in chapter 7.
4.3. Pbotoconduction in sensitized anthracene crystals
4.3.1. Effects of rhodamine B on the photoconduction
Steketee and De Jonge 49) found that several organic dyes have the property
of enhancing the photoconduction of anthracene crystals when dissolved in the aqueous solution in the positive-electrode compartment. Rhodamine B is one of the more active dyes. We found it to be active in the photoconduction in very
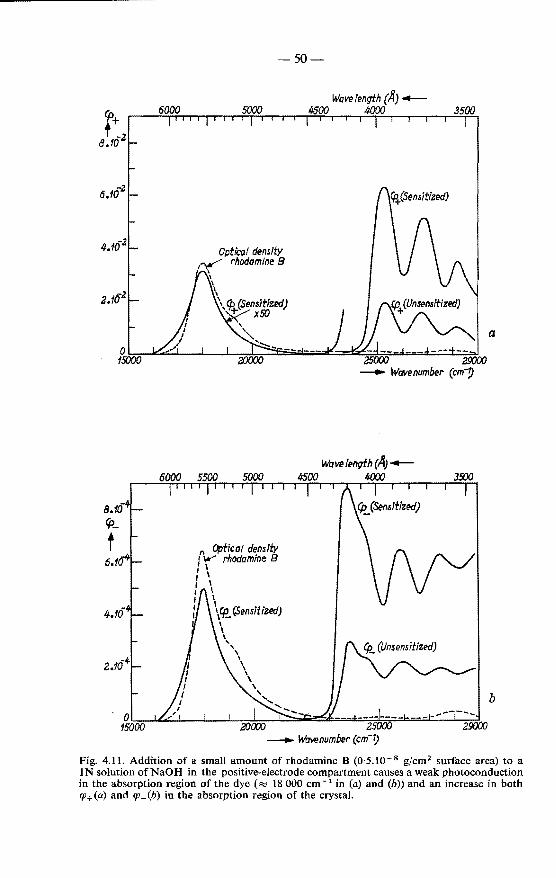
9>+ t ~z
8.10
-50-
Optical density 1~ rhodamine B
\ \ \
\ \~(Sensitized) ,+ x50
3500
a
Fig. 4.11. Addition of a small amount of rhodamine B (0·5.10- 8 gjcm2 surface area) to a IN solution ofNaOH in the positive-electrode compartment causes a weak photoconduction in the absorption region of the dye ( "<:! 18 000 cm- 1 in (a) and (b)) and an increase in both CfJ+(a) and q;_(b) in the absorption region of the crystal.
-51-
small amounts, the same as were used in measurements of the sensitized fluorescence. Rhodamine retains its colour and activity in alkaline solutions, unlike certain other active dyes like methylene blue and proflavine. The effect of rhodamine B on the photoconduction of anthracene is illustrated in figs 4.1la and b, showing photoconduction spectra measured before and after addition of rhodamine B to an alkaline solution in the positive-electrode compartment. The spectra (a) of <f+ were measured under illumination through the positive compartment, those of <p~ (b) under illumination through the negative compartment. It is seen that IP+ and If!- are each increased about 3 times. Another feature is a "sensitization", meaning that the crystal has become photosensitive outside its absorption region, at wavenumbers around 18 000 cm- 1 , where light is absorbed by the dye. In the following we shall briefly discuss these features in so far as they are important for the shape of the photoconduction spectrum (see also ref. 45).
In the absorption region of the dye the excitation spectrum of the photocurrent duplicates the optical-density spectrum of a solution of the dye (indicated by the dashed curves in fig. 4.11 ), so that the photocurrent is proportional to the amount oflight absorbed by the dye. Dye molecules excited by the incident light are evidently able to inject holes into the crystal by abstracting electrons from it. Since the crystal is transparent at 18 000 em- 1
, the small peak at 18 000 em- 1
has about the same magnitude under illumination through the positive and the negative electrode (If!+ and qy_).
The proportion of the incident light absorbed by all the dye molecules in the positive solution is less than w- 3 in the absorption peak of the dye. Since only part of the dye is adsorbed at the surface of the crystal and since only part of the excited dye molecules will be active in the photoconduction it is understandable that the efficiency of the "sensitized" photoconduction with respect to the total number of incident quanta is extremely small. In the absorption peak of the dye at 18 000 cm- 1 qy+ is only 6.10-4,as against 6.10- 2 in the first anthracene peak at 25 300 cm- 1 • In the absorption region of the crystal the dye absorbs much less of the incident light than in its absorption peak. Absorption of incident light by the dye does not, therefore, contribute to IP+ in the absorption region of the crystal.
Since excited dye molecules can generate holes in the crystal, a possible explanation of the current-increasing effect of the dye on IP+ and rp_ would be excitation of the dye by crystal fluorescence. Excitation of the dye by crystal fluorescence will contribute equal amounts to qy+ and If!- on account of the fact that the long-wave fluorescence, which is most active in exciting the dye, is many times reflected between the faces of the crystal. The increase in If!- is 3.10- 4 so that the increase in IP+ caused by absorption of crystal fluorescence by the dye is also at most about 3.10-4 or only 1% of the actual increase in IP+·
A remaining possibility is to assume a generation of charge carriers as the re-
-52-
sult of an interaction of the dye with excitons at the surface. In this case it is to be expected that cp_ will increase in the same ratio as fP+· The reason is that before sensitization cp_ and CfJ+ are both efficiencies of hole currents injected at the positive electrode by reactions of excitons which are generated, in the case of cp_, by reabsorption of crystal fluorescence in the crystal near the positive electrode 47). The observed relative increase is indeed about the same for cp_ (2·9 times) as for CfJ+ (3·3 times). This leaves no room for a contribution from absorption of crystal fluorescence by the dye to cp_, let alone to CfJ+. It is concluded that the photocurrent CfJ+ increases as a result of an interaction of excitons with the adsorbed dye. The first step is probably energy transfer from excitons to the dye, giving rise to excited dye molecules. These can emit a sensitized fluorescence (sec. 4.1) but can apparently also abstract anelectron from the crystal leaving a free hole in the crystal. Some evidence for this picture is given in ref. 45.
4.3.2. Effect of sensitization on the shape of the photoconduction spectrum
As we saw, the photocurrent CfJ+ measured with alkali on an unsensitized crystal has its origin in reactions of singlet excitons at the very surface of the crystal. According to the foregoing the increase in CfJ+ caused by the dye also has its origin in reactions of excitons at the surface. Provided only singlet excitons interact with the dye, it is to be expected that the shape of the photoconduction spectrum will not be altered by the sensitization. This was ascertained by measuring photoconduction spectra before and after sensitization of crystals in contact with an alkaline electrode solution. The measurements of the photoconduction were made together with those of the sensitized fluorescence described in sec. 4.2. When the inverse of the photocurrent measured on sensitiz~d crystals was plotted vs 1/ s, the result was a straight line. Thevalueoftheparameter Le derived from the straight lines is given in column 4 of table 4-1. It is seen that the reproducibility of Le determined from the photoconduction spectrum of sensitized crystals is very good, being 2% for the values determined in consecutive measurements on the sensitized crystal I. The values in column 4 differ only 5% from those in column 2, which are the values derived from the measurements of the fluorescence. This shows that the effect of rhodamine on the photoconduction of anthracene involves essentially the deactivation of singlet excitons at the very surface. Measurement of the photoconduction on sensitized anthracene crystals with an alkaline electrode solution can thus give reliable information on the exciton diffusion length in the crystal.
The effect of rhodamine on the magnitude of the photocurrent is given in column 5. The increase in the photocurrent is between 2 and 7 times. Rhodamine enhanced the photoconduction of anthracene not only when the aqueous solution in the positive-electrode compartment was alkaline but also when it was
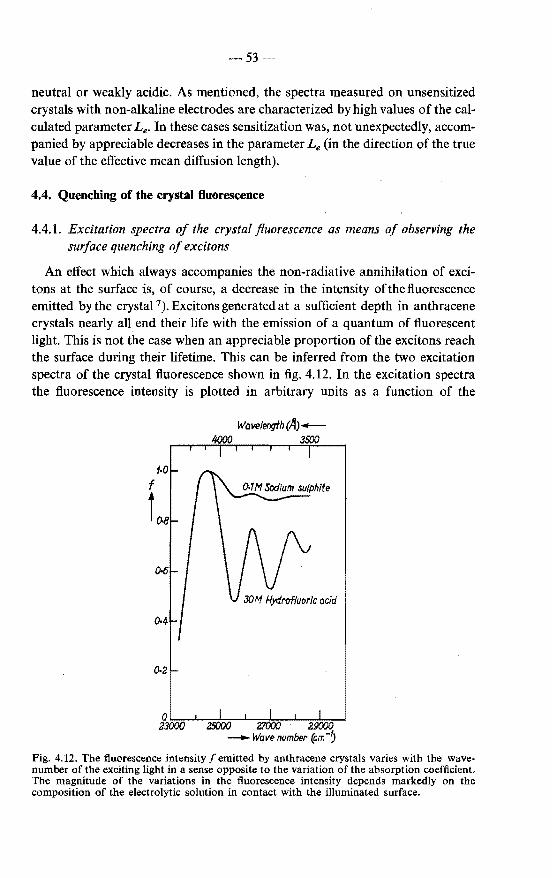
-53-
neutral or weakly acidic. As mentioned, the spectra measured on unsensitized crystals with non-alkaline electrodes are characterized by high values of the calculated parameter Le. In these cases sensitization was, not unexpectedly, accompanied by appreciable decreases in the parameter Le (in the direction of the true value of the effective mean diffusion length).
4.4. Quenching of the crystal ftuorescence
4.4.1. Excitation spectra of the crystal fluorescence as means of observing the surface quenching of excitons
An effect which always accompanies the non-radiative annihilation of excitons at the surface is, of course, a decrease in the intensity of the fluorescence emitted by the crystal 7). Excitons generated at a sufficient depth in anthracene crystals nearly all end their life with the emission of a quantum of fluorescent light. This is not the case when an appreciable proportion of the excitons reach the surface during their lifetime. This can be inferred from the two excitation spectra of the crystal fluorescence shown in fig. 4.12. In the excitation spectra the fluorescence intensity is plotted in arbitrary units as a function of the
Fig. 4.12. The fluorescence intensity f emitted by anthracene crystals varies with the wavenumber of the exciting light in a sense opposite to the variation of the absorption coefficient. The magnitude of the variations in the fluorescence intensity depends markedly on the composition of the electrolytic solution in contact with the illuminated surface.
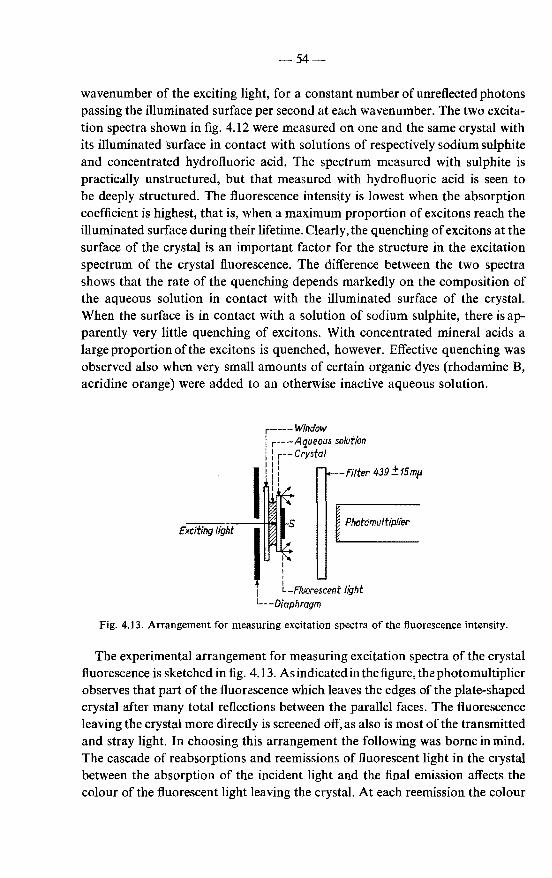
-54
wavenumber of the exciting light, for a constant number of unreflected photons passing the illuminated surface per second at each wavenumber. The two excitation spectra shown in fig. 4.12 were measured on one and the same crystal with its illuminated ·surface in contact with solutions of respectively sodium sulphite and concentrated hydrofluoric acid. The spectrum measured with sulphite is practically unstructured, but that measured with hydrofluoric acid is seen to be deeply structured. The fluorescence intensity is lowest when the absorption coefficient is highest, that is, when a maximum proportion of excitons reach the illuminated surface during their lifetime. Clearly, the quenching of excitons at the surface of the crystal is an important factor for the structure in the excitation spectrum of the crystal fluorescence. The difference between the two spectra shows that the rate of the quenching depends markedly on the composition of the aqueous solution in contact with the illuminated surface of the crystal. When the surface is in contact with a solution of sodium sulphite, there is apparently very little quenching of excitons. With concentrated mineral acids a largeproportionofthe excitons is quenched, however. Effective quenching was observed also when very small amounts of certain organic dyes (rhodamine B, acridine orange) were added to an otherwise inactive aqueous solution.
Exciting light
Wfndow r -- -Aqueous sofution 1 r-- Crystal '• I, ,, II I•
--Filter 439 ± 15 mp
Fig. 4.13. Arrangement for measuring excitation spectra of the fluorescence intensity.
The experimental arrangement for measuring excitation spectra of the crystal fluorescence is sketched in fig. 4.13. Asindicatedin the figure, the photomultiplier observes that part of the fluorescence which leaves the edges of the plate-shaped crystal after many total reflections between the parallel faces. The fluorescence leaving the crystal more directly is screened off, as also is most of the transmitted and stray light. In choosing this arrangement the following was borne in mind. The cascade of reabsorptions and reemissions of fluorescent light in the crystal between the absorption of the incident light and the final emission affects the colour of the fluorescent light leaving the crystal. At each reemission the colour
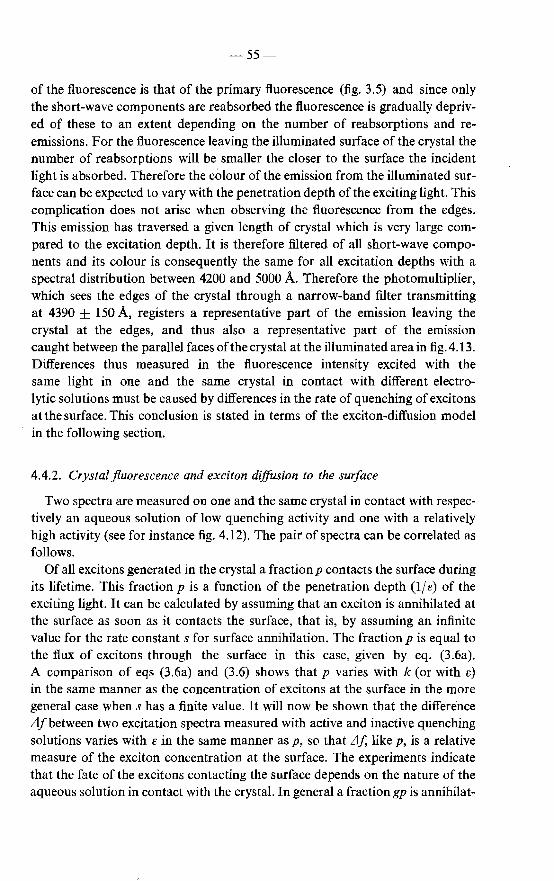
-55--
of the fluorescence is that of the primary fluorescence (fig. 3.5) and since only the short-wave components are reabsorbed the fluorescence is gradually deprived of these to an extent depending on the number of reabsorptions and reemissions. For the fluorescence leaving the illuminated surface of the crystal the number of reabsorptions will be smaller the closer to the surface the incident light is absorbed. Therefore the colour of the emission from the illuminated surface can be expected to vary with the penetration depth of the exciting light. This complication does not arise when observing the fluorescence from the edges. This emission has traversed a given length of crystal which is very large compared to the excitation depth. It is therefore filtered of all short-wave components and its colour is consequently the same for all excitation depths with a spectral distribution between 4200 and 5000 A. Therefore the photomultiplier, which sees the edges of the crystaJ through· a narrow-band filter transmitting at 4390 ± 150 A, registers a representative part of the emission leaving the crystal at the edges, and thus also a representative part of the emission caught between the parallel faces of the crystal at the illuminated area in fig.4.13. Differences thus measured in the fluorescence intensity excited with the same light in one and the same crystal in contact with different electrolytic solutions must be caused by differences in the rate of quenching of excitons at the surface. This conclusion is stated in terms of the exciton-diffusion model in the following section.
4.4.2. Crystal fluorescence and exciton diffusion to the surface
Two spectra are measured on one and the same crystal in contact with respectively an aqueous solution of low quenching activity and one with a relatively high activity (see for instance fig. 4.12). The pair of spectra can be correlated as foJlows.
Of all excitons generated in the crystal a fractionp contacts the surface during its lifetime. This fraction pis a function of the penetration depth (1/e) of the exciting light. It can be calculated by assuming that an exciton is annihilated at the surface as soon as it contacts the surface, that is, by assuming an infinite value for the rate constant s for surface annihilation. The fraction p is equal to the flux of excitons through the surface in this case, given by eq. (3.6a). A comparison of eqs (3.6a) and (3.6) shows that p varies with k (or with s) in the same manner as the concentration of excitons at the surface in the more general case when s has a finite value. It will now be shown that the difference L1fbetween two excitation spectra measured with active and inactive quenching solutions varies with s in the same manner asp, so that Llf, like p, is a relative measure of the exciton concentration at the surface. The experiments indicate that the fate of the excitons contacting the surface depends on the nature of the aqueous solution in contact with the crystal. In general a fraction gp is annihilat-
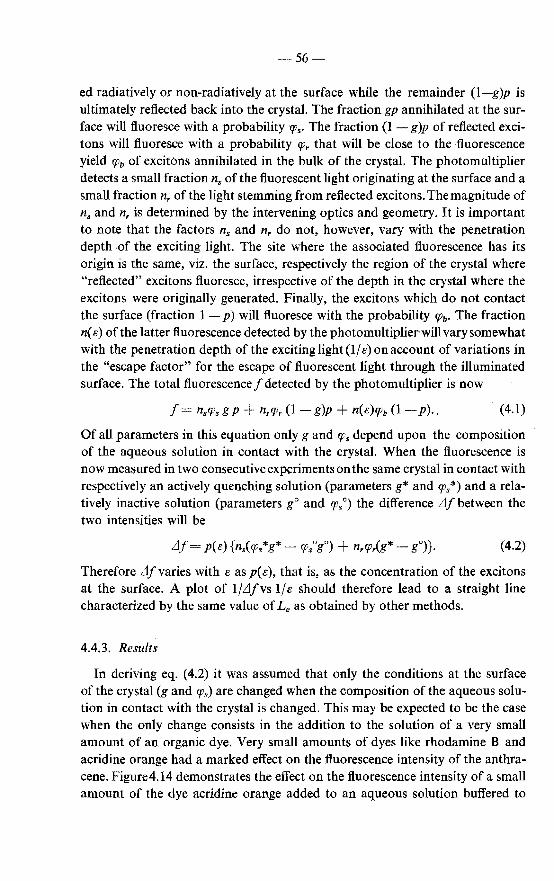
56-
ed radiatively or non-radiatively at the surface while the remainder (1-g)p is ultimately reflected back into the crystal. The fraction gp annihilated at the surface will fluoresce with a probability r's· The fraction (I - g)p of reflected excitons will fluoresce with a probability r'r that will be close to the fluorescence yield r'o of excitons annihilated in the bulk of the crystal. The photomultiplier detects a small fraction n. of the fluorescent light originating at the surface and a small fraction n, of the light stemming from reflected excitons. The magnitude of n. and n. is determined by the intervening optics and geometry. lt is important to note that the factors n. and n, do not, however, vary with the penetration depth of the exciting light. The site where the associated fluorescence has its origin is the same, viz. the surface, respectively the region of the crystal where "reflected" excitons fluoresce, irrespective of the depth in the crystal where the excitons were originally generated. Finally, the excitons which do not contact the surface (fraction 1-p) will fluoresce with the probability r'b· The fraction n( e) of the latter fluorescence detected by the photomultiplier will vary somewhat with the penetration depth of the excitinglight(l/e)onaccount of variations in the ''escape factor" for the escape of fluorescent light through the illuminated surface. The total fluorescence f detected by the photomultiplier is now
nsr's g P + nrr'r (1- g)p + n(e)r'o (1-p)., (4.1)
Of all parameters in this equation only g and r's depend upon the composition of the aqueous solution in contact with the crystal. When the fluorescence is now measured in two consecutiveexperimentsonthe same crystal in contact with respectively an actively quenching solution (parameters g* and o/s *) and a relatively inactive solution (parameters go and r's 0 ) the difference iJj between the two intensities will be
(4.2)
Therefore iJjvaries withe asp(e), that is, as the concentration of the excitons at the surface. A plot of 1/iJfvs 1/e should therefore lead to a straight line characterized by the same value of Le as obtained by other methods.
4.4.3. Results
In deriving eq. (4.2) it was assumed that only the conditions at the surface of the crystal (g and r's) are changed when the composition of the aqueous solution in contact with the crystal is changed. This may be expected to be the case when the only change consists in the addition to the solution of a very small amount of an organic dye. Very small amounts of dyes like rhodamine B and acridine orange had a marked effect on the fluorescence intensity of the anthracene. Figure4.14 demonstrates the effect on the fluorescence intensity of a small amount of the dye acridine orange added to an aqueous solution buffered to
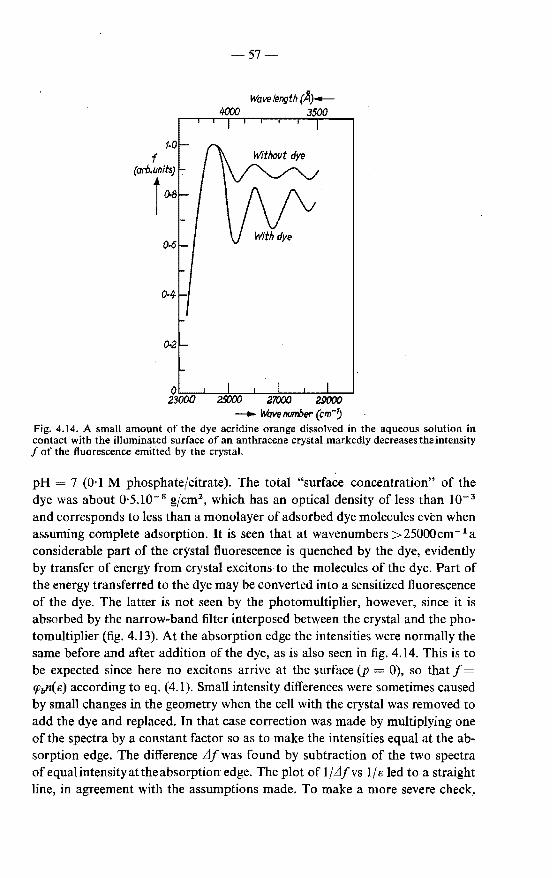
-57-
Wavelength(A)-4000 3500
iJ·7ooo~..__25000=;;;;---'---=27000=::--~--=29000-:":-:--=--' - Wavenumber (cm-5
Fig. 4.14. A small amount of the dye acridine orange dissolved in the aqueous solution in contact with the illuminated surface of an anthracene crystal markedly decreases the intensity f of the fluorescence emitted by the crystal.
pH 7 (0·1 M phosphate/citrate). The total "surface concentration" of the dye was about O·S.l0- 8 gfcm2 , which has an optical density of less than 10- 3
and corresponds to less than a monolayer of adsorbed dye molecules even when assuming complete adsorption. It is seen that at wavenumbers >25000cm- 1 a considerable part of the crystal fluorescence is quenched by the dye, evidently by transfer of energy from crystal excitons to the molecules of the dye. Part of the energy transferred to the dye may be converted into a sensitized fluorescence of the dye. The latter is not seen by the photomultiplier, however, since it is absorbed by the narrow-band filter interposed between the crystal and the photomultiplier (fig. 4.13). At the absorption edge the intensities were normally the same before and after addition of the dye, as is also seen in fig. 4.14. This is to be expected since here no excitons arrive at the surface (p = 0), so that f = q;bn(s) according to eq. (4.1). Small intensity differences were sometimes caused by small changes in the geometry when the cell with the crystal was removed to add the dye and replaced. In that case correction was made by multiplying one of the spectra by a constant factor so as to make the intensities equal at the absorption edge. The difference iJf was found by subtraction of the two spectra of equalintensityattheabsorption edge. The plot of lfiJfvs 1/e led to a straight line, in agreement with the assumptions made. To make a more severe check,
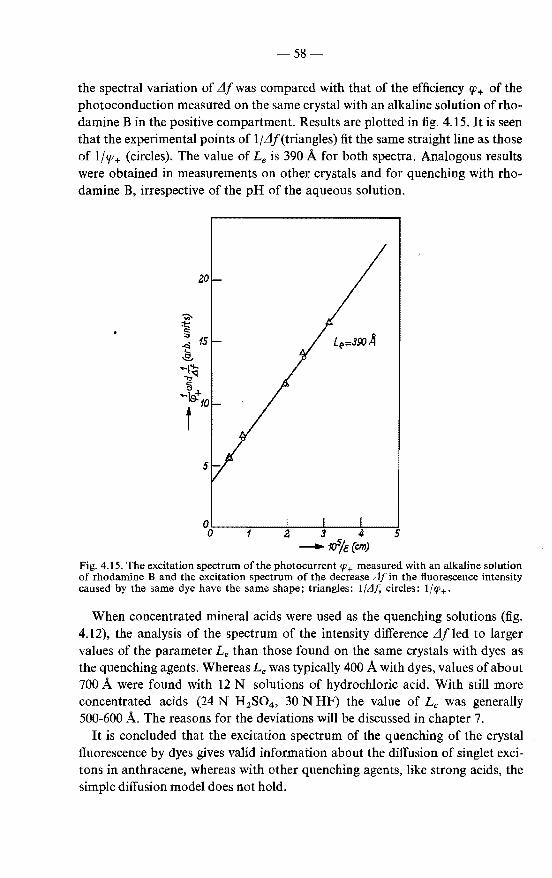
-58-
the spectral variation of Llfwas compared with that of the efficiency q;+ of the photoconduction measured on the same crystal with an alkaline solution of rhodamine Bin the positive compartment. Results are plotted in fig. 4.15. It is seen that the experimental points of 1/Lif(triangles) fit the same straight line as those of lfq;+ (circles). The value of Leis 390 A for both spectra. Analogous results were obtained in measurements on other crystals and for quenching with rhodamine B, irrespective of the pH of the aqueous solution.
Fig. 4.15. The excitation spectrum of the photocurrent 'P+ measured with an alkaline solution of rhodamine B and the excitation spectrum of the decrease .dj in the fluorescence intensity caused by the same dye have the same shape; triangles: 1//Jf. circles: 1/rp+.
When concentrated mineral acids were used as the quenching solutions (fig. 4.12), the analysis of the spectrum of the intensity difference Llfled to larger values of the parameter Le than those found on the same crystals with dyes as the quenching agents. Whereas Le was typically 400 A with dyes, values of about 700 A were found with 12 N solutions of hydrochloric acid. With still more concentrated acids (24 N H2S04 , 30 N HF) the value of Le was generally 500-600 A. The reasons for the deviations will be discussed in chapter 7.
It is concluded that the excitation spectrum of the quenching of the crystal fluorescence by dyes gives valid information about the diffusion of singlet excitons in anthracene, whereas with other quenching agents, like strong acids, the simple diffusion model does not hold.
-59-
4.5. Conclusions with respect to the validity of the exciton-diffusion model in the analysis of excitation spectra
In the exciton-diffusion model it is assumed that the observed effect has its origin in the. annihilation of one type of excitons at the very surface of the crystal. For such effects the shape of the excitation spectrum is determined by the nature of the crystal. This picture holds good in a number of cases. This is true in the first place for effects caused by organic dyes, including the emission of a sensitized fluorescence, photoinjection of holes (sensitized photoconduction) and quenching of the crystal fluorescence. All these effects are due to energy transfer from crystal excitons to dye molecules present at the surface of the crystals (the molecules of the dye are too bulky to penetrate into the crystal lattice). The quenching of the crystal fluorescence and the sensitized fluorescence are clearly caused by energy transfer from singlet excitons. The range of energy transfer is short (20 A or less) compared to the effective mean diffusion length of about 400 A of the excitons. Therefore the effects caused by dyes are a measure of the concentration of singlet excitons at the very surface. The only other effect with an excitation spectrum of the same shape as observed with dyes seems to be the photoconduction with dilute solutions of alkali as the electrode. This is found not only in the photoconduction of anthracene, but also for other aromatic hydrocarbons (sees 5.4, 5.5). By analysing the excitation spectrum of any of the effects caused by dyes, or of the photocurrent measured with alkaline electrode solutions, the mean diffusion length of singlet excitons in the crystal can be found.
In the photoconduction alkaline electrode solutions are apparently quite exceptional. The causes of the deviations from the exciton-diffusion model that are found in excitation spectra of the photocurrent (and also of the crystal fluorescence) measured on crystals in contact with acidic and neutral electrode solutions will be discussed in chapter 7.
60-
5. EXCITON DIFFUSION IN VARIOUS CRYSTALS
In this chapter we shall try to obtain information on the diffusion of excitons in crystals of a number of aromatic hydrocarbons. The information is drawn from experiments of the type described in the preceding chapter for solutiongrown anthracene crystals. The following materials are investigated: anthracene crystals grown by various techniques, doped anthracene crystals, pyrene, two modifications of perylene, tetracene and phenanthrene.
5.1. Exciton diffusion in anthracene; absorption spectrum of anthracene for light polarized in the a,c-plane
5.1.1. Effect of mode of preparation of the crystals on the exciton diffusion length
The experiments discussed in the foregoing chapter were made on anthracene crystals grown from solutions in dichloroethane. These crystals are rather impure because they contain appreciable amounts of solvent molecules (sec. 2.1.2). It might be that these have an adverse effect on the lifetime and hence on the diffusion length of the excitons. It was of interest, therefore, to investigate whether crystals grown in other ways (from other solvents, by sublimation or from a melt) would behave differently. Crystals grown from solutions in toluene and benzene and by sublimation in evacuated sealed tubes give results analogous to those obtained with crystals grown from solutions in dichloroethane. However, a given batch of crystals grown from dichloroethane was more homogeneous with respect to the shape and ostensible perfection of the crystals and also gave values of the exciton diffusion length that were grouped more closely together, such as those of crystals I, II and III in table 4-I. These values (500-600 A) are unusually high. Normally the values of Le ranged from 400 to 450 A. Crystals of one and the same batch grown from solutions in toluene or benzene or by sublimation were more variable, both as regards their shape and the Le
values of the photoconduction spectrum. An apparently very perfect, thin (5 11-m) sublimation flake had 550 A whereas another thick crystal from the same batch had 300 A. A well-developed crystal grown from toluene had 400 A while a poor specimen had only 200 A. The starting material was the same purified anthracene in all cases. This suggests that it is not so much the chemical purity of the crystals, such as the presence of solvent molecules in crystals grown from solutions and the absence of solvent molecules in sublimation flakes, as the physical perfection of the crystal lattice which is most important for the exciton diffusion length. Of course this is no longer true with specific impurities like tetracene that act as traps for excitons. These have a quite dramatic effect on the exciton diffusion length, as will be shown in sec. 5.2.
The importance of physical imperfections for the diffusion length of the
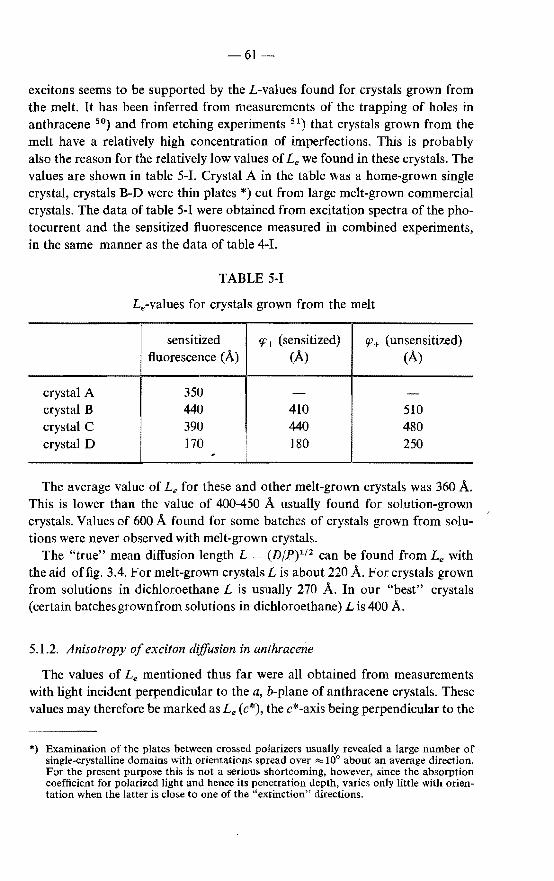
-61
excitons seems to be supported by the £-values found for crystals grown from the melt. It has been inferred from measurements of the trapping of holes in anthracene 50) and from etching experiments 51) that crystals grown from the melt have a relatively high concentration of imperfections. This is probably also the reason for the relatively low values of Le we found in these crystals. The values are shown in table 5-I. Crystal A in the table was a home-grown single crystal, crystals B-D were thin plates*) cut from large melt-grown commercial crystals. The data of table 5-1 were obtained from excitation spectra of the photocurrent and the sensitized fluorescence measured in combined experiments, in the same manner as the data of table 4-1.
TABLE 5-I
Le·values for crystals grown from the melt
sensitized P+ (sensitized) q; + ( unsensitized) fluorescence (A) (A) (A)
crystal A 350 - -crystal B 440 410 510 crystal C 390 440 480 crystal D 170 180 250
,
The average value of Le for these and other melt-grown crystals was 360 A. This is lower than the value of 400-450 A usually found for solution-grown crystals. Values of 600 A found for some batches of crystals grown from solutions were never observed with melt-grown crystals.
The "true" mean diffusion length L (D/P) 112 can be found from Le with the aid of fig. 3.4. For melt-grown crystals Lis about 220 A. For crystals grown from solutions in dichloroethane L is usually 270 A. In our "best" crystals (certain batches grown from solutions in dichloroethane) Lis 400 A.
5.1.2. Anisotropy of exciton diffusion in anthracene
The values of Le mentioned thus far were all obtained from measurements with light incident perpendicular to the a, b-plane of anthracene crystals. These values may therefore be marked as Le (c*), the c*-axis being perpendicular to the
*) Examination of the plates between crossed polarizers usually revealed a large number of single-crystalline domains with orientations spread over ""10° about an average direction. For the present purpose this is not a serious shortcoming, however, since the absorption coefficient for polarized light and hence its penetration depth, varies only little with orientation when the latter is close to one of the "extinction" directions.
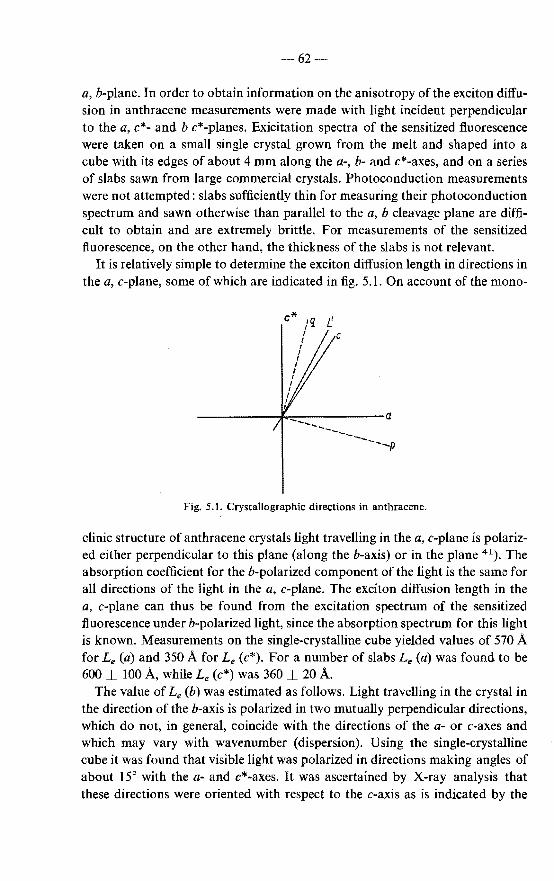
62-
a, b-plane. In order to obtain information on the anisotropy of the exciton diffusion in anthracene measurements were made with light incident perpendicular to the a, c*- and b c*-planes. Exicitation spectra of the sensitized fluorescence were taken on a small single crystal grown from the melt and shaped into a cube with its edges of about 4 rom along the a-, b- and c*-axes, and on a series of slabs sawn from large commercial crystals. Photoconduction measurements were not attempted: slabs sufficiently thin for measuring their photoconduction spectrum and sawn otherwise than parallel to the a, b cleavage plane are difficult to obtain and are extremely brittle. For measurements of the sensitized fluorescence, on the other hand, the thickness of the slabs is not relevant.
It is relatively simple to determine the exciton diffusion length in directions in the a, c-plane, some of which are indicated in fig. 5.1. On account of the mono-
c
-----------*~-~--~------------a ~-------~-p
Fig. 5.1. Crystallographic directions in anthracene.
clinic structure of anthracene crystals light travelling in the a, c-plane is polarized either perpendicular to this plane (along the b-axis) or in the plane 41). The absorption coefficient for the b-polarized component of the light is the same for all directions of the light in the a, c-plane. The exciton diffusion length in the a, c-plane can thus be found from the excitation spectrum of the sensitized fluorescence under b-polarized light, since the absorption spectrum for this light is known. Measurements on the single-crystalline cube yielded values of 570 A for Le (a) and 350 A for Le (c*). For a number of slabs Le (a) was found to be 600 ± 100 A, whileLe (c*) was 360 ± 20 A.
The value of Le (b) was estimated as follows. Light travelling in the crystal in the direction of the b-axis is polarized in two mutually perpendicular directions, which do not, in general, coincide with the directions of the a- or c-axes and which may vary with wavenumber (dispersion). Using the single-crystalline cube it was found that visible light was polarized in directions making angles of about 15° with the a- and c*-axes. It was ascertained by X-ray analysis that these directions were oriented with respect to the c-axis as is indicated by the
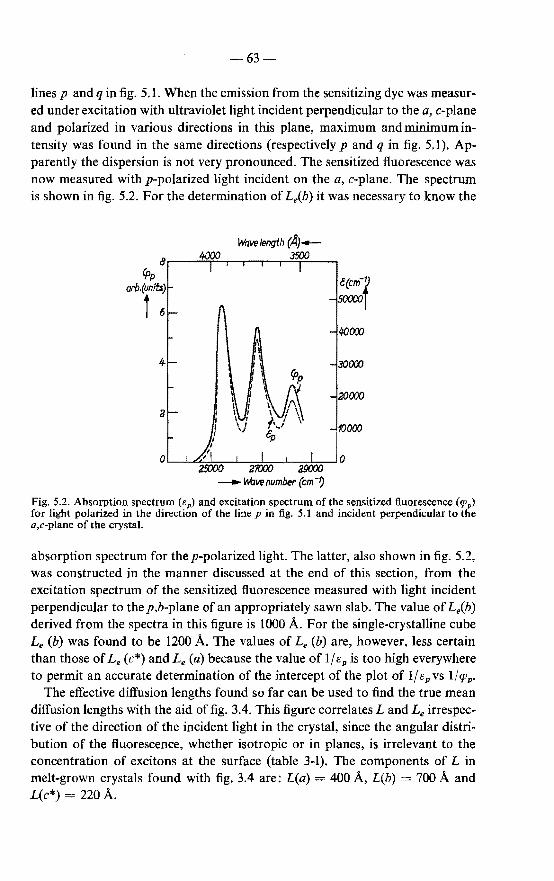
-63-
lines p and q in fig. 5.1. When the emission from the sensitizing dye was measured under excitation with ultraviolet light incident perpendicular to the a, c-plane and polarized in various directions in this plane, maximum andminimumintensity was found in the same directions (respectively p and q in fig. 5.1). Apparently the dispersion is not very pronounced. The sensitized fluorescence was now measured with p-polarized light incident on the a, c-plane. The spectrum is shown in fig. 5.2. For the determination of Le(b) it was necessary to know the
Wavelength cA;-8.---~~~.-.-,--.~~~--~
(pp arb.(units)
t 6
e(cm~r
Fig. 5.2. Absorption spectrum (ep) and excitation spectrum of the sensitized fluorescence (p0 )
for light polarized in the direction of the line pin fig. 5.1 and incident perpendicular to the a,c-plane of the crystal.
absorption spectrum for the p-polarized light. The latter, also shown in fig. 5.2, was constructed in the manner discussed at the end of this section, from the excitation spectrum of the sensitized fluorescence measured with light incident perpendicular to the p,b-plane of an appropriately sawn slab. The value of Le(b) derived from the spectra in this figure is 1000 A. For the single-crystalline cube Le (b) was found to be 1200 A. The values of Le (b) are, however, less certain than those of Le (c*) and L., (a) because the value of 1( Bv is too high everywhere to permit an accurate determination of the intercept of the plot of lfev vs 1/g;p.
The effective diffusion lengths found so far can be used to find the true mean diffusion lengths with the aid of fig. 3.4. This figure correlates Land Le irrespective of the direction of the incident light in the crystal, since the angular distribution of the fluorescence, whether isotropic or in planes, is irrelevant to the concentration of excitons at the surface (table 3-1). The components of L in melt-grown crystals found with fig. 3.4 are: L(a) = 400 A, L(b) = 700 A and L(c*) = 220 A.
-64
For the plate-shaped crystals grown from solutions and by sublimation only L(c*) could be determined. When it can be assumed that the anisotropy in the exciton diffusion is similar in various crystals, the components of L in our "best" crystals (certain batches grown from solutions in dichloroethane) are L(a) 800 A, L(b) = 1400 A and L(c*) 400 A.
5.1.3. Comparison of present and reported data
The mean diffusion length of excitons in anthracene crystals perpendicular to the a, b-plane has been determined by various authors from the excitation spectrum of the fluorescence and the photoconduction spectrum. Borisov and Vishnevskii 8) found 1000-1500 A from excitation spectra of the fluorescence, Eremenko and Medvedev 10) found 2000 A from the excitation spectrum of the fluorescence and from the photoconduction spectrum in a surface type of cell, and Steketee and De Jonge 13
) reported 700-2000 A from photoconduction spectra measured with a weakly acidic aqueous electrode. All these values are larger than the present range of values, which is 400 A on the average. In this connection it should be borne in mind that the exciton diffusion length formally determined from excitation spectra can be seemingly high for a number of reasons. (a) The assumption that the observed effect has its origin exclusively at the sur
face is not always valid. As argued in sec. 4.2.3 this leads to a high L-value. (b) Allowance should be made for the wavelength dependence of the reflection
of the incident light. When, for instance, Le is found to be 400 A when the proper correction is made for reflection, the apparent value of Le found without this correction is 620 A when the measurements are made on an anthracene-air interface, and 540 A when the measurements are made on an anthracene-water interface.
(c) In the analysis of excitation spectra of the crystal fluorescence it should be considered that the escape factor of the fluorescence through the illuminated surface is greater the larger the value of s 7). This tends to increase the intensity of the fluorescence emitted from the illuminated surface under excitation at absorption maxima. The result is again a decrease ofthepeak-tovalley ratios in the excitation spectrum of the "reflected" fluorescence, leading to an apparently high L-value.
It is difficult to say which is the main cause for the high diffusion lengths cited at the beginning of this section. From our own measurements (chapter 7) it follows that annihilation of excitons and generation of charge carriers at "deeper centres" (close to, but not right at the surface) is a common cause of high calculated L-values.
Many authors determined the mean diffusion length of excitons in anthracene from the ratio of the intensities of the host and guest fluorescence of anthra-
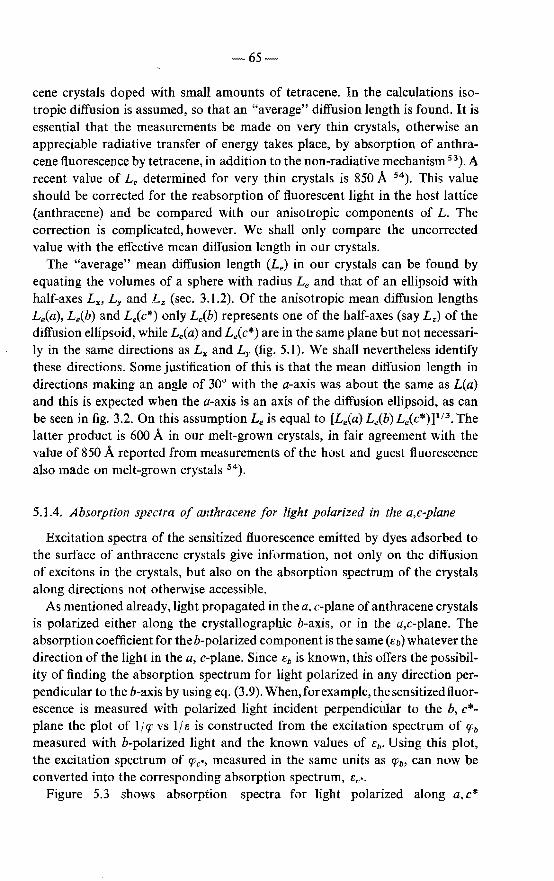
65
cene crystals doped with small amounts of tetracene. In the calculations isotropic diffusion is assumed, so that an "average" diffusion length is found. It is essential that the measurements be made on very thin crystals, otherwise an appreciable radiative transfer of energy takes place, by absorption of anthracene fluorescence by tetracene, in addition to the non-radiative mechanism 53). A recent value of Le determined for very thin crystals is 850 A 54
). This value should be corrected for the reabsorption of fluorescent light in the host lattice (anthracene) and be compared with our anisotropic components of L. The correction is complicated, however. We shall only compare the uncorrected value with the effective mean diffusion length in our crystals.
The "average" mean diffusion length (Le) in our crystals can be found by equating the volumes of a sphere with radius Le and that of an ellipsoid with half-axes Lx, Ly and Lz (sec. 3.1.2). Of the anisotropic mean diffusion lengths Le(a), Le(b) and Le(c*) only Le(b) represents one of the half-axes (say Lz) of the diffusion ellipsoid, while Le(a) and Le(c*) are in the same plane but not necessarily in the same directions as Lx and Ly (fig. 5.1). We shall nevertheless identify these directions. Some justification of this is that the mean diffusion length in directions making an angle of 30° with the a-axis was about the same as L(a) and this is expected when the a-axis is an axis of the diffusion ellipsoid, as can be seen in fig. 3.2. On this assumption Leis equal to [Le(a) L.,(b) Le(c*) ]113• The latter product is 600 A in our melt-grown crystals, in fair agreement with the value of 850 A reported from measurements of the host and guest fluorescence also made on melt-grown crystals 54).
5.1.4. Absorption spectra of anthracene for light polarized in the a,c-plane
Excitation spectra of the sensitized fluorescence emitted by dyes adsorbed to the surface of anthracene crystals give information, not only on the diffusion of excitons in the crystals, but also on the absorption spectrum of the crystals along directions not otherwise accessible.
As mentioned already, light propagated in the a, c-plane of anthracene crystals is polarized either along the crystallographic b-axis, or in the a,c-plane. The absorption coefficient for the b-polarized component is the same (eb) whatever the direction of the light in the a, c-plane. Since eb is known, this offers the possibility of finding the absorption spectrum for light polarized in any direction perpendicular to the b-axis by using eq. (3.9). When,forexample, the sensitized fluorescence is measured with polarized light incident perpendicular to the b, c*plane the plot of l/q; vs 1/e is constructed from the excitation spectrum of ffJb measured with b-polarized light and the known values of sb. Using this plot, the excitation spectrum of ffJc•• measured in the same units as q;b, can now be converted into the corresponding absorption spectrum, ec•·
Figure 5.3 shows absorption spectra for light polarized along a, c*
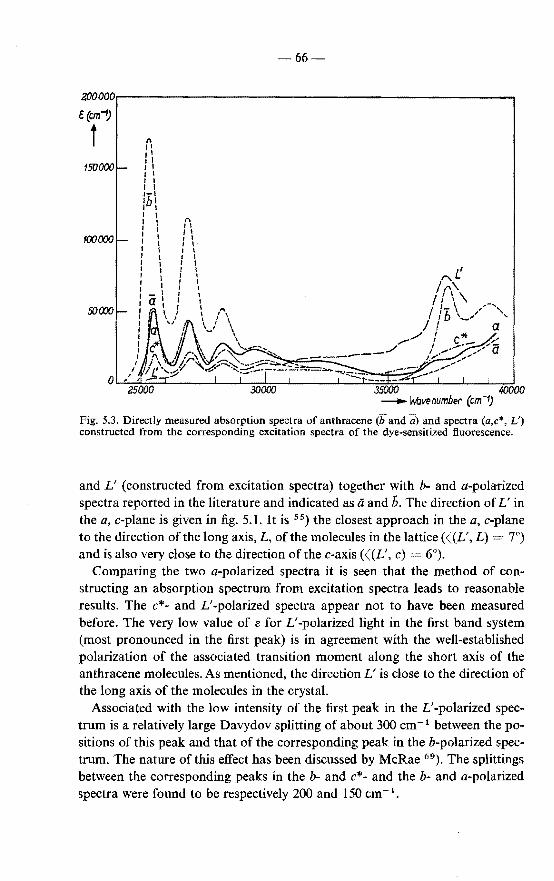
-66-
~000.-------------------~--------------------------~ E (cm-1)
t
(\ I I I I I I· I I I I I I I I I I I I I I I I I 1 I I " I \ I \
1 I 1 \~/ '
Fig. 5.3. Directly measured absorption spectra of anthracene (band a) and spectra (a,c*, L') constructed from the corresponding excitation spectra of the dye-sensitized fluorescence.
and L' (constructed from excitation spectra) together with b- and a-polaTized spectra reported in the literature and indicated as a and b. The direction of L' in the a, c-plane is given in fig. 5.1. It is 55) the closest approach in the a, c-plane to the direction of the long axis, L, of the molecules in the lattice(((£', L) 7°) and is also very close to the direction of the c-axis ( ((L', c) 6°).
Comparing the two a-polarized spectra it is seen that the method of constructing an absorption spectrum from excitation spectra leads to reasonable results. The c*- and L' -polarized spectra appear not to have been measured before. The very low value of s for L' -polarized light in the first band system (most pronounced in the first peak) is in agreement with the well-established polarization of the associated transition moment along the short axis of the anthracene molecules. As mentioned, the direction L' is close to the direction of the long axis of the molecules in the crystal.
Associated with the low intensity of the first peak in the L' -polarized spectrum is a relatively large Davydov splitting of about 300 cm- 1 between the positions of this peak and that of the corresponding peak in the b-polarized spectrum. The nature of this effect has been discussed by McRae 69). The splittings between the corresponding peaks in the b- and c*- and the b- and a-polarized spectra were found to be respectively 200 and 150cm- 1 •
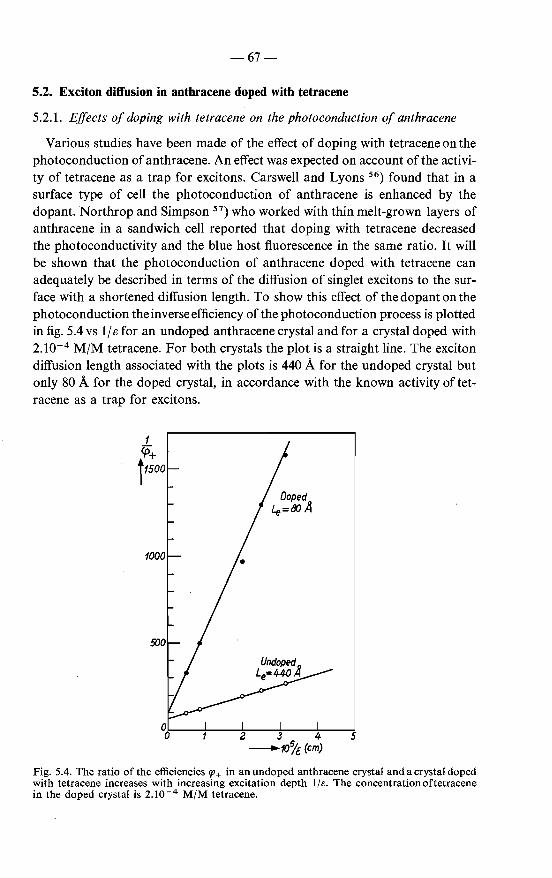
-67-
5.2. Exciton diffusion in anthracene doped with tetracene
5.2.1. Effects of doping with tetracene on the photoconduction of anthracene
Various studies have been made of the effect of doping with tetracene on the photoconduction of anthracene. An effect was expected on account of the activity of tetracene as a trap for excitons. Carswell and Lyons 56) found that in a surface type of cell the photoconduction of anthracene is enhanced by the dopant. Northrop and Simpson 57) who worked with thin melt-grown layers of anthracene in a sandwich cell reported that doping with tetracene decreased the photoconductivity and the blue host fluorescence in the same ratio. It will be shown that the photoconduction of anthracene doped with tetracene can adequately be described in terms of the diffusion of singlet excitons to the surface with a shortened diffusion length. To show this effect of the dopant on the photoconduction the inverse efficiency of the photoconduction process is plotted in fig. 5.4 vs 1/ e for an undoped anthracene crystal and for a crystal doped with 2.10- 4 M/M tetracene. For both crystals the plot is a straight line. The exciton diffusion length associated with the plots is 440 A for the undoped crystal but only 80 A for the doped crystal, in accordance with the known activity oftetracene as a trap for excitons.
1 (/:)+ jtsoo
5
Fig. 5.4. The ratio of the efficiencies 'P+ in an undoped anthracene crystal and a crystal doped with tetracene increases with increasing excitation depth 1/e. The concentrationoftetracene in the doped crystal is 2.10- 4 M/M tetracene.
-68
As regards the magnitude of the photocurrents in the two crystals the following can be remarked. The photocurrents were measured at the same voltage and with the same type of electrode solution (1 N NaOH) in each case. It can be seen that for relatively large values of the excitation depth 1/ s the ratio of the photocurrents in the doped and undoped crystals is appreciable. For 105
/ s = 3, for instance, the ratio is 6. The ratio extrapolated to zero excitation depth is, however, only 1·5. This result can be explained on the assumption that the effect of tetracene on the photoconduction is entirely caused by the activity of tetracene as a trap for excitons. On that assumption the efficiency of the photoconduction process can be written (eq. (3.8)):
<f+ = a (1 + DfsL)- 1 (l + 1/kL)- 1• (5.1)
The following can be said about the effect of tetracene on the parameters k, D, s and a in this equation. Since its concentration in the crystals is very small (I0- 6-I0- 3 M/M) the tetracene has evidently no effect on the absorption coefficient k in the spectral region where the light is strongly absorbed by anthracene, or on the diffusion coefficient D, which is a measure of the rate at which excitons migrate from one anthracene molecule to another. The annihilation of excitons at the surface is the result of reactions of the excitons on anthracene with chemical agents in the electrode solution and it would seem that neither the rate constants for the annihilation of excitons nor the probability constant a for the generation of free holes will be affected by the presence of small amounts of tetracene in the lattice. There can, however, be a pronounced indirect effect of tetracene on the efficiency of the electrode reaction through its activity as a shallow trap for holes 58
). Trapping of holes will lead to a space charge of positive holes in the crystal, and thereby decrease the effective field strength in the crystal near the illuminated electrode. As a result the efficiency factor a for the reaction of charge separation will be lower. Trapping of holes canmoreoverlead to a slow, non-linear response of the photocurrent through a slow build-up and decay of the space charge when the light is admitted or shut off. Very small stationary photocurrents and a slow response were indeed observed with thick doped crystals. In thin (30-50 fLID) crystals, on the other hand, at sufficiently high voltages (500 V across a 50 !1-m thick crystal) the photocurrent was considerably larger with a prompt response, which was proportional to light intensities lower than 1010 photonsjcm2s. At high voltages the space charge of trapped holes is apparently too small to affect the generation of charge carriers at the surface seriously. It follows that at a high voltage tetracene affects the photoconduction only by its effect on L, that is, by preventing the excitons from reaching the surface. This effect of tetracene will be smaller the smaller the penetration depth of the light, as can be seen in fig. 5.4.
When the diffusion length L becomes very short compared to the penetration depth 1/k of the light, eq. (5.1) is reduced to
69-
({!+ = aL (1 + DjsL)- 1 k. (5.1a)
This implies that the photoconduction spectrum measured on a heavily doped crystal will be completely similar to the absorption spectrum of anthracene: An illustration is the spectrum shown in fig. 2.5, which was measured on a crystal containing 10- 3 M/M tetracene and with a 1 N solution ofHCl in the positiveelectrode compartment.
Estimate of the annihilation constant s When all the excitons are generated right at the surface (1/ s = 0) the efficien
cy of the photoconduction becomes
(5.1b)
It can be seen that ({I+ will still be smaller the smaller L, unless the rate constant s for surface annihilation is infinite. This is because, although all excitons are generated at the surface, they can diffuse away. The difference between the extrapolated intercepts in fig. 5.4 is, however, small and was even smaller in other cases. It follows that the term DfsL in eq.(5.lb) must be small. On the assumption that the parameters D, sand a are the same for doped and undoped crystals the ratio sfD can be estimated. To this end one can substitute in eq. (5.lb) the effective values of L that describe the experimental plots in fig. 5.4. For the ratio of the extrapolated efficiencies in doped and undoped crystals this gives
({i+f({i+ 0 = 2/3 = (1 + D/440.10- 8s) (1 + D/80.10- 8 s)- 1• (5.2)
This leads to a value of 2.106 cm- 1 for sf D. This value is a minimum since, as mentioned, the difference between the extrapolated values of({!+ for doped and undoped crystals was frequently smaller than in fig. 5.4. The diffusion coefficient D can be found from the relationship D = (L 0 )
2 P, where L 0 represents the mean diffusion length in the undoped crystal, corrected for the effect of reabsorption of fluorescent light (about 300 A), while the annihilation probability P is 1·6.108 s- 1 43). It follows that D 14.10- 4 cm2fs. This gives for sa value of at least 3000 cmjs.
The data given above make it possible to find the fraction (1 + DjsL)- 1 of all excitons arriving at the surface that is annihilated at the surface. With the values of s, Land D given above this fraction is found to be at least 0·9. Therefore nearly all excitons arriving at the surface are annihilated. It may be remarked that only a small portion of these excitons is "quenched" (radiationless) at the surface *). Apparently most excitons arriving at the surface fluoresce there.
*) Measurements of the quenching of the fluorescence, to be discussed in chapter 6, indicate that the fraction that is quenched, is only about 0·15 when the crystal is in contact with water or alkali.
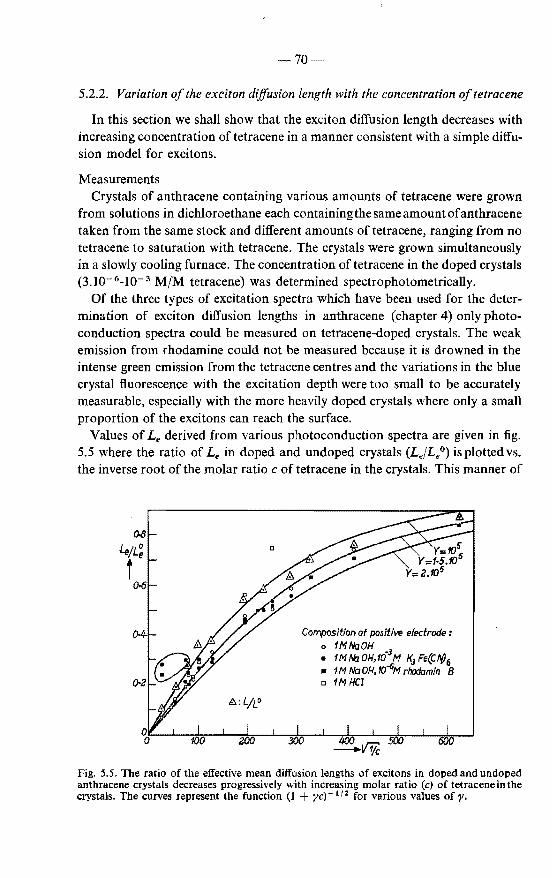
-70
5.2.2. Variation of the exciton diffusion length with the concentration oftetracene
In this section we shall show that the exciton diffusion length decreases with increasing concentration of tetracene in a manner consistent with a simple diffusion model for excitons.
Measurements Crystals of anthracene containing various amounts of tetracene were grown
from solutions in dichloroethane each containingthesameamountofanthracene taken from the same stock and different amounts of tetracene, ranging from no tetracene to saturation with tetracene. The crystals were grown simultaneously in a slowly cooling furnace. The concentration oftetracene in the doped crystals (3.10- 6-I0- 3 M/M tetracene) was determined spectrophotometrically.
Of the three types of excitation spectra which have been used for the determination of exciton diffusion lengths in anthracene (chapter 4) only photoconduction spectra could be measured on tetracene-doped crystals. The weak emission from rhodamine could not be measured because it is drowned in the intense green emission from the tetracene centres and the variations in the blue crystal fluorescence with the excitation depth were too small to be accurately measurable, especially with the more heavily doped crystals where only a small proportion of the excitons can reach the surface.
Values of Le derived from various photoconduction spectra are given in fig. 5.5 where the ratio of Le in doped and undoped crystals (Le/Le 0 ) is plotted vs. the inverse root of the molar ratio c of tetracene in the crystals. This manner of
Composition of positive electrode : o 1MNaOH _
3 • 1Mfob.OH,10 M f<aFe(Cf>06 • 1M Na OH, to-fiM rhodamin 8 o 1M HCl
Fig. 5.5. The ratio of the effective mean diffusion lengths of excitons in doped and undoped anthracene crystals decreases progressively with increasing molar ratio (c) of tetracene in the crystals. The curves represent the function (I + yc)- 1
'2 for various values of y.
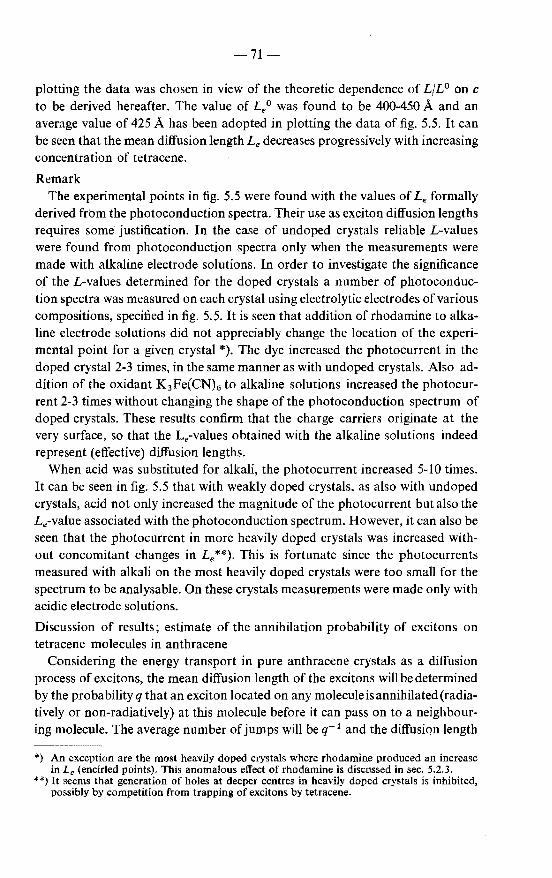
71
plotting the data was chosen in view of the theoretic dependence of L/L 0 on c to be derived hereafter. The value of Le 0 was found to be 400-450 A and an average value of 425 A has been adopted in plotting the data of fig. 5.5. It can be seen that the mean diffusion length Le decreases progressively with increasing concentration of tetracene.
Remark The experimental points in fig. 5.5 were found with the values of Le formally
derived from the photoconduction spectra. Their use as exciton diffusion lengths requires some justification. In the case of undoped crystals reliable £-values were found from photoconduction spectra only when the measurements were made with alkaline electrode solutions. In order to investigate the significance of the £-values determined for the doped crystals a number of photoconduction spectra was measured on each crystal using electrolytic electrodes of various compositions, specified in fig. 5.5. It is seen that addition of rhodamine to alkaline electrode solutions did not appreciably change the location of the experimental point for a given crystal *). The dye increased the photocurrent in the doped crystal 2-3 times, in the same manner as with undoped crystals. Also addition of the oxidant K3 Fe(CN)6 to alkaline solutions increased the photocurrent 2-3 times without changing the shape of the photoconduction spectrum of doped crystals. These results confirm that the charge carriers originate at the very surface, so that the Le-values obtained with the alkaline solutions indeed represent (effective) diffusion lengths.
When acid was substituted for alkali, the photocurrent increased 5-10 times. It can be seen in fig. 5.5 that with weakly doped crystals, as also with undoped crystals, acid not only increased the magnitude of the photocurrent but also the Le-value associated with the photoconduction spectrum. However, it can also be seen that the photocurrent in more heavily doped crystals was increased without concomitant changes in Le **). This is fortunate since the photocurrents measured with alkali on the most heavily doped crystals were too small for the spectrum to be analysable. On these crystals measurements were made only with acidic electrode solutions.
Discussion of results; estimate of the annihilation probability of excitons on tetracene molecules in anthracene
Considering the energy transport in pure anthracene crystals as a diffusion process of excitons, the mean diffusion length of the excitons will be determined by the probability q that an exciton located on any moleculeisannihilated(radiatively or non-radiatively) at this molecule before it can pass on to a neighbouring molecule. The average number of jumps will be q- 1 and the diffusion length
*) An exception are the most heavily doped crystals where rhodamine produced an increase in Le (encirled points). This anomalous effect of rhodamine is discussed in sec. 5.2.3.
**}It seems that generation of holes at deeper centres in heavily doped crystals is inhibited, possibly by competition from trapping of excitons by tetracene.
72-
in any given direction can be written as L 0 = aq- 112 , where <1. is determined by the lattice constants.
In doped crystals one can formally attribute the effect of the dopant on the mean diffusion length to a higher annihilation probability (denoted as yq) for excitons arriving during the diffusion process at a lattice site occupied by a molecule of the dopant. Denoting again the molar ratio of guest and host molecules as c, the proportion of excitons located at any moment on anthracene molecules is 1 c;:::,; 1 (c <10- 3), while the proportion located on molecules of the dopant is c. The average annihilation probability of excitons in doped crystals is thus q yqc, so that the mean diffusion length is L = a(q + yqc)- 112•
The ratio of the diffusion lengths in doped and undoped crystals thus varies withy as
(5.5)
This result is analogous to the equation describing the probability of :fluorescence in solutions under conditions of dynamic quenching (see ref. 46, p. 207):
P 0 fP = (1 + yc)- 1 ; L = (D/P)- 112
•
In the latter case excited and quenching molecules are subject to a diffusion process, whereas in our system it is the excitation energy which is considered to be diffusing.
To test eq. (5.5) one cannot consider the experimental points (circles and squares) in fig. 5.5 as such, since these represent values of Le/Le0 , and not of LfL0
• Values of L/L0 can be found from those of Le/Le0 as follows. At very low concentrations of tetracene nearly all of the fluorescent light emitted by the crystal is blue "host" fluorescence that is reabsorbed to give "secondary" excitons, as also in undoped crystals. Therefore L/L0 is practically equal to Le/Le0
(and close to unity) at high values of c- 112 in fig. 5.5. At very low values of c- 112 nearly all the :fluorescent light is green "guest" :fluorescence that is not reabsorbed by anthracene, so that here L = Le. To account for the effect of reabsorption of :fluorescent light on the L-values at intermediate concentrations one can as a first approximation assume that the relative effect of the reabsorption on L, that is (Le- L)fL, is proportional to the quantum yield of the blue fluorescence of the doped crystals. These quantum yields have been reported in the literature. The required ratio L/L0 can now be written
(5.6)
The factor Le/Le0 in this expression is given by the circles and squares in fig. 5.5. The factor Le0 /L0 has the value 1·54 (this follows from the data of fig. 3.4 for Le0 = 425 A). For undoped crystals (Le L)/L is 0·54. For doped crystals this expression is now assumed to be 0·54/(doped)/.f(undoped), where/denotes the quantum yield of the blue fluorescence. Zima and co-authors 54) report the following quantum yields of the blue fluorescence of anthracene at the concen-
-73--
trations of tetracene given between brackets as c -1!2: 0·90 ( oo); 0·68 ( 520); 0·265 (160); 0·16 (115), to which one can add 0(0). With these and interpolated data and with eq. (5.6) the ratio L/L0 was calculated for a number of values of c- 112, using the lowest experimental values of Le/Le0 in fig. 5.5 (the lowest values . would be the most reliable ones since, as noted in sec. 4.2.3, any deviation from the exciton-diffusion model leads to spuriously high values of Le). The results are given by the triangles in fig. 5.5.
To test eq. (5.5) the plot of LJL0 vs c- 112 (triangles in the figure) can be compared with curves of (I + yc)- 112 which have been plotted vs c- 112 for various values of y in the same figure. It is seen that the triangles fit the curve of (1 + yc)- 112 withy 105 • The most important conclusion is that the mean diffusion length of excitons in anthracene crystals doped withtetracenedecreases with increasing concentration of the dopant in a manner fully consistent with a simple diffusion model for the excitons. The result that y = 105 implies that an exciton arriving at a lattice site occupied by a tetracene molecule has a probability of annihilation which is 105 times the annihilation probability of an exciton on anthracene. The value of 105 fory has also been found by Zima and co-authors 54
) from the intensities of the host and guest fluorescence of anthracene doped with tetracene.
5.2.3. Evidence of trap-to-trap migration of excitons
The photocurrent was very small in heavily doped crystals with alkaline electrodes. As mentioned, addition of the dye rhodamine B to theelectrodesolution increased the photocurrent. In this case, however, the relative increase was unusually large (10-20 times, as against 2-4 times in more weakly doped and undoped crystals). Another abnormal effect of rhodamine B on heavily doped crystals was a marked increase in the exciton diffusion length. The encircled points in fig. 5.5 show that Le was 120 A for the sensitized crystals, as against 30 A for the unsensitized crystals with an acidic electrode. It was ascertained that the apparent increase inLe was not due to absorption bythedyemoleculesof the green fluorescent light emitted by the crystal*). To understand the anomalous effects of the dye one may consider other mechanisms of energy migration than that associated with normal excitons (the latter mechanism is practically inhibited: Le 30 A with acidic electrodes).
It is suggested that excitation energy can jump from trap to trap, that is, from one tetracene molecule to another, when the tetracene molecules are in sufficiently close proximity. In the absence of dye molecules this process ap-
*) The effect of the fluorescence on the photocurrent can be measured separately by illuminating the crystal through the negative electrode with strongly absorbed light. The reabsorption of fluorescent light by the dye {involving repeated total reflection of the fluorescent light within the crystal) is essentially the same for the two directions of incidence of the exciting light. The "negative" photocurrent was found to be only about 2% of the current obtained under illumination of the positive electrode with the same light (365 mtJ.).
74-
parently does not lead to photoconduction. The photoconduction in heavily doped crystals with acidic electrodes can be understood entirely in terms of a diffusion of normal excitons, with a very short diffusion length, followed by a generation of holes at the surface with the same efficiency as in undoped crystals. When dye molecules are adsorbed at the surface, the excitation energy trapped by tetracene molecules at or near the surface can, however, be transferred, in the second instance, to the dye molecules. Accordingly the following sequence of events is possible: absorption of a photon by anthracene, energy transfer to tetracene, trap-to-trap migration, energy transfer to a dye molecule (possibly followed by internal conversion of the excited dye molecule to the triplet state) and, finally, a reaction of the excited dye molecule with anthracene producing a mobile hole in the crystal. This will result in a photocurrent with a spectral response determined by the absorption spectrum of anthracene and by the mean diffusion length of excitation energy migrating from trap to trap. The latter is found to be about 120 A, which is considerably greater than the diffusion length of 30 A for normal excitons in the host lattice of the heavily doped crystal.
The proposed mechanism can explain that the dye causes an abnormally great relative increase in the photocurrent in the heavily doped crystals. Before sensitization the small photocurrent is caused only by reactions of normal excitons diffusing in the host lattice. The generation of holes by these excitons will increase 2-3 times upon sensitization with rhodamine, in the same manner as with less heavily doped and undoped crystals. Excitation energy migrating from trap to trap, which is inactive in the photoconduction before sensitization, becomes very active upon sensitization. Not only has it a greater diffusion length than that of normal excitons, but also will energy be transferred to rhodamine with greater probability from excited tetracene than from excited anthracene, on account of the large spectral overlap of the emission of tetracene, ranging from 4900 to 5900 A, and the absorption spectrum of rhodamine, which has its maximum at 5560 A.
At a concentration of tetracene of w- 3 M/M the average distance between the tetracene molecules is about 60 A. Energy transfer over comparable and larger distances has been claimed before 46). The relatively short diffusion length of 100-120 A associated with the trap-to-trap migration suggests that the number of jumps of excitation energy between traps is small when the average distance is 60 A (12 jumps over 60 A cause a mean diffusion length of 120 A).
5.3. Exciton diffusion in anthracene doped with phenazine and acridine
5.3.1. Measurements of the sensitized fluorescence
Acridine and phenazine have the same molecular structure as anthracene except that they have respectively one and two nitrogen atoms instead of carbon
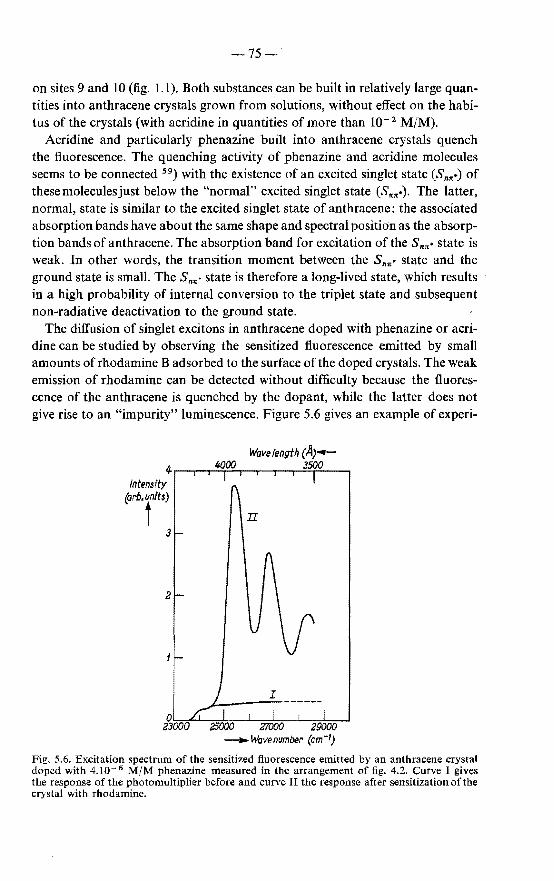
-75-
on sites 9 and 10 (fig. 1.1). Both substances can be built in relatively large quan· tities into anthracene crystals grown from solutions, without effect on the habi· tus of the crystals (with acridine in quantities of more than w-z M/M).
Acridine and particularly phenazine built into anthracene crystals quench the fluorescence. The quenching activity of phenazine and acridine molecules seems to be connected 59
) with the existence of an excited singlet state (Sn,•) of thesemoleculesjust below the "normal" excited singlet state (S,,•). The latter, normal, state is similar to the excited singlet state of anthracene: the associated absorption bands have about the same shape and spectral position as the absorp· tion bands of anthracene. The absorption band for excitation of the Sm,• state is weak. In other words, the transition moment between the S mr• state and the ground state is small. The Sn,• state is therefore a long-lived state, which results in a high probability of internal conversion to the triplet state and subsequent non·radiative deactivation to the ground state.
The diffusion of singlet excitons in anthracene doped with phenazine or acridine can be studied by observing the sensitized fluorescence emitted by small amounts of rhodamine B adsorbed to the surface of the doped crystals. The weak emission of rhodamine can be detected without difficulty because the fluores· cence of the anthracene is quenched by the dopant, while the latter does not give rise to an "impurity" luminescence. Figure 5.6 gives an example of experi-
Wavelength (A)~--~.~~00~,_-,_,~~~0--~
Intensity (arb. units)
t II 3
Fig. 5.6. Excitation spectrum of the sensitized fluorescence emitted by an anthracene crystal doped with 4.10- 6 M/M phenazine measured in the arrangement of fig. 4.2. Curve I gives the response of the photomultiplier before and curve II the response after sensitization of the crystal with rhodamine.
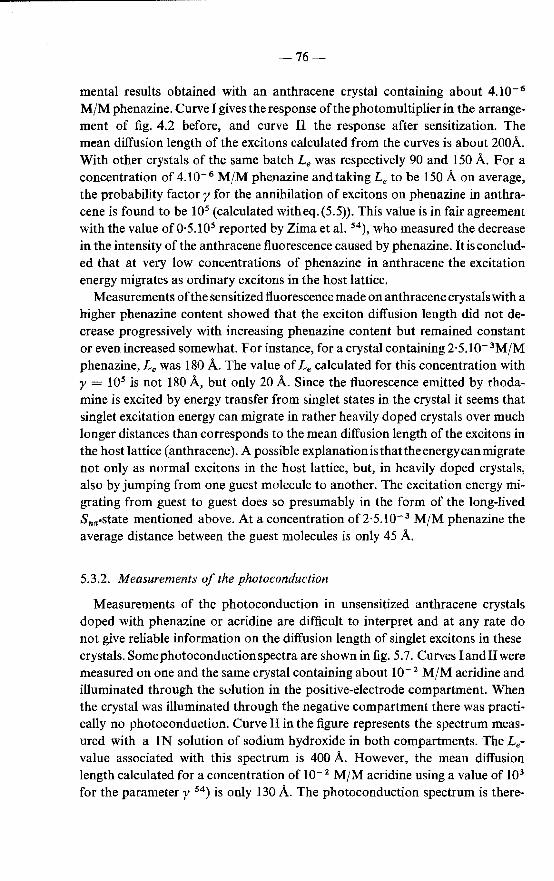
-76-
mental results obtained with an anthracene crystal containing about 4.10- 6
M/M phenazine. Curve I gives the response of the photomultiplier in the arrangement of fig. 4.2 before, and curve II the response after sensitization. The mean diffusion length of the excitons calculated from the curves is about 200A. With other crystals of the same batch Le was respectively 90 and 150 A. For a concentration of 4.1 o- 6 M/M phenazine and taking Le to be 150 A on average, the probability factory for the annihilation of excitons on phenazine in anthracene is found to be 105 (calculated witheq.(5.5)). This value is in fair agreement with the value of0·5.105 reported by Zima et al. 54), who measured the decrease in the intensity of the anthracene fluorescence caused by phenazine. It is concluded that at very low concentrations of phenazine in anthracene the excitation energy migrates as ordinary excitons in the host lattice.
Measurements of the sensitized fluorescence made on anthracene crystals with a higher phenazine content showed that the exciton diffusion length did not decrease progressively with increasing phenazine content but remained constant or even increased somewhat. For instance, for a crystal containing 2·5.10- 3M/M phenazine, Le was 180 A. The value of Le calculated for this concentration with y = 105 is not 180 A, but only 20 A. Since the fluorescence emitted by rhodamine is excited by energy transfer from singlet states in the crystal it seems that singlet excitation energy can migrate in rather heavily doped crystals over much longer distances than corresponds to the mean diffusion length of the excitons in the host lattice (anthracene). A possible explanation is that the energy can migrate not only as normal excitons in the host lattice, but, in heavily doped crystals, also by jumping from one guest molecule to another. The excitation energy migrating from guest to guest does so presumably in the form of the long-lived Snn•State mentioned above. At a concentration of2·5.10- 3 M/M phenazine the average distance between the guest molecules is only 45 A.
5.3.2. Measurements of the photoconduction
Measurements of the photoconduction in unsensitized anthracene crystals doped with phenazine or acridine are difficult to interpret and at any rate do not give reliable information on the diffusion length of singlet excitons in these crystals. Some photoconduction spectra are shown in fig. 5. 7. Curves I and II were measured on one and the same crystal containing about IQ- 2 M/M acridine and illuminated through the solution in the positive-electrode compartment. When the crystal was illuminated through the negative compartment there was practi· cally no photoconduction. Curve II in the figure represents the spectrum measured with a 1 N solution of sodium hydroxide in both compartments. The Levalue associated with this spectrum is 400 A. However, the mean diffusion length calculated for a concentration of 10- 2 M/M acridine using a value of 103
for the parameter y 54) is only 130 A. The photoconduction spectrum is there·
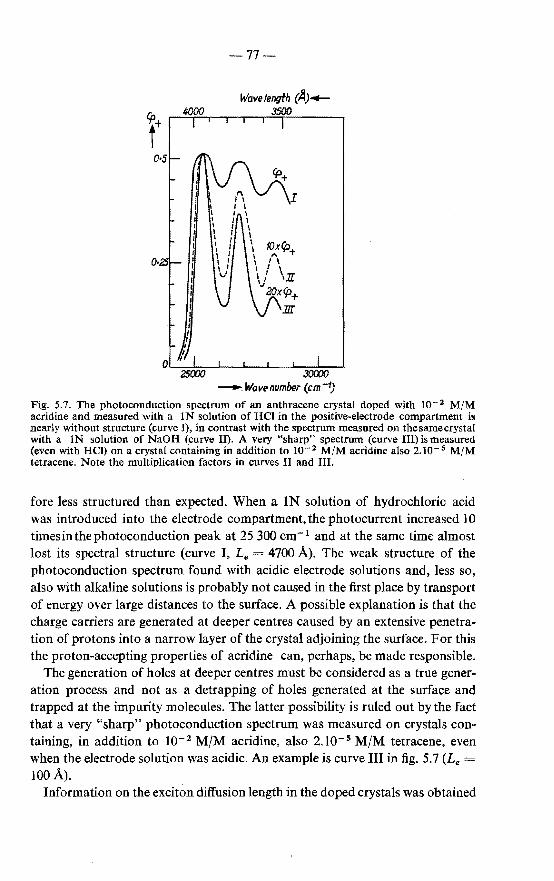
0·
I I I I I I I I I I I
-77-
30000 --.Wavenumber (cm-1)
Fig. 5.7. The photoconduction spectrum of an anthracene crystal doped with 10- 2 M/M acridine and measured with a IN solution of HCl in the positive-electrode compartment is nearly without structure (curve I), in contrast with the spectrum measured on the same crystal with a IN solution of NaOH (curve II). A very "sharp" spectrum (curve III) is measured (even with HCl) on a crystal containing in addition to 10- 2 M/M acridine also 2.10-s M/M tetracene. Note the multiplication factors in curves II and III.
fore less structured than expected. When a IN solution of hydrochloric acid was introduced into the electrode compartment, the photocurrent increased 10 timesinthephotoconduction peak at 25 300 cm- 1 and at the same time almost lost its spectral structure (curve I, Le = 4700 A). The weak structure of the photoconduction spectrum found with acidic electrode solutions and, less so, also with alkaline solutions is probably not caused in the first place by transport of energy over large distances to the surface. A possible explanation is that the charge carriers are generated at deeper centres caused by an extensive penetration of protons into a narrow layer of the crystal adjoining the surface. For this the proton-accepting properties of acridine can, perhaps, be made responsible.
The generation of holes at deeper centres must be considered as a true generation process and not as a detrapping of holes generated at the surface and trapped at the impurity molecules. The latter possibility is ruled out by the fact that a very "sharp" photoconduction spectrum was measured on crystals containing, in addition to I0- 2 M/M acridine, also 2.10-s M/M tetracene, even when the electrode solution was acidic. An example is curve III in fig. 5.7 (Le =
100 A). Information on the exciton diffusion length in the doped crystals was obtained
-78-
from photoconduction spectra measured after sensitization of the crystals. The measurements of the photoconduction on sensitized crystalswerecombined with measurements of the sensitized fluorescence. The following results relate to a crystal doped with2·5.10- 3 M/M phenazine. For the photoconduction spectrum measured with alkali Le was 600 A. After sensitization with rhodamine L. was 360 A (increase in the photocurrent 3 times). Even when only the increase in the photocurrent caused by rhodamine was considered, Le was not less than 300 A. However, the spectrum of the sensitized fluorescence measured on the same crystal yielded a value of Le of only 110 A. Both the sensitized fluorescence emitted by rhodamine and the increase in the photocurrent stem from interactions of excitons with the dye. The sensitized fluorescence is caused by energy transfer from singlet excitons. These have apparently a range of about 110 A in the doped crystal. This is clearly less than the value of 300 A associated with the increase in the photocurrent caused by the same dye in the same experiment. A plausible explanation seems the following. There is evidence that it is the triplet state of the dye which is the active agent in the photoconduction 45). This state can be excited directly by transfer of energy from triplet states in the crystal to the dye. As mentioned, the excitons captured by phenazine are degraded probably via the triplet state. Such states can migrate from one phenazine molecule to another (jumps of 45 A on average) apparently over distances of several hundreds of A units with ultimate transfer of the energy to the dye adsorbed at the surface.
From the above results it seems that in anthracene doped with phenazine or acridine energy can migrate in a number of ways. In weakly doped crystals, where the impurity molecules are widely separated, there is only migration of singlet excitons in the host lattice. The mean diffusion length is shortened due to trapping by the guest molecules. At higher concentrations of the dopant excitation energy trapped by the dopant can migrate from one guest molecule to another both as singlets (presumably the long-lived Sn,• state) and over larger distances, e.g. 300 A, as triplets. The singlet states manifest themselves in the sensitized fluorescence. Both excited singlets and triplets of the guest molecules can induce a photoconduction in sensitized crystals.
5.4. Exciton diffusion in crystals of the hydrocarbons pyrene and perylene
5.4.1. Photoconduction spectrum of pyrene
It can be shown that in crystals of pyrene the photogeneration of charge carriers takes place exclusively at the surface of the crystals when an alkaline aqueous electrode is applied. This follows from a comparison of the photoconduction spectrum ( fPa, q;b) of pyrene in fig. 5.8 with the absorption spectrum ( Ba, eb) of pyrene in the same figure, measured by Tanaka 60) with a microscopic technique. The similarity of the two spectra indicates that the region where
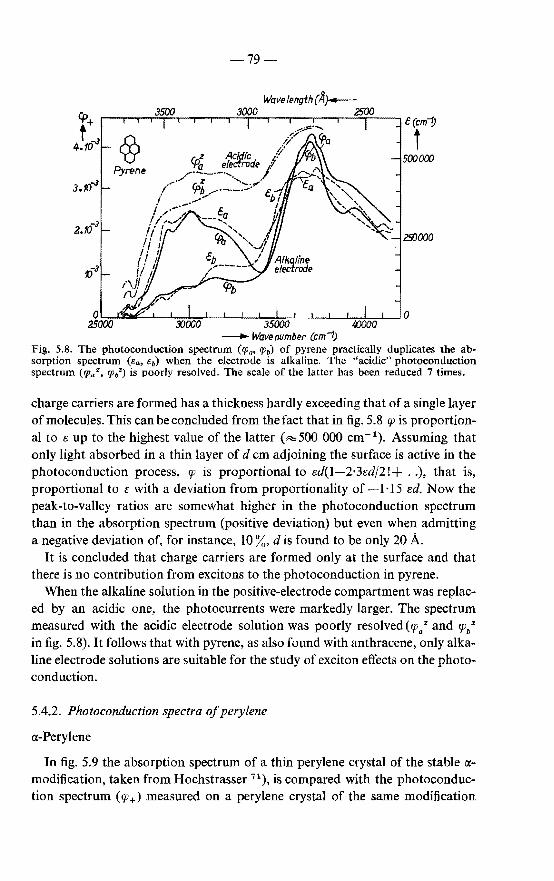
-79-
Wave /ength(AJ---J5(){) 3000 2500
e(cm!J
0 t Pyrene
0 0 2.5000 35000 liXJOO
- Wavetwmber (cm-1) Fig. 5.8. The photoconduction spectrum (rp,,, 'Pb) of pyrene practically duplicates the absorption spectrum (sa, sb) when the electrode is alkaline. The "acidic" photoconduction spectrum ('Paz, 'Pbz) is poorly resolved. The scale of the latter has been reduced 7 times.
charge carriers are formed has a thickness hardly exceeding that of a single layer of molecules. This can be concluded from the fact that in fig. 5.8 q; is proportional to e up to the highest value of the latter (~500 000 cm- 1). Assuming that only light absorbed in a thin layer of d em adjoining the surface is active in the photoconduction process, q; is proportional to ed(l-2·3ed/2!+ .. ), that is, proportional toe with a deviation from proportionality of -1·15 ed. Now the peak-to-valley ratios are somewhat higher in the photoconduction spectrum than in the absorption spectrum (positive deviation) but even when admitting a negative deviation of, for instance, 10%, dis found to be only 20 A.
It is concluded that charge carriers are formed only at the surface and that there is no contribution from excitons to the photoconduction in pyrene.
When the alkaline solution in the positive-electrode compartment was replaced by an acidic one, the photocurrents were markedly larger. The spectrum measured with the acidic electrode solution was poorly resolved ( q; a" and IP/ in fig. 5.8). It follows that with pyrene, as also found with anthracene, only alkaline electrode solutions are suitable for the study of exciton effects on the photoconduction.
5.4.2. Photoconduction spectra of perylene
a:-Perylene
In fig. 5.9 the absorption spectrum of a thin perylene crystal of the stable amodification, taken from Hochstrasser 71), is compared with the photoconduction spectrum (q;+) measured on a perylene crystal of the same modification
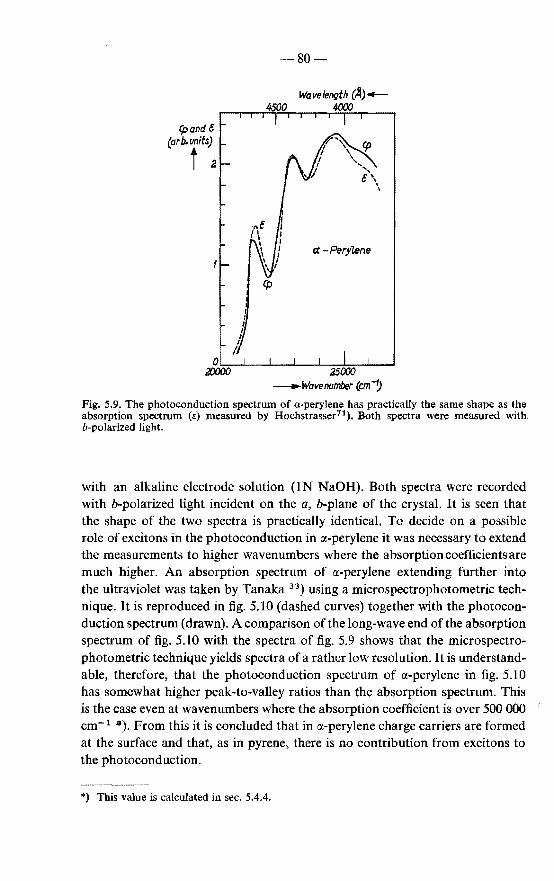
Cpand e (arb. units)
i 2
-80-
« - Perylene
Fig. 5.9. The photoconduction spectrum of a-perylene has practically the same shape as the absorption spectrum (s) measured by Hochstrasser71). Both spectra were measured with. b-polarized light.
with an alkaline electrode solution (IN NaOH). Both spectra were recorded with b-polarized light incident on the a, b-plane of the crystal. It is seen that the shape of the two spectra is practically identical. To decide on a possible role of excitons in the photoconduction in a-perylene it was necessary to extend the measurements to higher wavenumbers where the absorptioncoefficientsare much higher. An absorption spectrum of a-perylene extending further into the ultraviolet was taken by Tanaka 33) using a microspectrophotometric technique. It is reproduced in fig. 5.10 (dashed curves) together with the photoconduction spectrum (drawn). A comparison of the long-wave end of the absorption spectrum of fig. 5.10 with the spectra of fig. 5.9 shows that the microspectrophotometric technique yields spectra of a rather low resolution. It is understandable, therefore, that the photoconduction spectrum of a-perylene in fig. 5.10 has somewhat higher peak-to-valley ratios than the absorption spectrum. This is the case even at wavenumbers where the absorption coefficient is over 500 000 cm- 1 *). From this it is concluded that in a-perylene charge carriers are formed at the surface and that, as in pyrene, there is no contribution from excitons to the photoconduction.
*) This value is calculated in sec. 5.4.4.
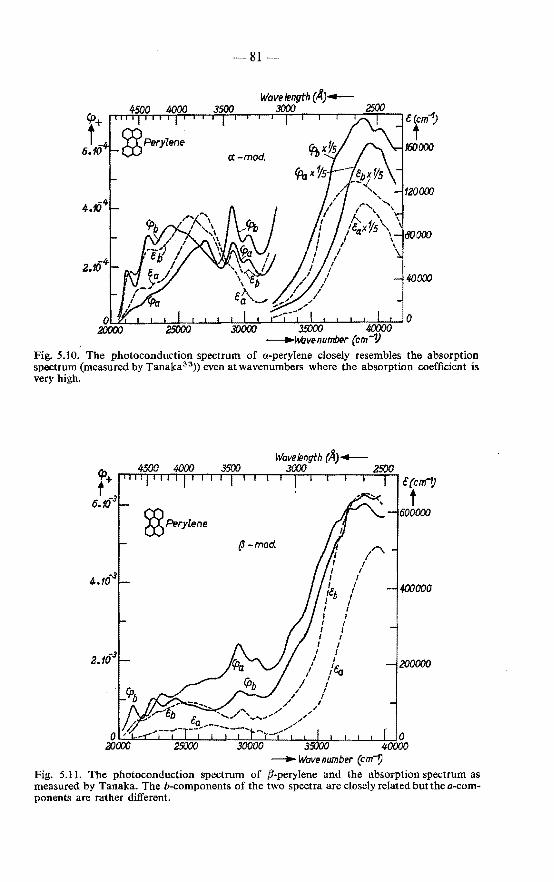
81
(p+
t_ 6.10
40000
~~J-~~~~=±~~~~~~~~~0 30000 35)00 40000 , -+'M:Ivenumber (em-?)
Fig. 5.10. The photoconduction spectrum of a-perylene closely resembles the absorption spectrum (measured by Tanaka33)) even at wavenumbers where the absorption coefficient is very high.
22Perylene
~~~~~~~~~~~~~35JOO~~L-~-+40~~ ............ Wavenumber (cm-1)
Fig. 5.11. The photoconduction spectrum of ,8-perylene and the absorption spectrum as measured by Tanaka. The b-components of the two spectra are closely related but the a-components are rather different.
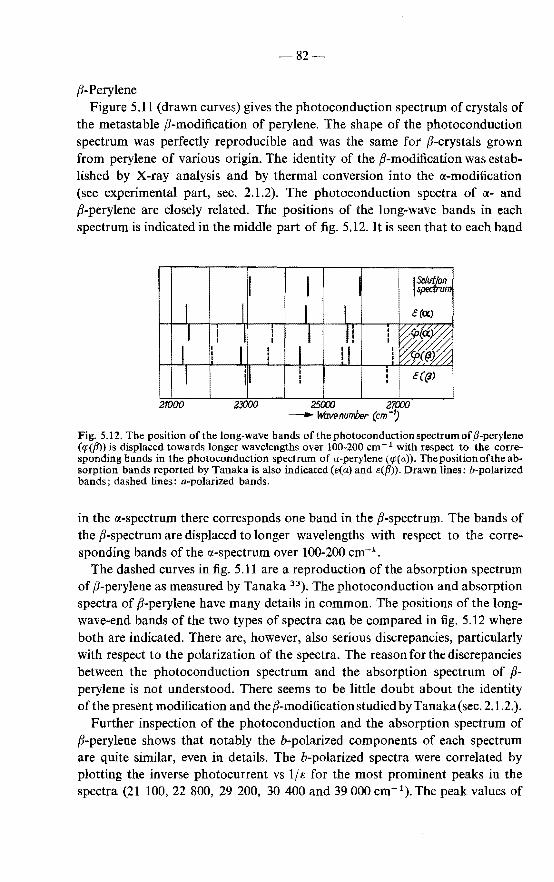
-82-
{J-Perylene Figure 5.11 (drawn curves) gives the photoconduction spectrum of crystals of
the metastable {J-modification of perylene. The shape of the photoconduction spectrum was perfectly reproducible and was the same for {J-crystals grown from perylene of various origin. The identity of the {J-modification was established by X-ray analysis and by thermal conversion into the a-modification (see experimental part, sec. 2.1.2). The photoconduction spectra of a- and {J-perylene are closely related. The positions of the long-wave bands in each spectrum is indicated in the middle part of fig. 5.12. It is seen that to each band
2XJ()O 2501XJ 27000 -- Wavenumber (em "1)
'
Solution $pedrom
Fig. 5.12. The position of the long-wave bands ofthephotoconductionspectrumofj3-perylene (tp({J)) is displaced towards longer wavelengths over 100-200 cm- 1 with respect to the corresponding bands in the photoconduction spectrum of a-perylene (tp(a)). Thepositionoftheabsorption bands reported by Tanaka is also indicated (c:(a) and s({J)). Drawn lines: b-polarized bands; dashed lines: a-polarized bands.
in the a-spectrum there corresponds one band in the {J-spectrum. The bands of the fJ-spectrum are displaced to longer wavelengths with respect to the corresponding bands of the a-spectrum over 100-200 cm-1 .
The dashed curves in fig. 5.11 are a reproduction of the absorption spectrum of {J-perylene as measured by Tanaka 33). The photoconduction and absorption spectra of {J-perylene have many details in common. The positions of the longwave-end bands of the two types of spectra can be compared in fig. 5.12 where both are indicated. There are, however, also serious discrepancies, particularly with respect to the polarization of the spectra. The reason for the discrepancies between the photoconduction spectrum and the absorption spectrum of {Jperylene is not understood. There seems to be little doubt about the identity of the present modification and the {J-modification studied by Tanaka (sec. 2.1.2.).
Further inspection of the photoconduction and the absorption spectrum of fJ-perylene shows that notably the b-polarized components of each spectrum are quite similar, even in details. The b-polarized spectra were correlated by plotting the inverse photocurrent vs 1/s for the most prominent peaks in the spectra (21 100, 22 800, 29 200, 30 400 and 39 000 cm- 1
). The peak values of
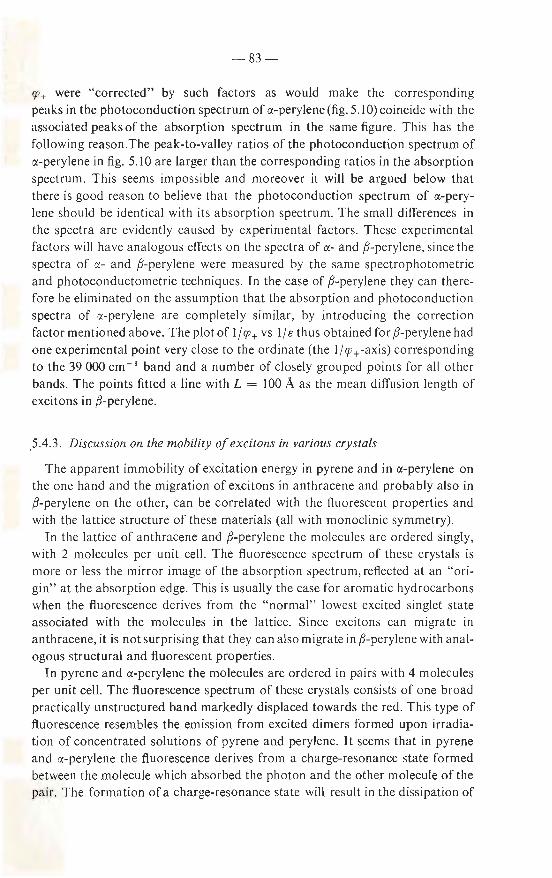
-83-
IP+ were "corrected" by such factors as would make the corresponding peaks in the photoconduction spectrum of a-perylene (fig. 5.1 0) coincide with the associated peaks of the absorption spectrum in the same figure. This has the following reason .The peak-to-valley ratios of the photoconduction spectrum of a-perylene in fig. 5.10 are larger than the corresponding ratios in the absorption spectrum. This seems impossible and moreover it will be argued below that there is good reason to believe that the photoconduction spectrum of a-perylene should be identical with its absorption spectrum. The small differences in the spectra are evidently caused by experimental factors. These experimental factors will have analogous effects on the spectra of a- and ,8-perylene, since the spectra of ct- and ,8-perylene were measured by the same spectrophotometric and photoconductometric techniques. In the case of ,8-perylene they can therefore be eliminated on the assumption that the absorption and photoconduction spectra of a-perylene are completely similar, by introducing the correction factor mentioned above. The plot of 1/ IP+ vs 1/ e thus obtained for ,8-perylene had one experimental point very close to the ordinate (the 1/ <p+-axis) corresponding to the 39 000 cm- 1 band and a number of closely grouped points for all other bands. The points fitted a line with L = 100 A as the mean diffusion length of excitons in ,8-perylene .
. 5.4.3. Discussion on the mobility of excitons in various crystals
The apparent immobility of excitation energy in pyrene and in a-perylene on the one hand and the migration of excitons in anthracene and probably also in ,8-perylene on the other, can be correlated with the fluorescent properties and with the lattice structure of these materials (all with monoclinic symmetry).
In the lattice of anthracene and ,8-perylene the molecules are ordered singly, with 2 molecules per unit cell. The fluorescence spectrum of these crystals is more or less the mirror image of the a bsorption spectrum, reflected at an " origin" at the absorption edge. This is usually the case for aromatic hydrocarbons when the fluorescence derives from the " normal" lowest excited singlet state associated with the molecules in the lattice. Since excitons can migrate in anthracene, it is not surprising that they can also migrate in ,8-perylene with analogous structural and fluorescent properties.
In pyrene and a-perylene the molecules are ordered in pairs with 4 molecules per unit cell. The fluorescence spectrum of these crystals consists of one broad practically unstructured band markedly displaced towards the red . This type of fluorescence resembles the emiss ion from excited dimers formed upon irradiation of concentrated solut ions of pyrene and perylene. It seems tha t in pyrene and cx-perylene the fluorescence derives from a charge-resonance state fo rmed between the molecule which absorbed the photon and the other molecule of the pair. The formation of a charge-resonance state will result in the dissipation of
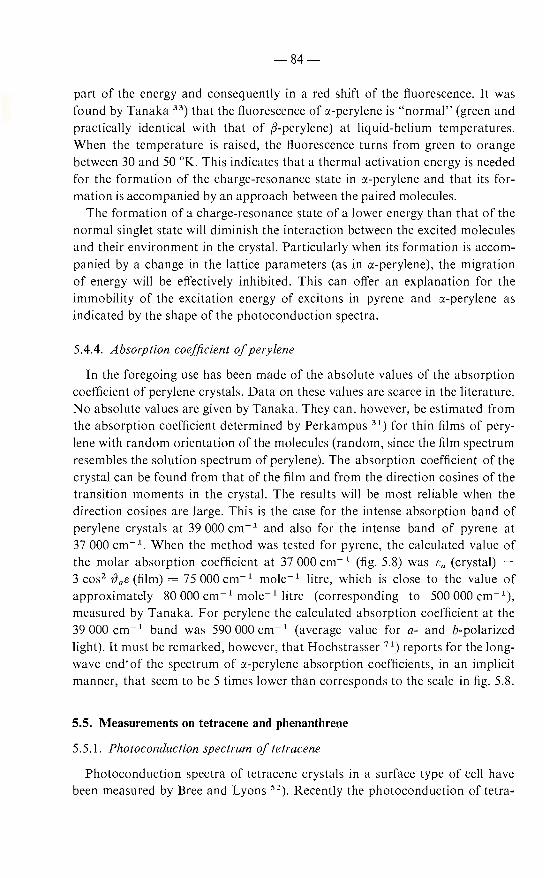
-84-
part of the energy and consequently in a red shift of the fluorescence. It was found by Tanaka 33
) that the fluorescence of a-perylene is "normal" (green and practically identical with that of /'i-perylene) at liquid-helium temperatures. When the temperature is raised, the fluorescence turns from green to orange between 30 and 50 °K. This indicates that a thermal activation energy is needed for the formation of the charge-resonance state in a-perylene and that its formation is accompanied by an approach between the paired molecules.
The formation of a charge-resonance state of a lower energy than that of the normal singlet state will diminish the interaction between the excited molecules and their environment in the crystal. Particularly when its formation is accompanied by a change in the lattice parameters (as in a-perylene), the migration of energy will be effectively inhibited. This can offer an explanation for the immobility of the excitation energy of excitons in pyrene and a-perylene as indicated by the shape of the photoconduction spectra.
5.4.4. Absorption coefficient of perylene
In the foregoing use has been made of the absolute values of the absorption coefficient of perylene crystals. Data on these values are scarce in the literature. No absolute values are given by Tanaka. They can, however, be estimated from the absorption coefficient determined by Perkampus 31 ) for thin films of perylene with random orientation of the molecules (random, since the film spectrum resembles the solution spectrum of perylene). The absorption coefficient of the crystal can be found from that of the film and from the direction cosines of the transition moments in the crystal. The results will be most reliable when the direction cosines are large. This is the case for the intense absorption band of perylene crystals at 39 000 cm- 1 and also for the intense band of pyrene at 37 000 cm- 1
. When the method was tested for pyrene, the calculated value of the molar absorption coefficient at 37 000 cm- 1 (fig. 5.8) was Bu (crystal) = 3 cos 2 ~as (film) = 75 000 cm- 1 mole- 1 litre, which is close to the value of approximately 80 000 cm- 1 mole- 1 litre (corresponding to 500 000 cm- 1 ),
measured by Tanaka. For perylene the calculated absorption coefficient at the 39 000 cm- 1 band was 590 000 cm- 1 (average value for a- and b-polarized light). It must be remarked, however, that Hochstrasser 71
) reports for the longwave end· of the spectrum of a-perylene absorption coefficients, in an implicit manner, that seem to be 5 times lower than corresponds to the scale in fig. 5.8.
5.5. Measurements on tetracene and phenanthrene
5.5.1. Photoconduction spectrum of tetracene
Photoconduction spectra of tetracene crystals in a surface type of cell have been measured by Bree and Lyons 52
). Recently the photoconduction of tetra-
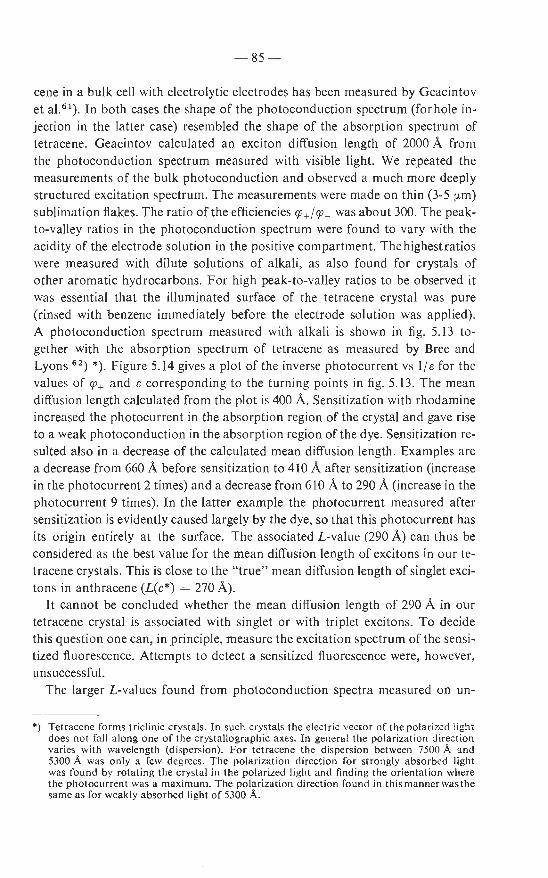
-85-
cene in a bulk cell with electrolytic electrodes has been measured by Geacintov et al. 61). In both cases the shape of the photoconduction spectrum (for hole injection in the latter case) resembled the shape of the absorption spectrum of tetracene. Geacintov calculated an exciton diffusion length of 2000 A from the photoconduction spectrum measured with visible light. We repeated the measurements of the bulk photoconduction and observed a much more deeply structured excitation spectrum. The measurements were made on thin (3-5 rm) sublimation flakes. The ratio of the efficiencies CfJ+ ! CfJ- was about 300. The peakto-valley ratios in the photoconduction spectrum were found to vary with the acidity of the electrode solution in the positive compartment. The highestratios were measured with dilute solutions of alkali, as also found for crystals of other aromatic hydrocarbons. For high peak-to-valley ratios to be observed it was essential that the illuminated surface of the tetracene crystal was pure (rinsed with benzene immediately before the electrode solution was applied). A photoconduction spectrum measured with alkali is shown in fig. 5.13 together with the absorption spectrum of tetracene as measured by Bree and Lyons 62
) *). Figure 5.14 gives a plot of the inverse photocurrent vs 1/ s for the values of CfJ+ and s corresponding to the turning points in fig . 5.13. The mean diffusion length calculated from the plot is 400 A. Sensitization with rhodamine increased the photocurrent in the absorption region of the crystal and gave rise to a weak photoconduction in the absorption region of the dye. Sensitization resulted also in a decrease of the calculated mean diffusion length. Examples are a decrease from 660 A before sensitization to 410 A after sensitization (increase in the photocurrent 2 times) and a decrease from 610 A to 290 A (increase in the photocurrent 9 times). In the la tter example the photocurrent measured after sensitization is evidently caused largely by the dye, so that this photocurrent has its origin entirely at the surface. The associated L-value (290 A) can thus be considered as the best value for the mean diffusion length of excitons in our tetracene crystals. This is close to the "true" mean diffusion length of singlet excitons in anthracene (L(c*) = 270 A).
It cannot be concluded whether the mean diffusion length of 290 A in our tetracene crystal is associated with singlet or with triplet excitons. To decide this question one can, in principle, measure the excitation spectrum of the sensitized fluorescence. Attempts to detect a sensitized fluorescence were, however, unsuccessful.
The la rger L -values found from photoconduction spectra measured on un-
*) 'fetracene forms triclinic crystals. In such crystals the electric vector of t he polarized light does not fall along one of the crystallographic axes. In general the polarizat ion direct ion varies with wavelength (dispersion) . For tetracene the d ispersion between 7500 A and 5300 A was only a few degrees. T he polarization direction for stro ngly absorbed light was found by rotating the crystal in the polarized light and finding the o riental ion where the pho tocurrent was a maximum. The po larization direct ion found in thismannerwas the same as for weakly absorbed light of 5300 A.
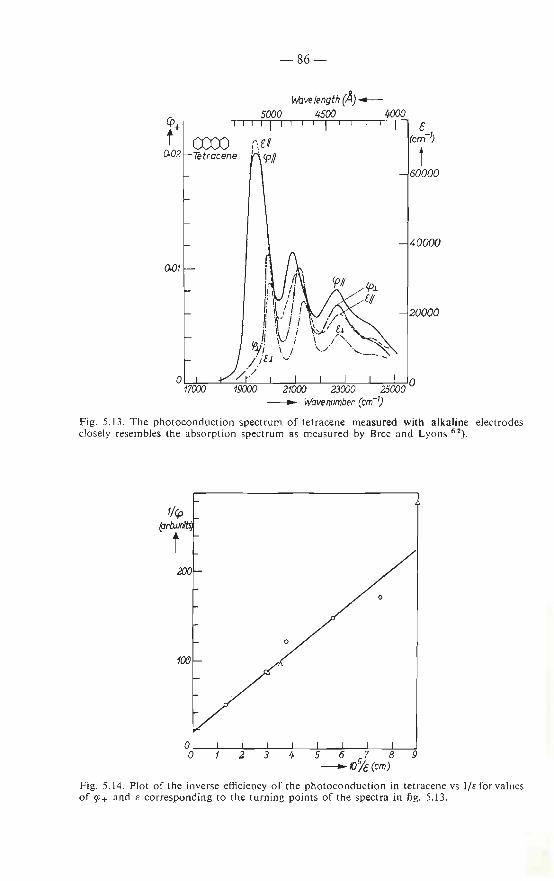
- 86-
~+.-----.. ~~T.-.~r.-.-.~TI c t rYYY"'' (cm-1)
0.02 ~e f
0.01
Fig. 5.13. The photoconduction spectrum of tetracene measured with alkaline electrodes closely resembles the absorption spectrum as measured by Brcc and Lyons 62).
1/ep (prb.unit
i
0
0
Fig. 5. 14. Plot of the inverse efficiency of the photoconduction in tetracene vs 1/e for values of CfJ + and e corresponding to the turning points of the spectra in fig. 5. 13.
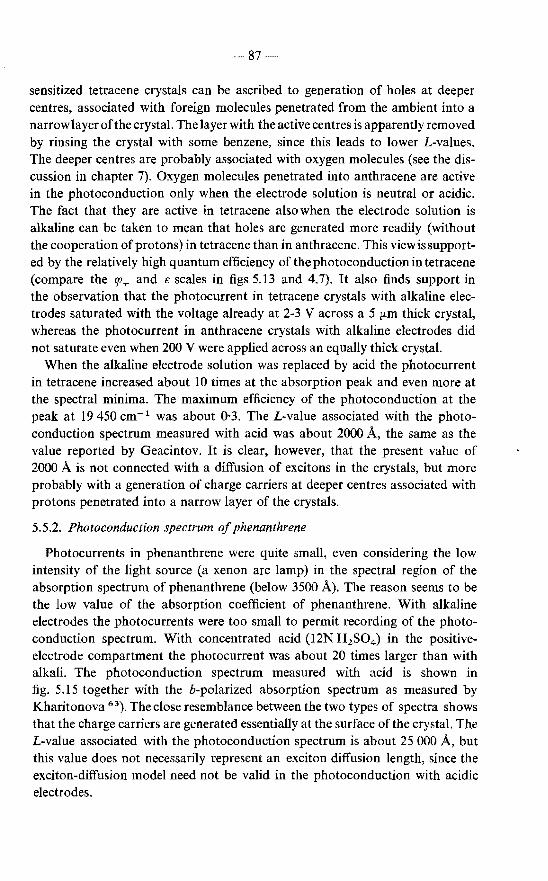
87
sensitized tetracene crystals can be ascribed to generation of holes at deeper centres, associated with foreign molecules penetrated from the ambient into a narrow layer of the crystal. The layer with the active centres is apparently removed by rinsing the crystal with some benzene, since this leads to lower L-values. The deeper centres are probably associated with oxygen molecules (see the discussion in chapter 7). Oxygen molecules penetrated into anthracene are active in the photoconduction only when the electrode solution is neutral or acidic. The fact that they are active in tetracene also when the electrode solution is alkaline can be taken to mean that holes are generated more readily (without the cooperation of protons) in tetracene than in anthracene. This view is supported by the relatively high quantum efficiency of the photoconduction in tetracene (compare the P+ and s scales in figs 5.13 and 4.7). It also finds support in the observation that the photocurrent in tetracene crystals with alkaline electrodes saturated with the voltage already at 2-3 V across a 5 11-m thick crystal, whereas the photocurrent in anthracene crystals with alkaline electrodes did not saturate even when 200 V were applied across an equally thick crystal.
When the alkaline electrode solution was replaced by acid the photocurrent in tetracene increased about 10 times at the absorption peak and even more at the spectral minima. The maximum efficiency of the photoconduction at the peak at 19 450 cm- 1 was about 0·3. The L-value associated with the photoconduction spectrum measured with acid was about 2000 A, the same as the value reported by Geacintov. It is clear, however, that the present value of 2000 A is not connected with a diffusion of excitons in the crystals, but more probably with a generation of charge carriers at deeper centres associated with protons penetrated into a narrow layer of the crystals.
5.5.2. Photoconduction spectrum of phenanthrene
Photocurrents in phenanthrene were quite small, even considering the low intensity of the light source (a xenon arc lamp) in the spectral region of the absorption spectrum of phenanthrene (below 3500 A). The reason seems to be the low value of the absorption coefficient of phenanthrene. With alkaline electrodes the photocurrents were too small to permit recording of the photoconduction spectrum. With concentrated acid (12N H 2S04 ) in the positiveelectrode compartment the photocurrent was about 20 times larger than with alkali. The photoconduction spectrum measured with acid is shown in fig. 5.15 together with the b-polarized absorption spectrum as measured by Kharitonova 63). The close resemblance between the two types of spectra shows that the charge carriers are generated essentially at the surface of the crystal. The L-value associated with the photoconduction spectrum is about 25 000 A, but this value does not necessarily represent an exciton diffusion length, since the exciton-diffusion model need not be valid in the photoconduction with acidic electrodes.
-88
~ ~ {) Phenanthrene II w II II
::c-b ,, ,, It 'I ,, II II II I I I I I 1 I I I I I 1 I 1
I
0 0 35000 40000
---Wave number(fm-1)
Fig. 5.15. Photoconduction spectrum of phenanthrene with a 12N solution of H 2 SO 4
in the positive compartment and the b-polarized absorption spectrum of phenanthrene as measured by Kharitonova 63).
89
6. REACTIONS OF EXCITONS AT THE SURFACE OF ANTHRACENE CRYSTALS
So far we have studied mainly the role of exciton diffusion in the nonradiative annihilation of excitons at the surface. In this chapter we shall discuss the nature of the surface reactions responsible for the annihilation. Some insight in these processes was gained by varying the composition of the aqueous solution in contact with the illuminated surface of anthracene crystals and observing the effect on the fluorescence intensity and the photoconduction. All experiments were made on crystals grown from solutions in dichloroethane.
6.1. The efficiency of the quenching of the fluorescence at the surface
Information on the reactions of excitons at the surface of crystals in contact with aqueous solutions can be obtained by varying the composition of the solution and observing the quenching of the crystal fluorescence at the surface. In this section we shall discuss a method of determining the efficiency of the quenching process from excitation spectra of the fluorescence. For this purpose the quenching efficiency q;q is defined as the number of excitons quenched in surface reactions with "extrinsic" chemical agents per photon absorbed in the crystal. The quenching efficiency can be expressed simply in terms of fluorescence intensities as follows.
Using the same symbols as in sec. 4.4 it is supposed that per photon absorbed in the crystal p excitons contact the surface during their lifetime. Of these a fraction g is trapped at the surface, while a fraction 1 - g is "reflected" back into the crystal. Of the gp excitons trapped at the surface of the crystal a total of rpq hgp excitons is quenched in reactions with extrinsic chemical agents at the surface of the crystal. The excitons that reach the surface without interacting with extrinsic chemical agents end their life either right at the surface or very close to it after "reflection". We shall treat these excitons as a single class for which the fluorescence probability is q;,. The number of excitons of this group annihilated under emission of fluorescence is therefore
fPr(l h) g P + q;.(l -g) p.
Of the fluorescence emitted at or near the surface the photomultiplier detects a proportion nr. For excitons ending their life in the bulk of the crystal the probability of fluorescence is q;b. Of the fluorescence originating in the bulk the photomultiplier detects a proportion n0(s). The total fluorescence intensity detected by the photomultiplier can now be written
-90-
It may be remarked that the probability of fluorescence q;, at or near the surface will not be very different from the probability of fluorescence q;b of excitons that end their life in the bulk of the crystal.
When the solution in contact with the surface is completely inactive in quenching the fluorescence, then h = 0. The fluorescence intensity / 0 observed in this case is
(6.2)
The difference !Jf between the intensities observed with non-quenching and quenching solutions is thus
!Jf =/o-f= n,q;,hgp. (6.3)
For infinitely strong absorbed light (p = 1) and no surface quenching we have from (6.2)
fo(p = 1) = n,q;,.
From {6.3) and {6.4) the quenching efficiency is found to be
gJq = hgp = !Jf!fo(p = 1).
(6.4)
(6.5)
It follows that the quenching efficiency can be determined by taking the difference between the observed intensity and the intensity / 0 that would be observed with the same exciting light on the same crystal in contact with a non-quenching solution and dividing by the intensity f 0(p 1) for a non-quenching solution extrapolated to an infinite absorption coefficient *).
The problem is, of course, to determine / 0 and / 0 (p 1). The best experimental approximation to / 0 is the least structured excitation spectrum of the fluorescence that can be measured on a given crystal. This can be seen as follows. The causes of structure in the excitation spectrum of the fluorescence are quenching of excitons at the surface and variations in the proportion of the fluorescent light that escapes reabsorption by leaving the crystal through the illuminated surface. The latter effect has been discussed by Wright 7). The smaller the penetration depth of the exciting light the larger the escape factor and the smaller the proportion of the fluorescent light that is ultimately caught as a fluorescence of long wavelengths between the parallel faces of the crystal and detected by~the photomultiplier in the experimental arrangement of fig. 4. 13. The variations in the escape factor will thus cause a structure in the excitation
*) In the discussion given above it is not essential that the exciton-diffusion model be strictly valid (it frequently is not). The discussion is valid as long as excitons are quenched by extrinsic agents at or very close to the surface. Any deeper quenching centres can be considered as an extension of the surface that can be active or inactive depending on the composition of the solution in contact with the crystal.
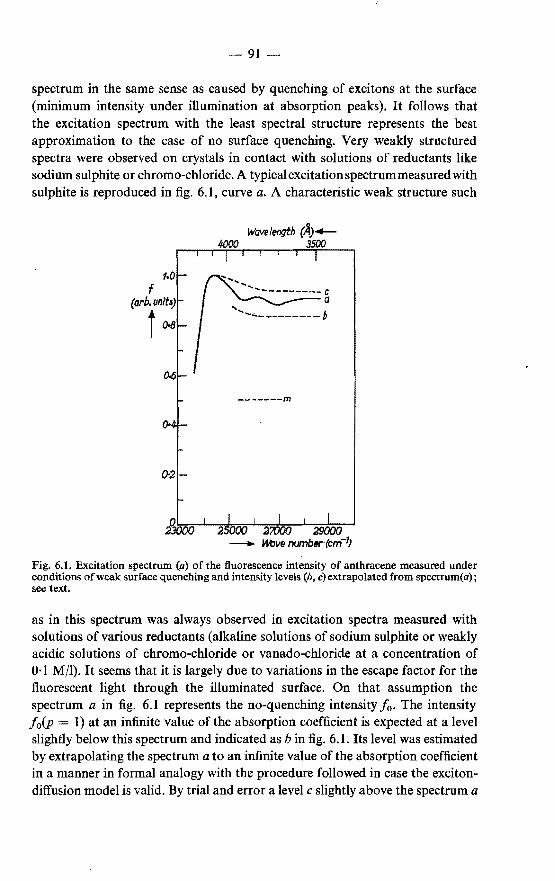
-91-
spectrum in the same sense as caused by quenching of excitons at the surface {minimum intensity under illumination at absorption peaks). It follows that the excitation spectrum with the least spectral structure represents the best approximation to the case of no surface quenching. Very weakly structured spectra were observed on crystals in contact with solutions of reductants like sodium sulphite or chromo-chloride. A typicalexcitationspectrummeasured with sulphite is reproduced in fig. 6.1, curve a. A characteristic weak structure such
Wavelength (A}+-Ij()()O 3500
Fig. 6.1. Excitation spectrum (a) of the fluorescence intensity of anthracene measured under conditions of weak surface quenching and intensity levels (b, c)extrapolated from spectrum(a); see text.
as in this spectrum was always observed in excitation spectra measured with solutions of various reductants (alkaline solutions of sodium sulphite or weakly acidic solutions of chromo-chloride or vanado-chloride at a concentration of 0·1 M/1). It seems that it is largely due to variations in the escape factor for the fluorescent light through the illuminated surface. On that assumption the spectrum a in fig. 6.1 represents the no-quenching intensity / 0 • The intensity f 0(p 1) at an infinite value of the absorption coefficient is expected at a level slightly below this spectrum and indicated as b in fig. 6.1. Its level was estimated by extrapolating the spectrum a to an infinite value of the absorption coefficient in a manner in formal analogy with the procedure followed in case the excitondiffusion model is valid. By trial and error a level c slightly above the spectrum a
-92-
was found in such a manner that 1/(c a) plotted vs 1/e gave a straight line which was extrapolated to 1/e 0 *).
When the fluorescence intensity observed with a quenching solution is m, the quenching efficiency is now, according to eq. (6.5),
<pq = (a- m)jb. (6.6)
Its value is, of course, a function of the penetration depth of the exciting light. The most instructive value of <f!q would be <pq(p = 1) associated with an infinite absorption coefficient. The value of <pq(p 1) can, in principle, vary between zero, when a = b m, and unity, when m 0 and a = b in eq. (6.6). However, since we want to compare the quenching efficiency fPq and the efficiency <fi+ of the photoconduction it seems most straightforward to measure <pq and Cf!+
under illumination at the absorption maximum (where both are greatest) and to compare these values instead of extrapolating to an infinite absorption coefficient. The latter procedure would be complicated by the fact that the shape of the excitation spectrum is not a characteristic of the crystal but varies with the composition of the aqueous electrode solution.
In the following section we shall discuss effects on cpq and Cf!+ of variations in the concentration of acid in the aqueous solution in contact with the crystal and find a correlation between the two types of effects.
6.2. Effects of acid on the fluorescence and the photocondnction of anthracene crystals
6.2.1. Quenching of the fluorescence by acids
The quenching of the fluorescence of anthracene crystals by aqueous solutions of mineral acids was determined by measuring the intensity of the fluorescence emitted by the crystal in contact with respectively the solution to be investigated and an alkaline solution of sodium sulphite. As mentioned, it is assumed that there is no surface quenching of the fluorescence when crystals are in contact with a solution of sodium sulphite. In each experiment the fluorescence intensity was measured under illumination at the absorption maximum and at the absorption edge (24 000 cm- 1
). At the absorption edge the intensity is independent of the composition ofthe solution. Small random variations in the intensity at the absorption edge resulted from removing and replacing the cell with the crystal. To eliminate the effect of such random variations, the intensity at the
*) At the absorption edge in fig. 6.1 the curve c curves slightly upwards, apparently on account of an increase in the fluorescence yield Cf!b· A larger fluorescence yield under illumination at the absorption edge has been attributed 10
) to a direct excitation of "fluorescence centres" in the crystal characterized by a somewhat lowerexcitationenergythanthatofnormal molecules.
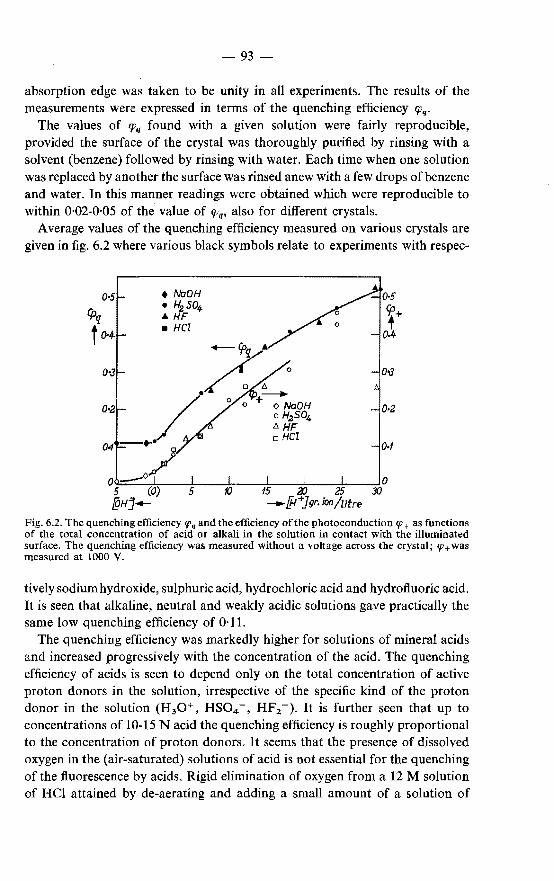
-93-
absorption edge was taken to be unity in all experiments. The results of the measurements were expressed in terms of the quenching efficiency fPq·
The values of pq found with a given solution were fairly reproducible, provided the surface of the crystal was thoroughly purified by rinsing with a solvent (benzene) followed by rinsing with water. Each time when one solution was replaced by another the surface was rinsed anew with a few drops of benzene and water. In this manner readings were obtained which were reproducible to within 0·02-0·05 of the value of pq, also for different crystals.
Average values of the quenching efficiency measured on various crystals are given in fig. 6.2 where various black symbols relate to experiments with respec-
• NaOH • H2 so • .t. HF • HCl
0 ~--~----~--~--~~~--~~---2~5~~~
- /ii+J gr. ion /litre
Fig. 6.2. The quenching efficiency 'P • and the efficiency of the photoconduction 'P + as functions of the total concentration of acid or alkali in the solution in contact with the illuminated surface. The quenching efficiency was measured without a voltage across the crystal; 'P +was measured at 1000 V.
tively sodium hydroxide, sulphuric acid, hydrochloric acid and hydrofluoric acid. It is seen that alkaline, neutral and weakly acidic solutions gave practically the same low quenching efficiency of 0·11.
The quenching efficiency was markedly higher for solutions of mineral acids and increased progressively with the concentration of the acid. The quenching efficiency of acids is seen to depend only on the total concentration of active proton donors in the solution, irrespective of the specific kind of the proton donor in the solution (H30+, HS04 -, HF 2 -). It is further seen that up to concentrations of 10-15 N acid the quenching efficiency is roughly proportional to the concentration of proton donors. It seems that the presence of dissolved oxygen in the (air-saturated) solutions of acid is not essential for the quenching of the fluorescence by acids. Rigid elimination of oxygen from a 12 M solution of HCl attained by de-aerating and adding a small amount of a solution of
-94-
CrC12 did not stop the quenching, but resulted only in a decrease in <pq from 0·30 to 0·20 on average. This shows that the quenching is brought about by only the acid and that it can be attributed to a reaction between an excited anthracene molecule and a molecule of a proton donor in the solution. Quenching of the fluorescence of solutions of anthracene in organic solvents by strong acids has been observed earlier 64
). The quenching effect of acids is apparently a consequence of the strong basic. properties of the excited singlet state of anthracene and has been attributed to the formation of a non-fluorescent excited proton adduct of anthracene. Apparently proton adducts can be formed not only in solutions of anthracene in organic solvents but also at the surface of anthracene crystals in contact with aqueous solutio~s of mineral acids.
6.2.2. Effect of acid on the photoconduction
Mineral acids not only quench the fluorescence of anthracene crystals, they also promote the photoconduction when present in the positive-electrode compartment. To compare the effects of acid on the photoconduction and the fluorescence, measurements of the efficiency <fl+ of the photoconduction were made with the same exciting light for solutions of the same acids (H2S02 ,
HCl, HF) as used in measuring the quenching efficiency. The photocurrent was measured immediately after an electrode solution had been applied to the crystal. Each time before a fresh solution was applied, the surface of the crystal was rinsed with a few drops of benzene and water. With these precautions the photocurrent was a fairly reproducible function of the concentration of acid, also with different crystals.
The variation of 'P+ with the total concentration of acid in the electrode solution is given by the open symbols in fig. 6.2. Symbols of different shapes relate to measurements with different acids, as indicated in the figure. The efficiencies <fl+ plotted in the figure were all measured at the same high voltage of 1000 V. It is seen that <fl+ increases markedly with increasing concentration of acid. Like <pq, If!+ depends only on the total concentration of acid and not on the particular kind of acid except at concentrations higher than 15 N[H+], where sulphuric acid is more effective than hydrofluoric acid.
The values of <fl+ given in fig. 6.2 were not very sensitive to the applied voltage V. This can be seen in fig. 6.3, which gives <fl+ vs V curves measured on one and the same crystal in contact with solutions of sulphuric acid and sodium hydroxide in various concentrations. At high voltages the variation of <fl+ with Vis quite small.
6.2.3. "Primary" photoconduction in anthracene crystals with acidic electrode solutions
An important feature of the photoconduction is the complete saturation of
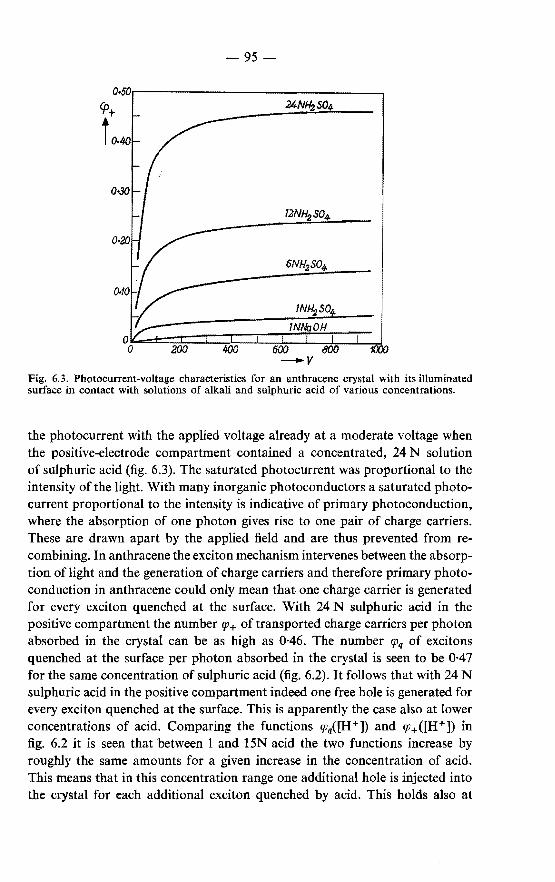
-95-
6NH2 SOq. -
TNNaOH
600 800 1000 -v
Fig. 6.3. Photocurrent-voltage characteristics for an anthracene crystal with its illuminated surface in contact with solutions of alkali and sulphuric acid of various concentrations.
the photocurrent with the applied voltage already at a moderate voltage when the positive-electrode compartment contained a concentrated, 24 N solution of sulphuric acid (fig. 6.3). The saturated photocurrent was proportional to the intensity of the light. With many inorganic photoconductors a saturated photocurrent proportional to the intensity is indicative of primary photoconduction, where the absorption of one photon gives rise to one pair of charge carriers. These are drawn apart by the applied field and are thus prevented from recombining. In anthracene the exciton mechanism intervenes between the absorption of light and the generation of charge carriers and therefore primary photoconduction in anthracene could only mean that one charge carrier is generated for every exciton quenched at the surface. With 24 N sulphuric acid in the positive compartment the number fP+ of transported charge carriers per photon absorbed in the crystal can be as high as 0·46. The number ffiq of excitons quenched at the surface per photon absorbed in the crystal is seen to be 0·47 for the same concentration of sulphuric acid (fig. 6.2). It follows that with 24 N sulphuric acid in the positive compartment indeed one free hole is generated for every exciton quenched at the surface. This is apparently the case also at lower concentrations of acid. Comparing the functions rpq{[H+]) and fP+([H+]) in fig. 6.2 it is seen that between 1 and 15N acid the two functions increase by roughly the same amounts for a given increase in the concentration of acid. This means that in this concentration range one additional hole is injected into the crystal for each additional exciton quenched by acid. This holds also at
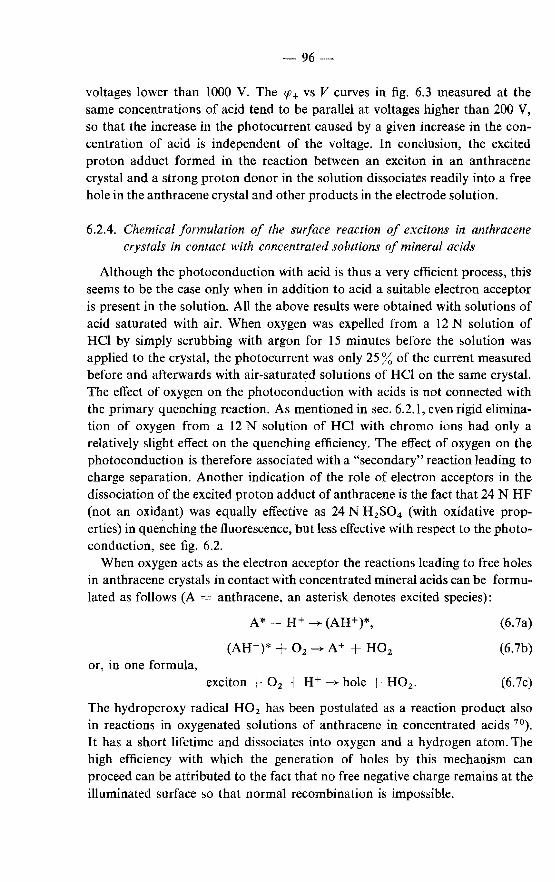
-96
voltages lower than 1000 V. The IP+ vs V curves in fig. 6.3 measured at the same concentrations of acid tend to be parallel at voltages higher than 200 V, so that the increase in the photocurrent caused by a given increase in the concentration of acid is independent of the voltage. In conclusion, the excited proton adduct formed in the reaction between an exciton in an anthracene crystal and a strong proton donor in the solution dissociates readily into a free hole in the anthracene crystal and other products in the electrode solution.
6.2.4. Chemical formulation of the surface reaction of excitons in anthracene crystals in contact with concentrated solutions of mineral acids
Although the photoconduction with acid is thus a very efficient process, this seems to be the case only when in addition to acid a suitable electron acceptor is present in the solution. All the above results were obtained with solutions of acid saturated with air. When oxygen was expelled from a 12 N solution of HCl by simply scrubbing with argon for 15 minutes before the solution was applied to the crystal, the photocurrent was only 25% of the current measured before and afterwards with air-saturated solutions of HCl on the same crystal. The effect of oxygen on the photoconduction with acids is not connected with the primary quenching reaction. As mentioned in sec. 6.2.1, even rigid elimination of oxygen from a 12 N solution of HCl with chromo ions had only a relatively slight effect on the quenching efficiency. The effect of oxygen on the photoconduction is therefore associated with a "secondary" reaction leading to charge separation. Another indication of the role of electron acceptors in the dissociation of the excited proton adduct of anthracene is the fact that 24 N HF (not an oxidant) was equally effective as 24 N H 2S04 (with oxidative properties) in quenching the fluorescence, but less effective with respect to the photoconduction, see fig. 6.2.
When oxygen acts as the electron acceptor the reactions leading to free holes in anthracene crystals in contact with concentrated mineral acids can be formulated as follows (A = anthracene, an asterisk denotes excited species):
or, in one formula, exciton 0 2 H+ -+hole + H02 •
(6.7a)
(6.7b)
(6.7c)
The hydroperoxy radical H02 has been postulated as a reaction product also in reactions in oxygenated solutions of anthracene in concentrated acids 70).
It has a short lifetime and dissociates into oxygen and a hydrogen atom. The high efficiency with which the generation of holes by this mechanism can proceed can be attributed to the fact that no free negative charge remains at the illuminated surface so that normal recombination is impossible.
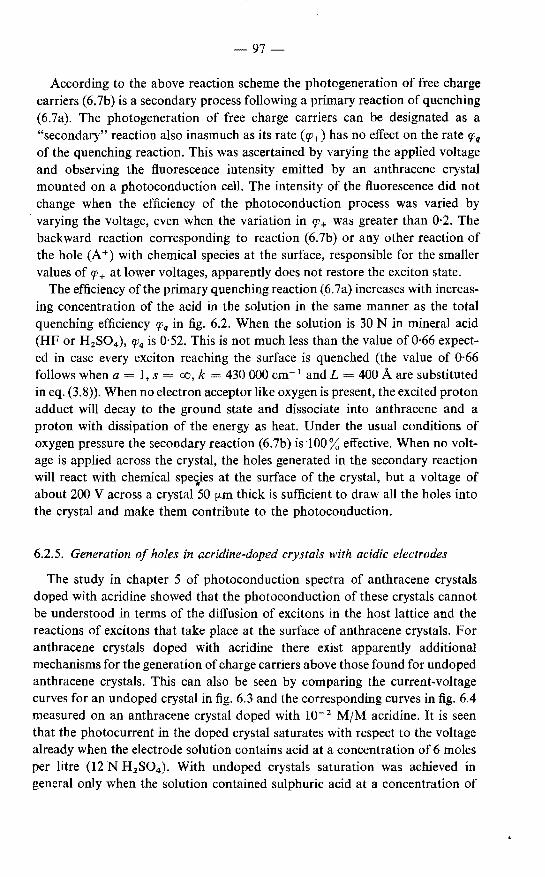
97-
According to the above reaction scheme the photogeneration of free charge carriers (6.7b) is a secondary process following a primary reaction of quenching (6.7a). The photogeneration of free charge carriers can be designated as a "secondary" reaction also inasmuch as its rate (q:;+) has no effect on the rate !Jlq of the quenching reaction. This was ascertained by varying the applied voltage and observing the fluorescence intensity emitted by an anthracene crystal mounted on a photoconduction cell. The intensity of the fluorescence did not change when the efficiency of the photoconduction process was varied by
· varying the voltage, even when the variation in !Jl+ was greater than 0·2. The backward reaction corresponding to reaction (6.7b) or any other reaction of the hole (A+) with chemical species at the surface, responsible for the smaller values of !Jl+ at lower voltages, apparently does not restore the exciton state.
The efficiency of the primary quenching reaction (6.7a) increases with increasing concentration of the acid in the solution in the same manner as the total quenching efficiency rpq in fig. 6.2. When the solution is 30 N in mineral acid (HF or H2S04 ), !Jlq is 0·52. This is not much less than the value of 0·66 expected in case every exciton reaching the surface is quenched (the value of 0·66 follows when a I, s = oo, k 430 000 cm- 1 and L 400 A are substituted in eq. (3.8)). When no electron acceptor like oxygen is present, the excited proton adduct will decay to the ground state and dissociate into anthracene and a proton with dissipation of the energy as heat. Under the usual conditions of oxygen pressure the secondary reaction ( 6. 7b) is ·1 00% effective. When no voltage is applied across the crystal, the holes generated in the secondary reaction will react with chemical spe~ies at the surface of the crystal, but a voltage of about 200 V across a crystal 50 f.LID thick is sufficient to draw all the holes into the crystal and make them contribute to the photoconduction.
6.2.5. Generation of holes in acridine-doped crystals with acidic electrodes
The study in chapter 5 of photoconduction spectra of anthracene crystals doped with acridine showed that the photoconduction of these crystals cannot be understood in terms of the diffusion of excitons in the host lattice and the reactions of excitons that take place at the surface of anthracene crystals. For anthracene crystals doped with acridine there exist apparently additional mechanisms for the generation of charge carriers above those found for undoped anthracene crystals. This can also be seen by comparing the current-voltage curves for an undoped crystal in fig. 6.3 and the corresponding curves in fig. 6.4 measured on an anthracene crystal doped with l0- 2 MjM acridine. It is seen that the photocurrent in the doped crystal saturates with respect to the voltage already when the electrode solution contains acid at a concentration of 6 moles per litre (12 N H2S04 ). With undoped crystals saturation was achieved in general only when the solution contained sulphuric acid at a concentration of
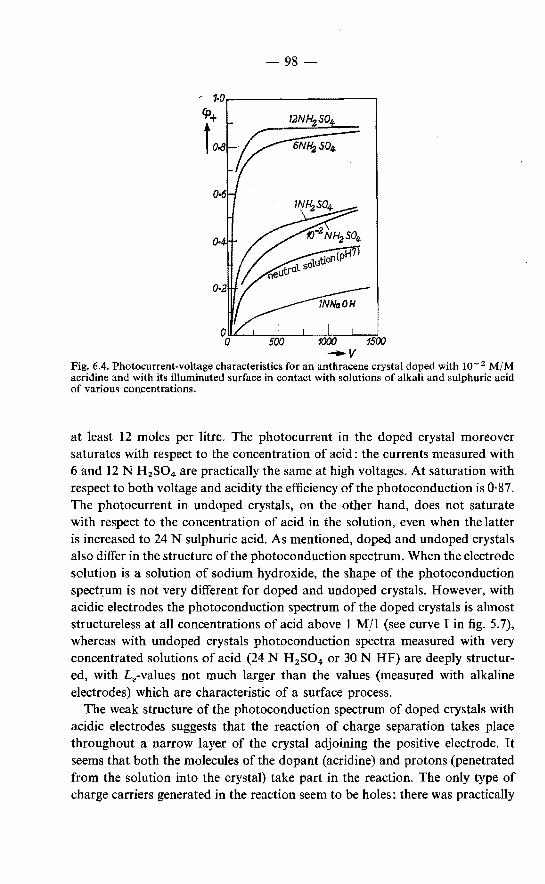
-98
1()()() 1500 -v
Fig. 6.4. Photocurrent-voltage characteristics for an anthracene crystal doped with 10- 2 M/M acridine and with its illuminated surface in contact with solutions of alkali and sulphuric acid of various concentrations.
at least 12 moles per litre. The photocurrent in the doped crystal moreover saturates with respect to the concentration of acid: the currents measured with 6 and 12 N H2S04 are practically the same at high voltages. At saturation with respect to both voltage and acidity the efficiency of the photoconduction is 0·87. The photocurrent in undoped crystals, on the other hand, does not saturate with respect to the concentration of acid in the solution, even when the latter is increased to 24 N sulphuric acid. As mentioned, doped and undoped crystals also differ in the structure of the photoconduction spectrum. When the electrode solution is a solution of sodium hydroxide, the shape of the photoconduction spectt;um is not very different for doped and undoped crystals. However, with acidic electrodes the photoconduction spectrum of the doped crystals is almost structureless at all concentrations of acid above 1 M/1 (see curve I in fig. 5.7), whereas with undoped crystals photoconduction spectra measured with very concentrated solutions of acid (24 N H2S04 or 30 N HF) are deeply structured, with £.,-values not much larger than the values (measured with alkaline electrodes) which are characteristic of a surface process.
The weak structure of the photoconduction spectrum of doped crystals with acidic electrodes suggests that the reaction of charge separation takes place throughout a narrow layer of the crystal adjoining the positive electrode. It seems that both the molecules of the dopant (acridine) and protons (penetrated from the solution into the crystal) take part in the reaction. The only type of charge carriers generated in the reaction seem to be holes: there was practically
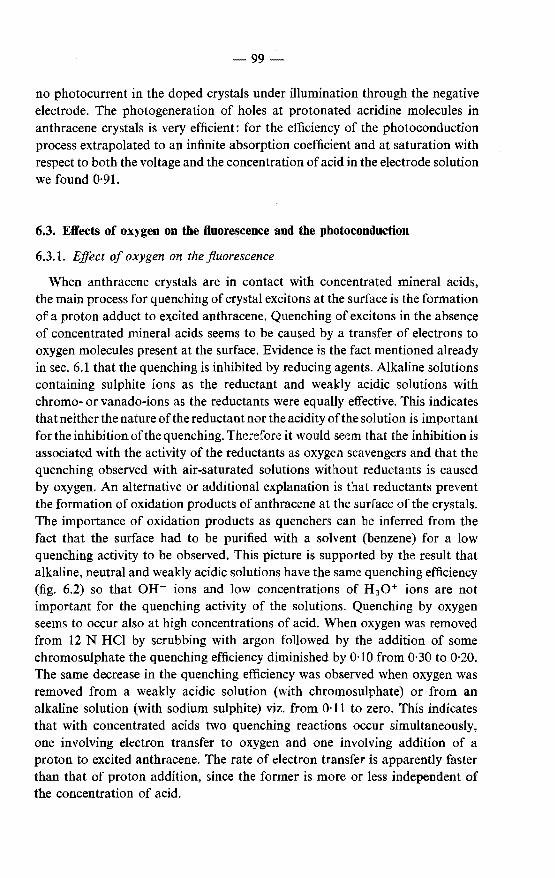
99
no photocurrent in the doped crystals under illumination through the negative electrode. The photogeneration of holes at protonated acridine molecules in anthracene crystals is very efficient: for the efficiency of the photoconduction process extrapolated to an infinite absorption coefficient and at saturation with respect to both the voltage and the concentration of acid in the electrode solution we found 0·91.
6.3. Effects of oxygen on the ftuorescence and the photoconduction
6.3.1. Effect of oxygen on the fluorescence
When anthracene crystals are in contact with concentrated mineral acids, the main process for quenching of crystal excitons at the surface is the formation of a proton adduct to excited anthracene. Quenching of excitons in the absence of concentrated mineral acids seems to be caused by a transfer of electrons to oxygen molecules present at the surface. Evidence is the fact mentioned already in sec. 6.1 that the quenching is inhibited by reducing agents. Alkaline solutions containing sulphite ions as the reductant and weakly acidic solutions with chromo- or vanado-ions as the reductants were equally effective. This indicates that neither the nature of the reductant nor the acidity of the solution is important fortheinhibitionofthequenching. Thc:-efore it would seem that the inhibition is associated with the activity of the reductants as oxygen scavengers and that the quenching observed with air-saturated solutions without reductants is caused by oxygen. An alternative or additional explanation is that reductants prevent the formation of oxidation products of anthracene at the surface of the crystals. The importance of oxidation products as quenchers can be inferred from the fact that the surface had to be purified with a solvent (benzene) for a low quenching activity to be observed. This picture is supported by the result that alkaline, neutral and weakly acidic solutions have the same quenching efficiency (fig. 6.2) so that OH- ions and low concentrations of H 30+ ions are not important for the quenching activity of the solutions. Quenching by oxygen seems to occur also at high concentrations of acid. When oxygen was removed from 12 N HCl by scrubbing with argon followed by the addition of some chromosulphate the quenching efficiency diminished by 0·10 from 0·30 to 0·20. The same decrease in the quenching efficiency was observed when oxygen was removed from a weakly acidic solution (with chromosulphate) or from an alkaline solution (with sodium sulphite) viz. from 0·11 to zero. This indicates that with concentrated acids two quenching reactions occur simultaneously, one involving electron transfer to oxygen and one involving addition of a proton to excited anthracene. The rate of electron transfer is apparently faster than that of proton addition, since the former is more or less independent of the concentration of acid.
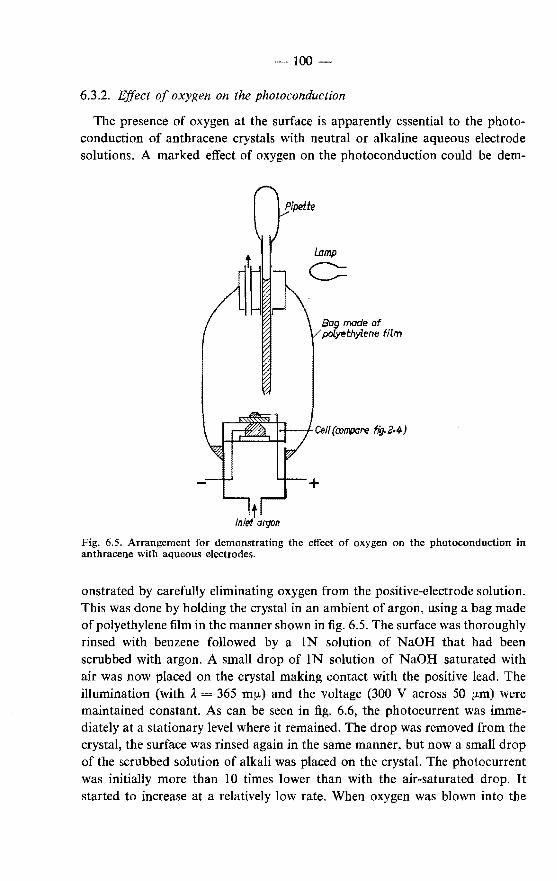
100-
6.3.2. Effect of oxygen on the photoconduction
The presence of oxygen at the surface is apparently essential to the photoconduction of anthracene crystals with neutral or alkaline aqueous electrode solutions. A marked effect of oxygen on the photoconduction could be dem-
Lamp
~
Bag made of polyethylene film
Cell (COfTVXJI'e fig.2.1f)
Fig. 6.5. Arrangement for demonstrating the effect of (}xygen on the photoconduction in anthracene with aqueous electrodes.
onstrated by carefully eliminating oxygen from the positive-electrode solution. This was done by holding the crystal in an ambient of argon, using a bag made of polyethylene film in the manner shown in fig. 6.5. The surface was thoroughly rinsed with benzene followed by a IN solution of NaOH that had been scrubbed with argon. A small drop of l N solution of NaOH saturated with air was now placed on the crystal making contact with the positive lead. The illumination (with It = 365 IDtJ.) and the voltage (300 V across 50 [LID) were maintained constant. As can be seen in fig. 6.6, the photocurrent was immediately at a stationary level where it remained. The drop was removed from the crystal, the surface was rinsed again in the same manner, but now a small drop of the scrubbed solution of alkali was placed on the crystal. The photocurrent was initially more than 10 times lower than with the air-saturated drop. It started to increase at a relatively low rate. When oxygen was blown into the
-101-
If>+
i <):>+
-tnin- -Tfme
6.6. Effect of oxygen on the photoconduction in anthracene with a drop of a 1 N solution alkali as the positive electrode in the arrangement of fig. 6.5.
bag, the photocurrent started to increase much more rapidly to a level above that measured with the air-saturated drop (fig. 6.6). It follows that simply de-aerating an alkaline electrode solution can reduce the photocurrent 10 times.
A much larger reduction in the photocurrent was brought about when oxygen was eliminated by adding a strong reductant, for instance chromo ions, to a 0·1 N solution of sulphuric acid. When a moderate voltage was applied across a crystal the photocurrent measured with a solution containing chromo-ions was on average 60 times lower than the photocurrent measured in the absence of the reductant. Its effect on the photocurrent is thought to be connected not only with their activity as scavengers of oxygen but also with the neutralization of holes by the reductant (electron donor) at the illuminated surface. An indication is that the inhibition of the photoconduction by the reductant became less pronounced when the voltage was increased.
6.3.3. Chemical formulation of the swface reaction of excitons with oxygen
In the reaction of excitons with oxygen and other oxidants the primary reaction would be the formation of a short-lived, excited electron-transfer state. The formation of short-lived electron-transfer states between excited molecules of aromatic hydrocarbons (perylene) and electron acceptors (chloranil) in solutions has been observed by flash spectroscopy 65). For the formation of such states it is not only the thermodynamic oxidation potential of the agent which is important, but obviously also the rate of the reaction. The electrontransfer state must be formed within about w- 8 s, which is the lifetime of excitons on anthracene. Thus one can attribute to kinetic factors the fact that a powerful oxidant like sodium persulphate was quite inactive as a quencher of the fluorescence of anthracene crystals, whereas sodium hypochlorite was very active.
Oxygen is the active agent not only in the bulk photoconduction of anthracene
- 102
in sandwich cells with aqueous electrodes (without special oxidants) but also in the surface conduction in cells with two electrodes on the illuminated surface. Bree and Lyons 66
) observed that the photocurrent in a surface cell decreased markedly when the cell was placed in a high vacuum. Although oxygen is the active agent in either case, the quantum efficiency of the photoconduction in a surface cell is much lower than the quantum efficiency in a bulk cell with aqueous electrodes. We measured a quantum efficiency of only about IQ- 4 in a surface cell with two painted silver electrodes (at the same side of the crystal) as against I0- 2 with the same crystal in a bulk cell with alkaline aqueous electrodes under the same illumination and with the same applied field (~ 3.104 Vfcm). The higher quantum efficiency measured with aqueous electrodes can be attributed to a localization by water dipoles of the negative charge on oxygen in the initially formed excited electron-transfer state. As a result, the probability of recombination of the electron on oxygen and the hole on anthracene is decreased. In weakly acidic solutions the electron on oxygen can be localized (neutralized) by a hydrogen ion.
In this case the reactions leading to charge carriers can be formulated as follows (A anthracene, an asterisk denotes excited species):
or, in one formula:
A*+ 02--+(A+o2-)*, (A+o2-) + H+ --+(A+-02H)*, (A+ -02H)* --+A+ + H02,
exciton + 0 2 + H+ --+hole H02 •
It is interesting to note that the net result of this reaction is entirely the same as that of reaction (6.7), for the generation of holes initiated by the addition of a proton to an excited anthracene molecule.
In spite of the localization of the negative charge on oxygen the rate of recombination is appreciable. An indication is the fact that the photocurrent measured with an alkaline electrode does not saturate with the voltage (fig. 6.3); 'P+ is, in fact, almost proportional to the applied voltage. No saturation was achieved even in cases where 2000 V could be applied across a crystal 50 fLm
thick. Another indication of a high rate of recombination is, of course, that 'P+ in fig. 6.2 is markedly lower than rpq in the same figure.
Remark The generation of holes in the reactions formulated above and in sec. 6.3.5
involves the disappearance of protons from the positive compartment. On the other hand, the discharge of holes at the negative electrode leads to the appearance of protons in the negative compartment (ref. 68, see also next section). This was concluded also by Matejec 67
) from potentiometric measurements. It is not implied, however, that protons carry the positive charge through the crystal.
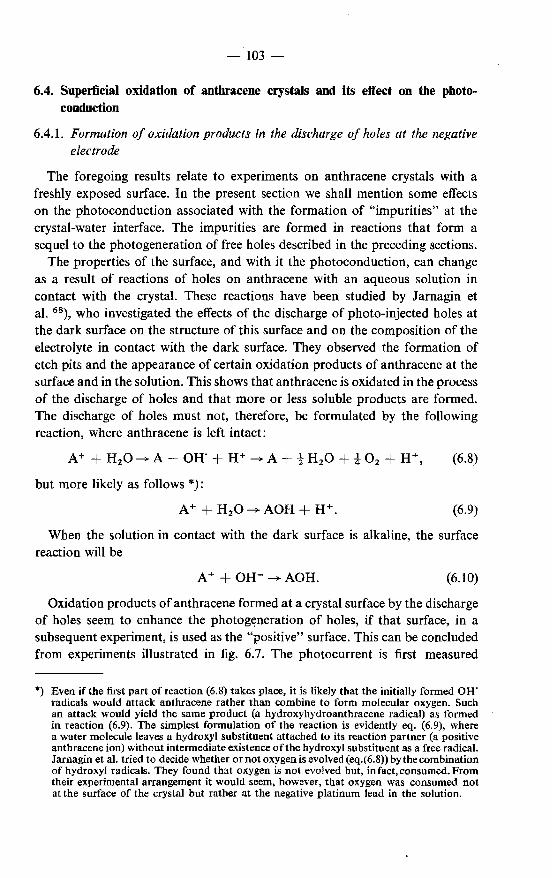
-103-
6.4. Superficial oxidation of anthracene crystals and its effect on the photoconduction
6.4.1. Formation of oxidation products in the discharge of holes at the negative electrode
The foregoing results relate to experiments on anthracene crystals with a freshly exposed surface. In the present section we shall mention some effects on the photoconduction associated with the formation of "impurities" at the crystal-water interface. The impurities are formed in reactions that form a sequel to the photogeneration of free holes described in the preceding sections.
The properties of the surface, and with it the photoconduction, can change as a result of reactions of holes on anthracene with an aqueous solution in contact with the crystal. These reactions have been studied by Jarnagin et al. 68), who investigated the effects of the discharge of photo-injected holes at the dark surface on the structure of this surface and on the composition of the electrolyte in contact with the dark surface. They observed the formation of etch pits and the appearance of certain oxidation products of anthracene at the surface and in the solution. This shows that anthracene is oxidated in the process of the discharge of holes and that more or less soluble products are formed. The discharge of holes must not, therefore, be formulated by the following reaction, where anthracene is left intact:
A++ H20-+ A+ OH' + H+ -+A -!H20 !02
but more likely as follows *):
A++ H20---+AOH H+.
(6.8)
(6.9)
When the solution in contact with the dark surface is alkaline, the surface reaction will be
A+ + OH- ---+ AOH. (6.10)
Oxidation products of anthracene formed at a crystal surface by the discharge of holes seem to enhance the photogeneration of holes, if that surface, in a subsequent experiment, is used as the "positive" surface. This can be concluded from experiments illustrated in fig. 6. 7. The photocurrent is first measured
*) Even if the first part of reaction (6.8) takes place, it is likely that the initially formed OH' radicals would attack anthracene rather than combine to form molecular oxygen. Such an attack would yield the same product (a hydroxyhydroanthracene radical) as formed in reaction (6.9). The simplest formulation of the reaction is evidently eq. (6.9), where a water molecule leaves a hydroxyl substituent attached to its reaction partner (a positive anthracene ion) without intermediate existence of the hydroxyl substituent as a free radical. Jarnagin et al. tried to decide whether or not oxygen is evolved (eq.(6.8)) by the combination of hydroxyl radicals. They found that oxygen is not evolved but, in fact, consumed. From their ej{perimental arrangement it would seem, however, that oxygen was consumed not at the surface of the crystal but rather at the negative platinum lead in the solution.
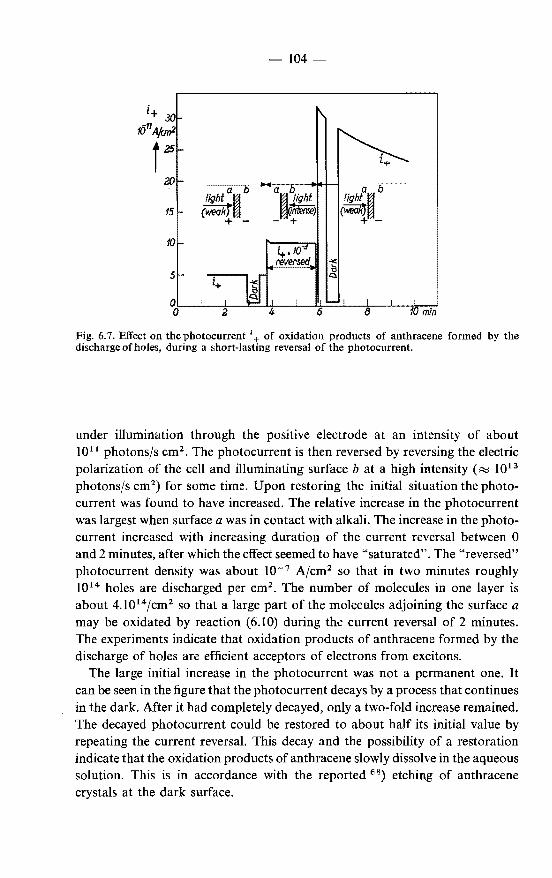
15
10
5
light alii (M>akfrii!
+ -
-104-
a b
~m +-
Fig. 6.7. Effect on the photocurrent 1 + of oxidation products of anthracene formed by the discharge of holes, during a short-lasting reversal of the photocurrent.
under illumination through the positive electrode at an intensity of about 1011 photons/s cm2 • The photocurrent is then reversed by reversing the electric polarization of the cell and illuminating surface bat a high intensity(,:;,; 1013
photons/s cm2) for some time. Upon restoring the initial situation the photo
current was found to have increased. The relative increase in the photocurrent was largest when surface a was in contact with alkali. The increase in the photocurrent increased with increasing duration of the current reversal between 0 and 2 minutes, after which the effect seemed to have "saturated". The "reversed" photocurrent density was about I0- 7 A/cm2 so that in two minutes roughly 1014 holes are discharged per cm2 • The number of molecules in one layer is about 4.1014fcm2 so that a large part of the molecules adjoining the surface a may be oxidated by reaction (6.10) during the current reversal of 2 minutes. The experiments indicate that oxidation products of anthracene formed by the discharge of holes are efficient acceptors of electrons from excitons.
The large initial increase in the photocurrent was not a permanent one. It can be seen in the figure that the photocurrent decays by a process that continues in the dark. After it had completely decayed, only a two-fold increase remained. The decayed photocurrent could be restored to about half its initial value by repeating the current reversal. This decay and the possibility of a restoration indicate that the oxidation products of anthracene slowly dissolve in the aqueous solution. This is in accordance with the reported 68) etching of anthracene crystals at the dark surface.
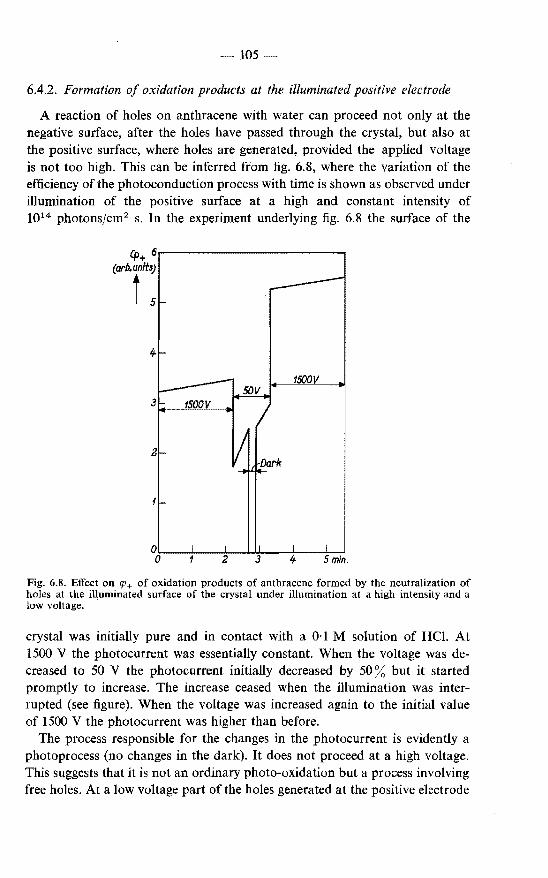
-105
6.4.2. Formation of oxidation products at the illuminated positive electrode
A reaction of holes on anthracene with water can proceed not only at the negative surface, after the holes have passed through the crystal, but also at the positive surface, where holes are generated, provided the applied voltage is not too high. This can be inferred from fig. 6.8, where the variation of the efficiency of the photoconduction process with time is shown as observed under illumination of the positive surface at a high and constant intensity of 1014 photonsfcm2 s. In the experiment underlying fig. 6.8 the surface of the
~+ 6r---------------------, (arb. units)
i 5
1500V
Fig. 6.8. Effect on If+ of oxidation products of anthracene formed by the neutralization of holes at the illuminated surface of the crystal under illumination at a high intensity and a low voltage. '
crystal was initially pure and in contact with a 0·1 M solution of HCl. At 1500 V the photocurrent was essentially constant. When the voltage was decreased to 50 V the photocurrent initially decreased by 50% but it started promptly to increase. The increase ceased when the illumination was interrupted (see figure). When the voltage was increased again to the initial value of 1500 V the photocurrent was higher than before.
The process responsible for the changes in the photocurrent is evidently a photoprocess (no changes in the dark). It does not proceed at a high voltage. This suggests that it is not an ordinary photo-oxidation but a process involving free holes. At a low voltage part of the holes generated at the positive electrode
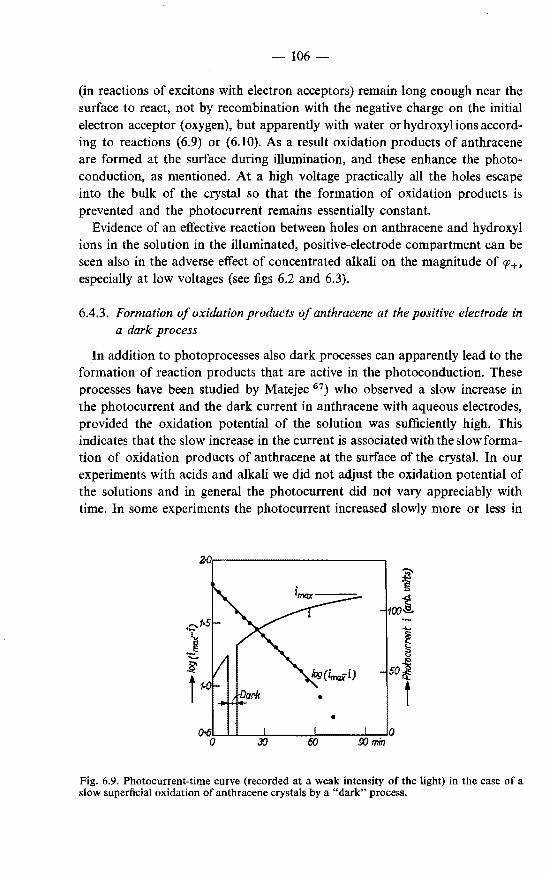
106-
(in reactions of excitons with electron acceptors) remain long enough near the surface to react, not by recombination with the negative charge on the initial electron acceptor (oxygen), but apparently with water orhydroxylionsaccording to reactions (6.9) or (6.10). As a result oxidation products of anthracene are formed at the surface during illumination, and these enhance the photoconduction, as mentioned. At a high voltage practically all the holes escape into the bulk of the crystal so that the formation of oxidation products is prevented and the photocurrent remains essentially constant.
Evidence of an effective reaction between holes on anthracene and hydroxyl ions in the solution in the illuminated, positive-electrode compartment can be seen also in the adverse effect of concentrated alkali on the magnitude of IP+• especially at low voltages {see figs 6.2 and 6.3).
6.4.3. Formation of oxidation products of anthracene at the positive electrode in a dark process
In addition to photoprocesses also dark processes can apparently lead to the formation of reaction products that are active in the photoconduction. These processes have been studied by Matejec 67
) who observed a slow increase in the photocurrent and the dark current in anthracene with aqueous electrodes, provided the oxidation potential of the solution was sufficiently high. This indicates that the slow increase in the current is associated with the slow formation of oxidation products of anthracene at the surface of the crystal. In our experiments with acids and alkali we did not adjust the oxidation potential of the solutions and in general the photocurrent did not vary appreciably with time. In some experiments the photocurrent increased slowly more or less in
•
Fig. 6.9. Photocurrent·time curve (recorded at a weak intensity of the light) in the case of a slow superficial oxidation of anthracene crystals by a "dark" process.
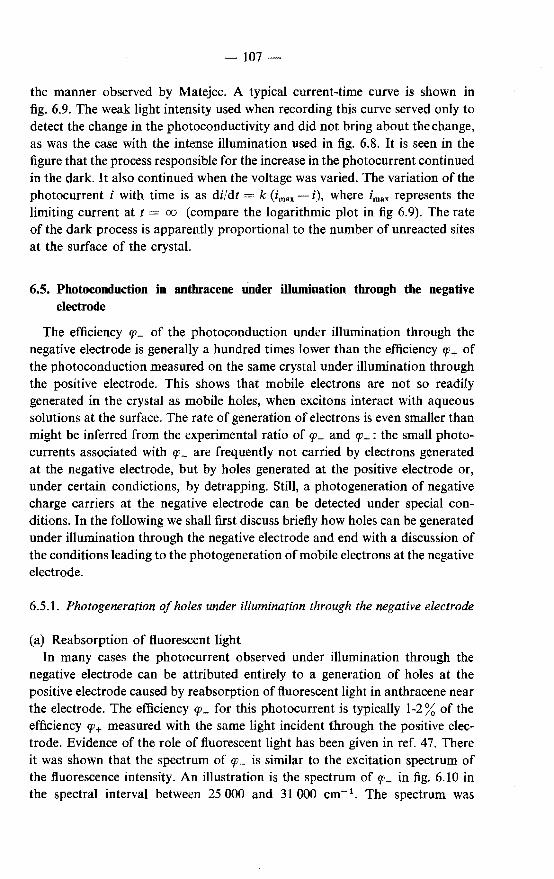
-107
the manner observed by Matejec. A typical current-time curve is shown in fig. 6.9. The weak light intensity used when recording this curve served only to detect the change in the photoconductivity and did not bring about the change, as was the case with the intense illumination used in fig. 6.8. It is seen in the figure that the process responsible for the increase in the photocurrent continued in the dark. It also continued when the voltage was varied. The variation of the photocurrent i with time is as di/dt = k (im••- i), where ima• represents the limiting current at t oo (compare the logarithmic plot in fig 6.9). The rate of the dark process is apparently proportional to the number of unreacted sites at the surface of the crystal.
6.5. Photoconduction in anthracene under illumination through the negative electrode
The efficiency lfl- of the photoconduction under illumination through the negative electrode is generally a hundred times lower than the efficiency lfl+ of the photoconduction measured on the same crystal under illumination through the positive electrode. This shows that mobile electrons are not so readily generated in the crystal as mobile holes, when excitons interact with aqueous solutions at the surface. The rate of generation of electrons is even smaller than might be inferred from the experimental ratio of lfl- and lfl+: the small photocurrents associated with lfl- are frequently not carried by electrons generated at the negative electrode, but by holes generated at the positive electrode or, under certain condictions, by detrapping. Still, a photogeneration of negative charge carriers at the negative electrode can be detected under special conditions. In the following we shall first discuss briefly how holes can be generated under illumination through the negative electrode and end with a discussion of the conditions leading to the photogeneration of mobile electrons at the negative electrode.
6.5.1. Photogeneration of holes under illumination through the negative electrode
(a) Reabsorption of fluorescent light In many cases the photocurrent observed under illumination through the
negative electrode can be attributed entirely to a generation of holes at the positive electrode caused by reabsorption of fluorescent light in anthracene near the electrode. The efficiency lfl- for this photocurrent is typically 1-2% of the efficiency lfl+ measured with the same light incident through the positive electrode. Evidence of the role of fluorescent light has been given in ref. 47. There it was shown that the spectrum of P- is similar to the excitation spectrum of the fluorescence intensity. An illustration is the spectrum of lfl- in fig. 6.10 in the spectral interval between 25 000 and 31 000 cm- 1 • The spectrum was
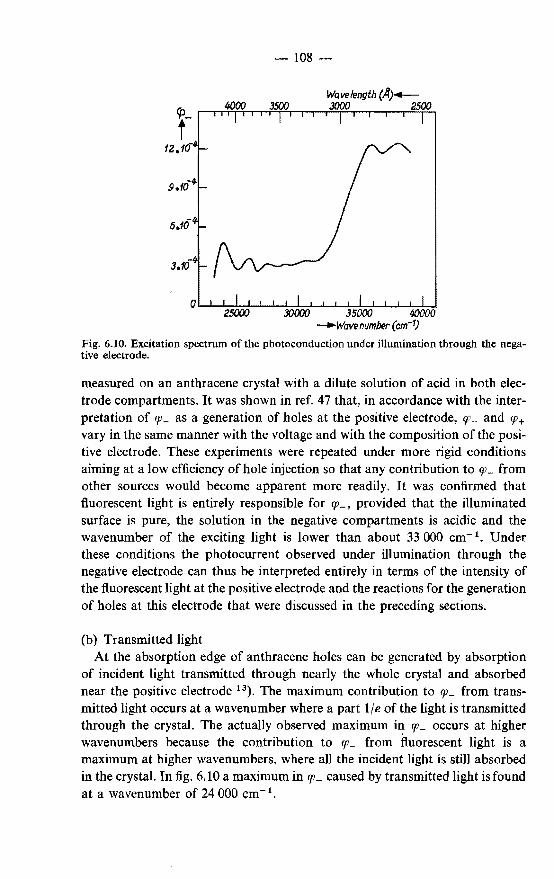
108-
Fig. 6.10. Excitation spectrum of the photoconduction under illumination through the negative electrode.
measured on an anthracene crystal with a dilute solution of acid in both electrode compartments. It was shown in ref. 47 that, in accordance with the interpretation of P- as a generation of holes at the positive electrode, P- and CfJ+
vary in the same manner with the voltage and with the composition of the positive electrode. These experiments were repeated under more rigid conditions aiming at a low efficiency of hole injection so that any contribution to cp_ from other sources would become apparent more readily. It was confirmed that fluorescent light is entirely responsible for q;_, provided that the illuminated surface is pure, the solution in the negative compartments is acidic and the wavenumber of the exciting light is lower than about 33 000 cm- 1
• Under these conditions the photocurrent observed under illumination through the negative electrode can thus be interpreted entirely in terms of the intensity of the fluorescent light at the positive electrode and the reactions for the generation of holes at this electrode that were discussed in the preceding sections.
(b) Transmitted light At the absorption edge of anthracene holes can be generated by absorption
of incident light transmitted through nearly the whole crystal and absorbed near the positive electrode 13
). The maximum contribution to p_ from transmitted light occurs at a wavenumber where a part 1/e of the light is transmitted through the crystal. The actually observed maximum in q;_ occurs at higher wavenumbers because the contribution to q;_ from fluorescent light is a maximum at higher wavenumbers, where all the incident light is still absorbed in the crystal. In fig. 6.10 a maximum in p _ caused by transmitted light is found at a wavenumber of 24 000 cm- 1
•
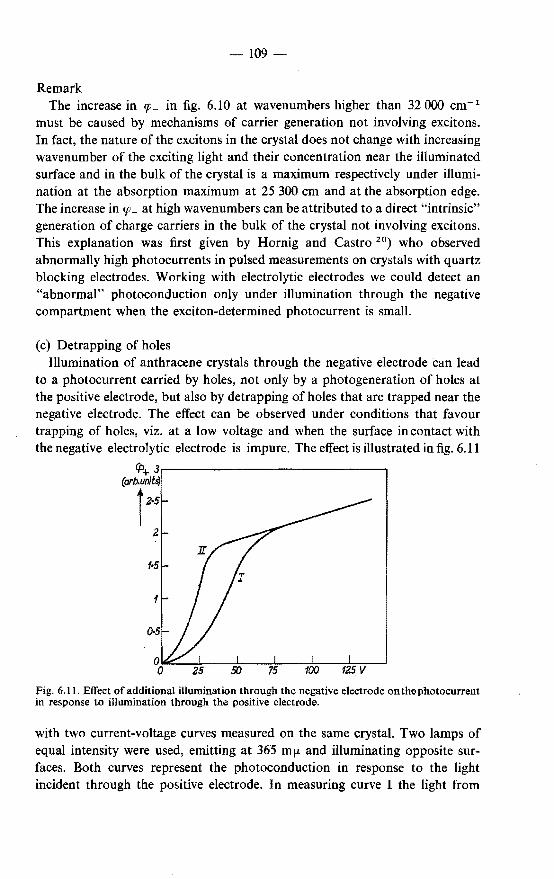
109 "7"""
Remark The increase in cp_ in fig. 6.10 at wavenumbers higher than 32 000 cm- 1
must be caused by mechanisms of carrier generation not involving excitons. In fact, the nature of the excitons in the crystal does not change with increasing wavenumber of the exciting light and their concentration near the illuminated surface and in the bulk of the crystal is a maximum respectively under illumination at the absorption maximum at 25 300 em and at the absorption edge. The increase in cp_ at high wavenumbers can be attributed to a direct "intrinsic" generation of charge carriers in the bulk of the crystal not involving excitons. This explanation was first given by Hornig and Castro 20
) who observed abnormally high photocurrents in pulsed measurements on crystals with quartz blocking electrodes. Working with electrolytic electrodes we could detect an "abnormal" photoconduction only under illumination through the negative compartment when the exciton-determined photocurrent is small.
(c) Detrapping of holes Illumination of anthracene crystals through the negative electrode can lead
to a photocurrent carried by holes, not only by a photogeneration of holes at the positive electrode, but also by detrapping of holes that are trapped near the negative electrode. The effect can be observed under conditions that favour trapping of holes, viz. at a low voltage and when the surface in contact with the negative electrolytic electrode is impure. The effect is illustrated in fig. 6.11
~+3r-------------------------~
C<mr::
0·
Fig. 6.11. Effect of additional illumination through the negative electrode on the photocurrent in response to illumination through the positive electrode.
with two current-voltage curves measured on the same crystal. Two lamps of equal intensity were used, emitting at 365 mf! and illuminating opposite surfaces. Both curves represent the photoconduction in response to the light incident through the positive electrode. In measuring curve I the light from
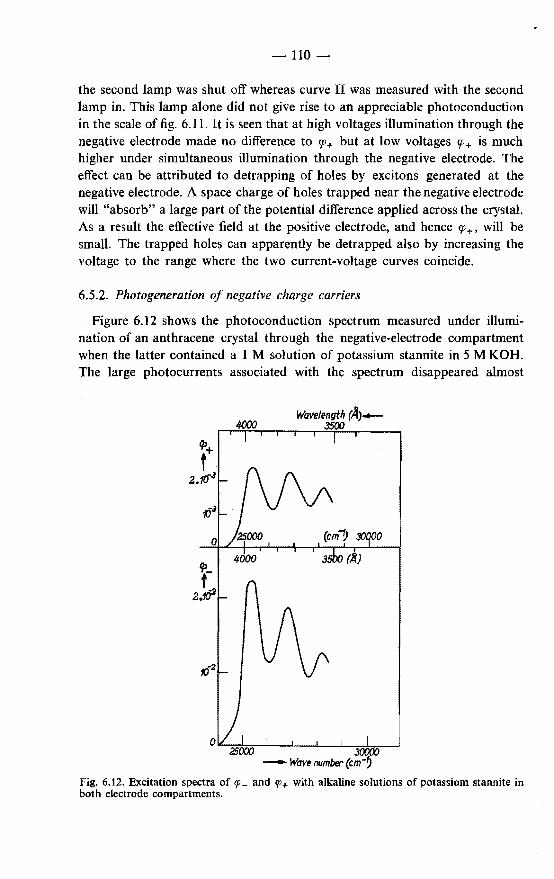
-110-
the second lamp was shut off whereas curve II was measured with the second lamp in. This lamp alone did not give rise to an appreciable photoconduction in the scale of fig. 6.11. It is seen that at high voltages illumination through the negative electrode made no difference to q:;+ but at low voltages q:;+ is much higher under simultaneous illumination through the negative electrode. The effect can be attributed to detrapping of holes by excitons generated at the negative electrode. A space charge of holes trapped near the negative electrode will "absorb" a large part of the potential difference applied across the crystal. As a result the effective field at the positive electrode, and hence q:;+, will be small. The trapped holes can apparently be detrapped also by increasing the voltage to the range where the two current-voltage curves coincide.
6.5.2. Photogeneration of negative charge carriers
Figure 6.12 shows the photoconduction spectrum measured under illumination of an anthracene crystal through the negative-electrode compartment when the latter contained a 1M solution of potassium stannite in 5 MKOH. The large photocurrents associated with the spectrum disappeared almost
Wavelength {A)-3500
30000 -Wave number (em-~
Fig. 6.12. Excitation spectra off/'- and fl'+ with alkaline solutions of potassium stannite in both electrode compartments.
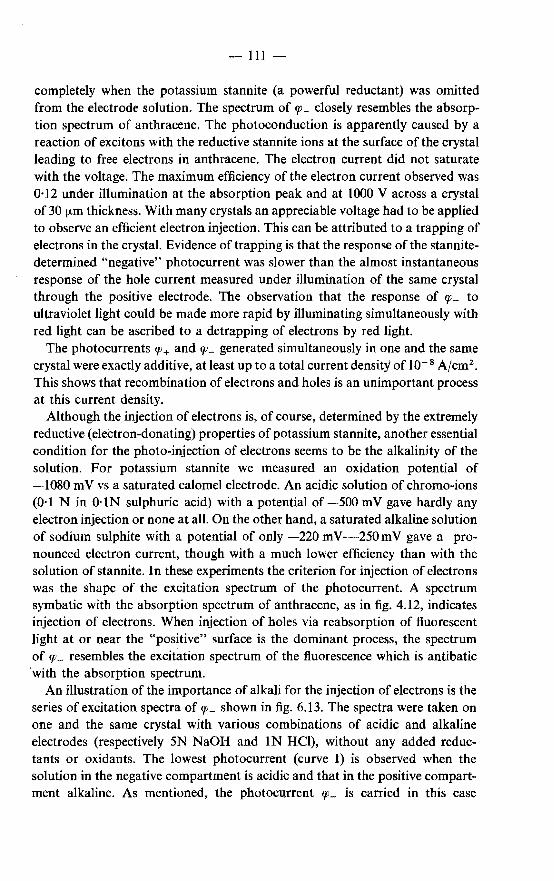
-111-
completely when the potassium stannite (a powerful reductant) was omitted from the electrode solution. The spectrum of P- closely resembles the absorption spectrum of anthracene. The photoconduction is apparently caused by a reaction of excitons with the reductive stannite ions at the surface of the crystal leading to free electrons in anthracene. The electron current did not saturate with the voltage. The maximum efficiency of the electron current observed was 0·12 under illumination at the absorption peak and at 1000 Y across a crystal of 30 11-m thickness. With many crystals an appreciable voltage had to be applied to observe an efficient electron injection. This can be attributed to a trapping of electrons in the crystal. Evidence of trapping is that the response of the stannitedetermined "negative" photocurrent was slower than the almost instantaneous response of the hole current measured under illumination of the same crystal through the positive electrode. The observation that the response of P- to ultraviolet light could be made more rapid by illuminating simultaneously with red light can be ascribed to a detrapping of electrons by red light.
The photocurrents P+ and P- generated simultaneously in one and the same crystal were exactly additive, at least up to a total current density of w- 8 A/cm2 •
This shows that recombination of electrons and holes is an unimportant process at this current density.
Although the injection of electrons is, of course, determined by the extremely reductive (electron-donating) properties of potassium stannite, another essential condition for the photo-injection of electrons seems to be the alkalinity of the solution. For potassium stannite we measured an oxidation potential of -1080 mY vs a saturated calomel electrode. An acidic solution of chromo-ions (0·1 N in O·lN sulphuric acid) with a potential of -500 mY gave hardly any electron injection or none at all. On the other hand, a saturated alkaline solution of sodium sulphite with a potential of only -220 mV--250mY gave a pronounced electron current, though with a much lower efficiency than with the solution of stannite. In these experiments the criterion for injection of electrons was the shape of the excitation spectrum of the photocurrent. A spectrum symbatic with the absorption spectrum of anthracene, as in fig. 4.12, indicates injection of electrons. When injection of holes via reabsorption of fluorescent light at or near the "positive" surface is the dominant process, the spectrum of rp_ resembles the excitation spectrum of the fluorescence which is antibatic ·with the absorption spectrum.
An illustration of the importance of alkali for the injection of electrons is the series of excitation spectra of rp_ shown in fig. 6.13. The spectra were taken on one and the same crystal with various combinations of acidic and alkaline electrodes (respectively SN NaOH and IN HCl), without any added reductants or oxidants. The lowest photocurrent (curve I) is observed when the solution in the negative compartment is acidic and that in the positive compartment alkaline. As mentioned, the photocurrent P- is carried in this case
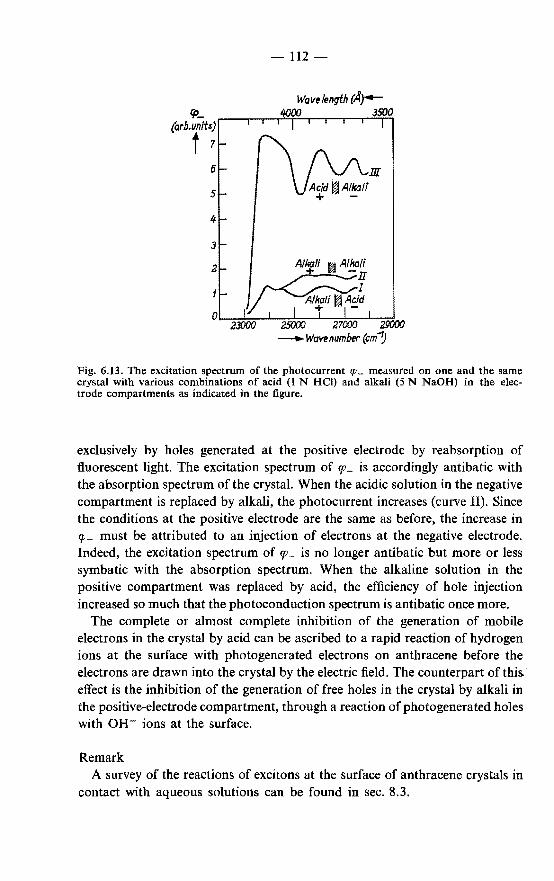
-112-
Wave length {A)-4000 3500
~~~ V. ~~li~£!~
0~. ~~~~~~~~~~ 23000 25000 27000 29000
--Wavenumber (em-f]
Fig. 6.13. The excitation spectrum of the photocurrent 'P- measured on one and the same crystal with various combinations of acid (1 N HCI) and alkali (5 N NaOH) in the electrode compartments as indicated in the figure.
exclusively by holes generated at the positive electrode by reabsorption of fluorescent light. The excitation spectrum of cp_ is accordingly antibatic with the absorption spectrum of the crystal. When the acidic solution in the negative compartment is replaced by alkali, the photocurrent increases (curve II). Since the conditions at the positive electrode are the same as before, the increase in {{- must be attributed to an injection of electrons at the negative electrode. Indeed, the excitation spectrum of cp_ is no longer antibatic but more or less symbatic with the absorption spectrum. When the alkaline solution in the positive compartment was replaced by acid, the efficiency of hole injection increased so much that the photoconduction spectrum is antibatic once more.
The complete or almost complete inhibition of the generation of mobile electrons in the crystal by acid can be ascribed to a rapid reaction of hydrogen ions at the surface with photogenerated electrons on anthracene before the electrons are drawn into the crystal by the electric field. The counterpart of this· effect is the inhibition of the generation of free holes in the crystal by alkali in the positive-electrode compartment, through a reaction of photogenerated holes with oH- ions at the surface.
Remark A survey of the reactions of excitons at the surface of anthracene crystals in
contact with aqueous solutions can be found in sec. 8.3.
-113-
7. GENERATION OF CHARGE CARRIERS AT DEEPER CENTRES
In this chapter it is shown that a penetration of foreign molecules into a narrow layer of our crystals can be made responsible for observed deviations from the exciton-diffusion model.
7.1. Deeper centres associated with concentrated mineral acids
Various examples have been given in chapter 4 of excitation spectra that cannot be described with the exciton-diffusion model which holds for true surface effects. In all these spectra the peak-to-va1ley ratios are lower than corresponds to the ratios in excitation spectra of true surface effects. The observed effects (photoconduction and quenching of the fluorescence) are nevertheless caused entirely by interactions of excitons with active agents in the electrode solution.
The photogeneration of charge carriers is a complex process and various causes can be conceived that can account for observed deviations in the photoconduction spectrum. Some have been mentioned in sec. 4.2.3. It is possible to come to a more definite conclusion as to the actual cause by considering deviations observed in the excitation spectrum of the crystal fluorescence. Such deviations (low peak-to-valley ratios) are notably found in fluorescence spectra of crystals in contact with concentrated solutions of mineral acids (fig. 4.12). In working out the fluorescence spectra all causes of spectral structure other than surface effects are eliminated by taking the difference between two excitation spectra measured with respectively a strongly and a weakly quenching solution in contact with the crystal. The fact that the peak-to-valley ratios in the excitation spectrum of the fluorescence are nevertheless lower than corresponds to a process of quenching at the very surface· seems to admit only one explanation, viz. that singlet excitons are quenched by acid not only at the very surface but also in deeper layers of the crystal. It must be assumed therefore that molecules of acid penetrate into the crystal over distances of several hundred A. This will have relatively little effect on the quenching probability of excitons generated close to the surface (under illumination at absorption maxima) but will increase the quenching probability of excitons generated deeply within the crystal (under illumination at absorption minima). As a result the peak-to-valley ratios in the excitation spectrum will decrease.
A penetration of acid into a narrow layer of the crystal can account also for deviations observed in excitation spectra of the photocurrent measured with concentrated acid as the electrode solution. This follows from the data given in table 7-I.
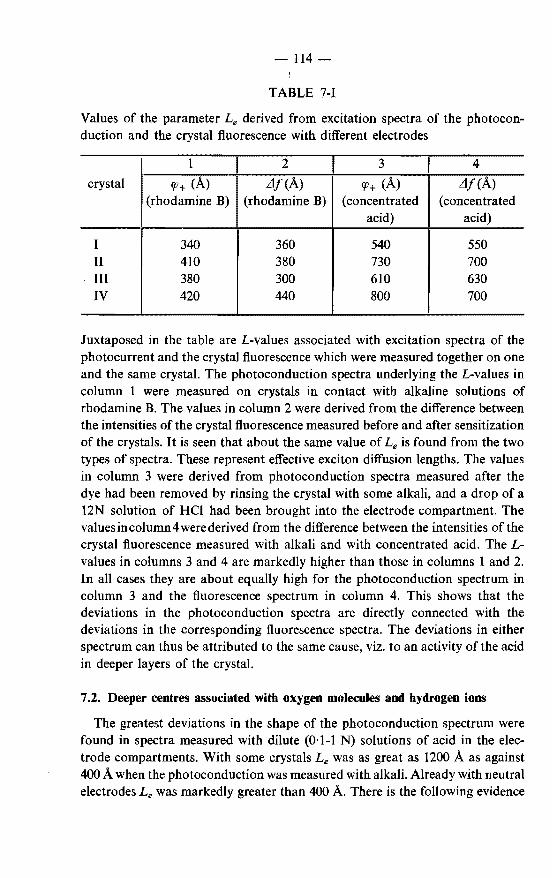
-114-
TABLE 7-I
Values of the parameter Le derived from excitation spectra of the photoconduction and the crystal fluorescence with different electrodes
1 2 3 I 4
crystal <fJ+ (A) L1J(A) <fJ+ (A) L1J(A) (rhodamine B) (rhodamine B) (concentrated (concentrated
acid) acid)
I 340 360 540 550 II 410 380 730 700 III 380 300 610 630 IV 420 440 800 700
Juxtaposed in the table are L-values associated with excitation spectra of the photocurrent and the crystal fluorescence which were measured together on one and the same crystal. The photoconduction spectra underlying the L-values in column 1 were measured on crystals in contact with alkaline solutions of rhodamine B. The values in column 2 were derived from the difference between the intensities of the crystal fluorescence measured before and after sensitization of the crystals. It is seen that about the same value of Le is found from the two types of spectra. These represent effective exciton diffusion lengths. The values in column 3 were derived from photoconduction spectra measured after the dye had been removed by rinsing the crystal with some alkali, and a drop of a 12N solution of HCI had been brought into the electrode compartment. The values in column 4 were derived from the difference between the intensities of the crystal fluorescence measured with alkali and with concentrated acid. The Lvalues in columns 3 and 4 are markedly higher than those in columns 1 and 2. In all cases they are about equally high for the photoconduction spectrum in column 3 and the fluorescence spectrum in column 4. This shows that the deviations in the photoconduction spectra are directly connected with the deviations in the corresponding fluorescence spectra. The deviations in either spectrum can thus he attributed to the same cause, viz. to an activity of the acid in deeper layers of the crystal.
7.2. Deeper centres associated with oxygen molecnles and hydrogen ions
The greatest deviations in the shape of the photoconduction spectrum were found in spectra measured with dilute (0·1-1 N) solutions of acid in the electrode compartments. With some crystals Le was as great as 1200 A as against 400 A when the photoconduction was measured with alkali. Already with neutral electrodes Le was markedly greater than 400 A. There is the following evidence
115-
that "deeper centres" are responsible for the deviations in these photoconduction spectra.
(a) Penetration of hydrogen ions Photoconduction spectra were measured on one and the same crystal as
follows. First the spectrum was measured with alkali, giving Le = 390 A. When alkali was replaced by O·lN hydrochloric acid, Le became 800 A. When the acid was now simply replaced by alkali without intermediate rinsing of the surface of the crystal, the value of Le remained high (700 A). Only after the crystal had been rinsed with benzene did the photoconduction spectrum resume its initial shape with an Le-value of 400 A.
The fact that the value of Le remains high when acid is simply replaced by alkali shows that hydrogen ions penetrate into deeper layers of the crystal and remain there. The effect of rinsing shows that the intrusion of the foreign molecules is limited to a narrow surface layer such as is removed by rinsing with a small amount of solvent.
(b) Role of oxygen Addition of small amounts of the reductant chromosulphate to weakly acidic
electrode solutions not only decreased the magnitude of the photocurrent (about 60 times) but also increased the peak-to-valley ratios of the photoconduction spectrum. The following L-values were found in successive measurements on one and the same crystal (the surface was rinsed with benzene and with water each time a fresh solution was applied). In successive measurements with 0·1 N chromosulphate in 0·1 N sulphuric acid in the positive-electrode compartment the L-value of the photoconduction spectrum was 580, 330 and 400 A. In subsequent measurements, where the reductant was omitted, Le was 680 and 870 A. When the reductant was again included Le was 430 A and when it was again omitted Le was 900 A. The values measured without the reductant are high as usual with weakly acidic solutions but in the presence of the reductant Le has the much lower value ( 400 A) characteristic of processes taking place exclusively at the surface. From this it is concluded that the weak photoconduction that remains when the reductant is added to acidic solutions has its origin exclusively at surface centres. The absolute and especially the relative loss of activity of the deeper centres indicates that these centres depend for their activity on the presence in the electrode solution of oxygen that is completely removed by the reductant.
It is concluded that a penetration of both oxygen molecules and hydrogen ions from weakly acidic solutions into the crystal is essential for the generation of holes at deeper centres. When either oxygen or hydrogen ions are absent from the solution (respectively in acidic solutions of chromo ions and in alkaline solutions) the generation of free holes at deeper centres is inhibited.
-116-
7 .3. Mechanisms of the generation of boles at deeper centres
One can distinguish a priori two types of processes that can lead to a photogeneration of free charge carriers at deeper centres, viz. (a) a true generation of charge carriers involving chemical reactions of reduc
tion and oxidation and (b) a simple detrapping of charge carriers generated originally at the surface
(in photo or dark processes) and trapped by the foreign molecules that form the deeper centres.
It seems that the latter possibility can be discarded, at least for the measurements with weakly acidic electrode solutions, where the relative importance of deeper centres is greatest. This can be concluded from the result that the photoconductivity with weakly acidic electrodes was strictly limited to the singlet absorption region of anthracene (no photocurrent at wavenumbers below 23 000 em- 1
). This was also the case when the photocurrent in response to light from the monochromator was measured while extra carriers were generated by illuminating the crystal through the positive electrode with light from a second source (365 m[J.) of constant intensity producing a photocurrent several times larger than the photocurrent in response to light from the monochromator. The detrapping activity is, however, not very different for light of 23 000 cm- 1
and light of slightly higher wavenumbers 22). This makes it improbable that detrapping is an important source of free charge carriers under illumination with strongly absorbed light. The same conclusion can be drawn from the fact that it made no difference to the shape of the photoconduction spectrum when the crystal was illuminated with light from an additional constant source illuminating the crystal through either the positive or the negative electrode and causing a photocurrent of the same magnitude or larger than the photocurrent generated by light from the monochromator. This result was found whatever the composition of the electrode solutions.
It is concluded that the generation of charge carriers at deeper centres involves not a detrapping of trapped holes but more probably a true generation of charge carriers by mechanisms such as postulated for the surface centres.
It is not necessary to postulate new mechanisms for the generation of charge carriers at deeper centres.
When the electrode is a dilute acid, both oxygen molecules and hydrogen ions take part in the generation of holes (sec. 7.2). These agents were shown to be active also in the generation of holes at the surface. The same reaction mechanism can therefore be assumed for the generation of holes at the surface and at deeper centres in crystals with weakly acidic electrodes. The reaction is initiated by the transfer of an electron from an excited anthracene molecule to oxygen, followed by the localization of the negative charge on oxygen by a proton.
117-
The picture is not, however, complete at this. When the same chemical mechanisms operate at the surface and at deeper centres it remains to be explained why the activity of the surface centres is much less easily inhibited than the activity of the deeper centres. There are conditions when the deeper centres are completely inactive in the photoconduction, while the surface centres remain quite active (with alkaline solutions) or at least retain some activity (with solutions of chromo ions). A possible explanation seems to be a role of oriented water molecules present at the surface. The initial reaction of excitons at the surface of anthracene crystals in contact with alkaline or weakly acidic solutions is the formation of an excited electron-transfer state to oxygen (sec. 6.3.3). The reaction will take place both at the surface and at deeper centres, irrespective of the presence of OH- ions and of small concentrations of hydroxonium ions in the electrode solution. Indeed, as can be seen in fig. 6.2, the quenching efficiency is the same for alkali and dilute solutions of acid. For the generation of free holes (photoconduction) it is necessary that the negative charge on oxygen be localized. When the oxygen molecule is adsorbed at the surface, the negative charge can be localized by hydrogen ions or, when the solution is alkaline, by water dipoles oriented towards the oxygen molecule adsorbed on the surface of the crystal. When oxygen is present at a deeper centre, only penetrated hydrogen ions can localize the negative charge. As a result deeper centres are active in the photoconduction only when the electrode solution can supply hydrogen ions. Surface centres, on the other hand, retain theit activity more or less also with proton-deficient alkaline solutions.
As regards the centres associated with concentrated acids, here the photoconduction spectrum and the excitation spectrum of the fluorescence can be described with the same value of Le (table 7-I). This implies that the generation of free holes proceeds with the same efficiency at the surface and at deeper centres. This, and the fact that the acid in the solution is responsible for both types of centres, indicates that here, too, the same reaction proceeds at the deeper centres and at the surface, so that the initial process is the formation of an excited proton adduct to anthracene.
7.4. The photoconduction spectrum in the case of an exponential distribution of deeper centres
It may seem surprising that a linear dependence on 1/e of, for instance, the inverse photoconduction parameter l/fP+ is always found, not only (as theory demands) in cases where the charge carriers are generated exclusively at the surface, but also when generation at deeper centres is important. It should be considered that a linear dependence will result not only when the excitondiffusion model is valid, but also when the diffusion of excitons to the surface is a relatively unimportant process, the charge carriers being generated in
-118-
reactions of almost immobile excitons at deeper centres with an exponential distribution in the crystal. In the latter case the charge carriers are generated with an efficiency
00
Cfi+ = a J exp (-x/A) k exp (-kx)dx, 0
where a and A are constants of appropriate dimensions, exp (-x/A) is proportional to the concentration of the centres and k exp (-kx) proportional to the concentration of excitons at a depth x under the illuminated surface. Integration yields
Cfi+ = a(l + IfkA)- 1•
This dependence of Cf'+ on k is of the same form as the dependence derived with the exciton-diffusion model (eq. (3.8)). The constant A has taken the place of the mean diffusion length. Clearly a linear plot of 1/cp + vs 1/s will be found not only when the exciton-diffusion model is valid, but also when an "activelayer" model holds with an exponentially decreasing concentration of deeper centres.
It is not surprising, therefore, that linear plots are found experimentally also in cases where exciton diffusion and deeper centres are both important.
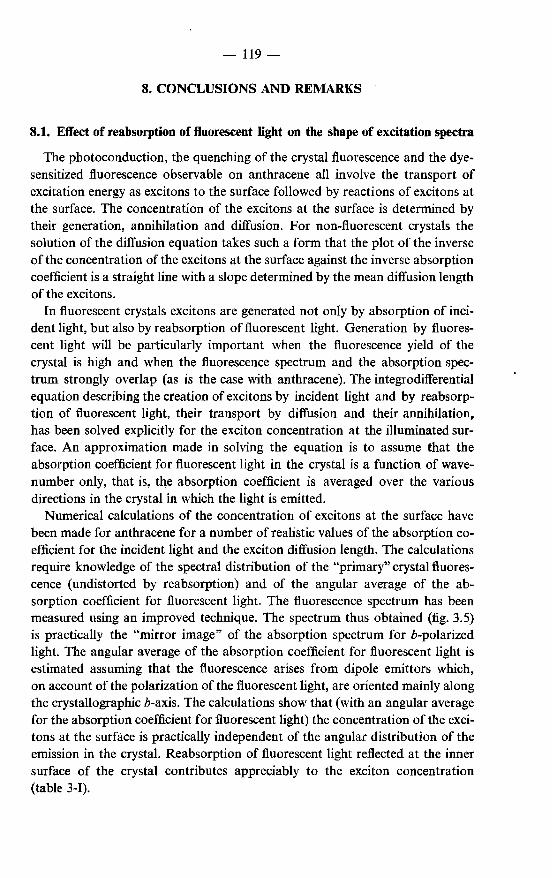
-119-
8. CONCLUSIONS AND REMARKS
8.1. Effect of reabsorption of fluorescent light on the shape of excitation spectra
The photoconduction, the quenching of the crystal fluorescence and the dyesensitized fluorescence observable on anthracene all involve the transport of excitation energy as excitons to the surface followed by reactions of excitons at the surface. The concentration of the excitons at the surface is determined by their generation, annihilation and diffusion. For non-fluorescent crystals the solution of the diffusion equation takes such a form that the plot of the inverse of the concentration of the excitons at the surface against the inverse absorption coefficient is a straight line with a slope determined by the mean diffusion length of the excitons.
In fluorescent crystals excitons are generated not only by absorption of incident light, but also by reabsorption of fluorescent light. Generation by fluorescent light will be particularly important when the fluorescence yield of the crystal is high and when the fluorescence spectrum and the absorption spectrum strongly overlap (as is the case with anthracene). The integrodifferential equation describing the creation of excitons by incident light and by reabsorption of fluorescent light, their transport by diffusion and their annihilation, has been solved explicitly for the exciton concentration at the illuminated surface. An approximation made in solving the equation is to assume that the absorption coefficient for fluorescent light in the crystal is a function of wavenumber only, that is, tqe absorption coefficient is averaged over the various directions in the crystal in which the light is emitted.
Numerical calculations of the concentration of excitons at the surface have been made for anthracene for a number of realistic values of the absorption coefficient for the incident light and the exciton diffusion length. The calculations require knowledge of the spectral distribution of the "primary" crystal fluorescence (undistorted by reabsorption) and of the angular average of the absorption coefficient for fluorescent light. The fluorescence spectrum has been measured using an improved technique. The spectrum thus obtained (fig. 3.5) is practically the "mirror image" of the absorption spectrum for b-polarized light. The angular average of the absorption coefficient for fluorescent light is estimated assuming that the fluorescence arises from dipole emittors which, on account of the polarization of the fluorescent light, are oriented mainly along the crystallographic b-axis. The calculations show that (with an angular average for the absorption coefficient for fluorescent light) the concentration of the excitons at the surface is practically independent of the angular distribution of the emission in the crystal. Reabsorption of fluorescent light reflected at the inner surface of the crystal contributes appreciably to the exciton concentration (table 3-I).
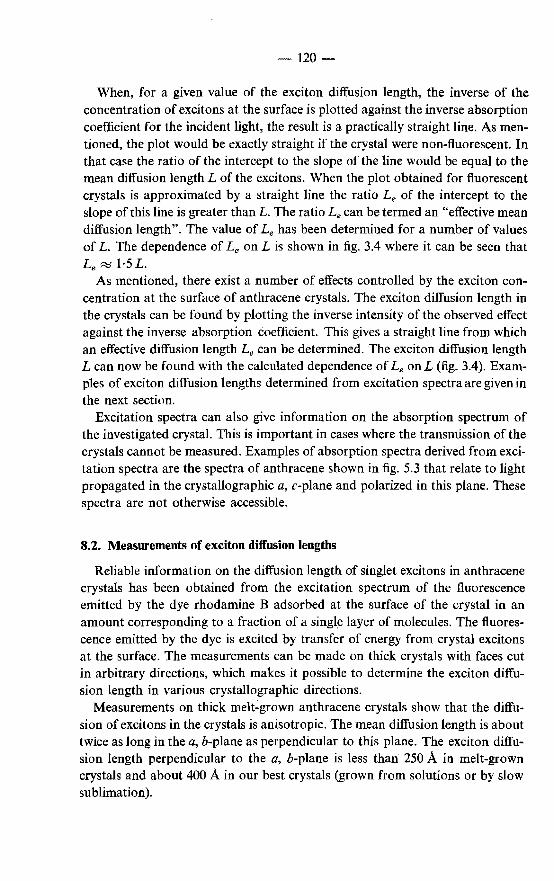
120-
When, for a given value of the exciton diffusion length, the inverse of the concentration of excitons at the surface is plotted against the inverse absorption coefficient for the incident light, the result is a practically straight line. As mentioned, the plot would be exactly straight if the crystal were non-fluorescent. In that case the ratio of the intercept to the slope of the line would be equal to the mean diffusion length L of the excitons. When the plot obtained for fluorescent crystals is approximated by a straight line the ratio Le of the intercept to the slope of this line is greater than L. The ratio Le can be termed an "effective mean diffusion length". The value of L. has been determined for a number of values of L. The dependence of Le on L is shown in fig. 3.4 where it can be seen that Le R::! 1·5 L.
As mentioned, there exist a number of effects controlled by the exciton concentration at the surface of anthracene crystals. The exciton diffusion length in the crystals can be found by plotting the inverse intensity of the observed effect against the inverse absorption coefficient. This gives a straight line from which an effective diffusion length Le can be determined. The exciton diffusion length L can now be found with the calculated dependence of Le on L (fig. 3.4). Examples of exciton diffusion lengths determined from excitation spectra are given in the next section.
Excitation spectra can also give information on the absorption spectrum of the investigated crystaL This is important in cases where the transmission of the crystals cannot be measured. Examples of absorption spectra derived from excitation spectra are the spectra of anthracene shown in fig. 5.3 that relate to light propagated in the crystallographic a, c-plane and polarized in this plane. These spectra are not otherwise accessible.
8.2. Measurements of exciton diffusion lengths
Reliable information on the diffusion length of singlet excitons in anthracene crystals has been obtained from the excitation spectrum of the fluorescence emitted by the dye rhodamine B adsorbed at the surface of the crystal in an amount corresponding to a fraction of a single layer of molecules. The fluorescence emitted by the dye is excited by transfer of energy from crystal excitons at the surface. The measurements can be made on thick crystals with faces cut in arbitrary directions, which makes it possible to determine the exciton diffusion length in various crystallographic directions.
Measurements on thick melt~grown anthracene crystals show that the diffusion of excitons in the crystals is anisotropic. The mean diffusion length is about twice as long in the a, b-plane as perpendicular to this plane. The exciton diffusion length perpendicular to the a, b-plane is less than 250 A in melt-grown crystals and about 400 A in our best crystals (grown from solutions or by slow sublimation).
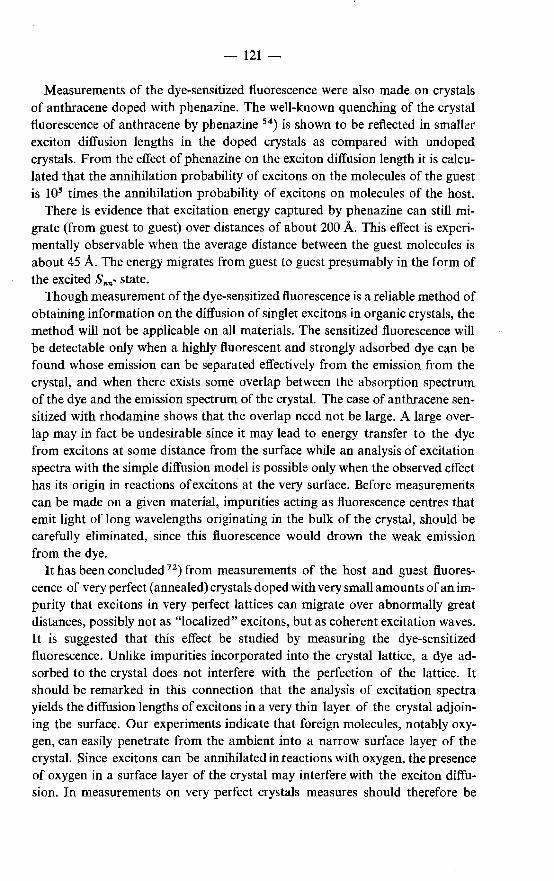
-121-
Measurements of the dye-sensitized fluorescence were also made on crystals of anthracene doped with phenazine. The well-known quenching of the crystal fluorescence of anthracene by phenazine 54
) is shown to be reflected in smaller exciton diffusion lengths in the doped crystals as compared with undoped crystals. From the effect of phenazine on the exciton diffusion length it is calculated that the annihilation probability of excitons on the molecules of the guest is 105 times the annihilation probability of excitons on molecules of the host.
There is evidence that excitation energy captured by phenazine can still migrate (from guest to guest) over distances of about 200 A. This effect is experimentally observable when the average distance between the guest molecules is about 45 A. The energy migrates from guest to guest presumably in the form of the excited S,.n• state.
Though measurement of the dye-sensitized fluorescence is a reliable method of obtaining information on the diffusion of singlet excitons in organic crystals, the method will not be applicable on all materials. The sensitized fluorescence will be detectable only when a highly fluorescent and strongly adsorbed dye can be found whose emission can be separated effectively from the emission from the crystal, and when there exists some overlap between the absorption spectrum of the dye and the emission spectrum of the crystal. The case of anthracene sensitized with rhodamine shows that the overlap need not be large. A large overlap may in fact be undesirable since it may lead to energy transfer to the dye from excitons at some distance from the surface while an analysis of excitation spectra with the simple diffusion model is possible only when the observed effect has its origin in reactions of excitons at the very surface. Before measurements can be made on a given material, impurities acting as fluorescence centres that emit light of long wavelengths originating in the bulk of the crystal, should be carefully eliminated, since this fluorescence would drown the weak emission from the dye.
It has been concluded 72) from measurements of the host and guest fluores
cence of very perfect (annealed) crystals doped with very small amounts of an impurity that excitons in very perfect lattices can migrate over abnormally great distances, possibly not as "localized" excitons, but as coherent excitation waves. It is suggested that this effect be studied by measuring the dye-sensitized fluorescence. Unlike impurities incorporated into the crystal lattice, a dye ad~ sorbed to the crystal does not interfere with the perfection of the lattice. It should be remarked in this connection that the analysis of excitation spectra yields the diffusion lengths of excitons in a very thin layer of the crystal adjoin· ing the surface. Our experiments indicate that foreign molecules, notably oxygen, can easily penetrate from the ambient into a narrow surface layer of the crystal. Since excitons can be annihilated in reactions with oxygen, the presence of oxygen in a surface layer of the crystal may interfere with the exciton diffu· sion. In measurements on very perfect crystals measures should therefore be
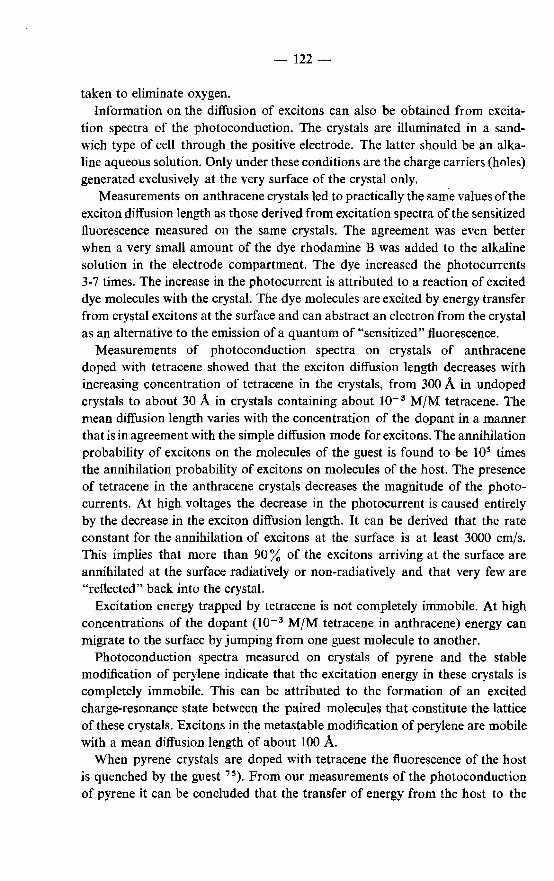
-122~
taken to eliminate oxygen. Information on the diffusion of excitons can also be obtained from excita~
tion spectra of the photoconduction. The crystals are illuminated in a sand~ wich type of cell through the positive electrode. The latter should be an alka~ line aqueous solution. Only under these conditions are the charge carriers (holes) generated exclusively at the very surface of the crystal only.
Measurements on anthracene crystals led to practically the same values of the exciton diffusion length as those derived from excitation spectra of the sensitized fluorescence measured on the same crystals. The agreement was even better when a very small amount of the dye rhodamine B was added to the alkaline solution in the electrode compartment. The dye increased the photocurrents 3~ 7 times. The increase in the photocurrent is attributed to a reaction of excited dye molecules with the crystal. The dye molecules are excited by energy transfer from crystal excitons at the surface and can abstract an electron from the crystal as an alternative to the emission of a quantum of "sensitized" fluorescence.
Measurements of photoconduction spectra on crystals of anthracene doped with tetracene showed that the exciton diffusion length decreases with increasing concentration of tetracene in the crystals, from 300 A in undoped crystals to about 30 A in crystals containing about 10- 3 M/M tetracene. The mean diffusion length varies with the concentration of the dopant in a manner that is in agreement with the simple diffusion mode for excitons. The annihilation probability of excitons on the molecules of the guest is found to be 105 times the annihilation probability of excitons on molecules of the host. The presence of tetracene in the anthracene crystals decreases the magnitude of the photo~ currents. At high voltages the decrease in the photocurrent is caused entirely by the decrease in the exciton diffusion length. It can be derived that the rate constant for the annihilation of excitons at the surface is at least 3000 cmjs. This implies that more than 90% of the excitons arriving at the surface are annihilated at the surface radiatively or non-radiatively and that very few are "reflected" back into the crystal.
Excitation energy trapped by tetracene is not completely immobile. At high concentrations of the dopant (l0- 3 M/M tetracene in anthracene) energy can migrate to the surface by jumping from one guest molecule to another.
Photoconduction spectra measured on crystals of pyrene and the stable modification of perylene indicate that the excitation energy in these crystals is completely immobile. This can be attributed to the formation of an excited charge-resonance state between the paired molecules that constitute the lattice of these crystals. Excitons in the metastable modification of perylene are mobile with a mean diffusion length of about 100 A.
When pyrene crystals are doped with tetracene the fluorescence of the host is quenched by the guest 75). From our measurements of the photoconduction of pyrene it can be concluded that the transfer of energy from the host to the
-123-
guest, which is responsible for the quenching of the fluorescence, probably does not involve a migration of the excitation energy in the host lattice as excitons. Possibly the energy is transferred more directly by a long-range dipole-dipole interaction.
Measurements of the photoconduction of tetracene crystals sensitize1 with rhodamine show that the exciton diffusion length in the crystals is about 300 A. It could not be decided wether this value relates to singlet or to triplet excitons. This is because triplet as well as singlet excitons can lead to a surface-determined photoconduction in sensitized crystals. Evidence of a possible role of triplet excitons in the photoconduction of dye-sensitized crystals was obtained from measurements of anthracene crystals heavily doped with phenazine.
A third type of excitation spectrum from which information on the diffusion of excitons was obtained are excitation spectra of the crystal fluorescence. In this case the difference between two spectra must be taken, measured withrespectively a strongly and a weakly quenching aqueous solution in contact with the crystal. This is necessary to eliminate effects of variations with wavenumber of the proportion of the fluorescent light which escapes reabsorption by leaving the crystal through the illuminated surface. Measurements of the crystal fluorescence have been made on anthracene. When the crystal fluorescence was quenched with a solution of a dye (rhodamine B, acridine orange) the diffusion length derived from the fluorescence spectra was the same as the diffusion length derived from the spectrum of the sensitized fluorescence or the photoconduction measured with an alkaline electrode solution on the same crystal. When the crystal fluorescence was quenched with a concentrated solution of a mineral acid (12 N solutions of hydrochloric acid) an almost twice higher value was found for the diffusion length.
High and evidently unreliable values of the exciton diffusion length were found not only from excitation spectra of the crystal fluorescence quenched by mineral acids, but also from photoconduction spectra measured with non-alkaline electrode solutions. There is evidence that in all these cases excitons are quenched and charge carriers can be generated not only at the very surface (as is assumed in the exciton-diffusion model), but also at "deeper centres". The deeper centres are associated with oxygen molecules and hydrogen ions penetrated from the (acidic) electrode solution into a thin layer of the crystal adjoining the electrode. The interaction of excitons with foreign molecules at deeper centres gives rise to smaller peak-to-valley ratios in the excitation spectra of the photoconduction and the crystal fluorescence. The effect does not give rise to qualitative changes in the shape of experimental spectra: the plot of, for instance, the inverse efficiency of the photoconduction 1/lfi+ vs 1/s was found to be a straight line in all cases. It can be remarked in this connection that an exponential distribution of deeper centres combined with a very small diffusion length of the excitons would lead to a linear dependence of 1/lfi+ on 1/e of the
-124
same type as the dependence derived with the exciton-diffusion model assuming annihilation of excitons at the very surface only.
8.3. Reactions of excitons at the surface of anthracene crystals
The surface quenching of the fluorescence of anthracene crystals is caused by interactions of excitons with specific chemical species present at the surface. The following types of agents are active.
(a) Certain organic dyes (rhodamine B, acridine orange). The interaction leads to transfer of energy from the exciton to the dye. Evidence is the emission of a sensitized fluorescence by the dye and a correlation 45) between the rate of the interaction on the one hand and the overlap between the emission spectrum of anthracene and the absorption spectrum of various dyes on the other.
(b) Concentrated solutions of mineral acids (H2S04 , HF, HCl). The interaction of excitons with acids probably leads to an excited proton adduct to anthracene. The latter is known to decay non-radiatively.
(c) Electron acceptors like molecular oxygen and solutions of sodium hypochlorite. With oxygen the primary reaction is probably the formation of a shortlived electron-transfer state. The interaction of excitons with oxidation products of anthracene at the surface may be of the same type. There are indications that the rate of electron transfer to oxygen is, not unexpectedly, fast compared to the rate of the formation of proton adducts.
(d) Powerful electron donors (sodium stannite).
The quenching of the fluorescence by any of these four types of agents can lead to photoconduction.
(a) Excited dye molecules can abstract an electron from the crystal, leaving a mobile hole. Evidence is the weak photoconduction observed when the crystal sensitized with the dye is irradiated in the absorption band of the dye. There is evidence that the reactive species is formed by the dye in the triplet state 45
).
(b) Formation of excited proton adducts can lead to charge carriers only in the presence of oxygen or other electron acceptors. The reaction leaves a hole in the crystal and a hydrogen atom probably bound to oxygen in the form of a hydroperoxy radical. Anthracene in contact with concentrated solutions of acid (the positive electrode) behaves as a "primary" photoconductorinasmuch as one mobile hole can be generated for every exciton quenched in a reaction with acid at the surface. The generation of holes in anthracene crystals doped with acridine and having acidic aqueous electrodes probably takes place by a different mechanism. Here holes are generated in the dopedcrystalsthroughout a narrow layer of the crystal adjoining the positive electrode, probably at protonated molecules of the dopant. In crystals doped with I0- 2 M/M acridine with 5-10 N solutions of mineral acid in the positive compartment nearly one hole can be generated for every photon absorbed in the crystal.
-125-
(c) The electron-transfer state to oxygen does not readily lead tomobilecharge carriers. Its dissociation is promoted when the negative charge on oxygen is localized, for instance by hydrogen ions. The reaction products in this case are a positive hole in the crystal and probably (again) a hydroperoxy radical. A generation of holes through a reaction of excitons with oxygen molecules and hydrogen ions takes place not only at the surface but apperently also at deeper centres associated with oxygen molecules and hydrogen ions penetrated over some distance into the crystal. In the absence ofhydrogen ions (with alkaline electrode solutions) the photocurrents are smaller. It can be shown that in this case the charge carriers are generated exclusively at the surface. This indicates that the negative charge on oxygen can be localized not only by hydrogen ions but also by oriented water dipoles at the crystal-water interface.
(d) Interactions of excitons with electron donors can lead to a generation of mobile electrons in the crystal only when the electrode solution is alkaline. The reason why no electrons are generated when the solution is acidic may be a rapid reaction of electrons on anthracene and hydrogen ions in the solution. This reaction will be favoured by the circumstance that electrons become readily trapped in anthracene, more so than holes. An analogous effect can be seen in the inhibition of the generation of free holes at the positive electrode by alkali in high concentrations.
Oxidation products of anthracene are formed at the surface in contact with the negative electrode, where holes are discharged and also at the positive electrode, where holes are generated, especially when the applied voltage is low. The oxidation products, when present in appreciable amounts at the positive electrode, are active in the photoconduction. They must be removed by rinsing the surface of the crystal with a solvent if one wants to study the reactions of excitons with agents in the solution.
It follows from the nature of the chemical reactions mentioned above that the photogeneration of charge carriers at the surface frequently cannot be described76)asaprocessthatis "reversible" in the electrochemical sense: before charge carriers arise, part of the energy is dissipated as heat so that any backward reaction involving charge carriers does not restore the exciton state. This is evident for the reactions of excitons with dyes and with proton donors, but probably holds also in other cases. An indication is that it was not possible to vary the fluorescence intensity by varying the applied voltage whatever the composition of the solution in contact with the illuminated surface.
-126-
REFERENCES
1) A. Byck and H. Bork, Ber. dtsch. phys. Ges. 8, 621, 1910. 2) H. Steubing, Ber. dtsch. phys. Ges. 8,867, 1910. 3 ) R. S. Knox, Solid St. Phys. 5, suppl. 1963. 4
) M. Trlifaj, Czech. J. Phys. B6, 533, 1956; B8, 510, 1958; B9, 4, 1959. 5) E. J. Bowen, J. chem. Phys. 13, 306, 1945. 6 ) 0. Simpson, Proc. Roy. Soc. A238, 402, 1956/57. 7 ) G. T. Wright, Proc. phys. Soc. 68B, 701, 1955. 8 ) M. D. Borisov and V. N. Vishnevskii, Ukr. fiz. Zh. 1, 371, 1956 (in Ukrainian).
See also W. Gartner, Phys. Rev. 105, 823, 1957. ~ L. E. Lyons, J. chem. Phys. 23, 220, 1955. 10) V. V. Eremenko and V. S. Medvedev, Fizika tverd. Tela 2, 1572, 1960. 11) A. G. Chynoweth and W. G. Schneider, J. chem. Phys. 22, 1021, 1954. 12) H. Kallmann and M. Pope, J. chem. Phys. 32, 300, 1960. 13) J. W. Steketee and J. de J onge, Philips Res. Repts 17, 363, 1962. 14) J. Kommandeur and W. G. Schneider, J. chem. Phys. 28, 582, 1958. 15) B. J. Mulder and J. de J onge, Solid St. Comm., to be published. 16) R. G. Kepler, Phys. Rev. 119, 1226, 1960. 17) 0. H. LeBlanc, J. chem. Phys. 35, 1275, 1961. 18) R. Silby, J. Jortner, A. Rice Stuart and T.V. Martin Jr, J. chem. Phys. 43, 2925,
1965. 19) M. Silver, D. Olness, M. Swicord and R. C. Jarnagin, Phys. Rev. Letters 10, 12,
1963. 20) J. F. Hornig and G. Castro, J. chem. Phys. 42, 1459, 1965. 21 ) P. Jansen, W. Helfrich and N. Riehl, Phys. Stat. sol. 7, 851, 1964. 22) J. Adolph, E. Baldinger and I. Granacher, Physics Letters 8, 224, 1964. 23) J. H. Sharp and W. G. Schneider, J. chem. Phys. 40, 3657, 1964. 24) 0. H. LeBlanc, Physics and chemistry of the organic solid state 3, 133, 1967. 25) J. Kommandeur, Physics and chemistry of the organic solid state 2, 1, 1965. 26) R. G. Kepler, Trans. nucl. Sci. 11, 1, 1964. 27) H. Inokuchi and H. Akamatu, Solid St. Phys. 12, 93, 1961. 2 8) R. Sizmann, Angew. Chern. 71, 243, 1959. 29) W. E. Bachmann, J. Am. chem. Soc. 57, 555, 1935. 30) H. Kallmann and M. Pope, Rev. sci. Instr. 29, 993, 1958. 31) H. H. Perkampus, Z. phys. Chern. 19, 206, 1959. 32) E. Clar, Aromatische Kohlenwasserstoffe, Springer, Berlin, 1952, p. 283. 33) J. Tanaka, Bull. chem. Soc. Japan 36, 1237, 1963. 34) D. M. Donaldson, J. M. Robertson and J. G. White, Proc. Roy. Soc. A220, 311,
1953. 35) B. J. Mulder, Rec. Trav. chim. Pays-Bas 84, 713, 1965. 36) C. G. Hatchard and C. A. Parker, Proc. Roy. Soc. A235, 530, 1956. 37) A. Bree and L. E. Lyons, J. chem. Soc. 1956, 2662. 38) H. S. Carslaw and J. C. Jaeger, Conduction of heat in solids, Clarendon Press, Oxford,
1959, 2nd ed., p. 41. 39) V. M. Agranovich and A. N. Faidy sh, Optika Spektrosk. 1, 885, 1956. 40) J. Ferguson, Aus. J. Chern. 9, 160, 1956. 41) F. Rinne and M. Berek, Anleitung zu optischen Untersuchungen mit dem Polarisations
mikroskop, E. Schweizenbart'sche Verlagsbuchhandlung, Stuttgart, 1953, p. 208. 42) I. V. Obreimov, A. F. Prikhotko and I. V. Rodnikova, Zh. eksp. teor. Fiz. 18,
409, 1948. 43) G. T. Wright, Proc. phys. Soc. 68B, 241, 1955. 44
) I. Nakada, J. phys. Soc. Japan 17, 116, 1962. 45) B. J. Mulder and J. de Jonge, Proc. Kon. Ned. Akad. Wet. B66, 303, 1963. 46) T. Forster, Fluoreszenz organischer Verbindungen, Vandenhoeck und Ruprecht,
Gottingen, 1951. 47) B. J. Mulder, J. de Jonge and G. Vermeulen, Rec. Trav. chim. Pays-Bas 85, 31, 1966. 48) D. F. Williams, J. Adolph and W. G. Schneider, J. chem. Phys. 45, 575, 1966. 49) J. W. Steketee and J. de Jonge, Proc. Kon. Ned. Akad. Wet. B66, 76, 1963. 50) W. Helfrich and F. R. Lipsett, J. chem. Phys. 43, 4368, 1965. 51 ) W. Mehl, J. M. Hale and F. Lohmann, J. electrochem. Soc.113, 1166, 1966. 52) A. Bree and L. E. Lyons, J. chem. Phys. 22, 1630, 1954. 53) V. M. Korsunskii and A. N. Faidysh, Optika Spektrosk. 11, 119, 1962.
-127-
54) V. L. Zima, V. M. Korsunskii and A. N. Faidysh, Iz. Akad. Nauk SSSR 27, Ser. Fiz., 519, 1963.
55) A. I. Kitaigorodskii, Organic chemical crystallography, Consultants Bureau, New York, 1961, p. 420.
56) D. J. Carswell and L. E. Lyons, J. chem. Soc. 1955, 1734. 57) D. C. Northrop and 0. Simpson, Proc. Roy. Soc. A244, 377, 1958. 58) D. C. Hoesterey and G. M. Letson, J. Phys. Chern. Solids 24, 1609, 1963. 59) E. Clementi and M. Kasha, J. molec. Spectrosc. 2, 297, 1958. · 60) J. Tanaka, Bull. chem. Soc. Japan 38, 86, 1965. 61) N. Geacintov, M. Pope and H. Kallmann, J. chem. Phys. 45, 2639, 1966. 62) A. Bree and L. E. Lyons, J. chem. Soc. 1960, 5206. 63) 0. P. Kharitonova, Optika Spektrosk. 5, 29, 1958. 64) J. P. Colpa, C. Maclean and E. L. Mackor, Tetrahedron 19, suppl. 2, 76, 1963. 65) 0. D. Dmitrievskii and A. H. Terenin, Dokl. Akad. Nauk SSSR 151, 122, 1963. 66) A. Bree and L. E. Lyons, J. chem. Soc. 1960, 5179. 67) R. Ma tejec, Ber. Bunsenges. 68, 964, 1964. 68) R. C. Jarnagin, J. Gilliland, J. S. Kim and M. Silver, J. chem. Phys. 39, 573, 1963. 69) E. G. McRae, Aus. J. Chern. 16, 315, 1963. 70) W. IJ. Aalbersberg, G. J. Hoijtink, E. L. Mackor and W. P. Weyland, J. chem.
Soc. 1959, 3049. 71 ) R. M. Hochstrasser, J. chem. Phys. 40, 2559, 1964. 72) A. A. Kazzaz and A. V. Zahlan, Phys. Rev. 124, 90, 1961. 73) H. S. Carslaw and J. C. Jaeger, Conduction of heat in solids, Clarendon Press, Oxford,
1959, 2nd ed., p. 256. 74) A. R. MeG rie, P. J. Reucroft and M. M. Labes, J. chem. Phys. 45, 3163, 1966. 75) K. Kawaoka and D. R. Kearns, J. chem. Phys. 41, 2095, 1964. 76) J. M. Hale and W. Mehl, Paper presented at the 18th meeting of the CITCE, Schloss
Elmau, Germany, 1967.
-128-
Acknowledgement
The investigations described in this thesis were carried out at the Research Laboratories of N.V. Philips' Gloeilampenfabrieken. I am greatly indebted to the directors of these laboratories for their permission to publish the results as a thesis. I wish to thank Dr J. de Jonge for his stimulating interest in this work and for his critical reading of the manuscript. Thanks are also due to Prof. Dr J. A. Geurst and Prof. Dr P. Penning for help with mathematical problems and to Dr L. Heijne for reading part of the manuscript. Finally I would like to express thanks to Mr G. Vermeulen for his part in the experimental work.
- 129
Summary
In this thesis a study is made of the migration of photoexcited singlet states in anthracene and some other aromatic hydrocarbons and of the reactions which lead to annihilation of excitation energy at the surface of the crystals in contact with aqueous solutions.
The migration of excitation energy can be described as a diffusion process of excitons. The concentration of excitons at. the illuminated surface can be calculated as a function of the excitation depth and the mean diffusion length of the excitons in the crystal. The calculations are extended to fluorescent crystals, where excitons are generated not only by absorption of incident light but also by reabsorption of fluorescent light. The integrodifferential equation which describes the creation of excitons by incident light and by reabsorption of fluorescent light, their transport by diffusion and their annihilation, can be solved explicitly for the exciton concentration at the illuminated surface.
Numerical calculations have been made for anthracene. For the calculations the spectral distribution of the "primary" fluorescence, undistorted by reabsorption, has to be known. The latter was measured on microcrystals embedded in aqueous solutions of sodium sulphite. It turns out that the exciton concentration at the surface of the (fluorescent) anthracene crystals varies with the excitation depth in the same manner as would be found for a non-fluorescent crystal with a 1·5 times greater exciton diffusion length.
The variation of the exciton concentration with excitation depth at the surface of anthracene crystals is studied experimentally from the quenching of the crystal fluorescence, the photoconduction and the "sensitized" fluorescence emitted by very small amounts of organic dyes adsorbed from aqueous solutions at the surface of the crystal. All these effects are proportional with the concentration of excitons at the surface. The experimental results, in the form of excitation spectra, are analysed with the mathematical modeL The three types of measurements are consistent, leading to the same value of the exciton diffusion length, when an organic dye is used as the active quenching agent at the surface. The same value of the exciton diffusion length is also found when the photoconduction spectrum is measured with a dilute solution of alkali as the electrode.
Excitation spectra of the crystal fluorescence and the photoconduction measured on crystals in contact with non-alkaline aqueous solutions have smaller peak-to-valley ratios than corresponds to a process of annihilation of excitons at the very surface, although the fluorescence is quenched and charge carriers are generated as a result of the interaction of excitons with the electrode. It seems that this interaction can take place not only at the very surface (as is assumed in the simple diffusion model) but also at "deeper centres". The deeper centres arise as a result of the penetration of small foreign molecules (oxygen)
130-
and ions (hydrogen ions) from the electrode solution into a narrow layer of the crystal adjoining the electrode.
The exciton diffusion length perpendicular to the a,b-plane of anthracene crystals is about 400 A in our best crystals (grown from solutions or by slow sublimation). In crystals grown from the melt the exciton diffusion length is less than 250 A. The diffusion of excitons in anthracene is found to be anisotropic. The mean diffusion length is about twice as long in the a,b-plane as perpendicular to this plane.
Determinations were also made of exciton diffusion lengths in anthracene crystals doped with various amounts of tetracene. Photoconduction spectra measured on the doped crystals show that the exciton diffusion length decreases with increasing concentration of tetracene (as a result of trapping of excitons by the dopant) in a manner that is in very good agreement with the simple diffusion model for excitons. At high concentrations of tetracene (I0- 3 M/M) the diffusion length is so small that the excitation spectrum of the photocurrent in these crystals practically duplicates the absorption spectrum of anthracene. The only cause of the fact that the photocurrents in doped crystals are smaller than those in undoped crystals under comparable experimental conditions is that fewer excitons reach the surface of the doped crystals. From the effect of the dopant on the magnitude of the photocurrent it can be concluded that the rate constant for the annihilation of excitons at the surface is at least 3000 cmfs. This implies that more than 90% of the excitons that contact the surface are annihilated at the surface (radiatively or non-radiatively). In heavily doped crystals excitation energy can migrate not only as excitons in the host lattice but also by jumping from one guest molecule to another. There is evidence that in anthracene crystals heavily doped with phenazine the energy can migrate from guest to guest both in the excited singlet state and in the triplet state.
Photoconduction spectra measured on crystals of pyrene and the stable modification of perylene indicate that excitation energy in these crystals is immobile. The reason seems to be the formation of excited charge-resonance states between the paired molecules that constitute the lattice of these crystals. Excitons in the metastable modification of perylene have a mean diffusion length of about 100 A. In tetracene the mean diffusion length of excitons (singlet or triplet) is found to be 300 A at the most.
Excitons can be annihilated and charge carriers generated in various types of chemical reactions at the interface between anthracene crystals and aqueous solutions. The following reactions can be distinguished.
(1) Transfer of energy to molecules of organic dyes followed by abstraction of an electron from the crystal by the excited dye molecule, or the emission of a "sensitized" fluorescence.
(2) Transfer of electrons to suitable acceptors, notably oxygen. The probability
131-
of recombination of the electron on oxygen and the hole on anthracene is diminished by acids, presumably by localization of the negative charge on oxygen by protons.
(3) Formation of proton adducts at excited anthracene molecules by interactions of excitons with concentrated mineral acids. In the presence of oxygen the proton adduct dissociates readily (with unit efficiency) into free holes and other products.
(4) Excitons can also interact with powerful reductants. When these are present in alkaline solutions (potassium stannite), the interaction can lead to injection of electrons into anthracene. No electrons are injected from acidic solutions, presumably because of a rapid neutralization of the electrons on anthracene by protons in the solution. An analogous effect can be seen in the inhibition of hole injection by concentrated solutions of alkali. This effect can be attributed to a reaction of holes on anthracene with OH- ions in the solution.
A neutralization of holes by a reaction with OH- ions or water molecules can take place both at the illuminated positive electrode and at the dark negative electrode. The reactions give rise to oxidation products of anthracene that are active in the photogeneration of holes.
-132-
Samenvatting
Dit proefschrift heeft tot onderwerp de migratie van met licht aangeslagen energietoestanden in anthraceen en andere aromatische koolwaterstoffen, alsmede de reacties waarin de aanslagenergie wordt vernietigd aan het kristaloppervlak dat in aanraking wordt gebracht met waterige oplossingen van uiteenlopende samenstelling.
De migratie van aanslagenergie kan beschreven worden als een diffusieproces van excitonen.
De concentratie van de excitonen aan het verlichte kristaloppervlak kan berekend worden als functie van de excitatiediepte en de gemiddelde diffusieweg van de excitonen. De berekeningen worden uitgebreid tot fluorescerende kristallen waarin ook excitonen gegenereerd worden door herabsorptie in het kristal van de eigen fluorescentie. Een en ander geeft aanleiding tot een integrodifferentiaalvergelijking, waaruit de excitonenconcentratie aan het oppervlak opgelost kan worden. Het blijkt, dat de excitonconcentratie aan het oppervlak van (fluorescerende) anthraceenkristallen met de excitatiediepte varieert op dezelfde wijze als het geval zou zijn met een nietfluorescerend kristal en een anderhalf maal zo lange gemiddelde diffusieweg van de excitonen.
De variatie van de concentratie van de excitonen met de excitatiediepte in anthraceenkristallen is experimented bepaald aan de doving van de kristalfluorescentie, de fotogeleiding en de ,gesensibiliseerde" fluorescentie uitgezonden door zeer kleine hoeveelheden van de kleurstof rhodamine B, die aan het kristaloppervlak kan worden geadsorbeerd. De resultaten van de metingen (in de vorm van excitatiespectra) leiden voor elk van de drie soarten metingen tot dezelfde waarde van de gemiddelde diffusieweg van de excitonen in een bepaald kristal, indien kleurstoffen verantwoordelijk zijn voor de doving van de kristalfluorescentie en het ontstaan van ladingsdragers. Dezelfde gemiddelde diffusieweg volgt ook nog uit het fotogeleidingsspectrum gemeten aan een niet met een kleurstof gesensitiseerd kristal met een alkalische waterige electrode. In andere gevallen zijn de piek-dal verhoudingeninhetexcitatiespectrum kleiner dan overeenkomt met een zuivere oppervlaktereactie van excitonen. Niettemin wordt in aile gevallen de fluorescentie gedoofd en worden ladingsdragers gegenereerd door wisselwerking van excitonen met de electrode. Er zijn aanwijzingen dat deze wisselwerking niet beperkt is tot het oppervlak in engere zin maar ook plaats vindt aan dieper gelegen centra. Deze laatste ontstaan door het binnendringen van moleculen zuurstof en waterstofionen uit de waterige oplossingen in een dunne laag van het kristal die aan het oppervlak grenst.
De diffusie van excitonen in anthraceen is anisotroop. In het kristallografisch a,b-vlak is de diffusieweg ongeveer tweemaal zo lang als loodrecht op dit vlak. De diffusieweg in de laatste richting is 400 A in goed ontwikkelde kristallen.
-133
verkregen uit oplossingen of door langzame sublimatie in een vacuum. In het algemeen is de diffusieweg korter en dit is steeds het geval in uit de smelt verkregen kristallen.
In met tetraceen verontreinigd anthraceen neemt de diffusieweg af met toenemende concentratie van tetraceen. De afname geschiedt op een wijze die zeer goed overeenstemt met een eenvoudig diffusiemodel voor excitonen. Bij hoge tetraceenconcentraties (I0- 3 M/M) is de diffusieweg zo klein dat het fotogeleidingsspectrum vrijwel dezelfde vorm krijgt als het absorptiespectrum van anthraceen. In anthraceen dat zwaar verontreinigd is met tetraceen, phenazine of acridine kan aanslagenergie zich verplaatsen door van de ene vangplaats naar de andere te springen.
Fotogeleidingsspectra gemeten aan pyreen en de stabiele vorm van peryleen wijzen uit dat in deze kristallen de aanslagenergie niet beweeglijk is. Dit zal samenhangen met de vorming van aangeslagen toestanden van electronoverdracht tussen de gepaarde moleculen die de bouwsteen vormen van deze kristallen. In de metastabiele vorm van peryleen hebben de excitonen een gemiddelde diffusieweg van ongeveer 100 A. In tetraceen is de diffusieweg ten hoogste 300 A.
Tot de oppervlaktereacties waarin excitonen vernietigd kunnen worden, behoren de volgende. (1) Energieoverdracht naar kleurstoffen gevolgd door emissie van gesensiti
seerde fluorescentie of een oxidatieve reactie van het aangeslagen kleurstofmolecuul met het kristal.
(2) Overdracht van een electron naar een geschikte acceptor zoals zuurstof. (3) Additie van een proton aan een aangeslagen anthraceenmolecuul. Het
laatste proces heeft de overhand wanneer anthraceenkristallen in aanraking zijn met geconcentreerde oplossingen van minerale zuren. Voor elk protonadduct kan een vrij positief gat in het kristal ontstaan.
(4) Excitonen kunnen ook in wisselwerking treden met krachtige reductors. Indien deze zich in alkalische oplossing bevinden, kunnen hierbij electronen in het kristal gelnjecteerd worden. Dit is niet het geval wanneer de oplossing zuur is, waarschijnlijk door een snelle neutralisering van de electronen door protonen uit de oplossing. Als een gelijksoortig verschijnsel kan men beschouwen het verhinderen van de injectie van positieve gaten door geconcentreerde loogoplossingen. Door een reactie van gaten met hydroxylionen aan het donkere of het verlichte oppervlak ontstaan oxidatieprodukten van anthraceen die de fotogeleiding bevorderen.
STELLING EN
B. J. MULDER
STELLING EN
I
De door Jarnagin, Gilliland, Kim en Silver aangegeven proefopstelling voor bet aantonen van zuurstof, die zou kunnen ontstaan bij de ontlading van positieve ladingsdragers aan bet oppervlak van antbraceenkristallen, is biertoe ongescbikt.
R. C. Jarnagin, J. Gilliland, J. S. Kim en M. Silver, J. chem. Phys. 39, 573, 1'963.
II
Bij bet bepalen van het quantenrendement van de pbotofluorescentie van organiscbe kristallen bebben Borisov en Vishnevskii ten onrecbte geen rekening gebouden met een mogelijke extrinsieke stralingsloze annihilatie van excitonen aan en nabij bet kristaloppervlak.
M. D. Borisov en V. N. Vishnevskii, Izv. Akad. Nauk SSSR 20, 502, 1956.
III
Wanneer van twee functies van eenzelfde veranderlijke de afgeleiden dezelfde nulpunten bebben en buiten de nulpunten van teken verscbillen kan men voor deze relatie de term antibaat invoeren.
IV
Bij bet vergelijken van bet quantenrendement van de pbotofluorescentie van kleurstoffen in verscbillende oplosmiddelen dient men rekening te houden met het verscbil in brekingsindex van de media.
A. V. Buettner, J. chem. Phys. 46, 1398, 1967.
v Sulfenyljodiden en sulfenylfl.uoriden zijn onjuiste voorbeelden ter illustratie van de bestendigheid van verbindingen tussen ,zachte" zuren en ,zachte" basen en de onbestendigheid van verbindingen tussen ,zachte" zuren en ,harde" basen. Eveneens onjuist is de bewering dat verbindingen van het type R-S-0-R niet voorkomen.
R. G. Pearson, Chemistry in Britain 3, 103, 1967.
VI
De termen ,fit" en ,misfit" zijn met betrekking tot kwesties van epitaxie van twijfelachtig nut.
A. Miller and H. M. Mamasevit, J. Vacuum Sci. Techno!. 3, 68, 1966.
vn Metingen van kleine zuurstofdrukken met een normale Bayard-Alpert manometer leiden tot onjuiste uitkomsten.
B. J. Hopkins en K. R. Pender, Surface Sci. 5, 155, 1966. R. N. Lee en H. E. Farnsworth. Surface Sci. 3, 461, 1965.
VIII
De intensiteitsverhoudingen van de lijnen voorkomend in het electronspinresonantiespectrum van zinksulfide gepubliceerd door Gavrilov en Shutilov zijn in strijd met het door hen voorgestelde model.
V. S. Gavrilov en V. A. Shutilov, Soviet Physics- Solid State 8, 501, 1966.
IX
Ret innemen van fl.uoridetabletten door volwassenen met een volgroeid gebit voor de preventie van caries is zinloos.
X
De afzonderlijke bedrijfspensioenfondsen in Nederland dienen vervangen te worden door een algemeen bedrijfspensioenfonds, dat onder toezicht van de Rijksoverheid staat.
B. J. Mulder 7 juli 1967

![18 760783.30 760784.30 760785.30 760786.30 761780.30 ... · base material NUCLEODUR ... Fluorene 185. Phenantrene 6. Anthracene 7. Fluoranthene 8. Pyrene 9. Benz[a]anthracene 10](https://img.pdfslide.tips/doc/110x75/5b870fbe7f8b9a162d8e40fb/18-76078330-76078430-76078530-76078630-76178030-base-material-nucleodur.jpg)