Embed Size (px)
Citation preview
14-osios Lietuvos jaunųjų mokslininkų konferencijos „Mokslas – Lietuvos ateitis“ 2011 metų teminės konferencijos straipsnių rinkinys ISSN 2029-7149 online STATYBA ISBN 978-9955-28-929-6
© Vilniaus Gedimino technikos universitetas http://dspace.vgtu.lt 1
DISCRETE CRACK MODEL OF STEEL FIBRE REINFORCED CONCRETE MEMBERS SUBJECTED TO TENSION
Adas Meskenas1, Darius Ulbinas2 Vilnius Gediminas technical university, Sauletekis al. 11
[email protected]; [email protected] Abstract. This paper presents discrete crack model analysis of steel fibre reinforced concrete tensile members. The crack model uses residual stresses of stress-strain relationships obtained from two different models: simplified model, proposed in the literature and the Layer section model. The latter model is based on the stress-strain relationships obtained from the test data of steel fibre reinforced concrete (SFRC) beams by the inverse technique. Crack width and average strain were investigated performing a comparative analysis of different prediction methodologies, significance of influence of residual stresses to the results is shown. Keywords: discrete crack, steel fibre, tensile members, crack model, simplified model, Layer section model, inverse technique, crack width. Introduction
In last decades, fibre reinforcement is widely used in many countries as additive for concrete and cement mortar mixture for production of structures. Fibre reinforced concrete is being increasingly used in pavements, off-shore platforms, water retaining structures, bridges, tunnels, etc. (Reinhardt and Naaman 1999; Rossi and Chanwillard 2000; König et al. 2002). The effectiveness of steel fibres in enhancing the mechanical properties, in particular toughness, of a quasi-brittle material as concrete, is primarily controlled by the processes of transferring stresses from the matrix to the fibre and by the bridging effect of the fibres across the cracks (Bentur and Mindess 1998). The addition of steel fibres to conventional reinforced concrete beams greatly improves the cracking strength, restricts the growth of cracks, and reduces the tensile strains in steel reinforcement bars, thereby resulting in smaller crack widths (Yang et al., 2009).
Discrete crack model was introduced by D. Ngo. A.C. Scordel and Y.R. Raschid (1967). This model shows the real behaviour of element, when with increasing loading all discrete cracks, opening in construction, are taken in consideration. Discrete crack model is used for calculation of crack widths and evaluation of strain and stress distribution between the cracks.
In this paper, calculations of the crack width and average strain were investigated performing a comparative analysis of different methodologies. In the discrete crack model residual stresses of stress-strain relationships obtained from two different models - simplified model, proposed in the literature and the Layer section model – are used. The latter model is based on the stress-strain relationships obtained from the test data of
steel fibre reinforced concrete (SFRC) beams using the inverse technique.
Simplified model
Campione (2008) proposed the Simplified model for the calculation of the load-deflection curves of simply supported reinforced concrete beams in the presence of fibre and transverse stirrups under flexure and shear. In the case of flexural failure, under the hypothesis of a perfect bond of steel bars and concrete, the plane section theory is considered, including the strength contribution due to the residual tensile strength of fibrous concrete. In this section approaches for calculations of residual stresses used in Simplified model by Campione (2008) are presented.
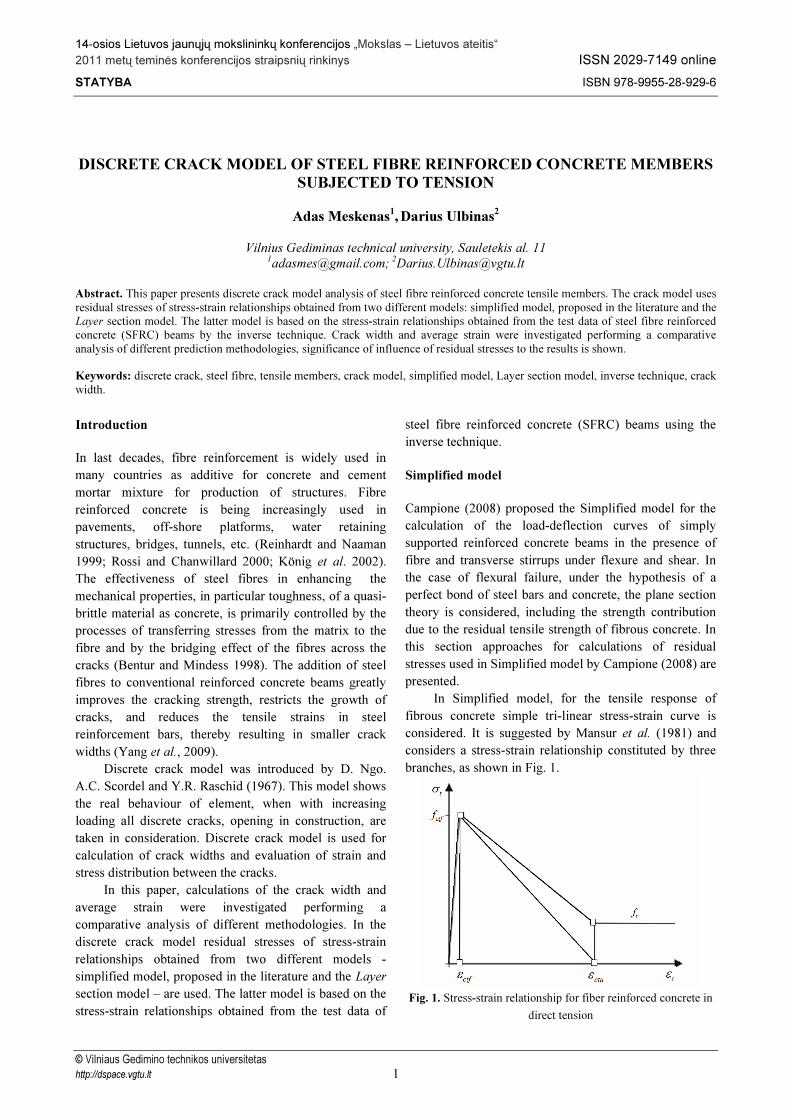
In Simplified model, for the tensile response of fibrous concrete simple tri-linear stress-strain curve is considered. It is suggested by Mansur et al. (1981) and considers a stress-strain relationship constituted by three branches, as shown in Fig. 1.
Fig. 1. Stress-strain relationship for fiber reinforced concrete in
direct tension

2
The whole expression of the relationship is presented below:
( ) ( ),
, 1
,
t ctf t ctf
t ctft ctf r r ctf t ctu
ctu t
r t ctu
E
f f f
f
ε ε ε
ε εσ ε ε ε
ε ε
ε ε
⋅ < −= − ⋅ + < < − > here ctff , ctfε - the maximum tensile strength and corresponding strain, respectively; rf , ctuε - residual strength and corresponding tensile strain, respectively;
ctfE - elastic modulus in tension.
For the calculation of the residual stress, as pointed
out by Campione (2008), its value depends on the effective content of fibres in the composite, and that it also depends on several factors, such as the orientation of fibres in the composite, on the expected pull-out length ratio, and the group reduction factor associated with the number of fibres pulling out per unit area. To take these phenomena into account, a simple analytical expression for residual stress, modified by Naaman (2003), Valle and Buyukozturk (1993) is proposed:
( )'0.2 2r cf f F= ⋅ ⋅ here '
cf - compressive strength of plain concrete; F - the fiber factor, taking into account the effect the fiber characteristics and calculated as:
( )3ff
f
LF V
dβ= ⋅ ⋅
here fL – length of fibre; fd - equivalent diameter; fV - volume percentage; β - a bond factor assumed according to Campione et al. (2006) equal to 1.0 for hooked fibers. This equation already tested in Campione et al. (2006), is continuously assumed in the Simplified model.
Layer Section model
For determination of average stress-strain (σ ε− ) relation for concrete in tension from experimental moment-curvature diagrams of flexural SFRC members the Inverse analysis can be imposed.
The applied technique is based on the following approaches and assumptions on the behaviour of flexural reinforced concrete members subjected to short-term load (Kaklauskas, Ghaboussi 2001): 1. The constitutive model is based on a smeared crack approach, i.e. average stresses and strains are used.
2. The Bernulli Hypothesis of beam bending is adopted implying a linear distribution of strain within the depth of the beam section.
3. Perfect bond between reinforcement and concrete is assumed. Reinforcement slippage occurring at advanced stress-strain states is included into σ ε− diagram of tensile concrete.
4. All fibres in the tensile concrete zone follow a uniform stress-strain law. The Layer Section model, proposed by G.
Kaklauskas and J. Ghaboussi (2001), is employed for computation of the internal forces in the cross-section. Analysis is performed with incrementally increasing bending moment. The two equilibrium equations of internal forces and bending moments are solved for each loading stage yielding a solution for the coordinate of neutral axis and the concrete stress in the extreme tension fibre. Since the extreme fibre has the largest strain, other tension fibres of concrete have smaller strains falling within the portion of the stress-strain diagram, which had already been determined. However, there are many layers in both the tensile and compressive concrete zones and the variation in stresses in each of these zones is not known. The assumption that the same stress-strain relations apply to all layers allows the reduction of the number of unknowns to one for each of the tensile and compressive concrete zones.
Computation is performed for incrementally increasing load. During the first load stage, tensile stresses corresponding to the strains in the extreme layers are computed. These stresses are then used in the equilibrium equations for the second load stage when new stresses corresponding to larger extreme layer strains are determined. In this way, stress-strain curves for the tensile concrete are progressively obtained from all previous stages and used in the next load stage.
The discussed method is illustrated in Fig. 2. It is assumed that the “experimental” moment-average strain curves for extreme fibres of the tensile concrete are given, as in Fig. 2 (a). Circled points in these curves correspond to the experimental data. Here the moment-strain curves were numerically smoothed, resulting in the solid lines, with on purpose to avoid slope discontinuities in the moment-strain curves, which can lead to jumps in the computed material stress-strain diagrams. Computation is performed for n load increments. In order to avoid oscillations in the computed material stress-strain curves, n has to be sufficiently large. For most practical cases, n ≥ 50 is sufficient.
Discrete crack model
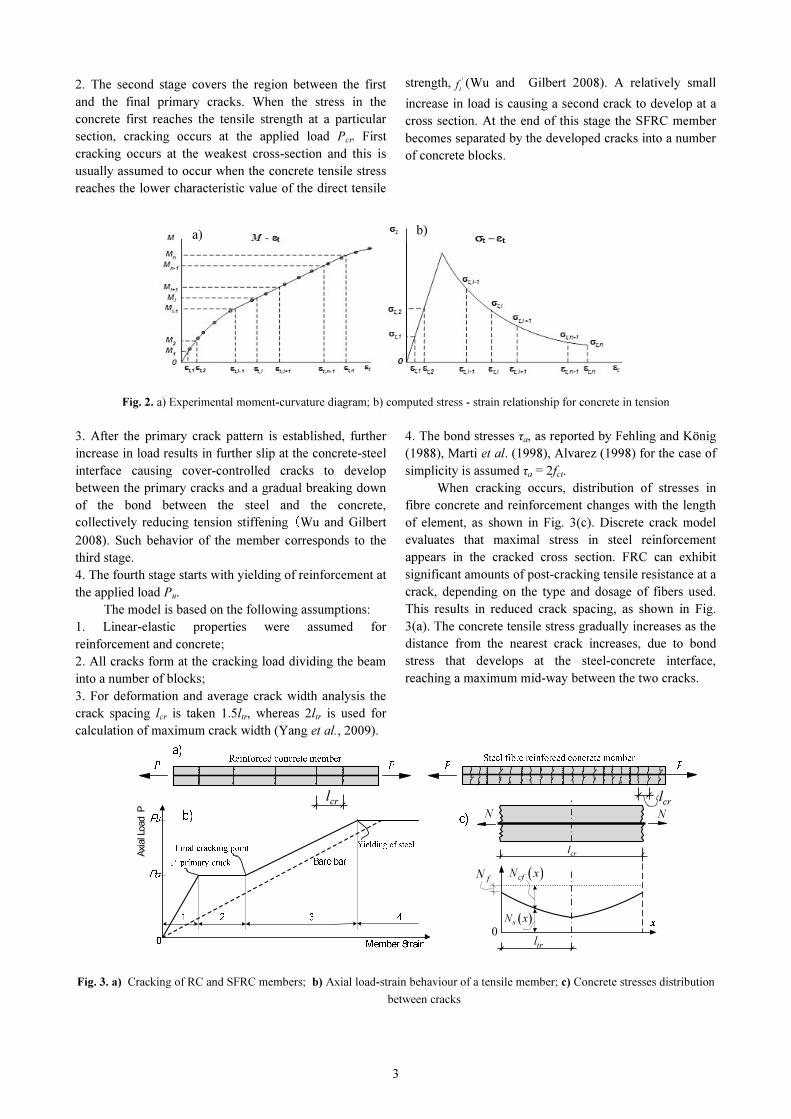
Discrete crack model shows the real behaviour of the concrete element, when with increasing loading all discrete cracks, opening in construction, are evaluated. Considering SFRC element in uniaxial tension a schematic load displacement relationship according to this model is plotted in Fig.3 (b), in which can be founded that the response of a SFRC element can be subdivided into four stages: 1. The first stage represents elastic deformations of the member, the concrete tensile stress increases with load up to start of cracking.
3
2. The second stage covers the region between the first and the final primary cracks. When the stress in the concrete first reaches the tensile strength at a particular section, cracking occurs at the applied load Pcr. First cracking occurs at the weakest cross-section and this is usually assumed to occur when the concrete tensile stress reaches the lower characteristic value of the direct tensile
strength, 'tf (Wu and Gilbert 2008). A relatively small
increase in load is causing a second crack to develop at a cross section. At the end of this stage the SFRC member becomes separated by the developed cracks into a number of concrete blocks.
Fig. 2. a) Experimental moment-curvature diagram; b) computed stress - strain relationship for concrete in tension
3. After the primary crack pattern is established, further increase in load results in further slip at the concrete-steel interface causing cover-controlled cracks to develop between the primary cracks and a gradual breaking down of the bond between the steel and the concrete, collectively reducing tension stiffening (Wu and Gilbert 2008). Such behavior of the member corresponds to the third stage. 4. The fourth stage starts with yielding of reinforcement at the applied load Pu.
The model is based on the following assumptions: 1. Linear-elastic properties were assumed for reinforcement and concrete; 2. All cracks form at the cracking load dividing the beam into a number of blocks; 3. For deformation and average crack width analysis the crack spacing lcr is taken 1.5ltr, whereas 2ltr is used for calculation of maximum crack width (Yang et al., 2009).
4. The bond stresses τa, as reported by Fehling and König (1988), Marti et al. (1998), Alvarez (1998) for the case of simplicity is assumed τa = 2fct.
When cracking occurs, distribution of stresses in fibre concrete and reinforcement changes with the length of element, as shown in Fig. 3(c). Discrete crack model evaluates that maximal stress in steel reinforcement appears in the cracked cross section. FRC can exhibit significant amounts of post-cracking tensile resistance at a crack, depending on the type and dosage of fibers used. This results in reduced crack spacing, as shown in Fig. 3(a). The concrete tensile stress gradually increases as the distance from the nearest crack increases, due to bond stress that develops at the steel-concrete interface, reaching a maximum mid-way between the two cracks.
crl crl
crl
0trl
N N
( )sN x
( )cfN xfN
Axial
Load
P
Fig. 3. a) Cracking of RC and SFRC members; b) Axial load-strain behaviour of a tensile member; c) Concrete stresses distribution
between cracks
a) b)

4
Following algorithm for calculation of strain and crack width of tensile SFRC member is proposed: 1. Calculate the cracking load: ( )1 .cr c tP A f αρ= + Here
/s cE Eα =
and /s cA Aρ = ;
2. Calculate the fiber factor F (see formula 3); 3. Assume the bond stress τa (see assumption 4); 4. Assume lcr (see assumption 3) and define the transfer length ltr=ft×ds/(4×ρ×τa), where ds - diameter of steel bar reinforcement, ρ - the steel reinforcement ratio; 5. Calculate residual stress fr assuming proposed techniques of Layer section model or Simplified model (Campione 2008); 6.Calculate the steel strains εs(x) by formula
( ) ( ) ( ) ( )/ / / 4 /s s s s s fr s a s bx E P A E f E E d xε σ ρ τ= = − − × and fibre concrete strains εcf (x) by formula ( ) ( )/ / 4 / ;cf cf c r c a c bx E f E E d xε σ ρτ= = + × 7. Using the strains of the steel εs(x) and the tensile fibre concrete εcf(x), calculate avarage strain of steel εs(x) and the crack width ( ) ( )( )
0
.
crl
s cfw x x dxε ε= −∫
Experimental investigation
All practical calculations were performed using the experimental results of SFRC beams S-3-2-3, S-3-1-F05, S-3-1-F10, S-3-1-F15. The experiments were held by scientists of Department of Bridges and Special Structures of VGTU. The beams were tested under a four-point loading scheme. The specimens were of rectangular cross-section with nominal length 3280 mm (span 3000 mm), depth 300 mm and width 280 mm. ∅10 mm deformed bars of mild steel were used for the main reinforcement giving tensile reinforcement ratio of 0.3%. Three samples of the bars were tested and several lengths were weighed to check the nominal size. The stresses and modulus of elasticity are based on nominal diameters. Yield strength was 559,9 MPa. Modulus of elasticity of reinforcing bars was obtained to be 202,8 GPa. The beams had different contents of steel fibres (0, 0.5, 1.0 and 1.5% by volume). DUOLOC fibres (aspect ratio 55 mm / 1 mm) were used. Reinforcement of test beams is shown in Fig.4. Main parameters of the experimental beams are listed in Table 1. Experimental moment – curvature diagrams (M κ− ) are given in Fig. 5.
Table 1. Characteristics of the beams h d b as2 As1 As2 p Vf ρ fcm,28 fc fs Es Beam mm mm mm mm mm2 mm2 % % kg/m3 MPa MPa MPa GPa
S-3-2-3 298 271 284 32 235.6 56.55 0.301 – 2410.0 49.50 50.90 578.0 209.9 S-3-1-F05 302 278 278 29 235.6 56.55 0.305 0.469 2417.8 46.21 55.62 559.9 202.8 S-3-1-F10 300 276 279 23 235.6 56.55 0.306 1.015 2392.7 41.99 47.95 559.9 202.8 S-3-1-F15 300 272 279 26 235.6 56.55 0.310 1.462 2439.2 46.90 52.15 559.9 202.8
Fig. 4. Test and reinforcement schemes of experimental beams
Fig. 5. Experimental moment – curvature diagrams
5
Calculation results
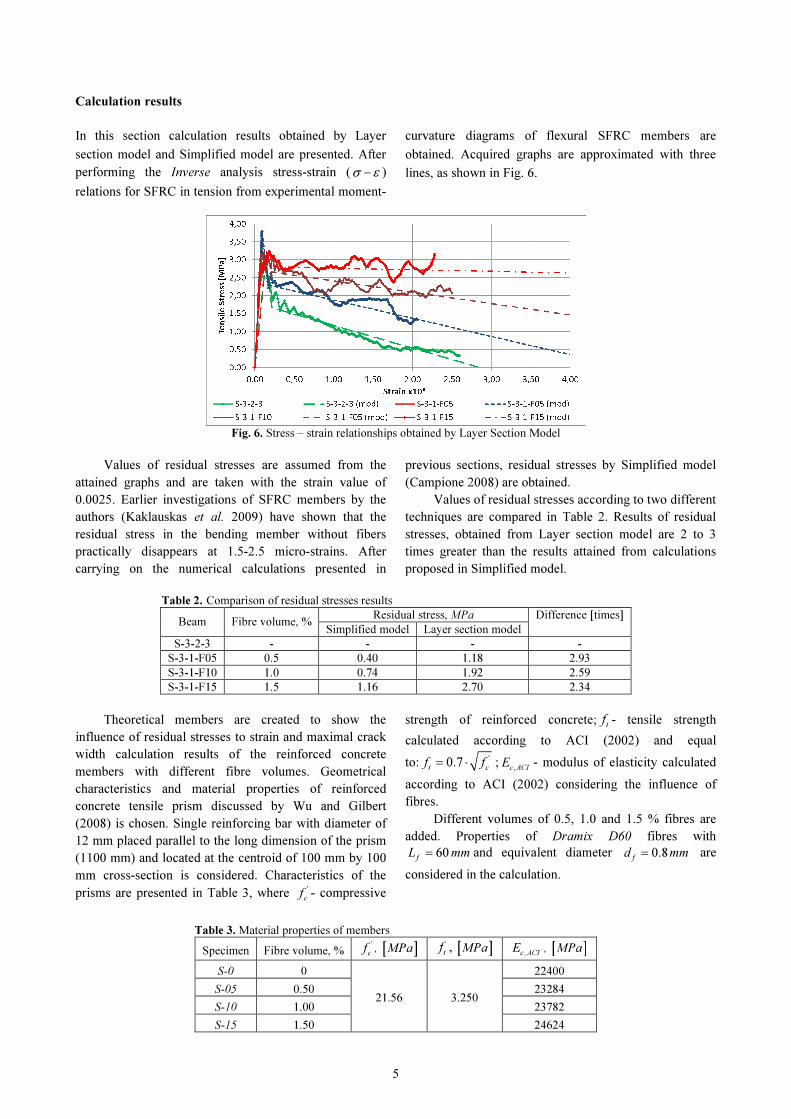
In this section calculation results obtained by Layer section model and Simplified model are presented. After performing the Inverse analysis stress-strain (σ ε− ) relations for SFRC in tension from experimental moment-
curvature diagrams of flexural SFRC members are obtained. Acquired graphs are approximated with three lines, as shown in Fig. 6.
Fig. 6. Stress – strain relationships obtained by Layer Section Model
Values of residual stresses are assumed from the attained graphs and are taken with the strain value of 0.0025. Earlier investigations of SFRC members by the authors (Kaklauskas et al. 2009) have shown that the residual stress in the bending member without fibers practically disappears at 1.5-2.5 micro-strains. After carrying on the numerical calculations presented in
previous sections, residual stresses by Simplified model (Campione 2008) are obtained.
Values of residual stresses according to two different techniques are compared in Table 2. Results of residual stresses, obtained from Layer section model are 2 to 3 times greater than the results attained from calculations proposed in Simplified model.
Table 2. Comparison of residual stresses results Residual stress, MPa Beam Fibre volume, % Simplified model Layer section model
Difference [times]
S-3-2-3 - - - - S-3-1-F05 0.5 0.40 1.18 2.93 S-3-1-F10 1.0 0.74 1.92 2.59 S-3-1-F15 1.5 1.16 2.70 2.34
Theoretical members are created to show the
influence of residual stresses to strain and maximal crack width calculation results of the reinforced concrete members with different fibre volumes. Geometrical characteristics and material properties of reinforced concrete tensile prism discussed by Wu and Gilbert (2008) is chosen. Single reinforcing bar with diameter of 12 mm placed parallel to the long dimension of the prism (1100 mm) and located at the centroid of 100 mm by 100 mm cross-section is considered. Characteristics of the prisms are presented in Table 3, where '
cf - compressive
strength of reinforced concrete; tf - tensile strength calculated according to ACI (2002) and equal to: '0.7t cf f= ⋅ ;
,c ACIE - modulus of elasticity calculated according to ACI (2002) considering the influence of fibres. Different volumes of 0.5, 1.0 and 1.5 % fibres are added. Properties of Dramix D60 fibres with
60fL mm= and equivalent diameter 0.8fd mm= are considered in the calculation.
Table 3. Material properties of members Specimen Fibre volume, % '
cf , [ ]MPa ,tf [ ]MPa ,c ACIE , [ ]MPa
S-0 0 22400 S-05 0.50 23284 S-10 1.00 23782 S-15 1.50
21.56 3.250 24624

6
Comparative analysis of load-strain relationships
employing residual stresses obtained by two different techniques is done. Results of calculated members S-0, S-05, S-10, S-15 are presented in Figs. 7 – 9.
Fig. 7. Load–strain relationships of member S-05 Fig. 8. Load–strain relationships of member S-10
Fig. 9. Load–strain relationships of member S-15
00,010,020,030,040,050,06
0 0,1 0,2 0,3 0,4 0,5
Load [
MN]
Crack width [mm]S-0 S-05 (Simplified model) S-05 (Layer section model)
00,010,020,030,040,050,06
0 0,1 0,2 0,3 0,4 0,5
Load [
MN]
Crack width [mm]S-0 S-10 (Simplified model) S-10 (Layer section model)
Fig. 10. Load – crack width relationships of member S-05 Fig. 11. Load – crack width relationships of member S-10
00,010,020,030,040,050,06
0 0,1 0,2 0,3 0,4 0,5
Load
[MN]
Crack width [mm]S-0 S-15 (Simplified model) S-15 (Layer section model)
Fig. 12. Load – crack width relationships of member S-15

7
In Figs. 10–12 graphs of load–crack width relationships are presented. As it can be seen, values of crack widths significantly depend on the chosen calculation technique of residual stresses. It can lead to the difference up to 330%, depending on the volume of fibres and giving smaller value of crack width by using residual stresses calculated by Layer section model. Results of average strain can differ up to 280% respectively, as presented in Fig. 7 – 9.
Conclusions
1. Layer section model and the Simplified model, proposed in the literature, were employed for the calculation analysis of residual stresses.
2. Application of Layer section model led to the greater values of residual stresses varying up to 3 times depending on the volume of fibres.
3. It is shown that residual stress is one of the significant factors for the prediction of crack width and average strain results by the Discrete crack model. The difference up to 330% for the crack widths and up to 280% for average strain is obtained depending on the volume of fibres and method of calculation of residual stresses.
4. The scope of the discussed technique should be further investigated considering the future experimental results performed in VGTU.
References
ACI Committee. (2002). Building code requirements for reinforced concrete. ACI No. 318-02, American Concrete Institute, Detroit.
Campione G. 2008. Simplified Flexural Response of Steel Fiber-Reinforced Concrete Beams, Journal of Materials in Civil Engineering, 20(4).
Eligehausen, R.; Popov, E. P.; Bertero, V. V. 1983. Local bond-slip relationship of deformed bars under generalized excitations, Earthquake Engineering Research Center, Report UCB/EERC: 83-19.
Kaklauskas, G.; Holschemacher, K.; Gribniak, V.; Bacinskas, D.; Sokolov, A. 2009. A stress-strain constitutive relationship of steel fiber reinforced concrete. Final Report No. T-101/09. Vilnius Gediminas Technical University. 57 p. (in Lithuanian).
Kaklauskas, G.; Ghaboussi, J. 2001. Stress-strain relations for cracked tensile concrete from RC beam tests, ASCE Journal of Structural Engineering 127(1): 64–73.
Lofgren, I. 2005. Fibre-reinforced Concrete for Industrial Construction - a fracture mechanics approach to material testing and structural analysis. Chalmers University of Technology. Göteborg, 2005 ISBN 91-7291-696-6.
Naaman, A. E. 2003. Engineered Steel Fibers with Optimal Properties for Reinforcement of Cement Composites. Journal of Advanced Concrete Technology, 1(3): 241-252.
Nataraja, M. C.; Dhang, M.; Gupta, A. P. 1999. Stress strain curve for steel-fiber reinforced concrete under compression, Cement & Concrete Composites 4(1): 383-390.
Salys, D.; Kaklauskas, G.; Gribniak, V. 2009. Modelling deformation behaviour of RC beams attributing tension-stiffening to tensile reinforcement, Statybines konstrukcijos ir tehnologijos 1(3): 141-147. (in Lithuanian)
Wu, H. Q.; Gilbert, R. I. 2008. An Experimental Study of Tension Stiffening in Reinforced Concrete Members under Short-Term and Long-Term Loads. UNICIV Report No. R-449. Sydney: The University of South Wales. 32 p.
Wu, H. Q.; Gilbert, R. I. 2009. Modeling short-term tension stiffening in reinforced concrete prisms using continuum-based finite element model, Eng Struct 31: 2380–2391.
Yang, Y.; Walraven, J. C.; den Uijl, J. A. 2009. Combined effect of fibers and steel rebars in high performance concrete, HERON Vol. 54 (2/3): 205.
DISKREČIŲJŲ PLYŠIŲ MODELIO TAIKYMAS PLIENO PLUOŠTU ARMUOTIEMS TEMPIAMIESIAMS GELŽBETONINIAMS ELEMENTAMS A. Meskenas, D. Ulbinas
Santrauka Šiame straipsnyje aptariamas tempiamų plieno pluoštu armuotų gelžbetoninių elementų diskretusis pleišėjimo modelis.
Plyšio pločio ir deformacijų skačiavimams reikšmingą įtaką turi naudojami liekamųjų įtempių rezultatai, gauti pasitelkus du skirtingus skaičiavimo modelius: supaprastintą modelį, pasiūlytą Campione (2008) ir sluoksnių modelį. Pastarasis modelis yra pagrįstas įtempių-deformacijų priklausomybe gauta iš plieno pluoštu armuotų lenkiamųjų elementų eksperimentinių duomenų, sprendžiant atvirkštinį uždavinį. Straipsnyje atlikta palyginamoji plyšio pločio ir vidutinių deformacijų skaičiavimų analizė taikant diskrečiųjų plyšių modelį. Reikšminiai žodžiai: diskretusis modelis, plieno pluoštas, tempiamas elementas, sluoksnių modelis, atvirkštinis uždavinys, plyšio plotis.