Embed Size (px)
Citation preview

Discussion Papers In Economics And Business
Graduate School of Economics and Osaka School of International Public Policy (OSIPP)
Osaka University, Toyonaka, Osaka 560-0043, JAPAN
Banks restructuring sonata:
How capital injection triggered labor force rejuvenation in Japanese banks
Kazuki Onji, Takeshi Osada, and David Vera
Discussion Paper 14-22

May 2014
Graduate School of Economics and Osaka School of International Public Policy (OSIPP)
Osaka University, Toyonaka, Osaka 560-0043, JAPAN
Banks restructuring sonata:
How capital injection triggered labor force rejuvenation in Japanese banks
Kazuki Onji, Takeshi Osada, and David Vera
Discussion Paper 14-22

Banks restructuring sonata:
How capital injection triggered labor force rejuvenation in Japanese banks *
Kazuki Onji, Takeshi Osada, and David Vera†
Abstract
Divergent interests of bank managers and financial regulators potentially compromise the
efficacy of bank rescue operations. This paper analyses an agency problem encountered in a
capital injection program implemented in Japan. We hypothesize that the operation’s
requirement to downsize lead banks to overstate the extent of downsizing by reassigning older
workers to bank subsidiaries. We implement a difference-in-difference analysis using a panel
of Japanese banks from 1990 through 2010. We also employ propensity score matching to
control for the sample selection. The result shows that recipients of public capital exhibited
workforce rejuvenation relative to non-recipient banks. Among injected banks, average
worker age falls by approximately one year, which is equivalent to about seventy less 65-
years-old workers. On stand-alone basis, the number of employees in injected banks decreases
as a response to injection, but on consolidated basis, which accounts for subsidiary
employment, the number of employees at banking does not fall. Our finding suggests that the
Japanese practice of life-time employment survived, albeit in a limited form, among
restructuring banks.
JEL Classification: C23, G21, G28
Keywords: Recapitalization program, lifetime employment, Japanese banks
* We would like to thank Takeo Hoshi and Masami Imai for providing valuable comments. Participants at the ANU-Japan
Public Economics Workshop, WEAI conference (Tokyo and Seattle), Osaka University Public Economics Workshop,
Hitotsubashi University Center for Financial Research Workshop, and Stanford Summer Juku provided useful feedback.
Osada would like to acknowledge the financial support under the Grant-in-Aid for Scientific Research (KAKENHI)
No23830068 provided by the Japan Society for the Promotion of Science. Onji would like to acknowledge research support
provided by the Australia-Japan Research Centre and Jenny Corbett. Akira Kinefuchi provided excellent research assistance.
All remaining errors are ours.
† Onji (corresponding author): Associate Professor, Graduate School of Economics, Osaka University, 1 -7 Machikaneyama,
Toyonaka, Osaka, Japan, 560-0043, Phone: 81-06-6850-5260, Email: [email protected]; Osada: Assistant
Professor, Faculty of Service Management, Bunri University of Hospitality, 311-1, Kashiwabara-shinden, Sayama, Saitama,
350-1336, Japan. Phone: 81-42-954-7968, Email [email protected]; Vera: Assistant Professor, Department of Economics,
California State University, Fresno 5245 N. Backer Avenue, M/S PB20, Fresno, CA 93740-8001, USA, Phone: 1-559-278-
4935, Email [email protected].

1
Introduction
The Global Financial Crisis forced governments all over the world to rescue severely affected
financial institutions for the purpose of containing systemic crisis. Some nonfinancial firms,
such as the General Motors, also received government assistance. These rescue operations
typically entailed government purchases of senior stocks or senior debt of troubled firms. Just
as in any widely-held corporations, where ownerships and controls differ, managers of
government-assisted firms and the regulatory agent need not share the same interests in, for
example, executive compensation and employee downsizing. As a result, the effectiveness of
a rescue operation, when ill designed, could be undermined by the agency problem. AIG,
which announced extravagant bonus payments to executives after receiving capital injection,
is a case in point.
This paper considers the extent and nature of the agency problem to highlight issues in
designing a rescue operation. We focus on the case of the Japanese capital injection program
in which previous studies identify the existence of the agency problem. Japan injected capital
to banks in March 1998 in response to a financial crisis outbreak. Among other provisions,
the capital injection program required banks to comply with targets on workforce downsizing.
To banks that receive public capital, the government becomes an active shareholder with
power to punish. Hoshi and Kashyap (2005) first noted that one bank met a downsizing target
by shuffling workers to its subsidiaries. Onji, Vera, and Corbett (2012) verified the
pervasiveness of the personnel shuffling behavior among injected banks with a sample of
regional banks. The latter study offers a nuanced interpretation on the shifting behavior,
observing that the intent of the bank management may not be malicious in that, in addition to
the downsizing target, banks operated in an environment where banks face restrictions on
layoffs due to the existing labor law and the life-time employment practice (LTE). Onji, Vera,

2
and Corbett (2012) hypothesize that banks shuffled older workers, who were near their
retirement age, to subsidiaries, but offer only circumstantial evidence to support their
hypothesis. In this backdrop, this paper examines the demographic composition of bank
employees to see whether the Japanese capital injection programs induced injected banks to
shed older employees.
Aside from offering a direct test of the hypothesis suggested by Onji, Vera, and Corbett
(2012), the demographic composition of bank workers is of interest for two reasons. The first
is in assessing the role of active shareholders in the death or survival of the Japanese-style
employment practices. The life-time employment (LTE) practice had been adopted
extensively in the Japanese banking industry (Koike, 1996).1 A corollary of the prominence of
LTE is that employers shield older workers from negative productivity shocks by reducing
job opening for younger workers (Genda, 2003). Therefore, the workforce would age if LTE
remains intact and banks freezes hiring of fresh graduates. Genda and Rebick (2000) observe
that changes in employment practices in Japan since the mid-1980s till late 1990s had been
slow due in part to a lack of shareholder activism. The bank capital injection program is an
interesting setting since the government becomes an active shareholder who sets targets on
financial performances as well as labor costs. Our examination of employee demographic of
injected banks would provide insights into how LTE has changed in response to a shareholder
who demands restructuring. The second is in gauging the extent of productivity enhancing
restructuring. Under the seniority-based wage practice, older workers are typically paid above
their marginal product.2 Previous studies emphasize behavioral responses to the capital
injection program that can undermine its efficacy. The capital injection programs however
1 Koike (1996) documents notably long tenures in the Japanese banking sector in the 1970s, compared with white-collar workers in
manufacturing, wholesale and retail, and also with bankers in the West Germany. 2 Further, with an advance of skill-biased technological change (Bresnahan, Brynjolfsson, and Hitt, 2002) and a requirement on injected banks to enhance mechanization, the injected banks may demand more IT-literate workers.

3
may have had ‘real’ impacts on productivity through facilitating shifts in employee
composition towards younger workers away from older workers.
The outcome variable that we examine is the average age of bank employees retrieved from
financial statements. We also examine the number of workers in conjunction with the average
age to infer how demographic composition may have changed. The panel dataset covers
financial year (FY) 1990-2010. We account for mergers by treating banks before and after
mergers as separate units, and the number of panel units in the base analysis is 172. The idea
of the empirical analysis is to see how banks with larger capital injection react relative to
banks with no injection and lower capital injection, accounting for bank-specific observables
and common macroeconomic shocks. As is well recognized in the literature (Onji, Vera,
Corbett, 2012; Duchin and Sosyura, 2012), banks do not receive capital injection randomly.
The sample selection bias is thus a concern. We address this concern in two ways. First, we
explicitly account for bank performance in the regression. Second, we use propensity score
matching to identify a sample of non-injected banks that are similar to injected banks across
many different dimensions, allowing us to determine more accurately the effects on banks
demographics and employment.
Our result suggests that injected banks exhibited workforce rejuvenation relative to non-
injected banks. The estimated coefficients roughly translates to one year reduction in average
age, equivalent to about seventy less 65-years old workers, for an average injected bank.
Upon repayment of injected capital, the average age at injected banks falls further by 1.7
years, which is equivalent to about extra two hundred 22-years old workers. We also examine
the number of employees using both consolidated and unconsolidated data. Consistent with
the previous studies, on parent bank’s stand-alone basis, we find that capital injection is

4
associated with a reduction in employment while repayment of the capital injection increases
employment. In contrast with this finding, on consolidated basis, we do not detect the impacts
of injection, while repayment is weakly associated with an increase in employment. The
contrast between unconsolidated and consolidated further supports the hypothesis that
employees were shifted to subsidiaries (Onji, Vera, and Corbett, 2012). This analysis suggests
that older workers lost their position at parent banks but were still not made completely
redundant as they were transferred to subsidiaries.
No study to our knowledge has examined how capital injection programs induce changes in
the demographic compositions of bank workers. Importantly, our results suggest that the
capital injection program in Japan might have facilitated changes in the labor force in injected
banks in a way that potentially improves productivity. Our analysis employs a longer time
series than those used in the previous studies, and therefore can examine the impacts of
repayments, which have not been considered in the previous studies. Third, we employ a
higher frequency data than data employed by Onji, Vera, and Corbett (2012), who draws from
subsidiary-level data on employment at biennial frequency.
Our study also relates more broadly to other types of behavioral responses to capital injection
programs. One type of responses that have received attention is the risk taking by banks. The
main objective of capital injection programs is to contain financial system meltdowns, but
policy makers explicitly or implicitly expect business lending to continue. Such expectations
lead banks to meet targets by extending loans to risky lenders or to induce moral hazard by
creating the perception that recipient banks are “too-important-to-fail.” Studies have
examined loan-level data on risk rating, and have found that the riskiness of loans increased
for TARP banks (Duchin and Sosyura, 2012; Black and Hazelwood, 2012).

5
Our study is also relevant in understanding the transformation of the LTE practice. Despite
popular discussion about the collapse of the Japanese-style employment practices, a number
of recent studies have documented the resilience of LTE using employee-level data across
industries (e.g. Kambayashi and Kato, 2011). Our research presents a case study from the
banking industry, and shows that even among firms under strict supervision, the practice of
LTE survived in a transformed form, rather than being completely abandoned.
The rest of the paper is organized as follows. Section 1 describes the capital injection
programs in Japan. Section 2 describes the data. Section 3 describes the regression analysis.
Section 4 presents the results of the regression analysis based on a matched sample of injected
and non-injected banks.
1. Institution
1.1 Capital injection and the labor laws
The Japanese government administered capital injection programs since 1998 in response to
the collapses of several prominent financial institutions in 1997 (Hoshi and Kashyap, 2010).
The Financial Function Stabilization Act (FFSA) injected total of 1.8 trillion yen on March
1998 to 21 large banks. The Prompt Recapitalization Act administered 8.6 trillion yen to 32
banks (1999-2002). Injected banks develop a business improvement plan with the Financial
Services Agency and lay out targets on financial outcomes (e.g. tire 1 ratio) as well as
restructuring targets such as the number of workers and board members, compensations,
overhead costs, and mechanization expenses (Onji, Vera, and Corbett, 2012). The target on
workforce downsizing tend to be quite aggressive. In 2001, the Ashikaga Bank for example
targeted a reduction of 26.3% in its workforce by 2005. If outcomes diverge from the targeted

6
figures, the regulator can invoke an administrative order which prohibits banks from paying
dividend and managerial bonuses. The possibility of punitive measures provides an incentive
for management to meet the personnel reduction target. The regulator monitors the bank’s
stock in assessing its performance, so the management also face incentives to implement an
economically meaningful personnel restructuring.
Injected banks however need to downsize workforce under a legal system that discourages
layoffs. OECD evaluates Japan as the third most difficult country to lay off workers in among
27 countries (OECD, 1999). Firms are only permitted to lay off workers after exhausting
alternative means for downsizing, such as hiring freeze, soliciting early retirement, and
permanent transfer to subsidiaries. In addition to the legal system, employment practices in
Japan discourage layoffs. Under the life-time employment and seniority wage practices,
workers and firms expects their relationship to last long. Young workers take wages below
their marginal products in exchange for a secure employment and future compensation. Thus,
a firm that breaks the implicit contract risk damage to its reputation as a reliable employer.
Therefore, the difficulties of conducting layoffs create incentives for banks to resort to other
means to achieve downsizing targets.
The injection program leave open the definition of ‘regular workers’ and how to account for a
reduction of workers. The number on reduction may or may not include workers re-hired by
bank subsidiaries. The lack of a precise definition leaves leeway to reshuffle personnel to
subsidiaries so that the target can be met at parent bank level but not on a consolidated basis.
As a point of comparison, consider another public support program for non-financial
businesses enacted just two years after FFSA.3 Firms under this other program report targets
3 The Law on Special Measures for Industrial Revitalization of 1999. The past reports for individual cases are reported in http://www.meti.go.jp/sankatsuhou/nintei/past_result.html (accessed 25 January 2013).

7
on the number of employees, breaking it down by temporary transfer (shukkou), permanent
transfer (tenseki) as well as the number of new hires. Onji, Vera, and Corbett (2012) argue
that the ambiguity in the reporting requirement under the Japanese capital injection program,
in conjunction with the tight restriction on layoffs in Japan, lead banks to reshuffle workers,
particularly older workers. The reasons for reshuffling older workers are many. First, under
the seniority wage practice, workers on average are paid below their productivity when young
and are paid above their productivity when old. Given profitability target, banks face
incentives to shed “overpaid” workers. The target on overall payroll reinforces such
incentives. Second, the business restructuring included mechanization of operations, which
increases demand for younger IT literate workers.
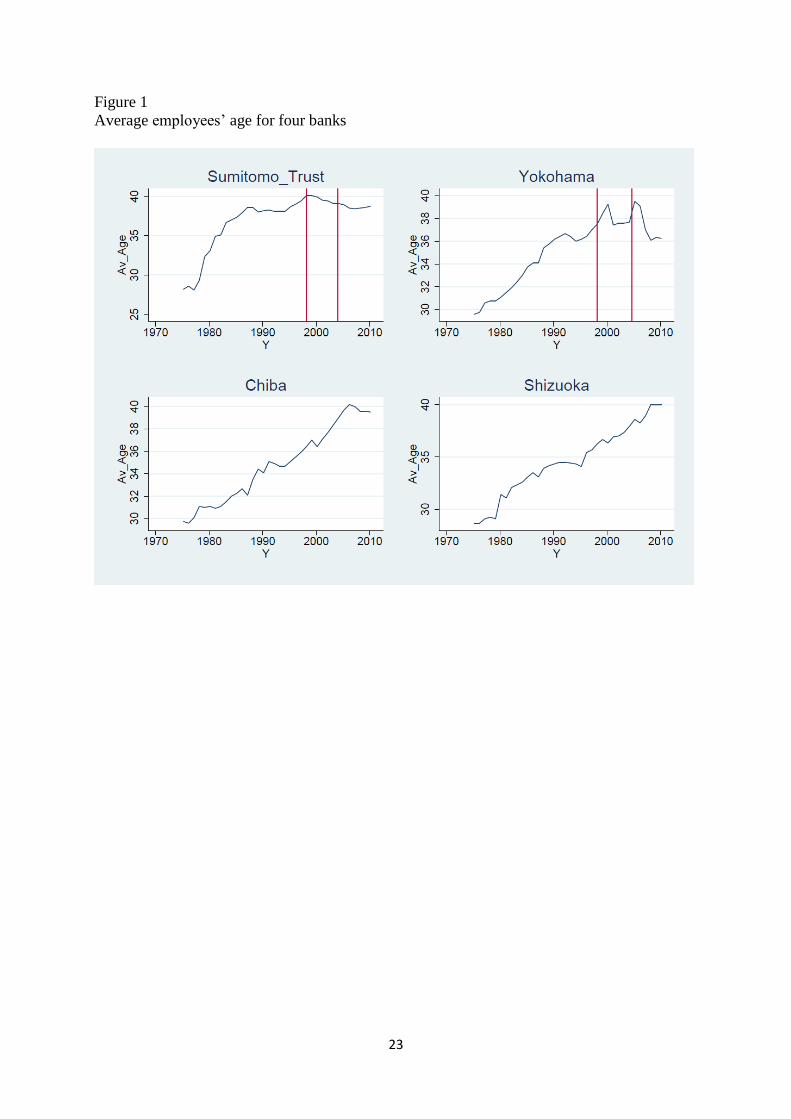
1.2 Preliminary examination
As a preliminary examination, we plot the time series of average age for the three largest
regional banks since the late 1970s (Figure 1). Regional banks did not go through as extensive
merger process as the larger banks in Japan, so regional banks provide a convenient sample.
We also show the Sumitomo Trust Bank in the figure since it did not merge with other banks
during the sample period. This sample is not meant to be a representative sample or a group of
most influential banks in Japan, but is a sample of important banks in the economy.
For banks that did not receive capital injection, the Chiba Bank and Shizuoka Bank, the
average age increased generally steadily from around 30 years old in the late 1970s to around
40 years old by 2010, suggesting that the lifetime employment practice remained generally
intact over time. Contrastingly, the average age at the Yokohama Bank fell sharply in 2001, 2
years after receiving capital injection, probably reflecting early retirement of older workers.
The average age also falls sharply again few years after the repayment. This time, the fall is

8
attributable to an increased hiring of fresh graduates. The average age at the Sumitomo Trust
Bank fell since 1999, when the bank received capital, and generally declined thereafter. While
yet tentative, the difference in the time series pattern of average age is indicative of the impact
of capital injection program on the retention rate of older employees. We turn to a regression
analysis employing all the Japanese banks to see if this pattern holds for a broader set of
banks.
2. Description of the data
The main data source used in this paper is Nikkei Economic Electronic Databank Systems’
(NEEDS) financial statements data CD-ROM (version 2011), which includes not only
accounting and employee characteristics data. We retrieved the fiscal-year-end data of all the
Japanese commercial banks that existed between FY 1990 and FY2010. The number of banks
varies over time, mostly due to mergers: 140 banks in FY1990 to 114 banks in FY2010.
Banks that have experienced mergers during a particular fiscal year are treated as new banks
from the following fiscal year. Overall, our dataset constitutes an unbalanced panel covering
the period between March 1991 and March 2011.
The main dependent variable is the bank employee’s average age.4 In regression analysis we
control for bank specific characteristics. All variables are from NEEDS and on
unconsolidated basis (i.e. standalone figures for parent banks not including subsidiary
outcomes).
To control for the differences among regional labor markets, we used two regional variables
from e-Stat (Regional Government Statistics for Japan site): the number of effective job
4 We made an adjustment to the original NEEDS data on age. For example, if the average age was 40 years and 11 months, NEEDS records the data as “40.11”, our modified data records it as “40.92”(=40+11/12).
9
seekers in a region, and the average cash wage in the finance and insurance industry.5 The
average mean of each variable is available for each prefecture and fiscal year for the sample
period. Table 1 provides the summary statistics.
3. Empirical models and results
3.1. Method: Demographic composition
Our aim is to analyze the response of banks’ worker demographic after both the injections and
the pay-backs of public capital. Under the capital injection program, banks that received
capital injection were expected to implement personnel changes to reduce banks’ payroll. If
injected banks shed middle-aged and older employees, who tend to receive higher salaries, the
average age of employees at those banks would fall. After paying back injected capital, banks’
personnel decisions are no longer constrained by the government monitoring. If in fact banks
started to hire younger workers after repaying the capital injection, we should also expect to
see a decline in employees’ average age. Therefore both capital injection and pay-back should
affect banks’ demographic composition. To examine this hypothesis, we estimate the
following model where the average age of a bank’s employees is the dependent variable:
𝐴𝑔𝑒𝑖𝑡 = ∑ 𝛼𝑗𝐼𝑁𝐽𝑐𝑟𝑜𝑠𝑠𝑖 𝑡−𝑗
3
𝑗=0
+ ∑ 𝛽𝑗𝑃𝐴𝐼𝐷𝑐𝑟𝑜𝑠𝑠𝑖 𝑡−𝑗
3
𝑗=0
+ 𝛾𝐴𝑔𝑒𝑖,𝑡−1 + 𝑋𝑖,𝑡′𝜃 + 𝜅 + 𝜇𝑖 + 𝜙𝑡 + 𝜀𝑖,𝑡 , (1)
where:
𝐼𝑁𝐽𝑐𝑟𝑜𝑠𝑠𝑖 𝑡−𝑗 = 𝐼𝑁𝐽𝑖 𝑡−𝑗
𝐼𝑛𝑗𝐶𝑎𝑝𝑖
𝐴𝑠𝑠𝑒𝑡𝑖𝑡 𝑃𝐴𝐼𝐷𝑐𝑟𝑜𝑠𝑠𝑖 𝑡−𝑗 = 𝑃𝐴𝐼𝐷𝑖 𝑡−𝑗
𝐼𝑛𝑗𝐶𝑎𝑝𝑖
𝐴𝑠𝑠𝑒𝑡𝑖𝑡
𝐴𝑔𝑒𝑖𝑡 is the employees’ average age of bank i at the end of financial year t. The lagged
dependent variable on the right-hand side captures the sluggishness in making annual
5 The data source for wage is the Basic Survey on Wage published by the Ministry of Health, Labor and Welfare (MoHLW). The number of job seekers is from ‘‘Employment Referrals Statistics’’ reported in Labor Market Annals also published by the MoHLW.
10
adjustments to an existing pool of employees who are typically under indefinite term
contracts.
Main explanatory variables are 𝐼𝑁𝐽𝑐𝑟𝑜𝑠𝑠𝑖 𝑡−𝑗 and 𝑃𝐴𝐼𝐷𝑐𝑟𝑜𝑠𝑠𝑖 𝑡−𝑗. 𝐼𝑛𝑗𝐶𝑎𝑝𝑖
𝐴𝑠𝑠𝑒𝑡𝑖𝑡 is the ratio of total
amount of capital injection to total asset. This term allows for differences in the intensity of
treatment, which should matter if banks with larger government support are under more
stringent restructuring plans. This formulation follows Onji, Vera, and Corbett (2012) whose
analyses show the importance of accounting for the intensity of treatment. 𝐼𝑁𝐽𝑖 𝑡−𝑗 is a
dummy for banks that received capital in t-j. For banks that received multiple injections, we
employed the first injection to define this variable. 𝑃𝐴𝐼𝐷𝑖 𝑡−𝑗 is also a dummy for banks that
paid back all of their injected capital in t-j. In practice, banks gradually paid back injected
capital over the years, but only after all of the injected funds are paid off banks’ personnel
decisions become independent from government monitoring. 𝑃𝐴𝐼𝐷𝑐𝑟𝑜𝑠𝑠𝑖 𝑡−𝑗 therefore
captures the removal of constrains imposed under capital injection programs.
The effects of capital injection and pay-back on banks’ demographic composition can last
over time. To capture lagged effects, we include the explanatory variables at time t and up to
three-year lags. The lag length is chosen to balance a trade-off in modelling. The adjustment
is likely to be gradual, so the model should allow for a sufficiently long lagged response.
However, a long lag would create an overlap of a period when the injection effects take place
with a period when the repayment effects take place. The average time to repayment is 7 years
and 6 month (Table 2), and the lag of three years is sufficiently short to limit overlaps.
Vector 𝑋𝑖,𝑡 denotes a vector of control variables for bank specific factors and regional labor
market factors. As is well recognized in the literature (Onji, Vera, Corbett, 2012; Duchin and
Sosyura, 2012), banks do not receive capital injection randomly so the sample selection

11
process can bias the estimated coefficients. Coefficients on the injection dummies and
repayment dummies may capture the average effects of employment reduction at poorly
performing banks, rather than the direct effects of capital injection programs. To remove this
selection bias, we include the return on assets (ROA) in the regression as a control for
performance. In addition, we included the total amount of salaries and allowances, the total
number of employees, and the total assets, as other bank specific controls. The number of
effective job seekers and the average cash wage of finance and insurance industry are
included as regional factors.6 𝜇𝑖 and 𝜙𝑡 are fixed effects and 𝜀𝑖,𝑡 is a heteroskedastic error
with no serial correlation. 𝜅 represents the constant term in a regression.
We estimated the model (1) with the fixed effects regression. The right-hand-side variables
include a lagged dependent variable so that the dynamic panel bias may appear to be a
concern with the fixed effect estimator. The dynamic panel bias is not likely to be of a
concern in the present setting. First, the fixed effects estimators generate large bias when the
time series dimension is small (Judson & Owen, 1999). The time series dimension in our data
is of a reasonable size (T=20) and the cross section dimension is large (N=173). Second, the
coefficient on lagged dependent variable suffers more severely than those on other covariates.
Our main interest is on the coefficient on the injection and repayment variables, and not that
on the lagged dependent variable. Therefore the key inference should not be affected by the
choice of estimator.
3.2. Personnel shuffling hypothesis
In addition to examining the effects on average ages, we examine the banks’ personnel
‘shifting behavior’ with longer time series data than that employed in Onji, Vera, and Corbett
6 Except for ROA, the other control variables are logarithmic values.

12
(2012). The inclusion of latter time period allows us to account for effects of repayments. We
estimate the following equation (2) and (3);
𝐸𝑚𝑝𝑙𝑜𝑦𝑒𝑒𝑈𝑁𝑖𝑡
= ∑ 𝛼𝑗𝐼𝑁𝐽𝑐𝑟𝑜𝑠𝑠𝑖 𝑡−𝑗
3
𝑗=0
+ ∑ 𝛽𝑗𝑃𝐴𝐼𝐷𝑐𝑟𝑜𝑠𝑠𝑖 𝑡−𝑗
3
𝑗=0
+ 𝛾𝐸𝑚𝑝𝑙𝑜𝑦𝑒𝑒𝑈𝑁𝑖,𝑡−1
+ 𝑍𝑖,𝑡′𝜃 + 𝜅 + 𝜇𝑖 + 𝜙𝑡 + 𝜀𝑖,𝑡 , (2)
𝐸𝑚𝑝𝑙𝑜𝑦𝑒𝑒𝐶𝑂𝑁𝑖𝑡
= ∑ 𝛼𝑗𝐼𝑁𝐽𝑐𝑟𝑜𝑠𝑠𝑖 𝑡−𝑗
3
𝑗=2
+ ∑ 𝛽𝑗𝑃𝐴𝐼𝐷𝑐𝑟𝑜𝑠𝑠𝑖 𝑡−𝑗
3
𝑗=0
+ 𝛾𝐸𝑚𝑝𝑙𝑜𝑦𝑒𝑒𝐶𝑂𝑁𝑖,𝑡−1
+ 𝑍𝑖,𝑡′𝜃 + 𝜅 + 𝜇𝑖 + 𝜙𝑡 + 𝜀𝑖,𝑡 , (3)
where 𝐸𝑚𝑝𝑙𝑜𝑦𝑒𝑒𝑈𝑁 and 𝐸𝑚𝑝𝑙𝑜𝑦𝑒𝑒𝐶𝑂𝑁 are the number of employees on an unconsolidated
basis and on consolidated basis respectively, which are both logarithmic values. Not all
subsidiaries are consolidated for accounting purposes; as a general rule, a parent company
includes majority-owned subsidiaries in a consolidated accounting statement. The number of
employees at consolidated basis thus includes employees at consolidated subsidiaries, most of
which with 50% or more direct and indirect ownership. If parent banks merely shuffled
employees to consolidated subsidiaries, we would expect that the number of employees to fall
at the parent bank but not at consolidated level. With the parent-bank-level consolidated data,
the present approach would not be able to capture shuffling to unconsolidated subsidiaries.
However, in the previous analysis by Onji, Vera, and Corbett (2012) whose data includes
unconsolidated subsidiaries, most of the responses take place within wholly-owned
subsidiaries, so the present approach should not lead to ‘false negative.’
One caveat is the availability of consolidated data. Consolidated financial reporting was not
mandatory until 1999 in Japan, and we do not have data at consolidated level prior to 1999. In
equation (3), given the shorter time frame, we are only able to estimate the lagged impact of
injection for the 2nd and 3rd year. 𝑍𝑖,𝑡 is vector of control variables similar to vector 𝑋𝑖,𝑡 from

13
equation (1). However, 𝑍𝑖,𝑡 includes employees’ average age instead of total number of
employees.
3.3 Results
We first examine the estimation results of equation (1), the effect of injection and re-payment
of capital on employees’ average age, which are presented in Table 3. The model in the first
column includes all of the control variables while those for the remainder columns include
each control variable at a time.
Looking at the first four rows in Table 3, every coefficient of INJcross is significant and
negative, except for the second row. These results suggest that the average age of employees
of capital-injected banks gradually fell, that is injected banks may have been hiring younger
workers over several years after receiving injections. How much younger did the average
employee become at injected banks? Using the results from the Table 3 first column, we can
roughly estimate it as follows; the coefficients on INJcross add to -52.091 (=�̂�0+�̂�2+�̂�3), and
the mean value of 𝐼𝑛𝑗𝐶𝑎𝑝𝑖
𝐴𝑠𝑠𝑒𝑡𝑖𝑡 is 0.023 from Table 1. So, we can say that capital injection reduced
the average employee’s age at injected banks by 1.198 years (=-52.091x0.023). What does
one year reduction in average age imply about the demographic composition? Consider a
bank with 2,000 employees whose average age is 37 years old. The average employees’ age
falls by about 1 year if sixty-nine 65-years-old workers leave the parent bank.
As for the effect of pay-backs, while the effects are not as strong, we find significant effects
after one and two years of pay-backs, which are shown the 6th and 7th rows of Table 3. Almost
all of these coefficients are negative and significant, which indicate that the average age of
employees of capital-injected banks gradually falls two years after paying back the injected

14
capital. Using the estimation results of the second column, we can roughly estimate that
injected-banks become around 1.7 years younger on average after paying back the capital.
Since the paybacks are typically accompanied by increases in employment, as will be
demonstrated below, this reduction in average age would have been due to younger hires. If
all the new hires consisted of 22-years-old college graduates, this would imply about extra
204 young workers.
These empirical results confirm that both Capital Injection and Payback have a negative
impact on banks’ average age. This suggests the possibility that older generations of
employees were dismissed or transferred to subsidiaries several years after injections, and that
banks started to hire younger workers two years after paying back the capital.
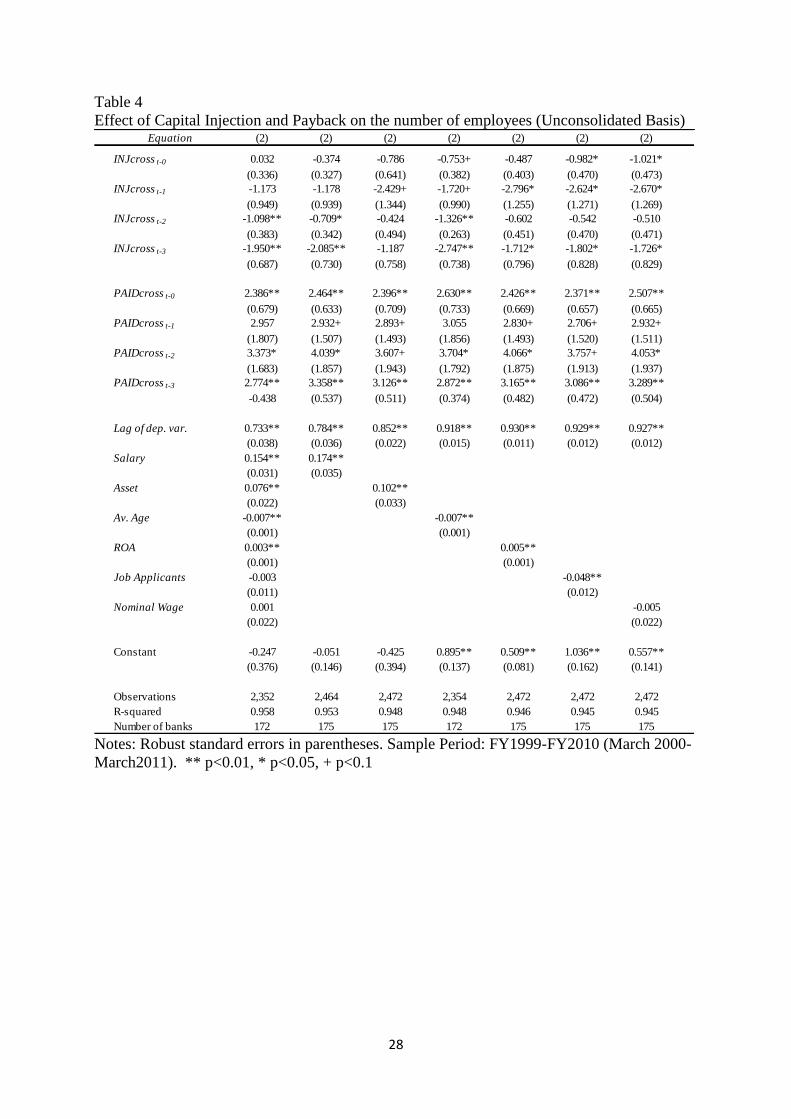
Next we turn to the results of Table 4, which shows the effect of injection on the number of
workers during the injection and after the injection was paid back. Injected banks gradually
decreased the number of employees several years after the event of the first capital injection.
On the other hand, it is also significant that the number of employees was gradually increased
several years after completing the capital pay-backs. These results are very consistent with the
findings from equation (1). The reduction in the number of workers after capital injection
suggests the possibility of older workers’ were being transferred to subsidiaries, and the
increment after pay-backs suggest that of hiring younger workers.
The result on consolidated basis in Table 5 is quite different. For instance, there is almost no
significant effect of capital injections on employment levels, and the results are robust to the
inclusion of additional controls. Even though the reduction of employees occurred on
unconsolidated basis, or in parent companies, there is no significant reduction on consolidated

15
basis after injections. The asymmetric result between on unconsolidated and consolidated
indicates the possibility that banks’ shifting behaviors was caused by capital injection.7
The coefficients on paybacks are significant and positive for the first and third lags at the 10
percent level, indicating that employment increased on the consolidated basis as well as on
the unconsolidated basis. 8 The employment on the consolidated basis however seems to take
more time to increase than that on the unconsolidated basis, and the effects are not as
precisely estimated. The weaker response may be due to several reasons. One possibility is
that some of the transferred old workers were rehired by parent banks. However, this is not
likely to have occurred on a large scale given the fall in the average age at parent banks
documented above. Another more likely scenario is that the transferees retired, offsetting the
increase in young workers are parent banks.
Our empirical results are consistent with the previous studies, and what is more, show the new
finding that injected-banks coped with restructuring programs monitored by government by
changing their demographic composition.
4. Matching analysis using Propensity Score
Ideally, we would like to assign banks randomly to capital injection programs to identify the
impacts of an intervention. The injections of capital were clearly not random. Rather, selected
banks received injection. In the previous section we controlled for confounding influences,
including the impacts of poor performance, assuming that the control variables, in a linear
specification, capture the influences of selection into the treatment. This section considers a
7 The analysis in Table 4 employs a shorter time series than that in Table 3, so the imprecise estimate in Table 4 may be due to weak power
of the test: due to non-reporting of consolidated financial statement until 1999, T=10, rather than 20, in the analysis on the consolidated
employment. As a robustness check, we re-estimated the model (2) using the FY1999-2010 data, dropping the first two injection variables.
We still found significantly negative coefficients so that the result is robust to this the time series length. 8 Though the dependent variable in equation (3) is on a consolidated basis, control variables for bank specific effects are on an
unconsolidated basis. As a robustness check, we re-estimated the model (3) using consolidated data instead. Again, there is almost no significant effect of injections, but the coefficients on lagged paybacks are significantly positive.

16
robustness check by constructing a comparable sample of non-injected banks based on
propensity score (PS). The advantage of this matching analysis is that we do not impose the
linier assumption, which may be viewed restrictive, on how the control variables captures the
influence of the selection process.
We use propensity score matching to identify banks that, even though did not receive
injection, are similar to injected banks across many dimensions. Notice that our goal is to find
a more comparable sample of non-injected banks to injected banks. In this case, the
propensity score provides an estimate of the likelihood of bank receiving a capital injection
based on observables characteristics before the capital injection.
To estimate the propensity score, we use the following set of covariates: workers average age,
return over assets, bank’s size, number of workers and number of job applicants. It is
important that we include pre-injection workers’ average age in order to meet the selection-
on-observables assumption (Dehejia and Wahba. 1999). That is, if we did not include pre-
injection workers’ average age we may be unable to capture the effect of some other
unobservable confounders. Return over assets is included to ensure that the banks injected are
being compared to banks of similar financial health in the pre-injection period. Bank size,
measured as the natural logarithm of total assets as well as number of workers, allows us to
match injected to non-injected banks in two different alternative dimensions of size. Number
of job applicants, data aggregated over region guarantees that we compare capital injected
banks to non-injected banks with similar labor supply conditions.
The pre-injection period is taken to be 1997 and 1998. Although some financial institutions
received injection as early as the first quarter of 1998, several banks did not receive capital
until the first quarter of 2000. Ideally, we want to estimate the propensity score for injected

17
and non-injected banks, in a period closed to the capital injection. We selected 1997 and 1998
since these are the two periods immediate before most capital injections occurred, and we
could expect the capital injection to impact personnel policies with a lag for those that receive
capital in early 1998. We use 2004 as the post-injection period. The choice of the post
injection period is based on the average time of the injection years (7 years and 3 months). 9
Figure 2 shows the age distribution of employees of injected and non-injected banks in the
Pre-injection and Post-injection period in the matched sample (solid line non-injected, dotted
line injected banks). The left panel shows how the distribution of the employees’ age is very
similar for both injected and non-injected banks in the pre-injection period. In contrast in the
right panel, post-injection period, the distribution of the employees’ age in the injected banks
is centered at a lower age than the employees’ age distribution of non-injected banks.10 This
further supports our initial findings that capital injected may have led to rejuvenation of the
workforce at injected banks. In order to corroborate our results, in the next section we
implement regression analysis using the matched sample.
4.1 Results on matched sample:
Using the banks’ propensity score to determine a comparable sample of non-injected banks,
we estimate the effect of “injection” and “repayment” on average employee’s age and number
employees (equations 2 and 3) on injected banks using a sample of 40 banks.11
9 We used alternative years for both pre-injection and post injection periods and we obtained equivalent results. 10 A t-test of mean differences of employee’s average age of injected vs. non-injected banks in the post-injection period, indicates a
statistically significant age difference of -1.2. Consistent with our initial regression analysis, employee's average age at injected banks
declines by more than a year compared to employee's age at non-injected banks. 11 For robustness, we estimate the main models with sample size of 30 and 50. We obtained similar results for all samples.
18
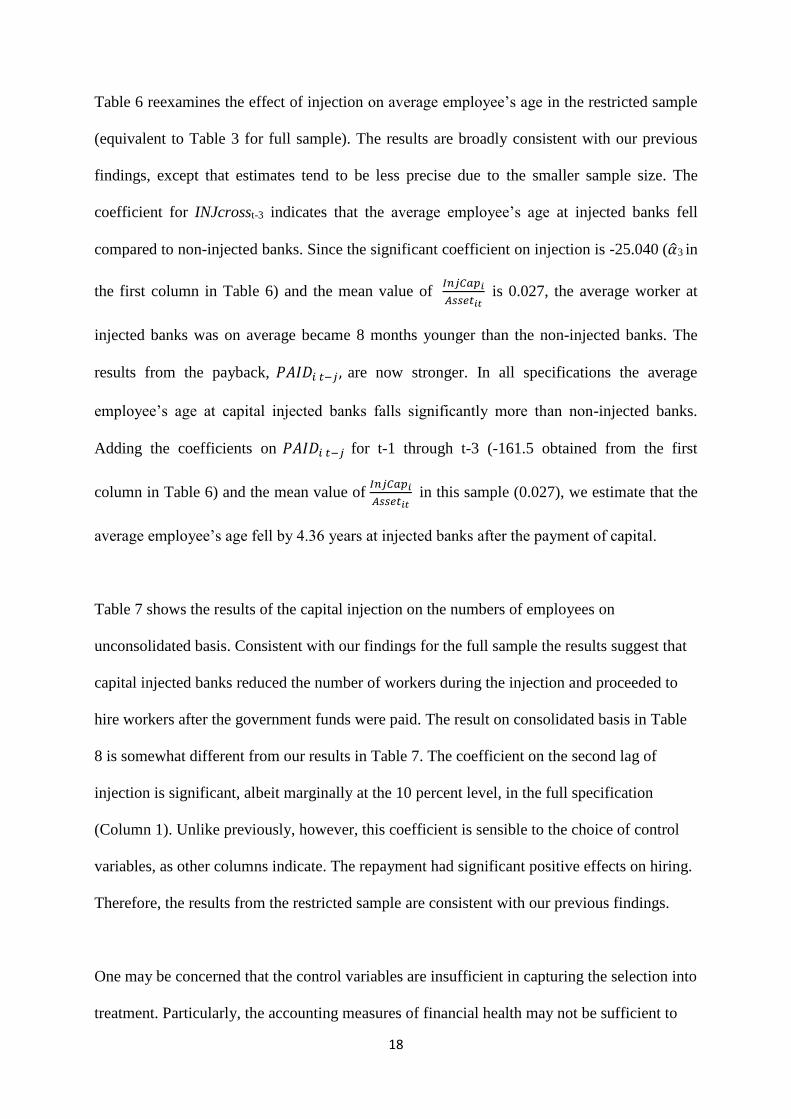
Table 6 reexamines the effect of injection on average employee’s age in the restricted sample
(equivalent to Table 3 for full sample). The results are broadly consistent with our previous
findings, except that estimates tend to be less precise due to the smaller sample size. The
coefficient for INJcrosst-3 indicates that the average employee’s age at injected banks fell
compared to non-injected banks. Since the significant coefficient on injection is -25.040 (�̂�3 in
the first column in Table 6) and the mean value of 𝐼𝑛𝑗𝐶𝑎𝑝𝑖
𝐴𝑠𝑠𝑒𝑡𝑖𝑡 is 0.027, the average worker at
injected banks was on average became 8 months younger than the non-injected banks. The
results from the payback, 𝑃𝐴𝐼𝐷𝑖 𝑡−𝑗 , are now stronger. In all specifications the average
employee’s age at capital injected banks falls significantly more than non-injected banks.
Adding the coefficients on 𝑃𝐴𝐼𝐷𝑖 𝑡−𝑗 for t-1 through t-3 (-161.5 obtained from the first
column in Table 6) and the mean value of 𝐼𝑛𝑗𝐶𝑎𝑝𝑖
𝐴𝑠𝑠𝑒𝑡𝑖𝑡 in this sample (0.027), we estimate that the
average employee’s age fell by 4.36 years at injected banks after the payment of capital.
Table 7 shows the results of the capital injection on the numbers of employees on
unconsolidated basis. Consistent with our findings for the full sample the results suggest that
capital injected banks reduced the number of workers during the injection and proceeded to
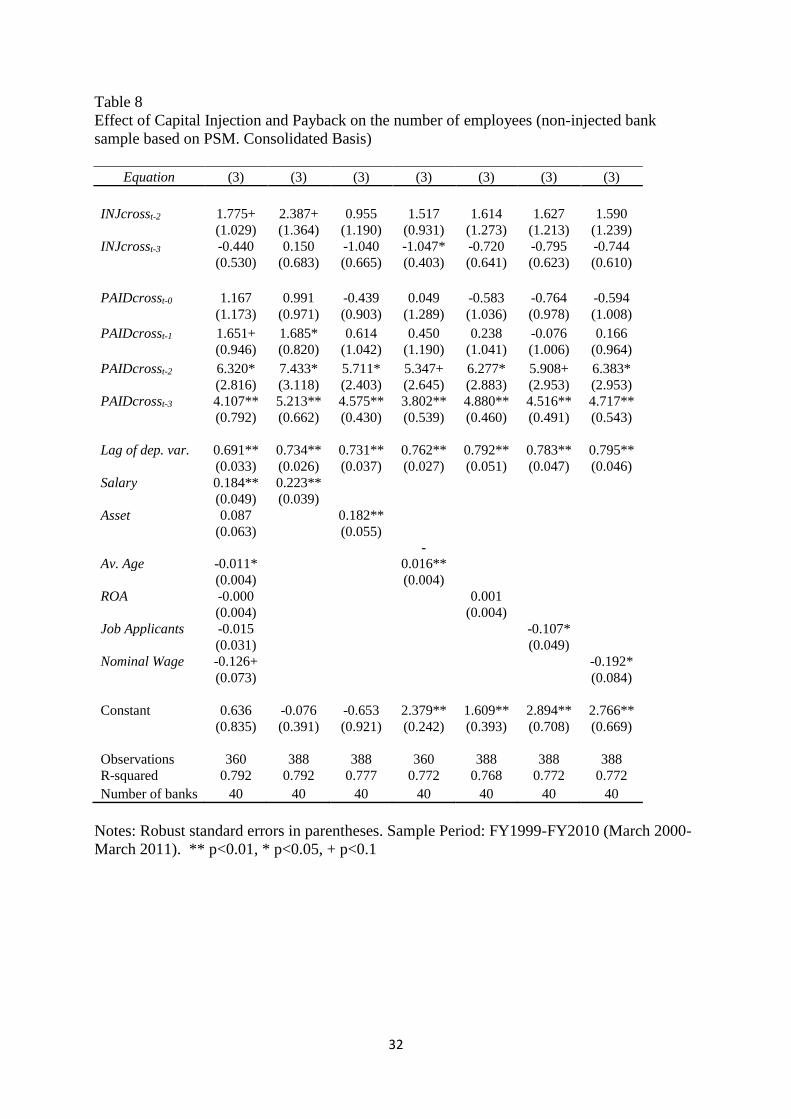
hire workers after the government funds were paid. The result on consolidated basis in Table
8 is somewhat different from our results in Table 7. The coefficient on the second lag of
injection is significant, albeit marginally at the 10 percent level, in the full specification
(Column 1). Unlike previously, however, this coefficient is sensible to the choice of control
variables, as other columns indicate. The repayment had significant positive effects on hiring.
Therefore, the results from the restricted sample are consistent with our previous findings.
One may be concerned that the control variables are insufficient in capturing the selection into
treatment. Particularly, the accounting measures of financial health may not be sufficient to

19
produce a comparable sample, if the degrees of financial window dressing differ across banks.
If this is the case, the estimates may still confound the influence of market forces, which
pushes weaker banks to remove older workers, unaccounted for by the accounting measures.
To address this concern, we have added the change in the stock price as a market-based
measure of financial health. If stock investors utilize qualitative information in making
assessments on banks’ health, we would expect that the movement of stock price should
reflect such additional information. By including the change in stock price we would expect
to obtain a more comparable sample. In implementation, we measured the change in stock
prices over years 1997- 1998, and included it as an additional variable to compute propensity
scores. The results were quantitatively similar to our findings on the original matched sample,
suggesting that the accounting measures are capturing most of the variation in true
performances.12
Our findings on the declining average employee’s age and the faster employment rate after
payment by injected banks support our main hypothesis: during the period of re-structuring
after receiving capital injections, on average capital injected banks shed (or shifted to
subsidiaries) older workers. After the repayment of the government funds, on average, capital
injected banks hired younger employees. Furthermore, our results suggest that older workers
that were initially shifted to subsidiaries during the re-structuring post-injection period, most
likely did not return to the main bank after the capital injections were paid.
6. Conclusion
12 Given their uniqueness, it may be hard to find a good match for some financial institutions . Yokohama bank, for example, is a regional
bank but has an extensive branch network outside its main operating region. Yokohama Bank would therefore not have a directly comparable
counterpart among a group of regional banks, but would look much different from large city banks. As an additional check, we have dropped
Yokohama Bank, and have found the results to be quantitatively similar to the baseline results.

20
This paper empirically examined the demographic composition of bank employees to see
whether the Japanese capital injection program induced injected banks to shed older
employees. The main contribution of our paper is that we provide the first exploration of the
relation between the bank capital injection and restructuring program, and workers’
demographics. Our results support the following conclusions. First, injected banks tended to
shed older workers at the time of the injection, most likely relocating many older workers to
subsidiaries until they retired. Second, the lifetime-employment practice evolved at injected
banks but not completely disappeared: Workers may not stay for life at a parent bank itself,
but still many continue to work in the same corporate group, at a subsidiary. Third, after
repayment of government funds injected banks were more likely to hire younger workers to
replace the older workers shifted or transferred to subsidiaries. To the extent that the banking
sector became high tech, a rejuvenation of the workforce may have resulted in productivity
growth.
We interpreted the direction of causality as flowing from the injection program to the labor
management and not vice versa. Our prior is that banks would have requested public funding
out of financing consideration and regarded requirements on restructuring as being ‘strings’
attached in public assistance. We however acknowledge that the direction of causality may in
part runs the other way. Possibly, bank managers viewed the injection program as an internal
political tool which pushes workers into accepting otherwise resisted layoff plans. The
corporate governance structure in Japan is such that the importance of workers as corporate
stakeholders is higher than in a typical company in the Anglo-Saxon countries. Our analysis
permits an interpretation that the manager applied for the injection program in part to
facilitate layoffs, and that the constraint was not as exogenously as it appears to be. The
21
determinants of the capital injection request were not in the scope of this paper but would be
an interesting topic for further investigation.
Finally, our empirical analysis is based on bank-level employee characteristics. Ideally, we
would like to have employee-level panel data that would us to track relocation of employees
within a banking group. Such future work would be of interests.
References
Black, Lamont and Lieu Hazelwood. 2012. The Effect of TARP on Bank Risk-Taking. Board
of Governors of the Federal Reserve System International Finance Discussion IFDP
1043.
Bresnahan, Timothy F., Erik Brynjolfsson, and Lorin M. Hitt. 2002. Information Technology,
Workplace Organization, and the Demand for Skilled Labor: Firm-Level Evidence.
Quarterly Journal of Economics 117(1), 339-376.
Dehejia and Wahba. 1999. Causal Effects in Non-Experimental Studies: Reevaluating the
Evaluation of Training Programs. Journal of the American Statistical Association
94(448), 1053-1062.
Duchin, Ran and Denis Sosyura. 2012. Safer Ratios, Riskier Portfolios: Bank’s Response to
Government Aid. Ross School of Business Working Paper No. 1165.
Genda, Yuji. 2003. “Who really Lost Jobs in Japan?: Youth Employment in an Aging
Japanese Society” in Seiritsu Ogura, Toshiaki Tachibanaki, and David A. Wise (Eds.)
Labor Markets and Firm Benefit: Policies in Japan and the United States. The
University of Chicago Press, Chicago, 103-133.
Genda, Yuji and Marcus E. Rebick. 2000. “Japanese Labour in the 1990s: Stability and
Stagnation,” Oxford Review of Economic Policy, 16(2), pp. 85-102.
Hoshi, Takeo and Anil Kashyap. 2005. Solutions to Japan's Banking Problems: What Might
Work and What Definitely Will Fail. In: Ito T., Patrick H. & Weinstein D. (eds.)
Reviving Japan's Economy: Problems and Prescriptions. MIT Press, Cambridge, 147--
195.
______. 2010. Will the U.S. Bank Recapitalization Succeed? Eight Lessons from Japan.
Journal of Financial Economics 97(3), 398-417.
Judson, Ruth A., and Ann L. Owen. 1999. Estimating dynamic panel data models: a guide for
macroeconomists. Economics letters 65(1), 9-15.
Kambayashi, Ryo, Takao Kato. 2011. The Japanese employment system after the bubble burst:
new evidence. In: Hamada, K., Kashyap, A., Weinstein, D. (Eds.), Japan’s Bubble,
Deflation, and Stagnation. MIT Press, Cambridge, 217–262.
Koike, Kazuo. 1996. The economics of work in Japan. Volume 3, LTCB international library
selection. LTCB International Library Foundation, Tokyo.
OECD. 1999. Employment Outlook. Organization for Economic Cooperation and
Development, Paris.

22
Onji, Kazuki, David Vera, and Jenny Corbett. 2012. Capital Injection, Restructuring Targets
and Personnel Management: The Case of Japanese Regional Banks. Journal of the
Japanese and International Economies 26(4), 495-517.
Rubin, Donald B., and Neal Thomas. 2000. Combining propensity score matching with
additional adjustments for prognostic covariates. Journal of the American Statistical
Association 95(450), 573-585.
23
Figure 1
Average employees’ age for four banks

24
Figure 2
Employees’ age injected versus non-injected banks
Note: injected banks solid line, non-injected banks dotted line

25
Table 1
Summary statistics
Variable Mean Std. Dev. Min Max Obs
level 37.079 2.199 30.917 43.667 2352
InjCap i
Asset it
Control Variables (Bank specific factors)
logarithm 7.482 0.807 5.652 10.460 2352
logarithm 7.520 0.853 5.872 11.004 1228
logarithm 9.454 0.908 7.425 12.663 2352
logarithm 14.641 1.208 12.303 18.852 2352
raio 0.045 1.049 -25.333 1.603 2352
Control Variables (Regional labor market factors)
logarithm 10.759 0.897 8.586 12.517 2352
logarithm 6.108 0.104 5.776 6.406 2352
0.067 263
Wage
Av. Age
ratio 0.023 0.012 0.006
No. EmployeesUN
No. EmployeesCON
Job Applicants
Total Asset
Salary
ROA

26
Table 2
Injection
(yyyymm)
Repayment
(yyyymm)
Time to
repayment
(years)
TOKYO-MITSUBISHI UFJ 199803 200002 1.92
MITSUBISHI UFJ TRUST 199803 200101 2.83
SUMITOMO TRUST&BANK 199803 200401 5.83
YACHIYO BANK 200009 200603 5.50
KYUSHU BANK 200203 200802 5.92
BANK OF YOKOHAMA 199803 200408 6.42
MIZUHO TRUST & BANK 199803 200409 6.50
MOMIJI BANK 199909 200512 6.25
KUMAMOTO FAMILY BANK 200002 200605 6.25
IND.BANK OF JAPAN 199803 200508 7.42
ASHIKAGA BANK 199803 200602 7.92
MITSUI TRUST & BANK 199803 200503 7.00
ASAHI BANK 199803 200510 7.58
MIZUHO BANK 199803 200607 8.33
MIZUHO CORPORATE BAN 199803 200607 8.33
UFJ BANK 199803 200605 8.33
TOKAI BANK 199803 200606 8.25
UFJ TRUST BANK 199803 200606 8.25
SAKURA BANK 199803 200610 8.58
CHUO MITSUI TRUST 199803 200607 8.33
FUKUOKA CITY BANK 200201 201007 8.50
HOKKAIDO BANK 200003 200908 9.42
GIFU BANK 200104 201012 9.67
BANK OF THE RYUKYUS 199909 201007 10.83
HIGASHI NIPPON BANK 200103 201103 10.00
HOKURIKU BANK 199803 200907 11.33
RESONA BANK 199803
SHINSEI BANK 199803
AOZORA BANK 199803
CHIBA KOGYO BANK 200009
KINKI OSAKA BANK 200104
AVERAGE (REPAYERS) 7.52
Unpaid
(≒7 yr. and 6 mo.)

27
Table 3
Effects of capital injection and payback on the average age of workers
Notes: Robust standard errors in parentheses. Sample Period: FY1999-FY2010 (March 2000-
March2011). ** p<0.01, * p<0.05, + p<0.1
Equation (1) (1) (1) (1) (1) (1) (1)
INJcross t-0 -8.712* -8.876* -10.123** -9.461* -7.886* -8.694* -8.410*
(3.978) (3.631) (3.732) (3.749) (3.592) (3.510) (3.574)
INJcross t-1 -12.333 -3.932 -5.174 -12.024 -3.409 -3.484 -3.229
(9.349) (7.033) (6.860) (9.452) (6.974) (6.974) (6.947)
INJcross t-2 -21.771* -20.775* -21.957* -22.615* -20.220+ -19.751+ -20.044+
(10.453) (10.115) (9.645) (10.523) (10.305) (10.358) (10.403)
INJcross t-3 -21.608** -18.469** -21.025** -21.830** -17.487** -16.896** -17.561**
(6.476) (5.787) (6.000) (6.225) (5.814) (5.726) (5.824)
PAIDcross t-0 10.944 12.123 10.710 9.361 12.926 14.097 12.986
(13.282) (14.587) (14.452) (13.320) (14.801) (15.009) (14.792)
PAIDcross t-1 -21.584+ -23.776* -24.522* -25.090* -22.944* -20.990* -22.815*
(11.430) (9.920) (10.429) (11.426) (9.577) (9.620) (9.571)
PAIDcross t-2 -42.322 -48.286+ -47.219+ -47.457+ -47.819+ -45.490+ -47.839+
(28.454) (26.955) (27.792) (28.531) (26.571) (26.302) (26.493)
PAIDcross t-3 -21.660 -25.427 -25.470 -24.674 -25.218 -23.698 -25.132
(22.360) (21.242) (21.792) (22.632) (20.953) (20.454) (20.913)
Lag of dep. var. 0.751** 0.778** 0.769** 0.759** 0.782** 0.779** 0.782**
(0.032) (0.031) (0.031) (0.032) (0.031) (0.031) (0.031)
Salary 0.567** -0.163
(0.192) (0.136)
Asset -0.261 -0.462**
(0.207) (0.155)
EmployeesUN
-1.040** -0.709**
(0.293) (0.191)
ROA 0.011 0.006
(0.014) (0.011)
Job Applicants 0.494* 0.404+
(0.212) (0.214)
Nominal Wage -0.112 0.021
(0.294) (0.296)
Constant 10.698* 9.346** 14.856** 13.878** 7.662** 3.610 7.549**
(4.550) (1.832) (2.775) (2.095) (1.091) (2.370) (2.214)
Observations 2,352 2,357 2,359 2,354 2,359 2,359 2,359
R-squared 0.897 0.894 0.895 0.896 0.894 0.895 0.894
Number of banks 172 173 173 172 173 173 173
28
Table 4
Effect of Capital Injection and Payback on the number of employees (Unconsolidated Basis)
Notes: Robust standard errors in parentheses. Sample Period: FY1999-FY2010 (March 2000-
March2011). ** p<0.01, * p<0.05, + p<0.1
Equation (2) (2) (2) (2) (2) (2) (2)
INJcross t-0 0.032 -0.374 -0.786 -0.753+ -0.487 -0.982* -1.021*
(0.336) (0.327) (0.641) (0.382) (0.403) (0.470) (0.473)
INJcross t-1 -1.173 -1.178 -2.429+ -1.720+ -2.796* -2.624* -2.670*
(0.949) (0.939) (1.344) (0.990) (1.255) (1.271) (1.269)
INJcross t-2 -1.098** -0.709* -0.424 -1.326** -0.602 -0.542 -0.510
(0.383) (0.342) (0.494) (0.263) (0.451) (0.470) (0.471)
INJcross t-3 -1.950** -2.085** -1.187 -2.747** -1.712* -1.802* -1.726*
(0.687) (0.730) (0.758) (0.738) (0.796) (0.828) (0.829)
PAIDcross t-0 2.386** 2.464** 2.396** 2.630** 2.426** 2.371** 2.507**
(0.679) (0.633) (0.709) (0.733) (0.669) (0.657) (0.665)
PAIDcross t-1 2.957 2.932+ 2.893+ 3.055 2.830+ 2.706+ 2.932+
(1.807) (1.507) (1.493) (1.856) (1.493) (1.520) (1.511)
PAIDcross t-2 3.373* 4.039* 3.607+ 3.704* 4.066* 3.757+ 4.053*
(1.683) (1.857) (1.943) (1.792) (1.875) (1.913) (1.937)
PAIDcross t-3 2.774** 3.358** 3.126** 2.872** 3.165** 3.086** 3.289**
-0.438 (0.537) (0.511) (0.374) (0.482) (0.472) (0.504)
Lag of dep. var. 0.733** 0.784** 0.852** 0.918** 0.930** 0.929** 0.927**
(0.038) (0.036) (0.022) (0.015) (0.011) (0.012) (0.012)
Salary 0.154** 0.174**
(0.031) (0.035)
Asset 0.076** 0.102**
(0.022) (0.033)
Av. Age -0.007** -0.007**
(0.001) (0.001)
ROA 0.003** 0.005**
(0.001) (0.001)
Job Applicants -0.003 -0.048**
(0.011) (0.012)
Nominal Wage 0.001 -0.005
(0.022) (0.022)
Constant -0.247 -0.051 -0.425 0.895** 0.509** 1.036** 0.557**
(0.376) (0.146) (0.394) (0.137) (0.081) (0.162) (0.141)
Observations 2,352 2,464 2,472 2,354 2,472 2,472 2,472
R-squared 0.958 0.953 0.948 0.948 0.946 0.945 0.945
Number of banks 172 175 175 172 175 175 175

29
Table 5
Effect of Capital Injection and Payback on the number of employees (Consolidated Basis)
Notes: Robust standard errors in parentheses. Sample Period: FY1999-FY2010 (March 2000-
March2011). ** p<0.01, * p<0.05, + p<0.1
Equation (3) (3) (3) (3) (3) (3) (3)
INJcross t-2 0.458 1.758 -0.816 0.857 1.016 0.938 0.908
(1.173) (1.363) (1.519) (1.370) (1.410) (1.367) (1.400)
INJcross t-3 -1.307 -0.726 -1.931+ -1.753+ -1.609 -1.561 -1.540
(1.028) (1.424) (1.058) (0.987) (1.171) (1.125) (1.133)
PAIDcross t-0 0.539 -1.146 -1.292 -0.535 -2.034 -2.176 -2.082
(1.236) (1.639) (1.467) (1.850) (1.927) (1.957) (1.943)
PAIDcross t-1 2.409+ 0.519 0.377 1.582 0.097 -0.138 0.061
(1.287) (1.475) (1.348) (2.353) (1.865) (1.918) (1.879)
PAIDcross t-2 1.515 2.116 0.171 3.172* 2.312* 2.110* 2.347*
(1.190) (1.350) (1.151) (1.472) (0.939) (0.902) (0.919)
PAIDcross t-3 6.869+ 6.957* 6.153+ 8.340+ 7.700* 7.517* 7.647*
(4.083) (3.398) (3.318) (4.341) (3.462) (3.500) (3.455)
Lag of dep. var. 0.204 0.285 0.280 0.298 0.352+ 0.353+ 0.353+
(0.152) (0.183) (0.183) (0.194) (0.205) (0.204) (0.204)
Salary 0.318** 0.401**
(0.063) (0.091)
Asset 0.346** 0.490**
(0.103) (0.122)
Av. Age -0.016** -0.022**
(0.005) (0.007)
ROA -0.002 -0.003
(0.005) (0.007)
Job Applicants 0.002 -0.049
(0.030) (0.037)
Nominal Wage 0.025 0.006
(0.046) (0.048)
Constant -1.637 1.615* -1.836+ 6.135** 4.856** 5.395** 4.815**
(1.626) (0.709) (0.999) (1.699) (1.529) (1.630) (1.527)
Observations 1,107 1,212 1,215 1,109 1,215 1,215 1,215
R-squared 0.671 0.621 0.597 0.543 0.522 0.523 0.522
Number of banks 147 150 150 147 150 150 150

30
Table 6
Effects of capital injection and payback on the average age of workers (non-injected bank
sample based on PSM)
Equation (1) (1) (1) (1) (1) (1) (1)
INJcrosst-0 11.903 -10.281 -6.081 -7.765 10.324 -9.206 -8.556
(21.052) (16.476) (13.737) (17.638) (18.296) (15.670) (15.827)
INJcrosst-1 34.942 17.820 19.254 35.400 20.480+ 19.998+ 20.426+
(22.294) (12.888) (11.978) (22.191) (11.452) (11.660) (11.912)
INJcrosst-2 -15.363 -13.526 -14.355 -14.844 -13.651 -11.289 -11.562
(16.742) (15.475) (15.179) (16.170) (16.476) (16.171) (16.052)
INJcrosst-3 -25.040** -22.503** -23.857** -25.256** -21.767** -19.981** -20.579**
(3.686) (3.172) (2.981) (3.508) (2.956) (2.919) (2.822)
PAIDcrosst-0 18.968 20.065 21.063 15.599 23.851 24.728 23.787
(31.674) (32.273) (32.580) (30.641) (32.838) (33.279) (32.758)
PAIDcrosst-1 -33.220** -35.733** -35.029** -37.343** -32.275** -30.713** -32.463**
(6.297) (6.673) (6.954) (5.174) (6.880) (7.494) (6.778)
PAIDcrosst-2 -84.708** -92.439** -89.989** -90.608** -89.090** -87.295** -89.300**
(13.969) (11.981) (13.783) (12.614) (12.673) (11.771) (12.360)
PAIDcrosst-3 -43.623** -46.653** -46.675** -46.654** -44.502** -42.776** -44.671**
(11.796) (10.468) (11.364) (10.958) (10.641) (10.396) (10.568)
Lag of dep. var. 0.787** 0.829** 0.814** 0.796** 0.838** 0.831** 0.836**
(0.036) (0.032) (0.031) (0.033) (0.032) (0.034) (0.033)
Salary 0.442 -0.315
(0.348) (0.216)
Asset -0.220
-0.493*
(0.274)
(0.197)
EmployeesUN -1.076+
-0.940**
(0.547)
(0.287)
ROA 0.038
0.042+
(0.023)
(0.022)
Job Applicants 0.499
0.472
(0.399)
(0.408)
Nominal Wage -0.360
0.009
(0.545)
(0.608)
Constant 12.065+ 9.632** 14.580** 14.884** 6.296** 1.370 6.316
(6.436) (2.489) (3.548) (2.893) (1.270) (4.268) (4.135)
Observations 713 714 714 713 714 714 714
R-squared 0.919 0.916 0.917 0.918 0.916 0.916 0.915
Number of
banks 40 40 40 40 40 40 40
Notes: Robust standard errors in parentheses. Sample Period: FY1999-FY2010 (March 2000-
March 2011). ** p<0.01, * p<0.05, + p<0.1

31
Table 7
Effect of Capital Injection and Payback on the number of employees (non-injected bank
sample based on PSM. Unconsolidated Basis)
Equation (2) (2) (2) (2) (2) (2) (2)
INJcrosst-0 0.674 -0.907 -3.802+ -1.817 -1.866 -3.408+ -3.528+
(0.806) (0.943) (1.980) (1.373) (1.843) (1.885) (1.870)
INJcrosst-1 -5.352* -6.033* -8.278** -6.064* -8.329** -8.298** -8.372**
(2.340) (2.736) (1.769) (2.928) (1.789) (1.829) (1.811)
INJcrosst-2 -2.337** -1.636** 0.328 -1.738** 0.316 0.335 0.391
(0.468) (0.355) (0.763) (0.374) (0.714) (0.687) (0.722)
INJcrosst-3 -1.187** -1.021* -0.479 -1.722** -0.747 -0.776 -0.661
(0.407) (0.479) (0.885) (0.496) (0.863) (0.878) (0.882)
PAIDcrosst-0 0.842* 1.702** 0.885* 0.855* 1.276** 1.034** 1.245**
(0.395) (0.574) (0.396) (0.328) (0.265) (0.328) (0.299)
PAIDcrosst-1 1.766* 2.724** 1.994** 1.616** 2.280** 1.933** 2.231**
(0.661) (0.847) (0.598) (0.411) (0.435) (0.510) (0.465)
PAIDcrosst-2 4.790** 6.672** 5.769** 4.929* 6.269** 5.868** 6.245**
(1.478) (1.090) (1.832) (1.927) (1.762) (1.727) (1.777)
PAIDcrosst-3 1.607** 3.300** 2.765** 1.574** 2.955** 2.559** 2.938**
(0.473) (0.485) (0.324) (0.498) (0.316) (0.333) (0.337)
Lag of dep. var. 0.769** 0.848** 0.907** 0.937** 0.962** 0.956** 0.960**
(0.036) (0.035) (0.022) (0.023) (0.018) (0.018) (0.018)
Salary 0.146** 0.145**
(0.021) (0.026)
Asset 0.053*
0.052*
(0.024)
(0.020)
Av. Age -0.008**
-0.008**
(0.002)
(0.002)
ROA 0.004**
0.004*
(0.001)
(0.002)
Job Applicants 0.004
-0.070**
(0.019)
(0.018)
Nominal Wage -0.007
-0.020
(0.042)
(0.044)
Constant -0.152 -0.211 -0.060 0.776** 0.300* 1.137** 0.444
(0.520) (0.197) (0.234) (0.218) (0.134) (0.246) (0.293)
Observations 713 743 747 713 747 747 747
R-squared 0.977 0.974 0.970 0.972 0.970 0.970 0.969
Number of
banks 40 40 40 40 40 40 40
Notes: Robust standard errors in parentheses. Sample Period: FY1999-FY2010 (March 2000-
March2011). ** p<0.01, * p<0.05, + p<0.1
32
Table 8
Effect of Capital Injection and Payback on the number of employees (non-injected bank
sample based on PSM. Consolidated Basis)
Equation (3) (3) (3) (3) (3) (3) (3)
INJcrosst-2 1.775+ 2.387+ 0.955 1.517 1.614 1.627 1.590
(1.029) (1.364) (1.190) (0.931) (1.273) (1.213) (1.239)
INJcrosst-3 -0.440 0.150 -1.040 -1.047* -0.720 -0.795 -0.744
(0.530) (0.683) (0.665) (0.403) (0.641) (0.623) (0.610)
PAIDcrosst-0 1.167 0.991 -0.439 0.049 -0.583 -0.764 -0.594
(1.173) (0.971) (0.903) (1.289) (1.036) (0.978) (1.008)
PAIDcrosst-1 1.651+ 1.685* 0.614 0.450 0.238 -0.076 0.166
(0.946) (0.820) (1.042) (1.190) (1.041) (1.006) (0.964)
PAIDcrosst-2 6.320* 7.433* 5.711* 5.347+ 6.277* 5.908+ 6.383*
(2.816) (3.118) (2.403) (2.645) (2.883) (2.953) (2.953)
PAIDcrosst-3 4.107** 5.213** 4.575** 3.802** 4.880** 4.516** 4.717**
(0.792) (0.662) (0.430) (0.539) (0.460) (0.491) (0.543)
Lag of dep. var. 0.691** 0.734** 0.731** 0.762** 0.792** 0.783** 0.795**
(0.033) (0.026) (0.037) (0.027) (0.051) (0.047) (0.046)
Salary 0.184** 0.223**
(0.049) (0.039)
Asset 0.087
0.182**
(0.063)
(0.055)
Av. Age -0.011*
-
0.016**
(0.004)
(0.004)
ROA -0.000
0.001
(0.004)
(0.004)
Job Applicants -0.015
-0.107*
(0.031)
(0.049)
Nominal Wage -0.126+
-0.192*
(0.073)
(0.084)
Constant 0.636 -0.076 -0.653 2.379** 1.609** 2.894** 2.766**
(0.835) (0.391) (0.921) (0.242) (0.393) (0.708) (0.669)
Observations 360 388 388 360 388 388 388
R-squared 0.792 0.792 0.777 0.772 0.768 0.772 0.772
Number of banks 40 40 40 40 40 40 40
Notes: Robust standard errors in parentheses. Sample Period: FY1999-FY2010 (March 2000-
March 2011). ** p<0.01, * p<0.05, + p<0.1